🔥 Would you like to save this?
Counties with the longest life expectancy in North Carolina
Life expectancy rates have been on the rise in the United States, with an increase of nearly seven years over the past half-century. (The average lifespan was 70.8 in 1970 and was documented as 77.5 in 2022, according to the Centers for Disease Control and Prevention.) There are many factors that can contribute to how long you’ll live—from genetics to how much you drink or smoke, your diet and weight, and how physically active you are. But then there’s the matter of where you live.
In some areas of the globe, dubbed “blue zones,” there is a disproportionately high number of residents who live to at least 100 years old. These five particular pockets of the world—Ikaria, Greece; Loma Linda, California; Nicoya, Costa Rica, Okinawa, Japan; and Sardinia, Italy—are heavily researched, as scientists try to determine what it is about these residents’ diets, lifestyles, and environments that can promote such longevity. While it may not be as obvious of a contributing factor, where you live can play a significant role in your overall lifespan, which is why some states and even counties in the U.S. tend to see longer life expectancy rates compared to others.
By delving into 2024 County Health Rankings & Roadmaps from the University of Wisconsin Population Health Institute, Stacker identified the counties with the longest life expectancy in North Carolina. Life expectancy measures the average number of years from birth a person can expect to live and is calculated based on the number of deaths in a given time period and the average number of people at risk of dying during that period. Counties with unreliable or insufficient data were excluded from the analysis. Mortality data came from the National Vital Statistics System.
Read on to see if your county made the list.
You may also like: Best counties to raise a family in North Carolina
#28. Clay County (tie)
– Life expectancy: 76.6 years
— Same as state average
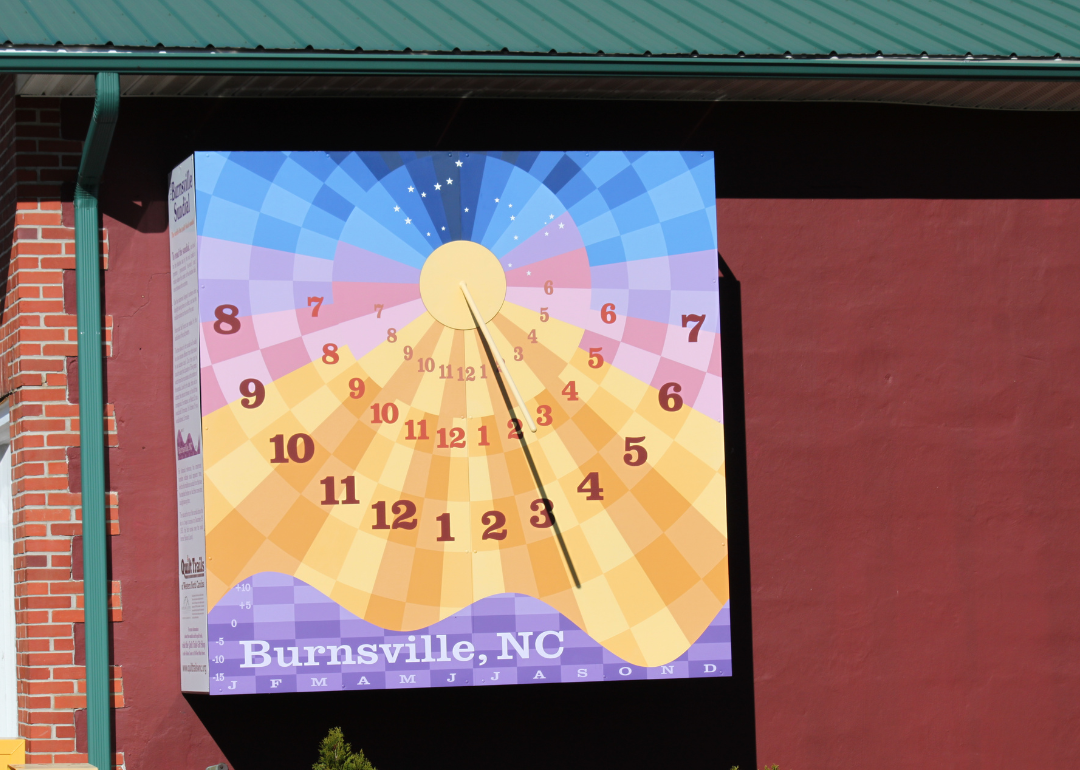
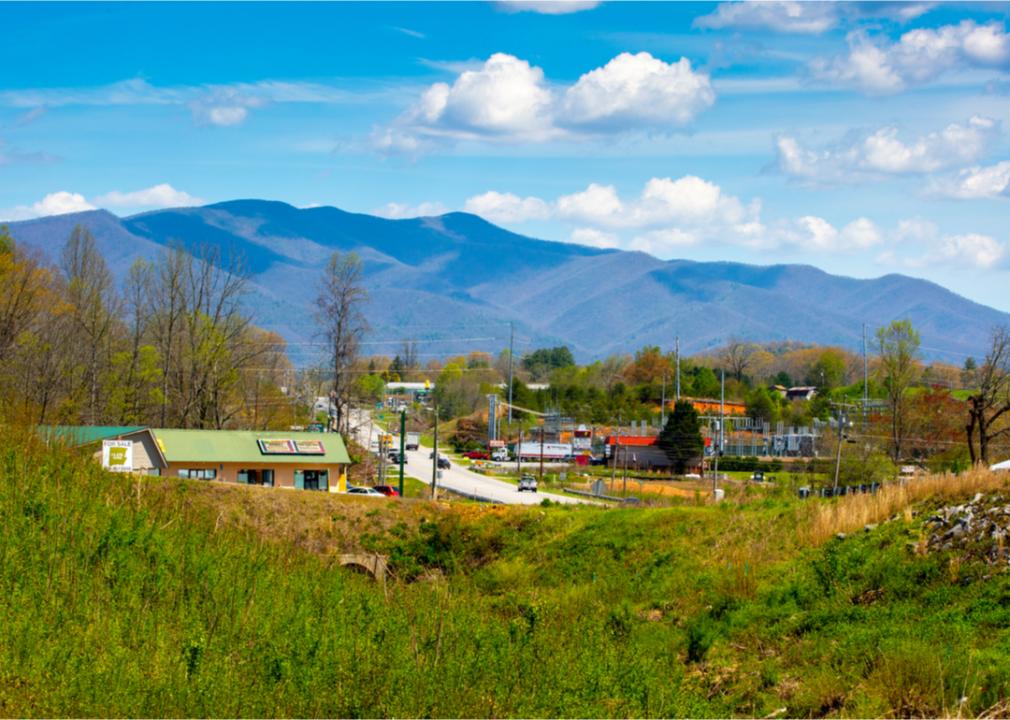
#28. Yancey County (tie)
– Life expectancy: 76.6 years
— Same as state average
In order to come up with the very specific design ideas, we create most designs with the assistance of state-of-the-art AI interior design software. Also, assume links that take you off the site are affiliate links such as links to Amazon. this means we may earn a commission if you buy something.
#28. Johnston County (tie)
– Life expectancy: 76.6 years
— Same as state average
#28. Granville County (tie)
– Life expectancy: 76.6 years
— Same as state average
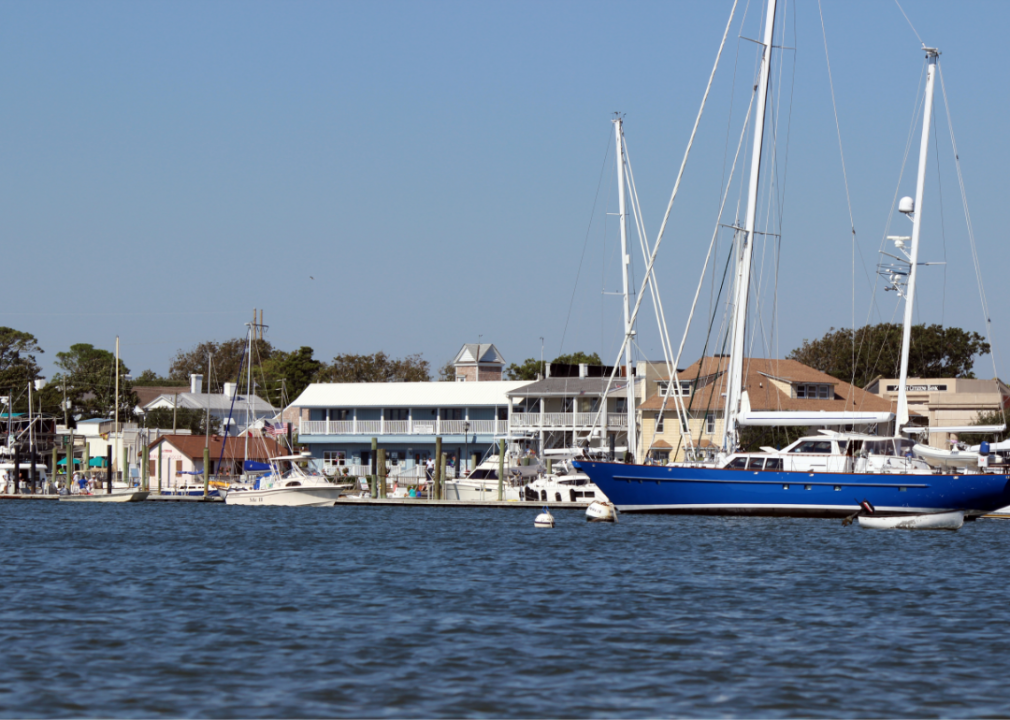
#25. Carteret County (tie)
– Life expectancy: 76.7 years
— 0.1 years higher than the state average
You may also like: Highest-rated beer in North Carolina

#25. Forsyth County (tie)
– Life expectancy: 76.7 years
— 0.1 years higher than the state average
#25. Guilford County (tie)
– Life expectancy: 76.7 years
— 0.1 years higher than the state average
#24. Jackson County
– Life expectancy: 76.8 years
— 0.2 years higher than the state average
#22. Iredell County (tie)
– Life expectancy: 76.9 years
— 0.3 years higher than the state average
#22. Franklin County (tie)
– Life expectancy: 76.9 years
— 0.3 years higher than the state average
You may also like: Metros where renters are the most overextended in North Carolina
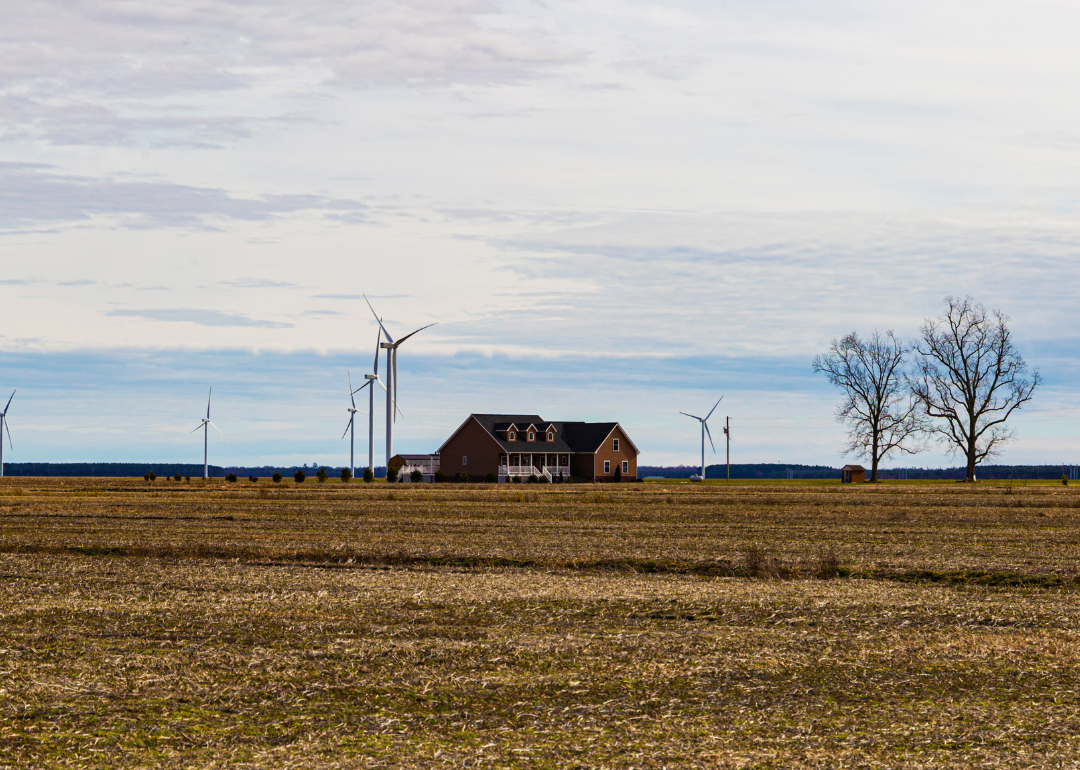
#21. Davie County
– Life expectancy: 77.0 years
— 0.4 years higher than the state average
#19. Alleghany County (tie)
– Life expectancy: 77.2 years
— 0.6 years higher than the state average
🔥 Would you like to save this?
#19. Currituck County (tie)
– Life expectancy: 77.2 years
— 0.6 years higher than the state average

#16. Tyrrell County (tie)
– Life expectancy: 77.6 years
— 1.0 years higher than the state average

#16. Cabarrus County (tie)
– Life expectancy: 77.6 years
— 1.0 years higher than the state average
You may also like: Counties where the most opioids are dispensed in North Carolina
#16. Camden County (tie)
– Life expectancy: 77.6 years
— 1.0 years higher than the state average
#12. Polk County (tie)
– Life expectancy: 77.8 years
— 1.2 years higher than the state average
#12. Brunswick County (tie)
– Life expectancy: 77.8 years
— 1.2 years higher than the state average

#12. Buncombe County (tie)
– Life expectancy: 77.8 years
— 1.2 years higher than the state average
#12. Moore County (tie)
– Life expectancy: 77.8 years
— 1.2 years higher than the state average
You may also like: Best private colleges in North Carolina
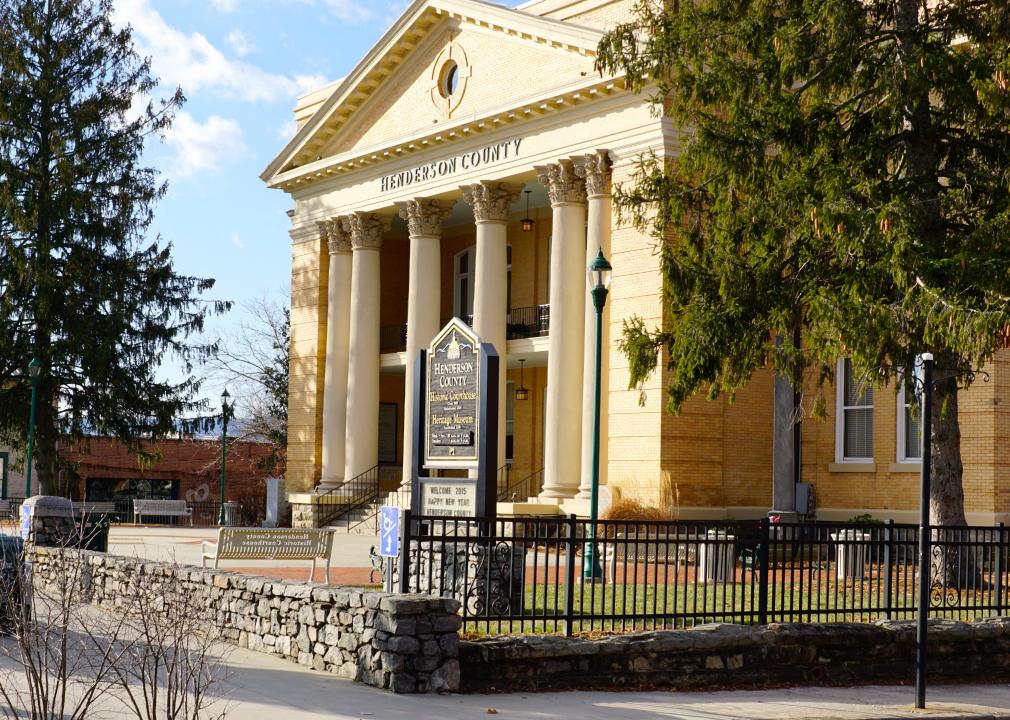
#10. Henderson County (tie)
– Life expectancy: 78.1 years
— 1.5 years higher than the state average
#10. New Hanover County (tie)
– Life expectancy: 78.1 years
— 1.5 years higher than the state average
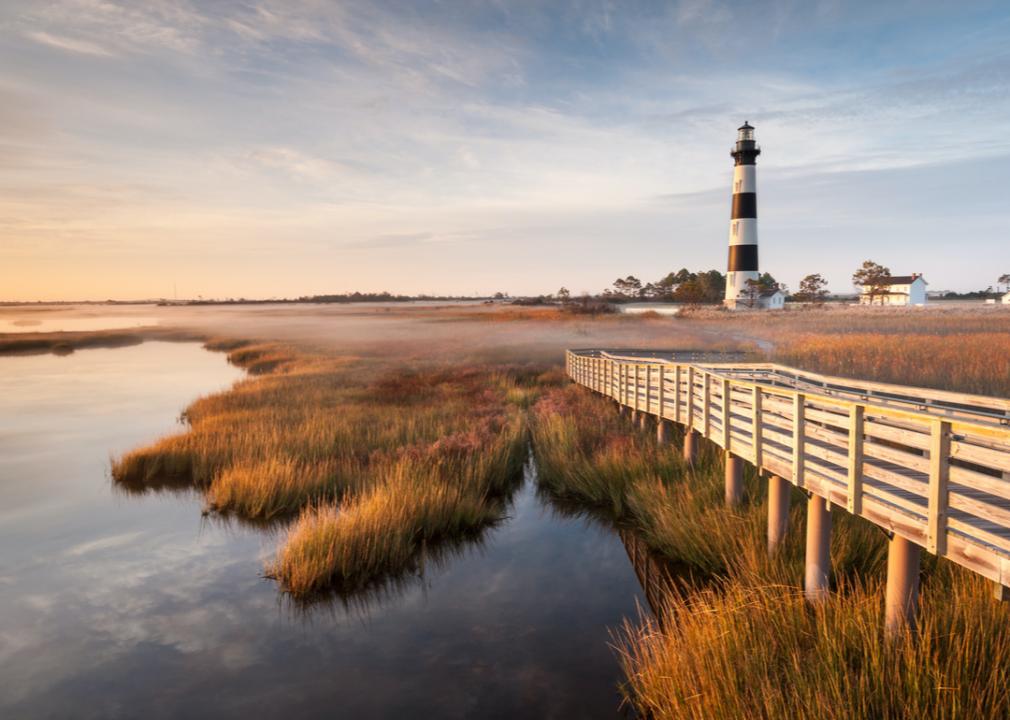
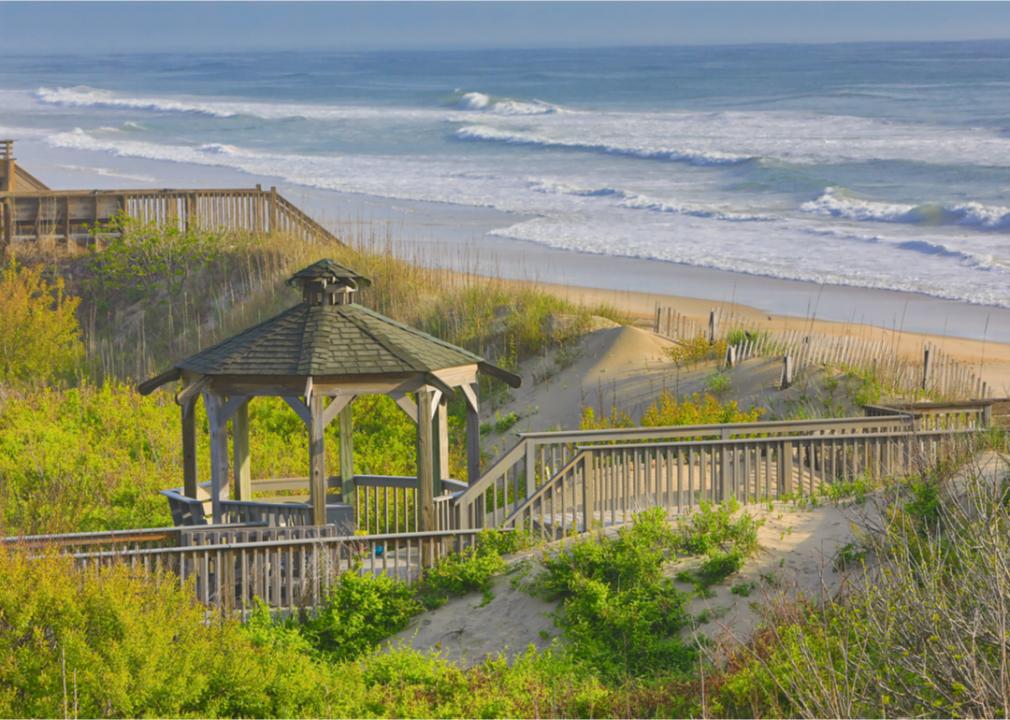
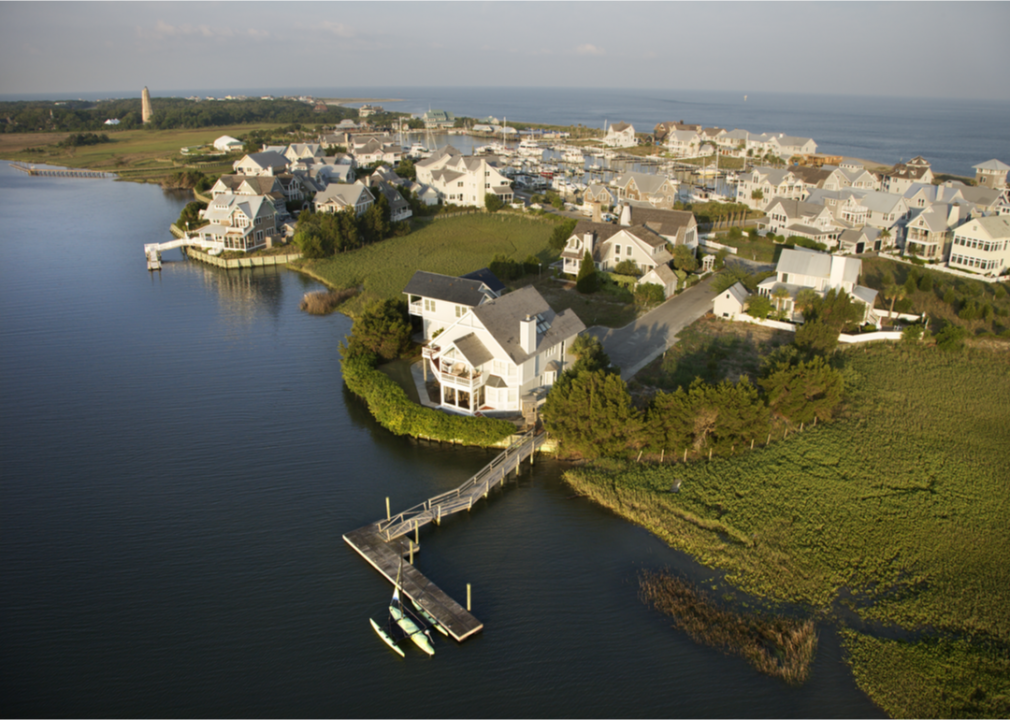
#9. Dare County
– Life expectancy: 78.5 years
— 1.9 years higher than the state average

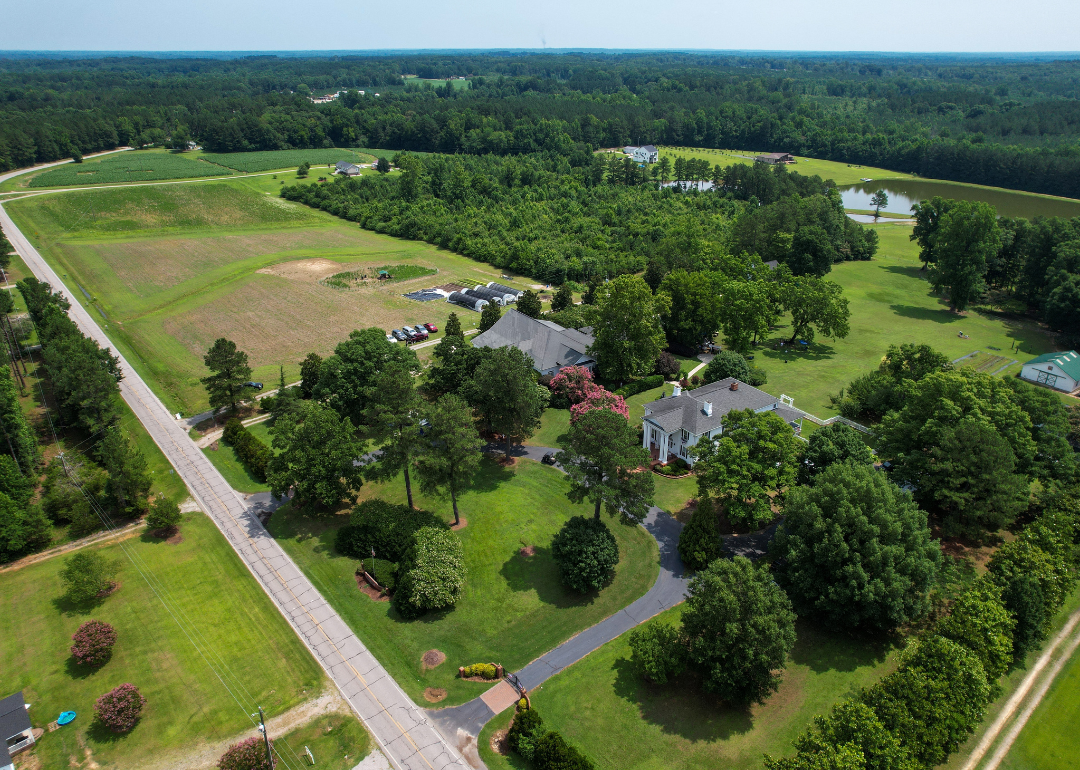
#8. Union County
– Life expectancy: 78.9 years
— 2.3 years higher than the state average

🔥 Would you like to save this?
#7. Mecklenburg County
– Life expectancy: 79.2 years
— 2.6 years higher than the state average
You may also like: Metros in North Carolina where jobs are growing fastest

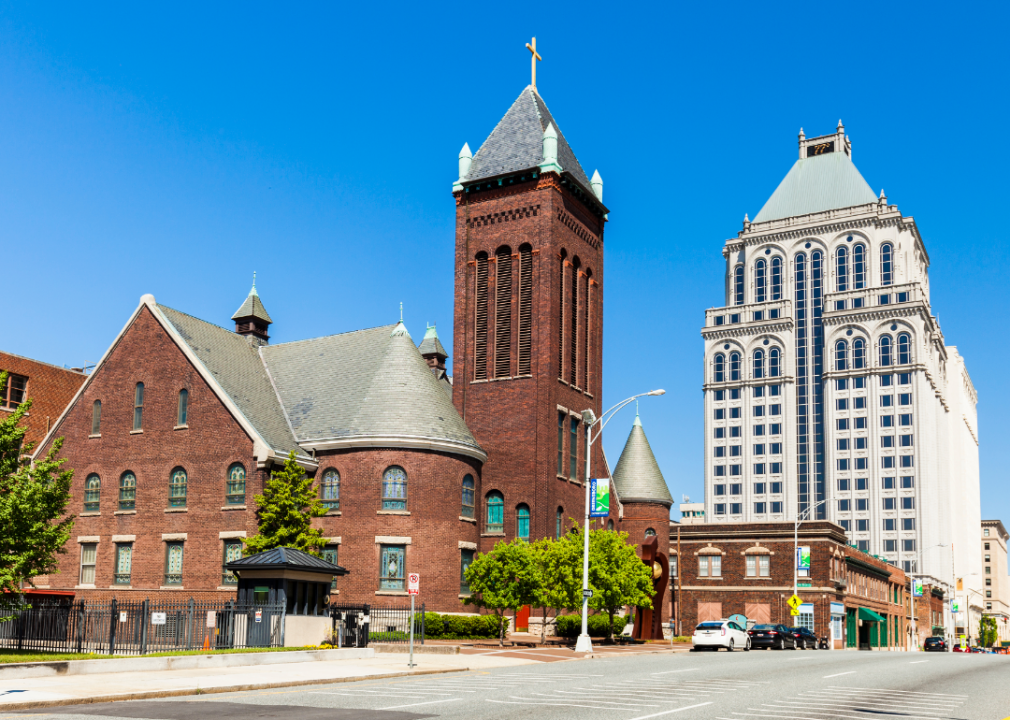
#6. Durham County
– Life expectancy: 79.4 years
— 2.8 years higher than the state average

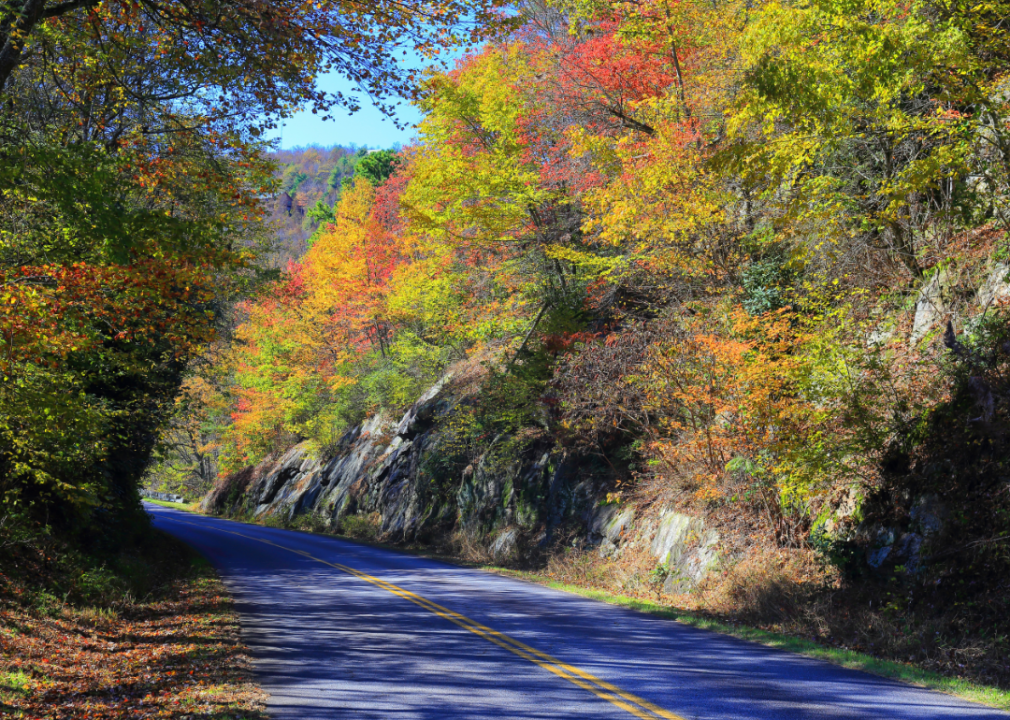
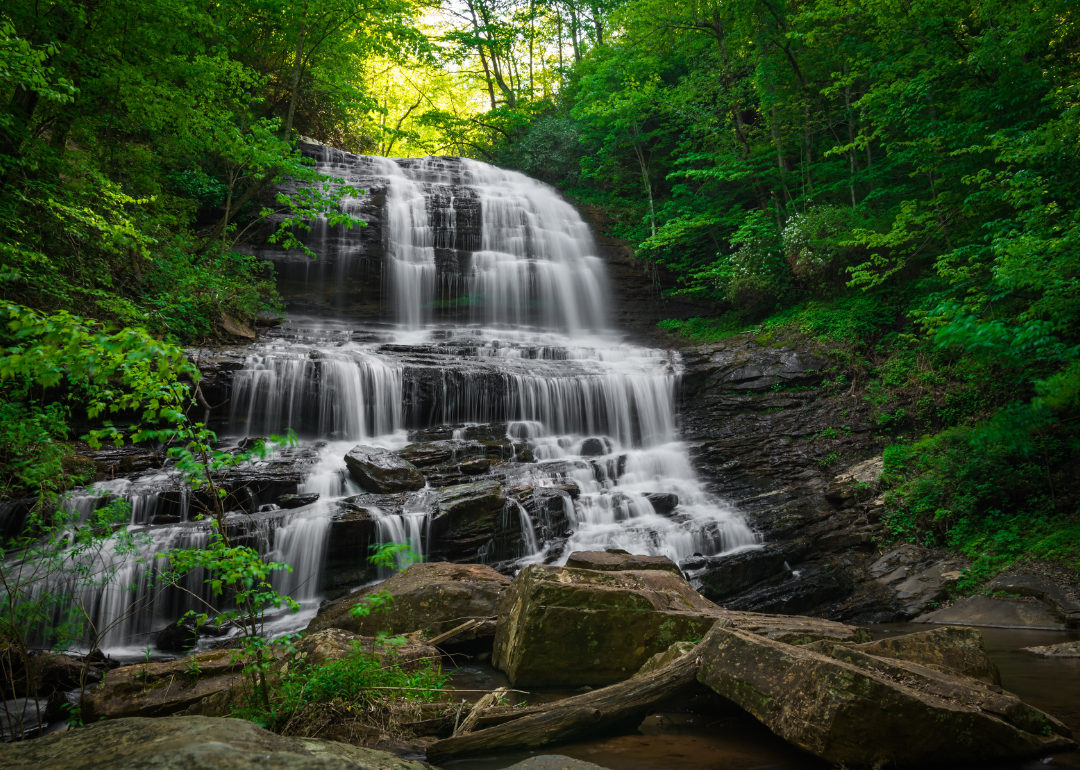
#5. Transylvania County
– Life expectancy: 79.5 years
— 2.9 years higher than the state average

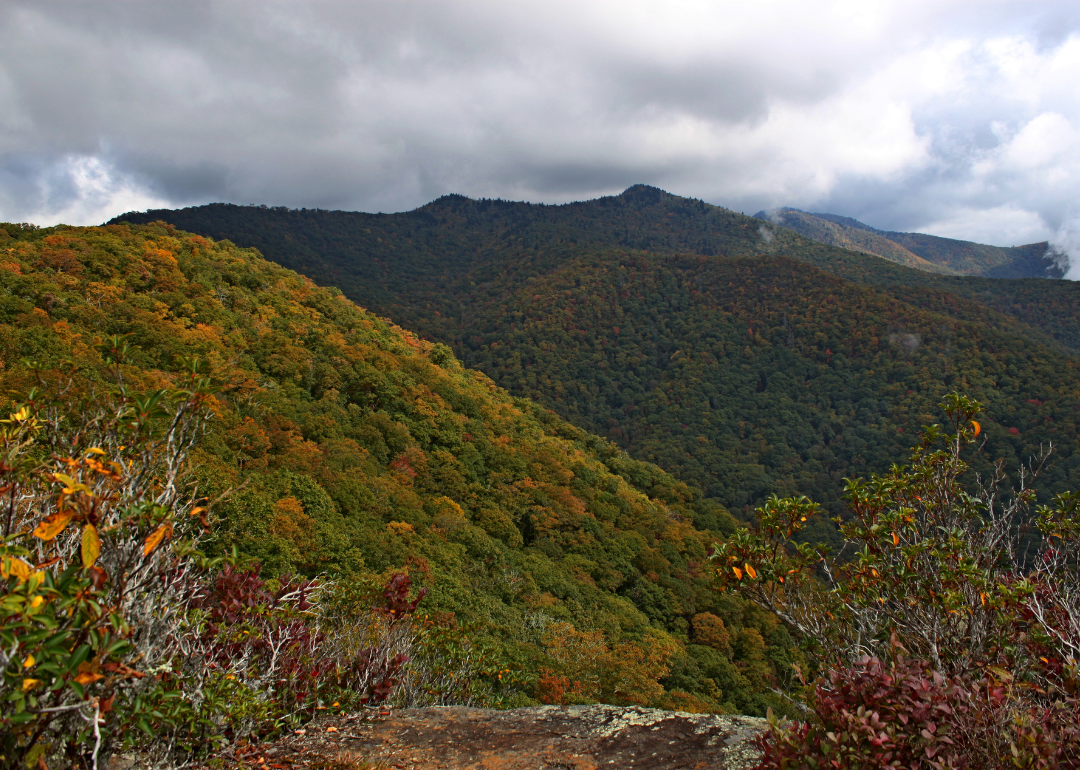
#4. Watauga County
– Life expectancy: 79.7 years
— 3.1 years higher than the state average
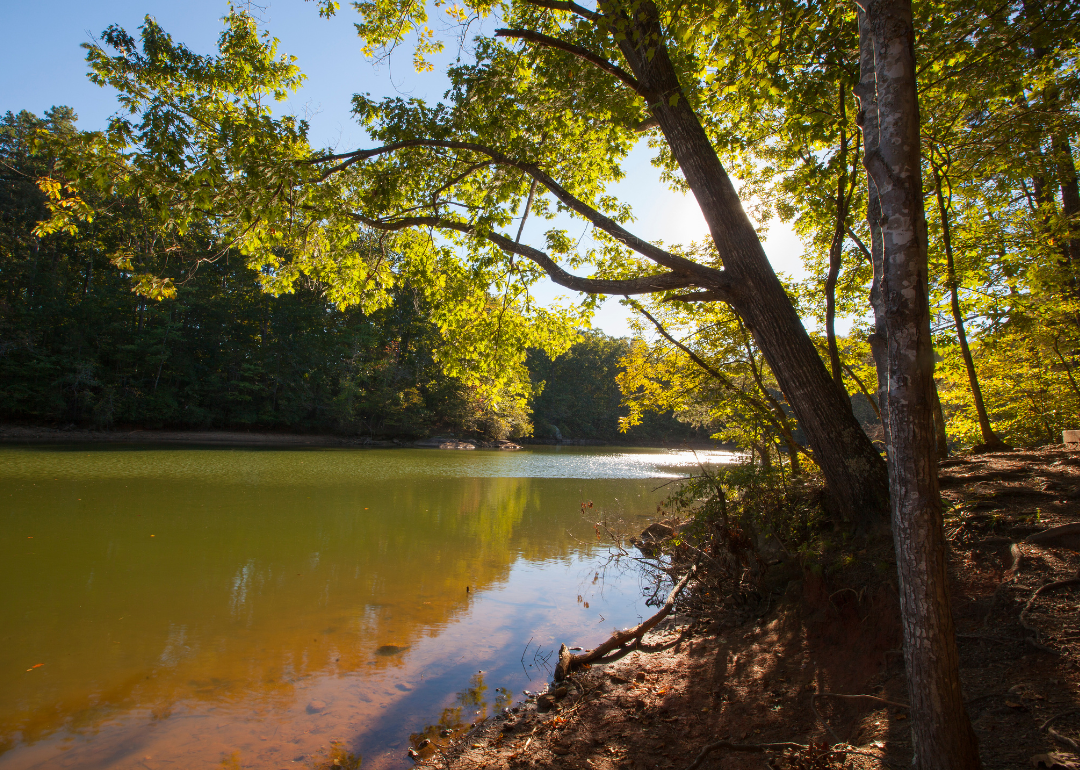
#3. Chatham County
– Life expectancy: 79.9 years
— 3.3 years higher than the state average

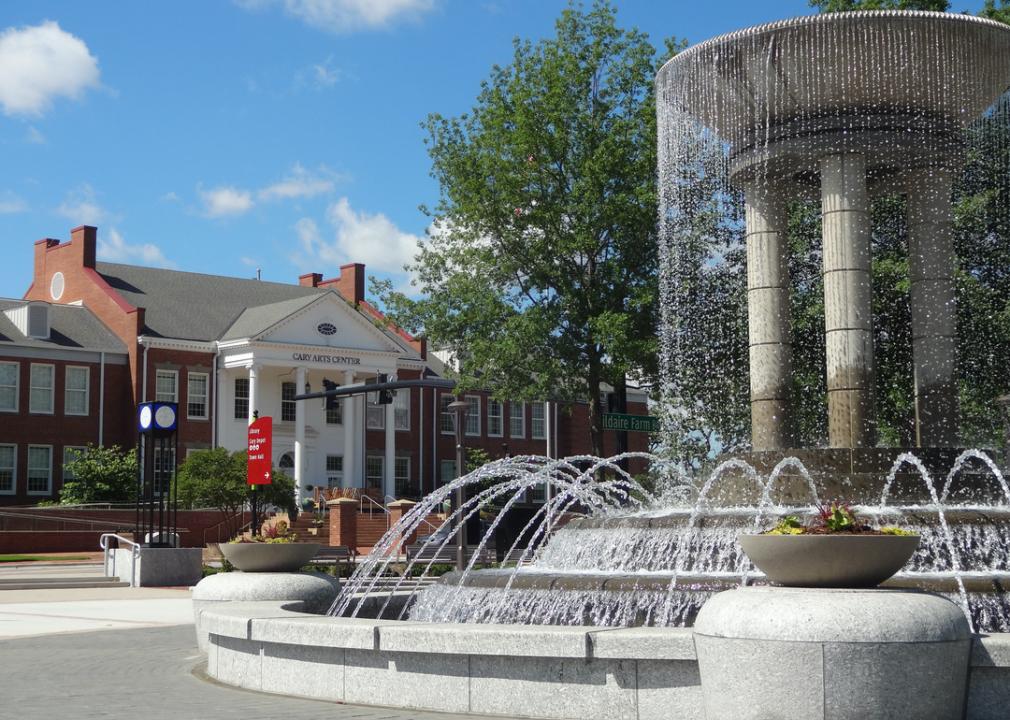
#2. Wake County
– Life expectancy: 81.2 years
— 4.6 years higher than the state average
You may also like: Counties with the highest cancer rates in North Carolina

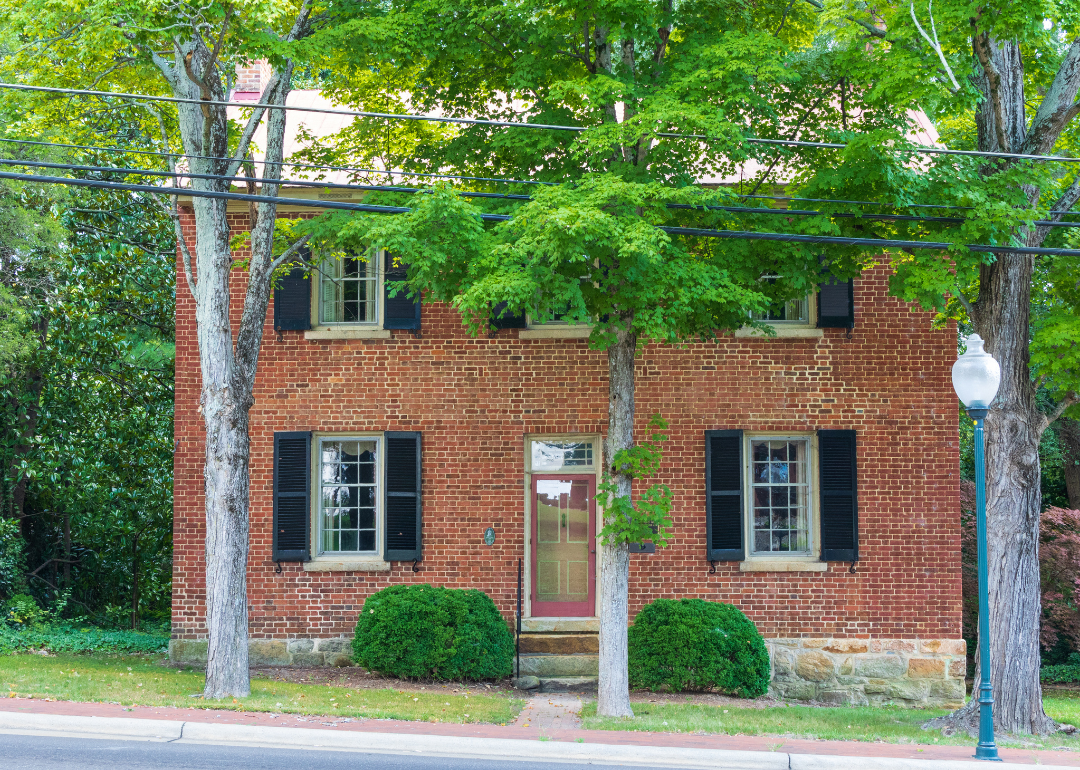
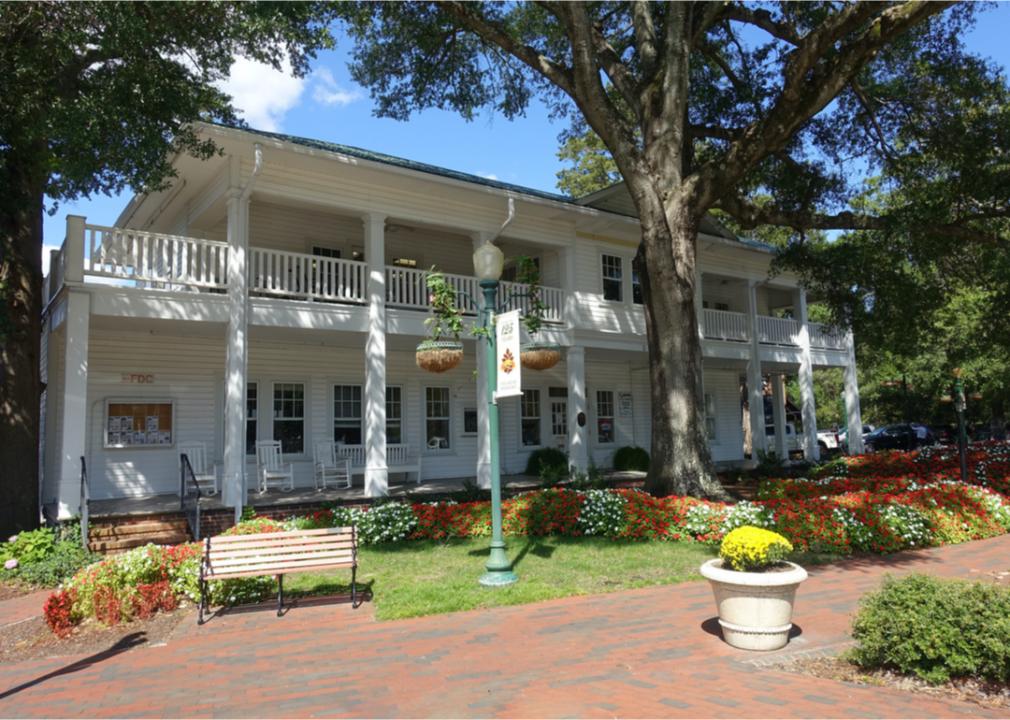
#1. Orange County
– Life expectancy: 81.6 years
— 5.0 years higher than the state average
This story features data reporting by Karim Noorani, writing by Kiersten Hickman, and is part of a series utilizing data automation across 50 states.
By Stacker