🔥 Would you like to save this?
Counties with the shortest life expectancy in North Carolina
Life expectancy can be affected by a variety of factors. About 25% of your lifespan is determined by genetics, according to the National Library of Medicine. Health and wellness habits—like following a balanced, nutrient-rich diet; not smoking; drinking minimal alcohol; maintaining a healthy weight; and staying physically active—can add more than a decade to your life, research from the National Institutes of Health shows. While these factors are significant, another important element that you might not have considered is your environment and community.
While life expectancy generally increases annually in the United States—jumping from about 70.8 years old to 77.5 between 1970 and 2022, according to the Centers for Disease Control and Prevention—this particular metric can vary from state to state or even county to county. In some parts of the country, the average lifespan is getting shorter based on a variety of risk factors on top of health, including socioeconomic factors like poverty, unemployment, income, and education.
According to a 2020 study from researchers at Penn State, West Virginia, and Michigan State Universities, communities with a higher population density, more fast food restaurants, and a high number of extraction industry-based jobs tend to have shorter life expectancies.
To find out how life expectancy varies within North Carolina, Stacker used 2024 County Health Rankings & Roadmaps from the University of Wisconsin Population Health Institute to identify the counties with the shortest life expectancy. Life expectancy measures the average number of years from birth a person can expect to live and is calculated based on the number of deaths in a given time period and the average number of people at risk of dying during that period. Counties with unreliable or insufficient data were excluded from the analysis. Mortality data came from the National Vital Statistics System.
Read on to see if your county is on the list.
You may also like: Metros in North Carolina where jobs are growing fastest
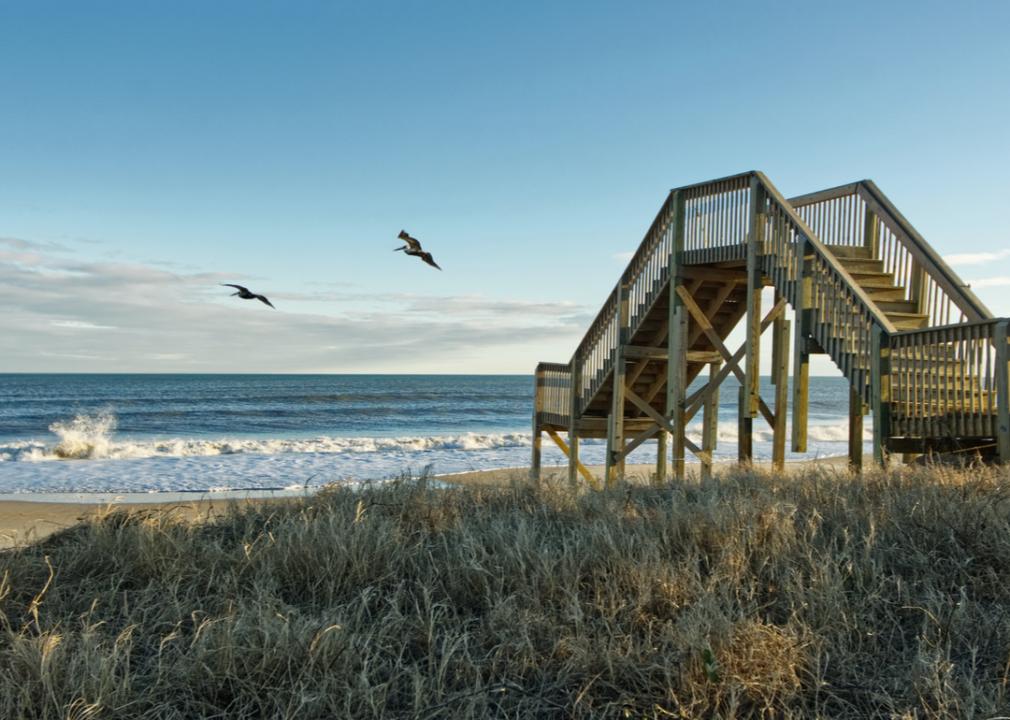
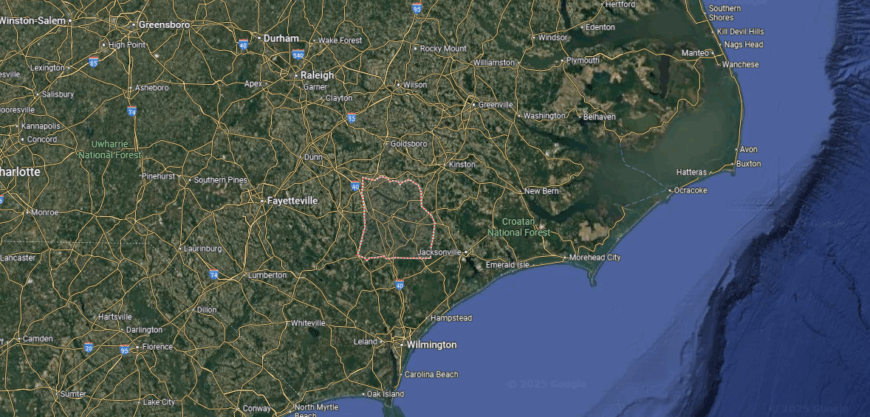
#50. Onslow County
– Life expectancy: 75.0 years
— 1.6 years lower than the state average
In order to come up with the very specific design ideas, we create most designs with the assistance of state-of-the-art AI interior design software. Also, assume links that take you off the site are affiliate links such as links to Amazon. this means we may earn a commission if you buy something.
About
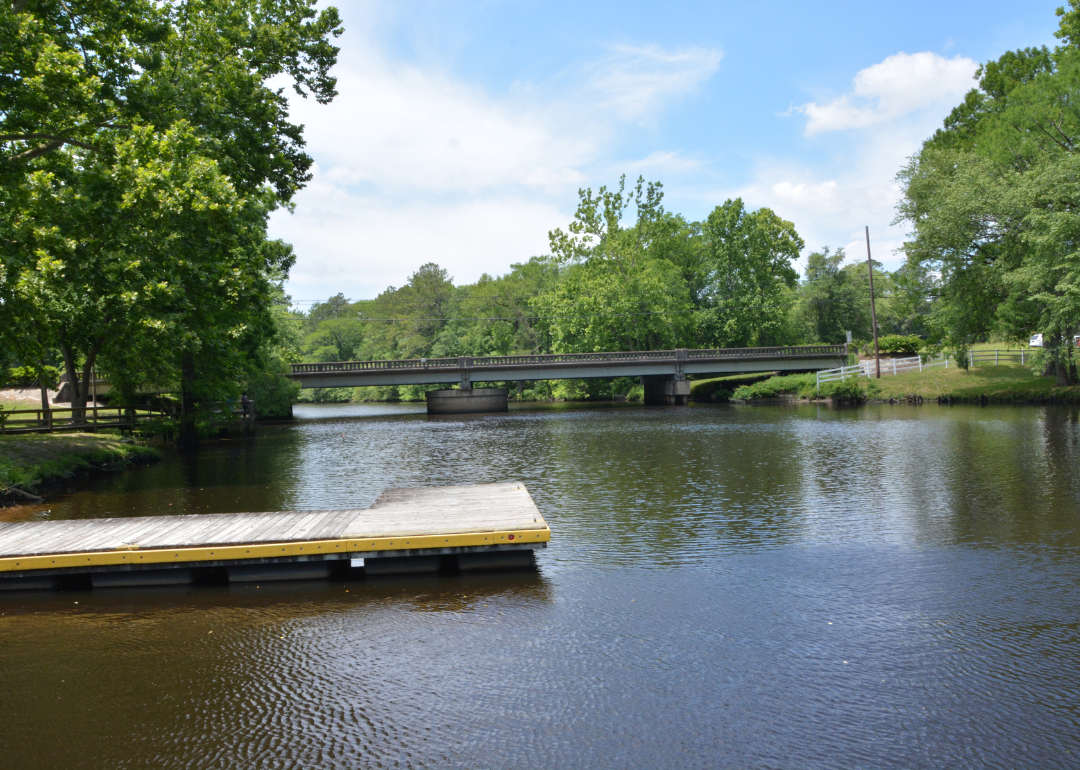
Onslow County lies along North Carolina’s southeastern coast, where rivers, inlets, and pine woodlands define its landscape. Its identity reflects a blend of maritime traditions and military presence, with Camp Lejeune serving as a central influence. Fishing villages, farmland, and historic town centers remain tied to the county’s long-standing coastal heritage.
Community life is built on schools, local gatherings, and recreation that often connects to the water. Families share seafood traditions, seasonal festivals, and neighborhood events that strengthen generational ties. The economy balances agriculture, tourism, and defense, giving Onslow County a character rooted in both heritage and resilience.
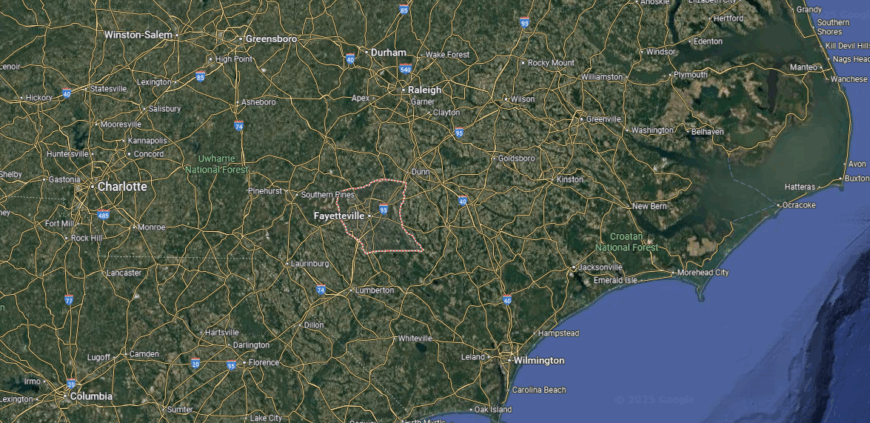
Where is Onslow County?
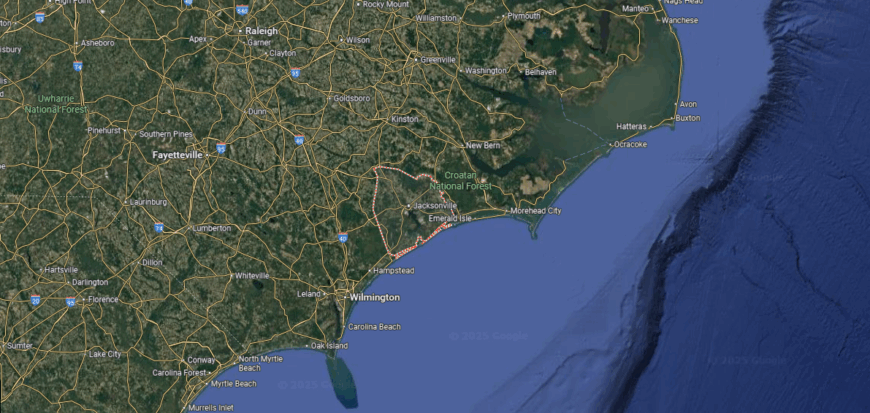
Onslow County lies in southeastern North Carolina, bordered by Jones County to the north, Pender County to the southwest, and Carteret County to the east. It extends to the Atlantic Ocean, where barrier islands such as Topsail Island and the Intracoastal Waterway create part of its shoreline. The county spans roughly 65 miles east to west and 30 miles north to south, combining coastal marshlands with pine forests and farmland.
Jacksonville, the county seat, sits along the New River near the county’s center. Other communities include Richlands to the northwest, Swansboro along the eastern coast, and Holly Ridge to the south. The area is defined by the presence of Camp Lejeune Marine Corps Base, tidal rivers such as the New and White Oak, and a mix of maritime and inland landscapes.
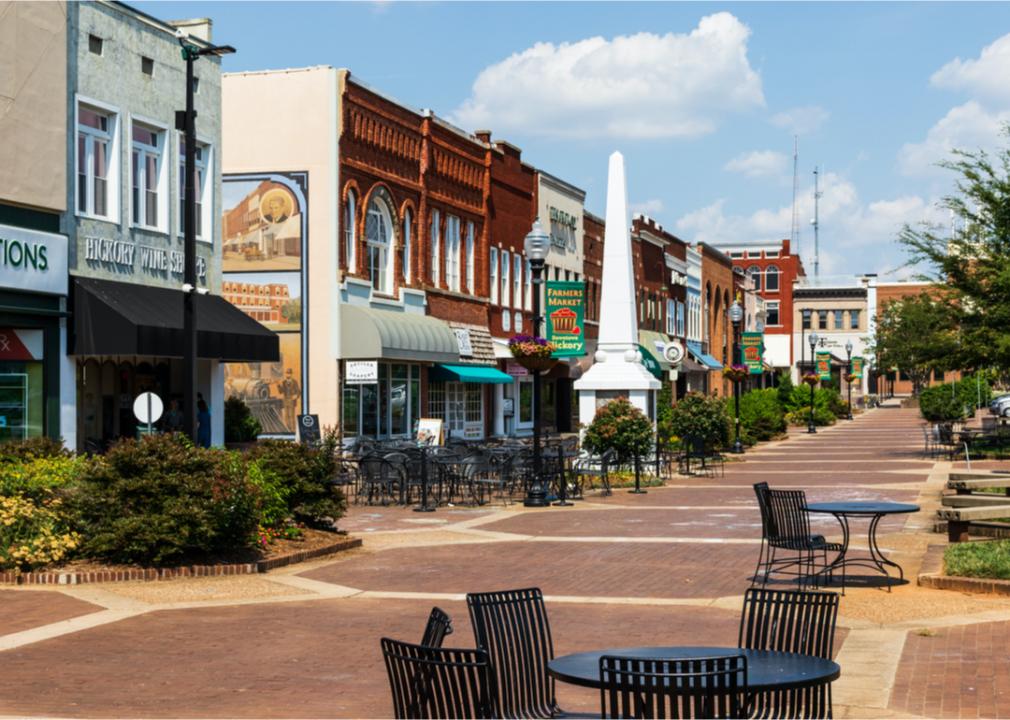
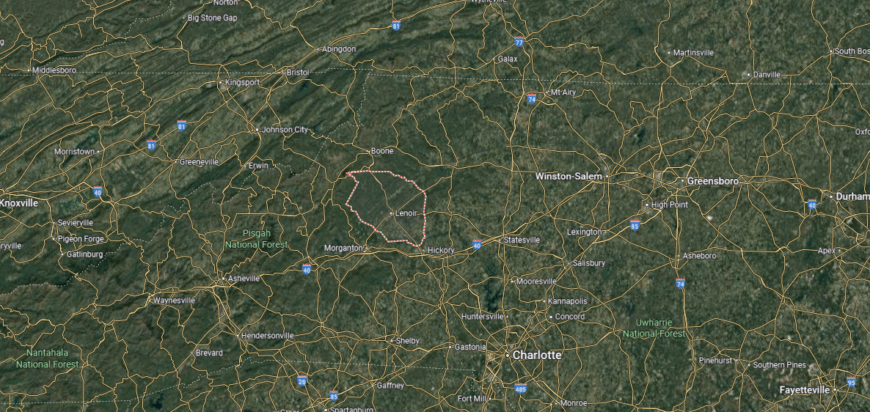
#49. Catawba County (tie)
– Life expectancy: 74.9 years
— 1.7 years lower than the state average
About
Catawba County in western North Carolina is framed by rolling foothills and the broad waters of Lake Norman and the Catawba River. Once defined by furniture and textile industries, it has steadily transitioned into a hub for technology, manufacturing, and education. The county’s mix of historic mill towns and modern centers shows a community that adapts while preserving its roots.
Daily life here brings together cultural events, outdoor recreation, and strong neighborhood traditions. Residents enjoy lakefront activities, gatherings in Hickory’s vibrant downtown, and festivals that highlight craft, food, and music. Catawba County stands as a place where innovation and heritage meet, offering a dynamic yet grounded sense of community.
Where is Catawba County?
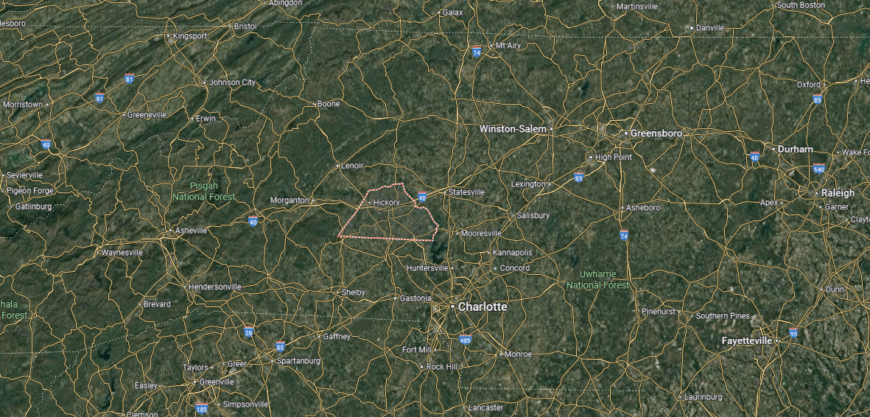
Catawba County lies in the western Piedmont region of North Carolina, bordered by Caldwell County to the north and Lincoln County to the south. It covers an area framed by the Catawba River and includes access to man-made Lake Norman along its southeastern edge. The county stretches about 25 miles from north to south and 30 miles from east to west.
Newton serves as the county seat, positioned slightly east of the county’s center. Nearby cities include Hickory to the northwest, Conover to the northeast, and Maiden to the south. The area blends urban centers, rolling foothills, and waterways such as the Catawba River and Lake Hickory.
#48. Duplin County (tie)
– Life expectancy: 74.9 years
— 1.7 years lower than the state average
About
Duplin County stretches across the flatlands of southeastern North Carolina, where fields of corn, soybeans, and vineyards dominate the horizon. Agriculture has long been the heart of its economy, especially poultry and hog farming, but its vineyards and wineries have also given the county a distinctive cultural flavor. Small towns and crossroads communities hold onto traditions shaped by the rhythms of rural life.
The county’s gatherings often revolve around food, music, and heritage festivals that draw residents together across generations. Churches, schools, and civic groups anchor community ties, while open landscapes encourage outdoor traditions that continue year after year. Duplin County reflects a steady, land-centered way of life, carried forward by resilience, pride, and a commitment to its rural identity.
Where is Duplin County?
Duplin County is located in the southeastern part of North Carolina, positioned inland between Sampson County to the north and Pender County to the south. It stretches across the Coastal Plain region, with a landscape shaped by rivers, farmland, and small communities. The county measures about 40 miles east to west and 30 miles north to south.
Kenansville serves as the county seat, lying near the geographic center of Duplin County. Other nearby towns include Wallace in the south, Warsaw toward the north, and Beulaville to the east. The area is defined by the Northeast Cape Fear River, agricultural lands, and its prominence in North Carolina’s viticulture and farming industry.
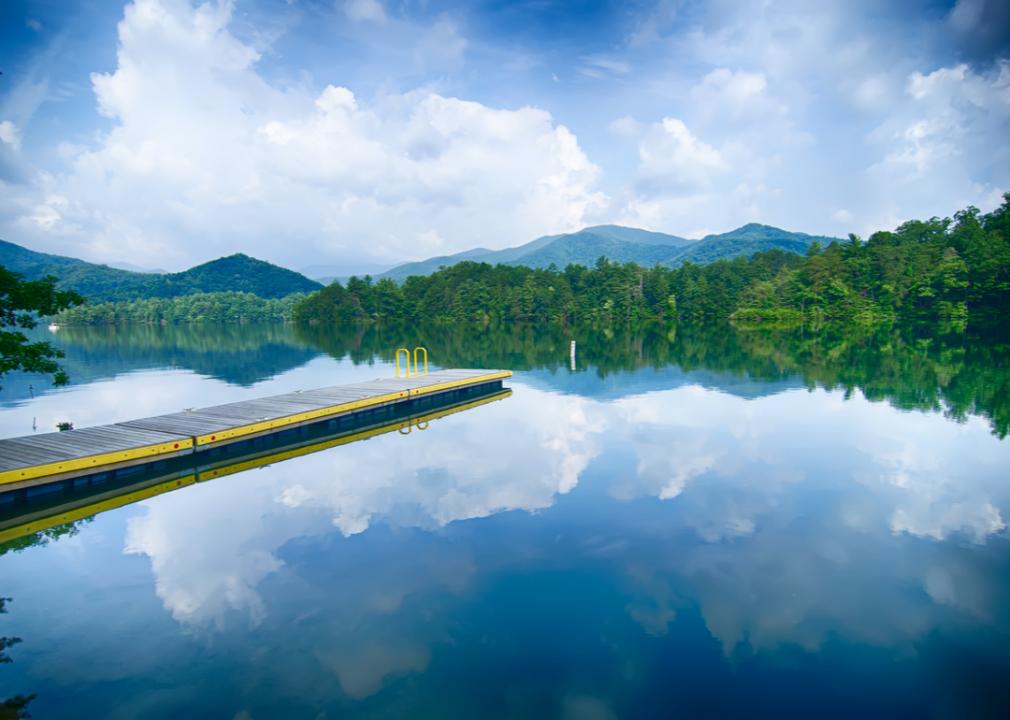
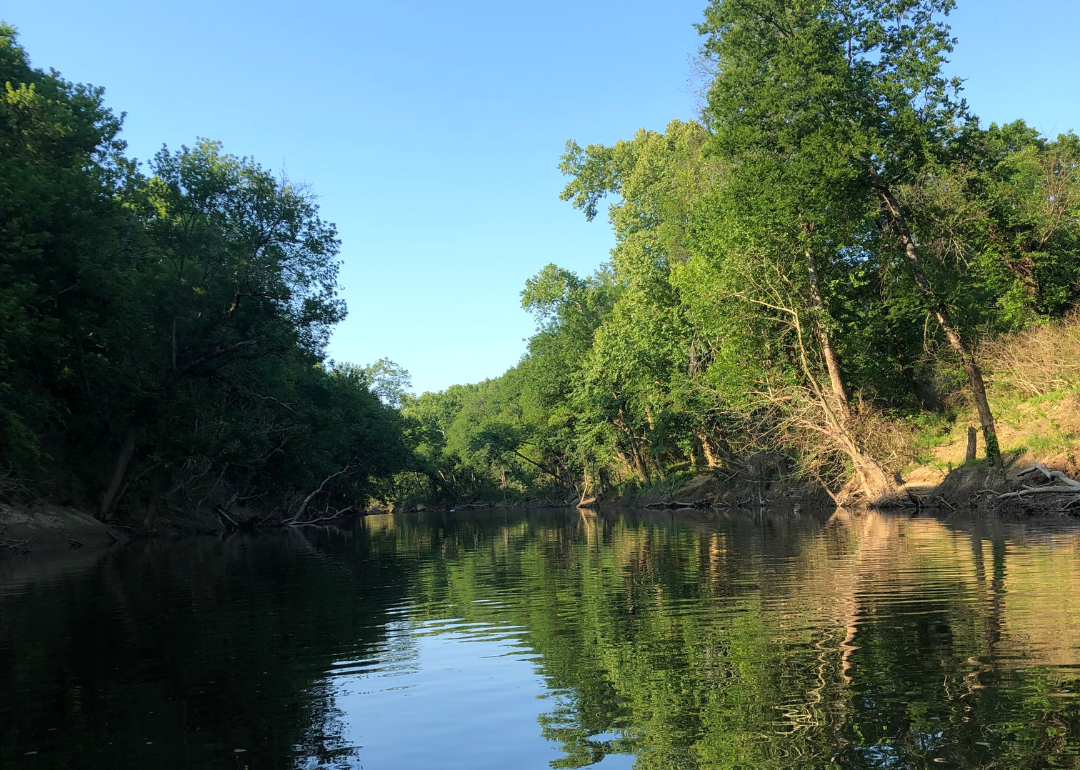
#47. Graham County (tie)
– Life expectancy: 74.8 years
— 1.8 years lower than the state average
About
Graham County sits in North Carolina’s far western mountains, where rugged peaks and deep forests create a landscape both secluded and striking. The county’s character has been shaped by its isolation, with winding roads and remote valleys preserving a slower rhythm of life. Generations have relied on timber, small farming, and close-knit community ties rooted in the Appalachian tradition.
Outdoor life is central here, from fishing and boating on Lake Santeetlah to hiking along Joyce Kilmer Memorial Forest and the Appalachian Trail. Community gatherings often celebrate mountain crafts, music, and seasonal traditions that connect residents to their heritage. Graham County stands as a quiet corner of the Blue Ridge, defined by its natural beauty, enduring traditions, and a strong sense of place.
Where is Graham County?
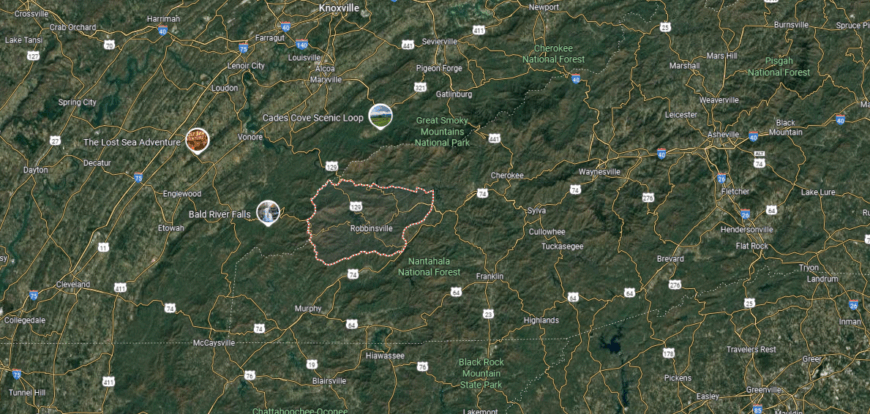
Graham County sits in the far western corner of North Carolina, sharing its southern border with Cherokee County and touching Tennessee to the north. It lies within the Great Smoky Mountains, making it one of the state’s most rugged and isolated counties. The land spans roughly 20 miles north to south and 30 miles east to west.
Robbinsville, the county seat, rests in the center of the county along U.S. Highway 129. Nearby communities include Stecoah to the northeast and Lake Santeetlah on the western side. The county is defined by mountain terrain, the Cheoah River, and large portions of Nantahala National Forest.
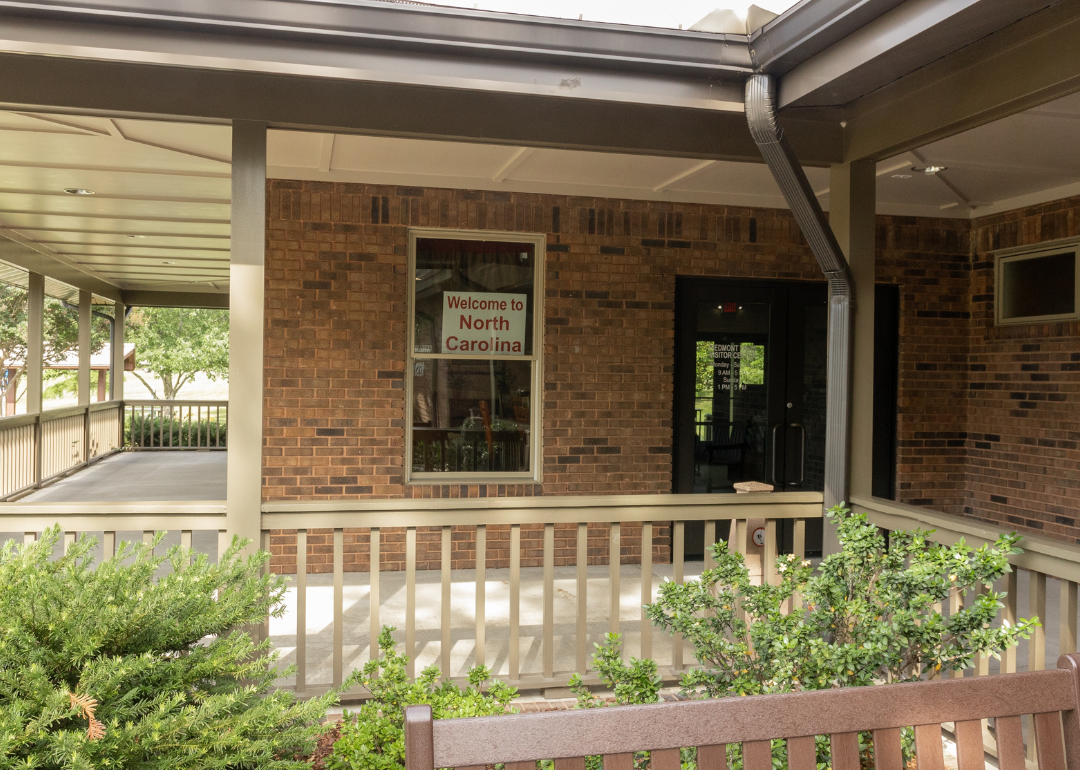
#46. Lee County (tie)
– Life expectancy: 74.8 years
— 1.8 years lower than the state average
You may also like: Counties where children have the best opportunity for economic mobility in North Carolina
About
Lee County rests in the heart of North Carolina, where crossroads of rail lines and highways once spurred its growth. The county’s history is closely tied to brickmaking and manufacturing, industries that earned it recognition as an industrial hub. Alongside this legacy, farming communities and small towns have kept their presence, balancing work, tradition, and steady development.
Residents gather at local festivals, school events, and civic spaces that reinforce a sense of unity. Outdoor recreation on parks, trails, and nearby reservoirs adds to the rhythm of community life. Lee County continues to blend its industrial roots with modern growth, creating a place marked by resilience, adaptability, and local pride.
Where is Lee County?
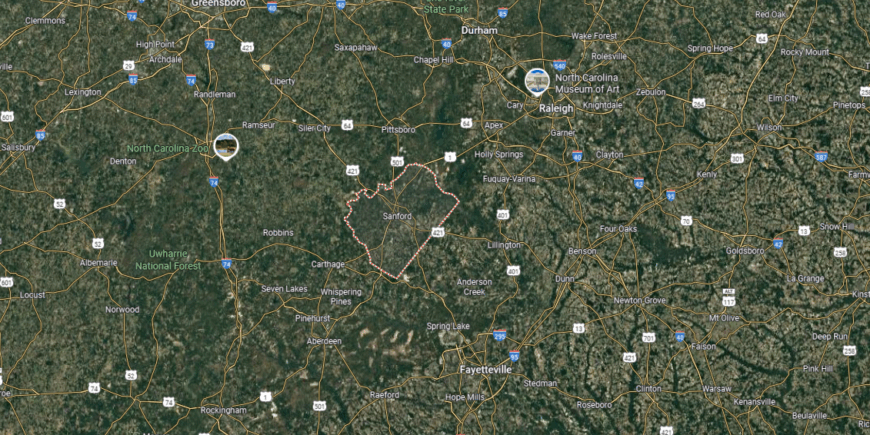
Lee County is positioned in the heart of central North Carolina, bordered by Chatham County to the north and Harnett County to the south. It belongs to the Piedmont region, where rolling hills and streams shape much of the landscape. The county covers about 25 miles from east to west and 20 miles from north to south.
Sanford, the county seat, lies near the center and serves as the main hub of activity. Other nearby communities include Broadway to the southeast and Tramway to the south. The Deep River and Cape Fear River form key waterways, placing Lee County at a natural crossroads between the Piedmont and Sandhills.
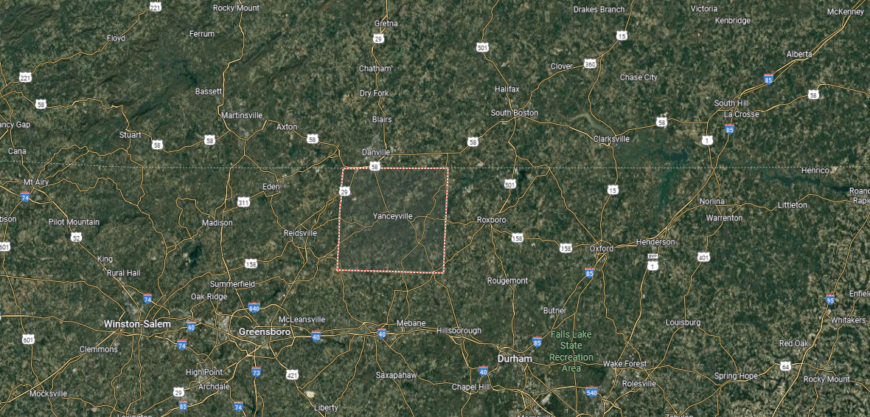
#45. Caswell County (tie)
– Life expectancy: 74.8 years
— 1.8 years lower than the state average
About
Caswell County lies along North Carolina’s northern border, where rolling farmland, woodlands, and quiet crossroads define its landscape. Established in the late 18th century, the county holds deep historical roots tied to tobacco farming, courthouse towns, and early civic life. Its rural stretches and historic structures still reflect the rhythm of an agricultural heritage that shaped generations.
Community life revolves around traditions carried through churches, schools, and annual gatherings that connect families across time. Residents take pride in preserving historic sites while fostering a slower, measured pace of living that contrasts with nearby urban areas. Caswell County endures as a place where history, land, and community remain tightly interwoven.
Where is Caswell County?
🔥 Would you like to save this?
Caswell County lies in the northern part of North Carolina, directly along the Virginia border. It is surrounded by Rockingham County to the west and Person County to the east, placing it within the rolling hills of the Piedmont. The county stretches about 30 miles east to west and 25 miles north to south.
Yanceyville serves as the county seat, located near the center of the county. Other nearby towns include Milton along the Dan River to the northeast and Providence closer to the Virginia state line. The county is marked by farmland, river valleys, and its proximity to the Dan and Hyco Rivers.
#44. Craven County
– Life expectancy: 74.7 years
— 1.9 years lower than the state average
About
Craven County sits where the Neuse and Trent Rivers meet, creating a landscape shaped by water, trade, and early settlement. Founded in the early 1700s, it carries a strong colonial legacy with New Bern serving as one of North Carolina’s earliest capitals. The mix of historic streets, coastal plains, and riverfront communities reflects centuries of cultural and economic life tied to the water.
Today, festivals, arts, and waterfront recreation keep community spirit alive across towns and neighborhoods. Families gather for boating, fishing, and seasonal celebrations that highlight both tradition and local pride. Craven County remains a place where history and riverside living merge, giving it a character that is both enduring and distinctly coastal.
Where is Craven County?
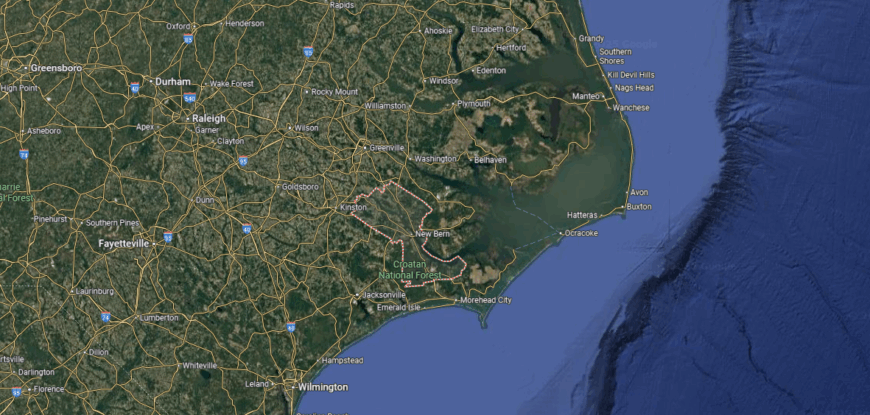
Craven County is situated in eastern North Carolina where the Neuse and Trent Rivers meet, giving it a strong coastal identity. It is bordered by Beaufort County to the northeast and Jones County to the southwest, with the Pamlico Sound lying to the east. The county extends about 40 miles north to south and 25 miles east to west.
New Bern, the county seat, rests at the confluence of the Neuse and Trent Rivers and is one of the oldest towns in the state. Other nearby communities include Havelock to the southeast, Bridgeton to the north, and Vanceboro in the west. The area features coastal wetlands, riverfront landscapes, and proximity to Marine Corps Air Station Cherry Point.
#43. Alexander County
– Life expectancy: 74.6 years
— 2.0 years lower than the state average
About
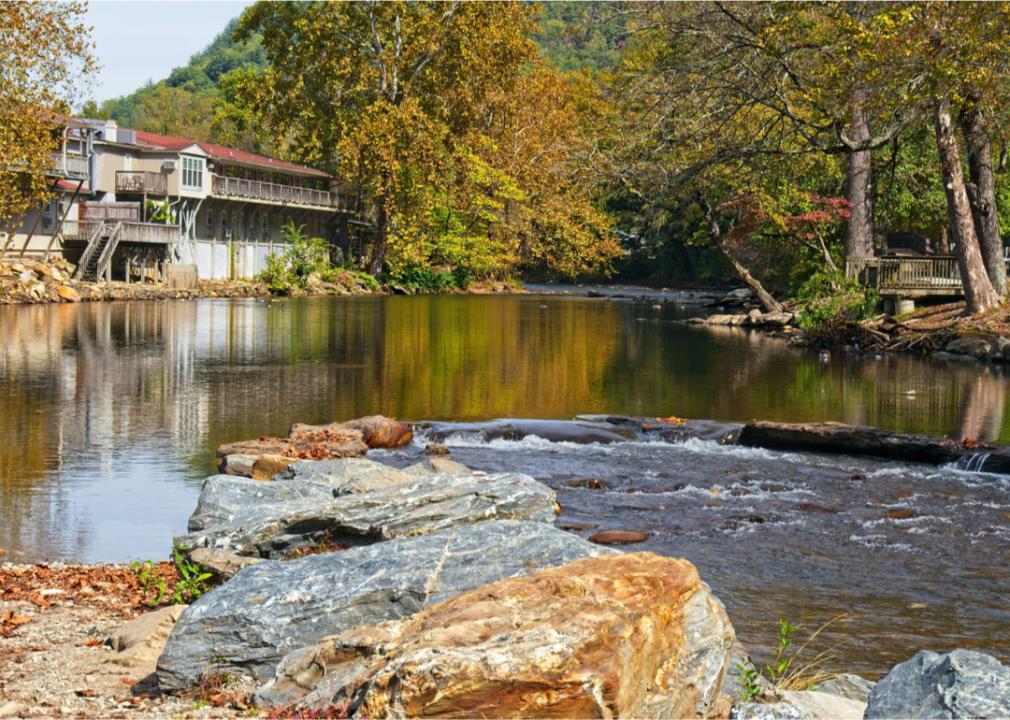
Alexander County rests in the foothills of western North Carolina, where ridges and valleys create a landscape shaped by both farming and small-town traditions. Formed in the mid-1800s, it grew from an agricultural base rooted in corn, wheat, and livestock, later expanding into furniture and textile production. The county’s communities remain close-knit, with historic town centers and rural homesteads tying residents to the land.
Life here blends outdoor recreation with enduring local customs. Residents gather for county fairs, church-centered events, and seasonal festivals that strengthen family and community ties. Alexander County reflects a steady, grounded identity—where heritage, hard work, and a connection to the foothills continue to define daily life.
Where is Alexander County?
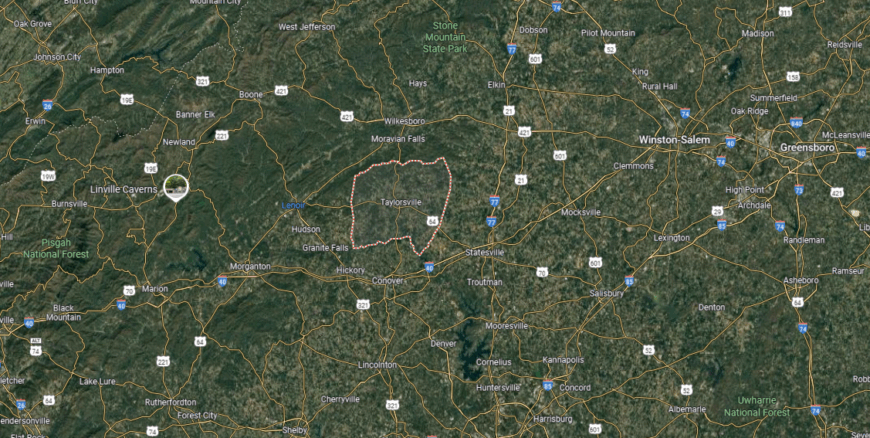
Alexander County is located in the western Piedmont of North Carolina, bordered by Wilkes County to the north and Catawba County to the south. The Brushy Mountains rise along its northern edge, giving the area a mix of rolling hills and foothills. The county spans about 20 miles from north to south and 35 miles from east to west.
Taylorsville, the county seat, lies near the geographic center of Alexander County. Nearby towns and communities include Hiddenite to the east, Ellendale to the northwest, and Bethlehem along the southern border. The county’s landscape is shaped by the South Yadkin River, fertile farmland, and the scenic Brushy Mountain range.
#42. Cherokee County (tie)
– Life expectancy: 74.5 years
— 2.1 years lower than the state average
About
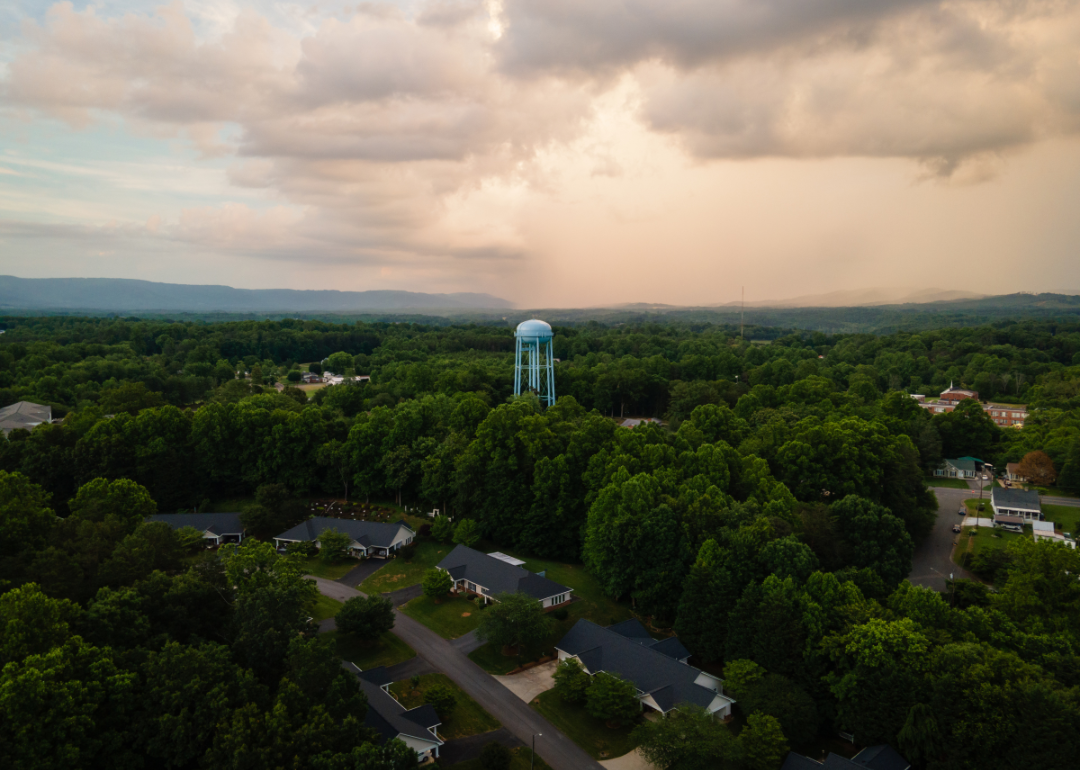
Cherokee County, at the southwestern tip of North Carolina, is framed by mountains, valleys, and rivers that have long guided its character. Its name honors the Cherokee people who first called this land home, and their legacy remains interwoven with the region’s story. Small towns like Murphy serve as anchors of commerce and culture, balancing mountain traditions with modern growth.
Life in the county is closely tied to the outdoors, from boating on Hiwassee Lake to exploring mountain trails and scenic byways. Community events celebrate crafts, music, and history, carrying forward Appalachian heritage through gatherings that bring neighbors together. Cherokee County endures as a place where natural beauty and cultural tradition meet, offering both seclusion and connection in equal measure.
Where is Cherokee County?
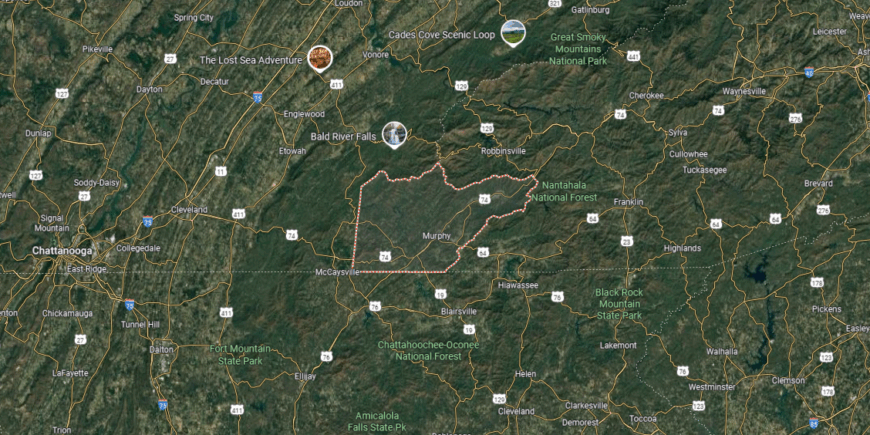
Cherokee County is tucked into the southwestern tip of North Carolina, where the state meets both Tennessee and Georgia. It lies within the southern Appalachian Mountains, giving it a rugged setting of peaks and valleys. The county stretches roughly 35 miles east to west and 20 miles north to south.
Murphy, the county seat, is positioned near the junction of the Hiwassee and Valley Rivers. Other nearby towns include Andrews to the east and Marble along U.S. Highway 19. The county’s features include large portions of Nantahala National Forest, Lake Hiwassee, and scenic connections to the Blue Ridge Mountains.
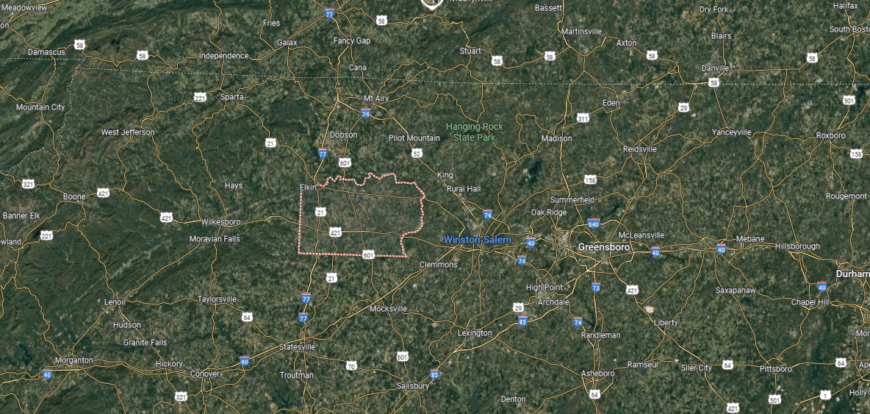
#41. Surry County (tie)
– Life expectancy: 74.5 years
— 2.1 years lower than the state average
You may also like: Highest-rated things to do in North Carolina, according to Tripadvisor
About
Surry County lies in the northern Piedmont of North Carolina, where the Blue Ridge foothills ease into fertile valleys. Its history is steeped in farming and milling, with tobacco and grain once driving the local economy. Towns like Mount Airy gained wider recognition for their ties to American culture, blending small-town identity with a sense of shared tradition.
Community rhythms flow through vineyard tours, bluegrass festivals, and gatherings that highlight the county’s mountain heritage. Outdoor life on the Yadkin River and the rolling hills adds another layer of connection to the land. Surry County remains a place where history, culture, and landscape create a distinct sense of belonging.
Where is Surry County?
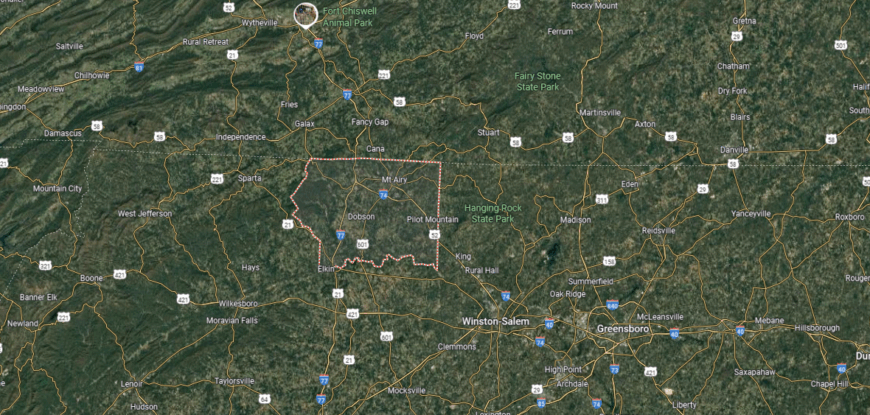
Surry County lies in the northwestern Piedmont region of North Carolina, sharing its northern border with the state of Virginia. It is framed by Stokes County to the east and Wilkes County to the west, covering an area of rolling foothills that lead into the Blue Ridge Mountains. The county spans about 30 miles north to south and 35 miles east to west.
Dobson serves as the county seat and sits near the county’s center. Other notable towns include Mount Airy to the north, Pilot Mountain to the southeast, and Elkin along the southern boundary. The county is defined by the Yadkin River, Pilot Mountain State Park, and its location at the gateway to the Blue Ridge Parkway.
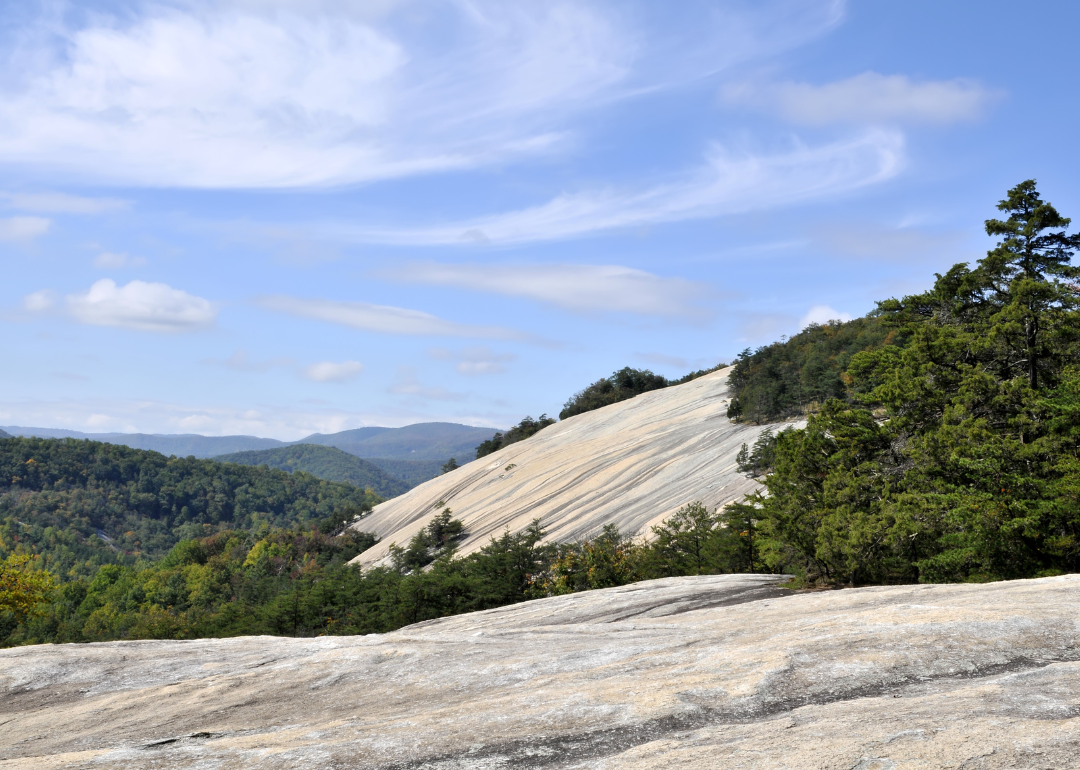
#40. Wilkes County (tie)
– Life expectancy: 74.5 years
— 2.1 years lower than the state average
About
Wilkes County stretches across the edge of North Carolina’s Blue Ridge Mountains, where rugged peaks give way to fertile valleys. Once known as the “Moonshine Capital of the World,” it holds a colorful past of frontier independence and mountain industry. The county’s roots in farming, timber, and music continue to shape its enduring identity.
Community gatherings often revolve around bluegrass traditions, harvest festivals, and outdoor life tied to the rivers and hills. Families find recreation in activities ranging from hiking and fishing to local events that honor both history and craft. Wilkes County stands as a mountain gateway, defined by resilience, heritage, and a landscape that encourages a strong connection to place.
Where is Wilkes County?
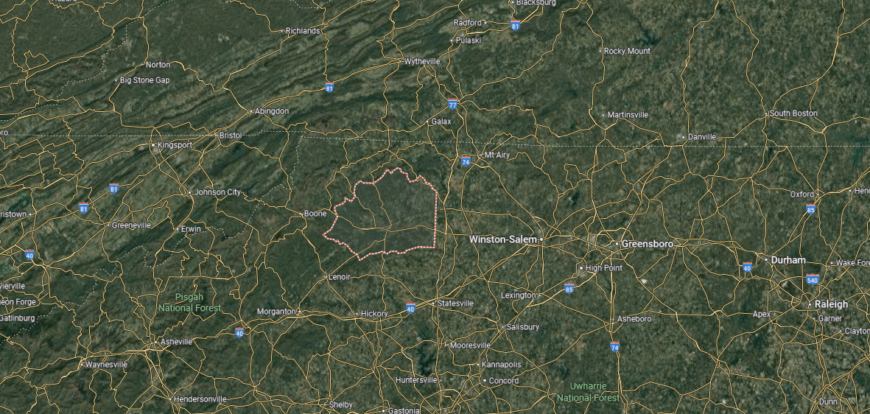
Wilkes County is located in the foothills of northwestern North Carolina, bordered by Ashe County to the north and Alexander County to the south. Its landscape stretches from the Yadkin Valley in the east to the Blue Ridge Mountains in the west. The county covers roughly 40 miles from north to south and 45 miles from east to west.
Wilkesboro, the county seat, lies along the Yadkin River near the county’s center. Neighboring towns include North Wilkesboro to the northeast, Traphill near the Blue Ridge, and Ronda along the southern edge. The county is marked by Stone Mountain State Park, parts of the Blue Ridge Parkway, and fertile valleys along the Yadkin River.
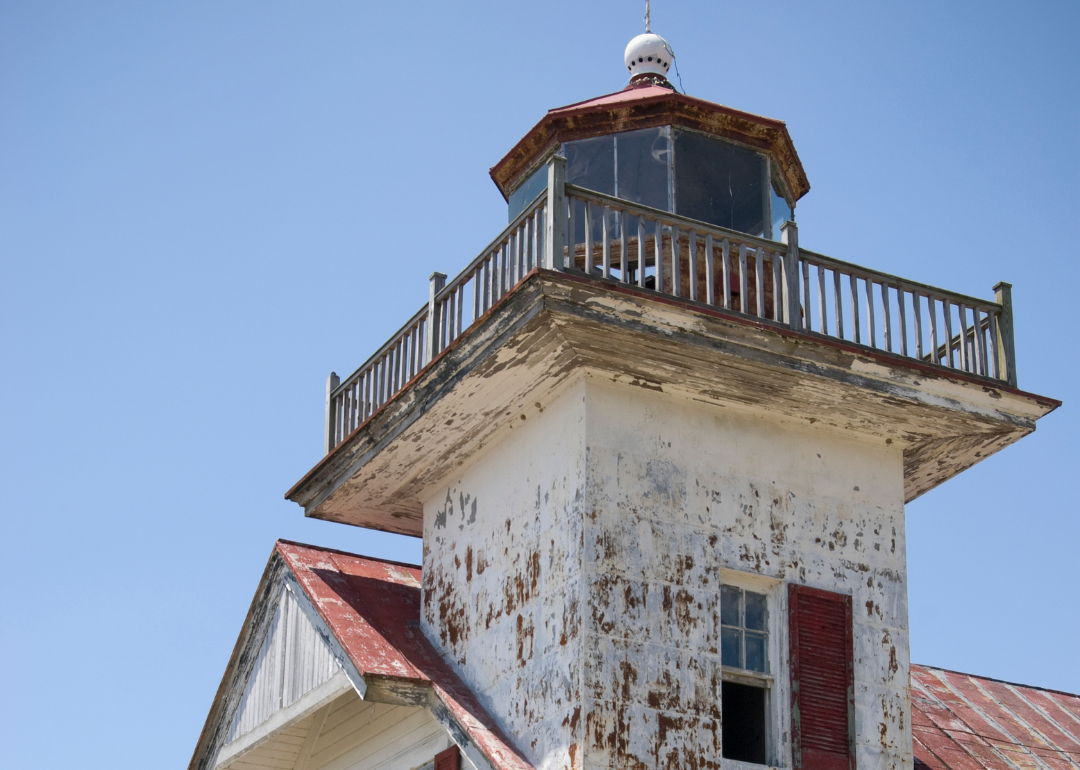
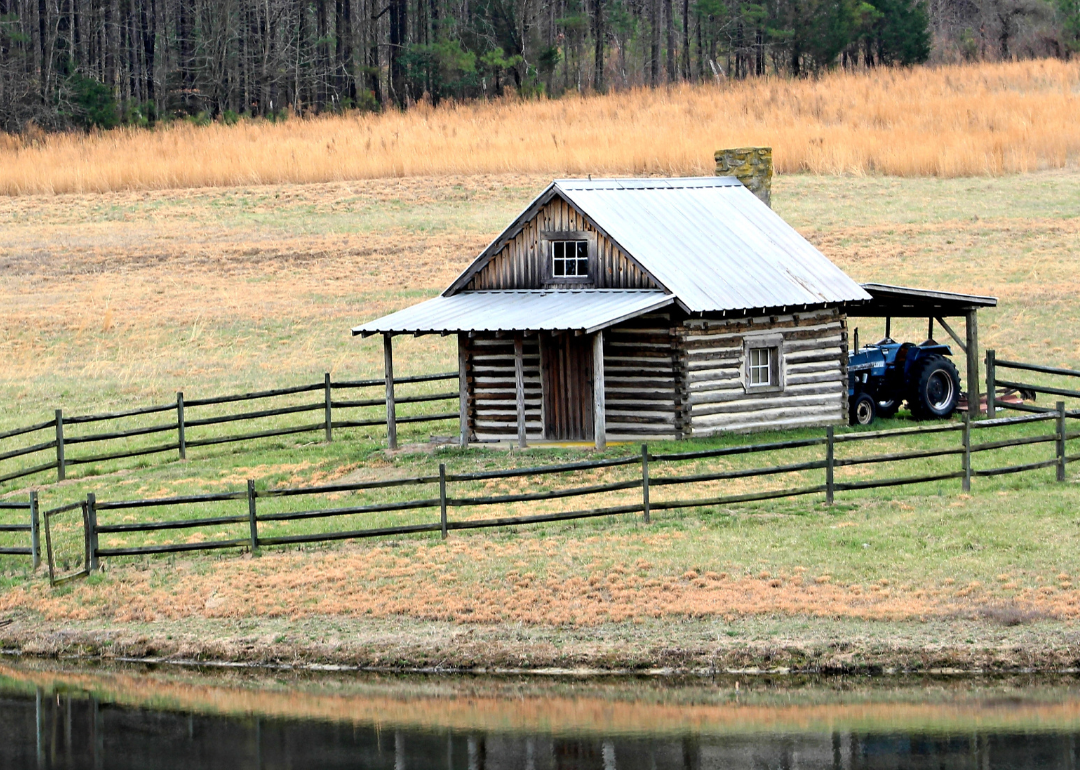
#39. Chowan County (tie)
– Life expectancy: 74.5 years
— 2.1 years lower than the state average
About
Chowan County sits along the Albemarle Sound in northeastern North Carolina, where waterways and fertile soil shaped some of the state’s earliest settlements. Established in the 1600s, it holds a long colonial legacy marked by historic Edenton, one of North Carolina’s first capitals. The county’s landscape of farms, rivers, and preserved architecture reflects centuries of cultural and civic life rooted in the coast.
Residents continue traditions through waterfront festivals, historic tours, and community gatherings that highlight both heritage and local pride. Daily life often centers around churches, schools, and small-town events that reinforce strong ties across generations. Chowan County remains a place where history and shoreline living intertwine, offering a lasting sense of identity grounded in both past and place.
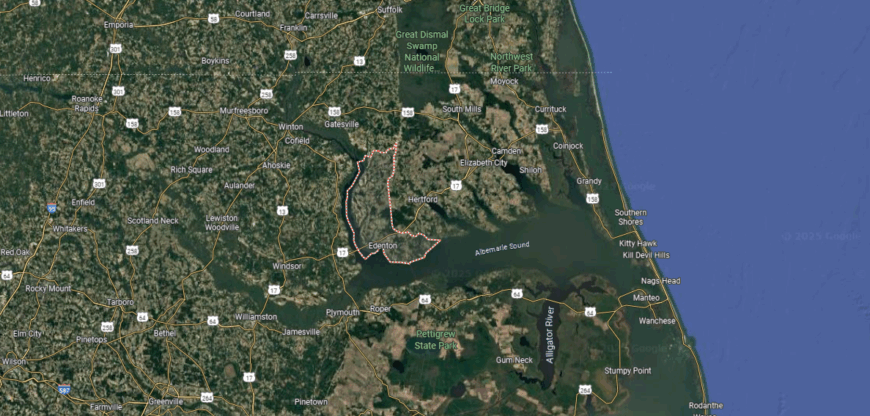
Where is Chowan County?
🔥 Would you like to save this?
Chowan County rests in northeastern North Carolina, bordered by Gates County to the north and Washington County to the south. Its western edge follows the Chowan River, while the Albemarle Sound defines much of its eastern boundary. The county spans about 15 miles north to south and 20 miles east to west, making it one of the state’s smallest counties in size.
Edenton, the county seat, is located at the mouth of the Chowan River where it meets the Albemarle Sound. Other nearby communities include Tyner to the west and Rockyhock to the northwest. The county is characterized by fertile coastal farmland, waterfront landscapes, and its historic role as one of North Carolina’s earliest centers of settlement.
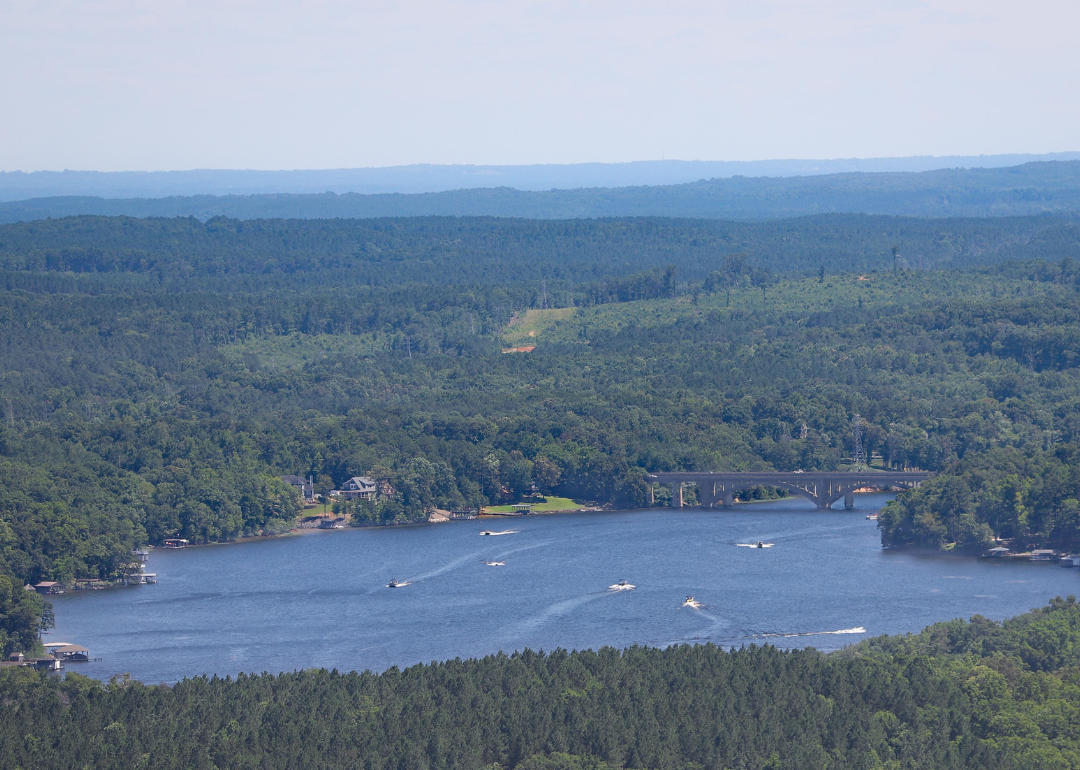
#38. Warren County (tie)
– Life expectancy: 74.4 years
— 2.2 years lower than the state average
About
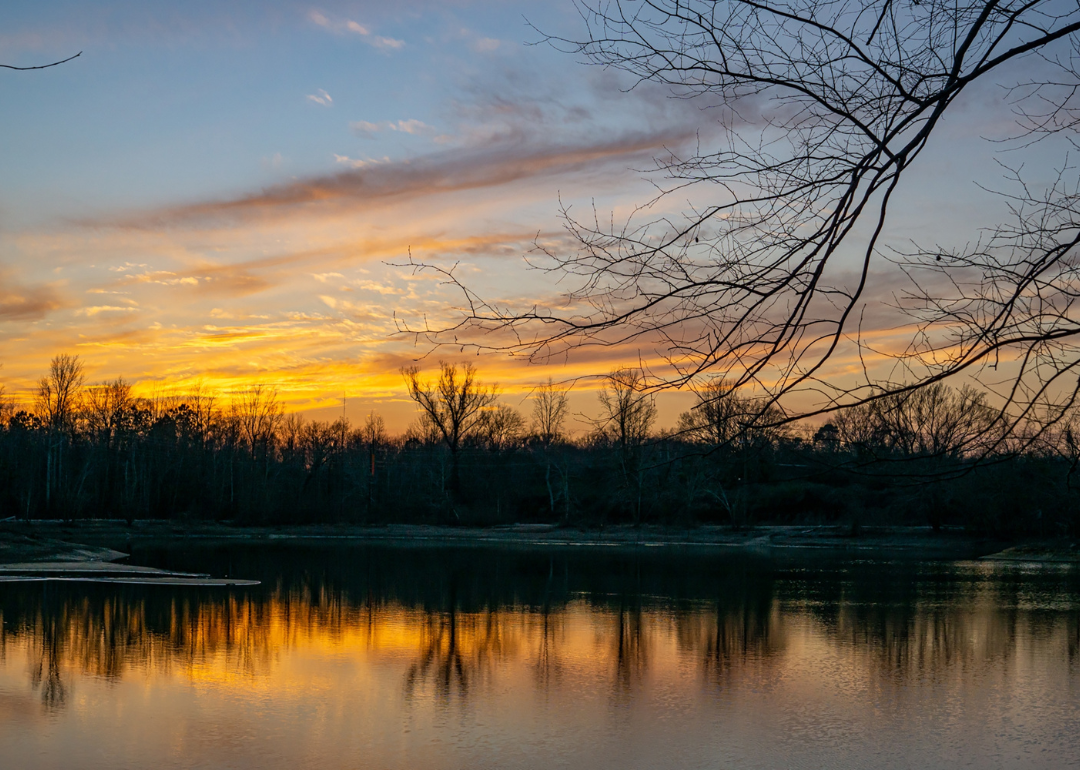
Warren County rests in North Carolina’s northeastern Piedmont, where gently rolling farmland meets the waters of Kerr Lake and the Roanoke River. Established in the late 18th century, it quickly grew into a center of plantation agriculture, education, and political life. Its towns still carry echoes of that history through courthouse squares, historic homes, and cultural landmarks.
Today, the county balances its heritage with recreation and community traditions. Residents enjoy lakefront activities, local festivals, and gatherings that highlight food, music, and civic pride. Warren County reflects both a deep historical legacy and a present-day rhythm tied to land, water, and enduring community bonds.
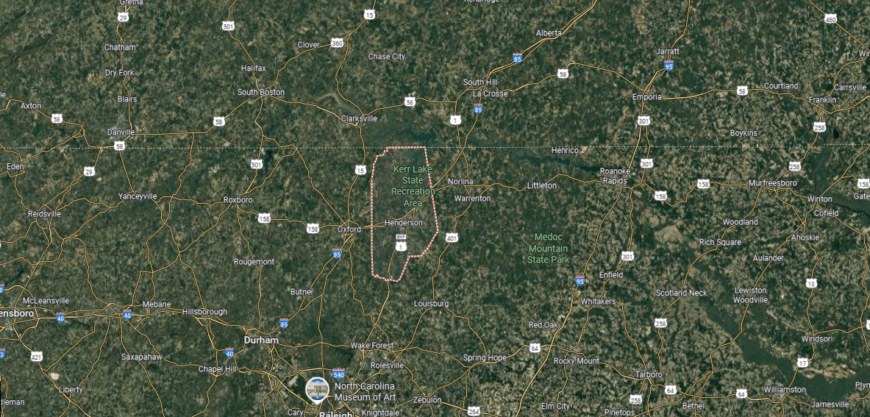
Where is Warren County?
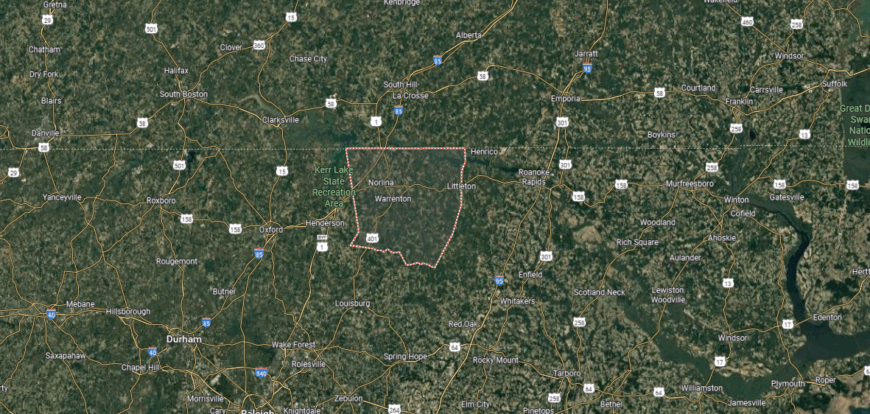
Warren County is situated in north-central North Carolina along the Virginia border. It is framed by Vance County to the west and Halifax County to the east, lying within the Piedmont region. The county covers about 25 miles from north to south and 30 miles from east to west.
Warrenton, the county seat, is located near the county’s center along U.S. Highway 158. Other nearby towns include Norlina to the north, Macon toward the southwest, and Littleton along the eastern edge. The county features Kerr Lake, sections of the Roanoke River basin, and a landscape of farmland and forest.
#37. Stanly County (tie)
– Life expectancy: 74.4 years
— 2.2 years lower than the state average
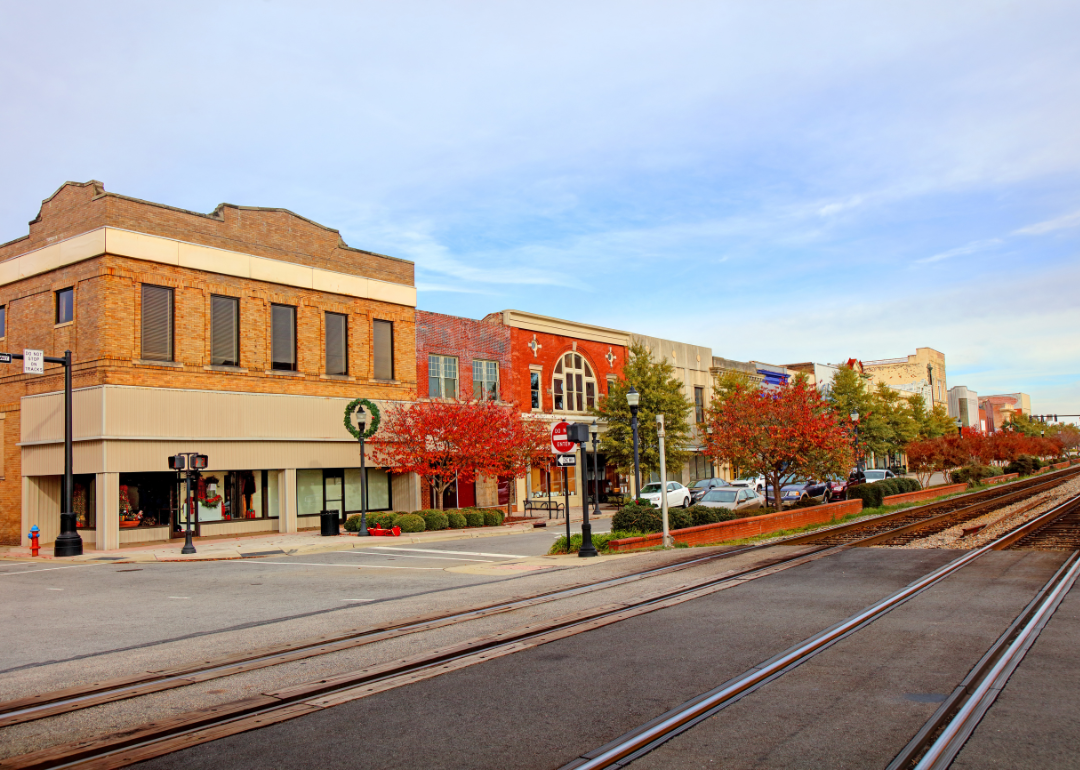
About
Stanly County lies in the rolling Piedmont of central North Carolina, where the Yadkin and Pee Dee Rivers carve through the landscape. Its roots trace back to early farming communities, textile mills, and river-based industry that gave shape to its economy. The county seat of Albemarle grew as a hub for commerce and civic life, anchoring the surrounding towns and rural areas.
Community life reflects a mix of tradition and recreation, from church-centered gatherings to outdoor activities at Morrow Mountain State Park. Festivals, local arts, and sports bring residents together, strengthening ties across generations. Stanly County endures as a place where natural beauty, history, and small-town spirit combine to create a steady, connected way of life.
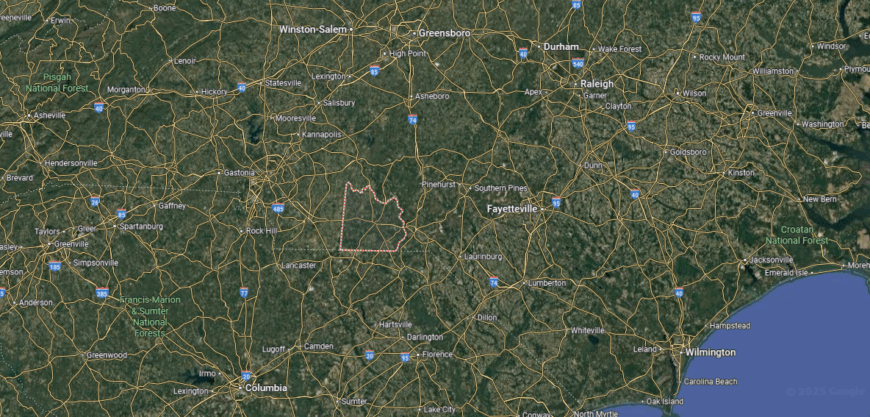
Where is Stanly County?
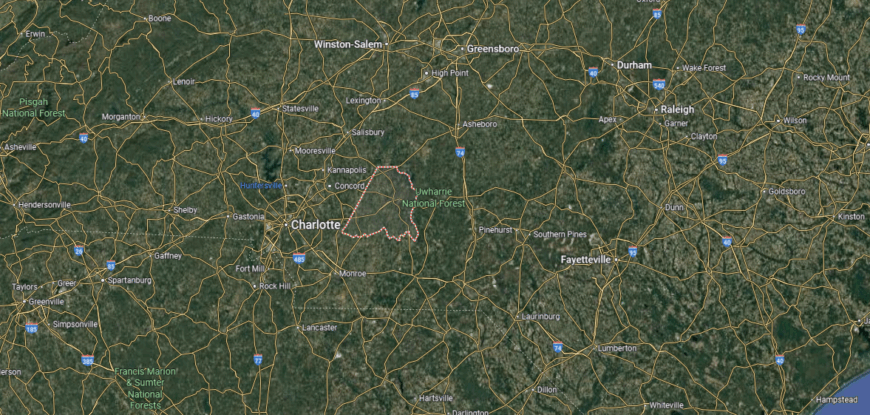
Stanly County lies in the south-central part of North Carolina, bordered by Rowan County to the north and Montgomery County to the east. It belongs to the Piedmont region, where rolling hills meet the Uwharrie Mountains. The county spans about 25 miles from north to south and 35 miles from east to west.
Albemarle serves as the county seat, positioned slightly east of center. Other nearby towns include Locust on the western edge, Norwood in the south, and Oakboro to the southwest. The Yadkin and Pee Dee Rivers shape the county’s eastern boundary, alongside Badin Lake and Morrow Mountain State Park.
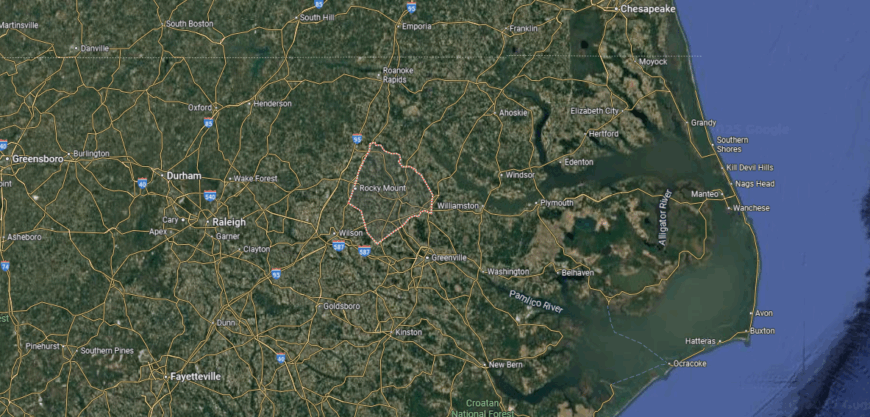
#36. Nash County (tie)
– Life expectancy: 74.4 years
— 2.2 years lower than the state average
You may also like: Fastest-growing jobs in North Carolina
About
Nash County sits in eastern North Carolina, where farmland stretches across the Coastal Plain and communities trace their history to the late 18th century. Agriculture, especially tobacco and later diversified crops, long shaped its economy, while railroads and highways brought steady growth. Rocky Mount, the largest city, developed into a commercial center that anchors the county’s civic and cultural life.
Daily rhythms here still reflect a blend of rural and urban influences. Residents gather for fairs, concerts, and community festivals while also enjoying parks, trails, and local sports. Nash County stands as a crossroads of tradition and progress, carrying forward its agricultural heritage while fostering a dynamic modern identity.
Where is Nash County?
Nash County is located in the northeastern Piedmont of North Carolina, bordered by Halifax County to the north and Wilson County to the south. The Tar River runs through the county, shaping much of its terrain and providing a natural waterway. It spans roughly 30 miles east to west and 25 miles north to south.
Nashville, the county seat, sits near the county’s center along U.S. Highway 64. Rocky Mount, the largest city, extends across the southern boundary into Edgecombe County. The county features farmland, river valleys, and access to major transportation routes linking it to Raleigh and eastern North Carolina.
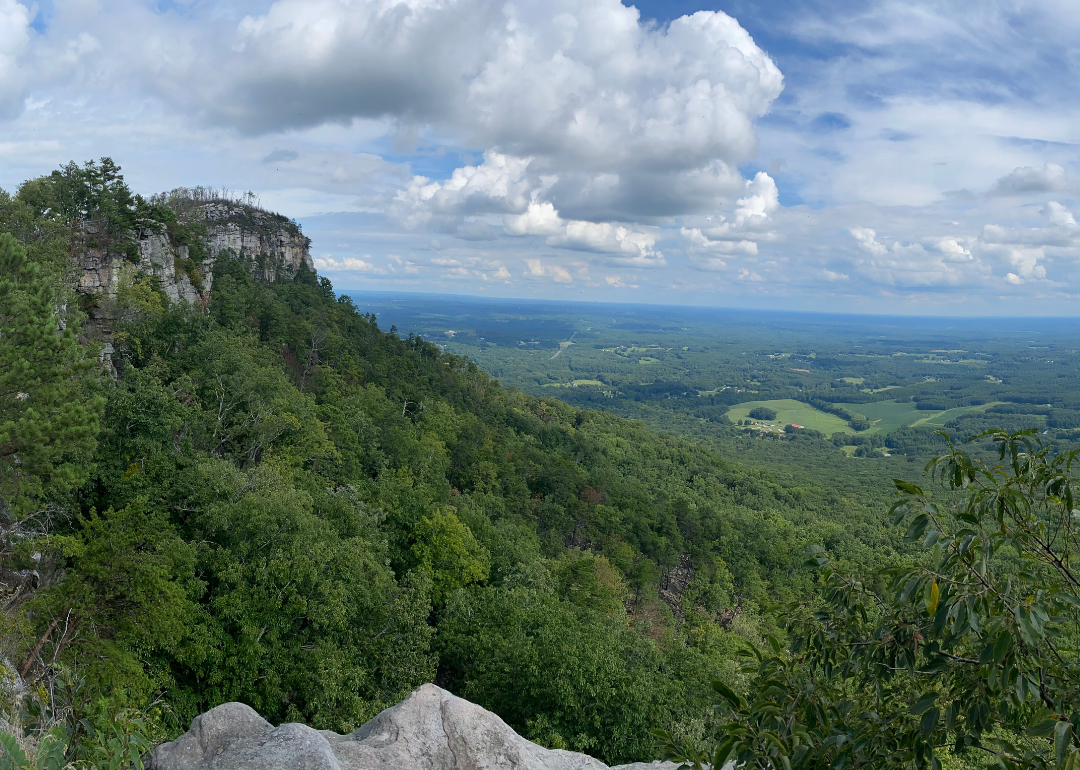
#35. Yadkin County (tie)
– Life expectancy: 74.4 years
— 2.2 years lower than the state average
About
Yadkin County rests in the northwestern Piedmont of North Carolina, where farmland and gentle hills define the landscape. Its roots lie in agriculture, with tobacco and grain once central, now joined by vineyards that give the county a role in North Carolina’s wine industry. Small towns and rural communities preserve a character shaped by hard work and generational ties to the land.
Life here often centers on local festivals, church events, and traditions that connect families year after year. Outdoor activities on the Yadkin River and surrounding countryside add to the pace of community living. Yadkin County reflects a grounded way of life, where heritage and landscape remain closely interwoven.
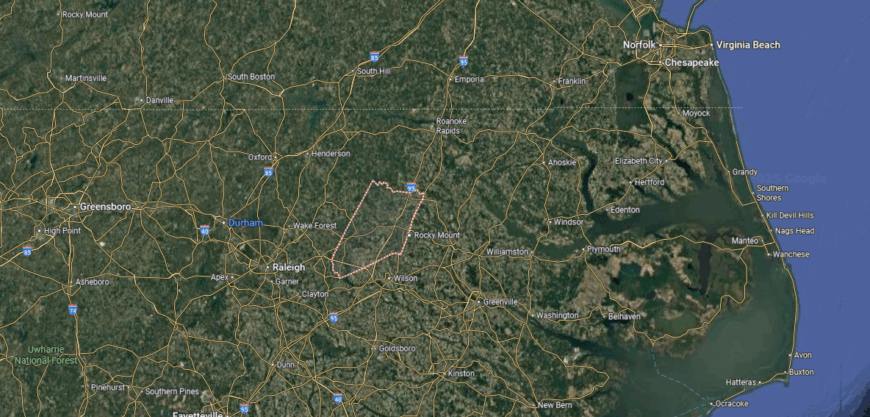
Where is Yadkin County?
Yadkin County rests in the northwestern Piedmont of North Carolina, bordered by Surry County to the north and Davie County to the east. It lies within the Yadkin Valley, an area known for rolling hills, fertile farmland, and vineyard country. The county covers about 20 miles from north to south and 25 miles from east to west.
Yadkinville, the county seat, is positioned near the geographic center along U.S. Highway 421. Other nearby towns include East Bend to the southeast, Jonesville at the western edge, and Boonville in the north. The Yadkin River forms much of the eastern boundary, shaping the county’s landscape and providing a natural corridor through the region.
#34. Pasquotank County (tie)
– Life expectancy: 74.3 years
— 2.3 years lower than the state average

🔥 Would you like to save this?
About
Pasquotank County sits in North Carolina’s northeast, bordered by the Pasquotank River and Albemarle Sound. From its earliest colonial settlement, the county grew through trade, river transport, and fertile farmland that supported coastal communities. Elizabeth City, the county seat, developed into a cultural and commercial hub, linking water-based heritage with civic life.
Residents gather for waterfront festivals, historic celebrations, and local arts that highlight community pride. The river and sound provide opportunities for boating, fishing, and recreation that connect daily life to the natural setting. Pasquotank County endures as a place where history, waterways, and community spirit continue to shape its identity.
Where is Pasquotank County?
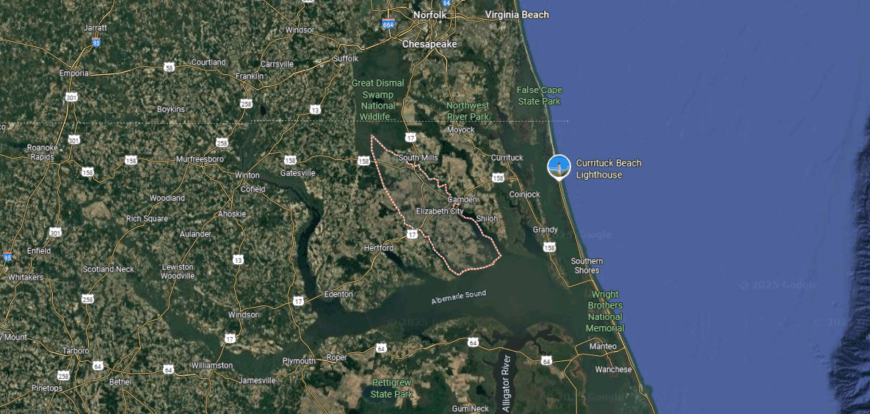
Pasquotank County is located in northeastern North Carolina, bordered by Perquimans County to the west and Camden County to the east. It lies along the Pasquotank River, which flows into the Albemarle Sound, giving the county strong ties to coastal waterways. The area measures about 20 miles from north to south and 15 miles from east to west.
Elizabeth City, the county seat, sits on the western bank of the Pasquotank River and serves as the region’s primary hub. Other nearby communities include Weeksville to the south and Providence to the north. The county is shaped by riverfront landscapes, agricultural lands, and access to the Intracoastal Waterway.
#33. Sampson County (tie)
– Life expectancy: 74.3 years
— 2.3 years lower than the state average
About
Sampson County, one of North Carolina’s largest by land area, stretches across the Coastal Plain with fields and forests defining much of its landscape. Agriculture has long been its backbone, with crops, livestock, and poultry anchoring both its economy and cultural life. Small towns and crossroads communities remain central, reflecting traditions built on farming and close community ties.
Festivals, school events, and church gatherings bring residents together in ways that emphasize heritage and pride of place. Outdoor life follows the rhythm of the land, from hunting and fishing to seasonal harvests that mark the calendar. Sampson County stands as a testament to rural endurance, where history, land, and community continue to guide its identity.
Where is Sampson County?
Sampson County lies in the southeastern part of North Carolina, bordered by Johnston County to the north and Bladen County to the south. It is one of the largest counties in the state by land area, stretching across farmland, forests, and river plains. The county spans about 45 miles east to west and 35 miles north to south.
Clinton, the county seat, is located near the center along U.S. Highway 421. Other communities include Newton Grove in the north, Garland to the south, and Roseboro in the west. The county is defined by its agricultural base, the presence of the Black River, and roadways that connect it to Fayetteville, Raleigh, and Wilmington.
#32. Davidson County (tie)
– Life expectancy: 74.3 years
— 2.3 years lower than the state average
About
Davidson County lies in North Carolina’s Piedmont, where rolling farmland meets the Yadkin River and long-standing communities trace back to the 19th century. Its history is tied to furniture and textile production, industries that shaped both its economy and cultural character. Lexington, the county seat, anchors civic life and is widely known for its barbecue tradition that draws visitors from across the state.
Community life is enriched through festivals, music, and gatherings that reflect both heritage and creativity. Parks, lakes, and trails provide space for recreation, while schools and local institutions sustain strong community bonds. Davidson County carries forward a balanced identity—rooted in industry and tradition, yet shaped by the rhythm of small-town pride and regional flavor.
Where is Davidson County?
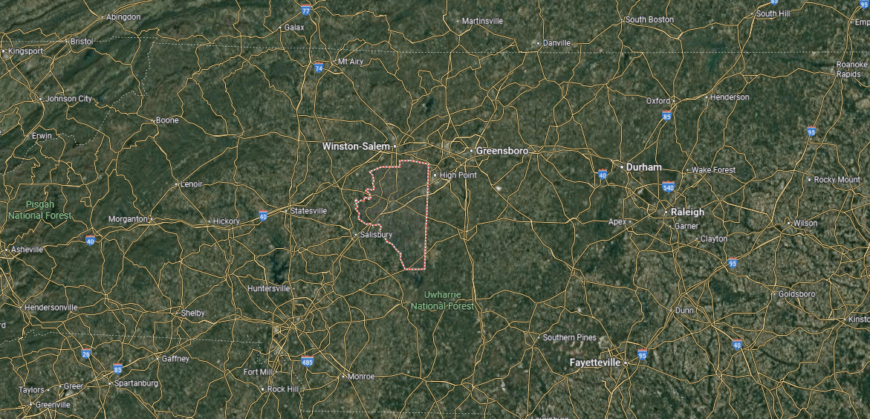
Davidson County is situated in the central Piedmont of North Carolina, bordered by Forsyth County to the north and Rowan County to the south. The Yadkin River defines its western boundary, while the Uwharrie Mountains touch its eastern side. The county measures about 30 miles from north to south and 35 miles from east to west.
Lexington, the county seat, lies near the center and is known as a regional hub along Interstate 85. Other towns include Thomasville to the southeast, Denton near the Uwharrie foothills, and Midway at the northern edge. The area is shaped by river valleys, Lake Thom-A-Lex, and its location between the Triad and Charlotte regions.
#31. Pamlico County (tie)
– Life expectancy: 74.3 years
— 2.3 years lower than the state average
You may also like: How drunk driving fatalities in North Carolina compare to the rest of the US
About
Pamlico County rests along North Carolina’s eastern coast, where rivers, creeks, and the Pamlico Sound shape both its landscape and its way of life. Formed in the late 19th century, the county has long relied on fishing, farming, and boating, with water serving as its defining feature. Small towns and rural crossroads reflect a history built on self-reliance and close ties to the natural environment.
Life here often centers on the water—residents gather for fishing tournaments, sailing, and waterfront festivals that highlight local culture. Churches, schools, and community events maintain strong bonds across generations. Pamlico County remains a place where coastal traditions and a steady pace of living continue to guide the community’s identity.
Where is Pamlico County?
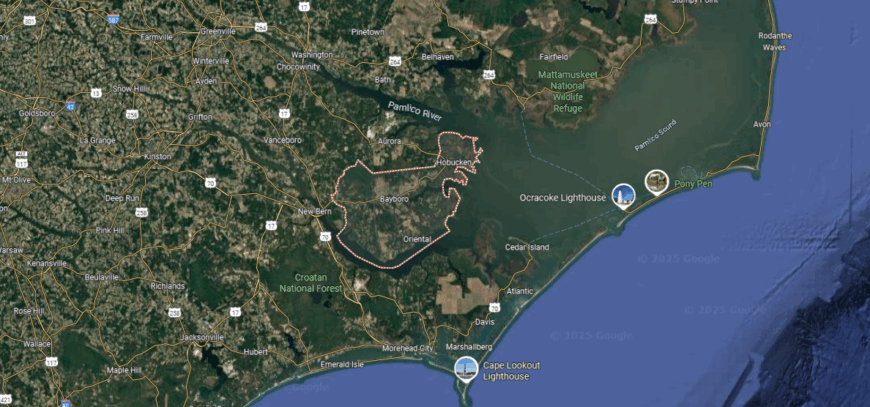
Pamlico County is located in eastern North Carolina, bordered by Beaufort County to the north and Craven County to the west. Its eastern side opens into the Pamlico Sound, while the Neuse River forms much of its southern boundary. The county spans about 20 miles from north to south and 25 miles from east to west.
Bayboro, the county seat, is situated near the center along N.C. Highway 55. Other communities include Oriental on the Neuse River, Grantsboro in the north, and Minnesott Beach near the southern shoreline. The county is defined by low-lying coastal plains, estuaries, and its direct access to the Intracoastal Waterway and Pamlico Sound.
#30. Mitchell County (tie)
– Life expectancy: 74.3 years
— 2.3 years lower than the state average

About
Mitchell County sits high in the Blue Ridge Mountains of western North Carolina, where rugged ridges and deep hollows define its terrain. Known for its rich deposits of mica and gemstones, the county built a legacy around mining that still shapes its identity. Small mountain towns grew as centers of trade, education, and community life, preserving the character of a remote yet resilient region.
Residents find connection through festivals that celebrate crafts, music, and the county’s mineral heritage. Outdoor life plays a central role, with trails, rivers, and scenic vistas offering daily ties to the mountains. Mitchell County endures as a place where natural resources, tradition, and strong community bonds remain at the heart of its story.
Where is Mitchell County?
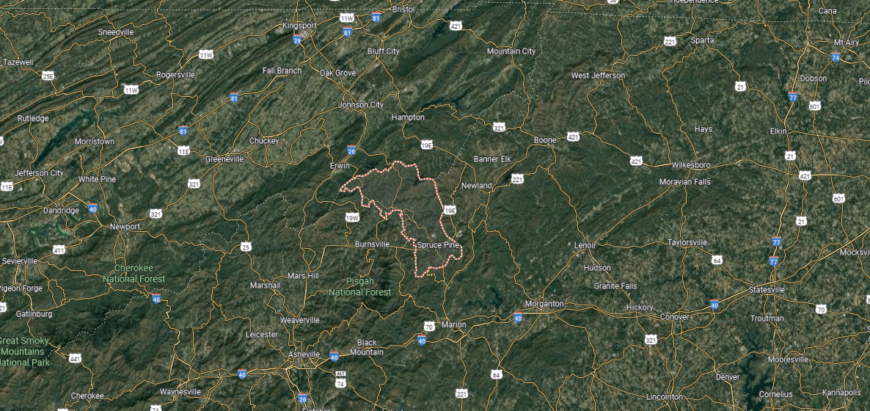
Mitchell County is set in the Blue Ridge Mountains of western North Carolina, bordered by Avery County to the north and Yancey County to the south. It lies near the Tennessee state line, giving it a rugged, high-elevation landscape. The county spans about 20 miles north to south and 25 miles east to west.
Bakersville, the county seat, is located near the center in a mountain valley. Other communities include Spruce Pine to the southeast and Penland along the North Toe River. The area is marked by peaks such as Roan Mountain, scenic river valleys, and sections of Pisgah National Forest.
#29. Wilson County (tie)
– Life expectancy: 73.9 years
— 2.7 years lower than the state average
About
Wilson County rests in eastern North Carolina’s Coastal Plain, where fertile farmland and crossroads towns gave rise to its growth. Tobacco warehouses and rail lines once defined the local economy, making Wilson a hub of agriculture and commerce. Over time, the county seat of Wilson developed into a cultural center, blending historic neighborhoods with modern institutions.
Life here is marked by festivals, arts, and community traditions that showcase both heritage and creativity. Parks, sports, and local events bring residents together, reinforcing strong civic ties. Wilson County carries forward a balance of history and progress, where agricultural roots remain visible alongside a steadily evolving identity.
Where is Wilson County?
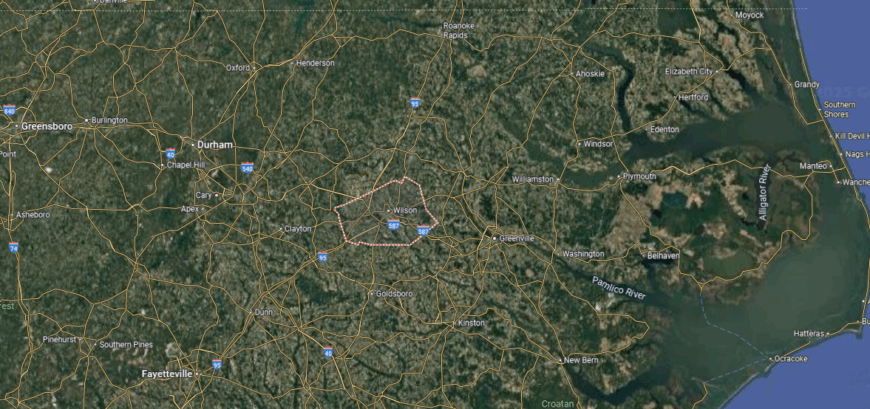
Wilson County lies in eastern North Carolina’s Coastal Plain, positioned east of Raleigh and west of Greenville. It is bordered by Nash County to the north and Wayne County to the south, with a landscape that transitions from gently rolling terrain to broad, flat farmland. The county stretches about 25 miles north to south and 20 miles east to west, forming part of the corridor that links the Triangle to the coastal plain.
Wilson, the county seat, sits near the center and anchors government, commerce, and culture. Other nearby towns include Lucama to the south, Elm City to the north, and Stantonsburg to the east. The county is shaped by agricultural lands, road networks such as U.S. Highway 264 and Interstate 95, and its proximity to the Tar River basin.
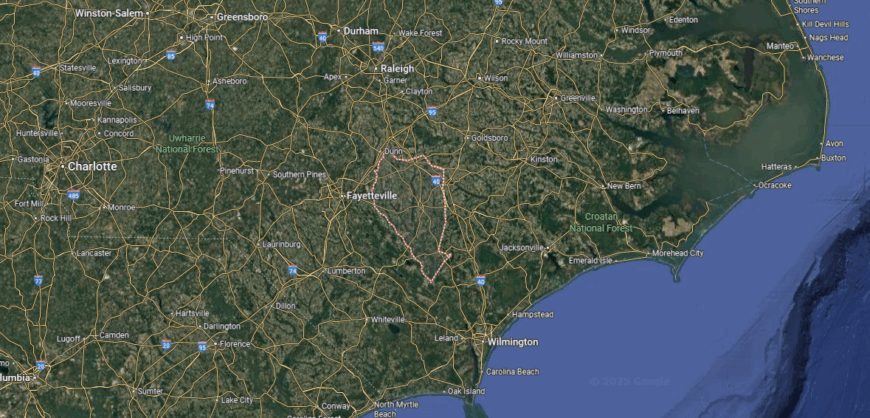
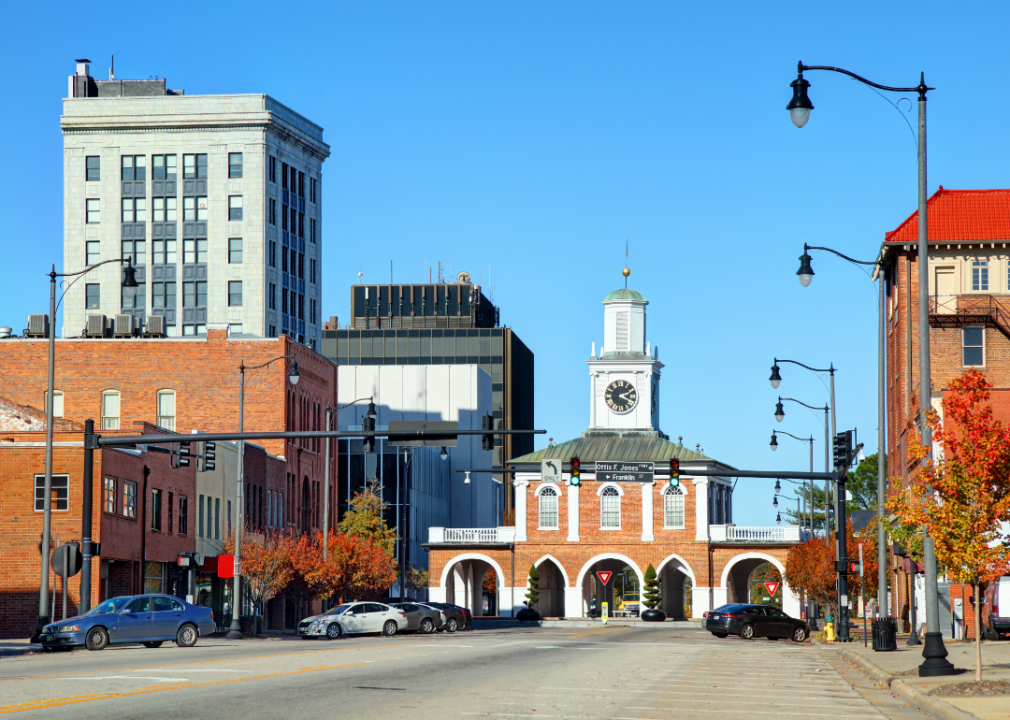
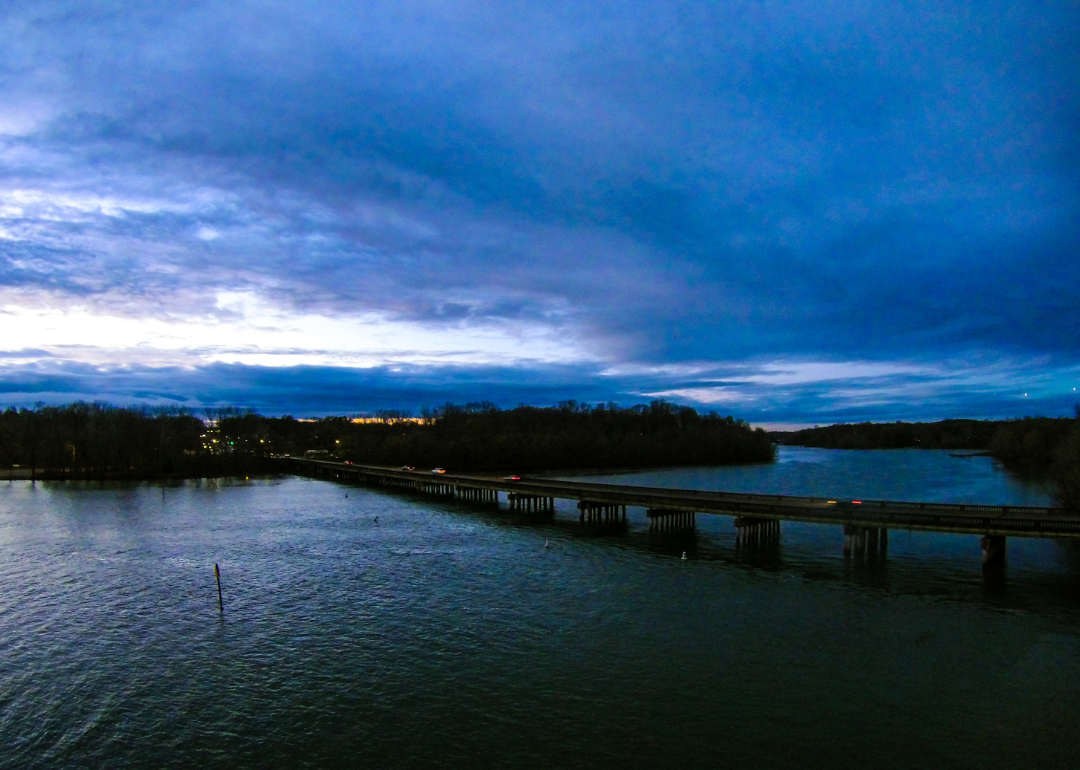
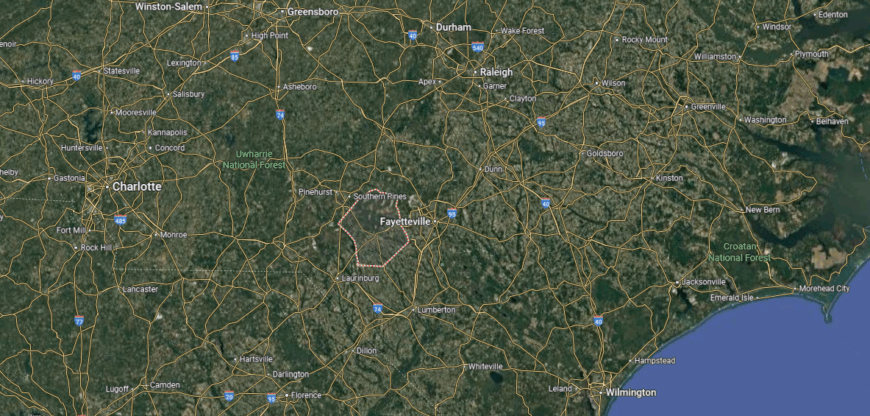
#28. Cumberland County (tie)
– Life expectancy: 73.9 years
— 2.7 years lower than the state average
About
Cumberland County lies in southeastern North Carolina, where the Cape Fear River flows through a region shaped by military, trade, and agriculture. Established in the 1700s, it grew as a crossroads of commerce and culture, later anchored by the presence of Fort Liberty (formerly Fort Bragg), one of the world’s largest military installations. Fayetteville, the county seat, reflects this layered history with its blend of historic districts, civic institutions, and modern growth.
Community life thrives through festivals, cultural events, and gatherings that honor both heritage and service. Families find connection in schools, churches, and recreational spaces that bridge the county’s rural and urban areas. Cumberland County endures as a place where history, military tradition, and community spirit continue to shape its distinct identity.
Where is Cumberland County?
Cumberland County sits in the southeastern part of North Carolina, bordered by Harnett County to the north and Robeson County to the south. It lies within the Sandhills region, an area of rolling terrain and pine forests. The county spans about 45 miles from north to south and 30 miles from east to west.
Fayetteville, the county seat, is located along the Cape Fear River near the center of the county. Other nearby towns include Hope Mills to the southwest, Spring Lake to the north, and Stedman to the east. The area is defined by Fort Liberty (formerly Fort Bragg), major river corridors, and its position as a transportation hub in southeastern North Carolina.
#27. Jones County (tie)
– Life expectancy: 73.9 years
— 2.7 years lower than the state average
About
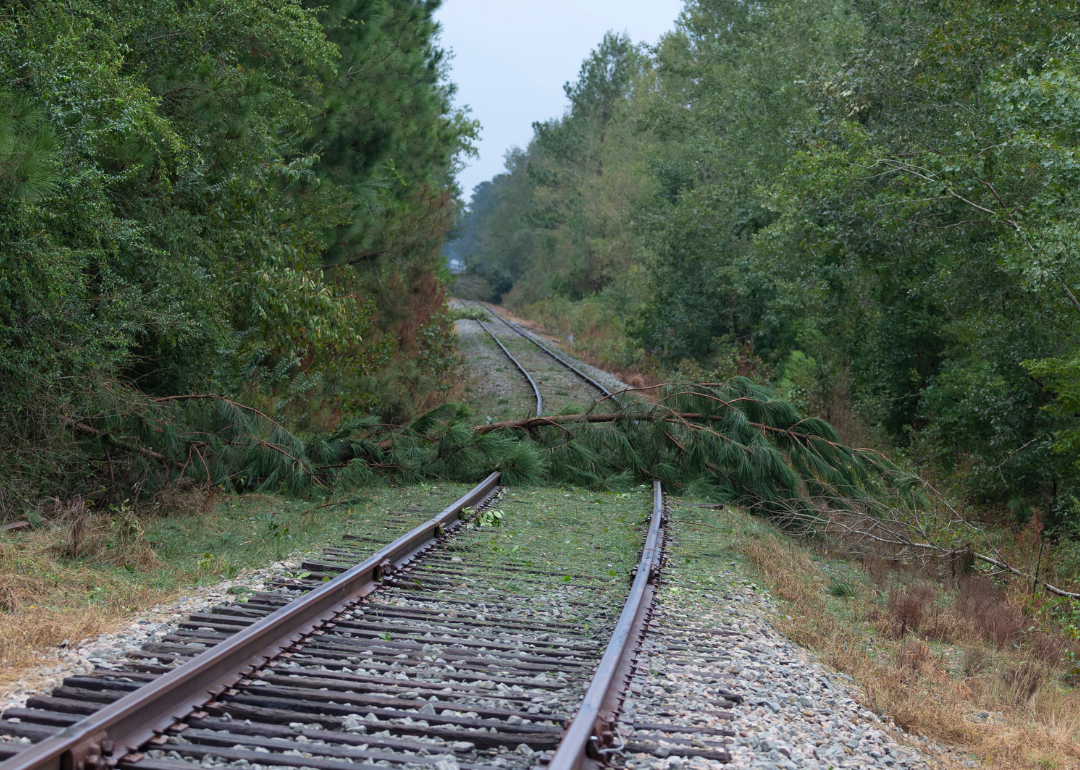
Jones County rests in eastern North Carolina, where wide stretches of farmland and forest meet the slow-moving waters of the Trent River. Its history is tied to agriculture and timber, industries that have long supported small towns and rural communities scattered across the landscape. The county’s quiet setting reflects a way of life built on resilience and a close relationship with the land.
Community ties are strengthened through school events, church gatherings, and seasonal traditions that bring neighbors together. Outdoor activities like hunting, fishing, and boating connect residents to the rivers and woodlands that surround them. Jones County remains a place where simplicity, heritage, and natural beauty guide the rhythm of daily life.
Where is Jones County?
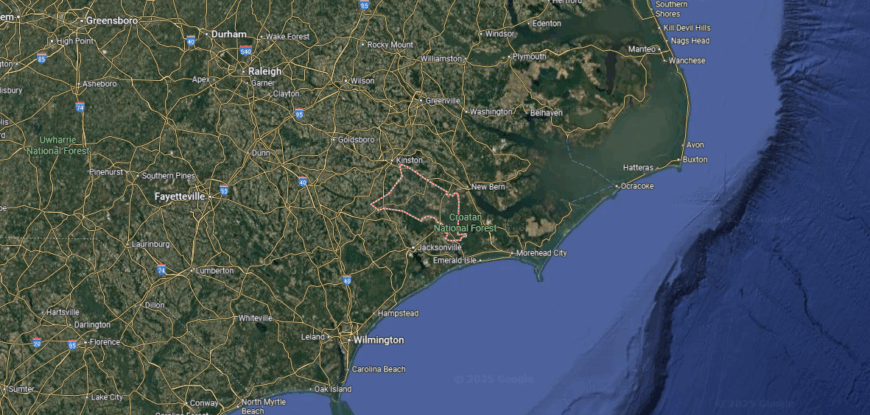
Jones County is located in eastern North Carolina, bordered by Craven County to the north and Onslow County to the south. It lies within the Coastal Plain region, where flat terrain and river basins shape the landscape. The county covers about 30 miles from north to south and 25 miles east to west.
Trenton, the county seat, is positioned near the geographic center along the Trent River. Other nearby communities include Pollocksville to the northeast and Maysville to the south. Much of the county is covered by Croatan National Forest, with the Trent and White Oak Rivers providing natural corridors through the area.
#26. Hoke County (tie)
– Life expectancy: 73.8 years
— 2.8 years lower than the state average
You may also like: The number of registered hunters in North Carolina
About
Hoke County lies in south-central North Carolina, where sandhills, longleaf pines, and open farmland give shape to its landscape. Formed in the early 20th century, it grew from a foundation of agriculture and textiles, later influenced by its proximity to Fort Liberty. Raeford, the county seat, developed into the heart of civic and community life, blending small-town traditions with steady growth.
Residents come together at cultural festivals, school events, and gatherings that highlight music, food, and local pride. Outdoor activities, from hunting and fishing to recreation on trails and fields, remain central to daily life. Hoke County carries forward a character rooted in resilience, rural heritage, and the shared strength of its community.
Where is Hoke County?
Hoke County is positioned in the south-central Sandhills of North Carolina, bordered by Moore County to the north and Robeson County to the south. It occupies a transitional landscape of sandy soils, pine forests, and small river valleys. The county stretches about 30 miles east to west and 25 miles north to south.
Raeford, the county seat, sits near the center and serves as the primary hub for government and commerce. Other nearby towns include Rockfish in the east, Dundarrach to the south, and Silver City near Raeford. The county is influenced by its proximity to Fort Liberty, as well as by natural features such as the Lumber River and Rockfish Creek.
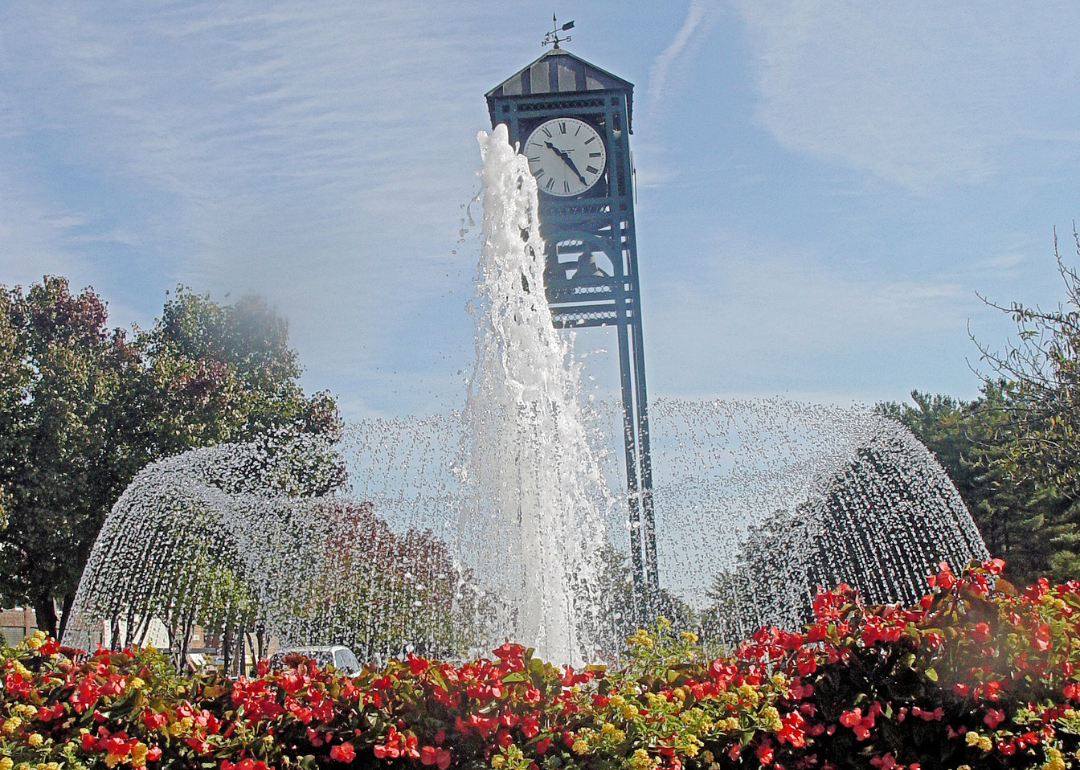
#25. Gaston County (tie)
– Life expectancy: 73.8 years
— 2.8 years lower than the state average
About
Gaston County sits in the Piedmont of North Carolina, where the Catawba River and rolling hills frame a region long shaped by industry. Textile mills once drove its economy, and their legacy remains visible in both architecture and community identity. Today, Gastonia and surrounding towns balance this industrial past with new growth in commerce, healthcare, and education.
Cultural life thrives through festivals, museums, and music traditions that reflect both heritage and progress. Crowders Mountain offers a natural landmark for hiking and outdoor recreation, connecting residents to the landscape. Gaston County continues to blend industry, history, and community spirit into a dynamic and enduring local character.
Where is Gaston County?
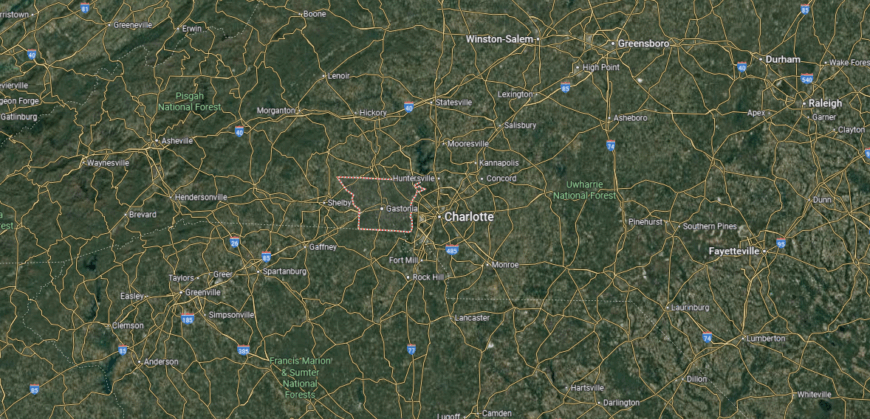
Gaston County is located in the south-central Piedmont of North Carolina, sharing its western border with Cleveland County and its eastern boundary with Mecklenburg County. The Catawba River forms much of the eastern edge, while Kings Mountain rises along the western side. The county extends about 28 miles east to west and 17 miles north to south.
Gastonia, the county seat, lies near the center and anchors the region’s industrial and commercial base. Other nearby towns include Belmont along the Catawba River, Mount Holly to the northeast, and Bessemer City toward the west. The county is shaped by Crowders Mountain State Park, Lake Wylie, and its proximity to the Charlotte metropolitan area.
#24. Randolph County
– Life expectancy: 73.7 years
— 2.9 years lower than the state average

About
Randolph County lies in the heart of North Carolina, where rolling Piedmont hills and winding rivers have long supported farms, mills, and small-town life. Its history is rooted in textile and furniture industries, alongside a strong tradition of craftsmanship and trade. Asheboro, the county seat, anchors civic and cultural life while also housing the North Carolina Zoo, a landmark that draws visitors from across the state.
Community spirit is reflected in festivals, arts, and gatherings that highlight local heritage and creativity. Residents find connection through schools, churches, and recreational spaces that bridge the county’s rural and urban areas. Randolph County remains a place where tradition and innovation meet, sustaining a character defined by resilience and pride in community.
Where is Randolph County?
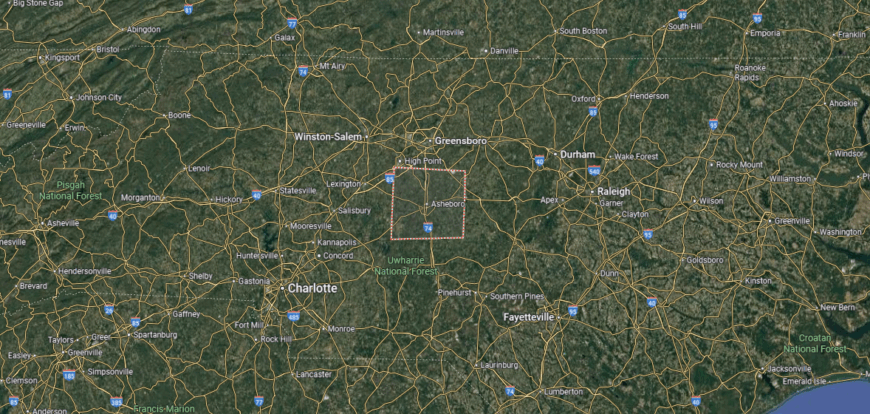
Randolph County lies in the central Piedmont of North Carolina, bordered by Guilford County to the north and Montgomery County to the south. The Uwharrie Mountains rise along its eastern side, while the Deep River cuts across its northern half. The county covers about 35 miles from north to south and 30 miles east to west.
Asheboro, the county seat, sits near the middle of the county and serves as a regional hub. Other nearby towns include Randleman to the north, Archdale along the northern border, and Trinity to the northwest. The county is home to the North Carolina Zoo, sections of the Uwharrie National Forest, and fertile river valleys.
#23. Rowan County (tie)
– Life expectancy: 73.6 years
— 3.0 years lower than the state average

About
Rowan County rests in North Carolina’s Piedmont, where the Yadkin River and fertile valleys supported early farming and trade. Established in the mid-1700s, it became one of the state’s original counties, carrying a legacy of colonial settlement and civic leadership. Salisbury, the county seat, grew into a cultural and economic hub, blending historic architecture with institutions that anchor regional life.
Residents celebrate their heritage through festivals, arts, and community events that highlight both tradition and creativity. Outdoor recreation on High Rock Lake and the county’s parks adds to the rhythm of local living. Rowan County continues to balance history and progress, offering a strong sense of place rooted in both past and present.
Where is Rowan County?
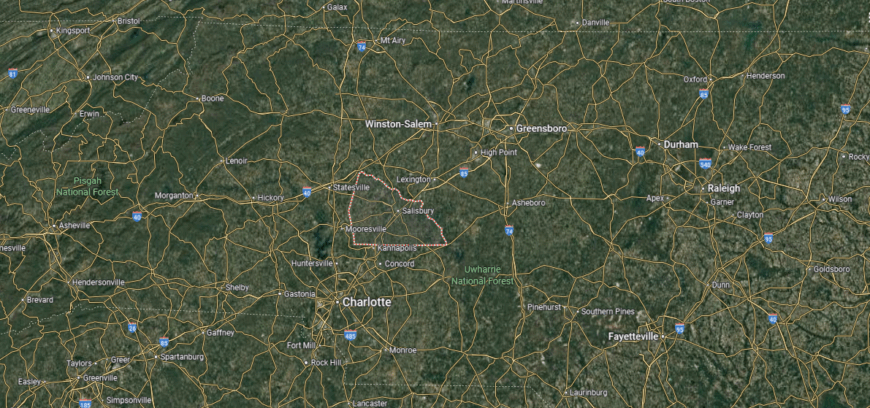
Rowan County is in the central Piedmont of North Carolina, bordered by Davie County to the north and Cabarrus County to the south. The Yadkin River forms much of its eastern boundary, while the South Yadkin River flows through the northern section. The county stretches about 35 miles from north to south and 30 miles east to west.
Salisbury, the county seat, lies near the center and serves as a historic crossroads of the region. Other towns include China Grove to the south, Spencer to the north, and Rockwell to the east. The area features High Rock Lake, major rail corridors, and a location along Interstate 85 connecting Charlotte and the Piedmont Triad.
#22. Wayne County (tie)
– Life expectancy: 73.6 years
— 3.0 years lower than the state average
About
Wayne County lies in eastern North Carolina, where flat farmland and the Neuse River shape its landscape. Established in the 1700s, it developed through agriculture and trade, later becoming known for its connection to Seymour Johnson Air Force Base, a key presence in the county. Goldsboro, the county seat, serves as the cultural and economic center, tying together rural communities and modern growth.
Life here blends tradition with service, as residents gather for festivals, civic events, and celebrations that honor both heritage and military pride. Outdoor recreation on rivers, parks, and trails complements a calendar of community activities. Wayne County reflects a character defined by resilience, connection to the land, and a strong sense of duty.
Where is Wayne County?
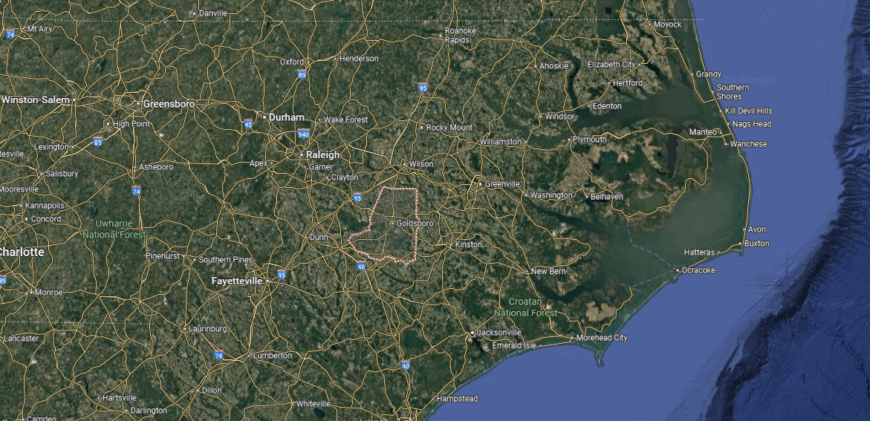
Wayne County is located in eastern North Carolina, bordered by Wilson County to the north and Duplin County to the south. It sits within the Coastal Plain, where flat farmland and river valleys dominate the landscape. The county measures about 30 miles from north to south and 35 miles east to west.
Goldsboro, the county seat, rests along the Neuse River near the center of the county. Other nearby communities include Mount Olive to the south, Fremont to the north, and Pikeville just above Goldsboro. The county is defined by its agricultural lands, Seymour Johnson Air Force Base, and its position along U.S. Highway 70 linking Raleigh and the coast.
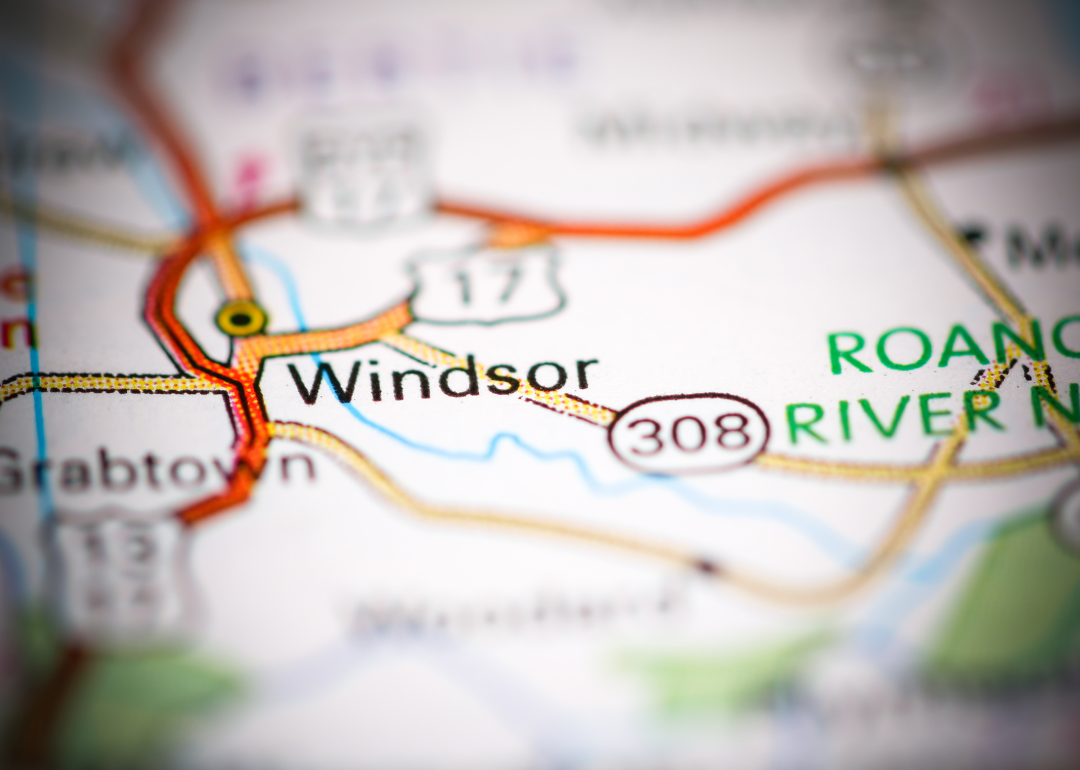
#21. Bertie County
– Life expectancy: 73.5 years
— 3.1 years lower than the state average
You may also like: Best public colleges in North Carolina
About
Bertie County stretches across northeastern North Carolina, where wide fields, cypress swamps, and the Roanoke and Chowan Rivers shape its geography. Established in the early 1700s, it carries a long agricultural history rooted in tobacco, corn, and timber, while its river towns reflect the county’s role in trade and settlement. Rural landscapes and historic structures still speak to centuries of community life tied to the land and water.
Residents gather for church events, school traditions, and local festivals that preserve a sense of continuity across generations. Outdoor pursuits like fishing, boating, and hunting remain central to daily rhythms, connecting people closely to the rivers and forests. Bertie County endures as a place where heritage, nature, and community remain deeply intertwined.
Where is Bertie County?

Bertie County is located in northeastern North Carolina, bordered by Hertford County to the north and Martin County to the south. The Roanoke River forms its northern boundary, while the Chowan River outlines much of its eastern edge. The county spans roughly 35 miles from north to south and 40 miles east to west.
Windsor, the county seat, lies near the center along the Cashie River. Other nearby communities include Colerain to the northeast, Aulander to the west, and Powellsville in the north. The county is marked by fertile river valleys, expansive farmland, and easy access to the Albemarle Sound.
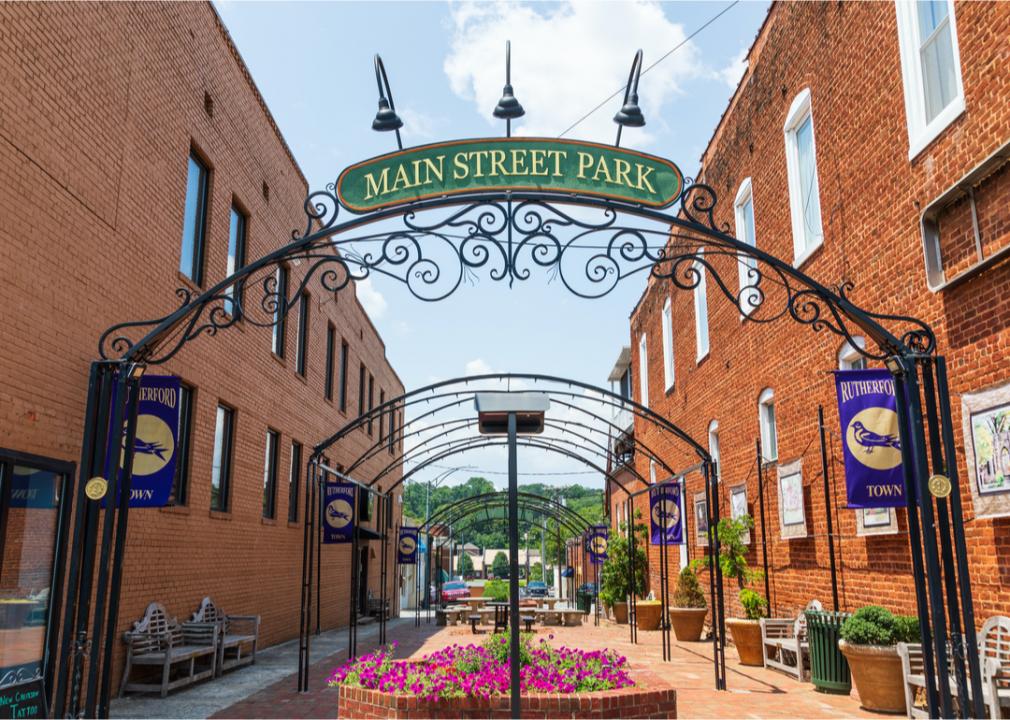
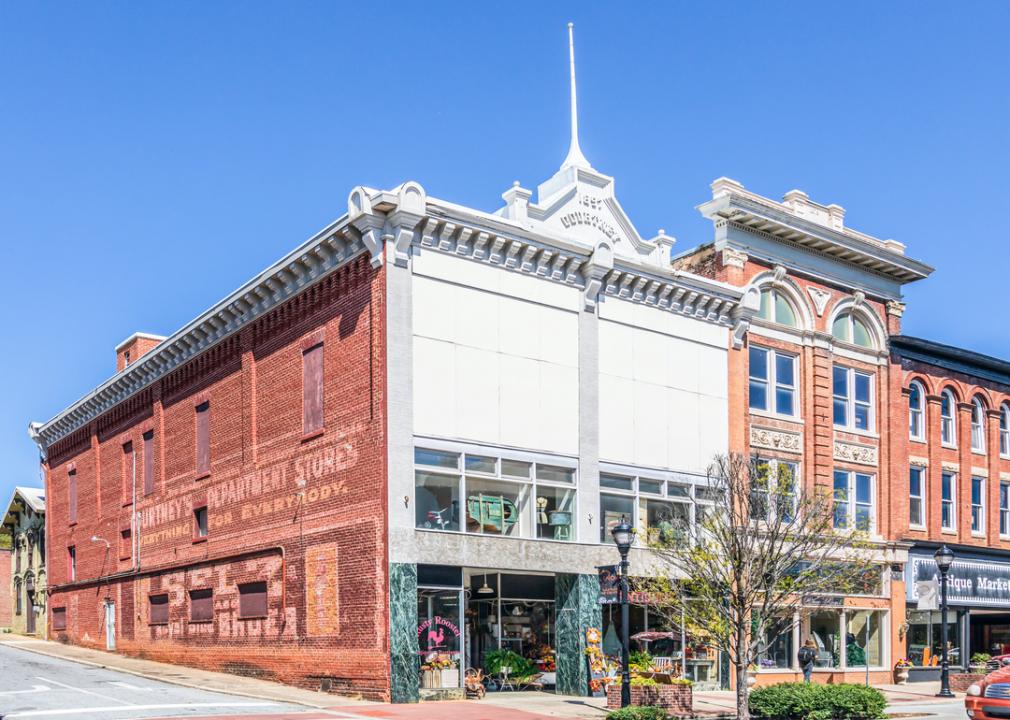
#20. Rutherford County (tie)
– Life expectancy: 73.4 years
— 3.2 years lower than the state average
About
Rutherford County lies in the foothills of western North Carolina, where rolling mountains and valleys have long shaped its communities. Founded in the late 18th century, it grew from frontier settlements into a region supported by farming, mining, and textile production. Towns like Rutherfordton and Forest City carry forward this legacy, blending historic charm with centers of commerce and culture.
Community life is strengthened through festivals, local arts, and gatherings that celebrate both heritage and creativity. Outdoor recreation on trails, rivers, and nearby Chimney Rock adds to the rhythm of living in the foothills. Rutherford County reflects a balance of history, natural beauty, and civic pride that continues to define its identity.
Where is Rutherford County?
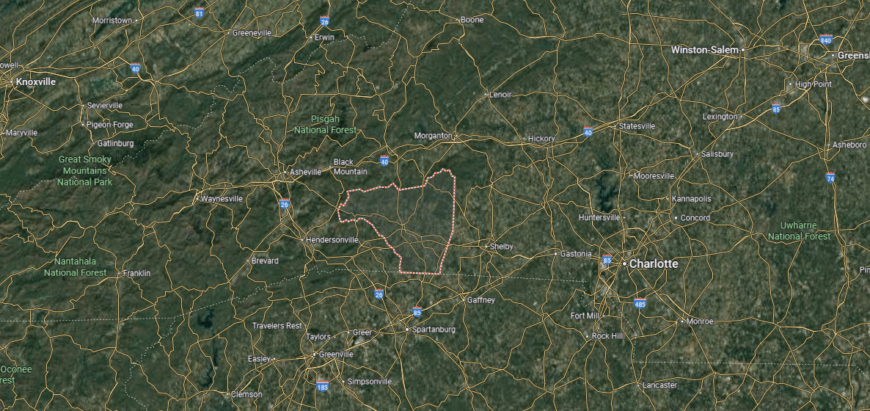
Rutherford County is set in the foothills of western North Carolina, bordered by McDowell County to the north and Cleveland County to the east. It extends to the South Carolina state line, combining rolling hills with sections of the Blue Ridge escarpment. The county stretches about 35 miles east to west and 25 miles north to south.
Rutherfordton, the county seat, is positioned near the center along U.S. Highway 74. Other towns include Forest City to the southeast, Spindale adjacent to it, and Lake Lure in the northern corner. The county is shaped by the Broad River, Chimney Rock State Park, and its location at the edge of the Blue Ridge Mountains.
#19. Caldwell County (tie)
– Life expectancy: 73.4 years
— 3.2 years lower than the state average
About
Caldwell County rests in the foothills of the Blue Ridge Mountains, where rugged peaks give way to valleys and river plains. Its history is tied to timber, furniture, and textile industries, which shaped the county’s economy and identity for generations. Lenoir, the county seat, developed as a hub of commerce and culture, anchoring smaller towns and rural communities across the region.
Residents take pride in traditions carried through music, festivals, and gatherings that honor both craft and heritage. Outdoor life is equally central, with access to the mountains, rivers, and trails offering recreation year-round. Caldwell County remains a place where industry, culture, and natural beauty blend into a lasting sense of community.
Where is Caldwell County?
Caldwell County is located in the foothills of western North Carolina, bordered by Watauga County to the north and Burke County to the south. The Blue Ridge Mountains rise along its northern edge, while the Yadkin Valley stretches across its southern half. The county spans about 35 miles from north to south and 25 miles east to west.
Lenoir, the county seat, lies near the center and serves as the hub for government and commerce. Other communities include Granite Falls to the south, Hudson in the central corridor, and Blowing Rock along the northern border. The area is marked by mountain ridges, sections of Pisgah National Forest, and access to the Blue Ridge Parkway.
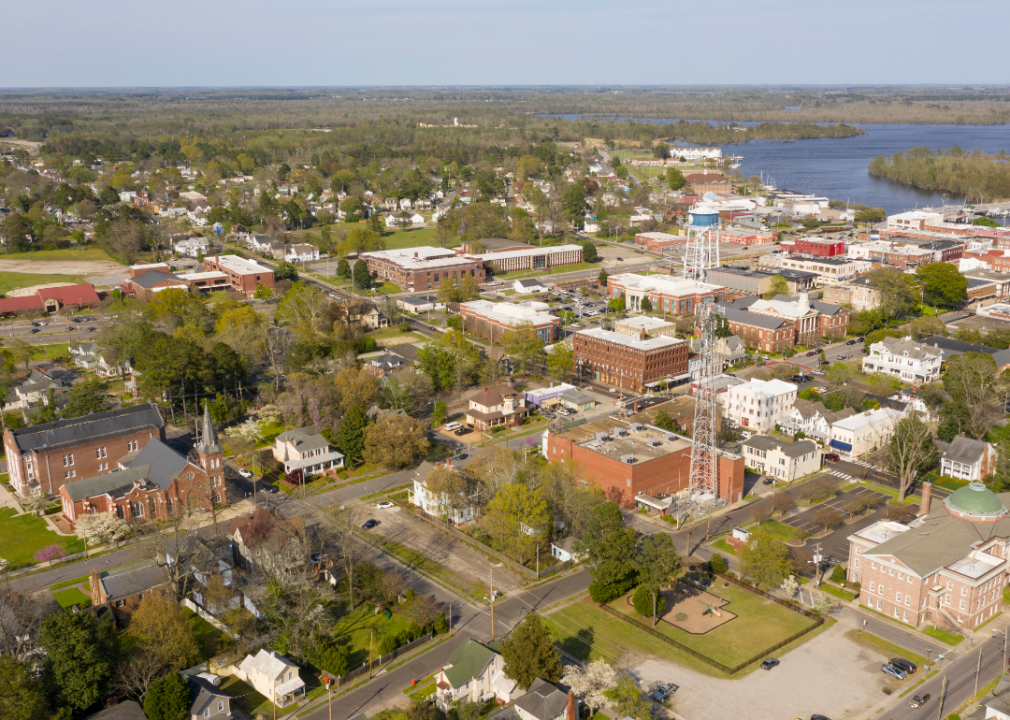
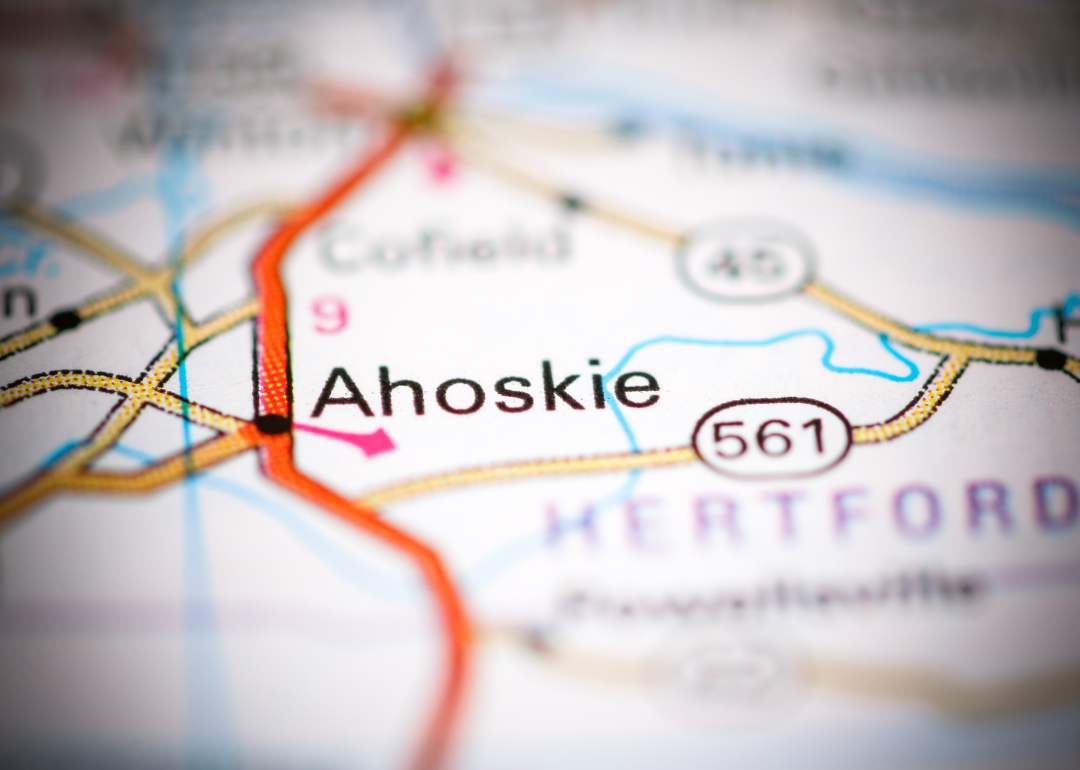
#18. Hertford County
– Life expectancy: 73.3 years
— 3.3 years lower than the state average
About
Hertford County lies in northeastern North Carolina, where the Chowan and Meherrin Rivers shape a landscape of fertile farmland and wooded lowlands. Established in the mid-1700s, its history is tied to agriculture, trade along the waterways, and small towns that developed as centers of local life. The county seat of Winton reflects this heritage, serving as a civic and cultural anchor for the surrounding communities.
Today, residents maintain traditions through festivals, school events, and church-centered gatherings that strengthen community bonds. Outdoor activities like fishing, hunting, and boating continue to connect people to the rivers and forests around them. Hertford County endures as a place where heritage, land, and community remain deeply intertwined.
Where is Hertford County?
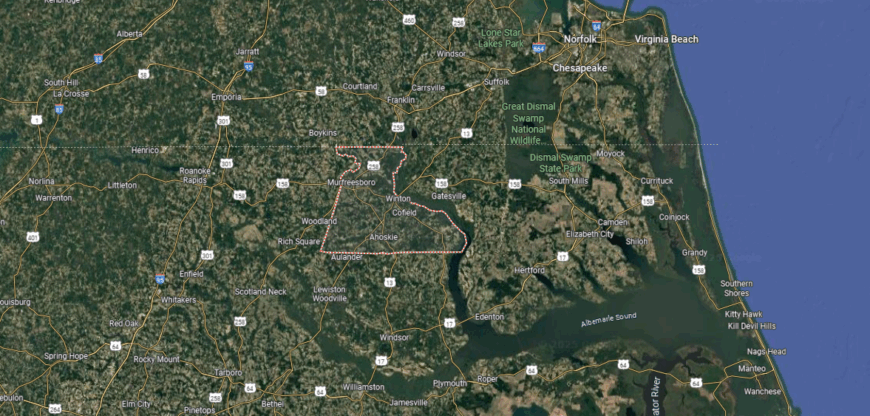
Hertford County is positioned in northeastern North Carolina along the Virginia border. It is bordered by Gates County to the east and Northampton County to the west, with the Chowan and Meherrin Rivers shaping much of its landscape. The county measures about 25 miles from north to south and 30 miles east to west.
Winton, the county seat, is located along the Chowan River near the county’s center. Other nearby towns include Ahoskie to the south, Murfreesboro to the west, and Cofield to the southeast. The county is defined by its river systems, fertile farmland, and its role as part of the Roanoke-Chowan region.
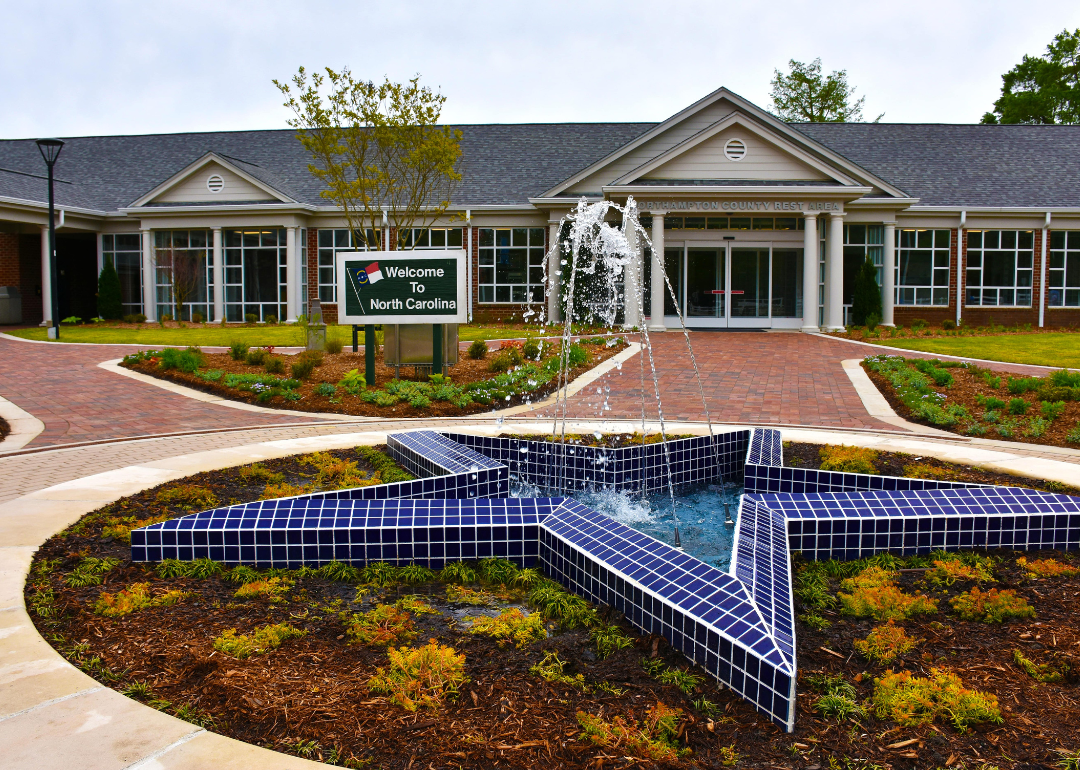
#17. Northampton County
– Life expectancy: 73.2 years
— 3.4 years lower than the state average
About
Northampton County rests along North Carolina’s northeastern border, where the Roanoke River and flat coastal plains have long supported farming and trade. Established in the mid-1700s, its history is closely tied to agriculture—especially cotton, peanuts, and timber—that shaped both its economy and way of life. Courthouse towns and crossroads communities reflect a rural character that has endured across generations.
Life here often centers on church gatherings, school traditions, and seasonal festivals that bring neighbors together. Hunting, fishing, and outdoor recreation along the river continue to connect residents to the land. Northampton County remains defined by its agricultural roots, steady pace of living, and strong sense of community.
Where is Northampton County?
Northampton County is located in northeastern North Carolina along the Virginia border. It is bordered by Halifax County to the south and Hertford County to the east, with the Roanoke River forming much of its western edge. The county covers about 35 miles from north to south and 30 miles east to west.
Jackson, the county seat, lies near the center and serves as the administrative hub. Other nearby communities include Rich Square in the north, Conway to the east, and Gaston near the Roanoke River. The county is shaped by fertile farmland, river valleys, and its place within the Roanoke River basin.
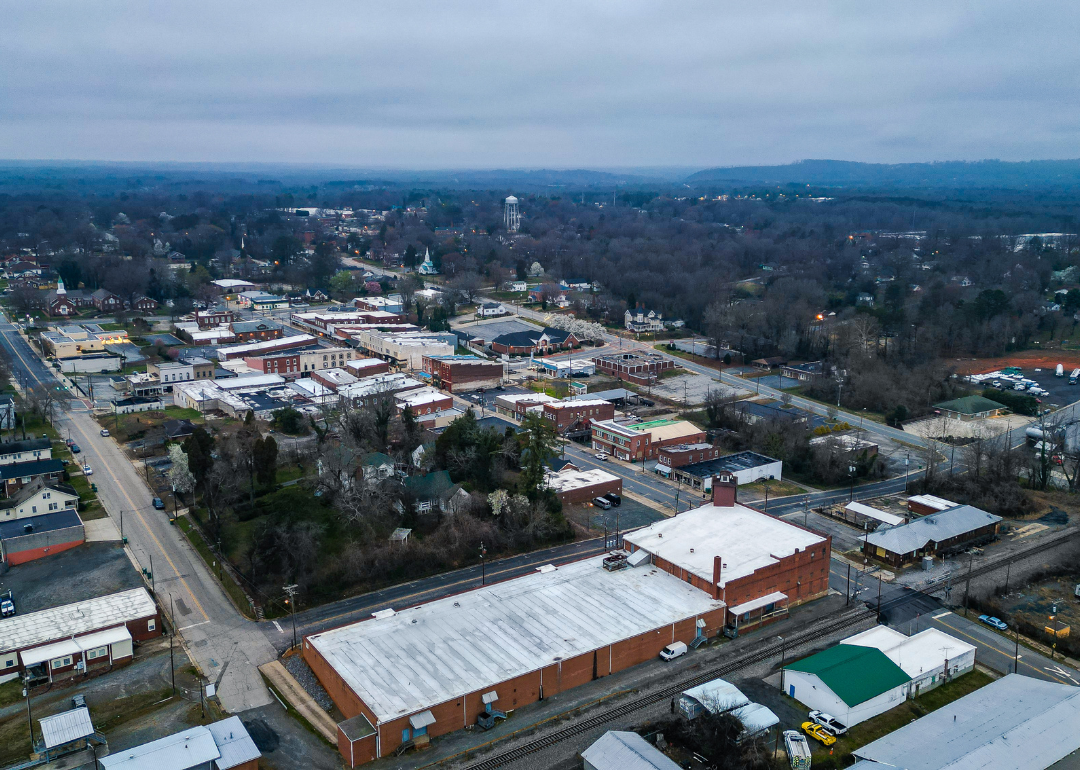
#16. Montgomery County
– Life expectancy: 73.1 years
— 3.5 years lower than the state average
You may also like: Highest-rated breweries in North Carolina
About
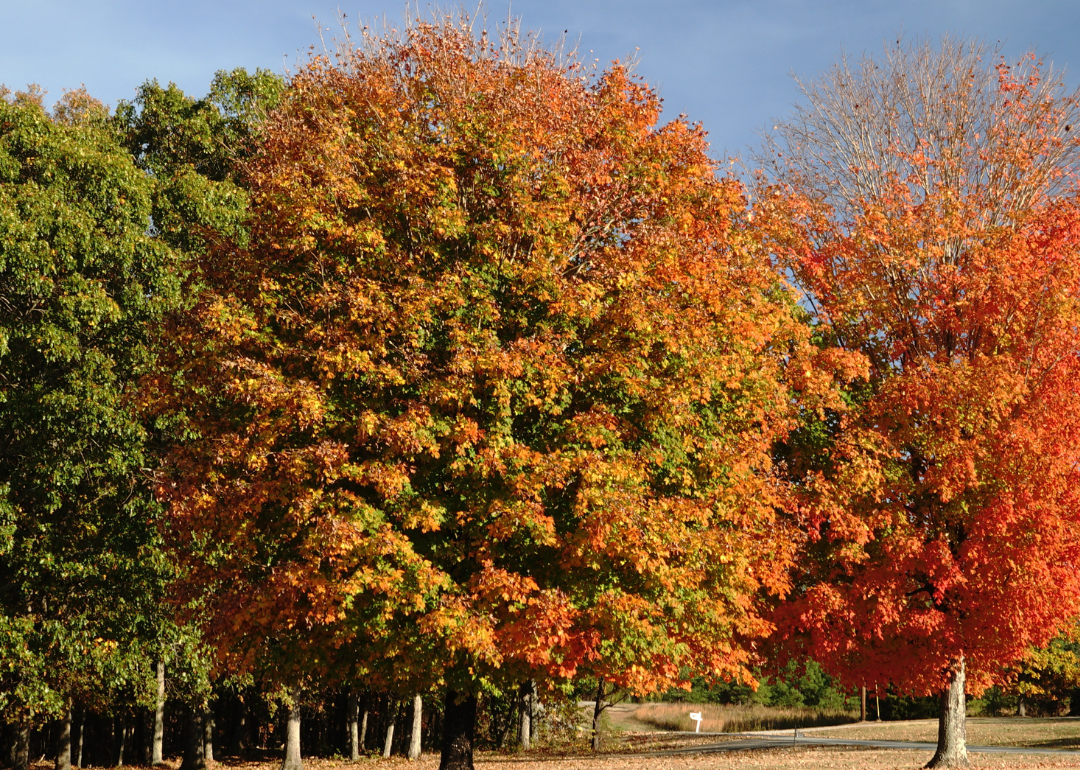
Montgomery County lies in central North Carolina, where the Uwharrie Mountains rise above forests, rivers, and rolling farmland. Its history reaches back to early Native American presence and pioneer settlements, later sustained by farming, timber, and small industry. The county’s rugged terrain and natural resources have long shaped both its economy and its independent character.
Community life is enriched by traditions that blend heritage with outdoor living. Residents gather for festivals, school events, and local gatherings, while the Uwharrie National Forest offers hiking, camping, and recreation that tie people closely to the land. Montgomery County endures as a place where history, nature, and community remain firmly rooted together.
Where is Montgomery County?
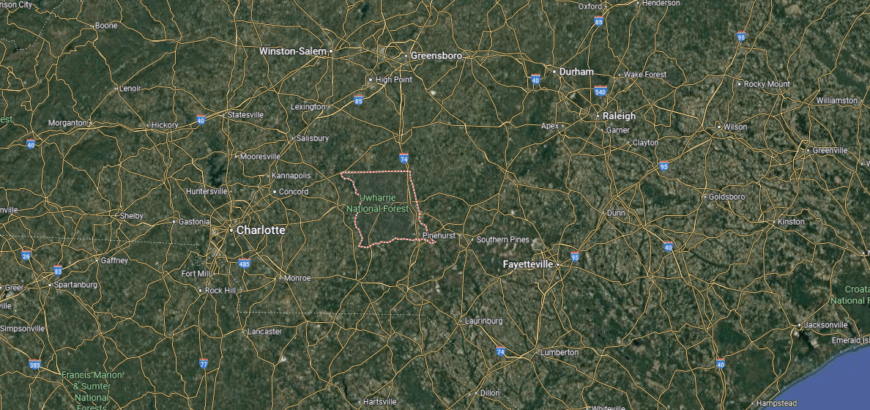
Montgomery County is situated in the central part of North Carolina, bordered by Randolph County to the north and Stanly County to the south. It lies in the Uwharrie Mountains, giving the area a rugged terrain that contrasts with the surrounding Piedmont. The county stretches about 30 miles east to west and 25 miles north to south.
Troy, the county seat, is located near the center of Montgomery County. Other nearby communities include Mount Gilead to the south, Biscoe along the eastern side, and Star to the north. The county is known for Uwharrie National Forest, Badin Lake, and its role as a gateway between the Piedmont and Sandhills.
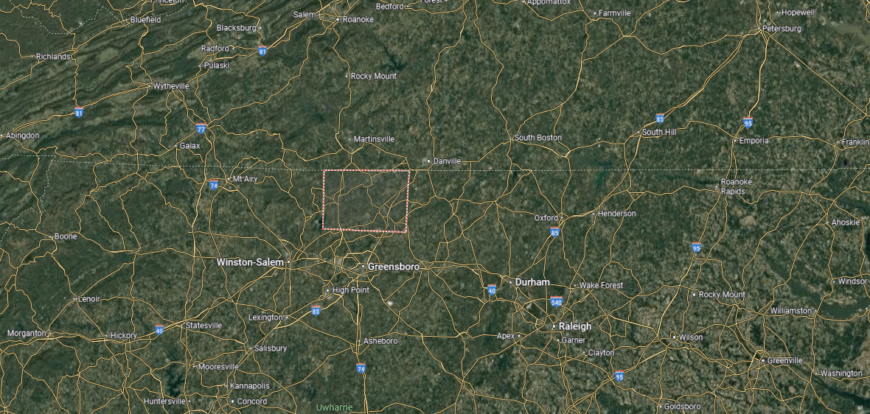
#15. Rockingham County (tie)
– Life expectancy: 72.7 years
— 3.9 years lower than the state average
About
Rockingham County sits along North Carolina’s northern border, where the Dan and Mayo Rivers wind through rolling hills and farmland. Established in the late 1700s, it built its foundation on tobacco, textiles, and furniture, industries that left a lasting mark on both economy and culture. Small towns and mill villages grew into community centers that still reflect the county’s working heritage.
Today, life here blends tradition with recreation, as residents gather for festivals, music, and local sporting events. Outdoor activities on rivers, lakes, and trails provide connections to the landscape that shapes daily living. Rockingham County carries forward a character defined by resilience, rural pride, and a strong sense of community.
Where is Rockingham County?
Rockingham County is located in the north-central Piedmont of North Carolina along the Virginia border. It is framed by Caswell County to the east and Stokes County to the west, with the Dan and Smith Rivers flowing through its landscape. The county stretches about 30 miles from east to west and 25 miles north to south.
Wentworth, the county seat, is positioned near the geographic center. Other nearby towns include Reidsville to the southeast, Eden near the Virginia line, and Madison in the west. The area is shaped by river valleys, rolling farmland, and natural corridors that connect the Piedmont to southern Virginia.
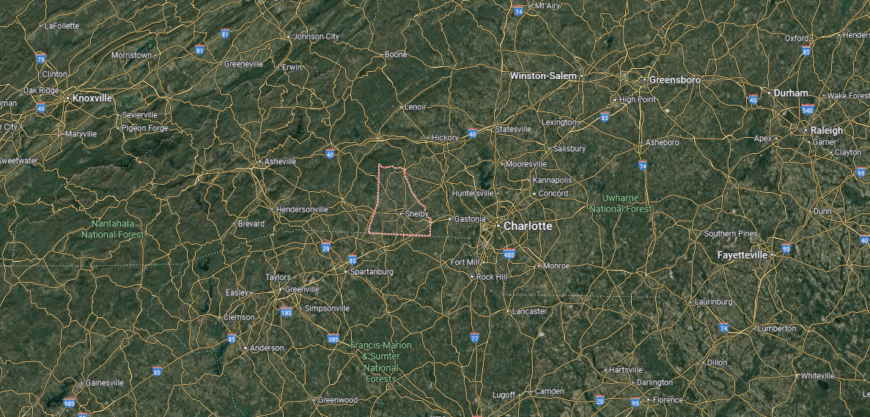
#14. Cleveland County (tie)
– Life expectancy: 72.7 years
— 3.9 years lower than the state average

About
Cleveland County rests in southwestern North Carolina, where rolling Piedmont hills stretch toward the South Carolina line. Formed in the mid-19th century, it grew from an agricultural base of cotton and corn into a region shaped by textiles, industry, and trade. Shelby, the county seat, became a cultural anchor, known for its courthouse square, music heritage, and civic life.
Residents keep traditions alive through festivals, church events, and gatherings that highlight food, music, and local pride. Outdoor recreation on lakes, parks, and trails adds to the county’s rhythm, connecting people with the land around them. Cleveland County stands as a community grounded in heritage, resilience, and a balance of progress with small-town spirit.
Where is Cleveland County?
Cleveland County lies in the southwestern Piedmont of North Carolina along the South Carolina border. It is framed by Rutherford County to the north and Gaston County to the east, with the Broad River running through its western half. The county covers roughly 35 miles north to south and 25 miles east to west, creating a broad mix of farmland, small towns, and low rolling hills.
Shelby, the county seat, sits near the center and serves as the cultural and economic hub. Other communities include Kings Mountain on the eastern side, Boiling Springs near the southern edge, and Lawndale toward the north. The county landscape blends Piedmont farmland with nearby ridges connected to Kings Mountain, tying the region geographically to both the Charlotte area and the Upstate of South Carolina.
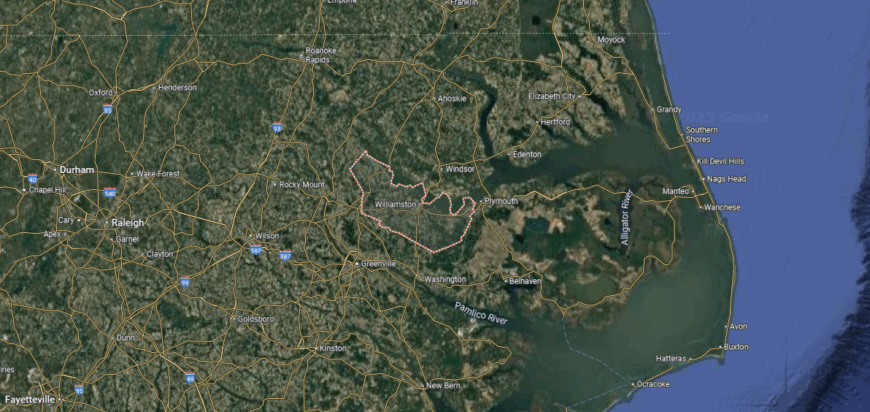
#13. Martin County
– Life expectancy: 72.4 years
— 4.2 years lower than the state average
About
Martin County lies in eastern North Carolina’s Coastal Plain, where farmland, pine forests, and the Roanoke River define its setting. Established in the 18th century, its history is rooted in agriculture, with tobacco, cotton, and later diversified crops shaping the economy. Small towns like Williamston reflect this legacy, serving as centers of trade, culture, and community life.
Residents gather for local festivals, school events, and traditions that celebrate both heritage and rural pride. Outdoor recreation along the river, hunting grounds, and open fields connects people to the land in enduring ways. Martin County remains a place where agricultural roots and close community ties continue to shape its identity.
Where is Martin County?
Martin County is located in eastern North Carolina within the Coastal Plain, bordered by Halifax County to the northwest and Washington County to the east. The Roanoke River forms much of its northern boundary, while flat farmland and woodlands stretch across the interior. The county spans roughly 30 miles from north to south and 25 miles east to west.
Williamston, the county seat, sits along the Roanoke River near the center. Other nearby towns include Robersonville to the west, Jamesville to the east, and Hamilton to the north. The county is defined by its agricultural base, river valleys, and proximity to the Albemarle Sound region.
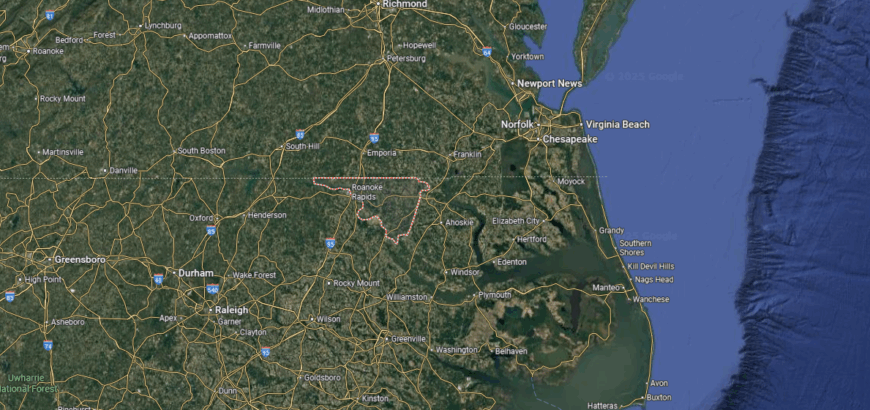
#12. Vance County
– Life expectancy: 71.9 years
— 4.7 years lower than the state average
About
Vance County rests in North Carolina’s northern Piedmont, where farmland and small towns grew around rail lines and trade routes. Formed in the late 1800s, it developed a strong agricultural base, later expanding into textiles and manufacturing that supported its communities for generations. Henderson, the county seat, serves as the cultural and economic center, blending historic neighborhoods with modern growth.
Life here is marked by festivals, school events, and gatherings that highlight both tradition and civic pride. Kerr Lake provides opportunities for boating, fishing, and recreation, offering a natural anchor to community life. Vance County reflects a character rooted in resilience, local heritage, and the steady rhythm of small-town living.
Where is Vance County?
Vance County is located in north-central North Carolina along the Virginia border. It is bordered by Warren County to the east and Granville County to the west, with rolling Piedmont terrain shaping its farmland and wooded areas. The county measures about 20 miles from north to south and 25 miles east to west, forming part of the corridor between the Research Triangle and southern Virginia.
Henderson, the county seat, is positioned near the center and anchors the region’s civic and economic life. Other nearby towns include Kittrell to the south and Middleburg toward the north. The county is strongly defined by Kerr Lake, which forms much of its northern boundary, and by Interstate 85, which links Henderson to Durham in the south and Petersburg, Virginia, to the north—a key gateway toward Richmond.
#11. Anson County
– Life expectancy: 71.8 years
— 4.8 years lower than the state average
You may also like: Highest-rated free things to do in North Carolina, according to Tripadvisor
About
Anson County lies in south-central North Carolina, where open farmland, pine woods, and the Pee Dee River shape its landscape. Established in the 1700s, it has long relied on agriculture, particularly cotton and livestock, while also carrying forward traditions of milling and trade. Small towns and rural crossroads reflect a heritage rooted in both the land and early frontier life.
Community bonds remain strong through church gatherings, school events, and local festivals that honor food, music, and history. Outdoor recreation along the river and fields continues to connect residents to their environment. Anson County endures as a place where heritage, resilience, and rural identity remain central to daily living.
Where is Anson County?
Anson County is situated in south-central North Carolina along the South Carolina border. It is bordered by Union County to the west and Richmond County to the east, with the Pee Dee River forming much of its eastern boundary. The county stretches about 35 miles north to south and 30 miles east to west.
Wadesboro, the county seat, is positioned near the center along U.S. Highway 74. Other communities include Polkton to the west, Morven to the southeast, and Lilesville near the Pee Dee River. The area is shaped by river valleys, rolling farmland, and its connections to both the Piedmont region of North Carolina and the Midlands of South Carolina.
#10. Lenoir County (tie)
– Life expectancy: 71.7 years
— 4.9 years lower than the state average
About
Lenoir County rests in eastern North Carolina’s Coastal Plain, where the Neuse River winds through farmland and small towns. Established in the 1700s, it grew from an agricultural base into a region known for tobacco, textiles, and trade. Kinston, the county seat, reflects this legacy with historic districts, cultural landmarks, and a continuing role as the county’s civic center.
Life here is marked by festivals, music, and food traditions that bring residents together across generations. Outdoor recreation on the river, parks, and fields adds to the rhythm of community life. Lenoir County continues to balance heritage with growth, offering a strong sense of identity rooted in both land and tradition.
Where is Lenoir County?
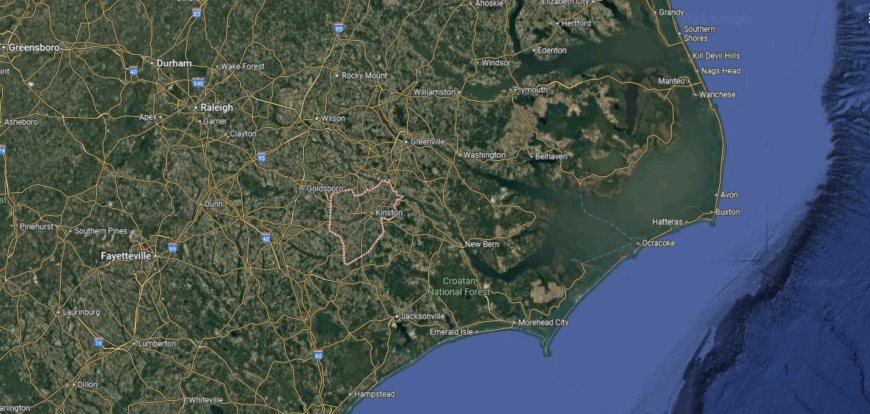
Lenoir County is located in eastern North Carolina within the Coastal Plain, bordered by Greene County to the north and Jones County to the south. The Neuse River flows through the center, shaping its farmland and low-lying terrain. The county measures about 30 miles from north to south and 25 miles east to west.
Kinston, the county seat, sits along the Neuse River and serves as the county’s largest community. Other nearby towns include La Grange to the northwest, Pink Hill to the south, and Deep Run toward the southeast. The county is defined by river valleys, agricultural lands, and transportation links connecting it to Goldsboro and New Bern.
#9. Bladen County (tie)
– Life expectancy: 71.7 years
— 4.9 years lower than the state average
About
Bladen County, often called the “Mother County” of North Carolina, spans the southeastern Coastal Plain with wide fields, pine forests, and numerous waterways. Established in the 1700s, it originally encompassed much of the state, and its history is tied to agriculture, lumber, and the steady work of rural communities. The Cape Fear River runs through its heart, shaping both settlement and commerce for generations.
Today, life here flows with traditions rooted in farming, church gatherings, and seasonal festivals. Bladen Lakes State Forest and Jones Lake State Park provide spaces for outdoor recreation, connecting residents to the natural landscape. Bladen County endures as a place where deep history, land, and community remain closely interwoven.
Where is Bladen County?
Bladen County is located in southeastern North Carolina, bordered by Cumberland County to the north and Columbus County to the south. It is the largest county in the state by land area, covering extensive farmland, forests, and river basins. The Cape Fear River runs along its western side, while the county itself measures about 50 miles from north to south and 35 miles east to west.
Elizabethtown, the county seat, lies near the center along the Cape Fear River. Other nearby towns include Bladenboro to the southwest, Dublin to the west, and White Lake to the east. The county is noted for its natural features, including the Carolina Bays, White Lake, and large tracts of Bladen Lakes State Forest.
#8. Washington County
– Life expectancy: 71.5 years
— 5.1 years lower than the state average
About
Washington County rests in northeastern North Carolina, bordered by the Albemarle Sound and the waters of the Roanoke River. Established in the late 1700s, its history is tied to agriculture, river trade, and the Civil War, with Plymouth standing as the county seat and historic heart. The landscape of fertile fields, swamps, and waterways continues to shape both economy and daily life.
Community traditions carry on through local festivals, church gatherings, and school-centered events that reinforce close ties. Outdoor life—whether fishing, hunting, or exploring the nearby refuges and lakes—remains central to the county’s rhythm. Washington County stands as a place where history, land, and water come together to define its enduring identity.
Where is Washington County?
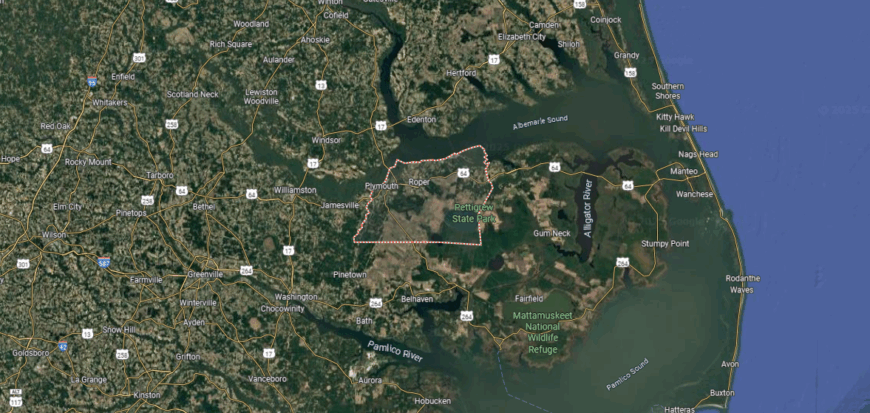
Washington County is located in eastern North Carolina, bordered by Bertie County to the north and Tyrrell County to the east. It sits within the Coastal Plain, with the Roanoke River forming much of its northern boundary and Albemarle Sound stretching along its northeastern edge. The county spans about 25 miles north to south and 30 miles east to west.
Plymouth, the county seat, is situated near the mouth of the Roanoke River where it meets the sound. Other communities include Roper to the east and Creswell near the county’s northern corner. The area is defined by riverfront landscapes, wetlands, and its proximity to the coastal waters of Albemarle Sound.
#7. Edgecombe County (tie)
– Life expectancy: 71.2 years
— 5.4 years lower than the state average

Edgecombe County lies in eastern North Carolina, where the Tar River winds through farmland, forests, and small towns. Established in the 1700s, it built its foundation on tobacco, cotton, and trade, with Tarboro emerging as a historic hub of culture and civic life. The county’s rural character remains strong, shaped by both agricultural traditions and deep community roots.
Residents come together through festivals, church gatherings, and school events that highlight pride in local heritage. Outdoor recreation on the river and open countryside adds to the county’s steady rhythm of living. Edgecombe County endures as a place where history, land, and community remain closely bound.
Where is Edgecombe County?
Edgecombe County is positioned in eastern North Carolina within the Coastal Plain, bordered by Halifax County to the north and Wilson County to the west. The Tar River flows through the county, shaping both its farmland and river valleys. It spans about 30 miles from north to south and 25 miles east to west.
Tarboro, the county seat, lies along the Tar River near the center of the county. Other nearby towns include Pinetops to the south, Princeville adjacent to Tarboro, and Macclesfield to the southwest. The area is characterized by fertile soils, flat terrain, and its location within the Tar-Pamlico River Basin.
#6. Halifax County (tie)
– Life expectancy: 71.2 years
— 5.4 years lower than the state average
You may also like: States sending the most people to North Carolina
About
Halifax County rests in northeastern North Carolina, where the Roanoke River and rolling farmland have long shaped its identity. Established in the 1700s, it played a key role in early state history, with the Halifax Resolves marking a step toward American independence. The county’s towns and rural communities reflect a heritage built on farming, trade, and civic tradition.
Community life thrives through festivals, historic commemorations, and gatherings that honor both culture and history. Residents connect through schools, churches, and outdoor activities along the river and countryside. Halifax County endures as a place where deep history and rural strength continue to guide its character.
Where is Halifax County?
Halifax County is located in northeastern North Carolina, bordered by Northampton County to the north and Edgecombe County to the south. The Roanoke River flows through its northern section, while the Tar River basin shapes parts of the south. The county stretches about 35 miles from north to south and 40 miles east to west.
Halifax, the county seat, sits near the Roanoke River and holds historical significance as an early political center. Other communities include Roanoke Rapids to the north, Scotland Neck to the east, and Enfield in the south. The area is defined by fertile farmland, river systems, and transportation routes linking it to both Virginia and central North Carolina.
#5. Scotland County
– Life expectancy: 71.0 years
— 5.6 years lower than the state average
About
Scotland County lies in the Sandhills of southern North Carolina, where longleaf pines and open farmland frame its landscape. Formed in the late 1800s, it carries a strong Scottish heritage reflected in traditions of music, dance, and community pride. Laurinburg, the county seat, grew as a center of education, trade, and cultural life that anchors the region.
Residents gather for festivals, parades, and events that highlight both history and local flavor. Outdoor recreation, from golf to walking trails and nearby rivers, adds to the rhythm of daily living. Scotland County continues to honor its cultural roots while sustaining a close-knit and enduring sense of community.
Where is Scotland County?
Scotland County is located in the Sandhills of south-central North Carolina along the South Carolina border. It is bordered by Richmond County to the north and Robeson County to the east, with sandy soils and rolling pine forests defining its landscape. The county measures about 25 miles east to west and 20 miles north to south.
Laurinburg, the county seat, is positioned near the center along U.S. Highway 401. Other nearby communities include Wagram to the north, Gibson to the south, and East Laurinburg adjacent to the seat. The area is influenced by its border location, agricultural base, and connections to both the Sandhills region and South Carolina’s Pee Dee area.
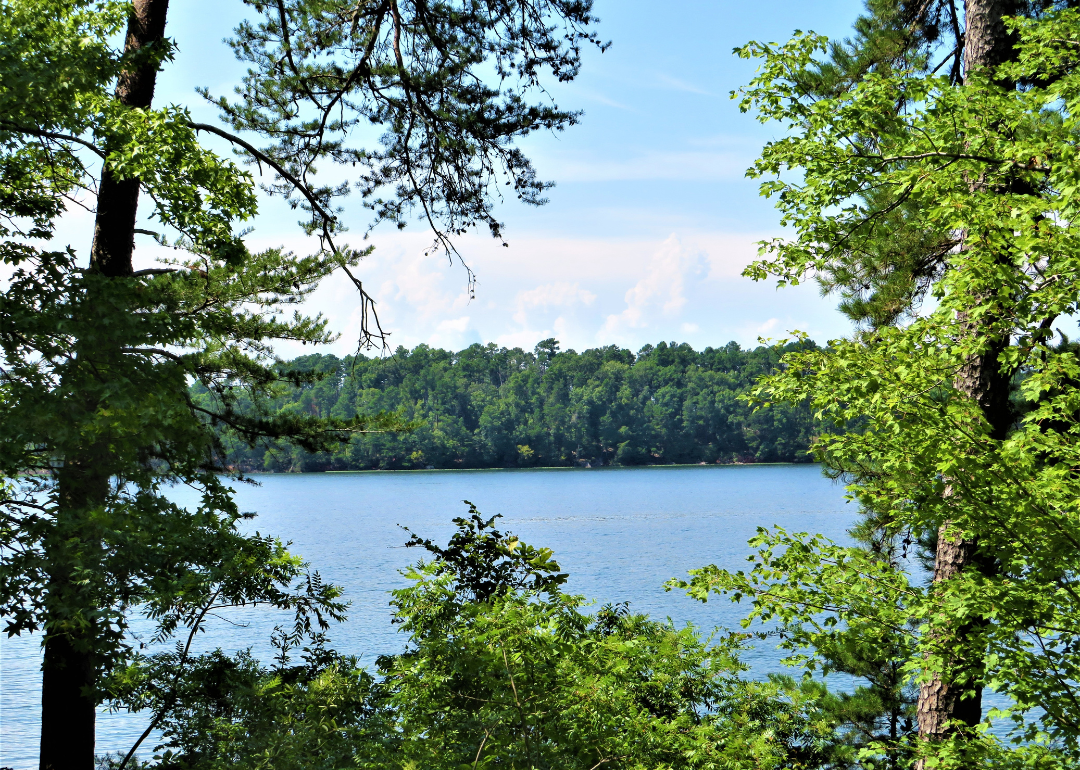
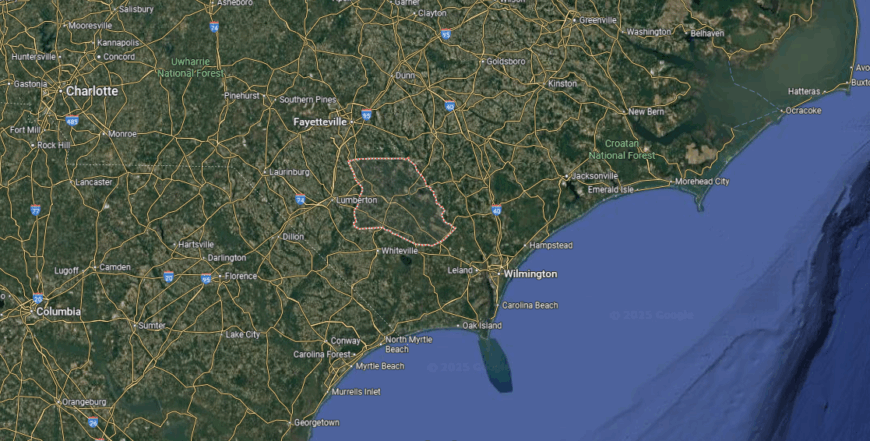
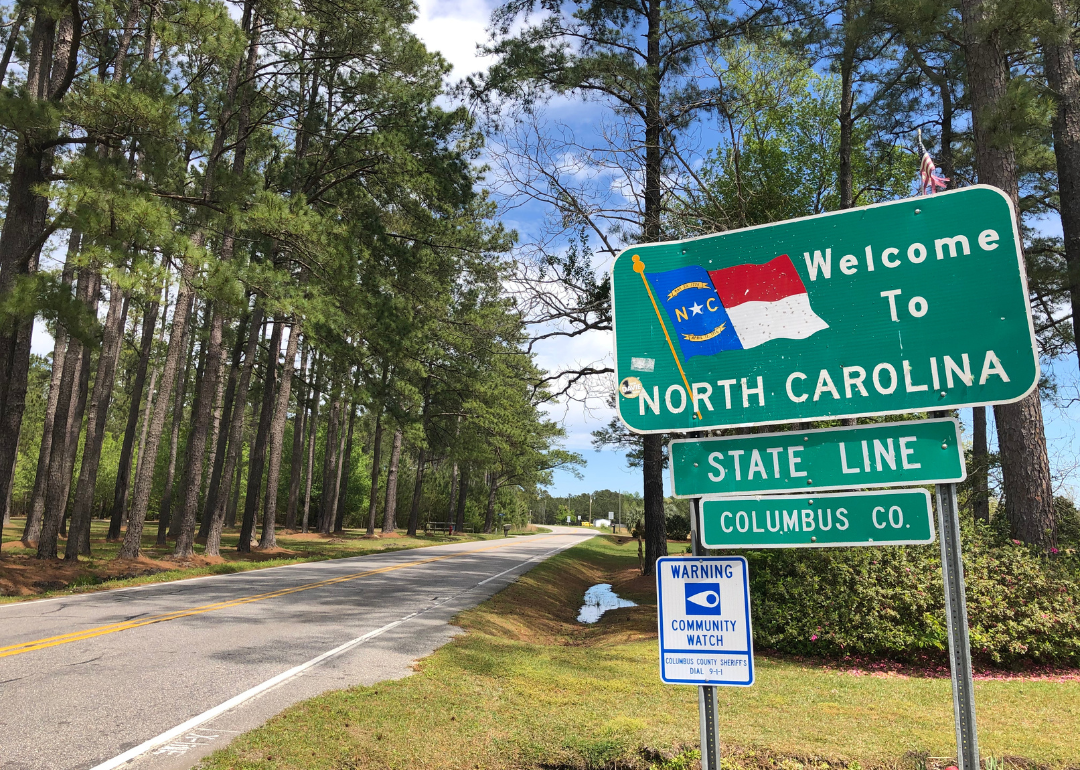
#4. Columbus County
– Life expectancy: 70.7 years
— 5.9 years lower than the state average
About
Columbus County rests in southeastern North Carolina, where pine forests, farmland, and the Waccamaw River shape its landscape. Formed in the early 19th century, it has long relied on agriculture, forestry, and small-town trade to support its communities. Whiteville, the county seat, developed into the cultural and civic hub, anchoring the county’s identity.
Community traditions remain strong through festivals, school events, and church gatherings that bring neighbors together. Residents also enjoy access to Lake Waccamaw, a natural landmark that provides opportunities for boating, fishing, and outdoor recreation. Columbus County endures as a place where land, water, and community ties form the foundation of daily life.
Where is Columbus County?
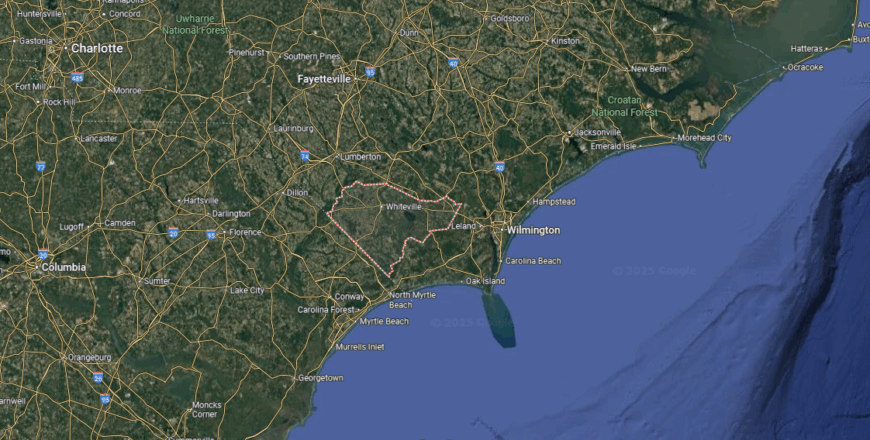
Columbus County is located in southeastern North Carolina along the South Carolina border. It is bordered by Bladen County to the north and Brunswick County to the east, with the Waccamaw River and Lumber River running through its landscape. The county spans about 40 miles north to south and 35 miles east to west, making it one of the largest counties in the state.
Whiteville, the county seat, sits near the center and serves as the county’s administrative hub. Other nearby communities include Chadbourn to the west, Tabor City near the South Carolina line, and Lake Waccamaw to the east. The county is defined by its river systems, extensive farmland, and the natural centerpiece of Lake Waccamaw.
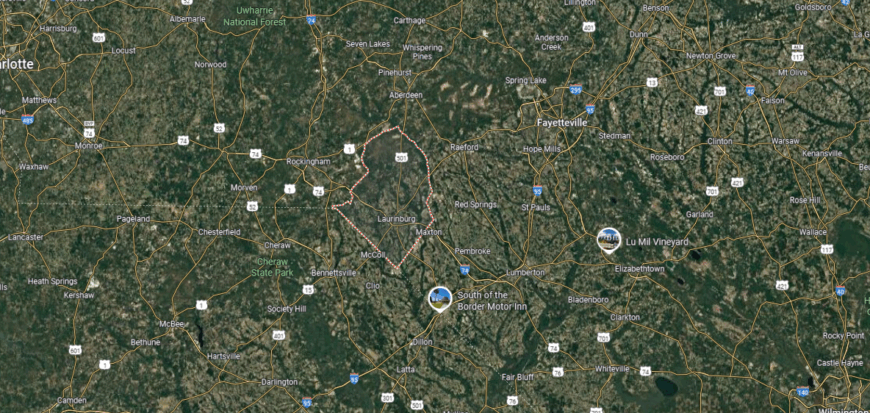
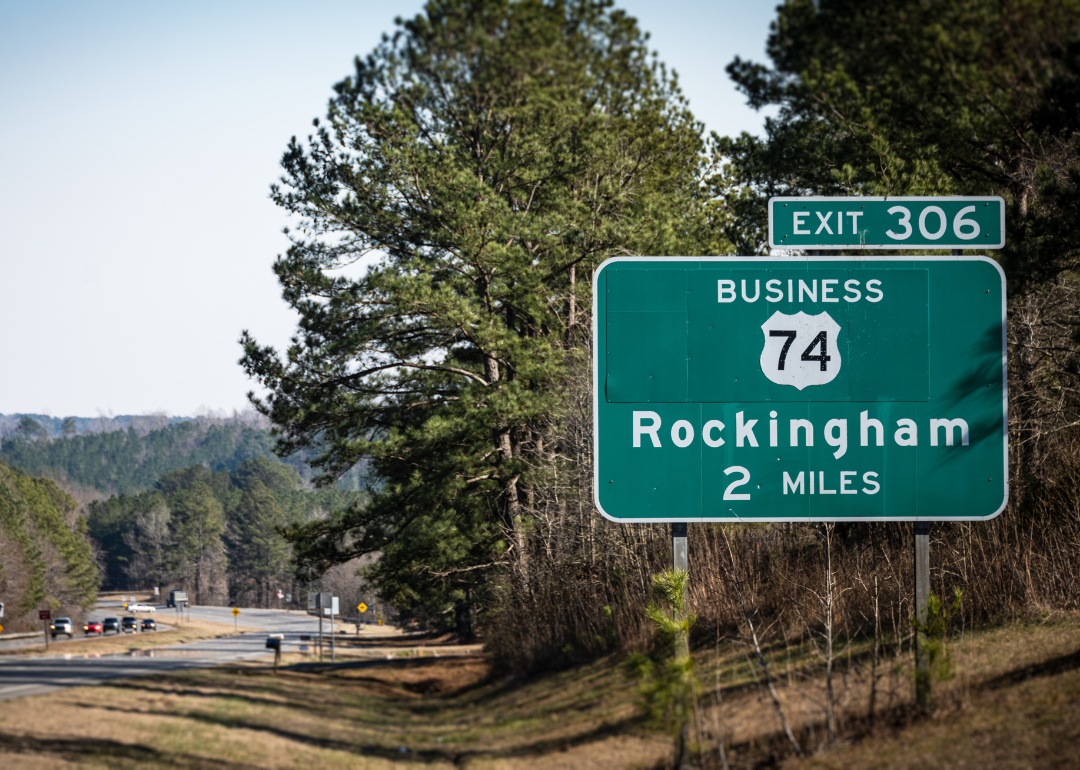
#3. Richmond County
– Life expectancy: 70.5 years
— 6.1 years lower than the state average
About
Richmond County lies in the Sandhills of south-central North Carolina, where rolling terrain and longleaf pines define the landscape. Established in the late 1700s, it grew through farming, railroads, and textiles, while small towns and mill villages shaped the rhythm of local life. Rockingham, the county seat, became known both for civic tradition and its historic ties to racing at the Rockingham Speedway.
Residents come together at festivals, parades, and school events that highlight community pride and heritage. Outdoor activities like hunting, fishing, and hiking connect daily life to the land and forests around them. Richmond County remains a place where tradition, resilience, and community spirit continue to guide its identity.
Where is Richmond County?
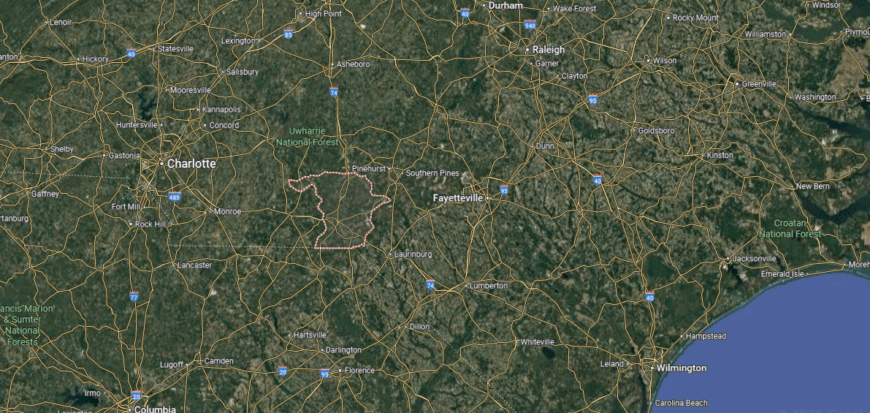
Richmond County is positioned in south-central North Carolina, bordered by Montgomery County to the north and Scotland County to the south. It extends to the South Carolina border, with the Pee Dee River forming much of its eastern edge. The county measures about 35 miles north to south and 30 miles east to west.
Rockingham, the county seat, is located near the center along U.S. Highway 74. Other nearby towns include Hamlet to the southeast, Ellerbe to the north, and Hoffman near the Sandhills Game Lands. The county is defined by its Sandhills terrain, river valleys, and transportation links connecting the Piedmont to South Carolina.
#2. Robeson County (tie)
– Life expectancy: 69.3 years
— 7.3 years lower than the state average
About
Robeson County rests in southeastern North Carolina, where flat coastal plain landscapes stretch between swamps, rivers, and farmland. Formed in the late 1700s, it carries a deep multicultural heritage, home to the Lumbee Tribe as well as long-standing African American and European American communities. Lumberton, the county seat, grew as a hub for trade and civic life, anchoring the region’s identity.
Life here is marked by cultural festivals, music, and gatherings that celebrate the county’s diversity and traditions. Farming and small industry continue to shape the economy, while outdoor activities along the Lumber River connect residents to the natural environment. Robeson County stands as a place defined by resilience, cultural richness, and strong community ties.
Where is Robeson County?
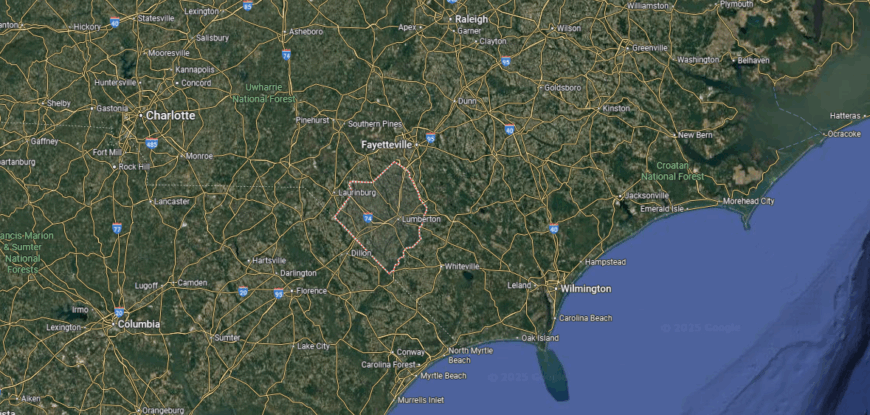
Robeson County is located in the southeastern part of North Carolina along the South Carolina border. It is bordered by Cumberland County to the north and Columbus County to the east, with the Lumber River flowing through its center. The county spans about 35 miles east to west and 30 miles north to south, making it one of the largest in the state.
Lumberton, the county seat, sits along the Lumber River near the center. Other nearby communities include Pembroke to the west, Red Springs to the north, and Fairmont toward the south. The county is defined by its river valleys, extensive farmland, and its cultural significance as home to the Lumbee Tribe of North Carolina.
#1. Swain County (tie)
– Life expectancy: 69.3 years
— 7.3 years lower than the state average
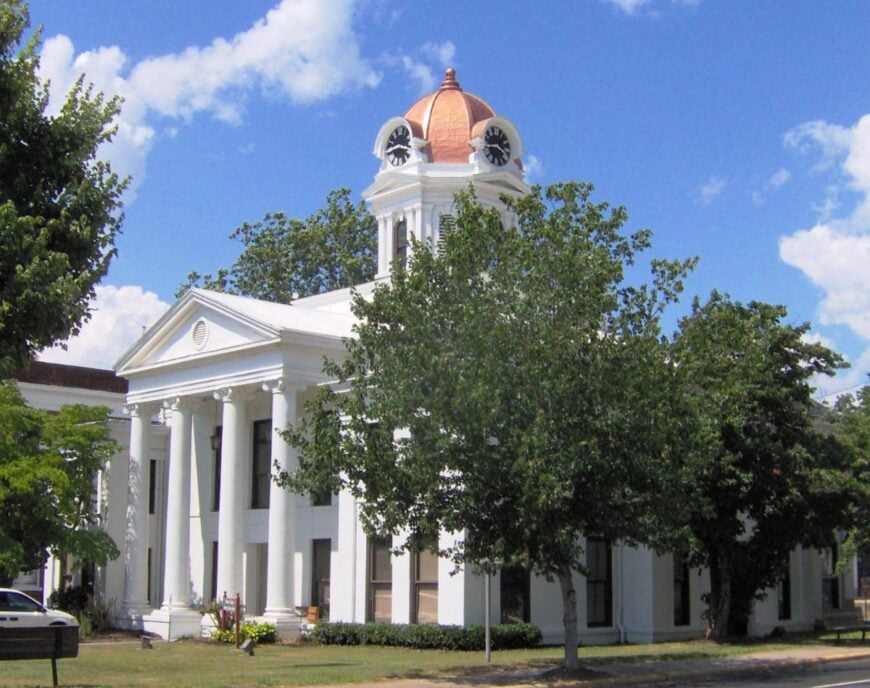
About
Swain County lies in western North Carolina, where the Great Smoky Mountains rise in dramatic ridges and valleys. Formed in the 1800s, it has long been shaped by its natural surroundings, with much of its land preserved in the Great Smoky Mountains National Park and Nantahala National Forest. The Tuckasegee River runs through the county, tying together its history of farming, timber, and small mountain communities.
Residents find connection through festivals, music traditions, and gatherings that highlight Appalachian heritage. Outdoor life is central, with hiking, rafting, and fishing offering daily ties to the mountains and rivers. Swain County endures as a place where natural beauty and cultural tradition remain deeply woven into community life.
Where is Swain County?
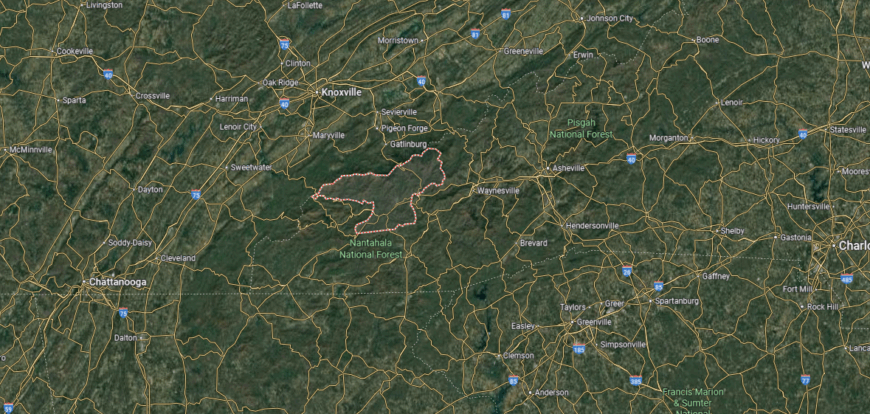
Swain County is located in the far western mountains of North Carolina, bordered by Graham County to the west and Jackson County to the east. Much of its land lies within the Great Smoky Mountains, giving it some of the most rugged terrain in the state. The county covers about 30 miles east to west and 25 miles north to south.
Bryson City, the county seat, is positioned along the Tuckasegee River near the center. Other nearby communities include Cherokee to the northeast and Almond along Fontana Lake. The county is defined by Great Smoky Mountains National Park, the Nantahala River Gorge, and its access to the Appalachian Trail.
This story features data reporting by Karim Noorani, writing by Kiersten Hickman, and is part of a series utilizing data automation across 49 states.
You may also like: Counties with the highest rates of strokes in North Carolina
By Stacker