🔥 Would you like to save this?
Counties with the shortest life expectancy in Illinois
Life expectancy can be affected by a variety of factors. About 25% of your lifespan is determined by genetics, according to the National Library of Medicine. Health and wellness habits—like following a balanced, nutrient-rich diet; not smoking; drinking minimal alcohol; maintaining a healthy weight; and staying physically active—can add more than a decade to your life, research from the National Institutes of Health shows. While these factors are significant, another important element that you might not have considered is your environment and community.
While life expectancy generally increases annually in the United States—jumping from about 70.8 years old to 77.5 between 1970 and 2022, according to the Centers for Disease Control and Prevention—this particular metric can vary from state to state or even county to county. In some parts of the country, the average lifespan is getting shorter based on a variety of risk factors on top of health, including socioeconomic factors like poverty, unemployment, income, and education.
In order to come up with the very specific design ideas, we create most designs with the assistance of state-of-the-art AI interior design software. Also, assume links that take you off the site are affiliate links such as links to Amazon. this means we may earn a commission if you buy something.
According to a 2020 study from researchers at Penn State, West Virginia, and Michigan State Universities, communities with a higher population density, more fast food restaurants, and a high number of extraction industry-based jobs tend to have shorter life expectancies.
To find out how life expectancy varies within Illinois, Stacker used 2024 County Health Rankings & Roadmaps from the University of Wisconsin Population Health Institute to identify the counties with the shortest life expectancy.
Life expectancy measures the average number of years from birth a person can expect to live and is calculated based on the number of deaths in a given time period and the average number of people at risk of dying during that period. Counties with unreliable or insufficient data were excluded from the analysis. Mortality data came from the National Vital Statistics System.
Read on to see if your county is on the list.
You may also like: Seniors in these Illinois counties have the highest Alzheimer’s rates
#50. Morgan County (tie)
– Life expectancy: 76.4 years
— 1.6 years lower than the state average
About
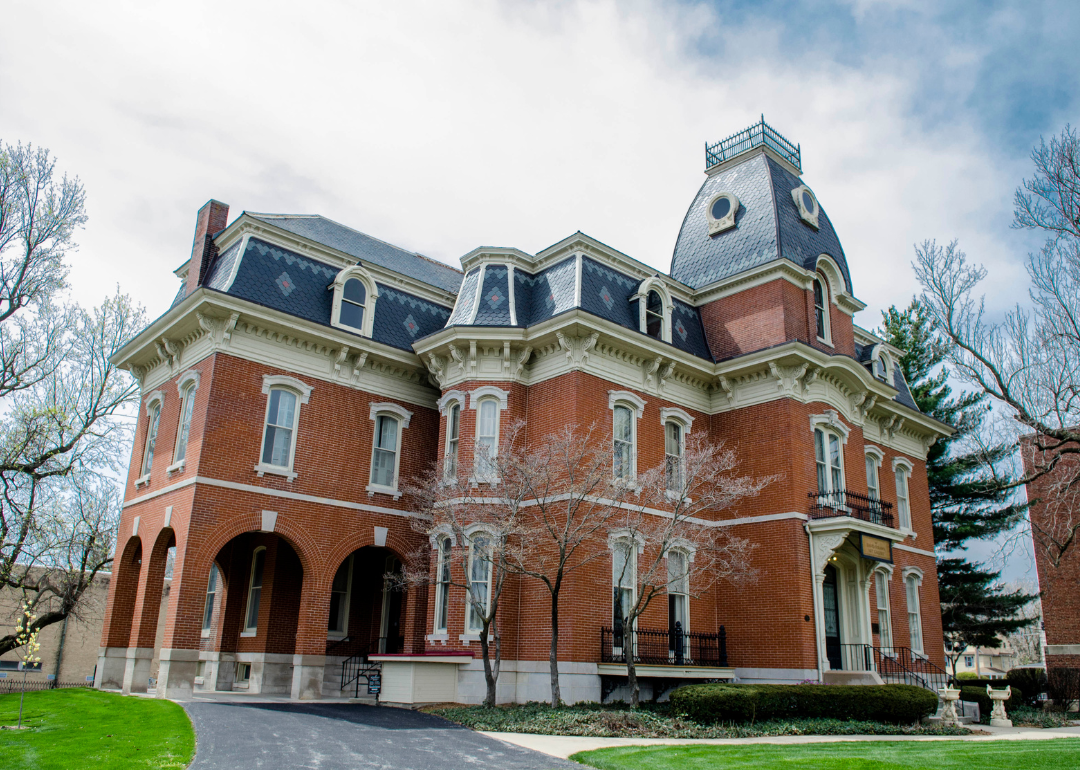
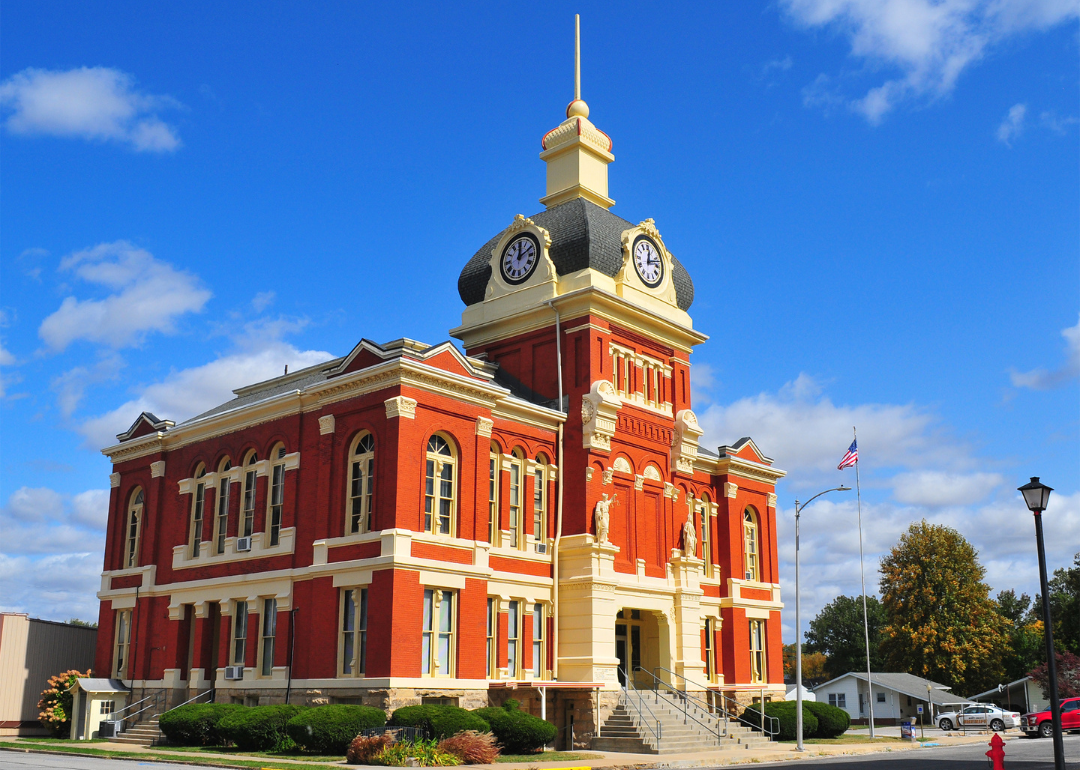
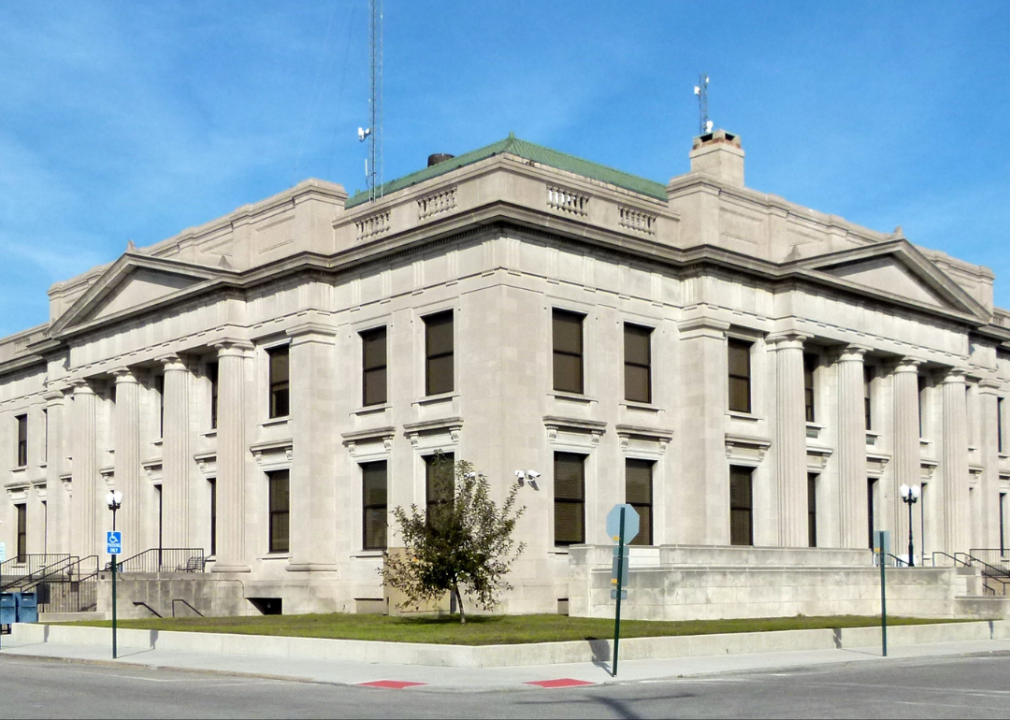
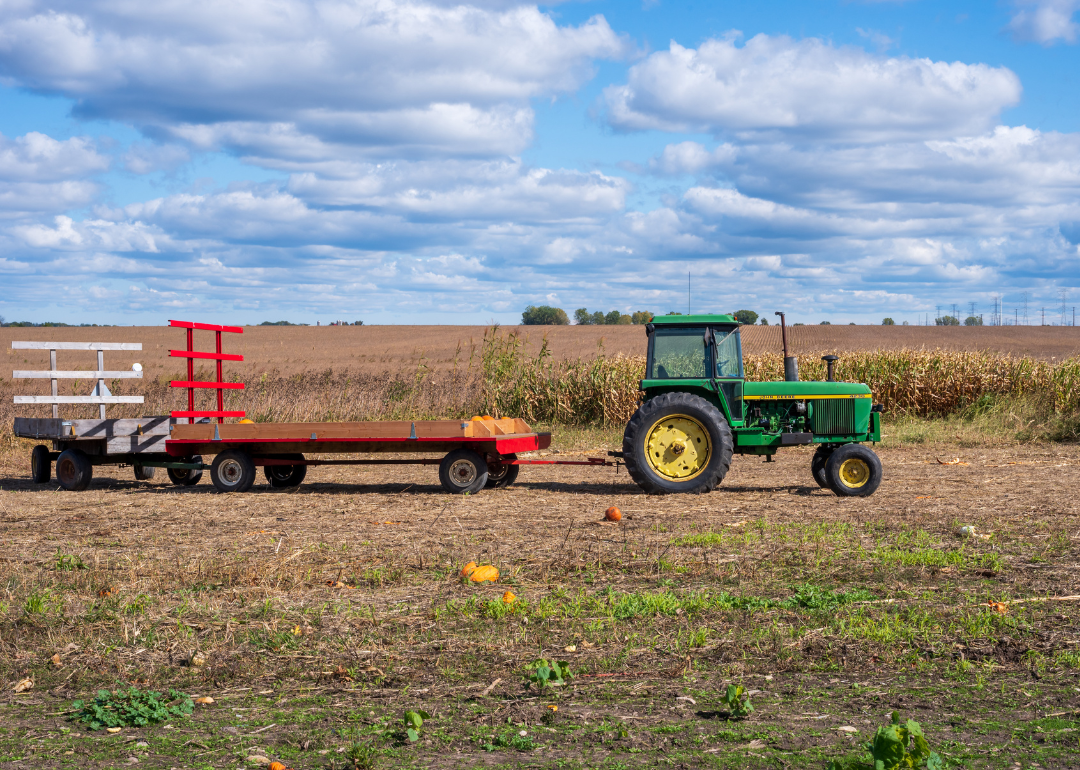
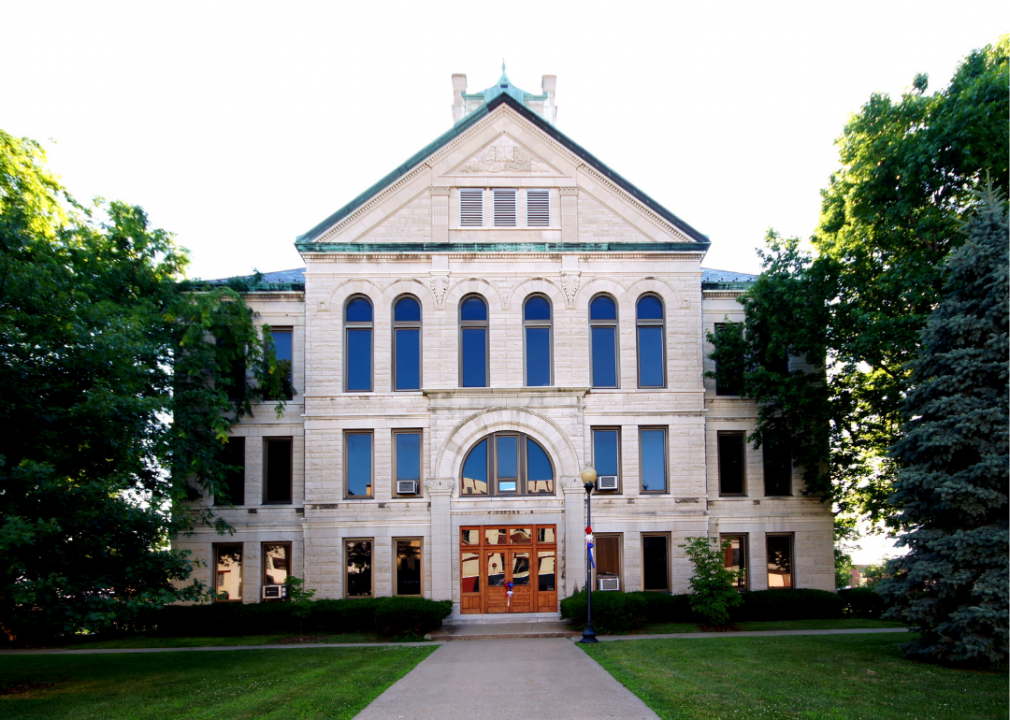
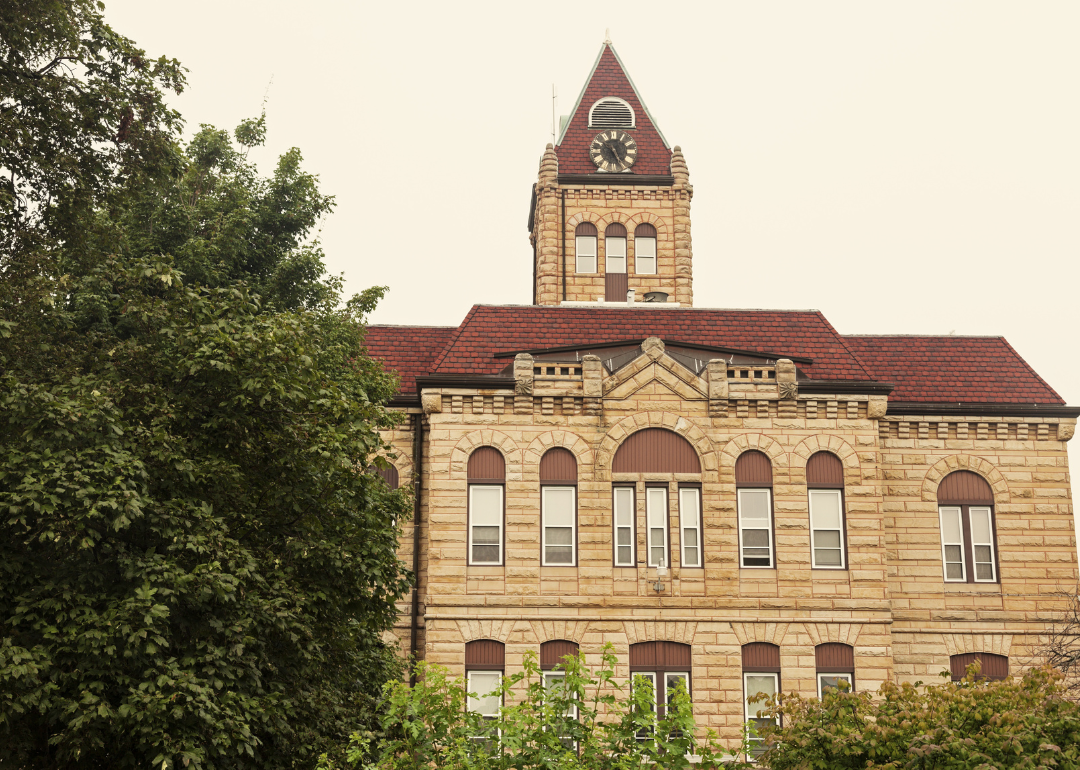
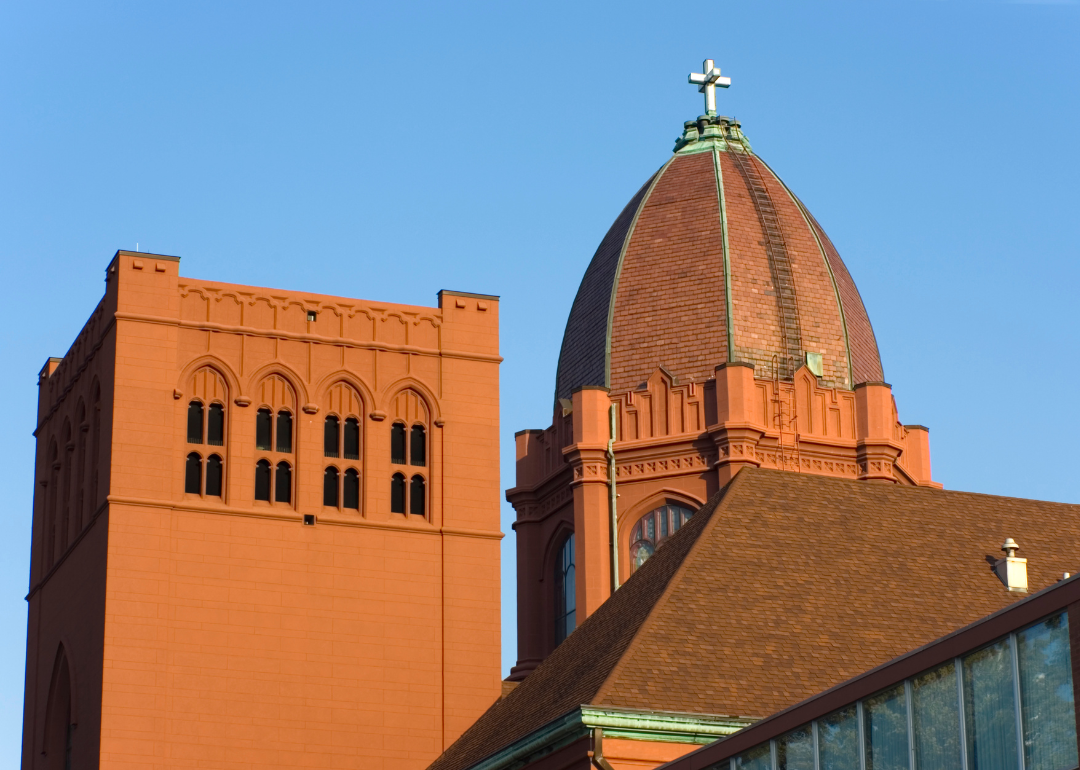
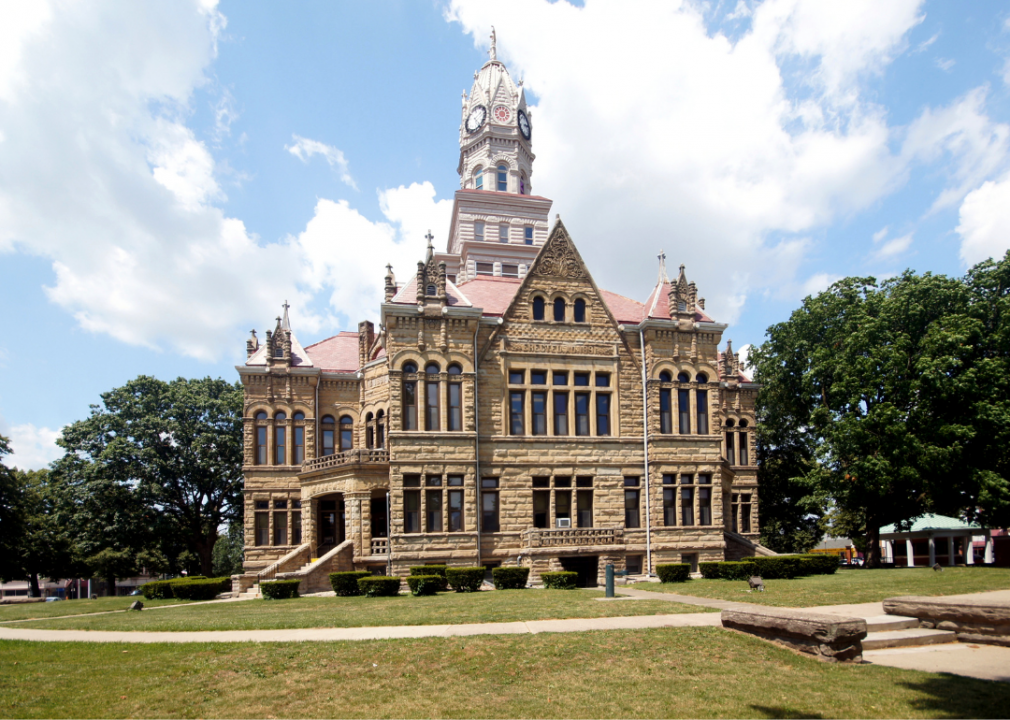
Morgan County, Illinois, lies in the heart of west-central Illinois, where historic charm meets agricultural strength. Jacksonville anchors the county with its colleges, healthcare facilities, and a walkable downtown lined with 19th-century architecture. Smaller towns like Waverly, Franklin, and South Jacksonville reflect the county’s deep-rooted rural values and community spirit.
Jacksonville stands out for its educational presence, including Illinois College and the Illinois School for the Deaf and Visually Impaired, adding depth to a region shaped largely by farming and local enterprise. Residents enjoy a slower pace with festivals, fairgrounds, and familiar faces.
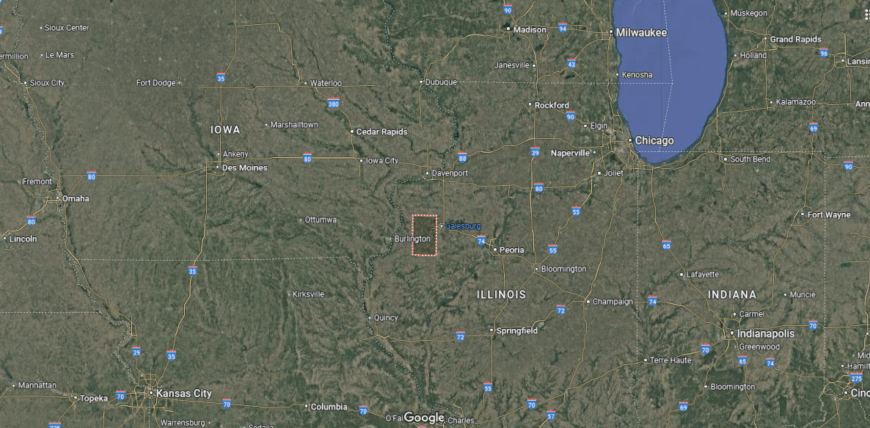
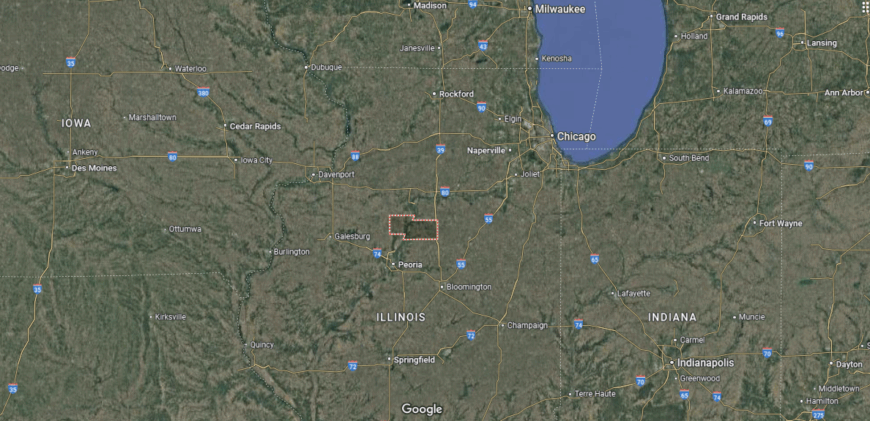
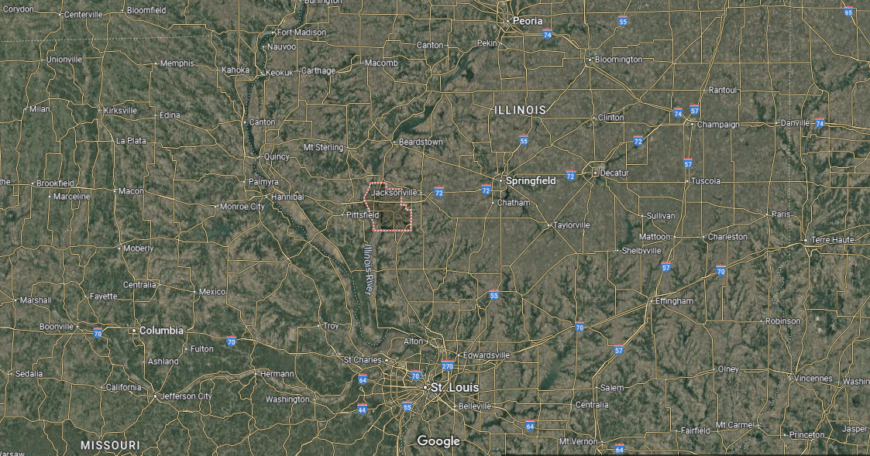
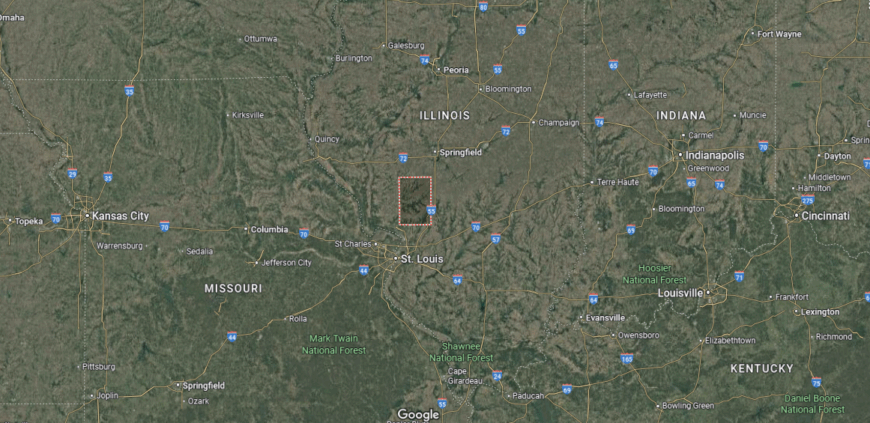
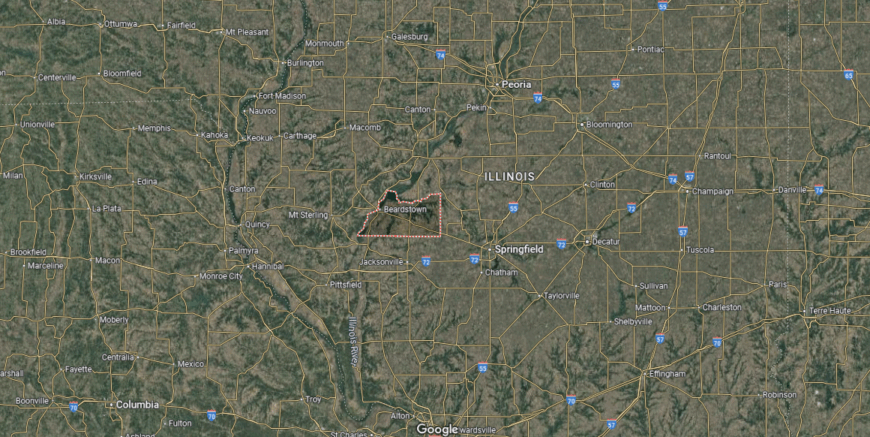
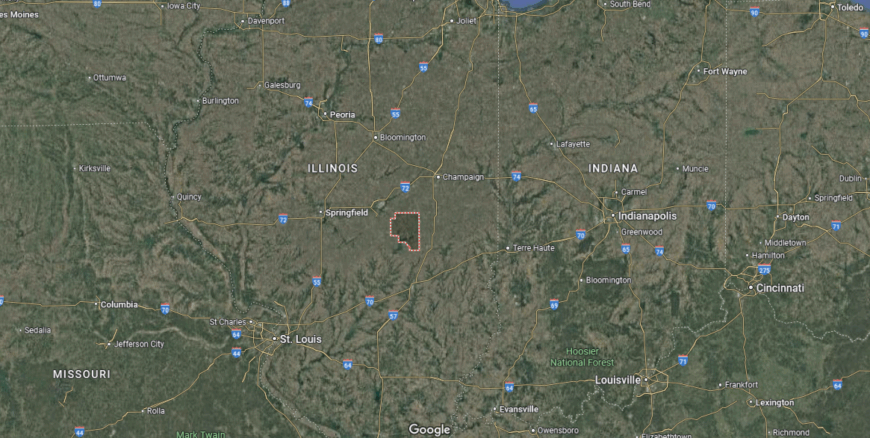
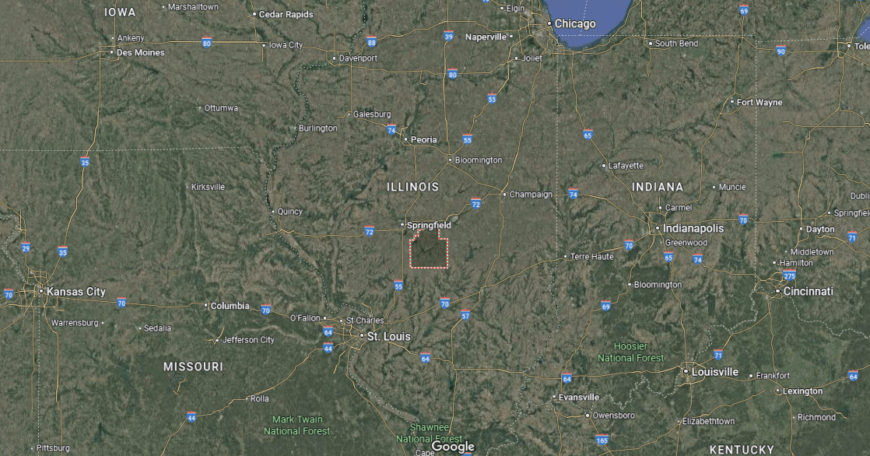
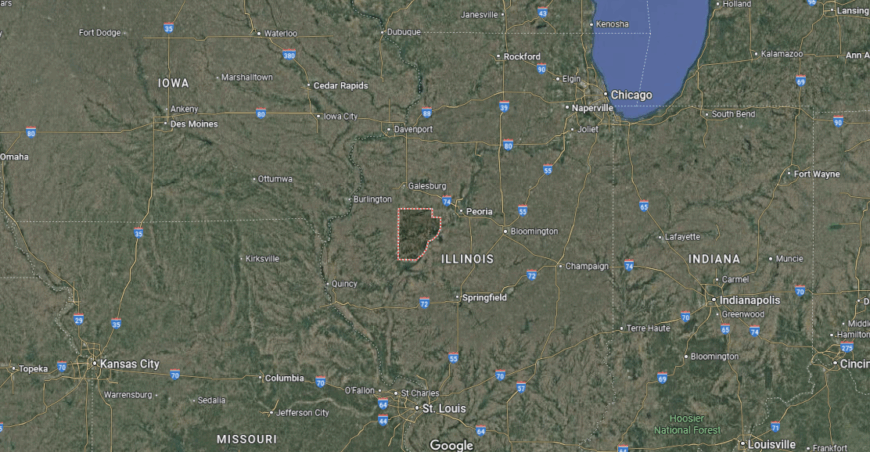
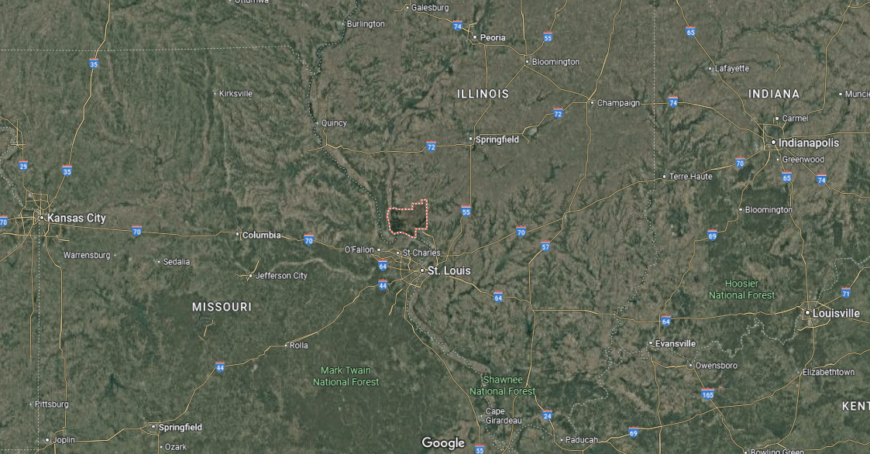
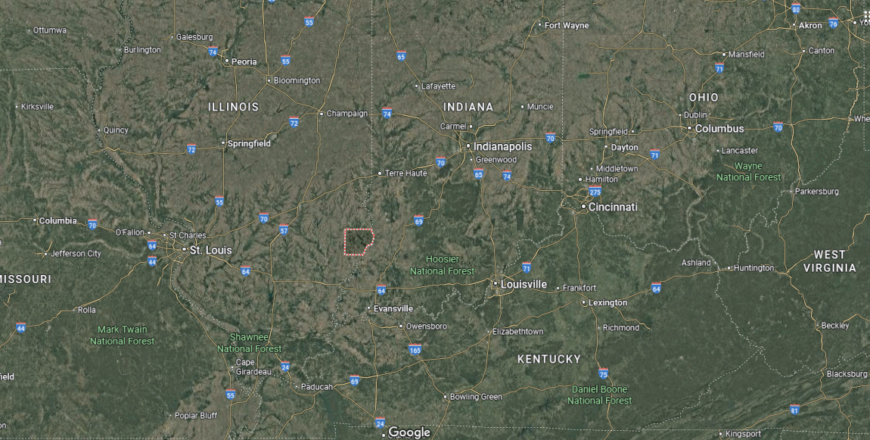
Where is Morgan County?
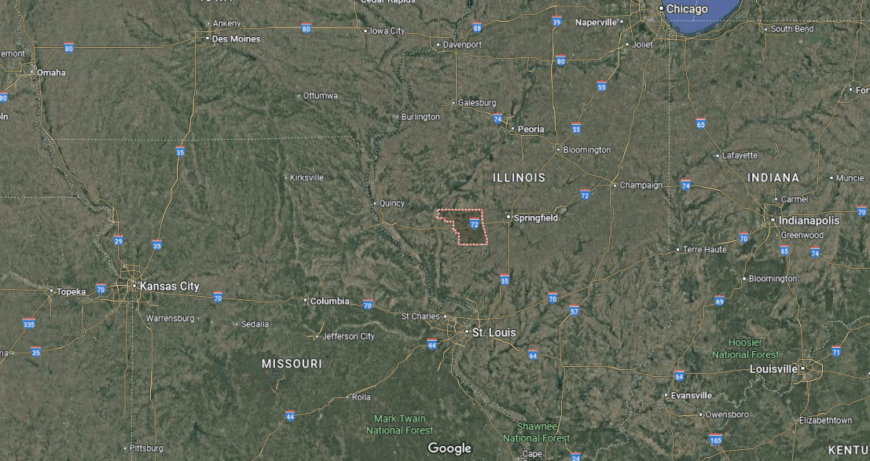
Morgan County sits in the heart of central Illinois, where quiet highways trace paths through cornfields, wooded creeks, and towns steeped in history. About 35 miles west of Springfield, it’s reached by Interstate 72 and U.S. Route 67, cutting through gently rolling farmland and long-settled communities.
Jacksonville stands at the center, known for its historic colleges, tree-lined streets, and deep local roots. Beyond the city, the countryside moves with the seasons—planting in spring, golden fields in fall. It’s a place shaped by legacy and land, where time runs deep and the sky always feels just a little closer.
#49. Warren County (tie)
– Life expectancy: 76.4 years
— 1.6 years lower than the state average
About
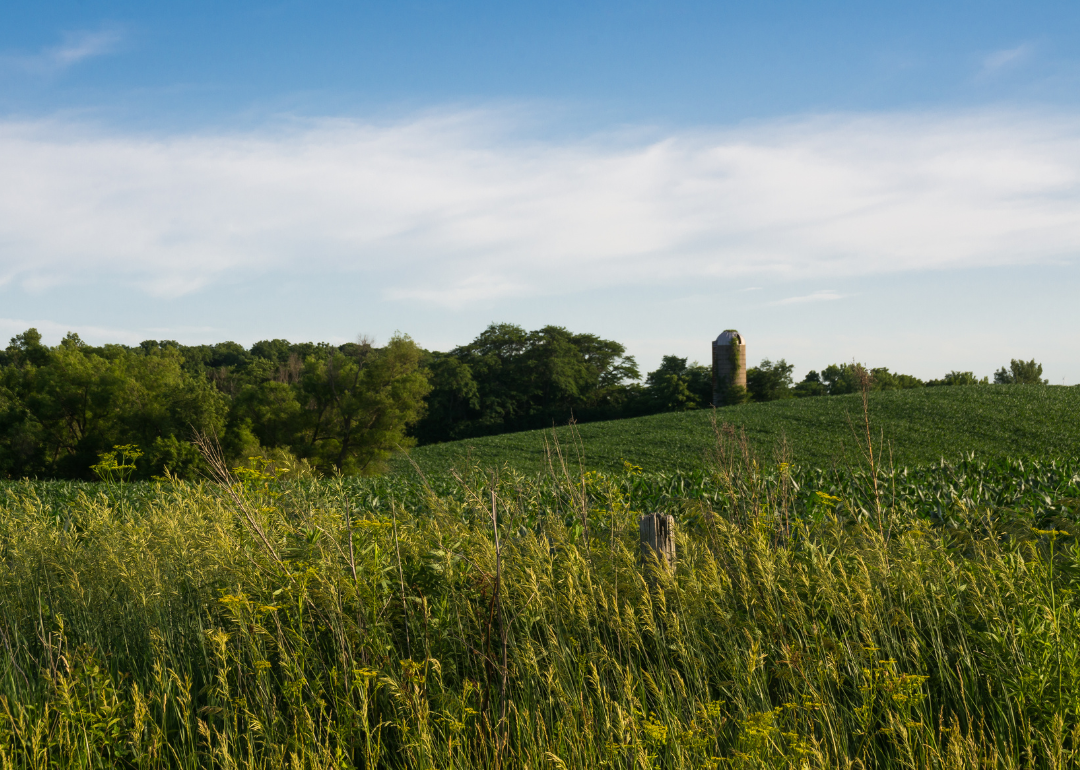
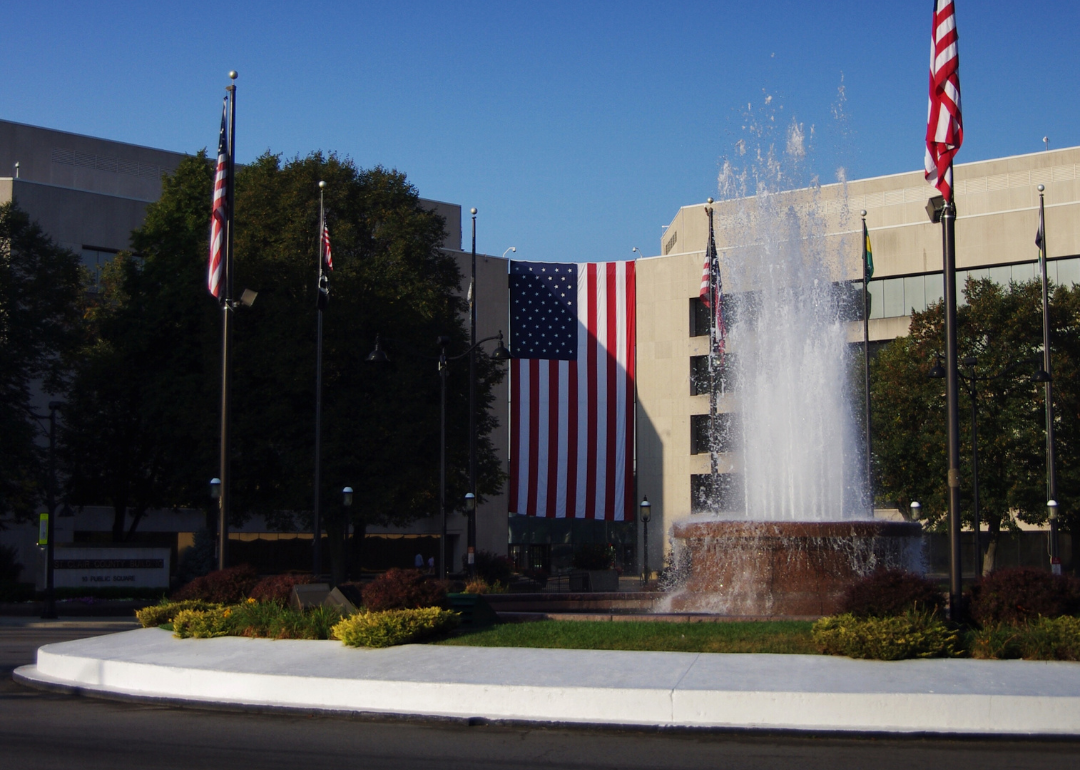
Warren County, Illinois, sits in the west-central part of the state, where fertile farmland surrounds quiet towns rooted in Midwestern tradition. Monmouth, the county seat, serves as the civic and cultural center with historic architecture, local schools, and Monmouth College adding a touch of academic life. Smaller communities like Roseville and Kirkwood contribute to the area’s strong agricultural identity.
The landscape is shaped by fields, grain elevators, and two-lane roads connecting neighbors and farms. Community events, high school sports, and family-run businesses form the fabric of daily life. Warren County appeals to those who value simplicity, close ties, and the rhythms of rural Illinois living.
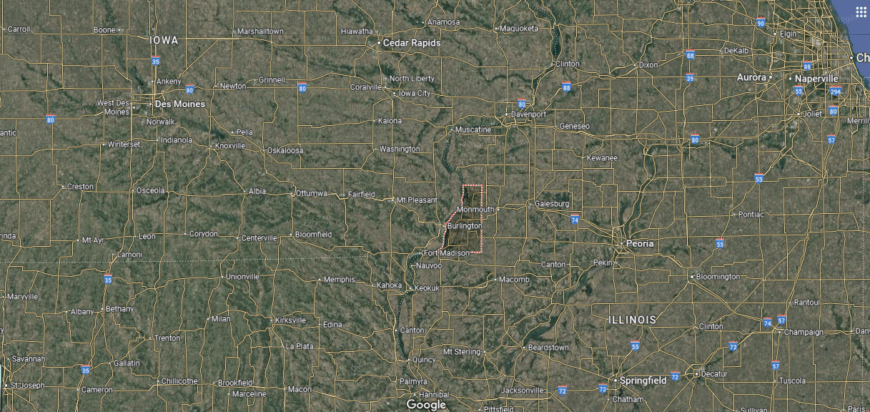
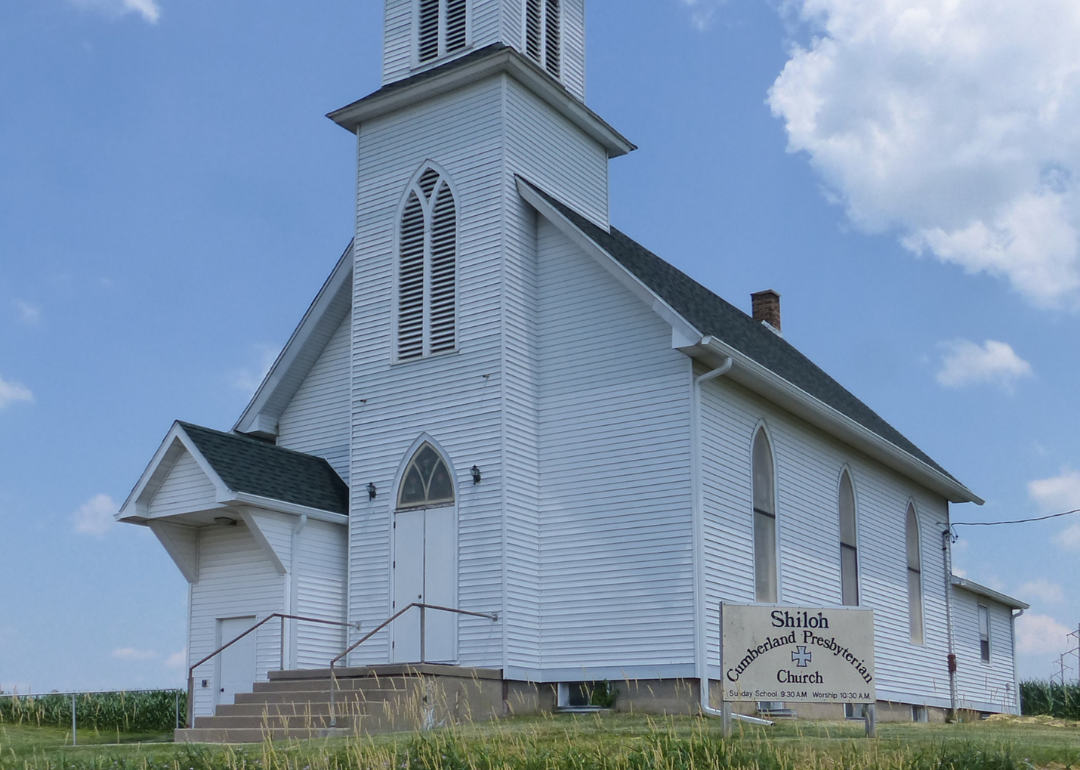
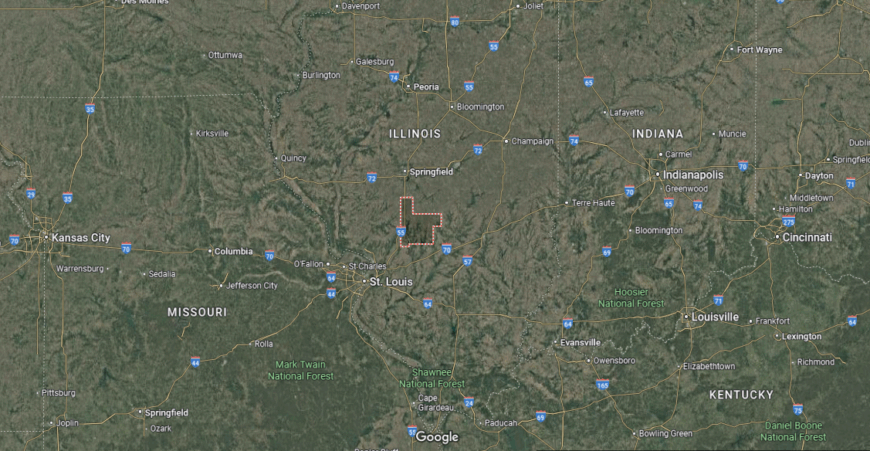
Where is Warren County?
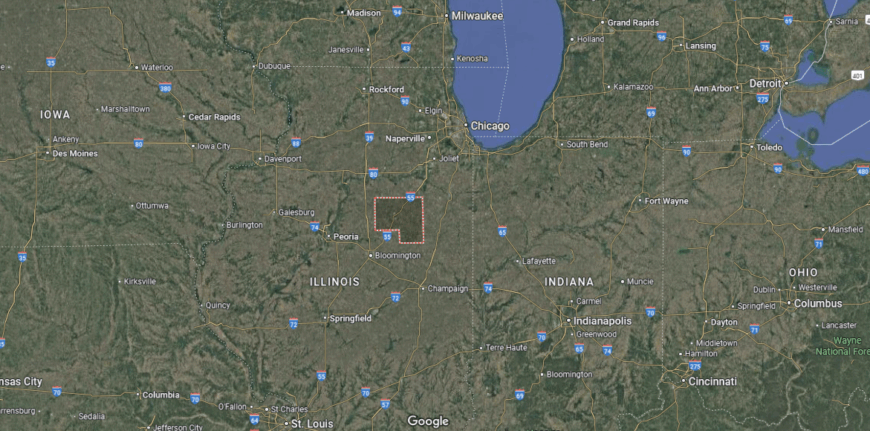
Warren County rests in western Illinois, where prairie fields roll gently beneath big skies and grain elevators mark the horizon. About 45 miles west of Peoria, it’s reached by U.S. Route 34 as it passes through farmland, windbreaks, and two-lane roads stretching long and straight.
Monmouth anchors the county with college-town steadiness, courthouse charm, and a history tied to agriculture and rail. Around it, small communities and wide fields carry the rhythm of planting, harvest, and slow sunsets. It’s a place where the pace runs with the land—steady, open, and grounded in the quiet strength of the plains.
#48. Henderson County (tie)
– Life expectancy: 76.3 years
— 1.7 years lower than the state average
About
Henderson County, Illinois, rests along the Mississippi River in the state’s western region, where bluff views, farmland, and quiet river towns define the landscape. Oquawka, the county seat, offers a mix of local history, civic life, and a relaxed, small-town pace. Communities like Stronghurst, Biggsville, and Gladstone carry strong agricultural ties and tight-knit traditions.
The river shapes both recreation and lifestyle—fishing, boating, and scenic drives are part of everyday life. Residents value community events, school spirit, and multigenerational family roots. Henderson County appeals to those seeking calm, connection, and a place where the river and land move in steady rhythm.
Where is Henderson County?
Henderson County rests along the western edge of Illinois, where the Mississippi River draws a slow boundary between farmland and water. Tucked between bluffs and bottomland, it’s reached by backroads and U.S. Route 34 as it crosses fields, rail lines, and winding levees.
Oquawka sits near the riverbank, where barges pass and cottonwoods line the shore, while inland towns like Stronghurst and Biggsville keep to the quiet rhythm of rural life. The land is flat, the views wide, and the pace deeply tied to season and soil. It’s a place where the river runs steady, and time feels anchored in every mile.
#47. Marshall County (tie)
– Life expectancy: 76.3 years
— 1.7 years lower than the state average
About
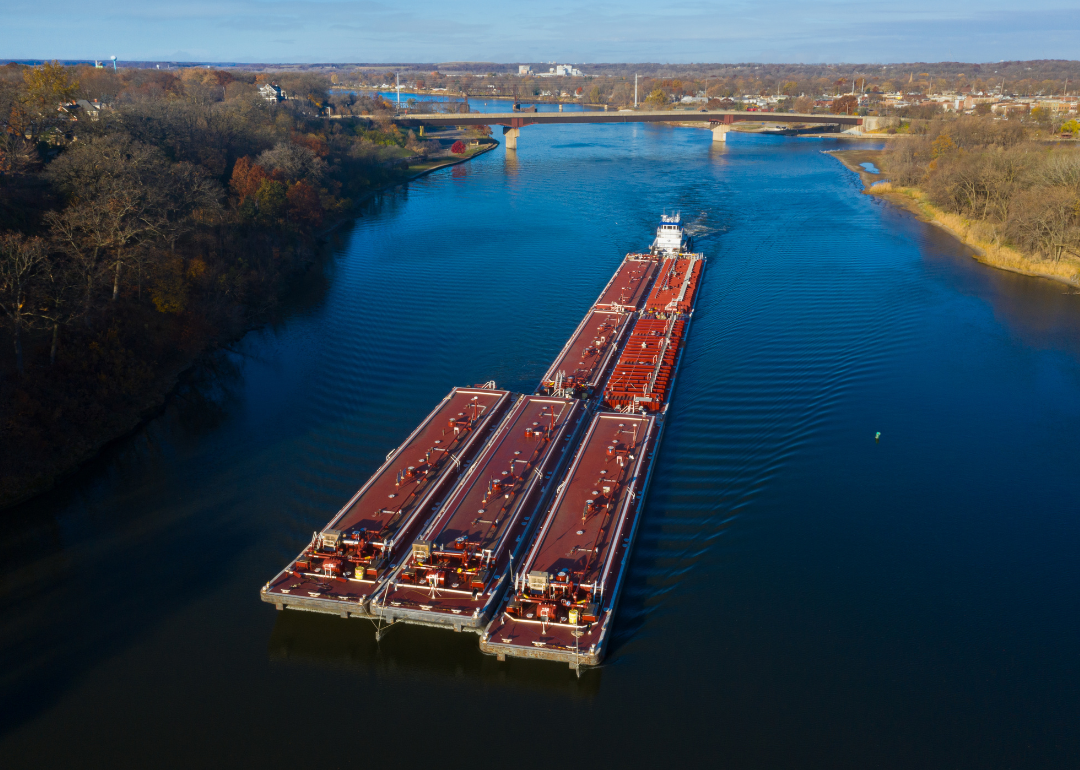
Marshall County, Illinois, sits along the Illinois River in the heart of the state, blending farmland, forest preserves, and small-town character. Lacon serves as the county seat with government services, riverfront parks, and a walkable downtown, while towns like Henry, Wenona, and Sparland reflect the region’s agricultural backbone and close-knit spirit.
The Illinois River adds natural beauty and supports local recreation, from boating to fishing to quiet scenic overlooks. Life here moves at a comfortable pace, centered around local schools, seasonal fairs, and deep-rooted community ties. Marshall County attracts those who value tradition, nature, and the everyday simplicity of rural central Illinois.
Where is Marshall County?
Marshall County lies in north-central Illinois, where farm fields meet wooded bluffs and the Illinois River bends along its western edge. About 30 miles north of Peoria, it’s reached by Route 29 and quiet rural highways that pass silos, streambeds, and stands of old oaks.
Lacon anchors the county from its perch above the river, while towns like Henry, Wenona, and Sparland mark the rhythm of a landscape built on agriculture and community ties. The land feels familiar here—broad skies, straight rows, and sunsets that stretch across the prairie. It’s a place where life moves steadily, shaped by water, work, and rooted ground.
#46. Randolph County (tie)
– Life expectancy: 76.3 years
— 1.7 years lower than the state average
About
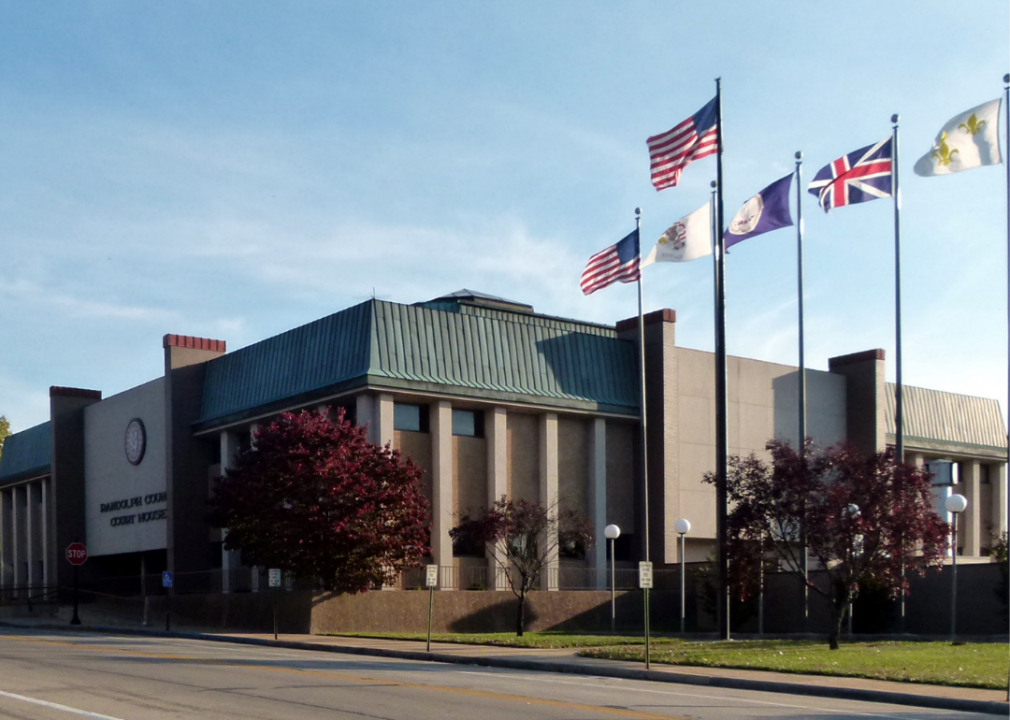
Randolph County, Illinois, stretches along the Mississippi River in the state’s southwest, steeped in history and defined by riverfront life and rural tradition. Chester, the county seat, overlooks the river and is known as the hometown of Popeye, blending local pride with small-town charm. Other communities like Sparta, Red Bud, and Steeleville reflect the county’s agricultural roots and historic settlements.
The area offers river recreation, state parks, and a strong connection to Illinois’ early French colonial past—especially in places like Fort de Chartres. Residents enjoy close community ties, local festivals, and a landscape shaped by farmland, forests, and bluffs. Randolph County appeals to those drawn to heritage, river views, and the enduring rhythm of downstate living.
Where is Randolph County?
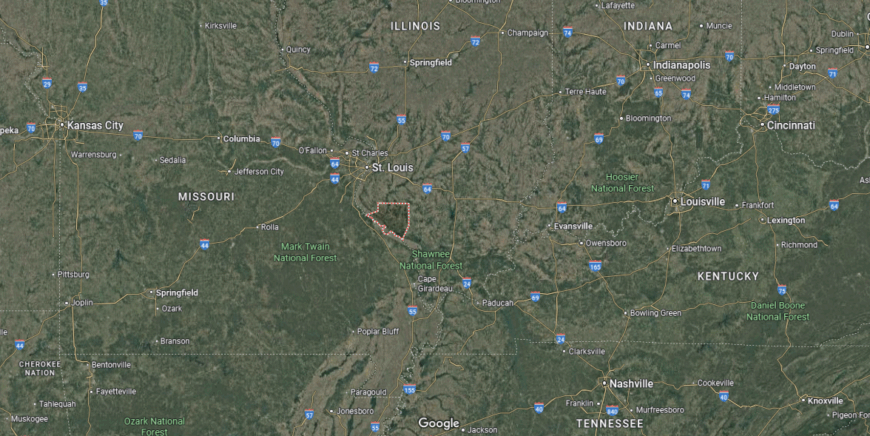
Randolph County sits along the Mississippi River in southwestern Illinois, where bottomland forests meet blufftop farms and small towns carry centuries of history. Located about 60 miles southeast of St. Louis, it’s reached by Illinois Routes 3 and 150, following the river’s curve through fields, levees, and limestone hills.
Chester, perched above the Mississippi, anchors the county with river views and historic streets, while Kaskaskia—once Illinois’ first capital—sits quietly on the opposite shore, nearly forgotten by time. Across the countryside, villages and farmland keep a steady pace, shaped by river floods and deep local memory. It’s a place where Illinois began, and where the river still tells the story.
You may also like: Counties where the most opioids are dispensed in Illinois
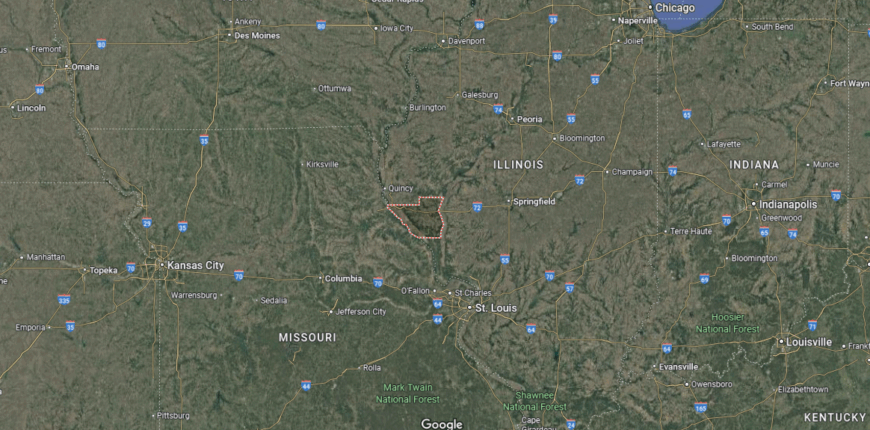
#45. Scott County
– Life expectancy: 76.2 years
— 1.8 years lower than the state average
About
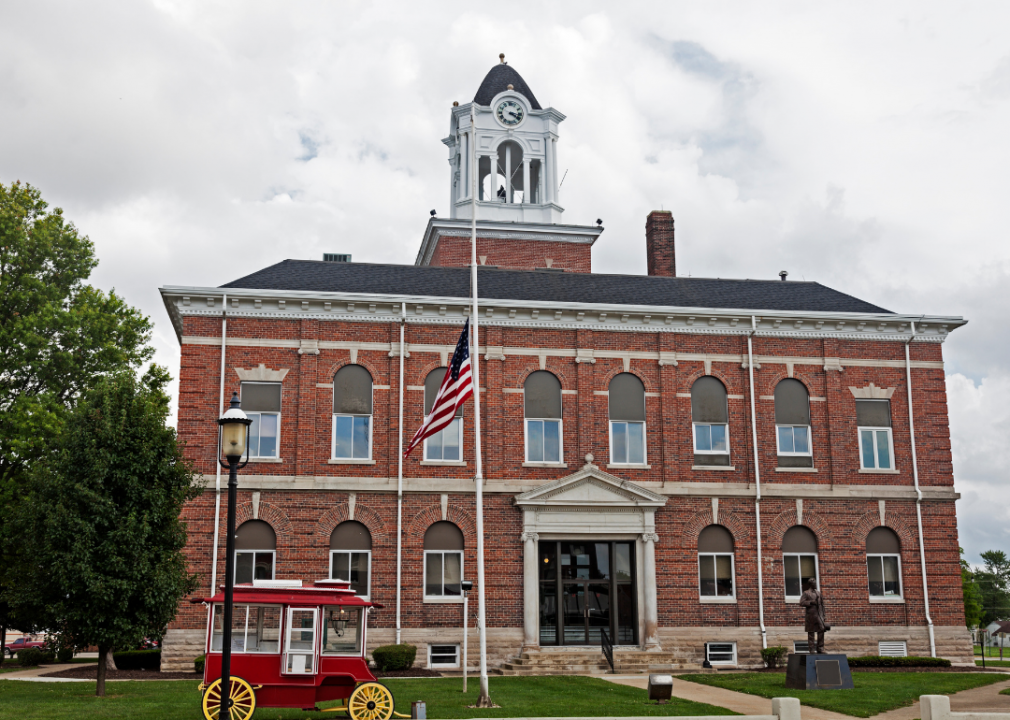
Scott County, Illinois, is one of the state’s smallest counties by area and population, offering a quiet stretch of farmland and prairie west of Springfield. Winchester, the county seat, serves as the heart of civic life with historic buildings, local schools, and a deep sense of community. Other small towns like Bluffs and Manchester support the area’s strong agricultural base and rural traditions.
With rolling fields, two-lane roads, and familiar faces, life in Scott County moves at a steady, unhurried pace. Residents value neighborly ties, seasonal fairs, and the preservation of small-town values. Scott County appeals to those who appreciate simplicity, heritage, and a lifestyle shaped by land and legacy.
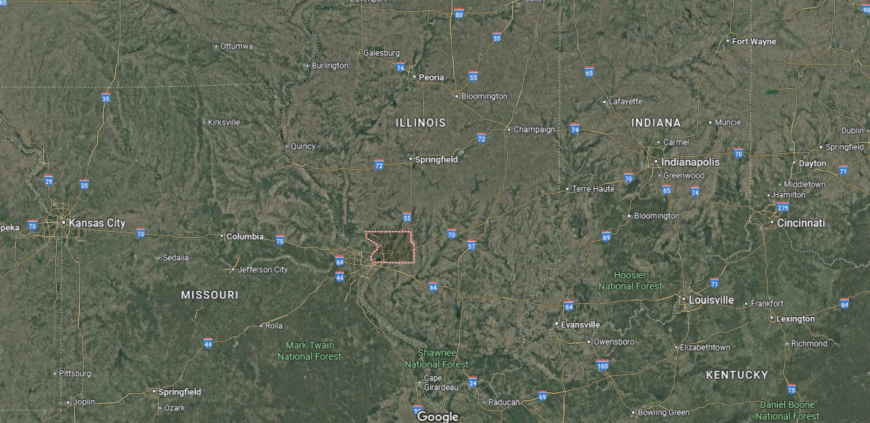
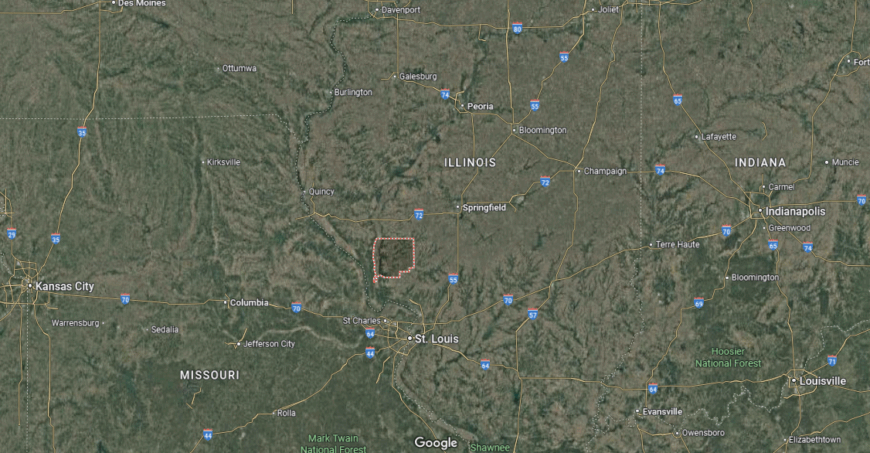
Where is Scott County?
🔥 Would you like to save this?
Scott County lies in west-central Illinois, where quiet roads thread through farmland, woodlots, and a handful of close-knit towns. Just west of Jacksonville, it’s reached by Interstate 72 and state routes that pass barns, silos, and fields that change with the season.
Winchester, the county seat, holds a courthouse square and a calm rhythm, surrounded by communities like Bluffs and Manchester that carry a similar sense of rootedness. This is one of Illinois’ smallest counties—by land and by people—but wide in sky and steady in spirit. It’s a place where time runs slow, shaped more by harvest than by hurry.
#44. LaSalle County (tie)
– Life expectancy: 76.1 years
— 1.9 years lower than the state average
About
LaSalle County, Illinois, spans a broad stretch of north-central Illinois, where rivers, canyons, and prairie land meet industrial heritage and rural charm. Anchored by Ottawa and LaSalle-Peru, the county also includes towns like Mendota, Streator, and Marseilles—each contributing to a blend of small-city energy and agricultural strength. The Illinois and Fox Rivers wind through the region, adding natural beauty and historic trade routes.
Starved Rock and Matthiessen State Parks offer canyons, waterfalls, and hiking trails that draw visitors year-round, while local communities support manufacturing, farming, and tourism. Residents enjoy festivals, farmers markets, and deep local pride rooted in generations. LaSalle County appeals to those seeking a mix of outdoor access, historic depth, and the enduring spirit of Midwestern towns.
Where is LaSalle County?

LaSalle County stretches across north-central Illinois, where the Illinois River winds through limestone bluffs, farmland, and towns rooted in canal-era ambition. About 90 miles southwest of Chicago, it’s reached by Interstates 39 and 80, crossing prairie plains and river valleys rich with legacy.
Ottawa and LaSalle anchor the county with historic downtowns and riverfront industry, while towns like Streator, Mendota, and Marseilles add their own rhythm of railroads, factories, and fields. Starved Rock State Park rises near the river’s edge—its sandstone canyons and forested trails drawing visitors into a quieter, older landscape.
#43. Jackson County (tie)
– Life expectancy: 76.1 years
— 1.9 years lower than the state average
About
Jackson County, Illinois, lies in the rolling hills of the state’s southern region, where forested bluffs, vineyards, and university life converge. Carbondale anchors the county as home to Southern Illinois University, bringing arts, research, and a youthful energy to the area. Towns like Murphysboro, De Soto, and Makanda add layers of heritage, local flavor, and rural charm.
The Shawnee National Forest covers much of the landscape, offering trails, rock formations, and scenic drives through places like Giant City State Park. Residents enjoy a mix of college-town culture and outdoor recreation, from wine trails to river adventures. Jackson County draws those who value education, nature, and a community shaped by both tradition and curiosity.
Where is Jackson County?
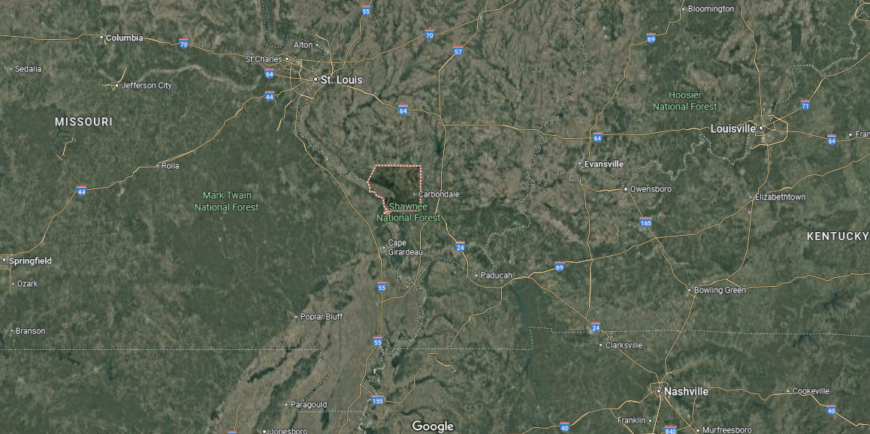
Jackson County lies in southern Illinois, where forested ridges, lakes, and sandstone cliffs break up the farmland and create a landscape that feels more hill country than prairie. About 100 miles southeast of St. Louis, it’s reached by Illinois Route 13 and U.S. Route 51, cutting through small towns, wooded hollows, and quiet stretches of road.
Carbondale anchors the county with the energy of a university town, while Murphysboro and smaller communities rest in the shadows of the Shawnee Hills. Giant City State Park and the southern stretches of the Shawnee National Forest bring rock formations, winding trails, and dense green canopies.
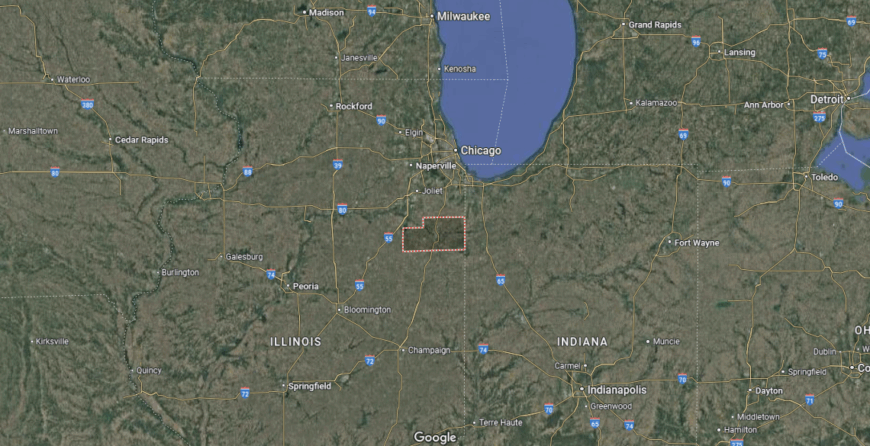
#42. Livingston County (tie)
– Life expectancy: 76.1 years
— 1.9 years lower than the state average
About
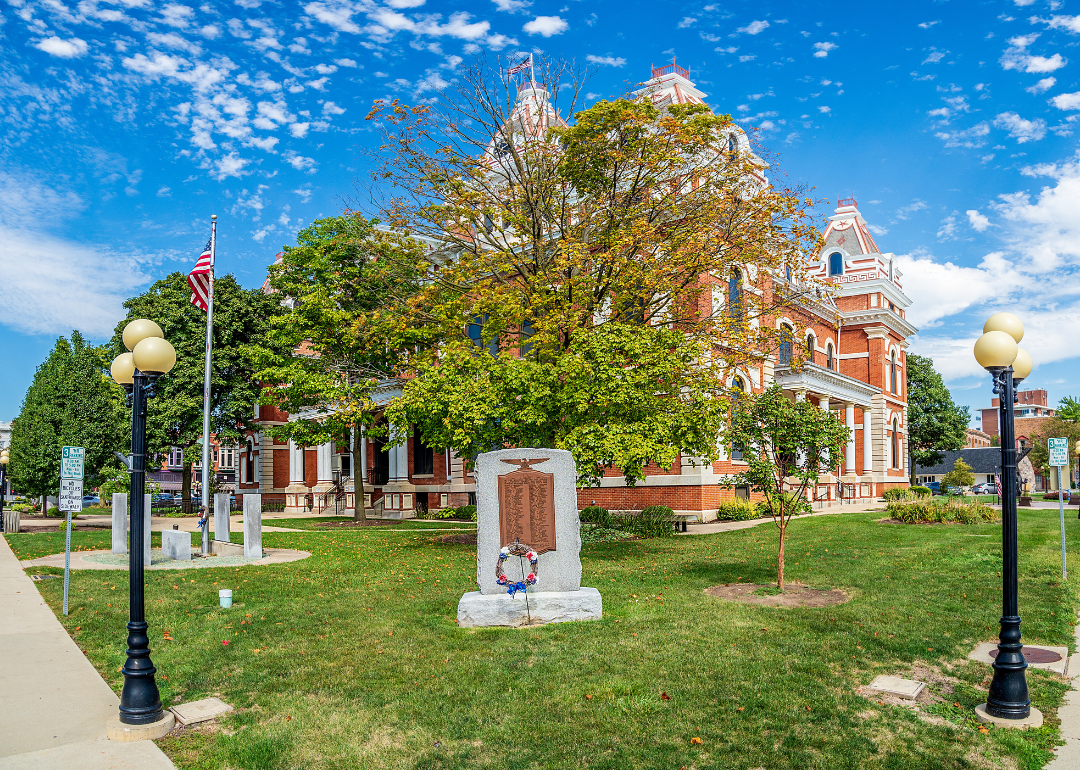
Livingston County, Illinois, sits in the heart of the state’s corn belt, where fertile farmland, rail lines, and classic small towns define the landscape. Pontiac, the county seat, serves as a cultural hub with its Route 66 history, murals, museums, and welcoming downtown. Communities like Fairbury, Dwight, and Flanagan support a strong agricultural economy and close community ties.
The county blends rural tradition with local pride, from historic courthouses to seasonal fairs and parades. Residents enjoy quiet neighborhoods, school events, and weekend drives through open fields. Livingston County appeals to those who appreciate heritage, hometown values, and the steady rhythm of life rooted in Illinois soil.
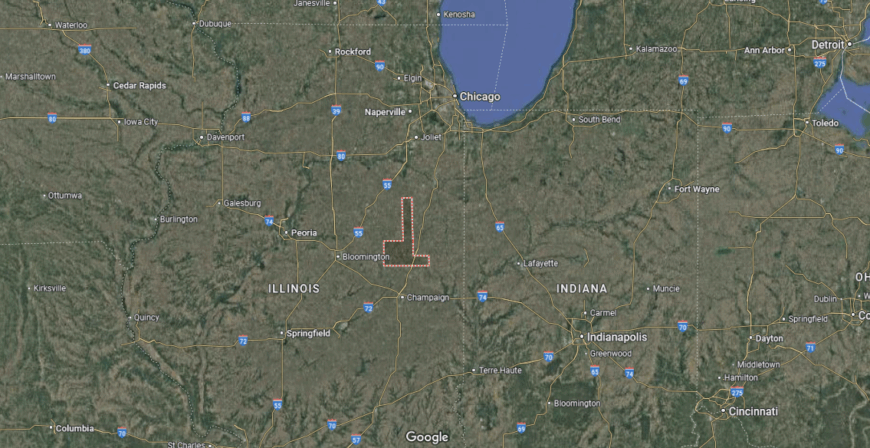
Where is Livingston County?
Livingston County sits in the heart of central Illinois, where flat fields stretch in every direction and grain elevators rise like mile markers across the prairie. About halfway between Bloomington and Joliet, it’s reached by Interstate 55 and old state highways that pass through rows of corn, soybeans, and roadside towns.
Pontiac anchors the county with murals, a classic courthouse square, and a deep connection to Route 66. Smaller towns like Fairbury, Dwight, and Flanagan echo a steady rural pace—built around schools, silos, and main streets unchanged for decades. It’s a place where the land runs long, and life holds close to the ground.
#41. Schuyler County
– Life expectancy: 76.0 years
— 2.0 years lower than the state average
You may also like: Where people in Illinois are moving to most

About
Schuyler County, Illinois, rests in the western part of the state, where wooded hills, winding creeks, and farmland shape a quiet, rural setting. Rushville, the county seat, anchors local life with a historic courthouse square, schools, and community traditions that reflect generations of small-town pride. Outlying areas offer scenic drives, wildlife, and a deep connection to the land.
Hunting, farming, and local festivals are woven into the county’s identity, with residents valuing independence, neighborly ties, and a slower pace of life. The landscape is marked by open skies and forested ridges that change with the seasons. Schuyler County draws those seeking space, simplicity, and a life grounded in nature and heritage.
Where is Schuyler County?
Schuyler County rests in western Illinois, where rolling hills, timbered ridges, and winding creeks break the flatness of the prairie. Tucked between the Illinois and Mississippi Rivers, it’s reached by rural highways that meander through forest edges, open pastures, and long stretches of silence.
Rushville anchors the county with a courthouse square and small-town rhythm, surrounded by woodlands, wildlife, and fields tucked into the folds of the land. Roads dip and rise, passing old barns and quiet hollows where deer move at dusk. It’s a place shaped more by ridge and tree than by grid, where time follows the contours of the earth.
#40. Macoupin County (tie)
– Life expectancy: 75.9 years
— 2.1 years lower than the state average
About
Macoupin County, Illinois, stretches across the southwestern part of the state with a blend of prairie farmland, coal mining heritage, and classic Midwestern towns. Carlinville, the county seat, stands out with its historic courthouse square, brick streets, and distinctive “Standard Addition” homes once built for coal miners.
The area balances tradition with small-town charm—residents gather for local festivals, high school sports, and community dinners. Rolling fields and quiet roads connect tight-knit neighborhoods where generations stay close. Macoupin County appeals to those who value history, resilience, and the steady rhythms of rural Illinois life.
Where is Macoupin County?
Macoupin County stretches across southwestern Illinois, where broad fields, coal country roots, and courthouse towns define the landscape. About 40 miles north of St. Louis, it’s reached by Illinois Routes 4 and 16, rolling past silos, rail crossings, and long rural vistas.
Carlinville anchors the county with its distinctive red-brick square and storied “Million Dollar Courthouse,” while Gillespie, Staunton, and Virden reflect the area’s mining and agricultural past. Rows of corn meet aging rail lines, and quiet roads lead through towns that still gather around grain elevators and high school games.
#39. Peoria County (tie)
– Life expectancy: 75.9 years
— 2.1 years lower than the state average
About
Peoria County, Illinois, blends urban energy with riverfront charm and rich agricultural surroundings in the heart of central Illinois. Anchored by the city of Peoria, the region balances its industrial legacy with innovation in healthcare, education, and the arts. Smaller communities like Chillicothe, Dunlap, and Elmwood contribute to a diverse landscape of neighborhoods, farmland, and forest preserves.
Peoria serves as the economic and cultural hub with hospitals, universities, and a lively downtown along the Illinois River. Residents enjoy a mix of museums, music festivals, river trails, and historic districts. Peoria County appeals to those seeking a vibrant yet grounded lifestyle, where city access meets small-town warmth and natural beauty.
Where is Peoria County?
🔥 Would you like to save this?
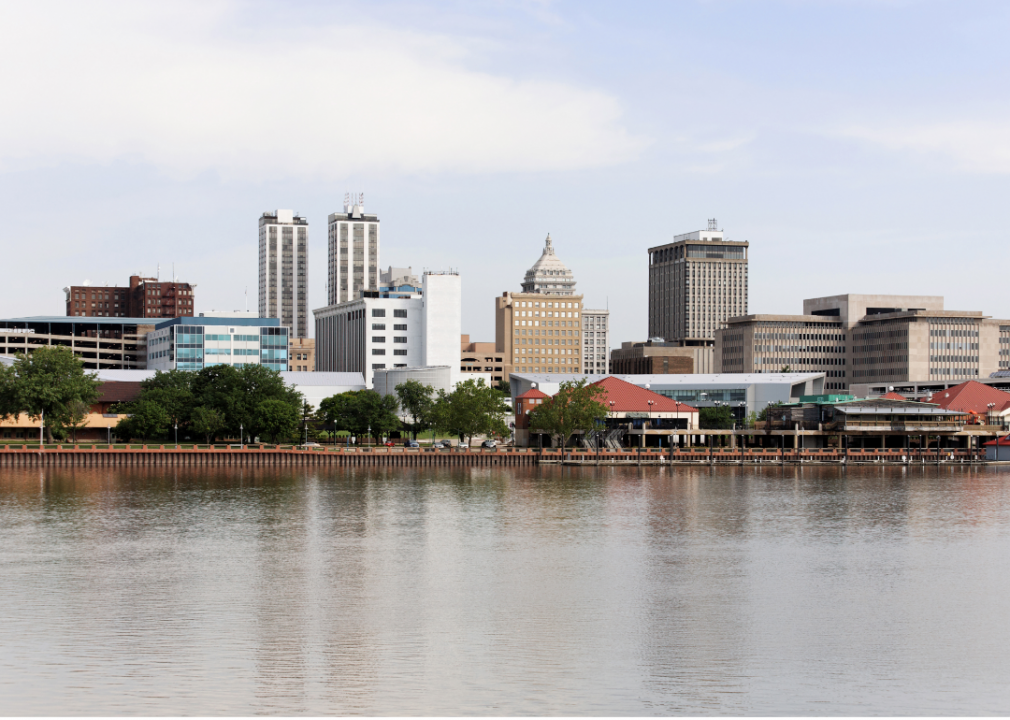
Peoria County sits along the Illinois River in central Illinois, where wooded bluffs overlook wide waters and the city rises with a mix of industry, neighborhoods, and old riverfront charm. It’s reached by Interstates 74 and 474, curving through both urban sprawl and pockets of farmland and forest.
Peoria anchors the county with deep manufacturing roots, cultural institutions, and a skyline that follows the river’s bend. Beyond the city, places like Bartonville, Chillicothe, and Dunlap move with a slower rhythm—fields, small schools, and quiet roads beneath the trees.
#38. Cass County (tie)
– Life expectancy: 75.8 years
— 2.2 years lower than the state average
About
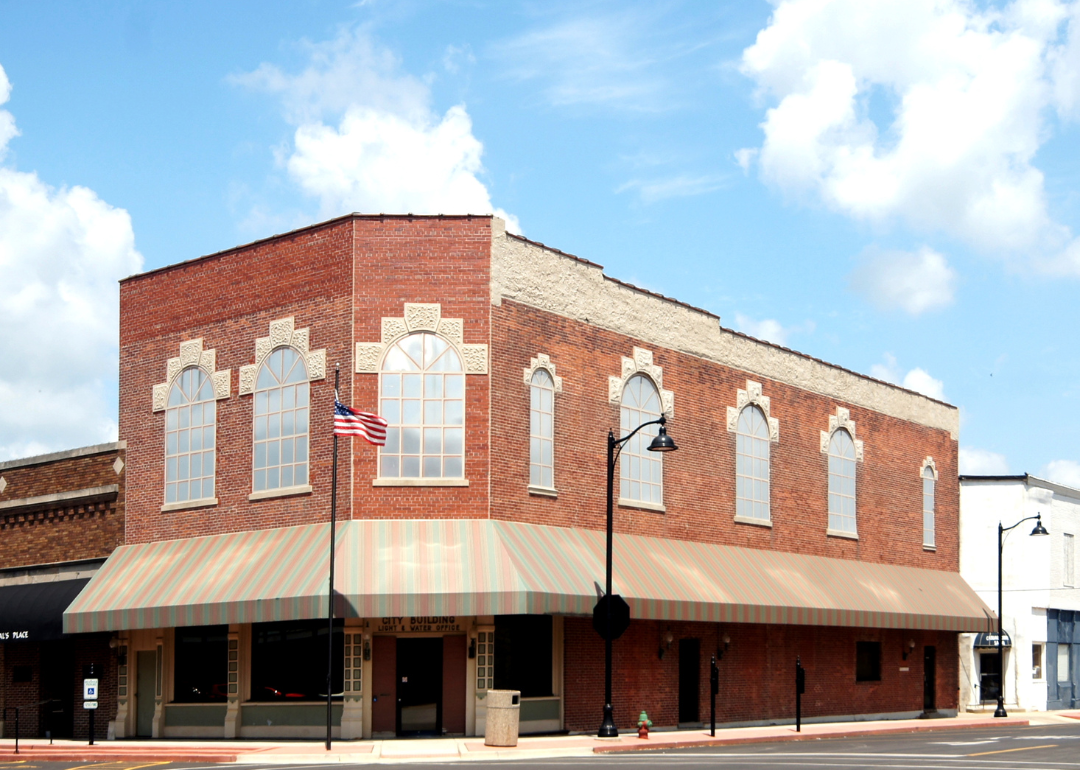
Cass County, Illinois, is a quiet, rural county in the west-central part of the state, where farmland, forests, and river valleys shape a steady, small-town way of life. Beardstown, the county seat, sits along the Illinois River and reflects the area’s mix of agricultural strength and multicultural heritage. Towns like Virginia, Ashland, and Chandlerville offer close-knit communities rooted in tradition and self-reliance.
The landscape supports farming, hunting, and outdoor recreation, with nearby state parks and conservation areas offering peaceful escapes. Local life centers around school events, seasonal festivals, and a strong sense of neighborly pride. Cass County draws those who value simplicity, heritage, and a lifestyle grounded in land and community.
Where is Cass County?
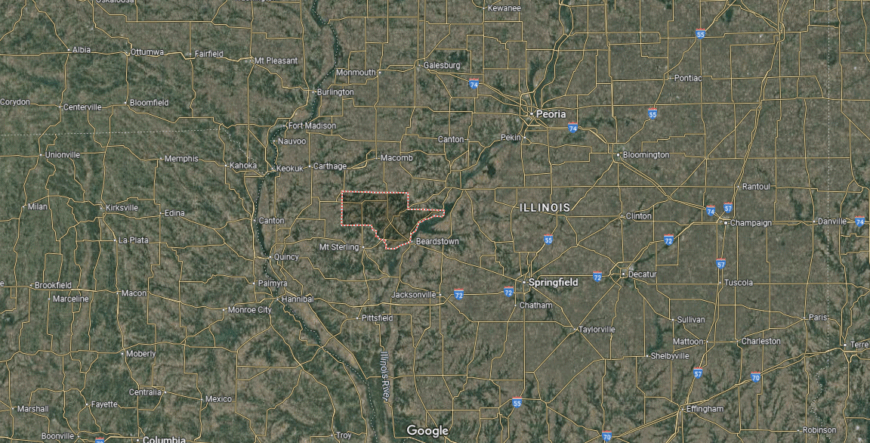
Cass County lies in west-central Illinois, where fields meet forest and the Illinois River curves gently past the county’s edge. About 40 miles west of Springfield, it’s reached by state highways that pass through farmland, wooded ridges, and towns with deep rural roots.
Beardstown anchors the county along the river with grain elevators, historic streets, and a long tradition of trade and labor. Further inland, towns like Virginia and Ashland move to the rhythm of farming seasons and community ties. It’s a place where the land holds memory, the river moves slow, and life stays close to the ground.
#37. Perry County (tie)
– Life expectancy: 75.8 years
— 2.2 years lower than the state average
About
Perry County, Illinois, lies in the southern part of the state, where coal country roots and agricultural fields stretch across a landscape of lakes, forests, and quiet towns. Du Quoin serves as the county’s largest city and cultural hub, known for hosting the historic Du Quoin State Fair and offering schools, shops, and local tradition.
The county’s natural features include Pyramid State Recreation Area and other outdoor spaces that support hunting, fishing, and hiking. Life here is shaped by hard work, hometown values, and strong community ties. Perry County appeals to those seeking rural calm, local events, and the familiar rhythm of Southern Illinois living.
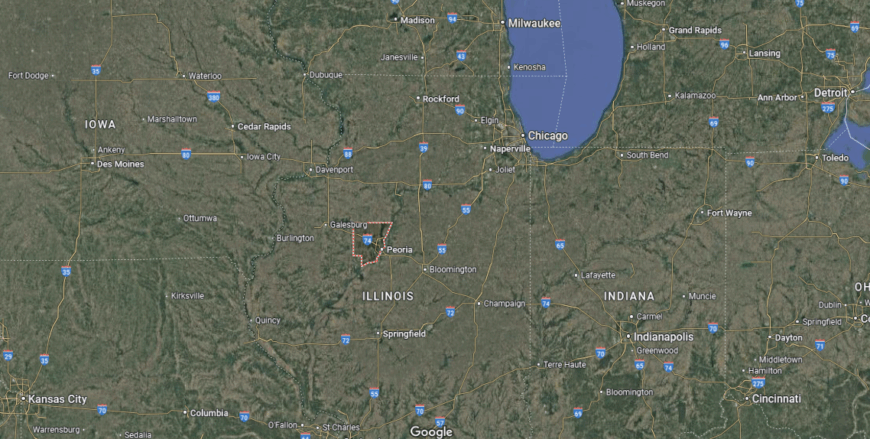
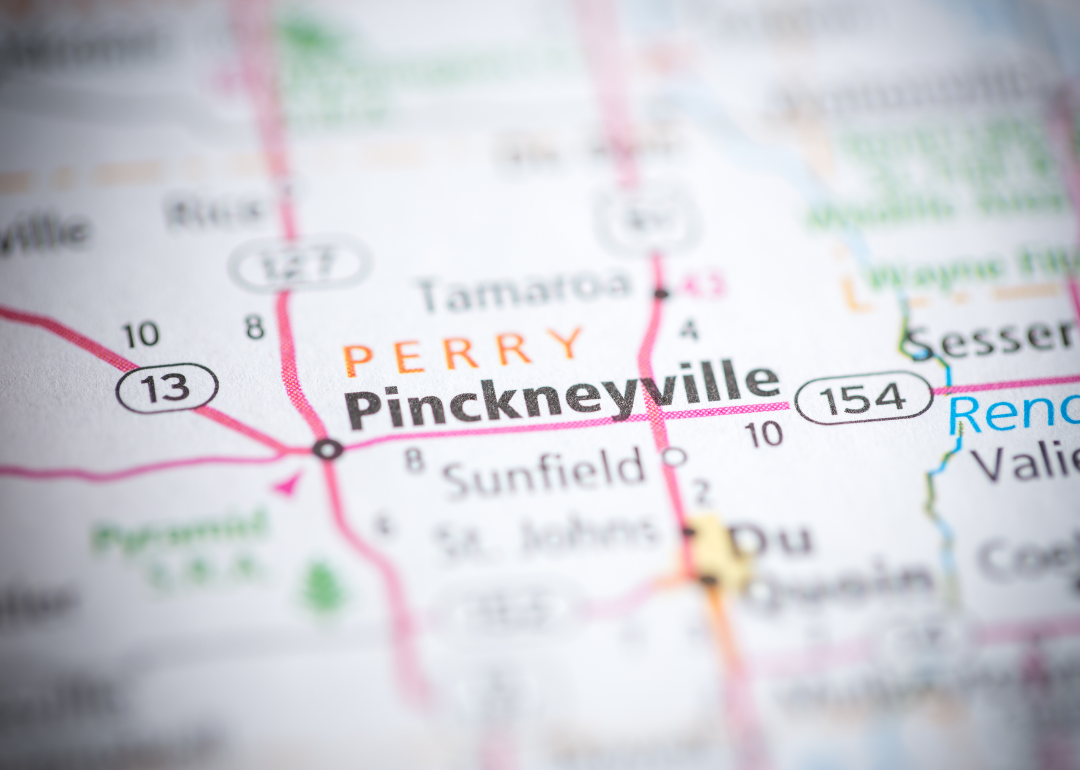
Where is Perry County?
Perry County rests in southern Illinois, where flat farmland gives way to lakes, timber stands, and towns shaped by coal and clay. About 80 miles southeast of St. Louis, it’s reached by Illinois Routes 13 and 127, crossing quiet roads lined with grain bins, rail lines, and fading company houses.
Du Quoin anchors the county with its fairgrounds, racetrack, and a history tied to mining and rail, while Pinckneyville holds a steadier civic rhythm beneath broad skies. Lakes like Carlyle and County Lake break up the farmland with water and woods, offering stillness at the edge of town. It’s a place built on work and weather, where the land holds stories and the pace stays rooted.
#36. Moultrie County (tie)
– Life expectancy: 75.7 years
— 2.3 years lower than the state average
You may also like: Best scenic drives in Illinois
About
Moultrie County, Illinois, is a small, centrally located county where farmland stretches to the horizon and community life remains close-knit. Sullivan, the county seat, anchors the area with schools, local theater, and a historic town square that reflects generations of civic pride. Other communities like Lovington, Bethany, and Dalton City support the county’s strong agricultural foundation.
Lake Shelbyville touches the northern edge, offering recreation and natural beauty in an otherwise pastoral landscape. Residents value neighborly ties, local traditions, and a steady pace shaped by rural routines. Moultrie County appeals to those who appreciate open space, simple living, and deep community roots in the heart of Illinois.
Where is Moultrie County?
Moultrie County lies in the east-central part of Illinois, where long fields, narrow highways, and quiet towns form a calm patch of prairie life. It’s reached by State Routes 121 and 32, passing through soybeans, cornfields, and wide skies stretching over the horizon.
Sullivan, the county seat, anchors the area with a courthouse square and a close-knit rhythm, while Lake Shelbyville edges into the northern side, adding woods, water, and weekend ease. The land here is level and lived-in, shaped by farming hands and the steady turn of seasons. It’s a place where time moves gently, and the view changes more with the crops than the years.
#35. Madison County (tie)
– Life expectancy: 75.7 years
— 2.3 years lower than the state average
About
Madison County, Illinois, lies just east of St. Louis along the Mississippi River, where industrial legacy, higher education, and riverfront communities converge. Anchored by cities like Edwardsville and Alton, the county balances economic growth with historic neighborhoods, scenic bluffs, and a network of trails and parks. The region blends manufacturing, healthcare, education, and a strong civic identity.
Edwardsville serves as the county seat with Southern Illinois University Edwardsville (SIUE), a thriving business district, and family-friendly neighborhoods, while Alton offers river views, historic architecture, and a growing arts scene. Residents enjoy biking along the levee trails, exploring local history, and easy access to metro St. Louis.
Where is Madison County?
Madison County stretches along the Mississippi River in southwestern Illinois, where levees, industry, and farmland meet just across from St. Louis. It’s reached by Interstates 55, 70, and 255, running through a mix of factory towns, open fields, and metro-area suburbs.
Edwardsville anchors the county with a university-town feel and historic brick streets, while Alton, Granite City, and Collinsville reflect deep labor roots and riverfront history. Old quarries, rail yards, and grain terminals still shape the land, even as bike trails and bluffs offer quiet edges. It’s a place of movement and memory—where steel, soil, and story all run deep.
#34. Christian County (tie)
– Life expectancy: 75.6 years
— 2.4 years lower than the state average
🔥 Would you like to save this?
About
Christian County, Illinois, sits in the central part of the state, where fertile farmland and small-town values shape a steady, rural lifestyle. Taylorville, the county seat, anchors the region with a historic courthouse square, schools, and a strong sense of community. Towns like Pana, Assumption, and Morrisonville contribute to the county’s agricultural backbone and hometown traditions.
Local life centers around seasonal fairs, high school sports, and neighborly gatherings, while nearby lakes and parks offer space for fishing, camping, and family outings. The economy is rooted in farming, small businesses, and a workforce proud of its heritage. Christian County appeals to those who appreciate simple living, strong roots, and the quiet rhythms of central Illinois.
Where is Christian County?
Christian County lies in the heart of central Illinois, where flat farmland stretches in all directions and small towns rise at gentle intervals along the grid. About 30 miles southeast of Springfield, it’s reached by State Routes 29 and 48, tracing paths past fields, grain bins, and quiet crossings.
Taylorville anchors the county with a classic courthouse square and deep farming ties, while towns like Pana, Assumption, and Morrisonville echo with local pride and seasonal rhythms. The horizon runs wide here, and the pace is shaped by soil and sky. It’s a place where roots go deep—into both the ground and the community.
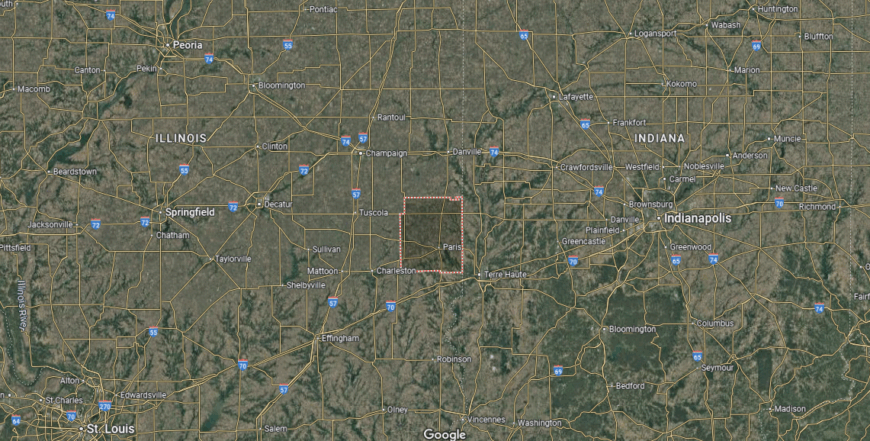
#33. Clark County (tie)
– Life expectancy: 75.6 years
— 2.4 years lower than the state average

About
Clark County, Illinois, lies along the eastern border of the state, where rolling farmland and wooded creeks stretch toward the Wabash River. Marshall, the county seat, blends historic charm with civic life, offering a walkable downtown, local schools, and strong community traditions. Other towns like Casey—famous for its collection of “world’s largest” items—add a quirky, welcoming spirit to the region.
Agriculture remains the backbone of the local economy, supported by family farms and small-town businesses. Residents enjoy local festivals, covered bridges, and quiet drives through open country. Clark County appeals to those who value rural heritage, neighborly ties, and a peaceful lifestyle rooted in the landscape of southeastern Illinois.
Where is Clark County?
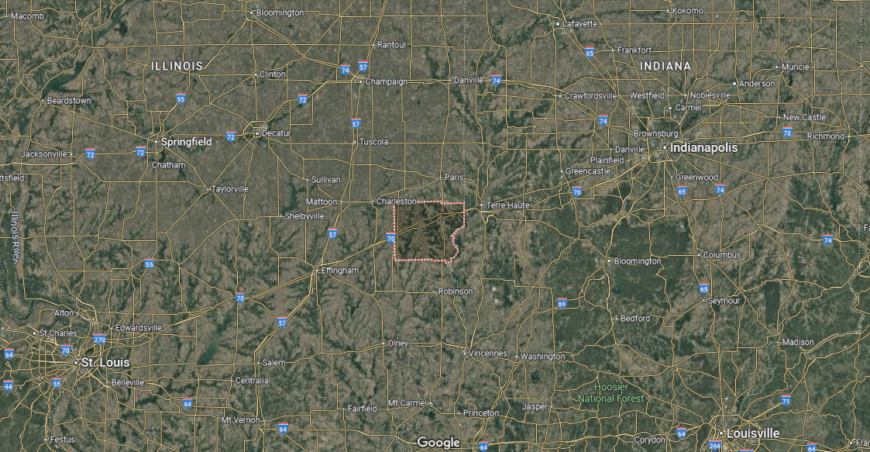
Clark County rests along the eastern border of Illinois, where farmland rolls gently toward the Wabash River and small towns cluster along old stagecoach routes. About 20 miles west of Terre Haute, Indiana, it’s reached by Interstate 70 and U.S. Route 40, which follow the path of the historic National Road.
Marshall anchors the county with brick streets, a courthouse square, and a rhythm tied to agriculture and tradition, while towns like Casey and Martinsville keep close to their roots—with giant roadside attractions and quiet main streets. The land here is open and dependable, shaped by time, travel, and the steady work of rural life. It’s a place where history lingers just beneath the fields.
#32. Knox County
– Life expectancy: 75.5 years
— 2.5 years lower than the state average
About
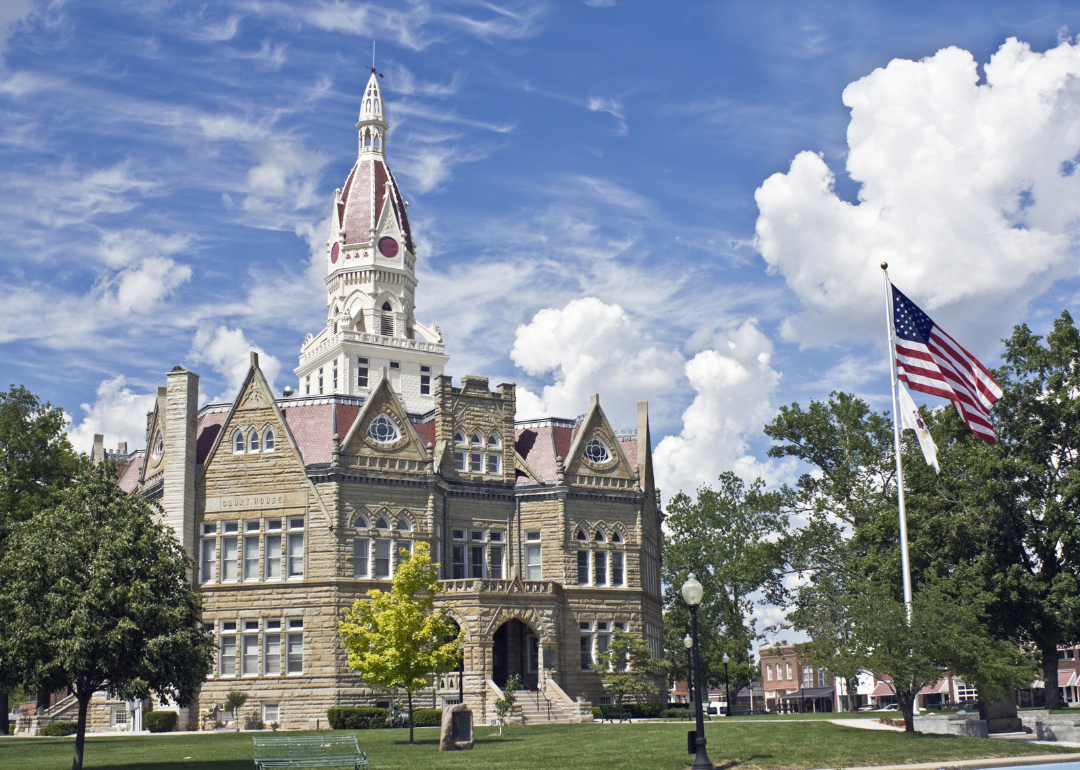
Knox County, Illinois, rests in the west-central region of the state, where prairie landscapes meet a legacy of education, industry, and Midwestern resilience. Galesburg, the county seat, serves as a cultural and economic anchor with its historic downtown, Amtrak hub, and institutions like Knox College. Towns such as Abingdon, Knoxville, and Yates City reflect the county’s agricultural strength and community pride.
Galesburg blends arts, rail history, and higher education, while rural areas offer open skies, family farms, and quiet routines. Residents enjoy local festivals, historic architecture, and strong school traditions. Knox County appeals to those who seek a grounded lifestyle—where culture, community, and countryside meet in equal measure.
Where is Knox County?
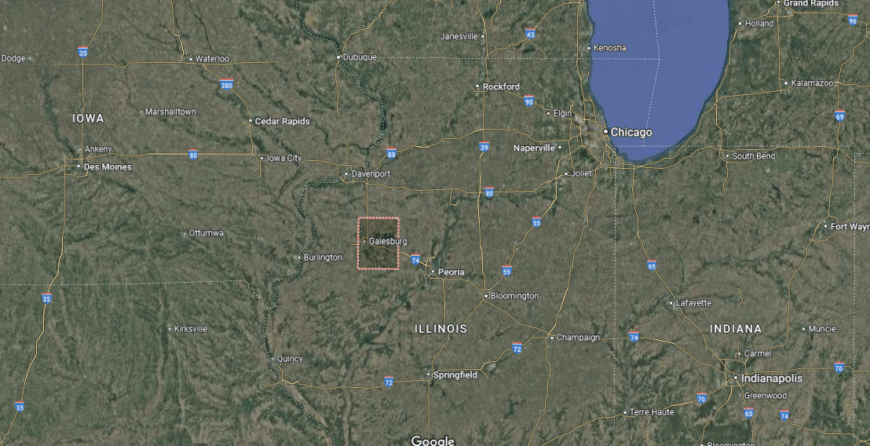
Knox County stretches across west-central Illinois, where prairies roll gently under wide skies and town squares still anchor everyday life. About 45 miles northwest of Peoria, it’s reached by U.S. Routes 34 and 150, crossing farmland, rail lines, and tree-lined streets.
Galesburg serves as the cultural and civic heart, home to Knox College, historic rail yards, and a legacy tied to both Abraham Lincoln and Carl Sandburg. Smaller towns like Abingdon and Oneida carry on with quiet resolve—surrounded by crops, silos, and school pride. It’s a place where heritage and horizon meet, steady and rooted in the rhythms of the land.
#31. Pike County (tie)
– Life expectancy: 75.4 years
— 2.6 years lower than the state average
You may also like: The most popular poker players in Illinois

About
Pike County, Illinois, stretches across the western edge of the state, where river bluffs, farmland, and wooded hollows shape a landscape steeped in history and natural beauty. Pittsfield, the county seat, anchors the region with a historic courthouse square, local schools, and a deep connection to Abraham Lincoln’s legal circuit. Small towns like Barry, Griggsville, and Pleasant Hill reflect a strong agricultural heritage and close-knit community life.
The Mississippi and Illinois Rivers frame the county, offering outdoor recreation like hunting, fishing, and scenic drives along winding byways. Life moves with the seasons—marked by fairs, harvests, and neighborly traditions. Pike County appeals to those who value heritage, quiet country living, and a place where the land and community endure together.
Where is Pike County?
Pike County lies in western Illinois, where the Mississippi and Illinois Rivers frame a landscape of rolling hills, wooded bluffs, and farmland tucked between ridge and valley. About halfway between Quincy and Springfield, it’s reached by U.S. Route 54 and State Route 100, curving through hollows, historic towns, and forested backroads.
Pittsfield anchors the county with a classic square, rich Lincoln-era history, and community pride, while smaller towns like Barry, Griggsville, and Pleasant Hill keep close to the rhythms of land and season. This is a place where deer move at dusk, creeks run clear, and time feels tied to timber, field, and family. It’s Illinois at its most rugged and quietly enduring.
#30. Kankakee County (tie)
– Life expectancy: 75.4 years
— 2.6 years lower than the state average
About
Kankakee County, Illinois, lies just south of the Chicago metro area, where city access meets small-town charm and a rich mix of culture, agriculture, and natural beauty. Anchored by the city of Kankakee, the county also includes Bourbonnais, Bradley, and Momence—each contributing to a diverse landscape shaped by rivers, colleges, and industry.
Kankakee serves as the civic and cultural center with hospitals, museums, and a revitalizing downtown, while Bourbonnais adds energy through Olivet Nazarene University and suburban growth. Residents enjoy farmers markets, riverfront trails, and strong community events.
Where is Kankakee County?
Kankakee County sits in northeastern Illinois, where the Kankakee River winds through limestone banks, flat farmland, and a mix of city and small-town life. About 60 miles south of Chicago, it’s reached by Interstate 57 and State Route 17, crossing rail lines, river bridges, and open fields.
Kankakee and Bourbonnais anchor the region with a blend of industry, colleges, and neighborhood streets, while outlying towns like Manteno and Momence carry rural roots and quiet charm. The river runs steady through it all—shaping parks, powering mills, and offering a calm thread through the county’s working landscape.
#29. Fulton County (tie)
– Life expectancy: 75.3 years
— 2.7 years lower than the state average
About
Fulton County, Illinois, spans a mix of wooded hills, lakes, and rich farmland in the west-central part of the state. Canton, the county seat, serves as the economic and cultural hub with a historic downtown, healthcare facilities, and community events that bring neighbors together. Towns like Lewistown, Farmington, and Havana reflect the county’s deep agricultural roots and strong local identity.
The area is home to parts of the Emiquon Preserve and other wetlands along the Illinois River, offering opportunities for birdwatching, fishing, and nature walks. Life moves with the seasons, shaped by small-town traditions and open landscapes. Fulton County appeals to those who appreciate natural beauty, rural resilience, and a lifestyle built on land, history, and hometown pride.
Where is Fulton County?
Fulton County spreads across west-central Illinois, where timbered hills and reclaimed lakes break the monotony of the prairie. About 45 miles southwest of Peoria, it’s reached by State Routes 9 and 100, winding through small towns, farm fields, and wooded ridgelines.
Canton anchors the county with a legacy of manufacturing and a broad town square, while Lewistown, Cuba, and Farmington keep close to the land and their deep community roots. Spoon River weaves through the county like a soft current of history and folklore, and old strip mines now brim with quiet water and wildlife. It’s a place where nature and memory linger—unrushed, resilient, and grounded in the land.
#28. Winnebago County (tie)
– Life expectancy: 75.3 years
— 2.7 years lower than the state average
About
Winnebago County, Illinois, anchors the northern part of the state with a blend of urban energy, manufacturing legacy, and natural beauty along the Rock River. Rockford, the county seat and third-largest city in Illinois, serves as the region’s cultural, economic, and medical hub—home to museums, colleges, and a growing revitalization movement.
The county combines industrial heritage with green space, including parks, forest preserves, and bike paths that wind through both city and countryside. Residents enjoy a mix of urban amenities and outdoor access, from arts and sports to riverfront recreation. Winnebago County appeals to those seeking affordability, diversity, and a community rooted in both grit and growth.
Where is Winnebago County?
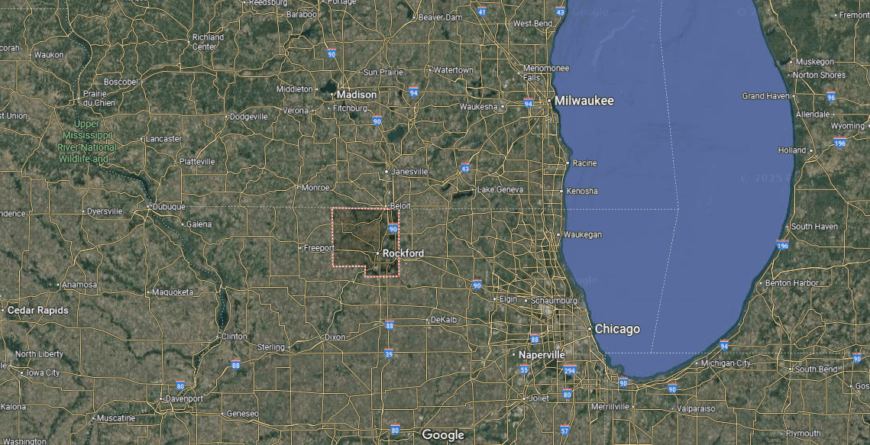
Winnebago County rests in northern Illinois along the Rock River, where midwestern industry, urban neighborhoods, and green corridors meet. About 90 miles northwest of Chicago, it’s reached by Interstates 39 and 90, crossing farmland and forest as the city of Rockford rises from the riverbanks.
Rockford anchors the county with a history of manufacturing, tree-lined streets, and a cultural core of museums, parks, and music halls. Outside the city, towns like Loves Park, Machesney Park, and Durand stretch toward farmland and forest preserves. It’s a place where the hum of the city meets the quiet of the north woods—resilient, rooted, and always in motion.
#27. Greene County (tie)
– Life expectancy: 75.3 years
— 2.7 years lower than the state average

About
Greene County, Illinois, sits in the southwest part of the state, where rolling farmland, wooded creeks, and quiet towns define a landscape rich in rural tradition. Carrollton, the county seat, anchors local life with its historic courthouse, schools, and strong community spirit. Towns like White Hall, Greenfield, and Roodhouse add to the county’s identity with deep agricultural roots and small-town pride.
The area offers scenic drives, seasonal festivals, and a pace of life shaped by the land and close connections. Farming remains central to the economy, along with local businesses and generational family ties. Greene County appeals to those who value simplicity, heritage, and the enduring rhythm of southern Illinois living.
Where is Greene County?
Greene County lies in southwestern Illinois, where the land rolls gently toward the Illinois River and farm towns rise between wooded creeks and patchwork fields. About 60 miles north of St. Louis, it’s reached by State Routes 67 and 108, winding through countryside that holds more history than hurry.
Carrollton, the county seat, anchors the region with a stately courthouse and streets lined with homes that remember another era, while towns like White Hall, Greenfield, and Roodhouse keep a steady, grounded pace. The land here moves with the seasons—planting, harvest, quiet winters—and the sky always feels close. It’s a place shaped by time, soil, and stories passed down the road.
#26. Jersey County (tie)
– Life expectancy: 75.2 years
— 2.8 years lower than the state average
You may also like: Counties with the worst commutes in Illinois
About
Jersey County, Illinois, rests where the Illinois and Mississippi Rivers meet, offering bluffside views, fertile farmland, and historic small-town charm. Jerseyville, the county seat, serves as the central hub with schools, healthcare, and a mix of local shops and preserved architecture. Towns like Grafton and Elsah add riverfront appeal, tourism, and a deep connection to the county’s early settlement history.
Outdoor recreation is a defining feature, with nearby Pere Marquette State Park drawing visitors for hiking, eagle watching, and scenic drives along the Great River Road. Life here blends natural beauty with community traditions and agricultural strength. Jersey County appeals to those who seek quiet river towns, outdoor access, and a lifestyle rooted in both history and heartland values.
Where is Jersey County?
Jersey County rests along the western edge of Illinois, where limestone bluffs rise above the Mississippi and Illinois Rivers, and rolling farmland stretches inland toward quiet towns. About 45 miles north of St. Louis, it’s reached by Illinois Routes 3 and 16, curving through river valleys, orchards, and ridge-top views.
Jerseyville anchors the county with a broad main street and deep agricultural roots, while towns like Grafton and Elsah hug the bluffs, their buildings nestled between rock and river. Pere Marquette State Park looms large, offering forest trails and sweeping overlooks above the water. It’s a place where the land lifts and turns, and where stillness carries on the wind off the river.
#25. Macon County (tie)
– Life expectancy: 75.2 years
— 2.8 years lower than the state average
About
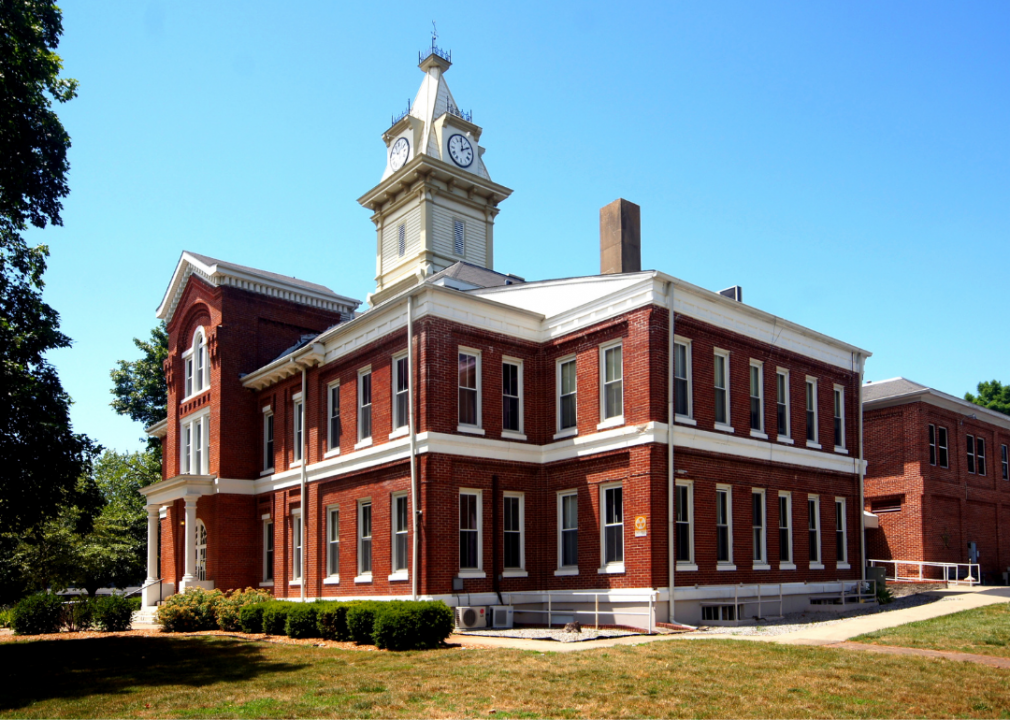
Macon County, Illinois, lies in the heart of the state, where prairie landscapes meet industrial legacy and urban convenience. Decatur, the county seat and economic center, anchors the region with its manufacturing base, healthcare systems, and Millikin University. Surrounding towns like Forsyth, Mount Zion, and Maroa add suburban balance and strong community ties.
Lake Decatur provides recreation and scenic value, while local parks, museums, and events support a vibrant civic life. The economy blends agribusiness with logistics and education, reflecting the county’s strategic location and hardworking spirit. Macon County appeals to those looking for affordability, access to amenities, and a lifestyle that balances progress with small-town pride.
Where is Macon County?
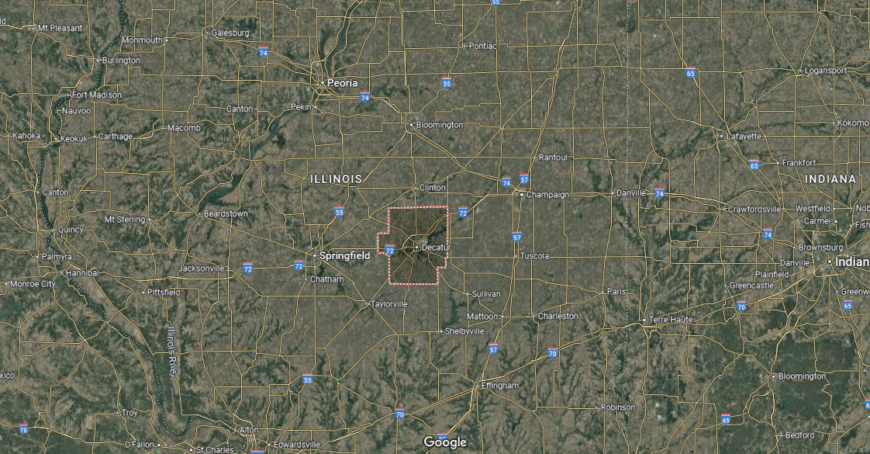
Macon County sits in the middle of Illinois, where rail lines, factories, and cornfields meet beneath a wide prairie sky. It’s anchored by Decatur, a city shaped by industry, soybeans, and the bend of Lake Decatur along its southern edge. Reached by U.S. Routes 51 and 36, the county is crisscrossed with grain elevators, highways, and fields stretching to the horizon.
Surrounding towns like Forsyth, Mount Zion, and Argenta move at a quieter pace, holding close to schools, fields, and local tradition. The air often carries the scent of earth and grain, and the land speaks in rows, silos, and steel. It’s a place where Illinois feels honest and unadorned—grounded in labor, land, and legacy.
#24. Edwards County (tie)
– Life expectancy: 75.1 years
— 2.9 years lower than the state average
About
Edwards County, Illinois, is one of the state’s smallest by area and population, offering a peaceful, rural setting in southeastern Illinois. Albion, the county seat, anchors the region with a quaint courthouse square, local schools, and a strong sense of tradition. West Salem and other small communities contribute to the county’s agricultural backbone and close-knit social fabric.
Life here is marked by quiet streets, family farms, and generations of community ties. Residents value local events, neighborly support, and the simplicity of daily routines shaped by the land. Edwards County appeals to those who seek solitude, heritage, and a grounded lifestyle in the heart of Illinois farm country.
Where is Edwards County?
Edwards County lies in southeastern Illinois, one of the state’s smallest by land and population, where narrow roads thread through low hills, creeks, and quiet farmland. About 40 miles west of Evansville, Indiana, it’s reached by Illinois Routes 1 and 130, passing fields, pastures, and woods touched by early statehood history.
Albion anchors the county with a courthouse square, English roots, and a pace that hasn’t hurried in generations, while West Salem and smaller communities carry the same sense of steadiness. The landscape is modest but familiar—marked by fencerows, grain bins, and front porch quiet. It’s a place where time runs slow and every name is known.
#23. Wayne County (tie)
– Life expectancy: 75.1 years
— 2.9 years lower than the state average
About
Wayne County, Illinois, sits in the southeastern part of the state, where fertile fields, quiet woodlands, and a strong rural character define everyday life. Fairfield, the county seat, serves as the central hub with local schools, healthcare, and a blend of historic charm and community pride. Towns like Cisne, Wayne City, and Johnsonville contribute to the region’s deep agricultural roots and tight-knit atmosphere.
Farming drives the local economy, supported by family-owned businesses and a tradition of self-reliance. Residents enjoy local fairs, school events, and outdoor activities that follow the rhythm of the seasons. Wayne County appeals to those who value tradition, open space, and the steady pace of life in southern Illinois.
Where is Wayne County?
Wayne County lies in southeastern Illinois, where flat fields, scattered woodlots, and oil pumpjacks mark a landscape shaped by farming and industry. About 100 miles east of St. Louis, it’s reached by U.S. Route 45 and Illinois Route 15, crossing through wide prairie stretches and small, close-knit towns.
Fairfield anchors the county with a courthouse square and deep roots in agriculture and oil, while communities like Cisne, Wayne City, and Johnsonville keep pace with the land and the seasons. Roads are long, traffic is rare, and the sky feels big above every acre. It’s a place where tradition holds steady and life stays close to the ground.
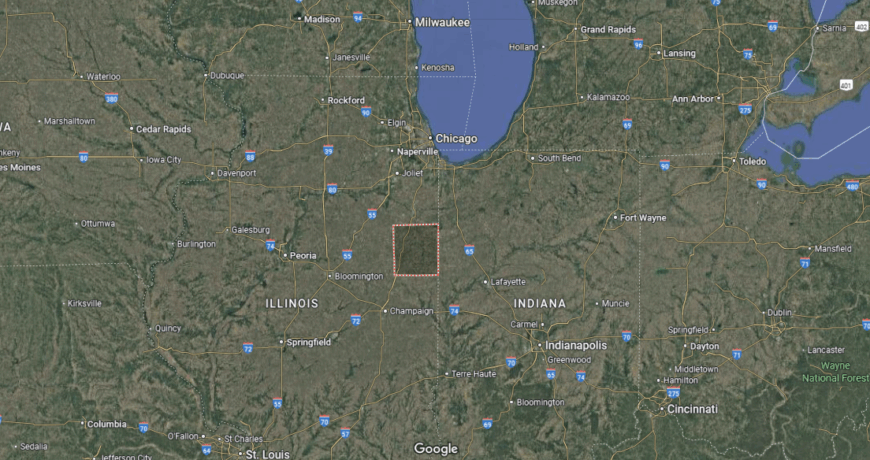
#22. Ford County (tie)
– Life expectancy: 75.1 years
— 2.9 years lower than the state average
About
Ford County, Illinois, is the state’s smallest by population, offering wide-open farmland, peaceful towns, and a lifestyle rooted in rural tradition. Paxton, the county seat, anchors the area with historic architecture, local businesses, and a strong sense of civic pride. Towns like Gibson City, Piper City, and Sibley reflect the county’s agricultural foundation and close community bonds.
The landscape is marked by cornfields, grain elevators, and quiet two-lane roads stretching across the prairie. Residents value neighborly ties, school spirit, and the steady rhythms of small-town life. Ford County appeals to those seeking simplicity, open skies, and a grounded connection to Illinois heartland living.
Where is Ford County?
Ford County rests in east-central Illinois, where level fields stretch in every direction and towns rise like quiet mile markers on the prairie. It’s the state’s smallest by area, reached by U.S. Routes 24 and 45, where grain elevators break the skyline and two-lane roads run straight and true.
Paxton anchors the county with a historic courthouse and steady rural pace, while smaller places like Gibson City and Piper City carry deep farming ties and local pride. The land here is open, the rhythm dependable, and the community grounded in hard work and neighborly ties. It’s a place where the horizon feels near, and everything moves with the seasons.
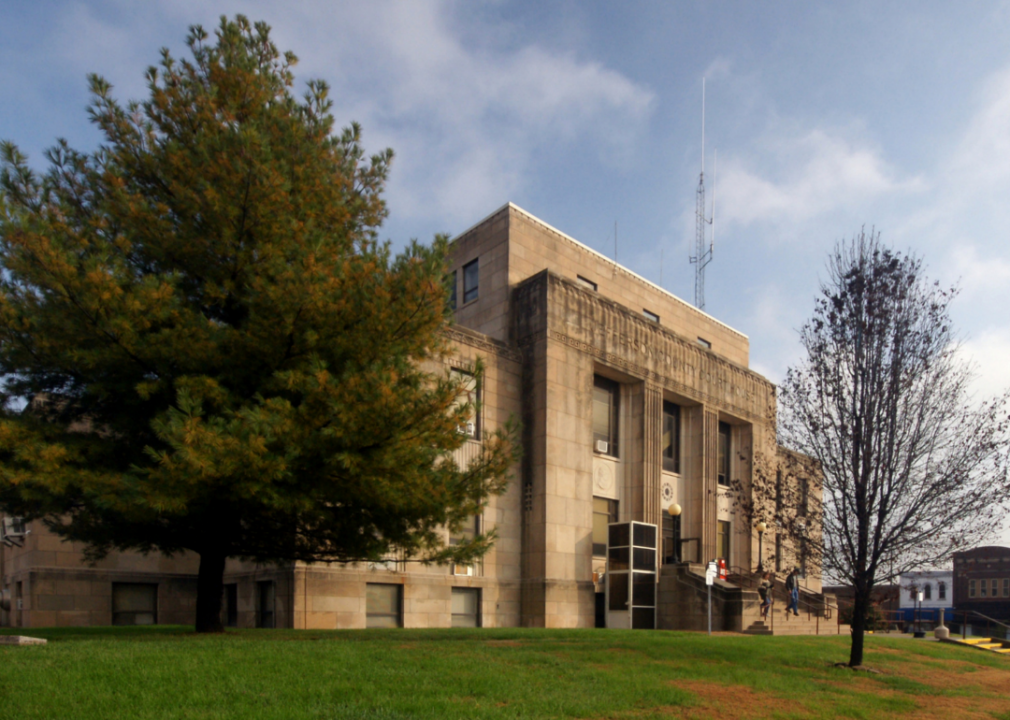
#21. Jefferson County (tie)
– Life expectancy: 75.0 years
— 3.0 years lower than the state average
You may also like: How road conditions in Illinois have deteriorated since 2000

About
Jefferson County, Illinois, lies at the crossroads of major highways and rail lines in the southern part of the state, blending small-town life with regional accessibility. Mount Vernon, the county seat, serves as a commercial and cultural hub with hospitals, schools, shopping centers, and a long-standing connection to transportation and industry. Communities like Ina, Dix, and Woodlawn contribute to the county’s agricultural roots and local character.
The area offers parks, museums, and seasonal fairs, with Rend Lake nearby providing fishing, camping, and outdoor recreation. Life in Jefferson County balances convenience with tradition, shaped by hardworking residents and a strong community fabric. It appeals to those who value rural resilience, access to amenities, and the steady pace of Southern Illinois living.
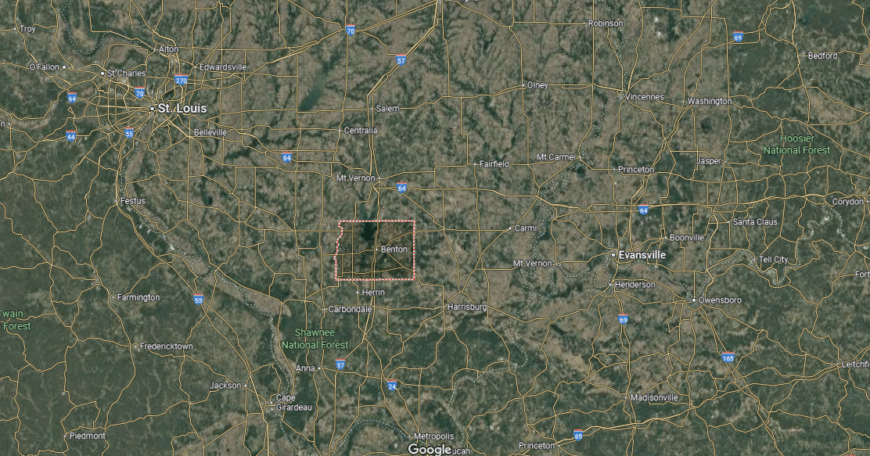
Where is Jefferson County?
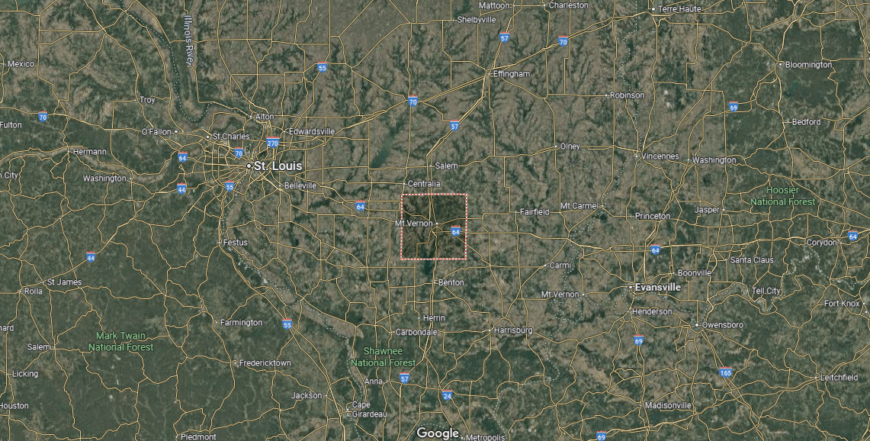
Jefferson County lies in south-central Illinois, where highways meet rail lines and fields give way to wooded creeks and scattered industry. About 80 miles southeast of St. Louis, it’s reached by the intersection of Interstates 57 and 64—making it a longtime hub of travel, trade, and connection.
Mt. Vernon anchors the county with a regional hospital, courthouse square, and a history built on railroads and manufacturing. Smaller towns like Ina, Dix, and Waltonville move with the slower rhythm of farming communities and local ties. It’s a place where movement passes through, but the heart of the county remains steady—rooted in labor, land, and resilience.
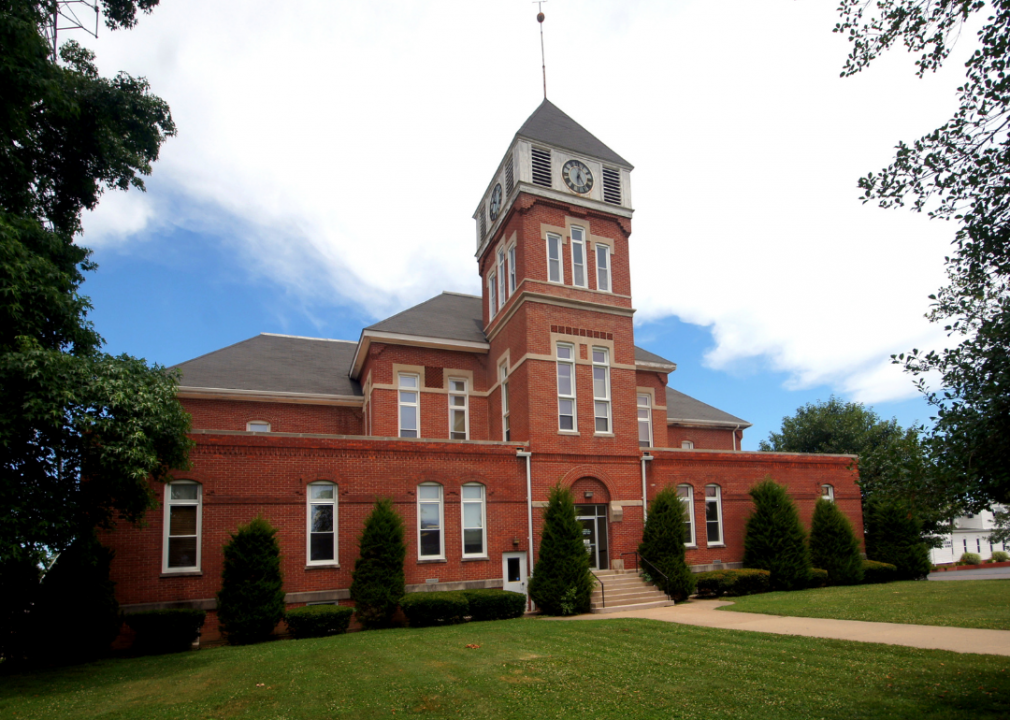
#20. Richland County (tie)
– Life expectancy: 75.0 years
— 3.0 years lower than the state average
About
Richland County, Illinois, rests in the southeastern part of the state, where gently rolling farmland and wooded creeks surround quiet towns with deep community roots. Olney, the county seat, is known for its resident white squirrels and serves as the civic and cultural heart with schools, parks, and local businesses that reflect small-town pride. Villages like Noble and Claremont contribute to the county’s strong agricultural identity and neighborly spirit.
Life here is shaped by seasonal rhythms—harvests, county fairs, and community events that bring people together. The local economy centers on farming, education, and small enterprises. Richland County appeals to those who appreciate simplicity, natural charm, and the comfort of familiar surroundings in the heart of rural Illinois.
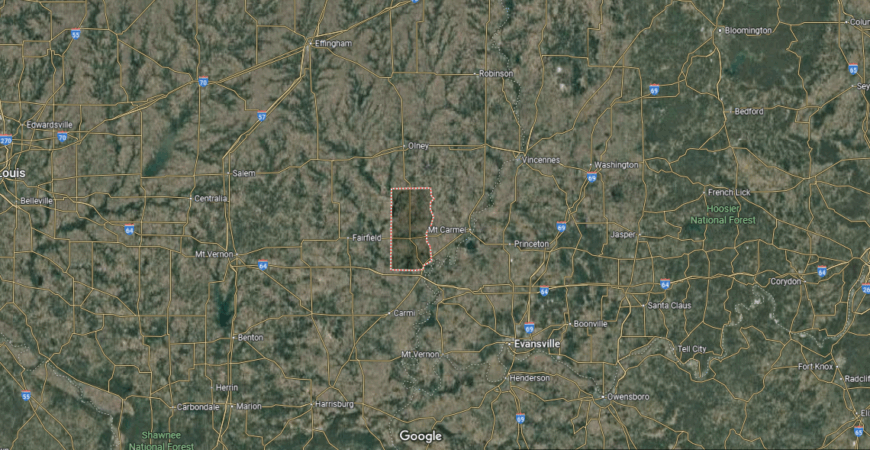
Where is Richland County?
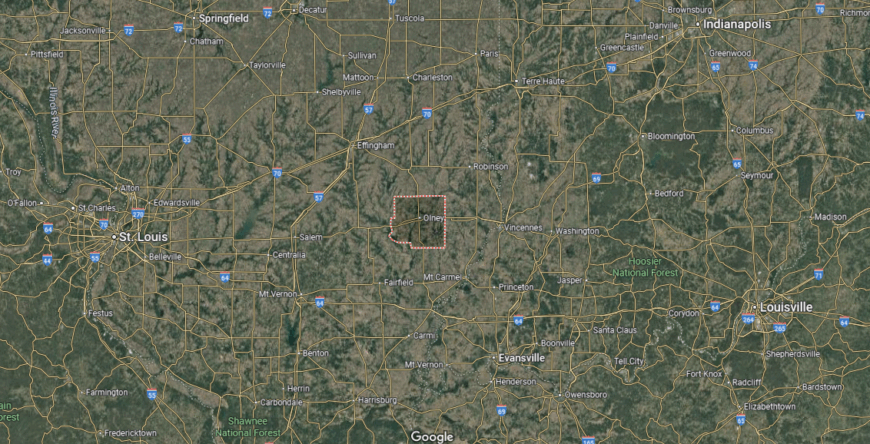
Richland County lies in southeastern Illinois, where open fields blend into low wooded hills and quiet roads trace the edge of forest and farmland. About 100 miles southeast of Springfield, it’s reached by Illinois Route 130 and U.S. Route 50, passing through rolling countryside and long-settled rural towns.
Olney anchors the county with shaded streets, a central square, and its famously roaming white squirrels, while smaller places like Claremont and Noble keep close to the land and their local roots. Creeks cut gentle paths through the fields, and the pace of life moves with the sun and soil. It’s a place of soft edges and deep familiarity—where stories stay rooted and the seasons speak first.
#19. Iroquois County (tie)
– Life expectancy: 75.0 years
— 3.0 years lower than the state average
About
Iroquois County, Illinois, stretches along the eastern state line, where flat prairie fields and small towns create a landscape rooted in agriculture and tradition. Watseka, the county seat, anchors the area with government services, local schools, and a strong community presence. Towns like Gilman, Clifton, and Milford contribute to a network of rural communities shaped by farming, family ties, and Midwestern resilience.
The county’s economy is driven by corn and soybean production, supported by grain elevators, cooperatives, and small businesses. Residents value quiet routines, Friday night lights, and local festivals that celebrate their shared heritage. Iroquois County appeals to those who seek open space, close connections, and the steady rhythm of life on the Illinois prairie.
Where is Iroquois County?
Iroquois County spreads across Illinois’ eastern edge, where the prairie runs wide toward Indiana and towns sit low among fields that stretch for miles. About 90 miles south of Chicago, it’s reached by U.S. Route 24 and Interstate 57, crossing long rows of corn, soybeans, and windbreaks under open sky.
Watseka, the county seat, anchors the region with a courthouse square and deep farming roots, while towns like Gilman, Sheldon, and Milford mark quiet waypoints in the grid. The Iroquois River winds softly through the county’s center, offering a hint of movement through land shaped by work and weather. It’s a place where the horizon stays broad, and the pace remains as steady as the seasons.
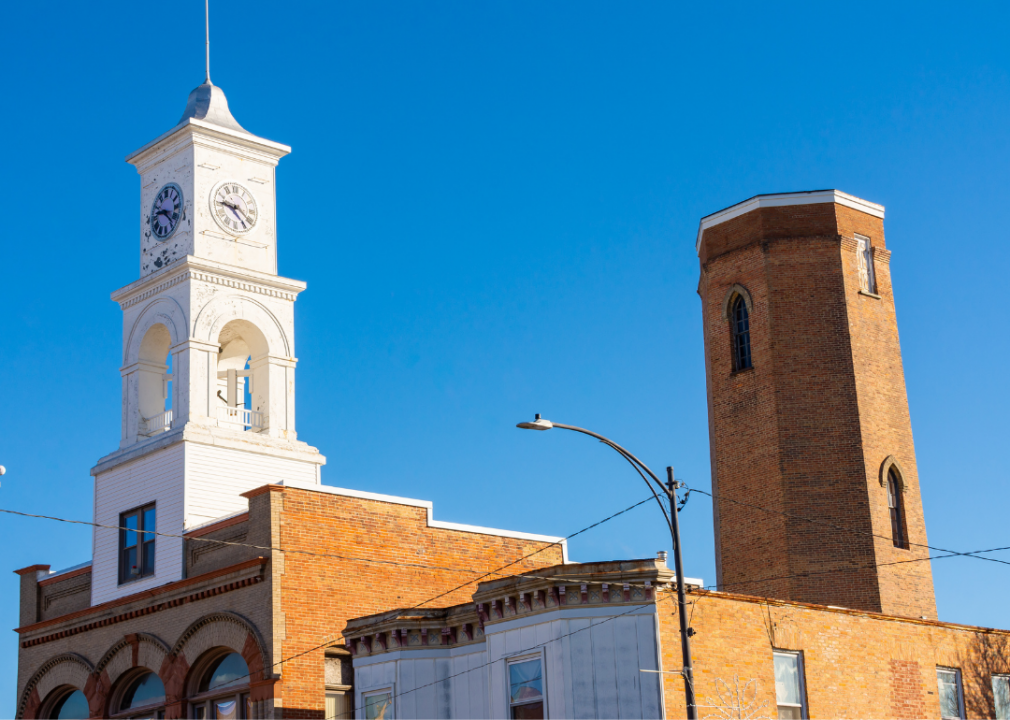
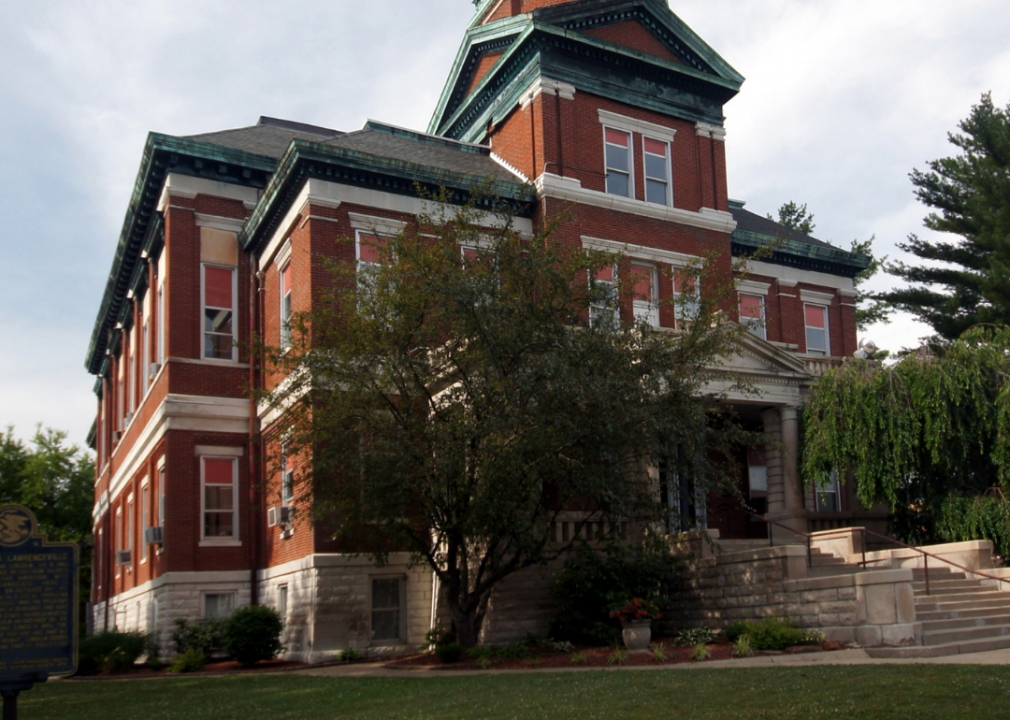
#18. Lawrence County
– Life expectancy: 74.9 years
— 3.1 years lower than the state average
About
Lawrence County, Illinois, sits along the southeastern border of the state, where the Wabash River and open farmland define a landscape of quiet resilience and rural charm. Lawrenceville, the county seat, serves as the central hub with schools, parks, and a walkable downtown rooted in local history. Communities like Bridgeport, Sumner, and St. Francisville reflect strong agricultural ties and a close-knit spirit.
The economy centers on farming, small industry, and regional commerce, with traditions passed down through generations. Residents enjoy hometown events, river recreation, and the comfort of familiar faces. Lawrence County appeals to those who value simplicity, heritage, and a steady pace of life shaped by land, legacy, and community.
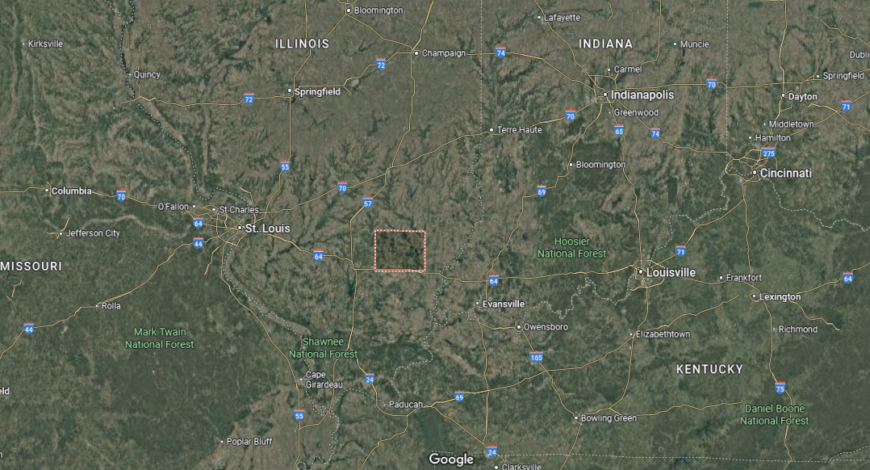
Where is Lawrence County?
Lawrence County rests along Illinois’ southeastern border, where the Wabash River separates it from Indiana and flat fields stretch toward the horizon. About 40 miles west of Vincennes, it’s reached by Illinois Routes 1 and 250, winding through quiet farmland, oil fields, and wooded creek bottoms.
Lawrenceville, the county seat, centers the region with a courthouse square and a calm, enduring rhythm, while towns like Bridgeport and Sumner carry the county’s long ties to agriculture and oil. The river bends slow along the edge, and the land moves with timeworn purpose. It’s a place where the boundary is water, the foundation is soil, and life is lived close to both.
#17. Montgomery County (tie)
– Life expectancy: 74.8 years
— 3.2 years lower than the state average
About
Montgomery County, Illinois, lies in the south-central part of the state, where rolling farmland meets historic towns and a strong sense of community. Hillsboro, the county seat, offers a charming courthouse square, local schools, and access to nearby lakes and parks. Litchfield, the largest city, adds commercial activity, Route 66 history, and a blend of small-town life with modern convenience.
Agriculture drives the economy, supported by local businesses and generations of family farms. Residents enjoy seasonal festivals, outdoor recreation, and deep-rooted traditions that foster close community bonds. Montgomery County appeals to those who seek a grounded lifestyle with rural beauty, hometown pride, and a slower, steady rhythm of living.
Where is Montgomery County?
Montgomery County lies in south-central Illinois, where rail lines, highways, and farmland meet in a steady rhythm of fields and small-town squares. About halfway between Springfield and St. Louis, it’s reached by Interstate 55 and State Route 16, passing grain elevators, church steeples, and stretches of open prairie.
Hillsboro, the county seat, anchors the area with courthouse charm and rolling hills, while Litchfield hums along the interstate with Route 66 history and a blue-collar pulse. Towns like Nokomis and Coffeen move at the pace of planting and harvest, rooted deep in local tradition. It’s a place where connection comes by road, and community comes by name.
#16. Edgar County (tie)
– Life expectancy: 74.8 years
— 3.2 years lower than the state average
You may also like: Counties with the most tornadoes in Illinois
About
Edgar County, Illinois, sits along the eastern border with Indiana, where rural landscapes, historic charm, and agricultural roots define daily life. Paris, the county seat, anchors the region with a classic courthouse square, local schools, and community events that reflect its deep Midwestern heritage. Towns like Chrisman, Kansas, and Brocton contribute to the county’s strong farming identity and neighborly spirit.
The economy centers on corn and soybean production, supported by small businesses and family-owned operations. Life here moves with the seasons—marked by fairs, harvests, and local gatherings that keep tradition alive. Edgar County appeals to those who appreciate quiet roads, open skies, and a lifestyle grounded in simplicity, heritage, and rural connection.
Where is Edgar County?
Edgar County sits along the Illinois-Indiana line in the state’s east-central region, where prairie fields meet low woodlands and two-lane roads stretch wide between quiet towns. About 10 miles west of Terre Haute, Indiana, it’s reached by U.S. Route 150 and Illinois Route 1, moving past silos, farmhouses, and open sky.
Paris, the county seat, anchors the region with historic storefronts, shaded neighborhoods, and a courthouse that watches over generations of stories. Beyond it, places like Chrisman, Kansas, and Hume keep the rhythm of rural life—rooted in seasons, family ties, and steady work. It’s a place where state lines are marked by creeks, and the land holds its people with quiet constancy.
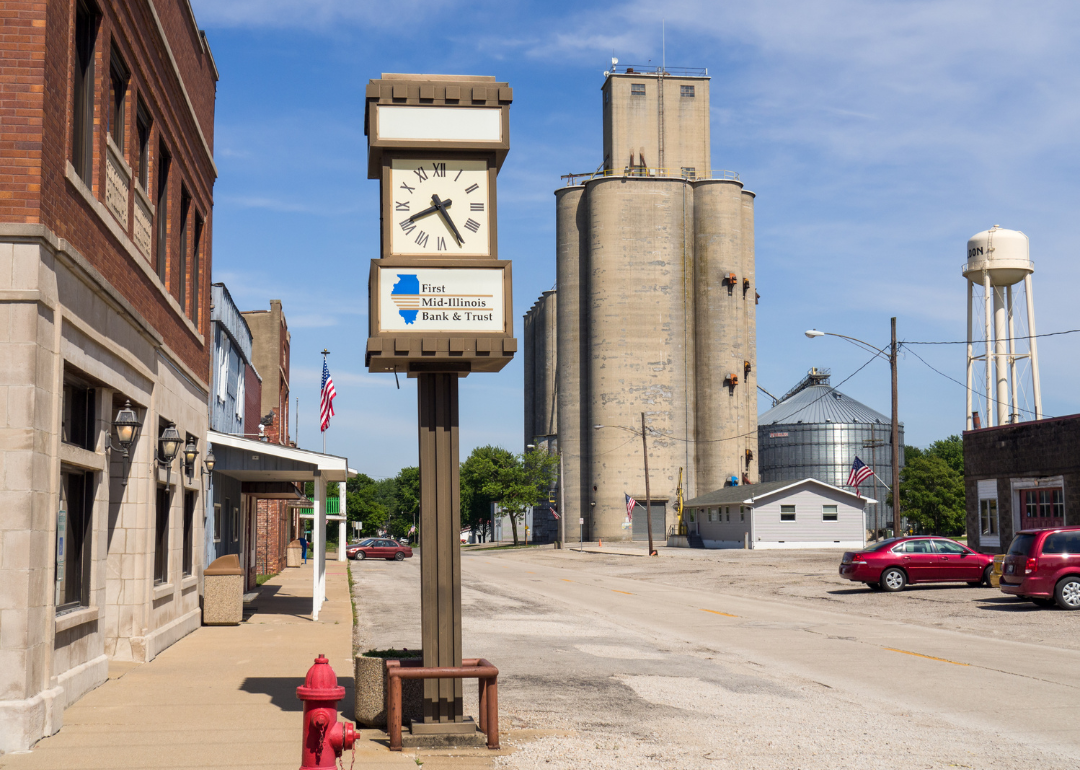
#15. St. Clair County
– Life expectancy: 74.7 years
— 3.3 years lower than the state average
About
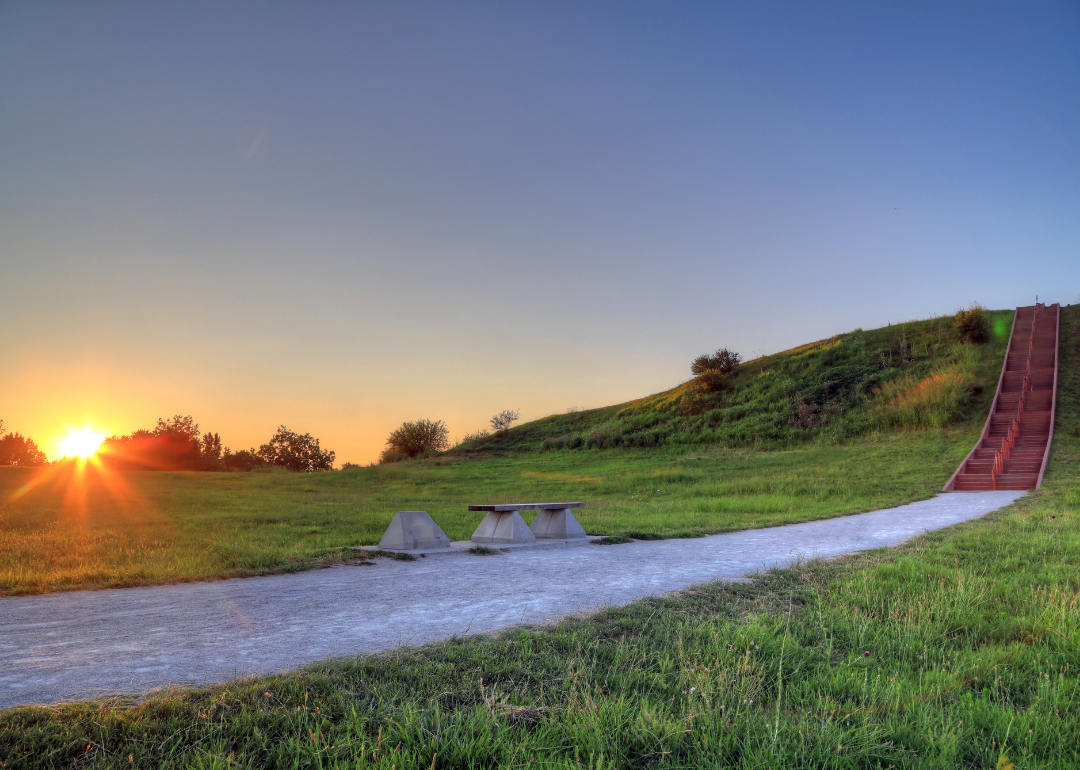
St. Clair County, Illinois, stands as a dynamic part of the Metro East region, just across the Mississippi River from St. Louis. Anchored by Belleville—its largest city and county seat—the area blends urban energy with suburban comfort, military presence, and deep historical roots. Communities like O’Fallon, East St. Louis, Fairview Heights, and Mascoutah contribute to the county’s cultural diversity, economic variety, and regional importance.
Scott Air Force Base plays a key role in the local economy, alongside healthcare, education, retail, and logistics. Residents enjoy access to major highways, city amenities, and nearby parks and recreation areas. St. Clair County appeals to those seeking a well-connected lifestyle with a mix of heritage, opportunity, and community depth in southwestern Illinois.
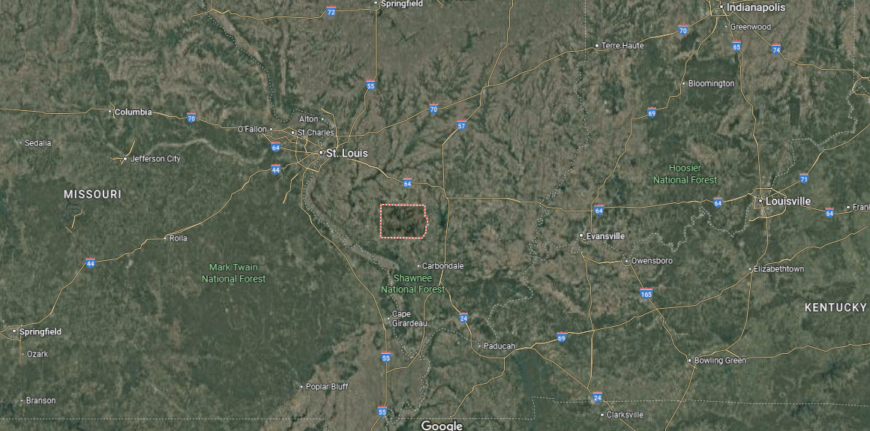
Where is St. Clair County?
St. Clair County lies along the Mississippi River in southwestern Illinois, just across from downtown St. Louis, where city streets give way to historic towns, industrial corridors, and open farmland. It’s reached by Interstates 64, 55, and 255, crossing bridges, rail lines, and neighborhoods that trace back to some of Illinois’ earliest settlements.
Belleville anchors the county with a broad downtown, cultural institutions, and deep German roots, while East St. Louis, O’Fallon, and Fairview Heights reflect a mix of change, resilience, and suburban growth. Scott Air Force Base brings global reach to the local map, while riverfronts and state parks offer quieter spaces in between. It’s a place where past and present meet at the edge of the city—diverse, storied, and always moving.
#14. DeWitt County
– Life expectancy: 74.6 years
— 3.4 years lower than the state average
About
DeWitt County, Illinois, lies in the central part of the state, where farmland, lakes, and small-town pride come together in a peaceful rural setting. Clinton, the county seat, anchors the area with a historic downtown, schools, and local events that highlight a strong sense of community. Smaller towns like Wapella, Farmer City, and Kenney contribute to the county’s agricultural backbone and tight-knit feel.
Clinton Lake adds a natural draw for boating, fishing, and camping, offering residents a scenic retreat close to home. The economy centers on farming, energy, and local services, all supported by generations of families who call the county home. DeWitt County appeals to those who value open space, tradition, and a steady pace rooted in Midwestern values.
Where is DeWitt County?
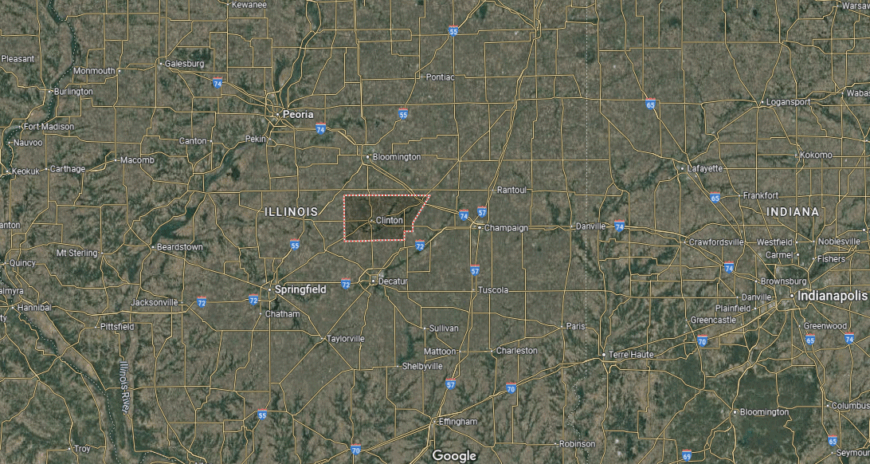
DeWitt County sits in the center of Illinois, where gently rolling farmland surrounds quiet towns and a wide reservoir breaks the prairie horizon. About 25 miles northwest of Decatur, it’s reached by U.S. Route 51 and Illinois Route 10, cutting through rows of crops and open sky.
Clinton, the county seat, anchors the region with a courthouse square, rooted traditions, and a close-knit rhythm, while Clinton Lake draws anglers, campers, and boaters to its wooded shores. Smaller communities like Farmer City and Wapella keep time with the seasons and the soil. It’s a place where the land is steady, the lake brings pause, and every road feels familiar.
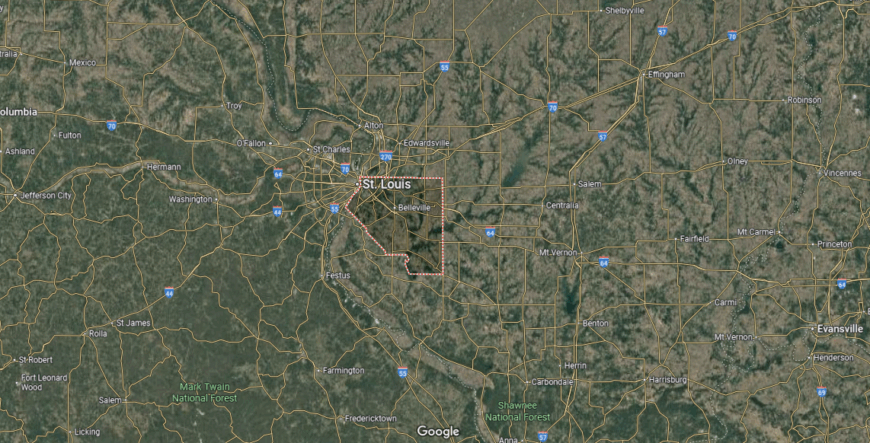
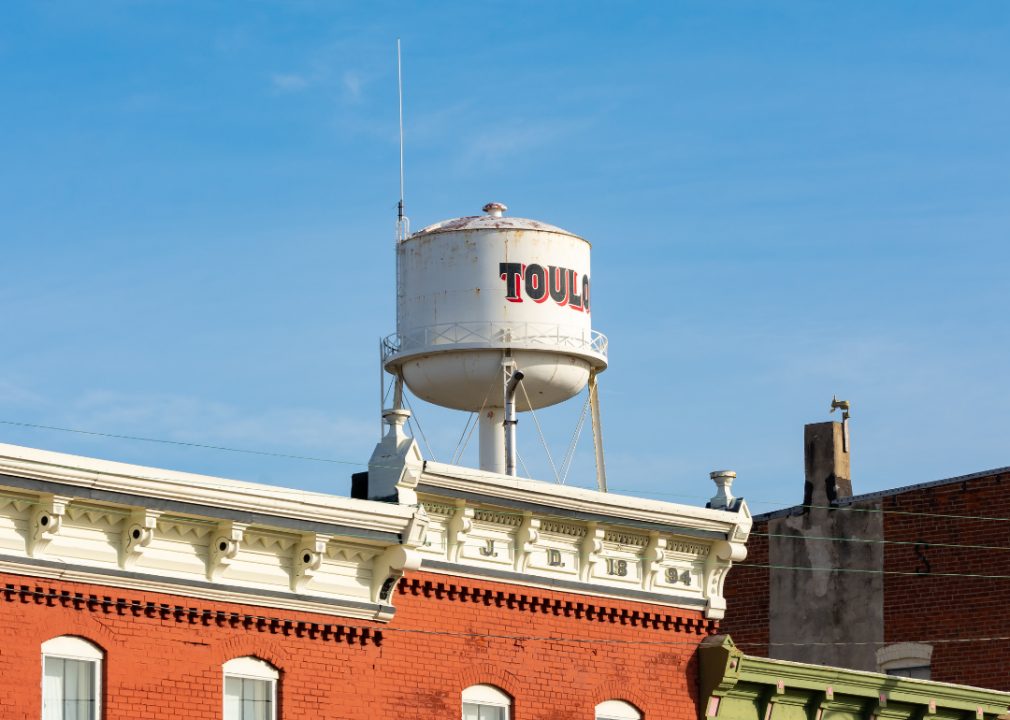
#13. Stark County
– Life expectancy: 74.5 years
— 3.5 years lower than the state average

About
Stark County, Illinois, is a quiet, rural county in the north-central part of the state, where rolling fields, wooded creeks, and close-knit towns define the landscape. Toulon, the county seat, serves as the civic hub with historic buildings, local schools, and a courthouse square that reflects the county’s small-town heritage. Communities like Wyoming, Bradford, and LaFayette support a strong agricultural economy and deep-rooted local traditions.
Life in Stark County is marked by simplicity and community—seasonal festivals, school events, and shared history bring residents together. The surrounding countryside offers peaceful drives, wildlife, and space to breathe. Stark County appeals to those who appreciate rural calm, strong neighborly ties, and a lifestyle grounded in land and legacy.
Where is Stark County?
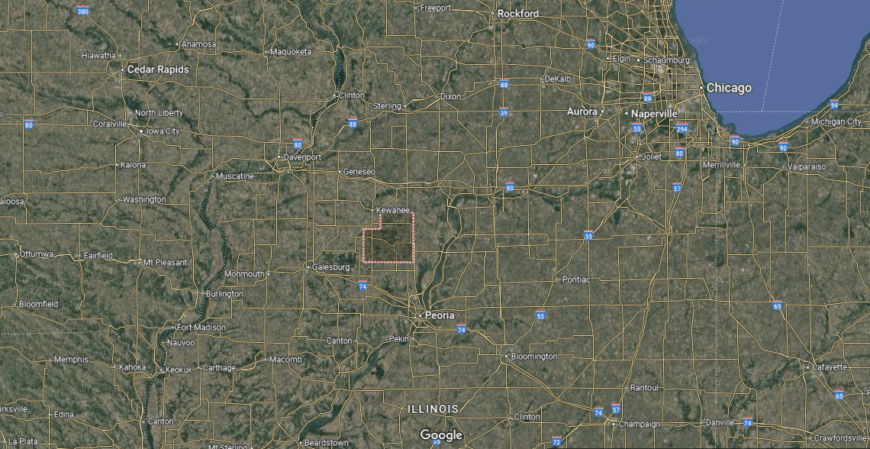
Stark County rests in north-central Illinois, where prairie farmland begins to ripple into soft hills and old towns sit tucked between fields and timber. About 30 miles northwest of Peoria, it’s reached by Illinois Routes 17 and 91, passing barns, church steeples, and quiet roadside stretches.
Toulon, the county seat, holds a modest square and a calm pace, while Wyoming and Bradford reflect the steady heart of farming communities grounded in family and field. The land rolls gently here—never hurried, never loud—shaped by time, weather, and deep rural roots. It’s a place where simplicity endures and the horizon always feels close.
#12. Union County
– Life expectancy: 74.1 years
— 3.9 years lower than the state average
About
Union County, Illinois, lies in the southern tip of the state, where the Shawnee Hills rise above fertile valleys and forests stretch toward the Mississippi River. Anna, the county seat, serves as the center of civic life, offering schools, healthcare, and access to the region’s natural beauty. Towns like Cobden, Alto Pass, and Jonesboro reflect the county’s blend of agricultural roots, winemaking traditions, and historic significance.
Surrounded by the Shawnee National Forest and dotted with orchards, vineyards, and scenic byways, Union County is a haven for hiking, wine tasting, and quiet retreats. The local economy thrives on farming, tourism, and artisan businesses tied to the land. Union County appeals to those seeking a peaceful lifestyle shaped by nature, heritage, and a strong sense of place.
Where is Union County?
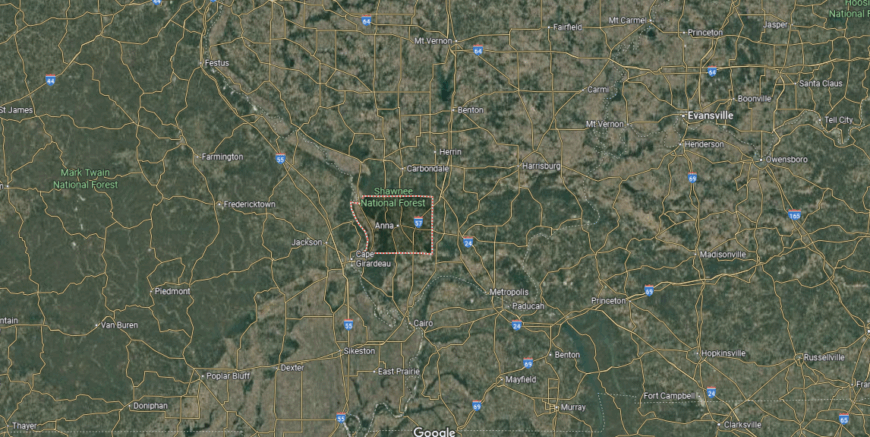
Union County lies in deep southern Illinois, where the land rises into forested hills, bluffs overlook the Mississippi, and orchards line ridge after ridge. About 20 miles south of Carbondale, it’s reached by U.S. Route 51 and Illinois Route 127, winding through wooded valleys, vineyards, and narrow backroads.
Anna anchors the county with small-town rhythm and historic ties, while Cobden and Alto Pass offer views, fruit stands, and hillside charm along the Shawnee Hills Wine Trail. The Shawnee National Forest spreads across much of the land, wrapping Union County in quiet trees, carved rock, and trails that stretch far beyond town. It’s a place where the land feels old, the sky feels near, and each turn leads to something softly unspoiled.
#11. Massac County
– Life expectancy: 74.0 years
— 4.0 years lower than the state average
You may also like: Best amusement parks in Illinois
About
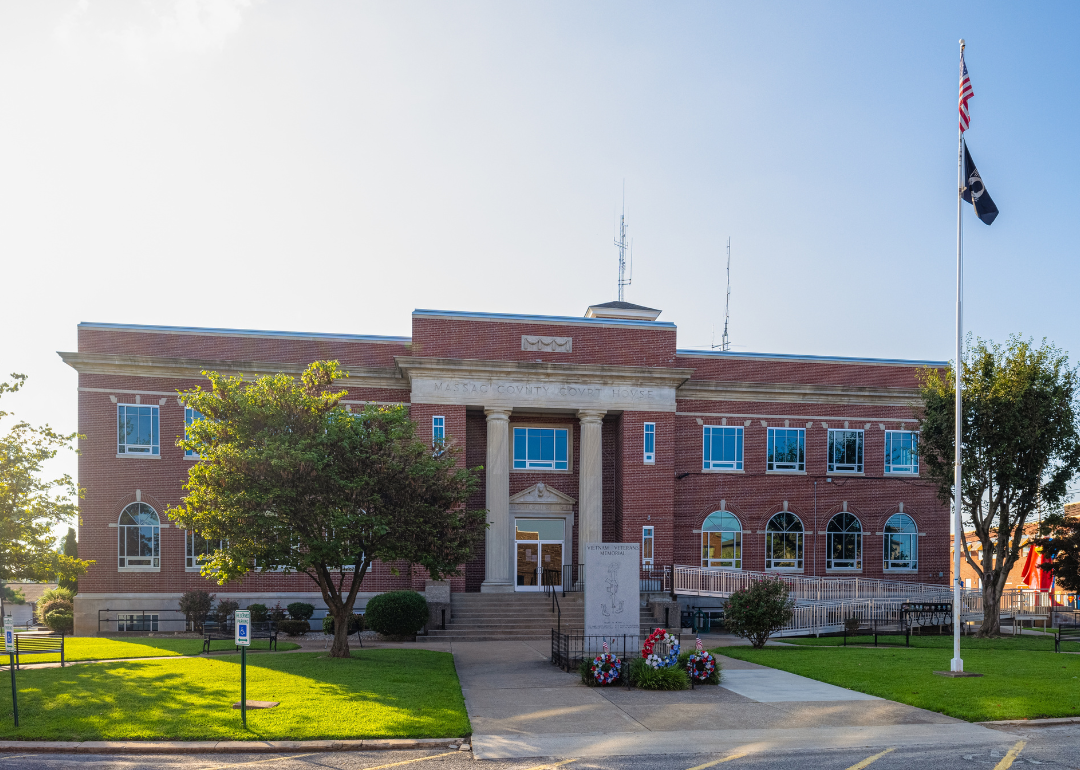
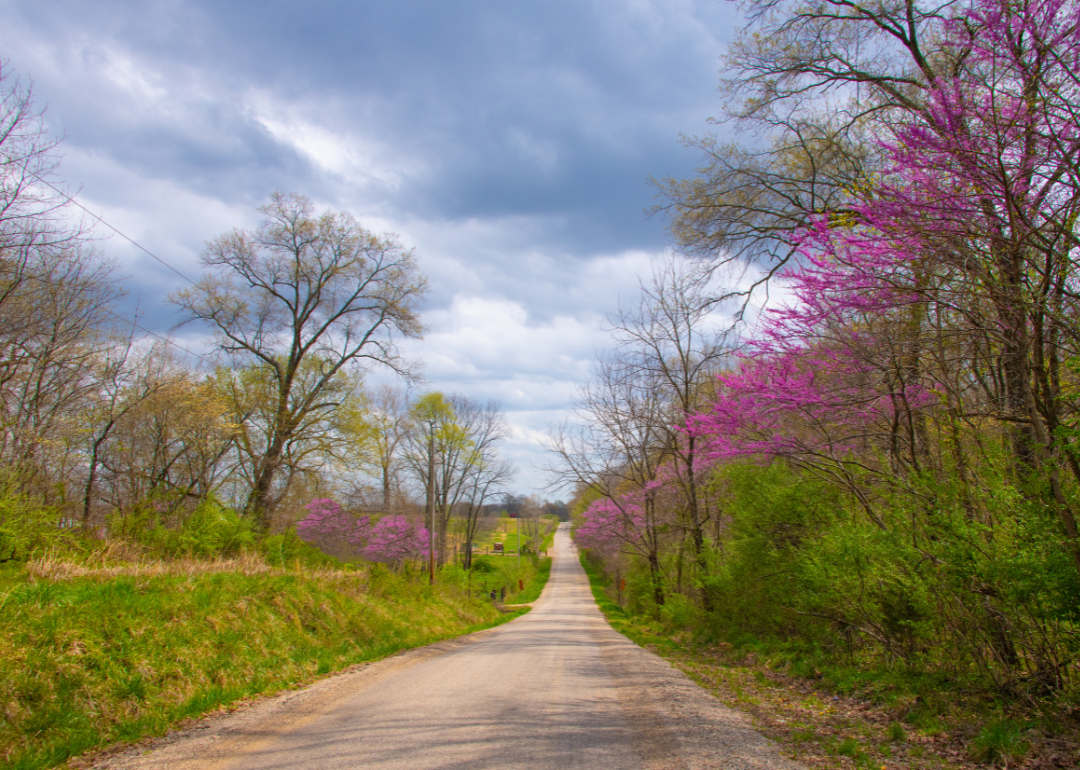
Massac County, Illinois, sits along the Ohio River in the far southern tip of the state, where river history, agriculture, and quiet rural life converge. Metropolis, the county seat, is famously known as the “Home of Superman,” blending small-town pride with a playful nod to pop culture. The city also serves as the center for schools, commerce, and local events.
The surrounding countryside features farmland, riverfront views, and access to Fort Massac State Park, a historic site and outdoor destination for residents and visitors alike. The local economy is supported by farming, tourism, and small businesses. Massac County appeals to those who appreciate a close-knit community, natural beauty, and a relaxed pace along one of America’s great rivers.
Where is Massac County?
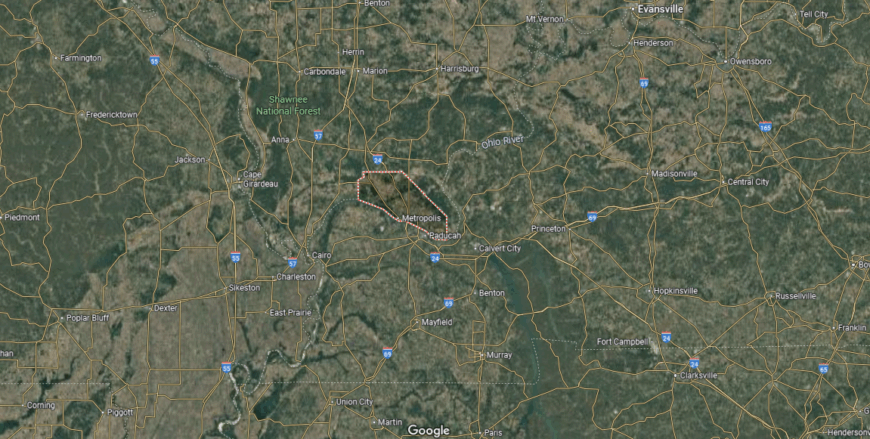
Massac County sits at Illinois’ southern edge, where the Ohio River curves gently past lowland fields and the Kentucky border lies just across the water. It’s reached by Interstate 24 and U.S. Route 45, as roads slip into Metropolis—the county seat known for its quiet charm and larger-than-life Superman statue.
Metropolis anchors the region with riverfront history, small-town pride, and a steady rhythm shaped by ferries, floods, and farming. Beyond the city, rural stretches reach into Shawnee National Forest, scattered with creeks, trails, and quiet woods. It’s a place where the river sets the tone—calm, winding, and always present—and where Illinois ends with a soft southern drawl.
#10. White County
– Life expectancy: 73.9 years
— 4.1 years lower than the state average
About
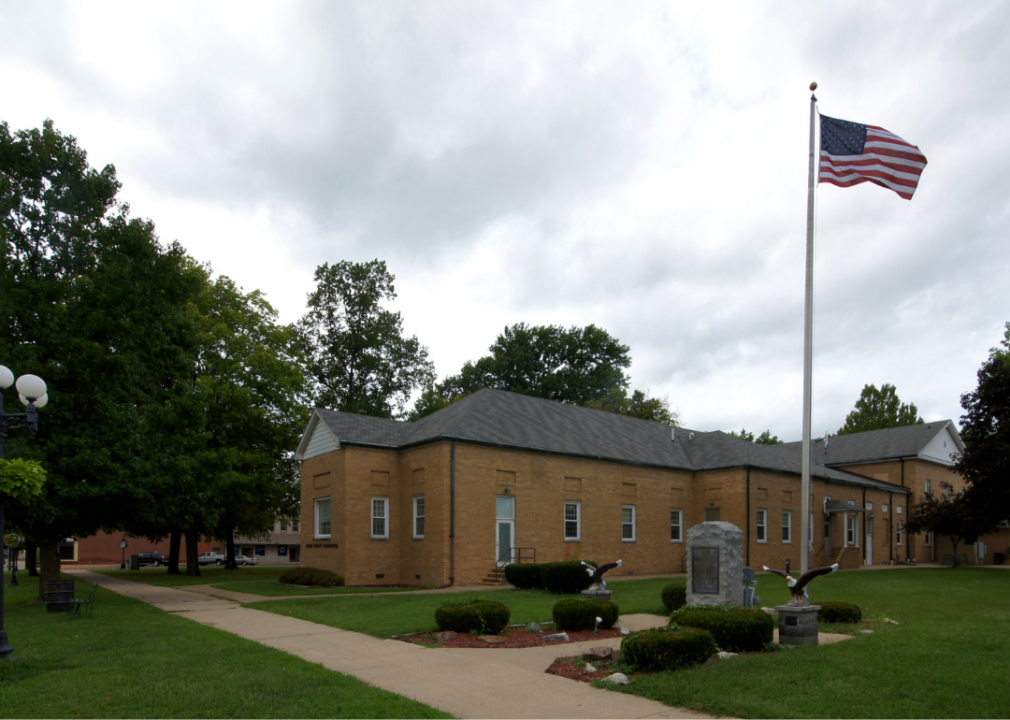
White County, Illinois, rests in the southeastern part of the state, where oil fields, farmland, and historic river towns shape a landscape of resilience and rural pride. Carmi, the county seat, anchors the area with a strong civic presence, local schools, and a deep connection to both agriculture and energy. Communities like Grayville, Norris City, and Crossville contribute to the county’s identity with tight-knit traditions and multigenerational roots.
The economy blends farming, oil production, and small-town commerce, reflecting a legacy of hard work and local independence. Residents enjoy county fairs, quiet neighborhoods, and access to parks and river recreation. White County appeals to those who value heritage, community ties, and the steady rhythm of Southern Illinois living.
Where is White County?
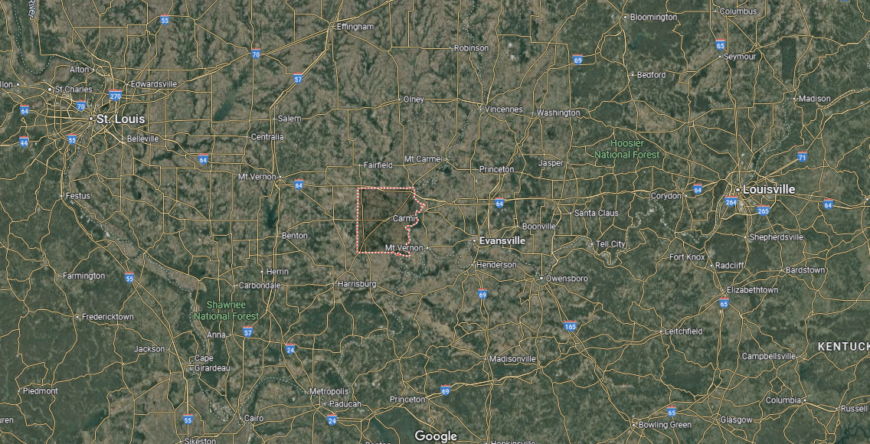
White County rests in southeastern Illinois, where flat fields stretch to the Wabash River and oil wells dot the landscape alongside rows of corn and soybeans. About 40 miles west of Evansville, Indiana, it’s reached by Illinois Routes 1 and 14, winding through farmland, floodplains, and low-lying timber.
Carmi, the county seat, anchors the region with a historic square, quiet neighborhoods, and a past tied to agriculture and early oil booms. Towns like Grayville, Norris City, and Crossville keep pace with the land—modest, rooted, and shaped by work and weather. It’s a place where roads run long and straight, and life moves to the rhythm of soil and seasons.
#9. Mason County
– Life expectancy: 73.8 years
— 4.2 years lower than the state average
About
Mason County, Illinois, lies in the central part of the state, where sandy soils, river valleys, and quiet farmland define a unique rural landscape. Havana, the county seat, sits along the Illinois River and offers a blend of historic charm, civic life, and outdoor access. Small towns like Manito, Mason City, and Bath support the county’s agricultural economy and close-knit community feel.
Known for its melon farms and conservation areas, the county is home to wildlife refuges, state parks, and hunting grounds that attract nature lovers and sportsmen. Life here is shaped by seasonal rhythms, from harvests to county fairs. Mason County appeals to those seeking simplicity, open space, and a strong connection to both land and local tradition.
Where is Mason County?
Mason County lies in central Illinois, where sandy soil, wide fields, and the slow bend of the Illinois River define the landscape. About 40 miles northwest of Springfield, it’s reached by Illinois Routes 10 and 97, weaving through open farmland, backwater lakes, and wooded floodplain edges.
Havana, the county seat, rests along the river with levee views, historic storefronts, and a pace shaped by both land and water. Towns like Mason City and Manito stretch out across the prairie, where melons grow in light soil and duck blinds dot the horizon. It’s a place where the river feeds the fields, and nature and farming live side by side—quiet, enduring, and full of space.
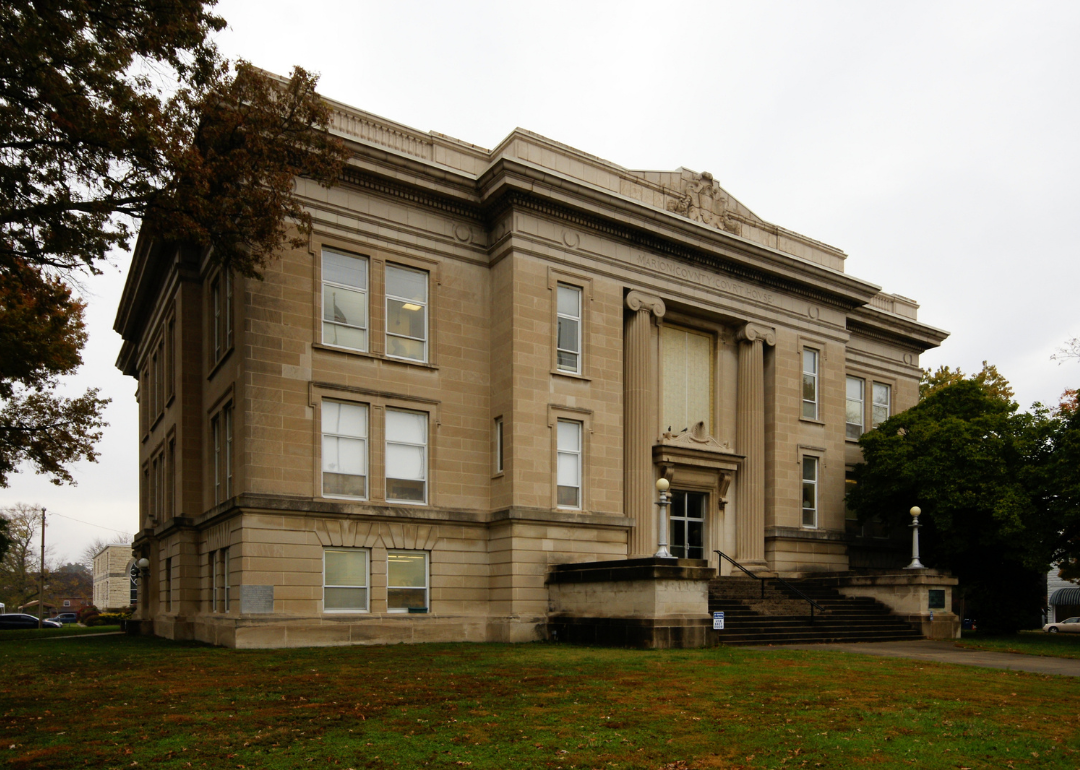
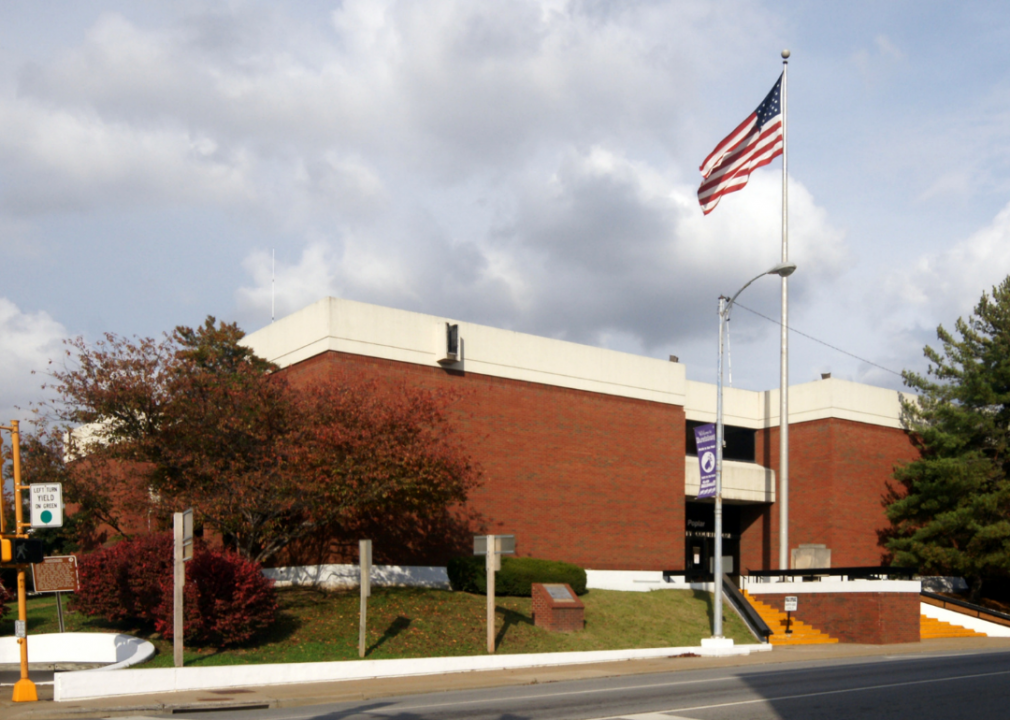
#8. Marion County
– Life expectancy: 73.4 years
— 4.6 years lower than the state average

About
Marion County, Illinois, sits in the south-central part of the state, where rail lines, farmland, and coal country roots come together in a landscape shaped by industry and tradition. Salem, the county seat, anchors the region with schools, healthcare, and a historic downtown that reflects its role as the “Gateway to Little Egypt.” Centralia, the county’s largest city, adds economic diversity through manufacturing, rail service, and local arts.
Towns like Kinmundy, Odin, and Sandoval contribute to the county’s identity with strong community ties and deep agricultural foundations. Residents enjoy local festivals, parks, and a way of life built on resilience and hometown pride. Marion County appeals to those who value history, hard work, and the rhythm of life in the heart of Southern Illinois.
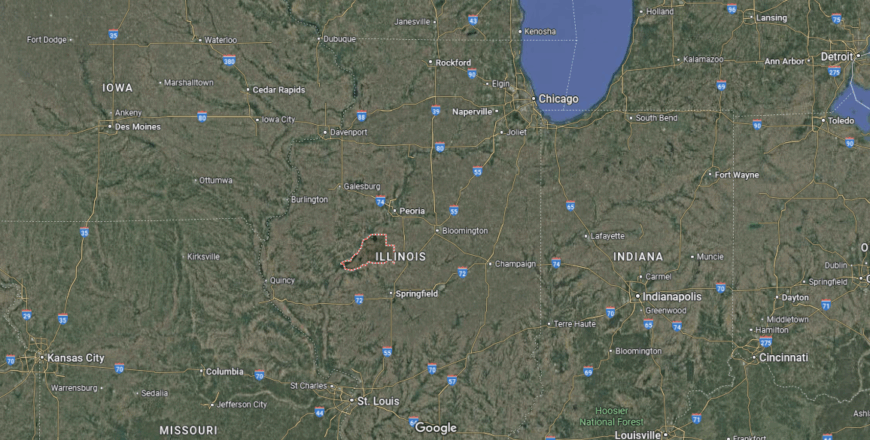
Where is Marion County?
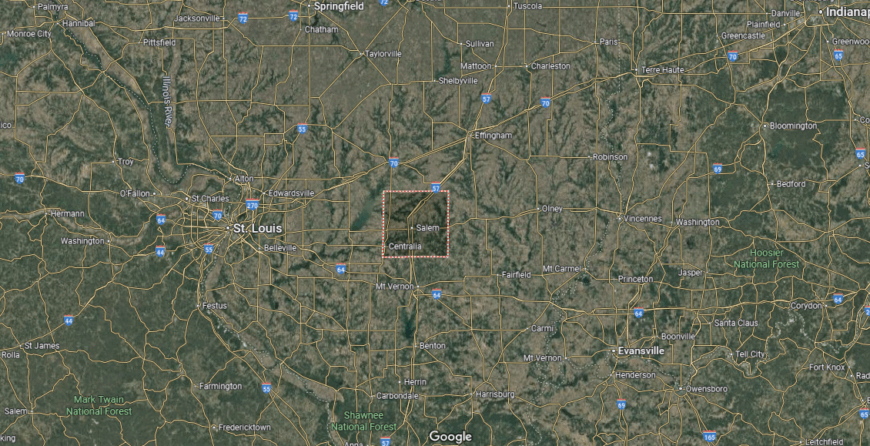
Marion County rests in south-central Illinois, where rail lines, highways, and farmland meet in long stretches of open ground and steady community life. About 80 miles east of St. Louis, it’s reached by Interstate 57 and U.S. Route 50, both tracing paths through fields, towns, and timeworn rail yards.
Salem, the county seat, anchors the region with civic pride and historic charm, while Centralia—shared with neighboring counties—adds a pulse of rail history and working-class resilience. Kinmundy, Odin, and Sandoval carry the county’s agricultural roots, surrounded by grain bins, fencerows, and wide skies. It’s a place where connections are forged by road, rail, and family—and where the prairie holds both past and purpose.
#7. Franklin County
– Life expectancy: 73.3 years
— 4.7 years lower than the state average
About
Franklin County, Illinois, lies in the heart of Southern Illinois, where coal mining heritage, rural traditions, and growing community life come together. Benton, the county seat, anchors the region with government services, local schools, and a revitalized square that reflects its small-town charm. West Frankfort, Christopher, and Sesser add depth to the county’s identity with strong neighborhood ties and generational roots.
The area offers access to Rend Lake, a major destination for boating, fishing, and camping that supports both tourism and recreation. The economy blends coal history with modern services, education, and small businesses. Franklin County appeals to those who value community pride, outdoor living, and a lifestyle grounded in resilience and connection.
Where is Franklin County?
Franklin County lies in the heart of southern Illinois, where reclaimed coal lands, wooded hills, and quiet lakes shape a landscape marked by both industry and renewal. About 90 miles southeast of St. Louis, it’s reached by Interstate 57 and Illinois Route 149, running past water towers, ballfields, and fading mine shafts.
Benton, the county seat, anchors the region with courthouse pride and a deep connection to coal country history, while West Frankfort, Zeigler, and Christopher reflect a legacy of labor, loss, and tight-knit community. Rend Lake stretches along the county’s western edge, offering calm water, forest trails, and a place to breathe.
#6. Vermilion County
– Life expectancy: 73.2 years
— 4.8 years lower than the state average
You may also like: Counties with the highest STI rates in Illinois
About
Vermilion County, Illinois, stretches along the eastern border of the state, where industrial legacy, fertile farmland, and natural preserves shape a region rich in diversity and resilience. Danville, the county seat, serves as the economic and cultural hub with healthcare facilities, colleges, and a revitalizing downtown rooted in manufacturing history. Towns like Hoopeston, Georgetown, and Westville contribute to the county’s character with strong community traditions and agricultural strength.
The county is home to scenic areas like Kickapoo State Park and the Middle Fork of the Vermilion River, offering trails, paddling, and wildlife viewing. Residents enjoy a blend of rural calm, civic pride, and access to outdoor recreation. Vermilion County appeals to those who value both hard-working roots and the open space and nature that define this part of east-central Illinois.
Where is Vermilion County?
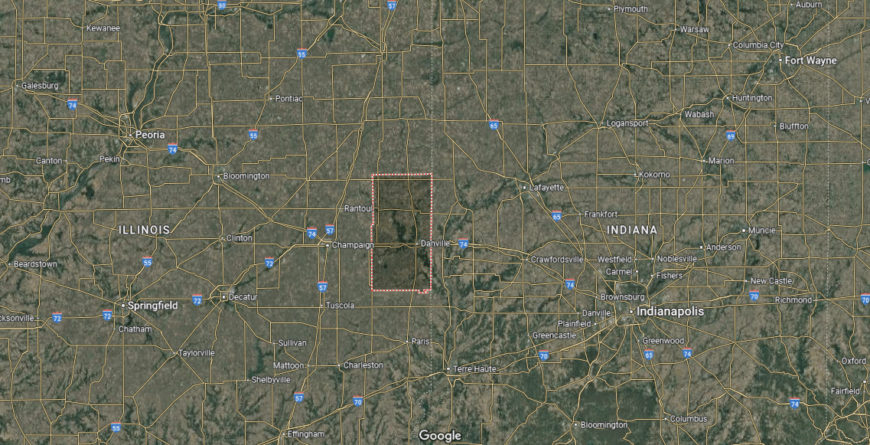
Vermilion County lies along Illinois’ eastern edge, where the open prairie gives way to wooded ravines and the Vermilion River carves quiet paths through rock and farmland. About 35 miles east of Champaign and bordering Indiana, it’s reached by Interstate 74 and U.S. Route 136, stretching past grain fields, smokestacks, and state park trails.
Danville anchors the county with a legacy of rail, coal, and manufacturing, while towns like Hoopeston, Georgetown, and Oakwood move with the steady rhythm of rural life. Forest preserves and river canyons offer unexpected wildness—places like Kickapoo and Kennekuk where cliffs and creeks break the flatness. It’s a place where labor shaped the towns, but nature still claims the edges.
#5. Pulaski County
– Life expectancy: 73.0 years
— 5.0 years lower than the state average
About
Pulaski County, Illinois, sits at the southern tip of the state, where the Ohio and Mississippi Rivers meet amid forested hills, wetlands, and rich history. Mound City, the county seat, is known for its Civil War-era heritage and proximity to the confluence of major waterways. Neighboring towns like Mounds, Ullin, and Olmsted reflect a quiet rural lifestyle shaped by agriculture, transportation, and deep-rooted community ties.
The area offers access to Shawnee National Forest and the Cache River Wetlands, drawing nature lovers and birdwatchers to its unique ecological landscapes. Life here is slow-paced and deeply connected to the land and past. Pulaski County appeals to those seeking solitude, natural beauty, and a lifestyle grounded in heritage and Southern Illinois tradition.
Where is Pulaski County?
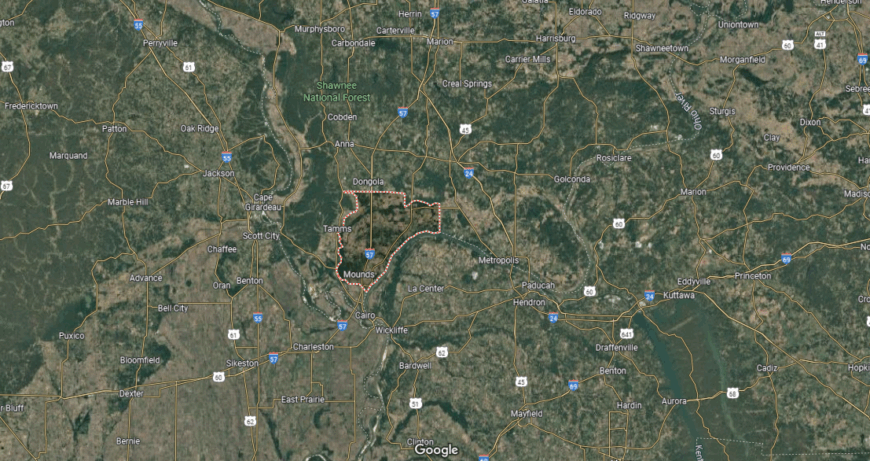
Pulaski County lies at the far southern tip of Illinois, where the Ohio River curves wide and the land flattens into bottomlands, bayous, and forested margins. About 30 miles north of where the Ohio meets the Mississippi, it’s reached by U.S. Route 51 and Illinois Route 37, winding through quiet fields and floodplain timber.
Mound City and Mounds, the county’s twin anchors, hold layers of Civil War history and long-faded riverfront commerce, while small towns like Ullin and Pulaski drift with the steady pace of rural southern life. Cypress swamps and river fog lend a stillness to the land, and time moves slow between train tracks and cottonwoods. It’s a place where Illinois ends not with a skyline, but with silence, water, and deep roots.
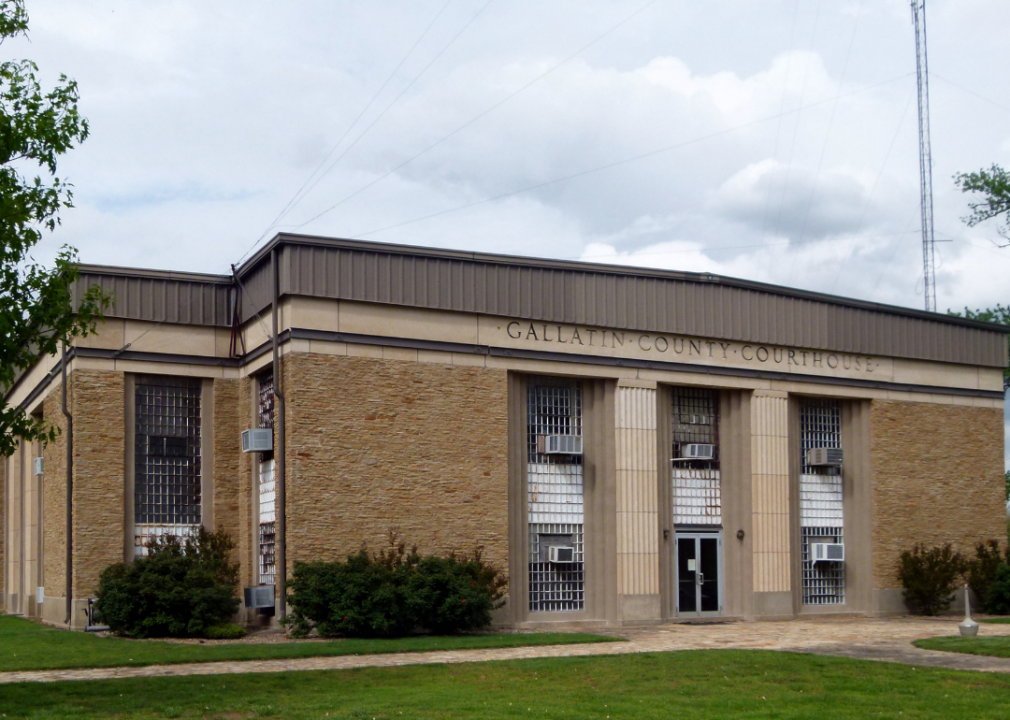
#4. Gallatin County (tie)
– Life expectancy: 72.5 years
— 5.5 years lower than the state average
About
Gallatin County, Illinois, rests along the southeastern border of the state, where the Ohio River, fertile farmland, and deep historic roots shape a quiet and enduring rural landscape. Shawneetown, the county seat, holds a rich past as one of Illinois’s earliest settlements and river trade centers. Small towns like Ridgway, Equality, and Junction add to the county’s character with close-knit communities and strong agricultural traditions.
The region offers access to the Shawnee National Forest and the Saline River, providing opportunities for hunting, fishing, and peaceful outdoor escapes. Residents value local history, family ties, and a slower pace that follows the rhythms of the land. Gallatin County appeals to those who seek simplicity, heritage, and a lifestyle rooted in Southern Illinois soil.
Where is Gallatin County?
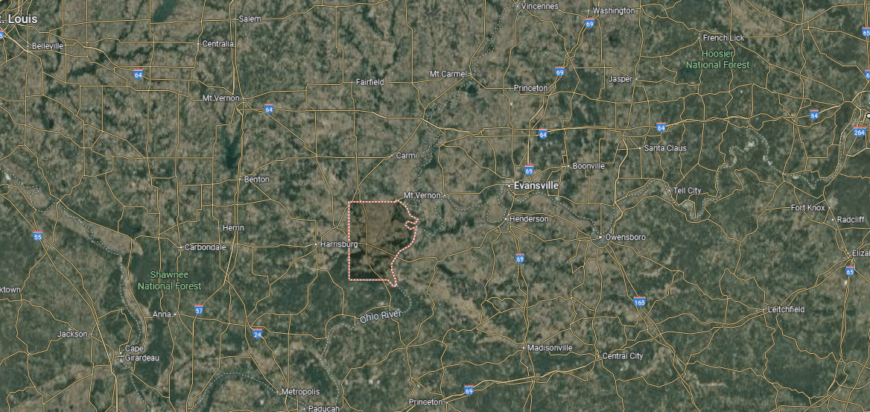
Gallatin County rests in southeastern Illinois, where the Wabash and Ohio Rivers draw quiet boundaries and history lingers in the floodplain air. About 25 miles east of Harrisburg, it’s reached by Illinois Routes 1 and 13, cutting through flat farmland, empty stretches, and towns that once bustled with river trade.
Shawneetown, the historic heart, sits near the river’s edge—its original site long surrendered to floodwaters, its newer streets marked by age and quiet resilience. Ridgway and Junction carry on with farming life and local ties, surrounded by soybeans, silos, and the long horizon. It’s a place where Illinois began in commerce and promise, and now rests in stillness, soil, and memory.
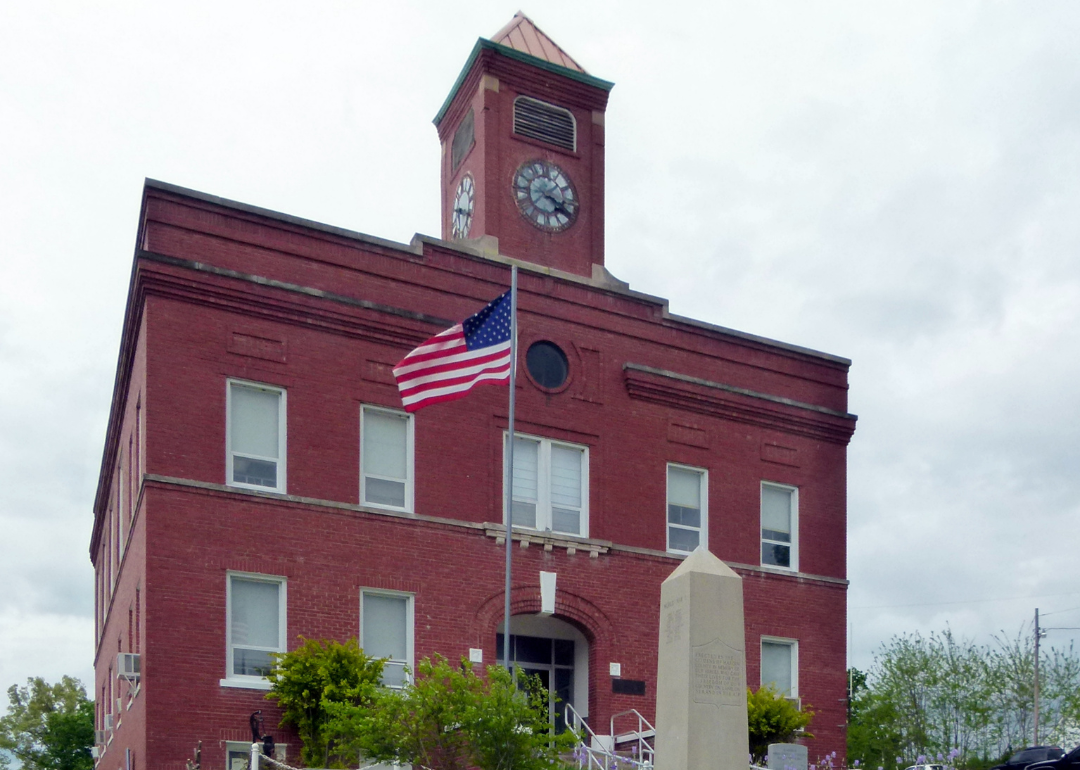
#3. Saline County (tie)
– Life expectancy: 72.5 years
— 5.5 years lower than the state average
About
Saline County, Illinois, lies at the edge of the Shawnee National Forest in the southeastern part of the state, where coal country history, farmland, and forested hills come together. Harrisburg, the county seat and largest city, serves as the regional hub with healthcare, schools, and access to outdoor recreation. Towns like Eldorado, Carrier Mills, and Galatia contribute to the county’s strong community ties and working-class roots.
The county is a gateway to Garden of the Gods and other natural landmarks, making it a favorite for hikers, campers, and nature lovers. Its economy blends coal mining heritage with agriculture, local commerce, and public services. Saline County appeals to those who value scenic beauty, small-town pride, and a lifestyle rooted in both tradition and the land.
Where is Saline County?
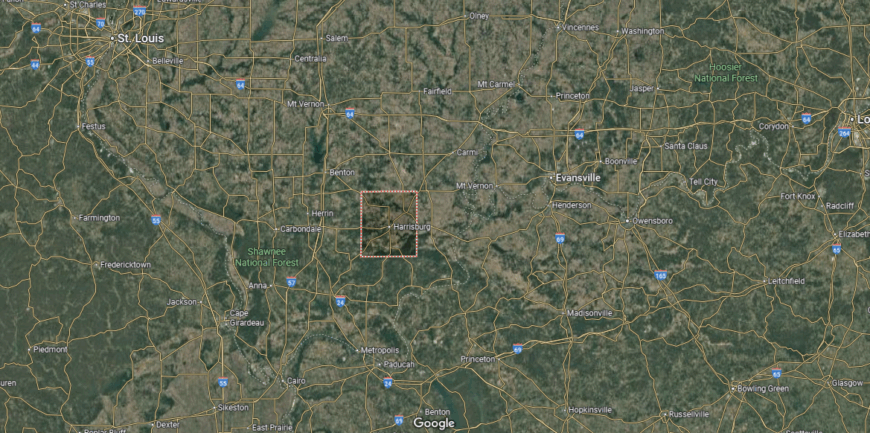
Saline County lies in southeastern Illinois, where flatlands rise gently into wooded hills and the old tracks of coal towns lead toward the edges of the Shawnee National Forest. About 25 miles east of Marion, it’s reached by U.S. Route 45 and Illinois Route 13, passing through reclaimed mine land, rural highways, and working-class neighborhoods.
Harrisburg anchors the county with a busy crossroads feel—once a boomtown for coal and now a gateway to trails, bluffs, and Garden of the Gods just beyond its border. Eldorado, Galatia, and Carrier Mills echo with deep labor histories and quiet persistence. It’s a place where the past runs underground, and the forest breathes just beyond the edge of town.
#2. Hardin County (tie)
– Life expectancy: 72.5 years
— 5.5 years lower than the state average
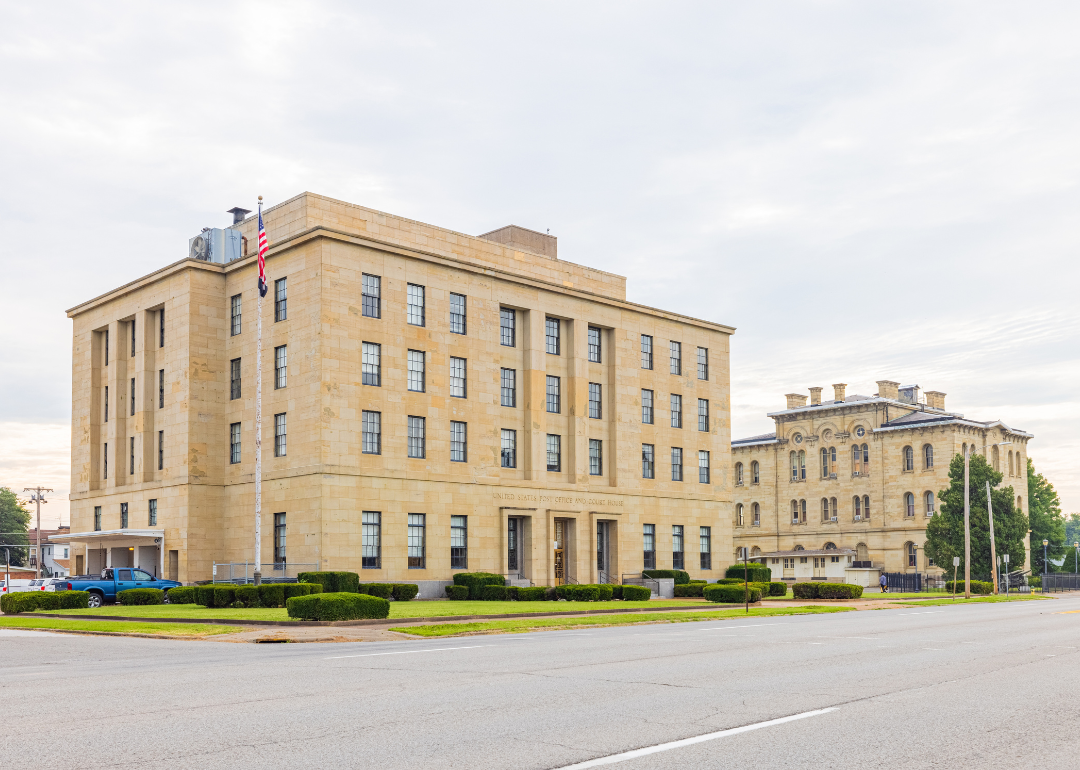
About
Hardin County, Illinois, is the smallest by population in the state, tucked into the southeastern corner where the Ohio River and Shawnee National Forest meet. Elizabethtown, the county seat, overlooks the river and offers a peaceful, historic setting with ties to early river trade and Southern Illinois heritage. Communities like Rosiclare and Cave-In-Rock reflect a deep connection to the region’s mining history, natural beauty, and rural life.
The county is home to dramatic landscapes, including river bluffs, forested hills, and the famous Cave-In-Rock State Park, drawing visitors for hiking, boating, and sightseeing. Life here moves at a quiet, steady pace, grounded in nature and close community ties. Hardin County appeals to those seeking solitude, outdoor adventure, and a lifestyle deeply rooted in the history and terrain of Southern Illinois.
Where is Hardin County?
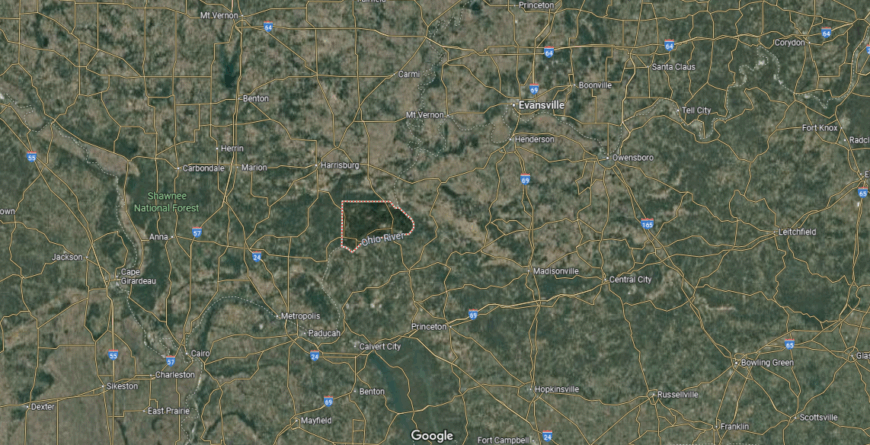
Hardin County lies in the far southeastern corner of Illinois, where the Ohio River cuts deep along limestone bluffs and the Shawnee National Forest cloaks the land in trees and silence. It’s the state’s least populous county, reached by winding stretches of Illinois Routes 1 and 34 that move slowly through hollows, ridges, and hardwood canopy.
Elizabethtown, the tiny riverfront seat, holds a handful of buildings and a long gaze over the Ohio, while Rosiclare and Cave-In-Rock recall days of fluorspar mining, ferry crossings, and outlaw folklore. Trails dip into canyons, caves open into stone, and the sky feels closer through bare branches. It’s a place where Illinois fades into wilderness—quiet, rough-edged, and deeply rooted in the shape of the land.
#1. Alexander County
– Life expectancy: 68.6 years
— 9.4 years lower than the state average
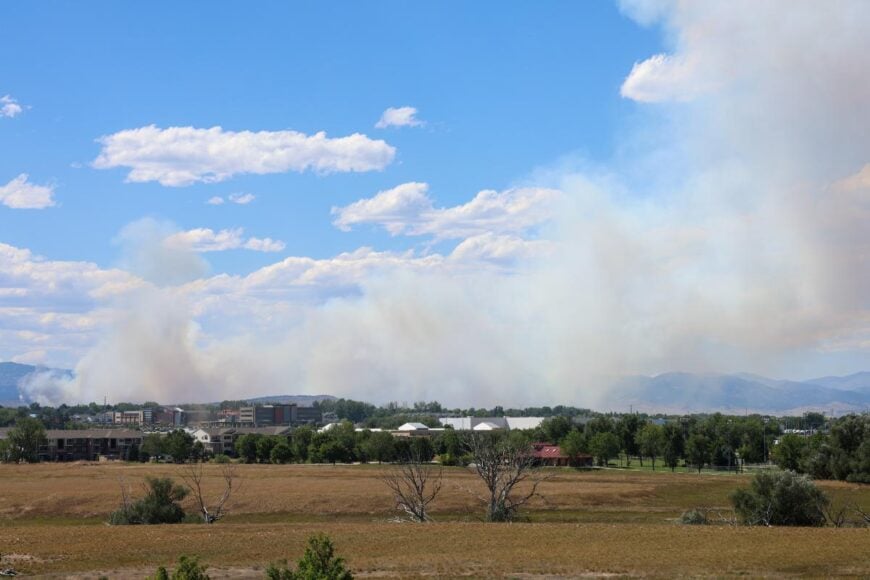
About
Alexander County, Illinois, rests at the southernmost tip of the state, where the Mississippi and Ohio Rivers meet in a confluence of history, waterway commerce, and natural beauty. Cairo, the county seat, once a bustling river port, holds a rich and complex past reflected in its historic architecture and strategic location. Smaller communities like Tamms and Olive Branch contribute to the county’s quiet rural character and strong regional identity.
The landscape includes levees, floodplains, and forested stretches that offer opportunities for birdwatching, fishing, and exploring secluded riverfront areas. While shaped by challenges, the county remains a place of resilience and deep-rooted pride. Alexander County appeals to those drawn to history, river life, and the uniquely reflective pace of Illinois’s southernmost region.
Where is Alexander County?
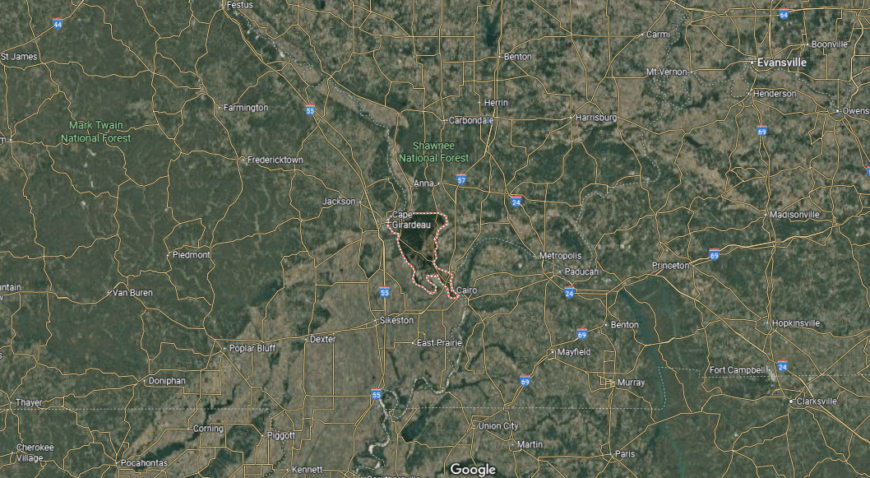
Alexander County rests at the southernmost tip of Illinois, where the Mississippi and Ohio Rivers meet in a broad, quiet confluence. It’s reached by U.S. Route 51 and Illinois Route 3, curving past levees, wetlands, and rail lines that once carried goods and people through a bustling gateway.
Cairo, the county seat, sits at the meeting of two great rivers—its grand past marked by fading buildings, wide streets, and a heavy, complicated history. The rest of the county spreads out in fields, forest patches, and river bottom stillness, dotted with small communities like Olive Branch and Tamms. It’s a place where geography is destiny—where the land holds memory, and the rivers carry the weight of everything that came before.
This story features data reporting by Karim Noorani, writing by Kiersten Hickman, and is part of a series utilizing data automation across 49 states.
You may also like: The biggest health care data breaches you should know about in Illinois
By Stacker