🔥 Would you like to save this?
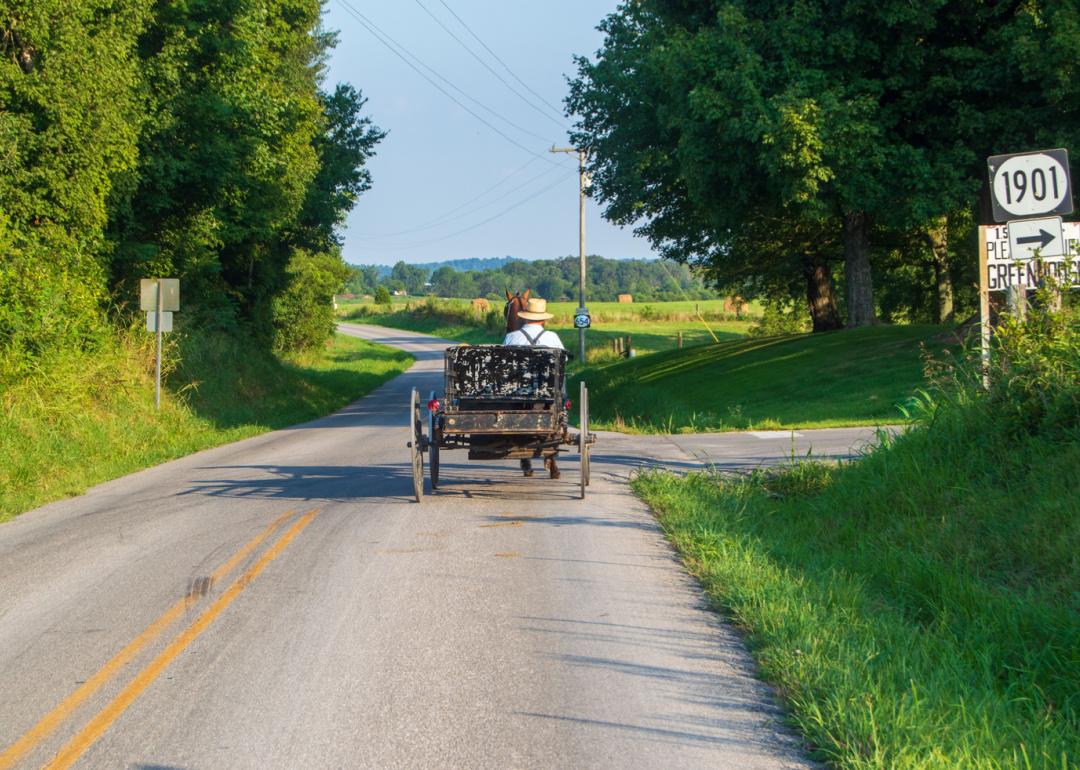
Counties with the shortest life expectancy in Kentucky
Life expectancy can be affected by a variety of factors. About 25% of your lifespan is determined by genetics, according to the National Library of Medicine. Health and wellness habits—like following a balanced, nutrient-rich diet; not smoking; drinking minimal alcohol; maintaining a healthy weight; and staying physically active—can add more than a decade to your life, research from the National Institutes of Health shows. While these factors are significant, another important element that you might not have considered is your environment and community.
In order to come up with the very specific design ideas, we create most designs with the assistance of state-of-the-art AI interior design software. Also, assume links that take you off the site are affiliate links such as links to Amazon. this means we may earn a commission if you buy something.
While life expectancy generally increases annually in the United States—jumping from about 70.8 years old to 77.5 between 1970 and 2022, according to the Centers for Disease Control and Prevention—this particular metric can vary from state to state or even county to county. In some parts of the country, the average lifespan is getting shorter based on a variety of risk factors on top of health, including socioeconomic factors like poverty, unemployment, income, and education.
According to a 2020 study from researchers at Penn State, West Virginia, and Michigan State Universities, communities with a higher population density, more fast food restaurants, and a high number of extraction industry-based jobs tend to have shorter life expectancies.
To find out how life expectancy varies within Kentucky, Stacker used 2024 County Health Rankings & Roadmaps from the University of Wisconsin Population Health Institute to identify the counties with the shortest life expectancy. Life expectancy measures the average number of years from birth a person can expect to live and is calculated based on the number of deaths in a given time period and the average number of people at risk of dying during that period. Counties with unreliable or insufficient data were excluded from the analysis. Mortality data came from the National Vital Statistics System.
Read on to see if your county is on the list.
You may also like: Counties with the highest unemployment in Kentucky
#50. Trimble County (tie)
– Life expectancy: 72.7 years
— 1.3 years lower than the state average

About
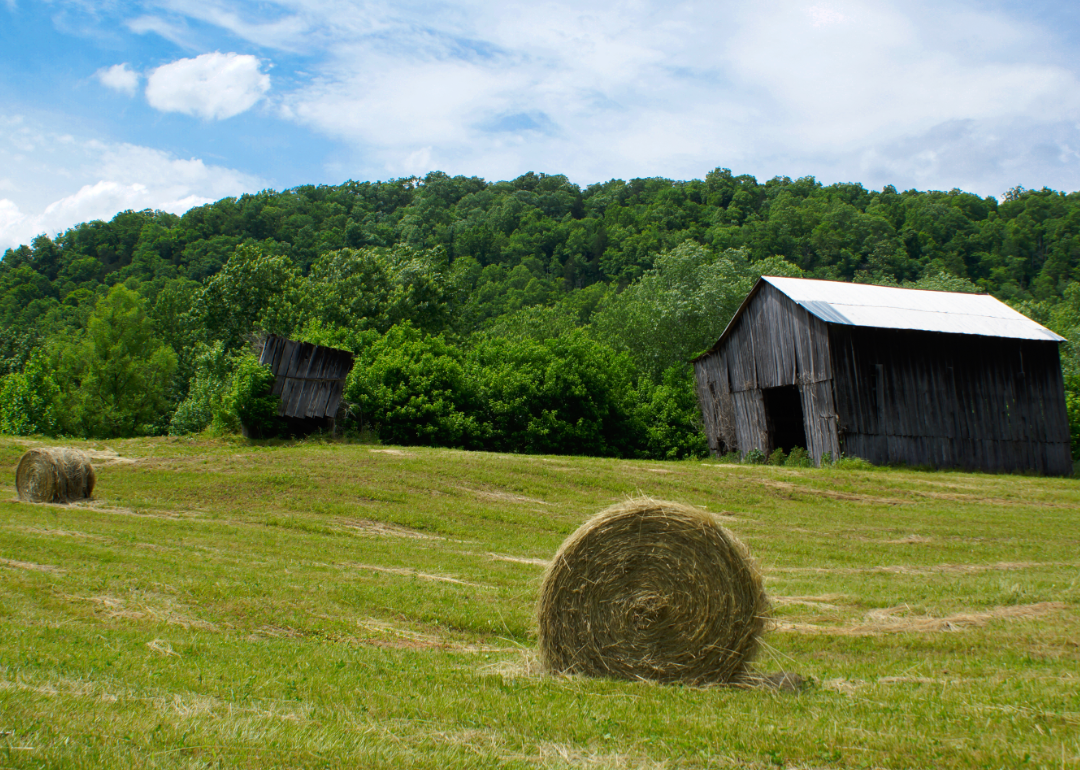
Trimble County is defined by its rolling farmland, river valleys, and small-town ties that continue to shape everyday life. Nestled along the Ohio River, the county blends agricultural traditions with quiet communities that place value on self-reliance and close relationships. Its landscape of fields, waterways, and rural roads creates a setting where heritage and natural surroundings remain at the center of identity.
Life here often revolves around farming cycles, school activities, and local gatherings that bring neighbors together. Residents share a pace of living rooted in familiarity and generational continuity, where family histories and community pride carry deep weight. Trimble County reflects a steady balance of place and people, grounded in the rhythms of land and shared experience.
Where is Trimble County?
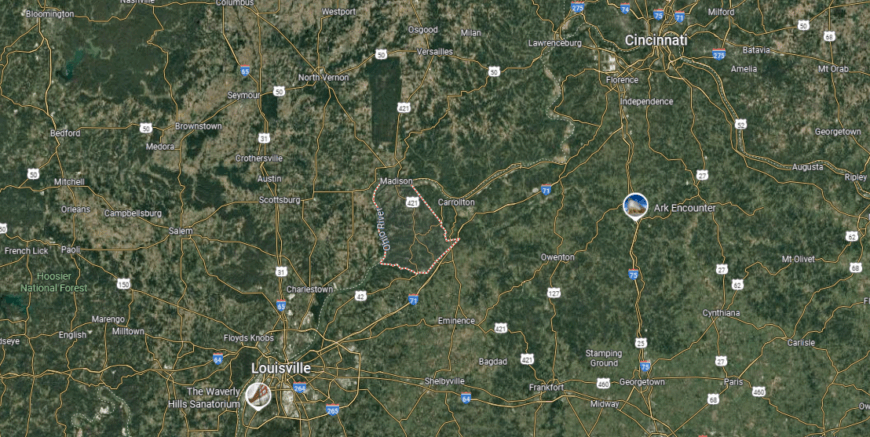
Trimble County is set in north-central Kentucky along the Ohio River, directly across from Indiana. The county stretches about 25 miles from east to west and roughly 12 miles from north to south, giving it a narrow but elongated shape. It lies around 45 miles northeast of Louisville and about 65 miles southwest of Cincinnati, making it part of the greater Ohio River Valley region.
Bedford, the county seat, sits near the middle of the county where U.S. Highways 42 and 421 intersect. Milton, another key town, rests on the northern edge of the county at the river’s edge, connected to Madison, Indiana, by a bridge crossing. The area is largely rural, marked by farmland, wooded ridges, and its close relationship with the Ohio River, which defines its northern border.
#44. Christian County (tie)
– Life expectancy: 72.6 years
— 1.4 years lower than the state average
About
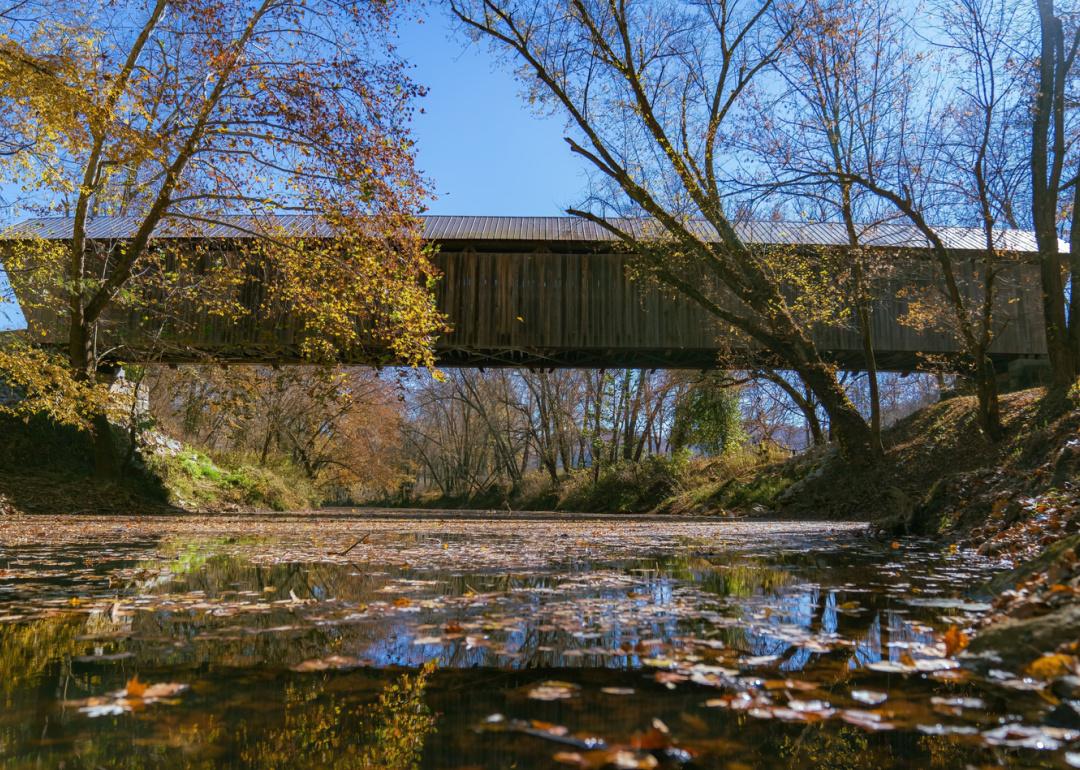
Christian County balances expansive farmland with the civic activity of Hopkinsville, its largest community. Agriculture continues to shape the county’s foundation, while commerce and culture add a steady rhythm of growth. Together, rural landscapes and town life define its character.
Residents gather for festivals, markets, and school events that reinforce close ties. Generations of families remain rooted here, giving the county a strong sense of continuity. Christian County reflects both tradition and adaptation, offering a grounded place to belong.
Where is Christian County?
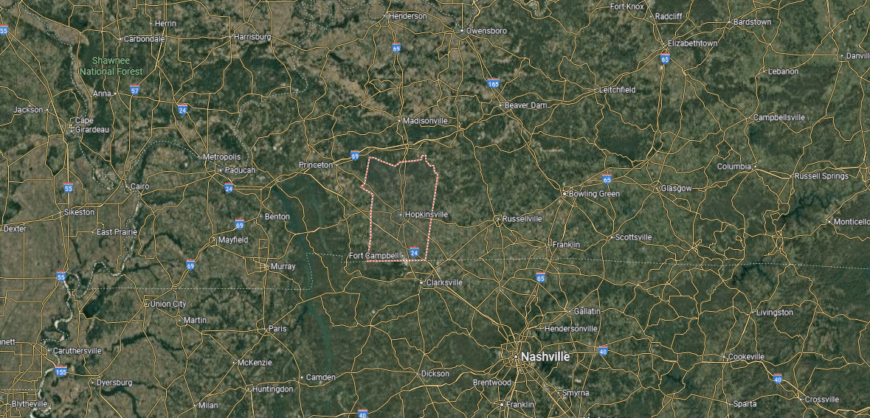
Christian County is positioned in southwestern Kentucky along the Tennessee border, about 75 miles northwest of Nashville and 170 miles southwest of Louisville. The county covers a wide area of farmland, rolling hills, and small waterways that flow into the Little River. Its location places it within reach of both regional trade centers and major transportation routes.
Hopkinsville, the county seat, sits near the center and serves as the focal point for government and commerce. Fort Campbell, a major U.S. Army base, occupies the southern boundary and extends into Tennessee. Together, these landmarks shape the county’s identity as both a military hub and an agricultural community.
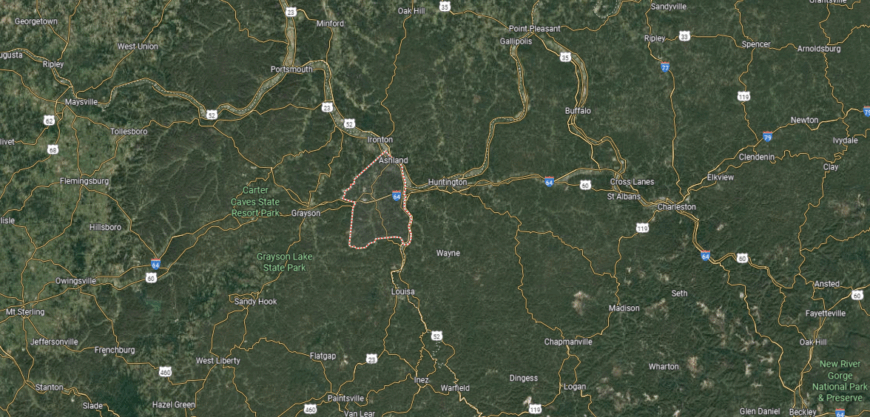
#44. Greenup County (tie)
– Life expectancy: 72.6 years
— 1.4 years lower than the state average
About
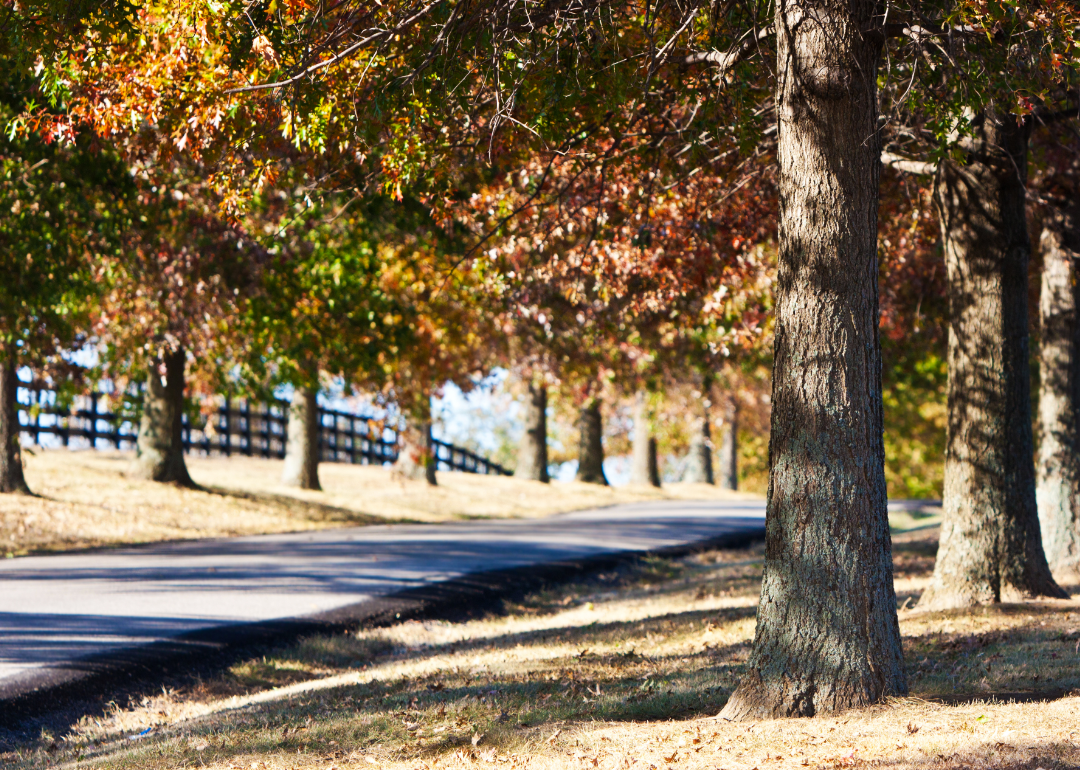
Greenup County rests along the Ohio River, where winding waterways and wooded hills create a distinctive landscape. River towns and wide rural stretches together reflect a heritage of trade, farming, and community resilience built over generations. The county’s identity carries both the calm of the countryside and the steady movement of the river.
Residents connect through seasonal fairs, school-centered gatherings, and traditions tied to the region’s long history. Family roots often extend across many decades, creating a rhythm of life grounded in continuity. Greenup County stands as a place where land, river, and people remain closely woven together.
Where is Greenup County?
Greenup County sits in the northeastern corner of Kentucky along the banks of the Ohio River. It lies about 110 miles east of Lexington and roughly 15 miles northeast of Ashland, connecting Kentucky with both Ohio and West Virginia. The county covers a mix of riverfront lowlands and rolling Appalachian foothills, giving it a varied landscape.
Greenup, the county seat, is located near the center along the Ohio River, while Flatwoods, South Shore, and Raceland serve as other key communities. U.S. Highway 23 runs north to south through the county, linking it to regional cities and trade routes. The Ohio River is a defining feature, shaping both transportation and the daily life of the area.
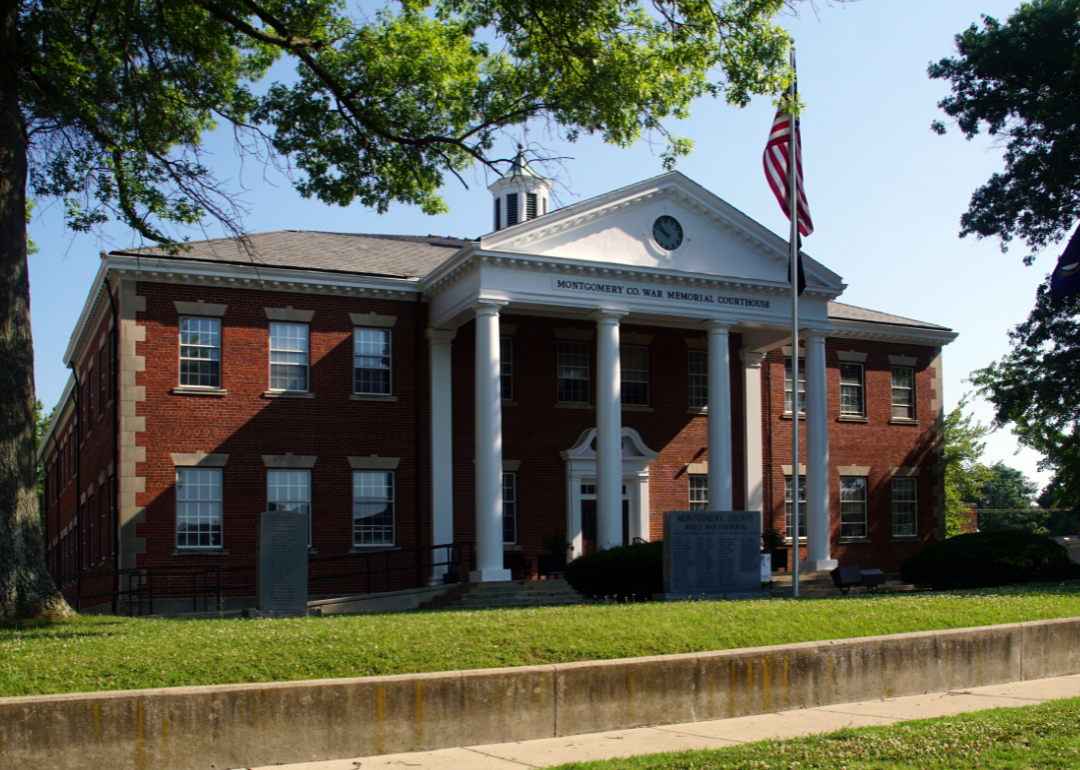
#44. Monroe County (tie)
– Life expectancy: 72.6 years
— 1.4 years lower than the state average
About
Monroe County lies in the rolling hills of south-central Kentucky, where farmland and small communities form the foundation of daily life. Its history is tied to agriculture and local craftsmanship, giving the county a sense of resilience shaped by the land. The county seat of Tompkinsville serves as a hub, connecting rural areas through schools, markets, and shared institutions.
Community life thrives through annual festivals, church gatherings, and traditions that highlight long-standing family ties. Generations remain closely linked to the soil, passing down a way of life rooted in steady values and pride in heritage. Monroe County endures as a place where history, land, and people remain deeply connected.
Where is Monroe County?
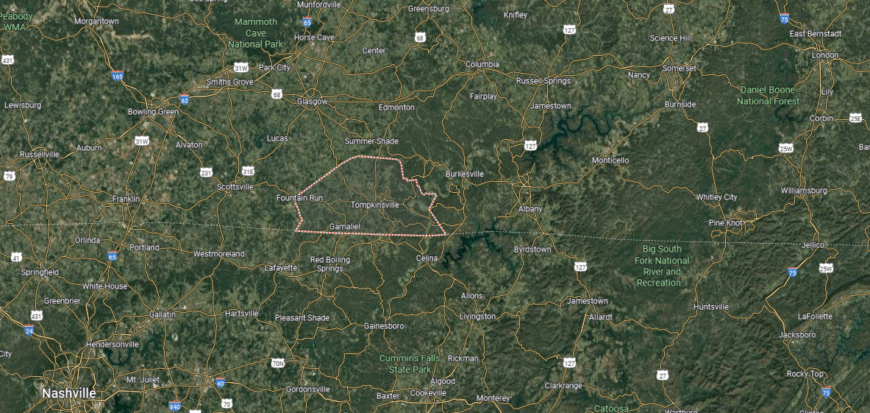
Monroe County is located in south-central Kentucky, bordering Tennessee to the south. It lies about 40 miles southeast of Bowling Green and roughly 100 miles northeast of Nashville. The county’s terrain is defined by open farmland, wooded hills, and the waters of the Cumberland River that brush its eastern edge.
Tompkinsville, the county seat, sits near the center and serves as the main hub for commerce and government. Smaller communities like Gamaliel and Fountain Run lie close to the Tennessee line, providing local connections across the border. The blend of rural landscapes and river access has long shaped Monroe County’s character and development.
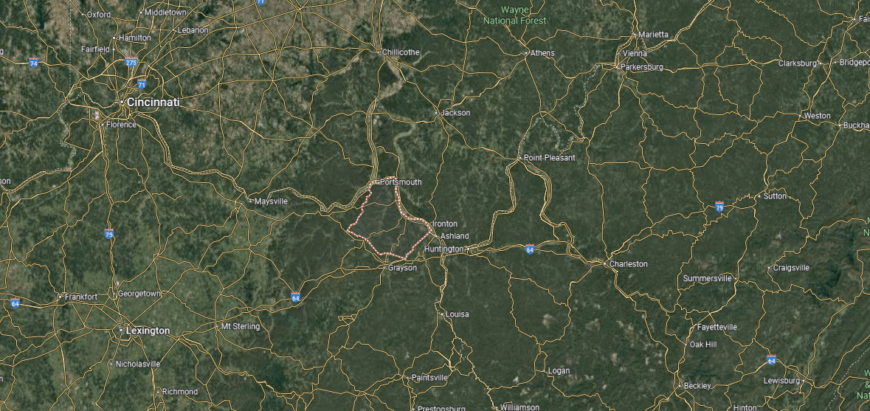
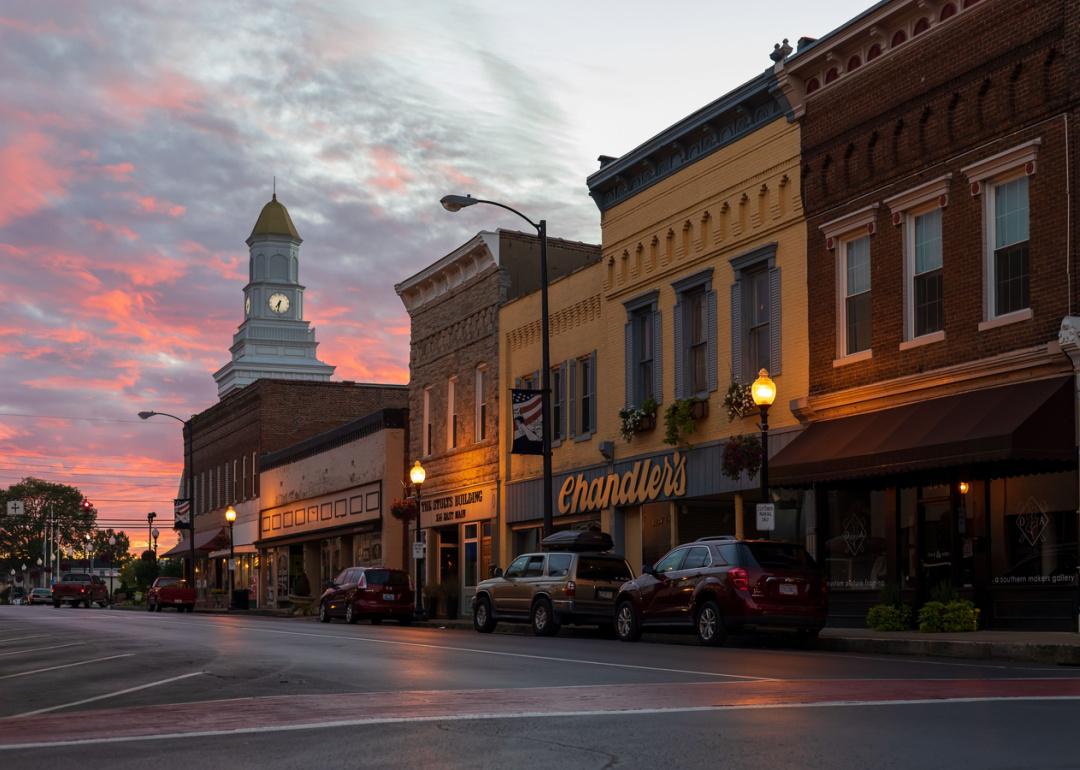
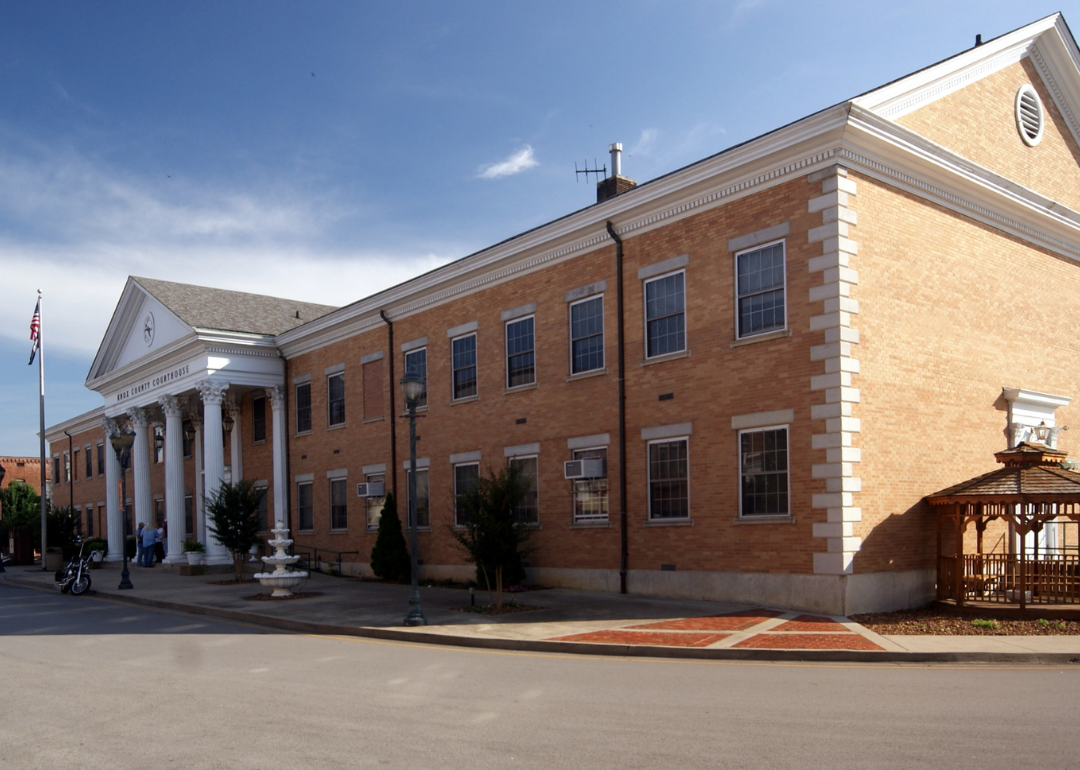
#44. Montgomery County (tie)
– Life expectancy: 72.6 years
— 1.4 years lower than the state average
You may also like: Counties in Kentucky with more precipitation over the past year than average
About
Montgomery County lies in the Bluegrass region, where farmland, small towns, and a steady pace of life create its foundation. Mount Sterling, the county seat, has long been a gathering point for trade, culture, and education, linking rural areas with broader opportunities. Together, historic landmarks, open fields, and local traditions form the county’s enduring character.
Festivals, school events, and civic traditions provide the rhythm of community life, drawing people together year after year. Deep family roots tie generations to both land and place, strengthening the bonds that hold the county steady. Montgomery County reflects a balance of heritage and progress, carrying forward a sense of belonging that endures.
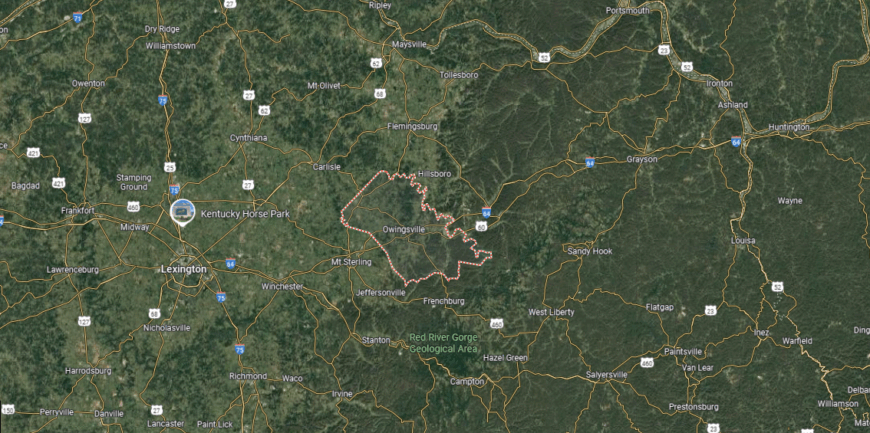
Where is Montgomery County?
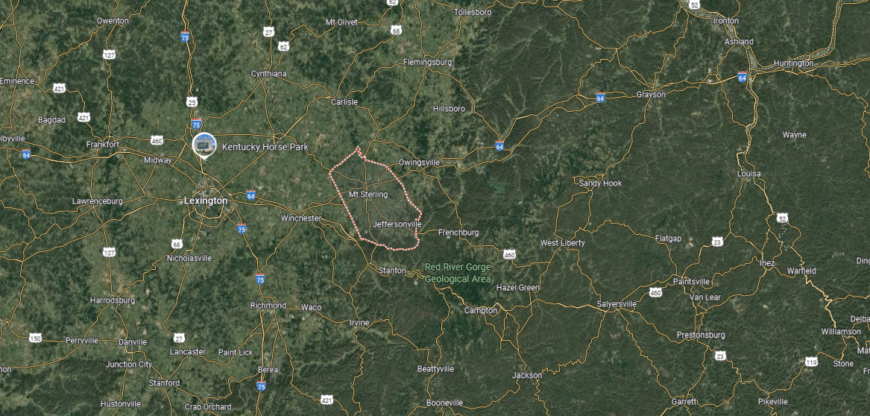
Montgomery County is found in east-central Kentucky, about 35 miles east of Lexington and within the Bluegrass region. The county covers just over 190 square miles, blending farmland with gently rolling hills. Its position places it along major travel routes that link central and eastern Kentucky.
Mount Sterling, the county seat, lies near the heart of the county and serves as its commercial and cultural center. Surrounding towns and rural communities spread outward, tied together by U.S. Highway 60 and Interstate 64. The landscape mixes agricultural fields with wooded ridges, reflecting the county’s balance between tradition and growth.
#44. Taylor County (tie)
– Life expectancy: 72.6 years
— 1.4 years lower than the state average

About
Taylor County rests in central Kentucky, where farmland, wooded ridges, and small-town life shape its setting. Campbellsville, the county seat, serves as the center of commerce, education, and local gatherings, linking rural communities across the area. Agriculture, industry, and regional trade together provide the backbone of the county’s identity.
Church events, fairs, and seasonal traditions highlight the strong role of community in daily living. Generations often remain connected to the land, carrying forward both family history and a sense of continuity. Taylor County reflects a blend of rural heritage and civic life, steady in its character and ties to place.
Where is Taylor County?
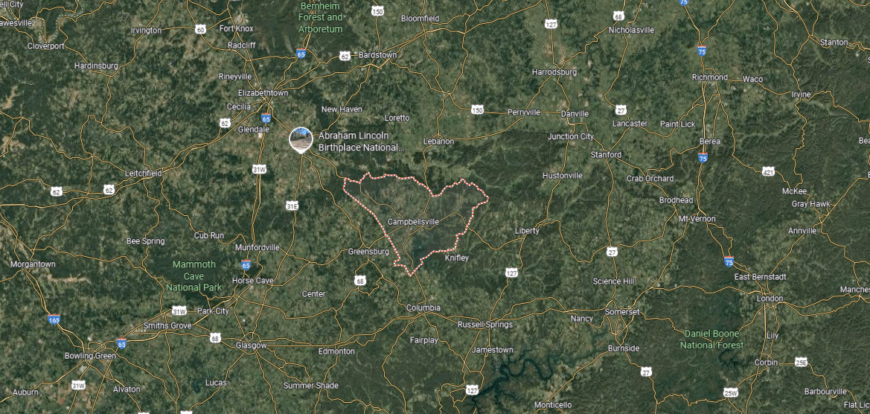
🔥 Would you like to save this?
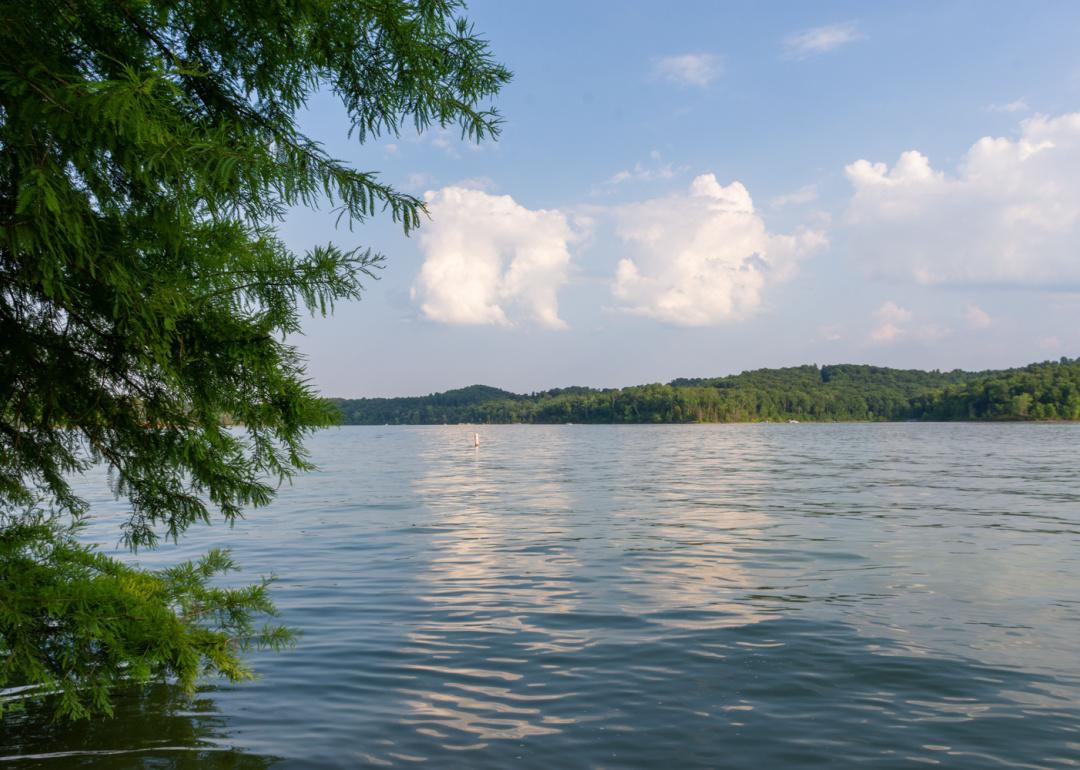
Taylor County is situated in the central-south region of Kentucky, roughly 90 miles southeast of Louisville and about 65 miles southwest of Lexington. The county spans rolling farmland, wooded areas, and open ridges, with Green River Lake stretching across its northern half. This mix of waterways and land has made it both a farming region and a recreational destination.
Campbellsville, the county seat, rests near the middle of the county and serves as the primary hub for business and education. Smaller communities and rural settlements spread outward, connected by state highways that link to surrounding counties. The presence of Green River Lake and its surrounding parklands gives Taylor County a distinct geographic anchor.
#44. Pulaski County (tie)
– Life expectancy: 72.6 years
— 1.4 years lower than the state average
About
Pulaski County sits in south-central Kentucky, bordered by rolling hills and anchored by the waters of Lake Cumberland. Somerset, the county seat, has developed into a hub for business, education, and regional activity, connecting the surrounding rural areas. The blend of farmland, lakefront, and town life shapes the county’s unique character.
The presence of Lake Cumberland defines much of the county’s recreation, from fishing and boating to community events along the shoreline. Families and visitors alike find continuity in both land-based traditions and water-centered pastimes. Pulaski County stands as a place where natural resources, local life, and regional ties remain deeply intertwined.
Where is Pulaski County?
Pulaski County is located in the south-central part of Kentucky, stretching across more than 650 square miles of farmland, hills, and waterways. It sits about 80 miles south of Lexington and roughly 120 miles north of Knoxville, Tennessee, giving it a central spot between major urban areas. Lake Cumberland defines much of the county’s southern edge, making the area both scenic and recreationally important.
Somerset serves as the county seat and stands at the heart of Pulaski County as its largest city and economic hub. Other communities such as Burnside, Eubank, and Science Hill provide smaller local centers spread across the county. The combination of agriculture, tourism, and transportation routes gives Pulaski County a distinct role in the region.
#42. Russell County (tie)
– Life expectancy: 72.5 years
— 1.5 years lower than the state average
About
Russell County rests in south-central Kentucky, shaped by farmland, ridges, and the waters of Lake Cumberland. Jamestown and Russell Springs serve as central gathering points, blending small-town life with the wider rural surroundings. Agriculture and the lake together form the foundation of the county’s identity.
Lake Cumberland plays a major role in recreation, drawing families for fishing, boating, and seasonal festivals along its shores. Local traditions, schools, and churches strengthen ties within the community and carry forward a sense of belonging. Russell County endures as a place where natural beauty and rural heritage remain closely connected.
Where is Russell County?
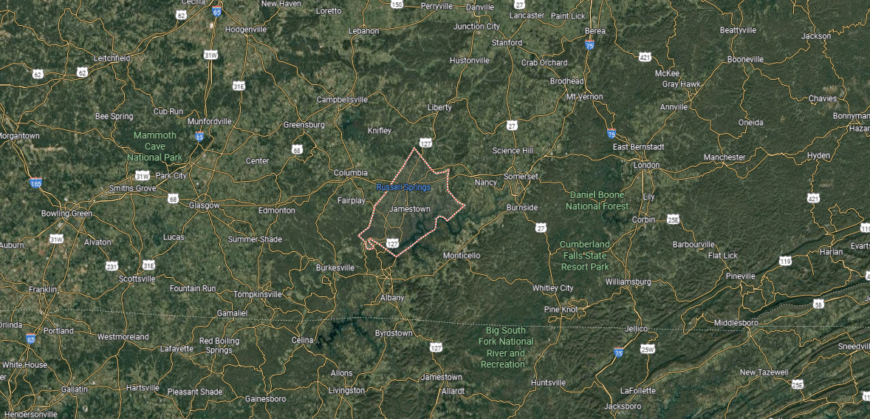
Russell County is located in south-central Kentucky, bordered to the south by the waters of Lake Cumberland, one of the state’s largest reservoirs. It lies about 90 miles south of Lexington and roughly 130 miles northwest of Knoxville, Tennessee, placing it in a region where rolling hills give way to wide stretches of lake shoreline. The terrain combines farmland with wooded ridges and recreation areas tied closely to the lake.
Jamestown, the county seat, sits near Lake Cumberland’s northern shore and functions as the primary gateway to marinas, state parks, and tourism along the reservoir. Russell Springs, a few miles northeast, serves as a commercial hub with shops and schools that anchor daily life. Together, these towns reflect the county’s balance of agricultural heritage and its reliance on lake-based recreation.
#42. Boyd County (tie)
– Life expectancy: 72.5 years
— 1.5 years lower than the state average
About
Boyd County lies in northeastern Kentucky along the Ohio River, where river commerce and industrial growth have long influenced its development. Ashland, the county seat, stands as a regional hub for business, education, and cultural life, tying together surrounding towns and neighborhoods. The county’s setting reflects both its industrial heritage and its Appalachian landscape.
Historic neighborhoods, schools, and civic groups provide continuity for families who have lived here across generations. Arts, festivals, and recreational opportunities along the river add layers of community connection. Boyd County represents a place where industry, history, and local life remain firmly interwoven.
Where is Boyd County?
Boyd County is positioned in the northeastern corner of Kentucky where the state meets both Ohio and West Virginia. It lies about 125 miles east of Lexington and is part of the broader Huntington–Ashland metropolitan area. The Ohio River shapes much of its northern boundary, while rolling Appalachian foothills spread southward through the county.
Catlettsburg serves as the county seat, located at the confluence of the Ohio and Big Sandy Rivers. Ashland, the largest city, anchors the region’s industry and commerce along the riverfront. Smaller communities such as Cannonsburg and Summit connect the rural areas, making Boyd County a mix of urban centers and river valley landscapes.
#41. Butler County
– Life expectancy: 72.4 years
— 1.6 years lower than the state average
You may also like: Best-performing Kentucky stocks last week

About
Butler County sits in western Kentucky, where farmland, river valleys, and wooded ridges form its backdrop. Morgantown serves as the county seat, providing a focal point for schools, commerce, and civic activity. The county’s story is tied to agriculture, local craftsmanship, and the quiet strength of small communities.
Traditions are kept alive through fairs, church gatherings, and events that bring neighbors together across generations. Family histories run deep, giving residents a sense of belonging that carries from past to present. Butler County continues to reflect the values of connection, place, and resilience that define its character.
Where is Butler County?
Butler County is set in western Kentucky, positioned along the Green River which winds through its northern half. It lies about 95 miles southwest of Louisville and roughly 35 miles north of Bowling Green, placing it within reach of larger trade and travel routes. The county’s landscape is made up of farmland, wooded ridges, and the waterways that feed into the Green River system.
Morgantown, the county seat, rests near the center and acts as the main hub for government and community life. Smaller towns and rural settlements, such as Woodbury and Rochester, line the river and surrounding countryside. The county’s identity is closely tied to its river access, fertile lands, and small-town setting.
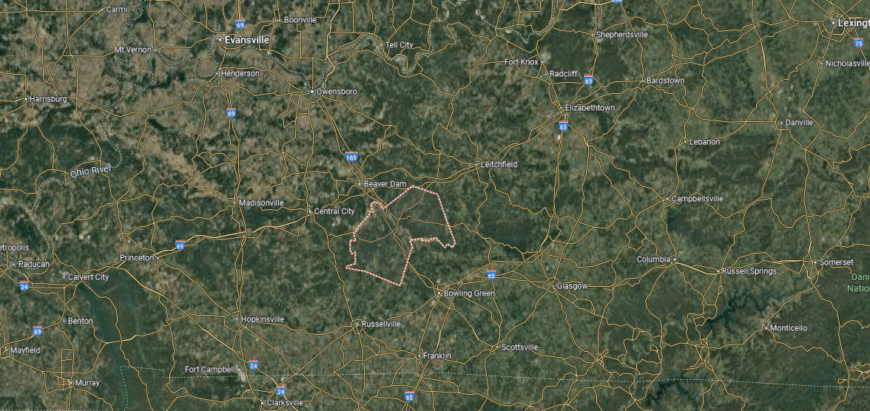
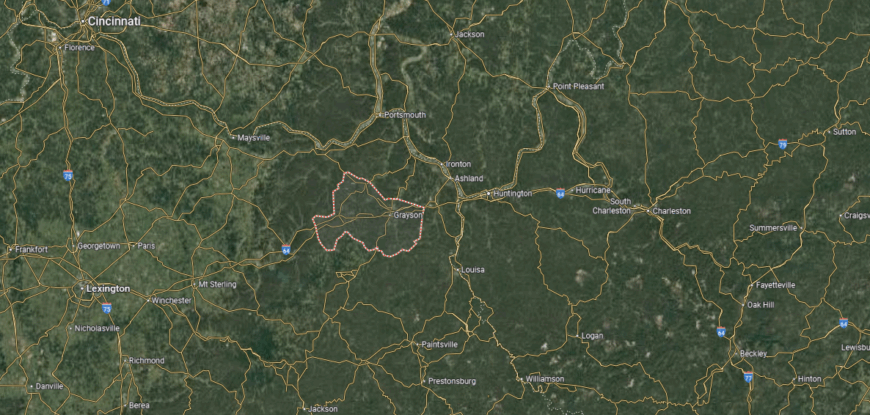
#40. Grayson County
– Life expectancy: 72.2 years
— 1.8 years lower than the state average
About
Grayson County lies between the Green River and Nolin River watersheds, where farmland, forests, and two major lakes shape its landscape. Leitchfield serves as the county seat, anchoring schools, businesses, and civic life for surrounding communities. The presence of Rough River Lake and Nolin Lake gives the county both identity and opportunity.
Fishing tournaments, lake festivals, and seasonal gatherings bring people together while supporting the local economy. Generational ties to farming and small-town living remain strong, grounding the county’s traditions in place. Grayson County endures as a landscape of water, land, and community woven together.
Where is Grayson County?
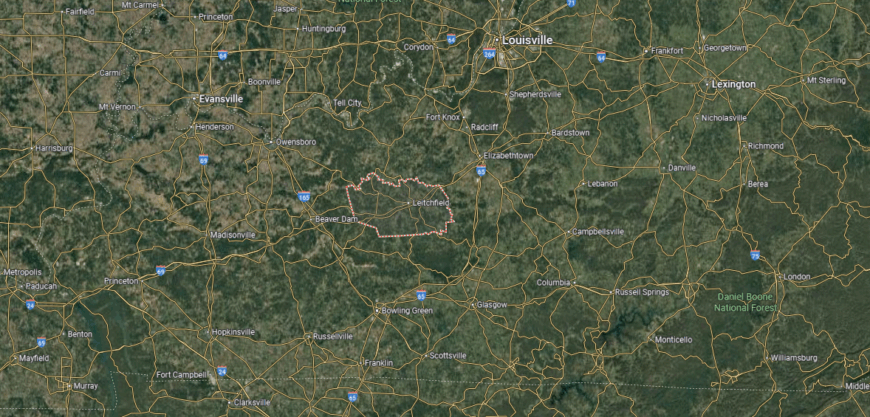
Grayson County is located in west-central Kentucky, about 75 miles southwest of Louisville and 65 miles northeast of Bowling Green. The county spans rolling farmland, wooded hills, and prominent waterways, with Rough River Lake forming much of its northern boundary and Nolin River Lake cutting into its southern edge. This geography makes it both an agricultural region and a recreation spot.
Leitchfield, the county seat, sits at the center where U.S. Highways 62 and 259 intersect, serving as the hub for commerce and services. Smaller communities such as Clarkson and Caneyville provide local connections across the county. With its lakes, farmland, and crossroads location, Grayson County links natural resources with regional travel routes.
#37. Menifee County (tie)
– Life expectancy: 72.1 years
— 1.9 years lower than the state average
About
Menifee County sits within the Appalachian foothills, where ridges, forests, and winding creeks define its setting. Frenchburg, the county seat, provides a central point for schools and civic life, linking scattered rural communities together. The county’s heritage reflects a deep connection to the land and the endurance of small-town traditions.
Local life is marked by church gatherings, seasonal events, and family histories that stretch across generations. Crafts, storytelling, and ties to the surrounding hills give the community a strong sense of identity. Menifee County remains a place where heritage and landscape continue to guide daily living.
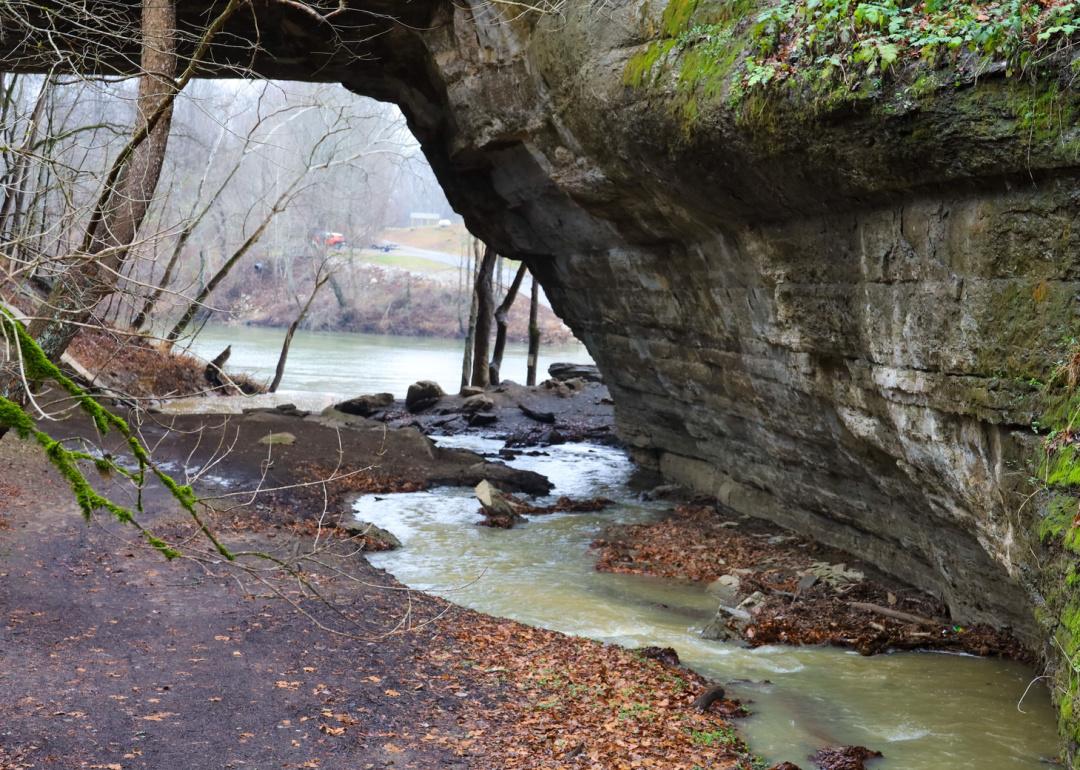
Where is Menifee County?
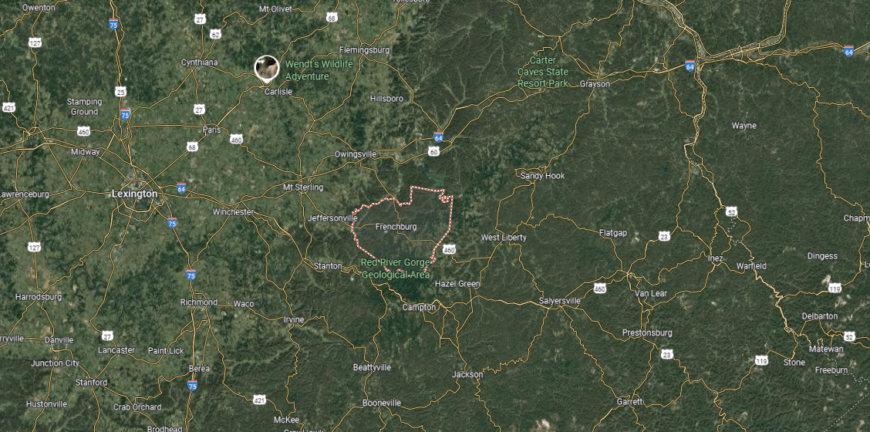
🔥 Would you like to save this?
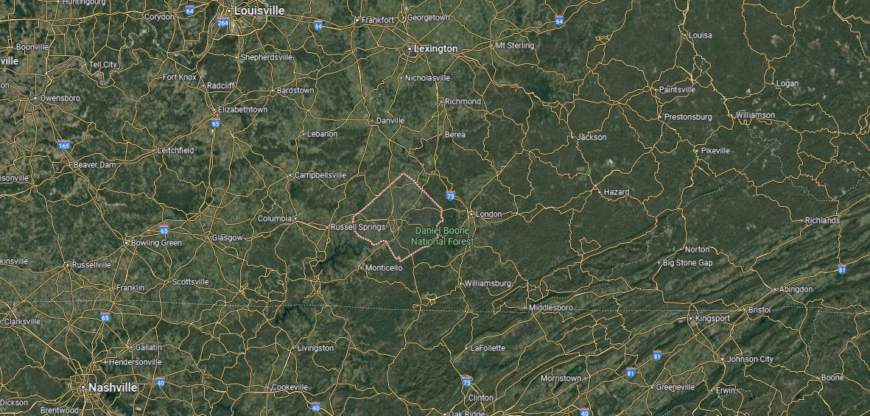
Menifee County rests in the foothills of eastern Kentucky, within the Daniel Boone National Forest. It is about 60 miles east of Lexington and spans a smaller area compared to many counties, with a landscape dominated by wooded ridges, valleys, and winding creeks. The Red River Gorge lies just to the south, giving the county proximity to one of Kentucky’s best-known natural landmarks.
Frenchburg, the county seat, is located near the center and serves as the county’s main gathering point for government and local services. Smaller communities and rural settlements are scattered across the hills, connected by state highways such as KY 36 and KY 1274. Menifee County is defined by its rugged terrain, forested lands, and its ties to outdoor recreation in the surrounding region.
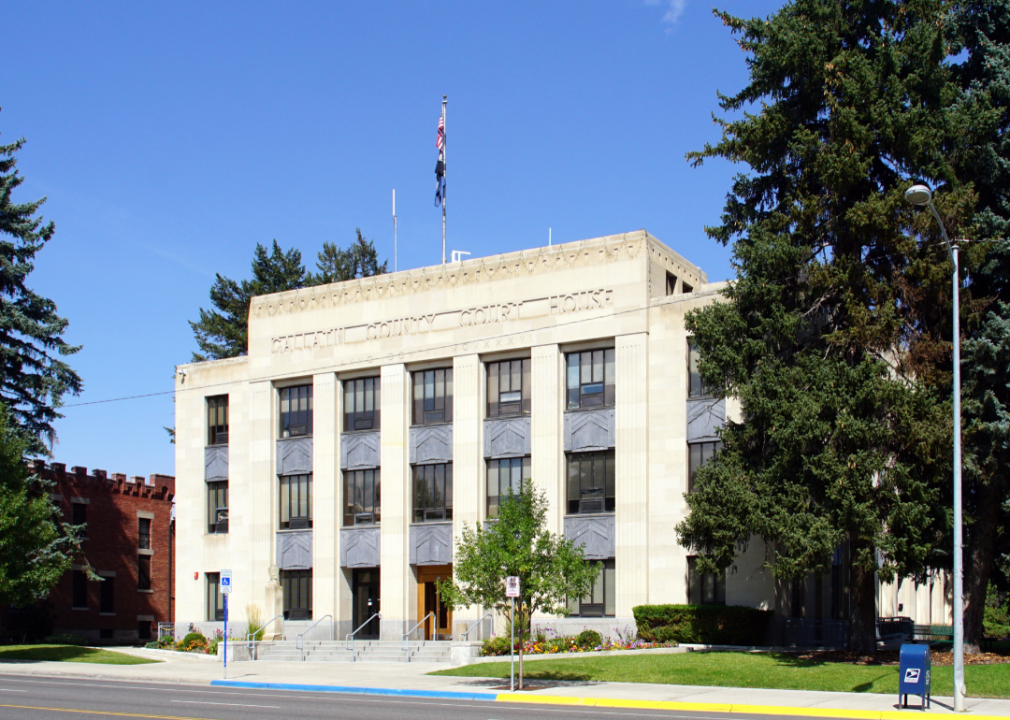
#37. Gallatin County (tie)
– Life expectancy: 72.1 years
— 1.9 years lower than the state average
About
Life in Gallatin County centers on its small communities, where schools, churches, and local events keep neighbors closely connected. Warsaw, the county seat, provides a gathering place for commerce and civic activity, tying together the county’s rural stretches. Generational families contribute to a strong sense of continuity and belonging.
Set along the Ohio River, the county’s landscape includes fertile farmland and wooded hills that have long supported agriculture. River access has shaped both its history and its ties to surrounding regions. Gallatin County reflects a steady balance of rural heritage, community spirit, and natural setting.
Where is Gallatin County?
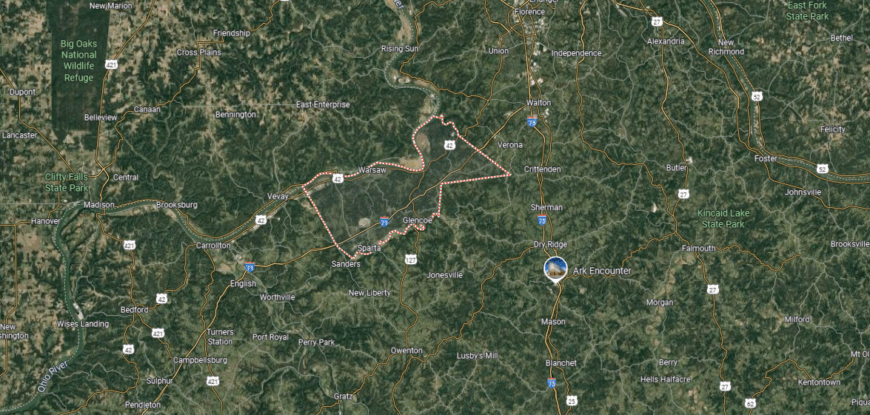
Gallatin County is situated in northern Kentucky along the Ohio River, where the state meets Indiana. It lies about 55 miles northeast of Louisville and roughly 45 miles southwest of Cincinnati, giving it a strategic position between two major metro areas. The county is compact, covering a little more than 100 square miles of farmland, river valleys, and rolling hills.
Warsaw, the county seat, sits on the Ohio River and serves as the county’s main center of activity. Nearby, Glencoe and Sparta are smaller towns, with Sparta noted for hosting the Kentucky Speedway. The river, farmland, and highway access together shape Gallatin County’s blend of rural life and regional connections.
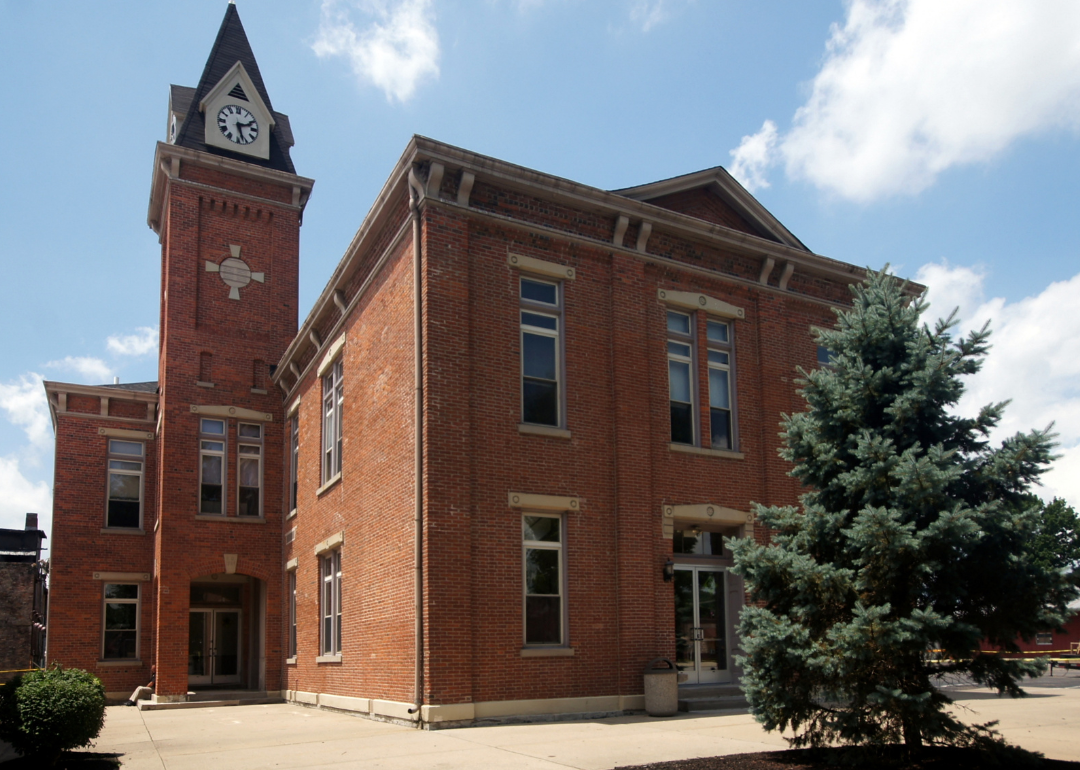
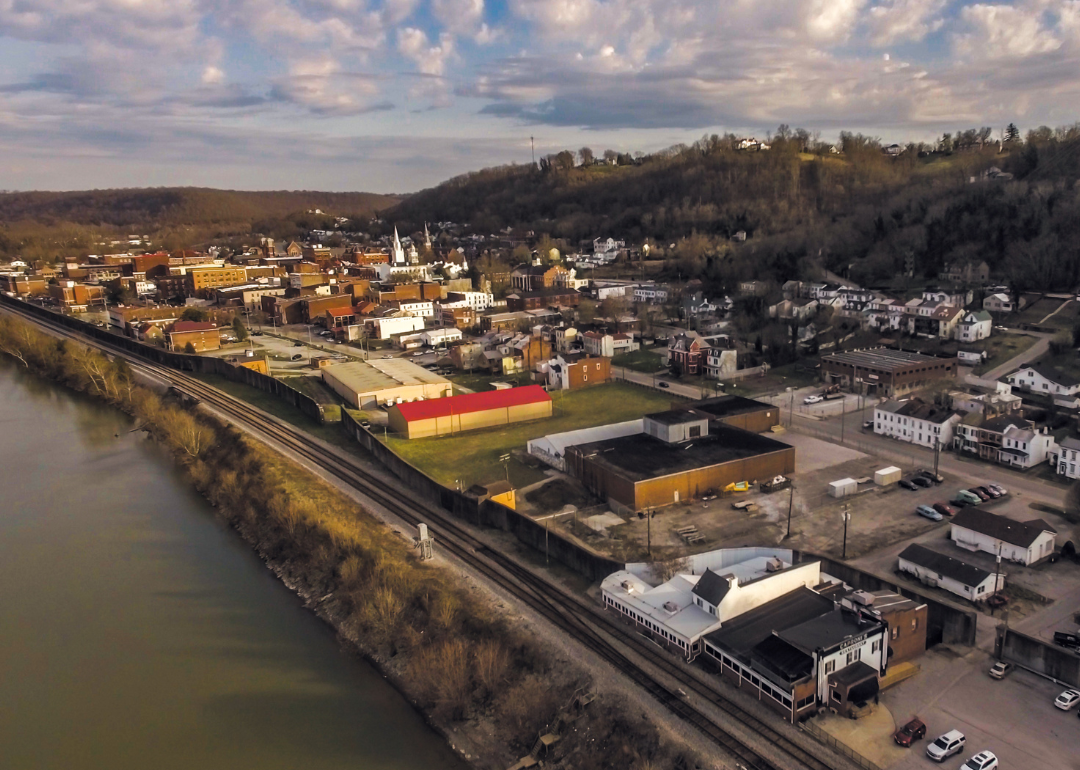
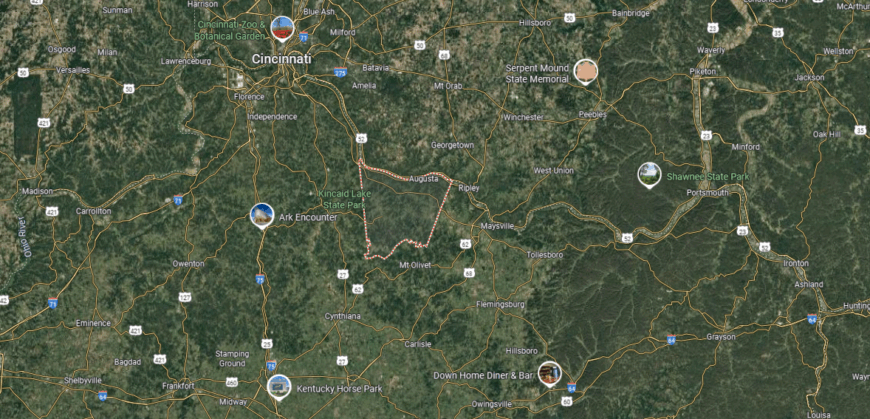
#37. Pendleton County (tie)
– Life expectancy: 72.1 years
— 1.9 years lower than the state average
About
Pendleton County lies in northern Kentucky, where rolling farmland meets wooded valleys and the Licking River winds through its landscape. Falmouth, the county seat, has long been a gathering place for trade, schools, and civic traditions, anchoring the surrounding countryside. The county’s history reflects a blend of agricultural roots and strong local resilience.
Cultural life continues through fairs, church gatherings, and events that highlight both farming heritage and community pride. Families maintain ties across generations, giving stability and continuity to daily life. Pendleton County stands as a place where land, history, and people remain closely bound together.
Where is Pendleton County?
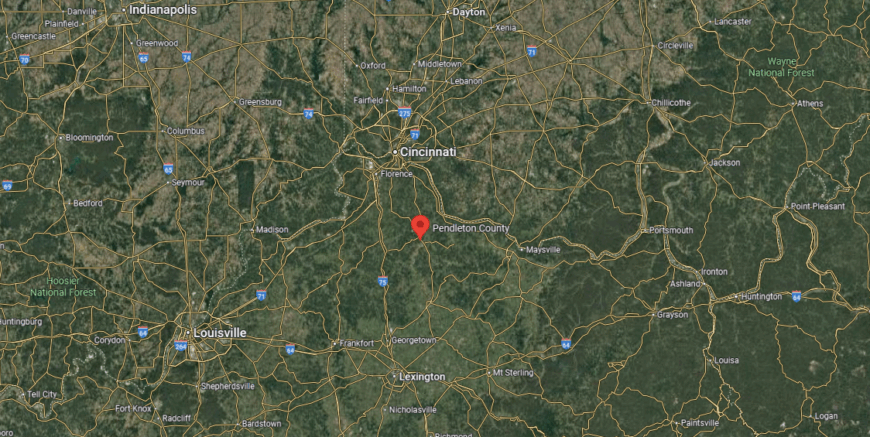
Pendleton County lies in northern Kentucky, positioned between the Licking River’s north and south forks. It is located about 40 miles south of Cincinnati and roughly 30 miles north of Lexington, giving it ties to both metropolitan regions. The land is marked by rolling hills, fertile valleys, and waterways that define much of its geography.
Falmouth, the county seat, sits at the confluence of the two forks of the Licking River and serves as the county’s hub. Smaller communities such as Butler and Morgan spread along highway corridors and riverbanks. With its mix of farmland, river valleys, and proximity to larger cities, Pendleton County maintains a rural character while remaining well connected.
#36. Mason County
– Life expectancy: 72.0 years
— 2.0 years lower than the state average
You may also like: Which movies were filmed in Kentucky?
About
Mason County carries a strong sense of history, with deep ties to river trade, early settlement, and long-standing community traditions. Maysville, the county seat, reflects this heritage through its historic downtown, cultural institutions, and role as a regional center. The Ohio River frames the county’s setting, linking past and present in its steady flow.
Festivals, arts programs, and local gatherings highlight the cultural spirit that continues to thrive here. Generational families remain closely tied to the land, blending rural life with town energy. Mason County endures as a place where history, culture, and community remain inseparable.
Where is Mason County?
Mason County is positioned in northeastern Kentucky along the Ohio River, directly across from the state of Ohio. It lies about 60 miles northeast of Lexington and roughly 55 miles west of Huntington, West Virginia, placing it within the central Ohio River Valley. The county is known for its blend of riverfront lowlands and gently rolling hills that extend inland.
Maysville, the county seat, rests on the river and has long been a key crossing point and trade center between Kentucky and Ohio. Smaller communities such as Dover, Germantown, and Sardis connect the surrounding rural areas. With its river access, historic towns, and agricultural landscapes, Mason County balances local tradition with regional importance.
#34. Webster County (tie)
– Life expectancy: 71.9 years
— 2.1 years lower than the state average
About
Webster County reflects a legacy shaped by coal mining, farming, and the endurance of rural communities. Dixon, the county seat, anchors schools, commerce, and civic life, linking together small towns across the area. The county’s story carries both the challenges of its industrial past and the traditions of its people.
Rolling farmland, wooded areas, and river valleys provide the landscape that supports work and recreation. Festivals, church gatherings, and family ties strengthen the bonds that hold communities together. Webster County remains a place where history, land, and community continue to shape daily life.
Where is Webster County?
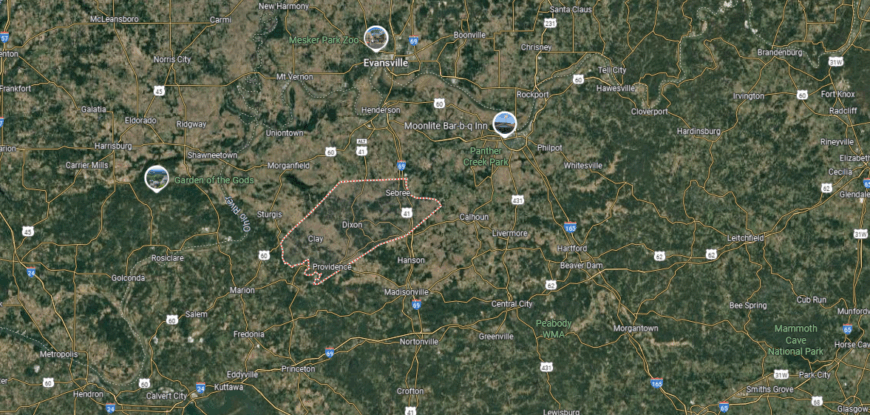
Webster County is located in western Kentucky within the state’s coalfield region. It sits about 40 miles southwest of Evansville, Indiana, and roughly 150 miles west of Louisville. The county’s landscape is shaped by gently rolling hills, farmland, and areas historically tied to coal mining.
Dixon, the county seat, lies near the center and functions as the main hub for government and services. Providence and Sebree are other key towns, each contributing to the county’s economic and community life. With its mix of agriculture, mining heritage, and small-town character, Webster County reflects both tradition and rural industry.
#34. Crittenden County (tie)
– Life expectancy: 71.9 years
— 2.1 years lower than the state average

🔥 Would you like to save this?
About
Crittenden County lies in western Kentucky, where farmland, forests, and the Ohio River define its borders. Marion, the county seat, serves as the center of schools, commerce, and civic life, connecting scattered rural communities. The county’s identity reflects both its agricultural roots and its ties to the river.
Mining heritage, local festivals, and church-centered gatherings shape much of community life. Families often remain in place for generations, carrying forward traditions that link past and present. Crittenden County continues to reflect a balance of land, heritage, and community strength.
Where is Crittenden County?
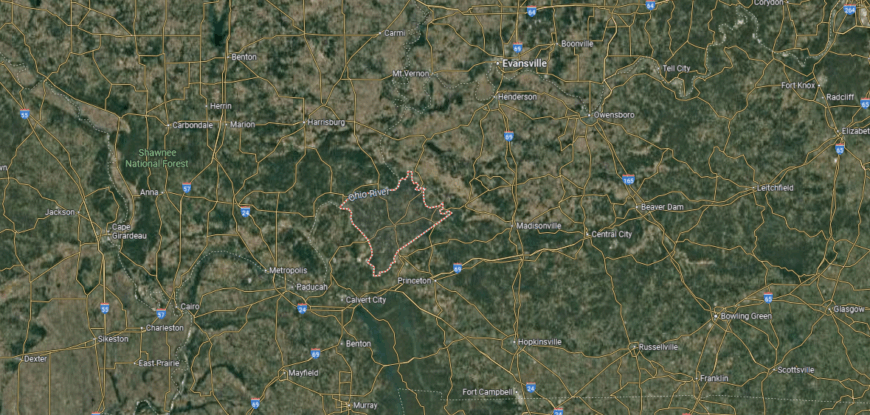
Crittenden County is set in western Kentucky along the Ohio River, directly across from southern Illinois. It lies about 60 miles northwest of Paducah and nearly 150 miles southwest of Louisville, making it part of the state’s river corridor region. The terrain blends river bottoms, farmland, and wooded uplands that stretch toward the Shawnee National Forest across the river.
Marion, the county seat, is located near the center and serves as the focal point for government and commerce. Smaller communities such as Dycusburg and Tolu sit closer to the river, reflecting the county’s historic ties to trade and river travel. With its mix of agriculture, riverfront, and rural settlements, Crittenden County connects Kentucky’s interior to its western waterways.
#33. Carter County
– Life expectancy: 71.8 years
— 2.2 years lower than the state average
About
Carter County is defined by its close-knit communities, where schools, churches, and gatherings bring people together across rural stretches. Grayson and Olive Hill serve as centers of activity, linking residents through commerce, education, and shared traditions. The county’s character reflects both Appalachian heritage and the steady rhythm of small-town life.
Caves, forests, and rolling hills form the natural backdrop, giving residents access to outdoor recreation and a strong tie to the land. Local festivals and family histories deepen the sense of belonging across generations. Carter County stands as a place where community, heritage, and landscape remain inseparable.
Where is Carter County?
Carter County lies in northeastern Kentucky, set within the Appalachian foothills. It is located about 65 miles northeast of Lexington and roughly 25 miles west of Ashland, giving it a position between the Bluegrass region and the Ohio River Valley. The landscape is defined by rugged hills, forested ridges, and caves, with parts of Grayson Lake extending into the county.
Grayson, the county seat, sits along Interstate 64 and serves as the primary hub for commerce and travel. Olive Hill, another notable town, lies to the west and anchors the county’s cultural and historic heritage. With its mix of natural features, state parks, and small communities, Carter County combines rural life with outdoor recreation.
#32. Martin County
– Life expectancy: 71.6 years
— 2.4 years lower than the state average
About
Martin County carries a legacy tied to the Appalachian coalfields, where mining shaped both its economy and its identity for generations. Inez, the county seat, stands as a small but important hub for civic life, schools, and local commerce. The county’s story reflects resilience, with communities adapting while holding firmly to their roots.
Hills, hollows, and winding streams define the landscape, offering both challenges and connections to the land. Local traditions, church gatherings, and strong family networks sustain daily life across its rural communities. Martin County endures as a place where history, land, and community remain closely interwoven.
Where is Martin County?
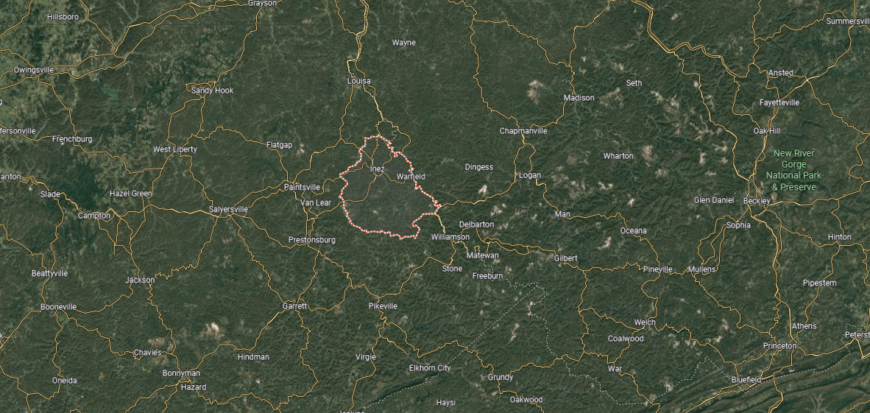
Martin County is located in the eastern tip of Kentucky along the border with West Virginia. It lies about 125 miles southeast of Lexington and roughly 45 miles south of Huntington, West Virginia. The county is part of the Appalachian Plateau, with steep ridges, narrow valleys, and streams that feed into the Tug Fork of the Big Sandy River.
Inez, the county seat, sits near the center and serves as the administrative and commercial hub. Warfield, another small town, rests on the Tug Fork directly across from Kermit, West Virginia, highlighting the county’s cross-state connections. Martin County’s identity is rooted in its Appalachian landscape, coal heritage, and close-knit rural communities.
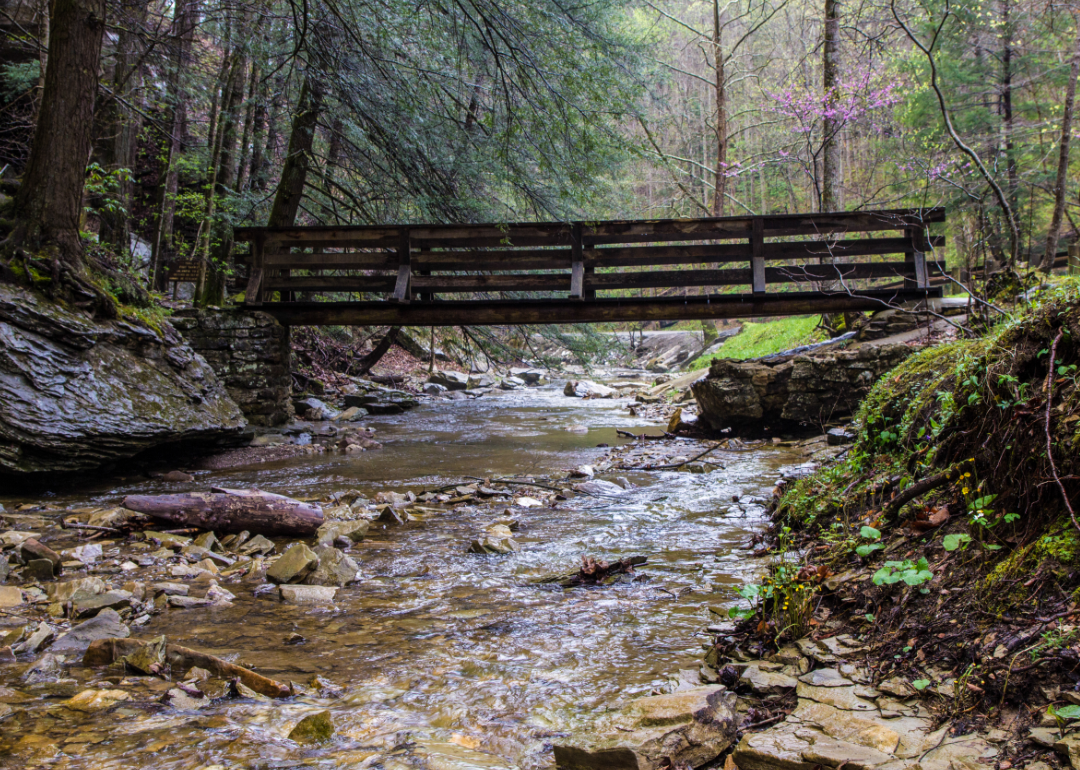
#31. Bracken County
– Life expectancy: 71.5 years
— 2.5 years lower than the state average
You may also like: Counties with the longest life expectancy in Kentucky
About
Bracken County stretches along the Ohio River, where fertile farmland and rolling hills shape its rural identity. Augusta and Brooksville serve as central towns, connecting residents through commerce, schools, and civic traditions. The river’s presence has long tied the county to trade, travel, and cultural exchange.
Heritage is preserved through festivals, historic sites, and community events that highlight its deep agricultural roots. Families remain closely tied to the land, passing down traditions that carry across generations. Bracken County continues to reflect a steady balance of river, land, and community life.
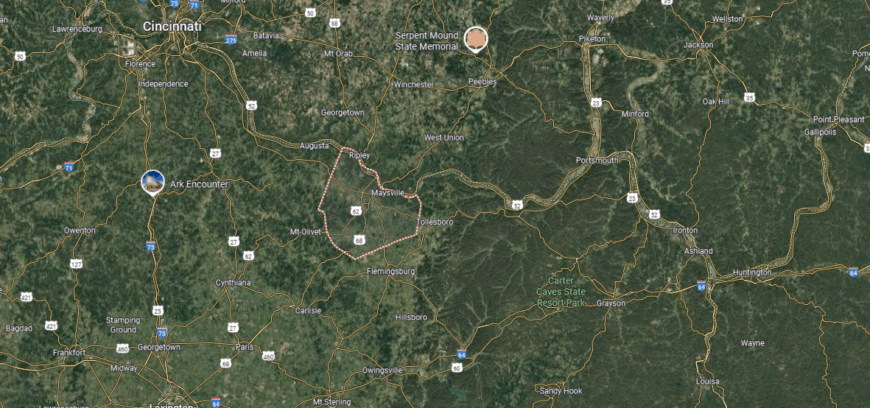
Where is Bracken County?
Bracken County is set in northern Kentucky along the Ohio River, directly across from the state of Ohio. It lies about 50 miles northeast of Lexington and roughly the same distance southeast of Cincinnati, giving it ties to both regions. The county’s landscape includes fertile river bottoms, rolling farmland, and wooded hills that extend inland from the river.
Brooksville, the county seat, is located near the geographic center, while Augusta, a riverfront town, sits along the Ohio and is known as one of the county’s oldest communities. Germantown and other small settlements connect the rural countryside. With its river access, farmland, and historic communities, Bracken County reflects both its agricultural roots and river valley heritage.
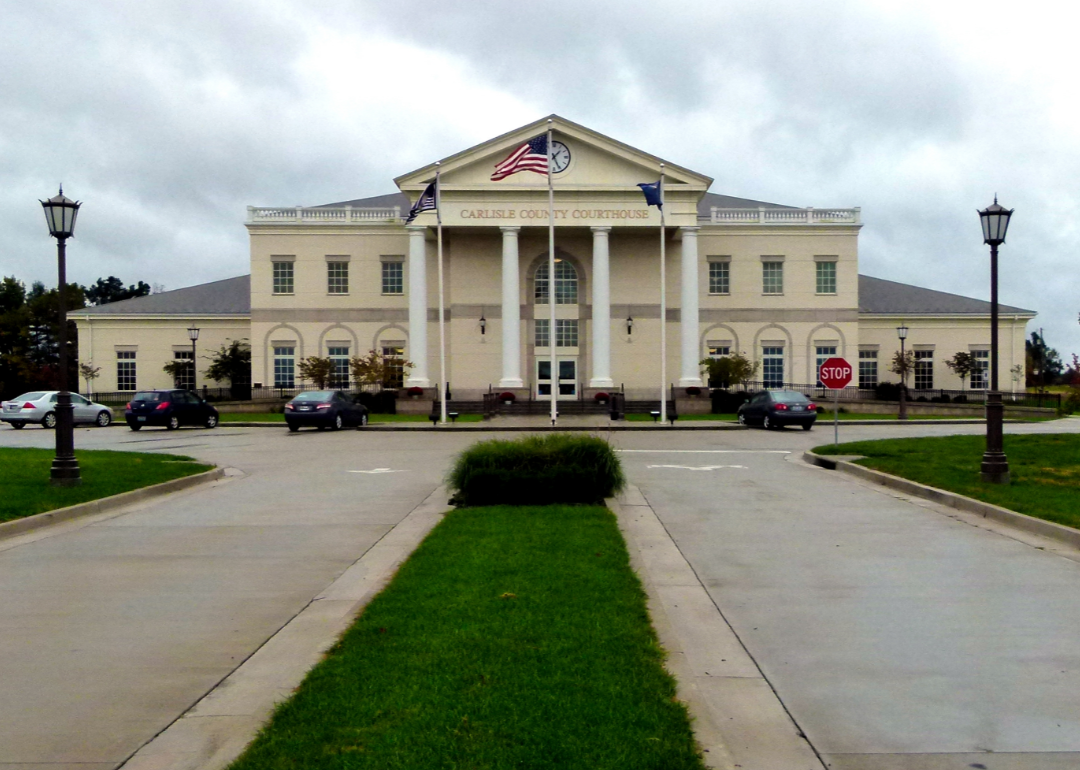
#29. Carlisle County (tie)
– Life expectancy: 71.3 years
— 2.7 years lower than the state average
About
Carlisle County is marked by its small-town gatherings, church events, and school-centered traditions that bind neighbors together. Bardwell, the county seat, serves as the heart of civic life, connecting the wider rural landscape through commerce and community institutions. These rhythms of local life give the county its enduring sense of belonging.
Stretching across western Kentucky, the county’s farmland and river bottoms support agriculture as a steady foundation. Families often remain rooted for generations, carrying forward a heritage shaped by land and community ties. Carlisle County stands as a place where tradition, daily life, and natural setting remain closely linked.
Where is Carlisle County?
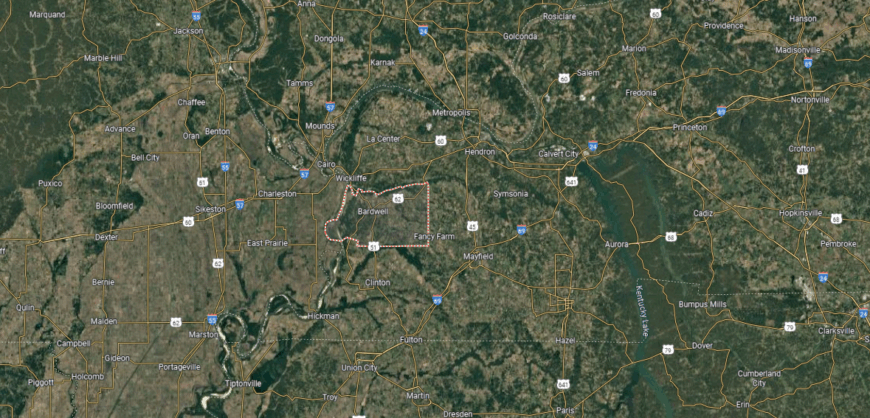
Carlisle County is located in the Jackson Purchase region of far western Kentucky. It lies about 35 miles west of Paducah and directly borders the Mississippi River at its western edge, making it part of the small section of Kentucky that touches both Missouri and Tennessee. The county’s terrain is mostly flat to gently rolling, with fertile farmland dominating its landscape.
Bardwell, the county seat, sits near the center and functions as the hub for government, schools, and local services. Smaller communities such as Arlington and Milburn are scattered across the farmland and connected by state highways that cross the countryside. With its agricultural base and direct Mississippi River frontage, Carlisle County maintains a rural identity rooted in both land and waterways.
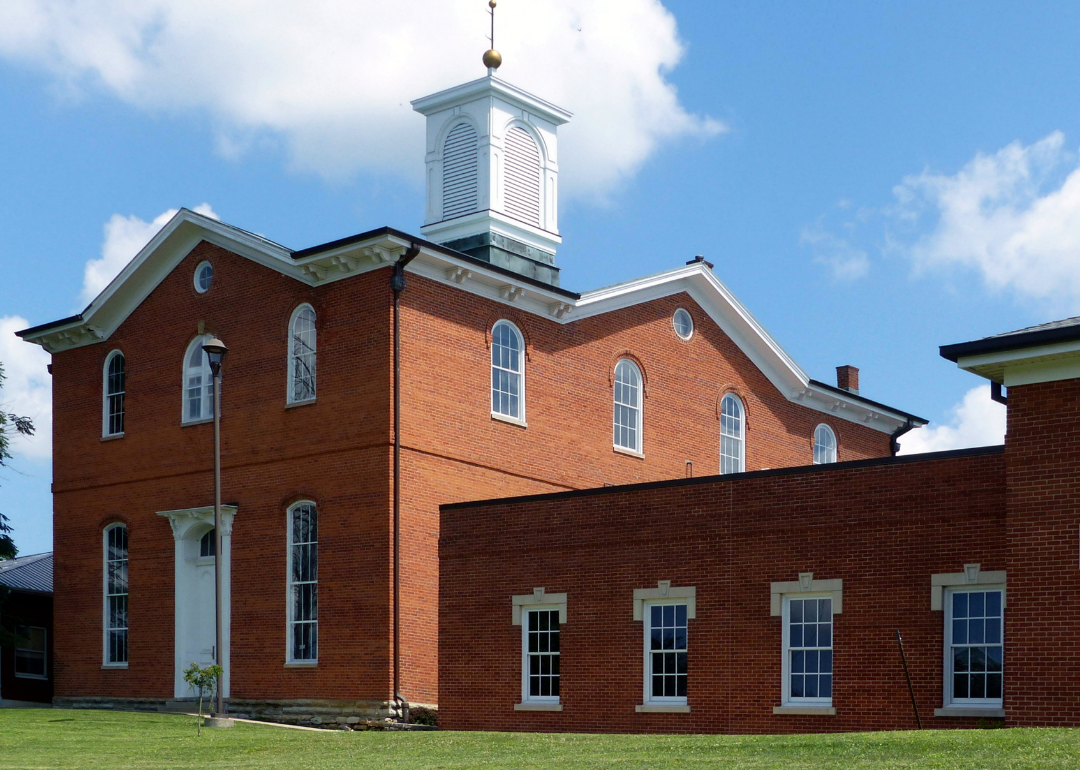
#29. Robertson County (tie)
– Life expectancy: 71.3 years
— 2.7 years lower than the state average
About
Robertson County, the smallest in Kentucky, is defined by its quiet rural character and strong sense of local identity. Mount Olivet, the county seat, anchors schools, churches, and gatherings that connect the area’s close-knit communities. Agriculture and generational family ties form the county’s enduring foundation.
Rolling hills and farmland shape the landscape, offering both livelihood and continuity for residents. Traditions, seasonal events, and shared histories strengthen bonds across families and neighbors. Robertson County reflects a modest but steady balance of heritage, land, and community spirit.
Where is Robertson County?
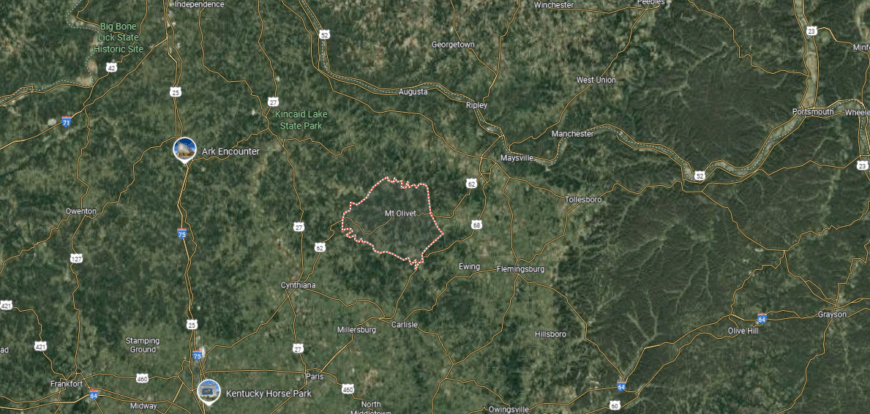
Robertson County is the smallest county in Kentucky, located in the northeastern part of the state. It sits about 60 miles northeast of Lexington and 25 miles southwest of Maysville, positioned within the rolling hills of the Bluegrass region. The county covers just under 100 square miles, giving it a compact but distinctive rural setting.
Mount Olivet, the county seat, is situated near the center and serves as the county’s main hub for government and community life. Other small settlements and family farms are spread across the countryside, connected by narrow state roads. Robertson County’s identity is tied to its small size, close-knit communities, and agricultural landscape.
#28. Lincoln County
– Life expectancy: 71.2 years
— 2.8 years lower than the state average
About
Lincoln County is one of Kentucky’s oldest counties, carrying a legacy tied to the state’s early settlement and frontier past. Stanford, the county seat, reflects this heritage through historic buildings, civic life, and its role as a center for the surrounding farmland. The county’s identity rests on both its long history and its ongoing rural traditions.
Rolling farmland, ridges, and small communities shape the daily rhythm of life. Festivals, school activities, and local gatherings sustain a sense of continuity across generations. Lincoln County remains a place where history and community are firmly woven together.
Where is Lincoln County?
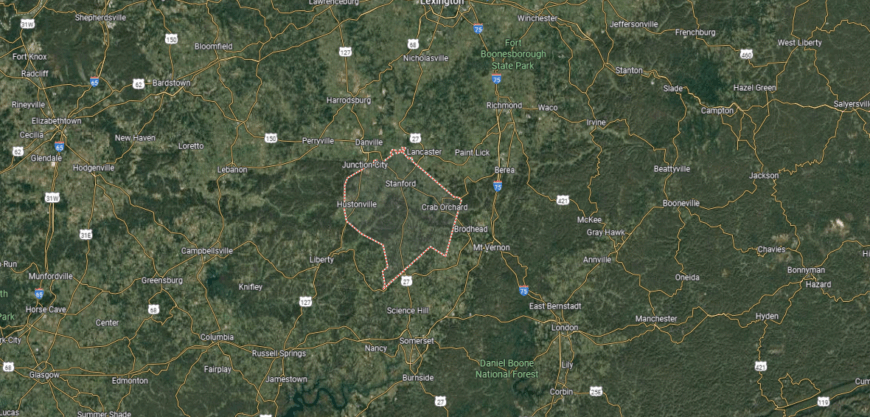
Lincoln County is situated in south-central Kentucky at the edge of the Bluegrass region. It lies about 45 miles south of Lexington and roughly 85 miles southeast of Louisville, giving it a position along major travel corridors that connect central Kentucky to the Appalachian foothills. The county’s landscape is shaped by fertile farmland, wooded ridges, and valleys cut by the Dix and Green Rivers.
Stanford, the county seat, is one of Kentucky’s oldest towns and lies near the geographic center of the county. Other communities such as Crab Orchard, Hustonville, and Waynesburg are spread across the countryside, each serving as local anchors for schools, churches, and commerce. With its historic roots and mix of farmland and ridges, Lincoln County blends early settlement heritage with a steady rural identity.
#27. Lawrence County
– Life expectancy: 71.1 years
— 2.9 years lower than the state average
About
Lawrence County lies in eastern Kentucky, where wooded hills, valleys, and winding streams form a rugged Appalachian landscape. Louisa, the county seat, sits at the confluence of the Levisa and Tug Fork rivers, serving as a center for commerce, schools, and local culture. The land has long shaped the county’s identity, providing both challenge and connection.
Cultural life is marked by music, festivals, and church gatherings that highlight Appalachian traditions. Families often trace their roots back generations, giving a strong sense of continuity and place. Lawrence County reflects the resilience of its people, grounded in both heritage and landscape.
Where is Lawrence County?
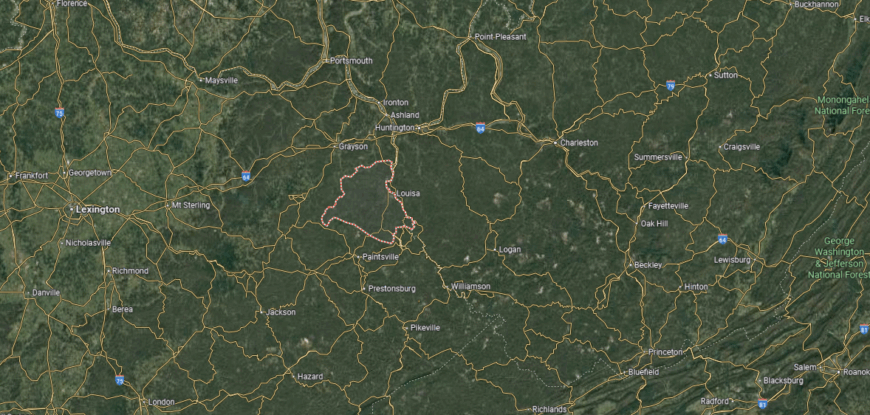
Lawrence County is found in far eastern Kentucky along the border with West Virginia. It lies about 130 miles east of Lexington and 40 miles south of Huntington, West Virginia. The county’s terrain is part of the Appalachian Plateau, marked by steep hills, winding valleys, and the confluence of the Levisa and Tug Forks that form the Big Sandy River.
Louisa, the county seat, sits at the meeting point of these rivers and directly borders Fort Gay, West Virginia. Smaller communities such as Blaine and Webbville are spread throughout the hills and connected by state routes. Lawrence County’s identity is closely tied to its Appalachian setting, river valleys, and cross-border connections.
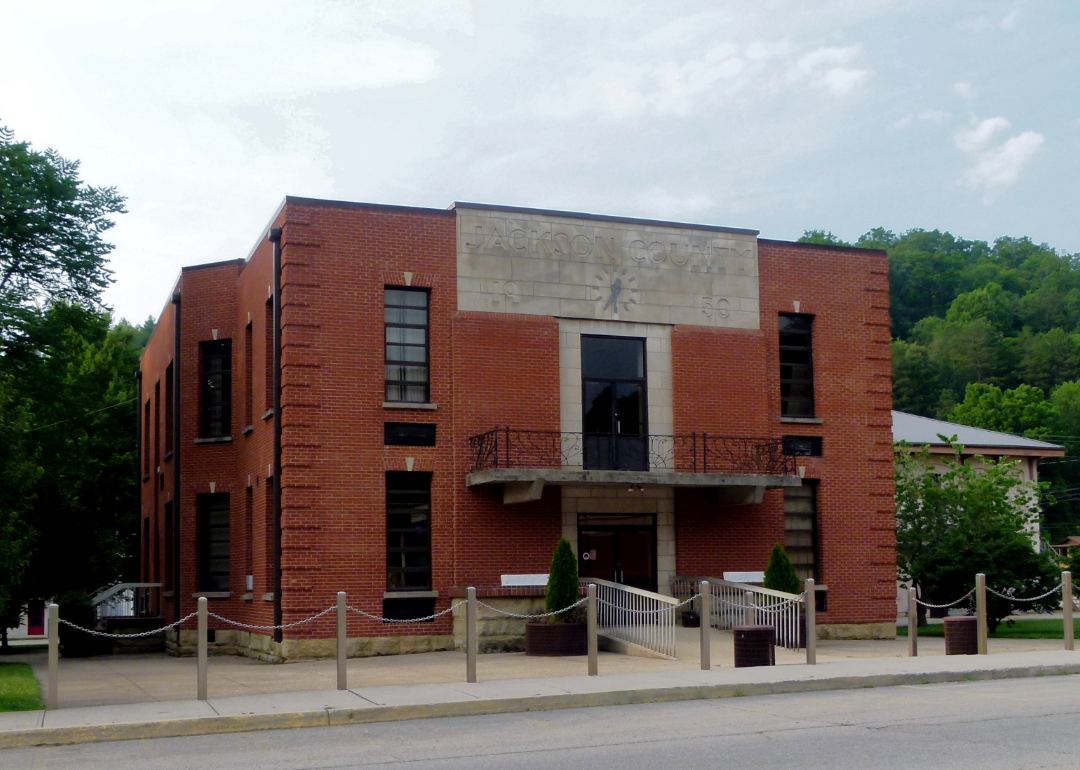
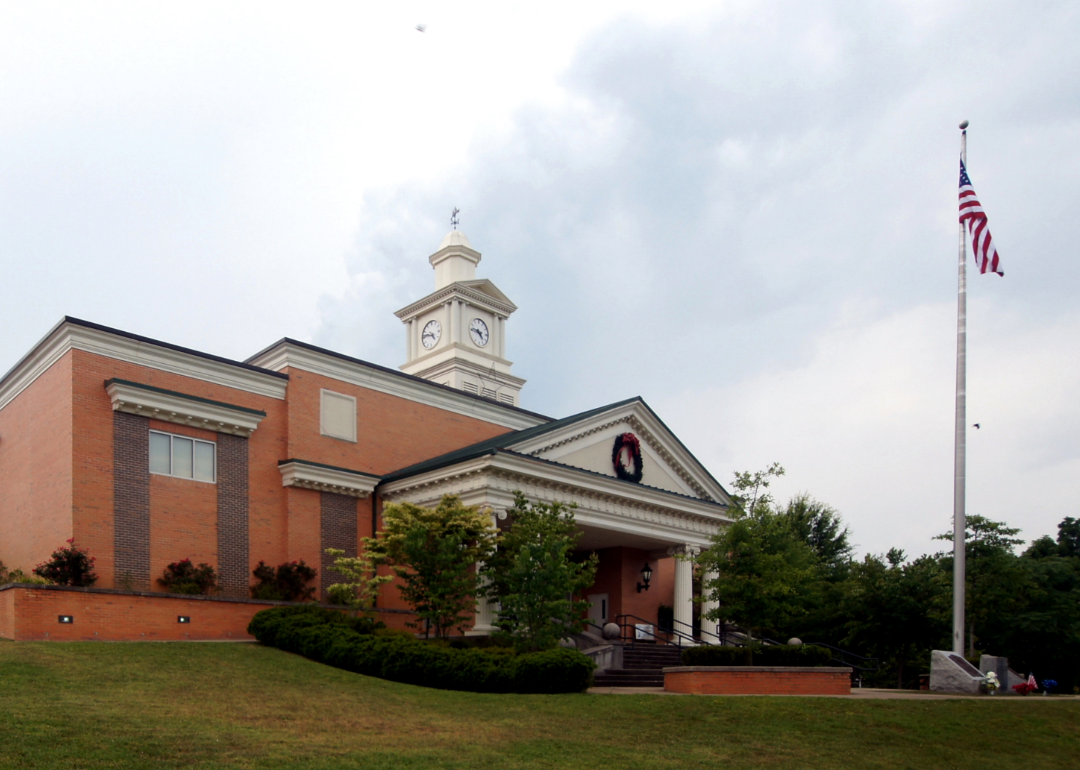
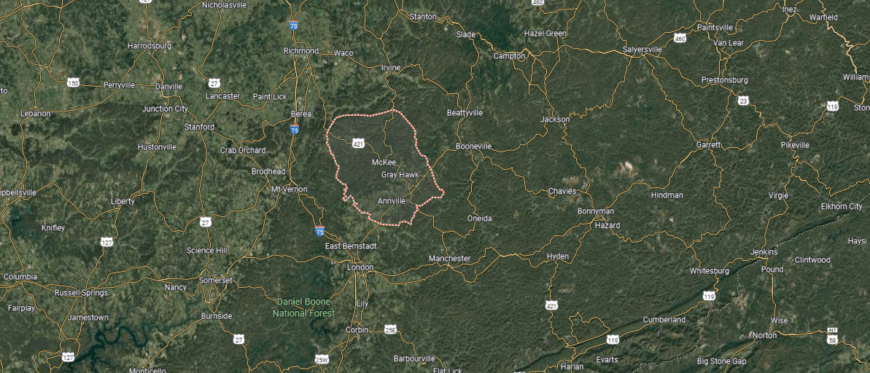
#25. Jackson County (tie)
– Life expectancy: 70.9 years
— 3.1 years lower than the state average
You may also like: Metros where renters are the most overextended in Kentucky
About
Jackson County is shaped by traditions that emphasize self-reliance, community ties, and gatherings rooted in mountain heritage. McKee, the county seat, serves as the hub for schools, local commerce, and civic institutions that connect scattered rural areas. The county’s story reflects both Appalachian culture and the steady pace of small-town life.
Forests, ridges, and winding creeks define the landscape, offering residents both livelihood and recreation. Family roots run deep, with generations remaining connected to the land and its traditions. Jackson County endures as a place where culture, land, and community remain closely bound.
Where is Jackson County?
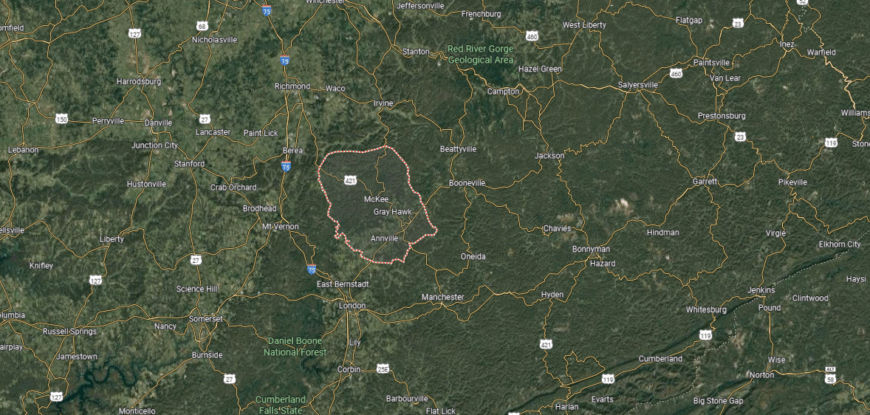
Jackson County is located in southeastern Kentucky, about 60 miles south of Lexington and 25 miles east of Berea. The county lies within the Appalachian foothills, with a landscape of forested ridges, narrow valleys, and winding streams. Much of the land is rural, with stretches of Daniel Boone National Forest touching its borders.
McKee, the county seat, rests near the center and serves as the primary hub for government and local services. Smaller communities such as Annville and Sandgap connect the surrounding hills and farmland. With its rugged terrain and wooded countryside, Jackson County reflects the natural character of Kentucky’s mountain region.
#25. Lewis County (tie)
– Life expectancy: 70.9 years
— 3.1 years lower than the state average
About
Lewis County stretches along the Ohio River in northeastern Kentucky, where forests and ridges frame a largely rural landscape. Vanceburg, the county seat, has long served as a focal point for commerce, schools, and community traditions. The county’s past is closely tied to river trade and the endurance of farming families.
Local life reflects both the rugged land and the heritage of those who have remained rooted here for generations. Festivals, church gatherings, and school events provide continuity while strengthening community ties. Lewis County stands as a place where history, land, and local traditions remain firmly connected.
Where is Lewis County?
Lewis County sits in northeastern Kentucky along the Ohio River, directly across from southern Ohio. It lies about 65 miles southeast of Cincinnati and roughly 75 miles northeast of Lexington, making it part of the state’s Ohio River corridor. The county covers more than 480 square miles, much of it made up of forested hills, valleys, and stretches of fertile bottomland near the river.
Vanceburg, the county seat, is located on the riverfront and serves as the main hub for government and commerce. Smaller communities such as Tollesboro, Concord, and Garrison connect the rural interior with river access. With its combination of Appalachian foothills, farmland, and Ohio River frontage, Lewis County balances rugged terrain with vital waterway connections.
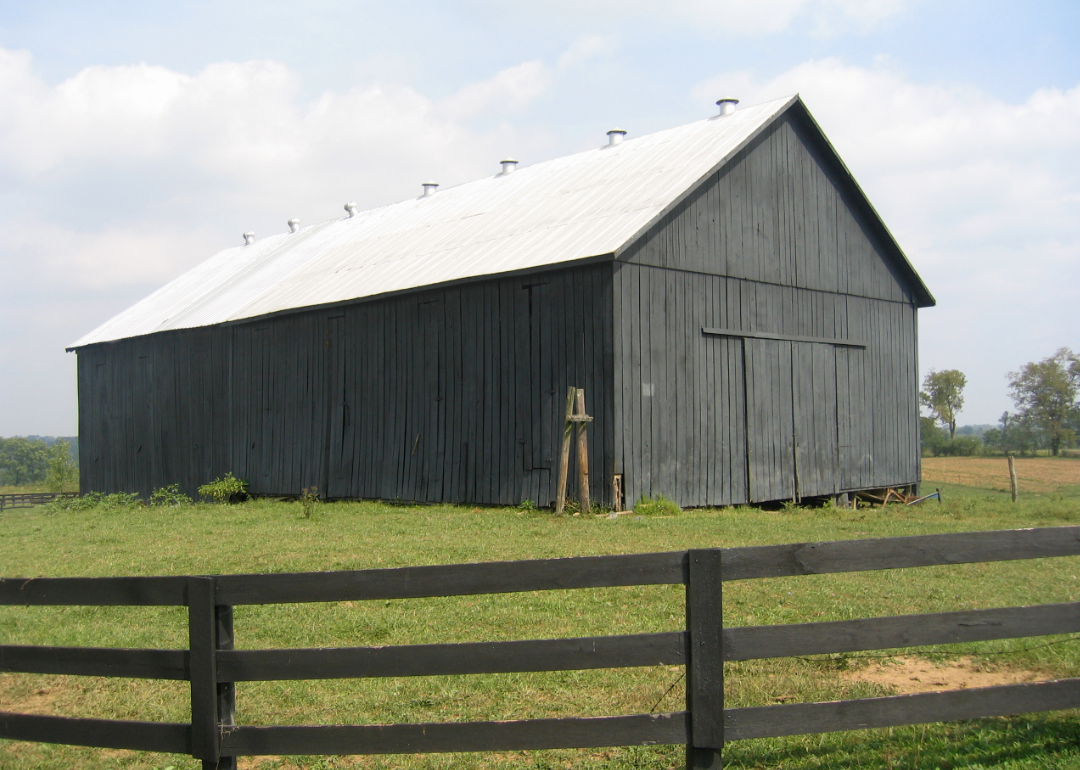
#22. McCreary County (tie)
– Life expectancy: 70.8 years
— 3.2 years lower than the state average
About
McCreary County carries a strong Appalachian identity, shaped by coal mining, timber, and the resilience of its rural communities. Whitley City, the county seat, anchors schools, civic life, and local institutions that connect scattered settlements across the region. The county’s character reflects both its working heritage and its ties to the surrounding land.
Forests, ridges, and rivers provide the backdrop for daily life, with the Daniel Boone National Forest and Big South Fork National River and Recreation Area offering both livelihood and recreation. Families often remain in place for generations, carrying forward traditions tied to faith, work, and community. McCreary County endures as a place where heritage, land, and family ties remain closely intertwined.
Where is McCreary County?
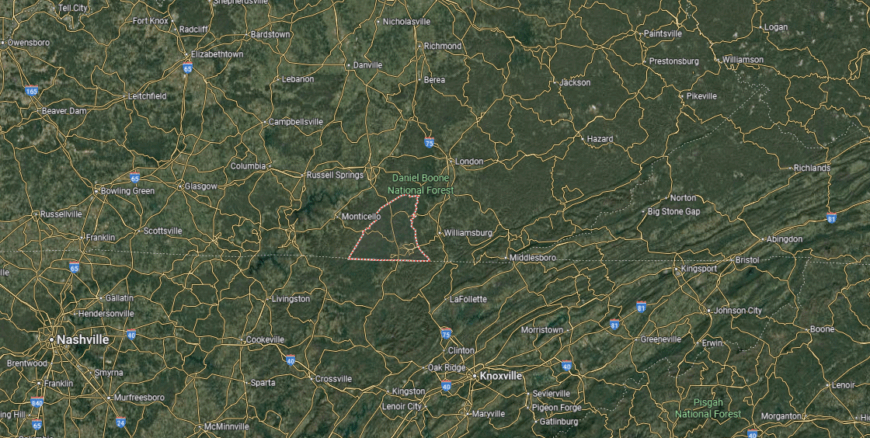
McCreary County is located in southern Kentucky along the Tennessee border, about 95 miles south of Lexington and 65 miles north of Knoxville. It is unique in that it has no incorporated cities, with most of its land covered by forested ridges, valleys, and streams. Large portions of the county are part of the Daniel Boone National Forest and the Big South Fork National River and Recreation Area.
Whitley City, an unincorporated community, functions as the county seat and serves as the center for government and services. Other small communities such as Stearns and Pine Knot provide local hubs scattered across the hills. With its rugged terrain, public lands, and outdoor recreation areas, McCreary County is defined more by natural landscapes than urban centers.
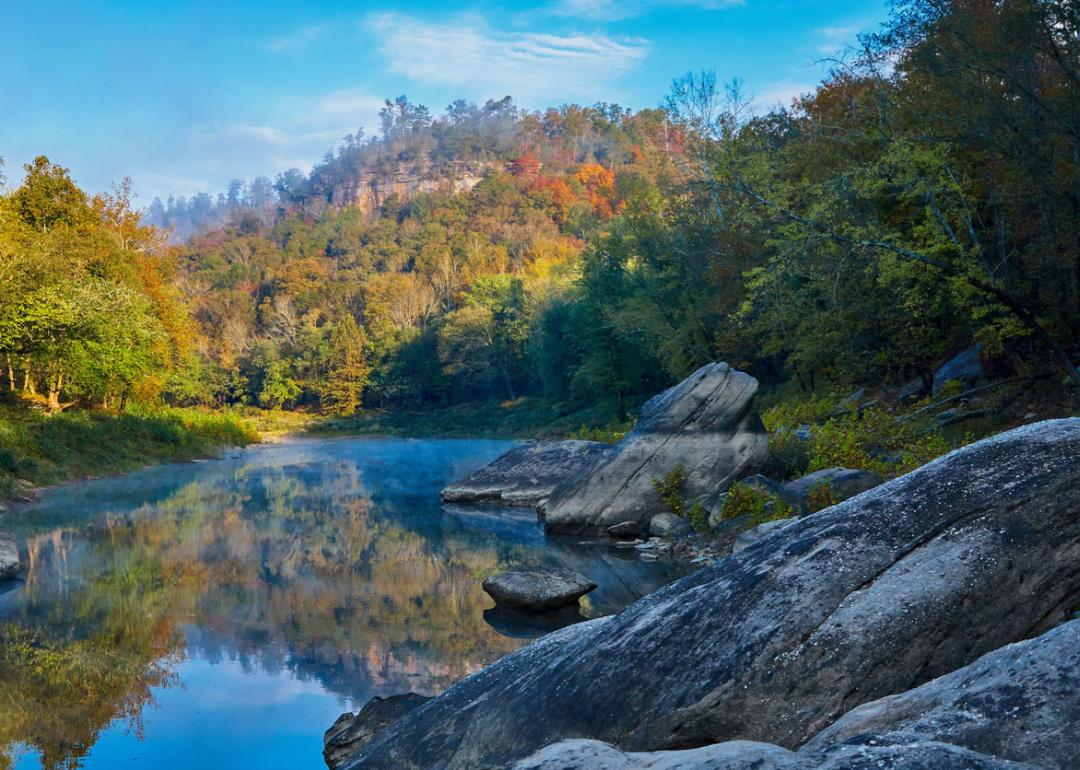
#22. Carroll County (tie)
– Life expectancy: 70.8 years
— 3.2 years lower than the state average
About
Carroll County is centered on its towns and gatherings, where schools, churches, and civic traditions connect residents across its rural landscape. Carrollton, the county seat, serves as a hub for commerce and community events, bringing together families from the surrounding countryside. The county’s story is shaped by both its small-town spirit and its steady agricultural base.
Set along the Ohio and Kentucky Rivers, the land provides fertile ground for farming while linking the county to regional trade. Festivals, riverfront activities, and long-standing family roots strengthen ties between past and present. Carroll County continues to reflect a blend of community, heritage, and geography that defines its identity.
Where is Carroll County?
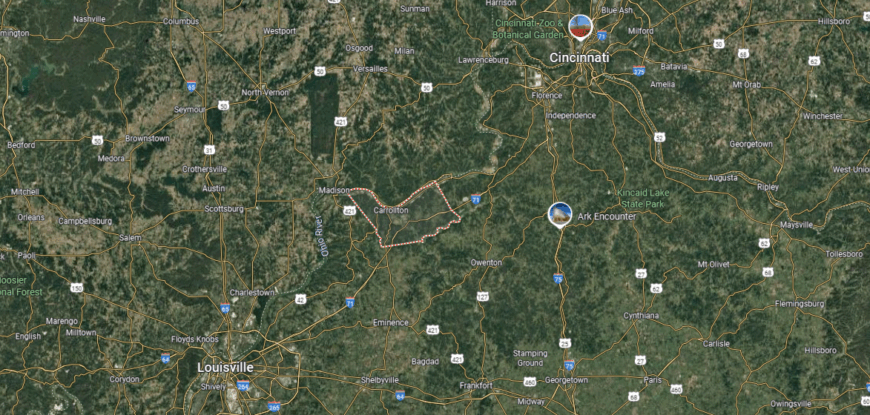
Carroll County is positioned in northern Kentucky where the Kentucky and Ohio Rivers meet. It lies about 50 miles northeast of Louisville and 55 miles southwest of Cincinnati, giving it a location tied closely to major river and highway routes. The county’s geography includes river valleys, low-lying farmland, and wooded hills rising away from the waterways.
Carrollton, the county seat, sits at the river confluence and has long been the center of trade and travel in the area. Smaller communities such as Prestonville, Sanders, and Worthville are spread across the county and connected by U.S. Highway 42 and Interstate 71. Carroll County’s identity is rooted in its river access, transportation links, and blend of rural and small-town life.
#22. Rockcastle County (tie)
– Life expectancy: 70.8 years
— 3.2 years lower than the state average
About
Rockcastle County lies where the Cumberland Plateau meets the Bluegrass, a landscape of ridges, valleys, and winding waterways. Mount Vernon, the county seat, serves as the center of schools, commerce, and civic traditions that unite the surrounding rural areas. The county’s identity is shaped by both its natural setting and its long-standing agricultural roots.
Heritage runs deep through music, festivals, and gatherings that highlight Appalachian culture. Generational families remain tied to the land, carrying forward traditions that connect past and present. Rockcastle County reflects a steady balance of landscape, culture, and community life.
Where is Rockcastle County?
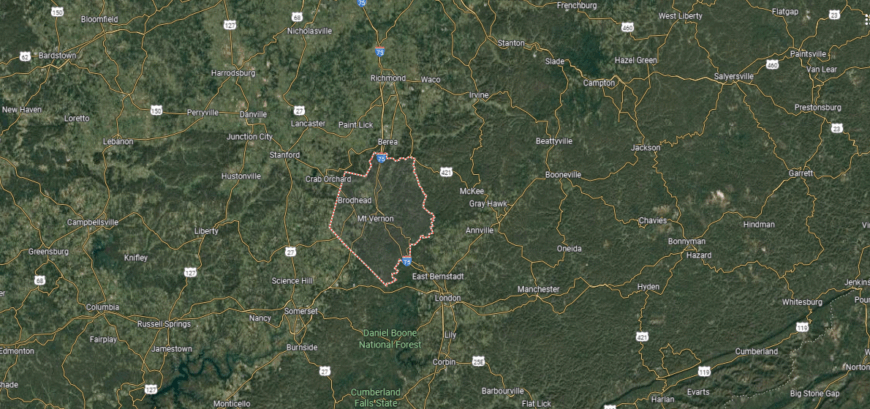
Rockcastle County is located in south-central Kentucky, bordered by the Daniel Boone National Forest to the east. It lies about 50 miles south of Lexington and 25 miles northeast of London, placing it within the Appalachian foothills. The landscape is rugged, with forested ridges, rocky bluffs, and valleys shaped by the Rockcastle River, which flows along its southeastern edge.
Mount Vernon, the county seat, sits near the center and serves as the main hub for government and community life. Brodhead and Livingston are smaller towns that anchor the county’s outer areas, each linked by U.S. 25 and Interstate 75. With its wooded terrain and river corridors, Rockcastle County reflects the natural character of Kentucky’s mountain gateway.
#19. Estill County (tie)
– Life expectancy: 70.6 years
— 3.4 years lower than the state average
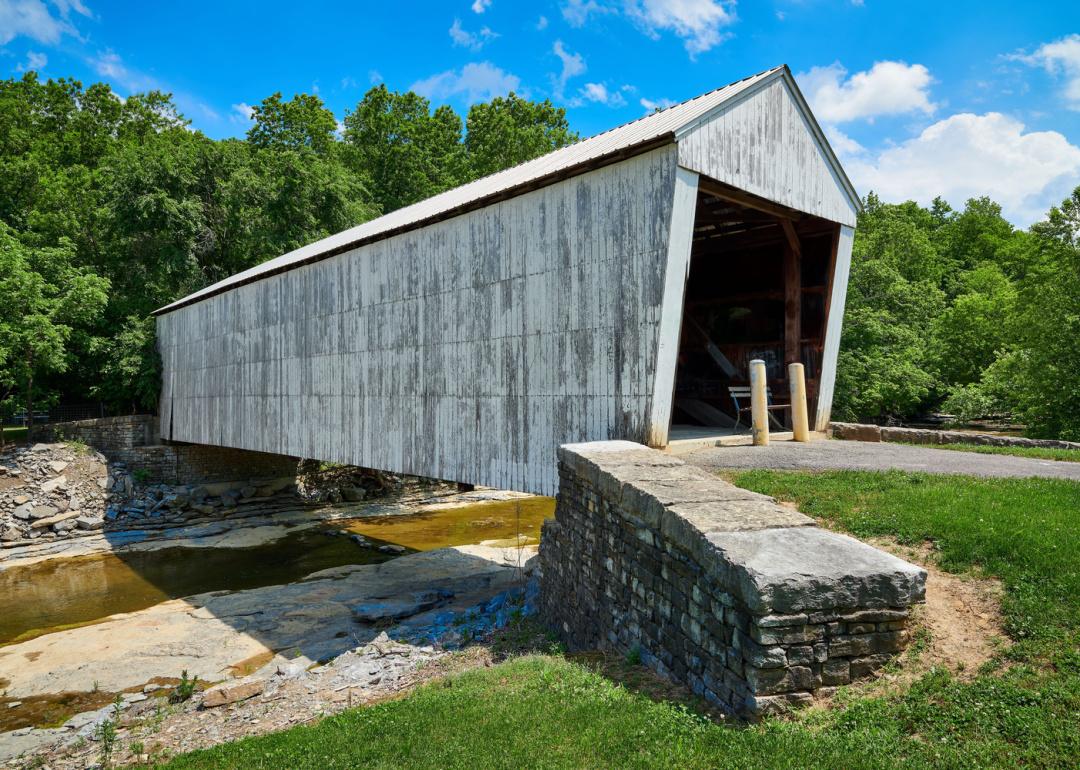
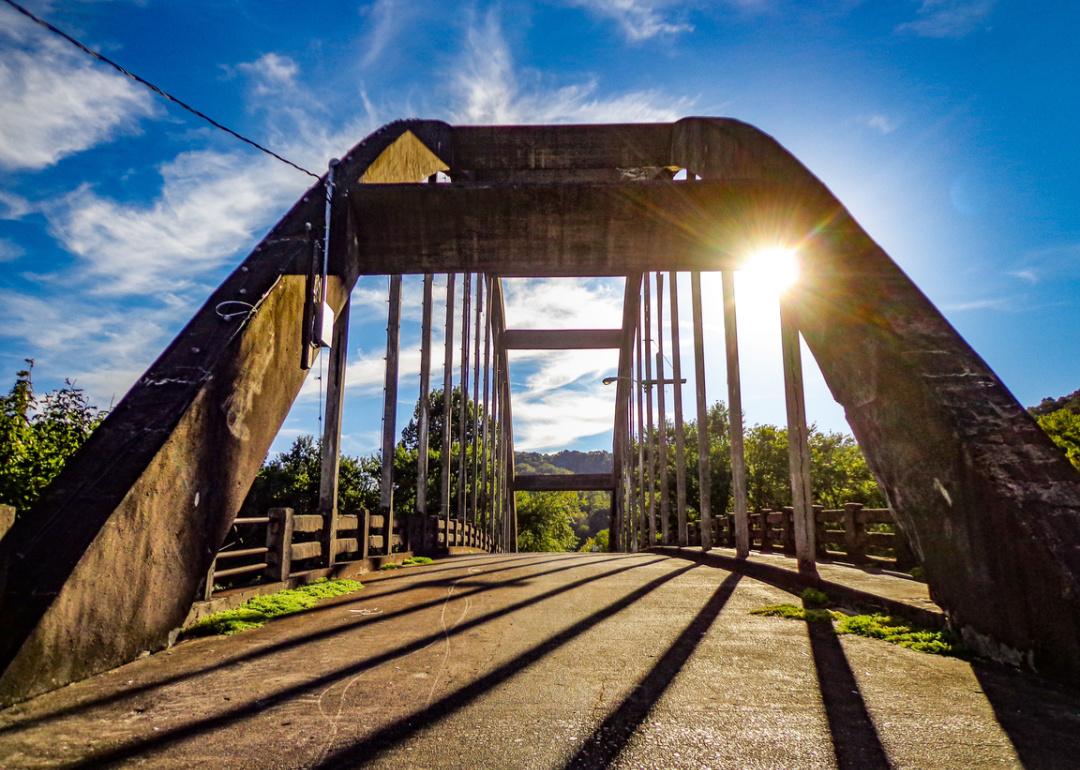
You may also like: Counties with the most bridges in Kentucky
About
Estill County is known for its strong Appalachian roots, where music, storytelling, and local gatherings keep cultural traditions alive. Irvine and Ravenna serve as centers for schools, commerce, and community ties, connecting the surrounding rural areas. The county’s history reflects both resilience and the enduring pride of its people.
Forested hills and the Kentucky River frame the landscape, shaping both daily life and recreation. Families often remain in place for generations, linking community strength to the land itself. Estill County endures as a place where heritage, geography, and family bonds remain inseparable.
Where is Estill County?
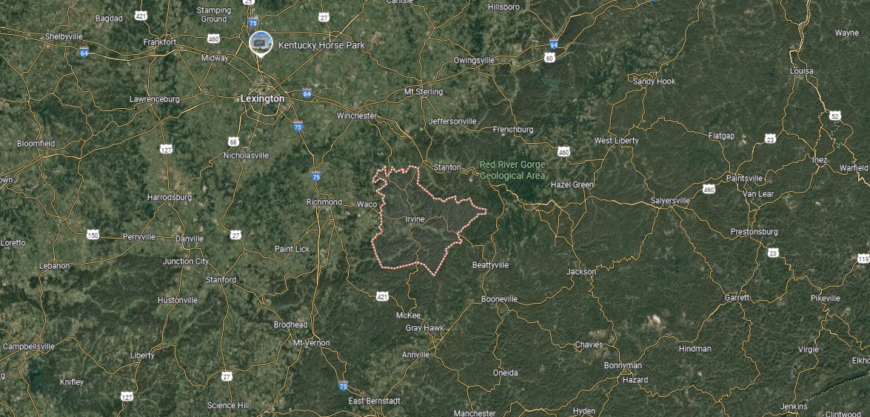
Estill County lies in east-central Kentucky where the Bluegrass region meets the Appalachian foothills. It is about 45 miles southeast of Lexington and covers just over 250 square miles of ridges, valleys, and river bottoms. The Kentucky River cuts through the county, creating fertile lowlands along its course.
Irvine, the county seat, sits on the river’s banks and serves as the center of commerce and government. Ravenna, a neighboring town, developed alongside the railroad and remains an important local community. With its river valley setting, wooded hills, and small towns, Estill County blends natural scenery with a rural way of life.
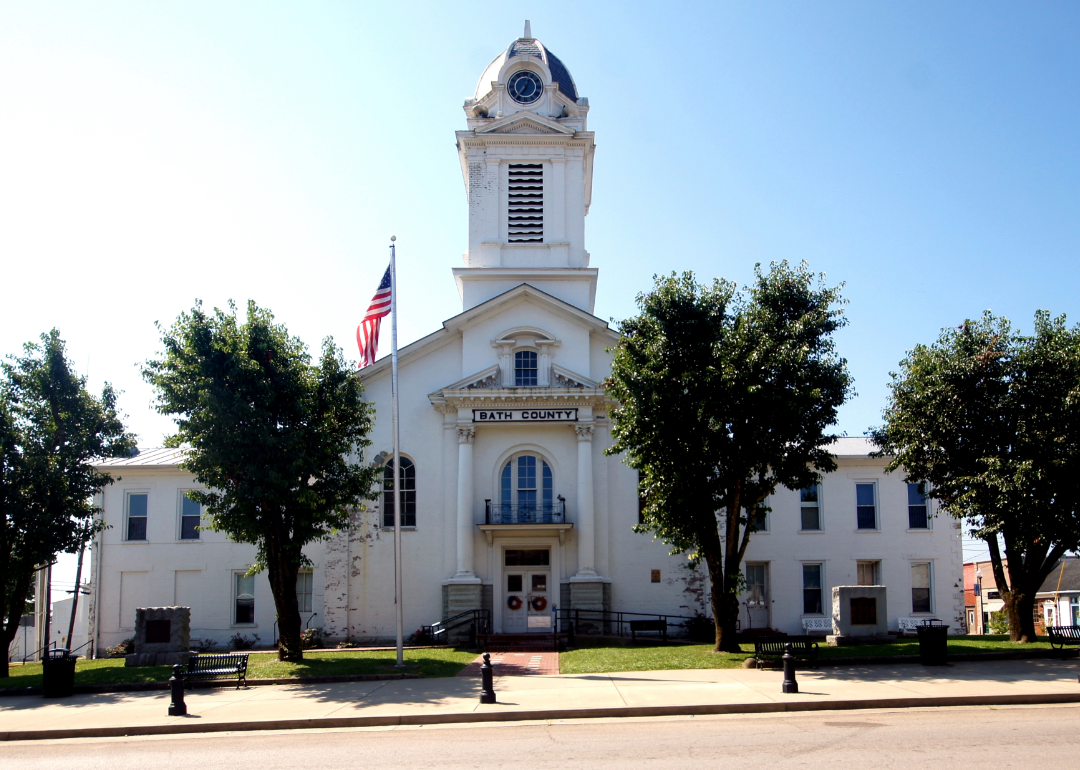
#19. Bath County (tie)
– Life expectancy: 70.6 years
— 3.4 years lower than the state average
About
Bath County centers much of its rhythm on schools, churches, and gatherings that bring neighbors together across its rural landscape. Owingsville, the county seat, provides a hub for commerce, education, and civic activity that connects surrounding communities. The county’s story reflects both small-town traditions and its agricultural foundation.
Rolling hills, farmland, and nearby lakes create a natural setting that shapes both work and recreation. Families often remain rooted here for generations, carrying forward local customs and ties to the land. Bath County stands as a place where community spirit, heritage, and geography are closely woven together.
Where is Bath County?
Bath County is located in northeastern Kentucky within the Outer Bluegrass region. It lies about 45 miles east of Lexington and covers a landscape of rolling farmland, forested ridges, and the waters of Cave Run Lake along its southern boundary. The Licking River also winds through the county, shaping much of its terrain.
Owingsville, the county seat, is positioned near the center and serves as the focal point for local government and commerce. Other small communities, including Salt Lick and Sharpsburg, connect the rural countryside with nearby counties. With its mix of farmland, waterways, and forested land, Bath County reflects both agricultural roots and recreational appeal.
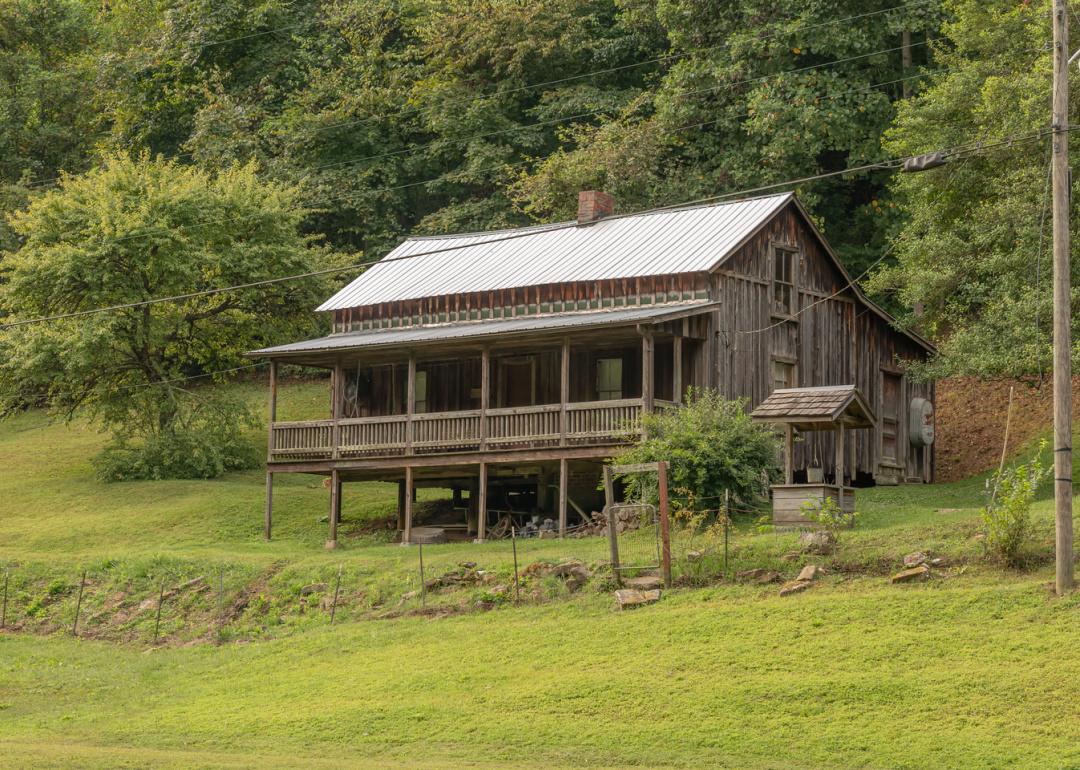
#19. Knox County (tie)
– Life expectancy: 70.6 years
— 3.4 years lower than the state average
About
Knox County lies in southeastern Kentucky, where ridges, valleys, and streams shape the Appalachian landscape. Barbourville, the county seat, serves as a hub for schools, commerce, and civic life that ties rural communities together. The county’s character reflects both its natural setting and its enduring small-town traditions.
History runs deep, from frontier settlement to Civil War sites that remain part of the local identity. Festivals, church gatherings, and family networks sustain a strong sense of belonging across generations. Knox County continues to stand as a place where land, history, and community remain closely connected.
Where is Knox County?
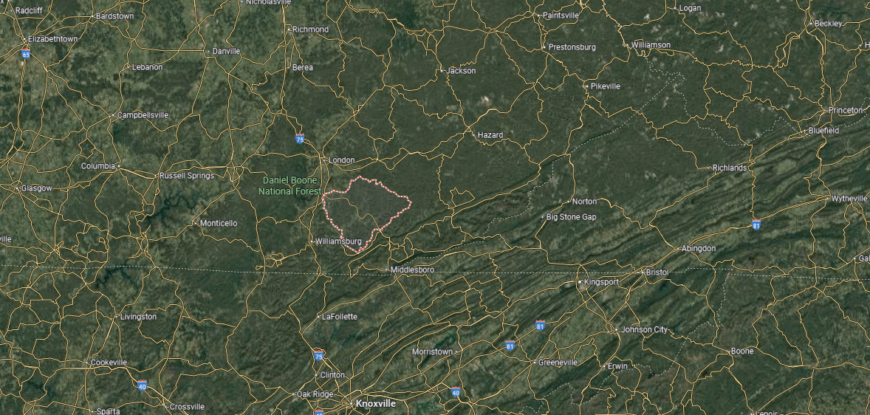
Knox County is found in southeastern Kentucky, about 80 miles south of Lexington and 35 miles north of the Tennessee line. The county lies within the Appalachian region, with terrain made up of forested ridges, narrow valleys, and creeks that flow into the Cumberland River. Its geography has long supported both farming and small coal operations.
Barbourville, the county seat, sits along the Cumberland River near the center of the county and serves as the hub for government and commerce. Smaller communities such as Corbin, Artemus, and Flat Lick spread across the valleys and ridges, connected by U.S. Highway 25E and other routes. With its mix of mountains, waterways, and historic towns, Knox County reflects the character of southeastern Kentucky.
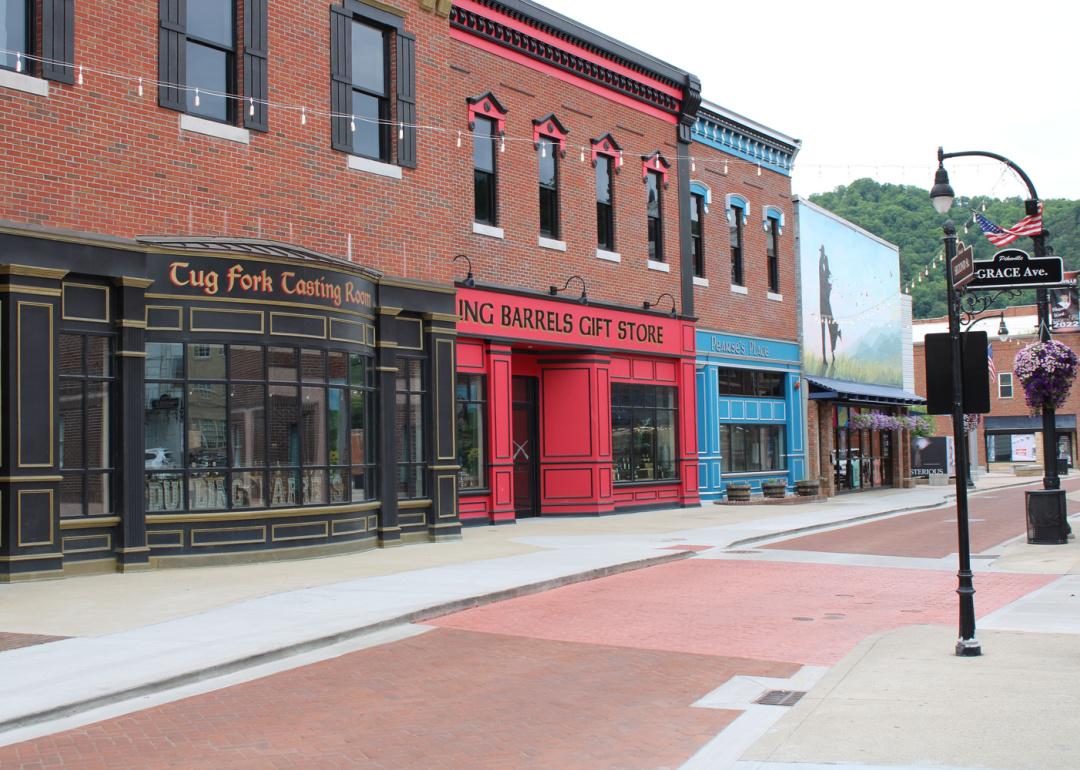
#18. Johnson County
– Life expectancy: 70.5 years
— 3.5 years lower than the state average
About
Johnson County carries a legacy tied to the heart of Appalachia, where coal mining, music, and craftsmanship have shaped its story. Paintsville, the county seat, reflects this heritage through its role as a hub for education, commerce, and cultural life. The county’s identity blends the endurance of its past with the steady rhythms of small-town living.
Forested hills and winding valleys provide the backdrop, offering both livelihood and recreation for residents. Local festivals, church events, and deep family roots strengthen ties across generations. Johnson County endures as a place where history, land, and community traditions remain closely bound.
Where is Johnson County?
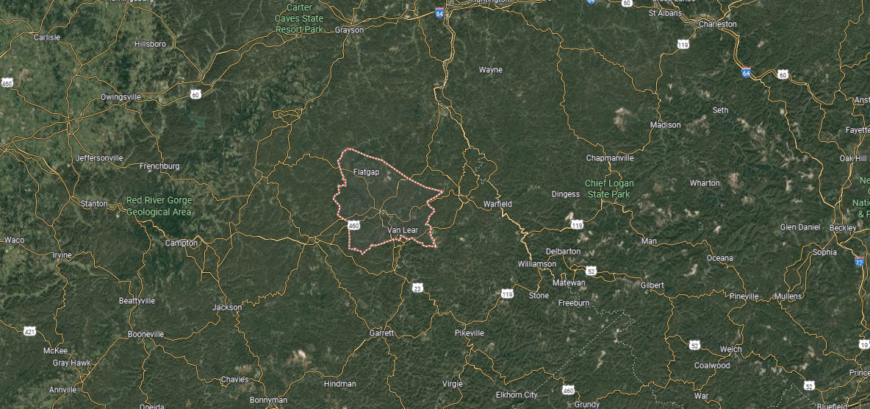
Johnson County is situated in eastern Kentucky, about 100 miles east of Lexington in the heart of the Appalachian region. The county covers a landscape of rugged hills, narrow valleys, and streams that flow into the Big Sandy River system. Paintsville Lake, a state park and reservoir, lies in the northeastern section of the county, serving as a major recreation area for residents and visitors.
Paintsville, the county seat, sits along the Levisa Fork of the Big Sandy River and functions as the commercial and cultural hub. Smaller communities such as Van Lear, Oil Springs, and Flat Gap are scattered across the surrounding hills, each tied to coal, timber, or farming heritage. With its mix of Appalachian terrain, coalfield history, and small towns, Johnson County reflects both the natural and cultural core of eastern Kentucky.
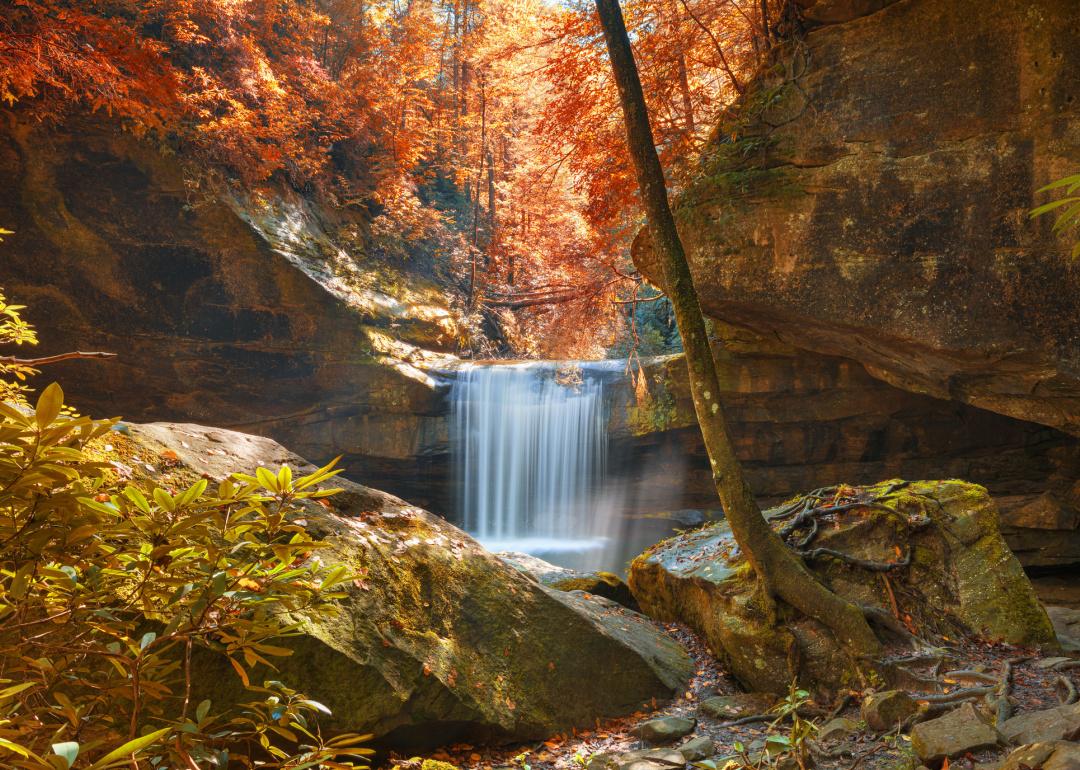
#17. Pike County
– Life expectancy: 70.3 years
— 3.7 years lower than the state average
About
Pike County is deeply tied to Appalachian culture, where music, storytelling, and community gatherings highlight a rich regional identity. Pikeville, the county seat, serves as a hub for education, commerce, and civic life, connecting rural communities across the mountains. The county’s heritage reflects a blend of coalfield history and long-standing traditions.
Hills, hollows, and winding rivers shape both daily life and recreation, providing a backdrop that defines the land. Families often remain rooted here for generations, strengthening the bond between people and place. Pike County endures as a community where culture, land, and history remain inseparable.
Where is Pike County?
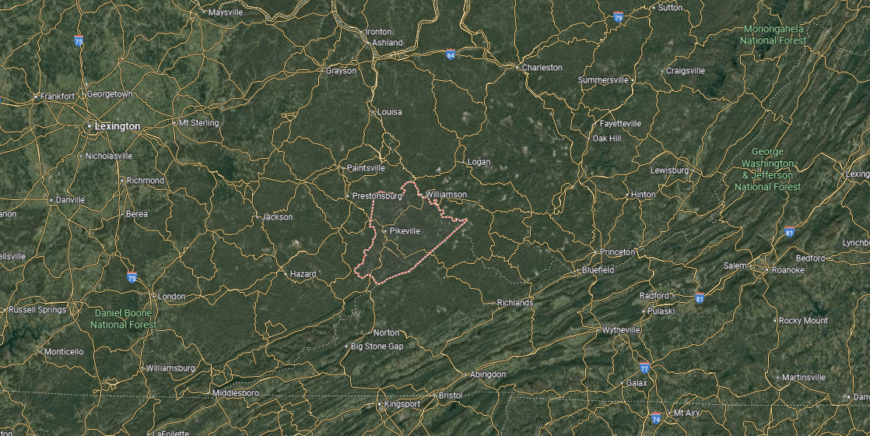
Pike County lies in the far eastern part of Kentucky, directly bordering Virginia and West Virginia. It is the largest county in the state by land area, covering over 780 square miles of Appalachian terrain. The land is characterized by steep mountains, narrow hollows, and the Levisa Fork of the Big Sandy River flowing through its valleys.
Pikeville, the county seat, sits in the northeastern section and serves as the center for business, education, and culture. Smaller towns such as Elkhorn City, Coal Run Village, and Belfry are scattered throughout the mountain ridges and valleys. With its vast coal heritage, rugged geography, and cross-state connections, Pike County plays a significant role in the Appalachian region.
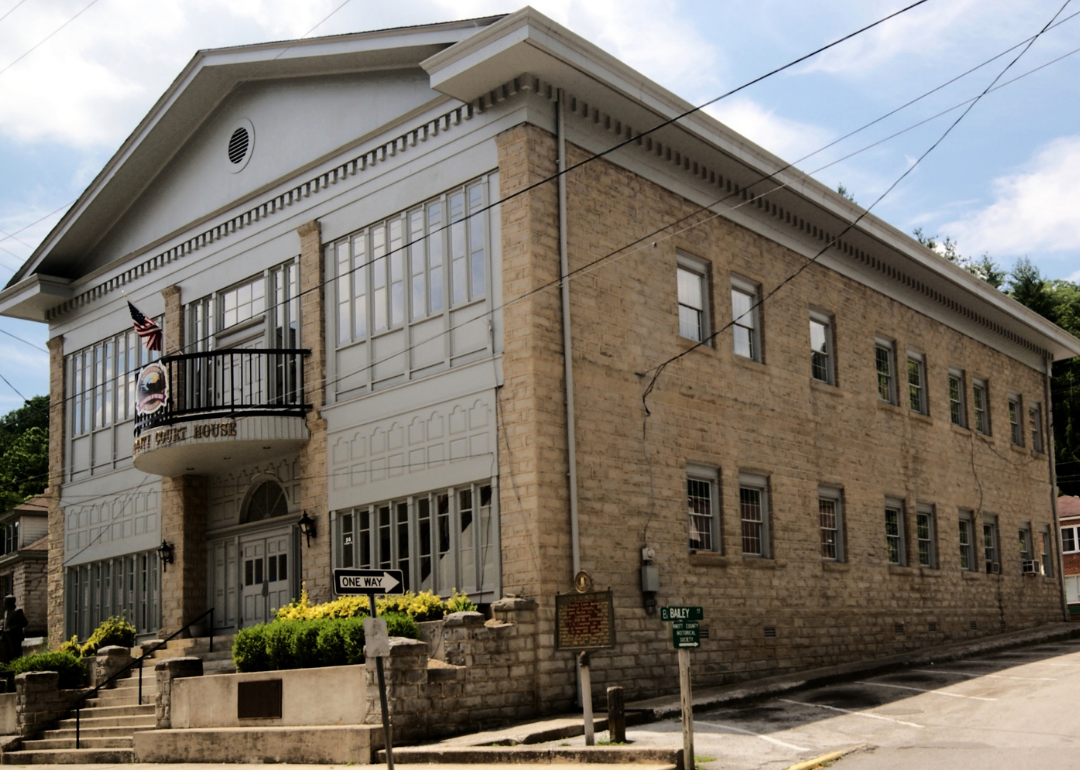
#16. Whitley County
– Life expectancy: 70.0 years
— 4.0 years lower than the state average
You may also like: Bestselling cars in Kentucky
About
Whitley County rests in southeastern Kentucky, where mountains, forests, and waterways frame a rugged Appalachian setting. Williamsburg, the county seat, serves as the center of schools, commerce, and local government, tying together rural communities. The county’s identity reflects both its natural landscape and its steady traditions.
History and culture remain strong through festivals, church gatherings, and family connections that stretch across generations. Outdoor recreation, from forest trails to riverbanks, adds another layer of daily life. Whitley County stands as a place where land, heritage, and community remain firmly linked.
Where is Whitley County?
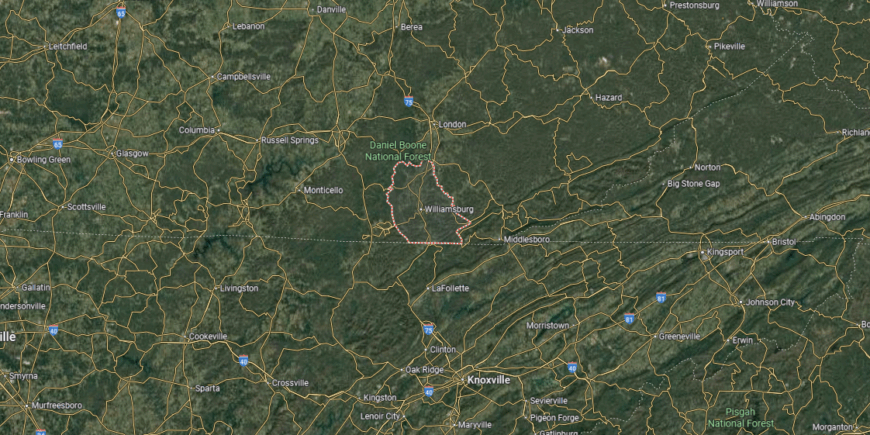
Whitley County is positioned in southeastern Kentucky along the Tennessee border. It lies about 85 miles south of Lexington and roughly 65 miles north of Knoxville, Tennessee, placing it in the heart of the Appalachian foothills. The Cumberland River and its tributaries wind through the county, shaping valleys surrounded by wooded ridges.
Williamsburg, the county seat, sits near the center and anchors the county’s government and local economy. Corbin, another major city, spans the northern edge and connects the county to Interstate 75, a key travel route through the region. With its river valleys, forested lands, and cross-border location, Whitley County blends natural resources with regional accessibility.
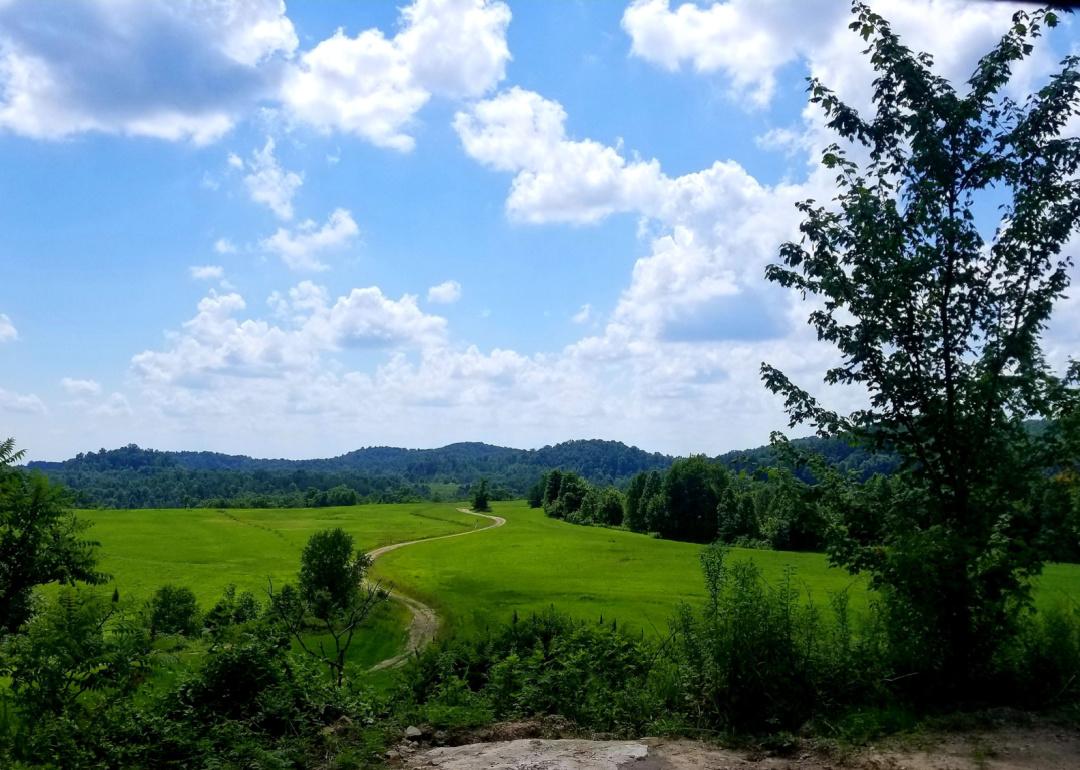
#15. Knott County
– Life expectancy: 69.5 years
— 4.5 years lower than the state average
About
Knott County reflects an Appalachian past shaped by coal mining, subsistence farming, and the endurance of rural communities. Hindman, the county seat, has long been a center for education and local culture, most notably through its historic settlement school. The county’s character carries forward both its working heritage and its cultural legacy.
Forested hills and winding valleys define the land, offering both challenge and connection for generations of families. Music, festivals, and church gatherings keep traditions alive while reinforcing community bonds. Knott County remains a place where history, landscape, and culture continue to guide daily life.
Where is Knott County?
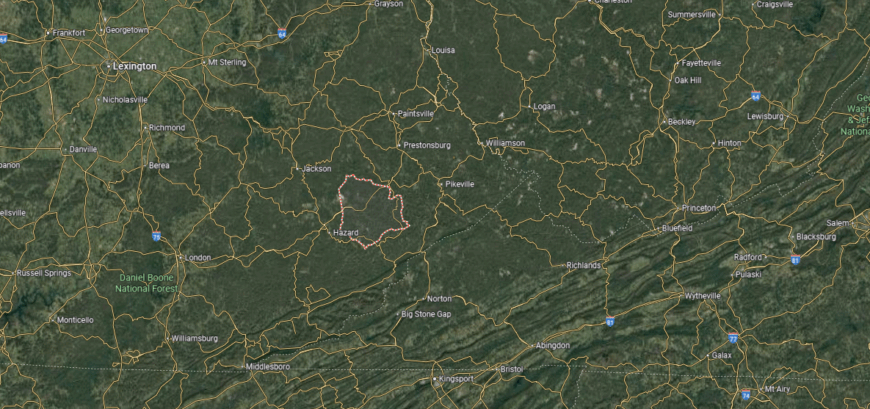
Knott County is located in southeastern Kentucky, deep within the Appalachian Mountains. It lies about 110 miles southeast of Lexington and roughly 35 miles east of Hazard, giving it a remote position in the state’s coalfield region. The terrain is rugged, with steep ridges, narrow hollows, and streams that flow into the Kentucky River system.
Hindman, the county seat, rests near the center and serves as the hub for government, commerce, and education. Smaller communities such as Pippa Passes and Carr are scattered along winding roads that cut through the mountains. With its mountain setting, coal heritage, and rural communities, Knott County reflects the traditional character of southeastern Kentucky.
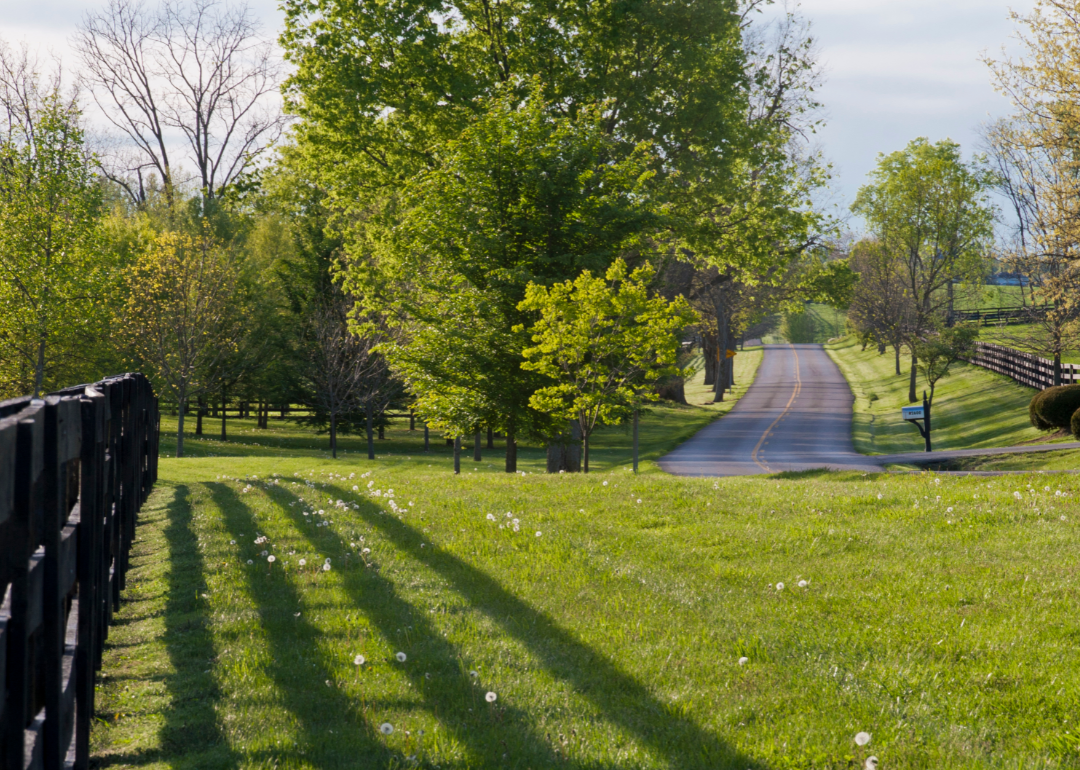
#14. Magoffin County
– Life expectancy: 69.4 years
— 4.6 years lower than the state average
About
Magoffin County is known for its strong Appalachian traditions, where music, storytelling, and community gatherings preserve a living heritage. Salyersville, the county seat, anchors schools, commerce, and civic life, linking scattered rural areas across the hills. The county’s character reflects both its cultural roots and the resilience of its people.
Ridges, valleys, and creeks shape the land, providing both livelihood and a sense of place for generations. Family ties run deep, with histories carried forward through festivals, churches, and shared community life. Magoffin County continues to stand as a place where heritage, land, and family remain closely connected.
Where is Magoffin County?
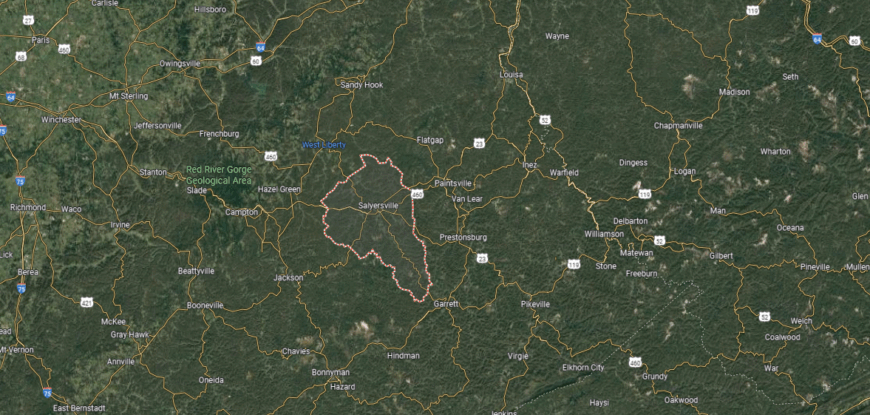
Magoffin County is set in eastern Kentucky, about 90 miles east of Lexington and 35 miles west of Paintsville. The county lies within the Appalachian foothills, with a landscape defined by forested ridges, deep hollows, and small creeks that join the Licking River. Its geography has long supported farming in the valleys alongside a history tied to coal and timber.
Salyersville, the county seat, is located near the middle of the county and serves as the center for government and community life. Smaller settlements are scattered across the hills, connected by U.S. Highway 460 and state routes. With its mix of mountain terrain and rural communities, Magoffin County reflects the character of Kentucky’s eastern uplands.
#13. Clay County
– Life expectancy: 69.1 years
— 4.9 years lower than the state average
About
Clay County rests in the mountains of southeastern Kentucky, where ridges, valleys, and waterways frame a rugged Appalachian landscape. Manchester, the county seat, serves as the hub for schools, commerce, and civic life, connecting smaller rural communities. The county’s identity has long been tied to its land and its deep-rooted traditions.
Heritage is reflected in festivals, church gatherings, and the passing down of family customs across generations. Music, storytelling, and community events add richness to daily life while reinforcing a strong sense of belonging. Clay County endures as a place where land, culture, and people remain firmly intertwined.
Where is Clay County?
Clay County is located in southeastern Kentucky within the foothills of the Appalachian Mountains. It lies about 80 miles southeast of Lexington and 30 miles east of London, covering a landscape of steep ridges, winding valleys, and streams that feed into the South Fork of the Kentucky River. Much of the county is forested, giving it a rugged and rural character.
Manchester, the county seat, sits along the river near the county’s center and serves as the hub for government and commerce. Smaller communities such as Oneida and Burning Springs are spread across the valleys, connected by state highways and rural roads. With its mountain setting and river system, Clay County is closely tied to the geography of southeastern Kentucky.
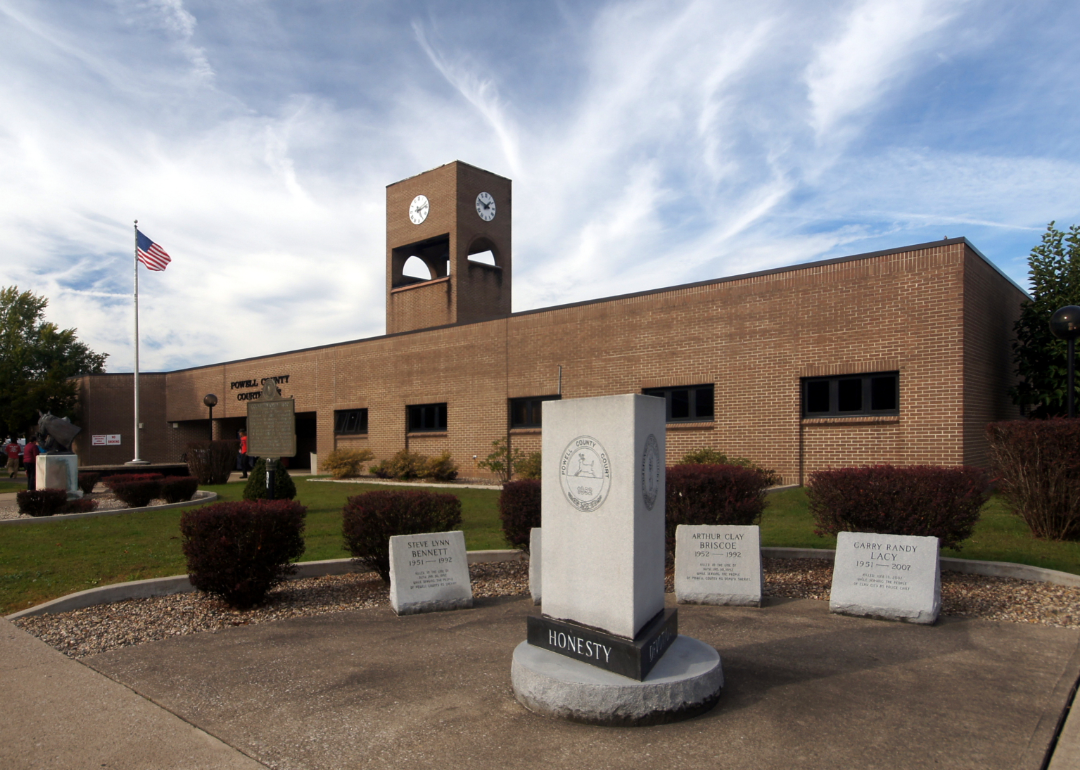
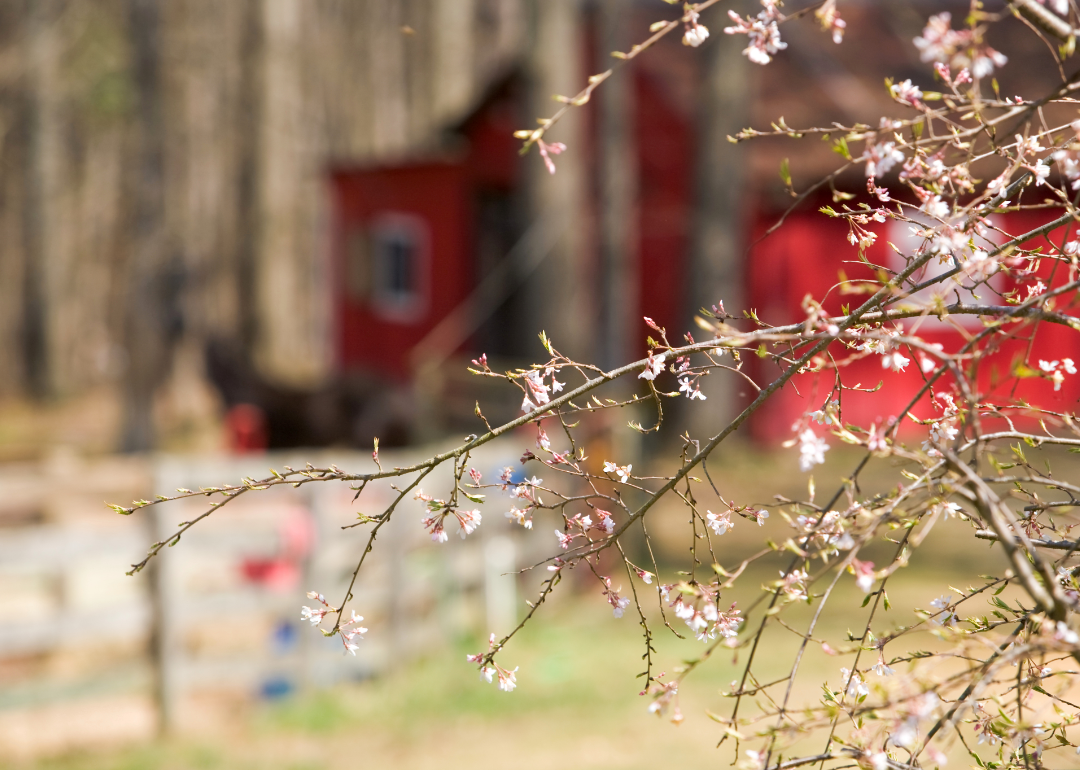
#12. Powell County
– Life expectancy: 69.0 years
— 5.0 years lower than the state average
About
Powell County carries a heritage rooted in early settlement and the enduring influence of its Appalachian setting. Stanton, the county seat, provides a hub for schools, commerce, and civic life, serving as the link between surrounding rural communities. The county’s story reflects both the resilience of its people and the traditions passed down through generations.
The Red River Gorge and Daniel Boone National Forest shape much of the landscape, drawing residents and visitors alike for outdoor recreation. Festivals, church gatherings, and family ties give continuity to community life. Powell County remains a place where history, land, and culture remain closely bound together.
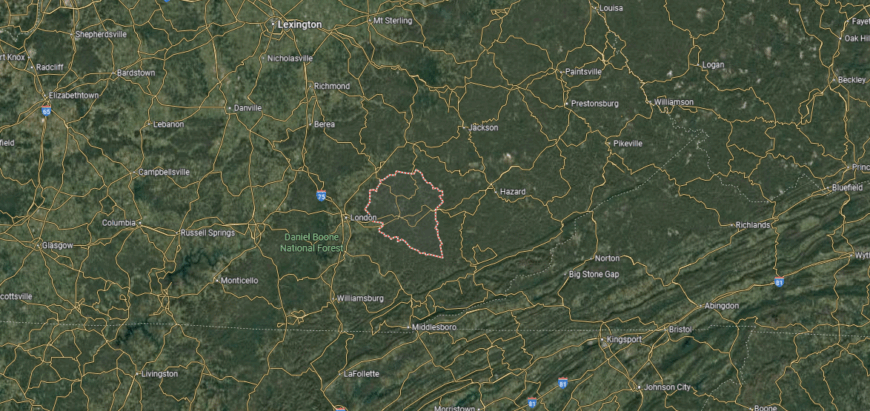
Where is Powell County?
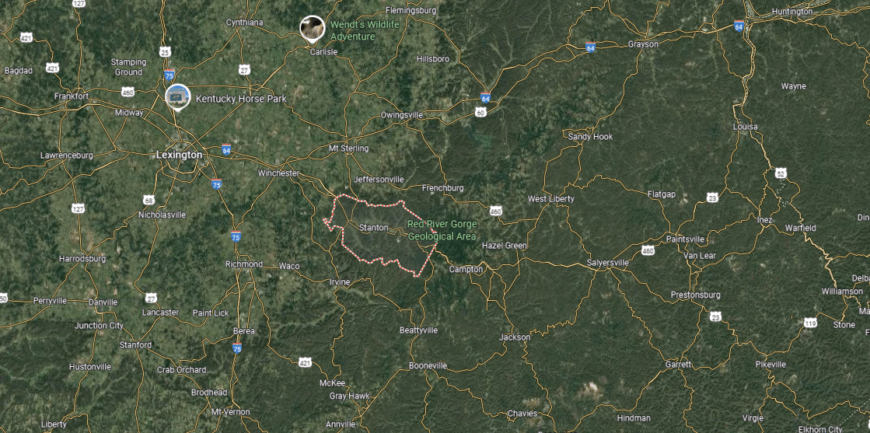
Powell County sits in east-central Kentucky, about 45 miles east of Lexington, where the Bluegrass region transitions into the Appalachian foothills. The county is marked by dramatic sandstone cliffs, forested ridges, and valleys shaped by the Red River. A large portion of its land falls within the Daniel Boone National Forest, including the well-known Red River Gorge.
Stanton, the county seat, rests near the center and serves as the focal point for government and local business. Clay City, another key community, lies along the Red River and U.S. Highway 15, providing a gateway to the surrounding natural areas. With its mix of small towns, forestland, and striking geology, Powell County is both a rural community and a destination for outdoor recreation.
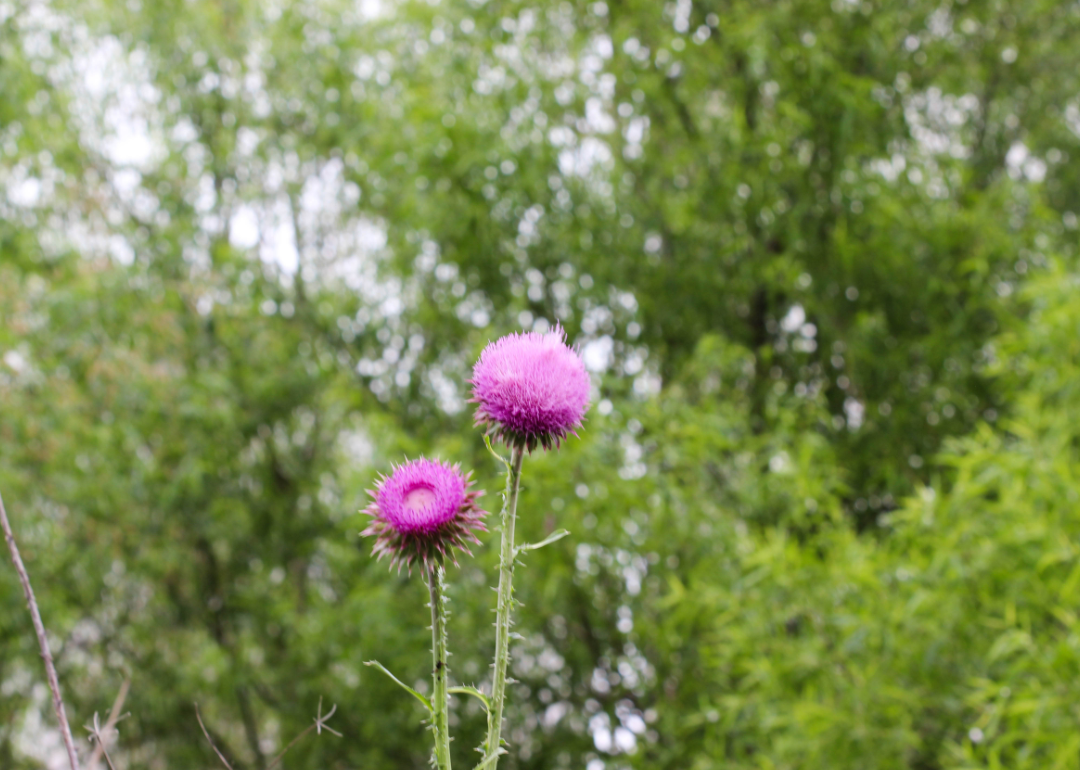
#9. Letcher County (tie)
– Life expectancy: 68.8 years
— 5.2 years lower than the state average
You may also like: Highest-rated breweries in Kentucky
About
Letcher County is known for its strong Appalachian traditions, where music, storytelling, and community gatherings keep heritage alive. Whitesburg, the county seat, serves as a cultural and civic hub, connecting rural mountain communities through schools, commerce, and local events. The county’s identity reflects both its coalfield history and its vibrant cultural life.
Steep ridges, narrow valleys, and winding streams define the land, shaping daily living and recreation. Generational families remain rooted here, carrying forward traditions that link past and present. Letcher County continues to stand as a place where culture, land, and community remain firmly connected.
Where is Letcher County?
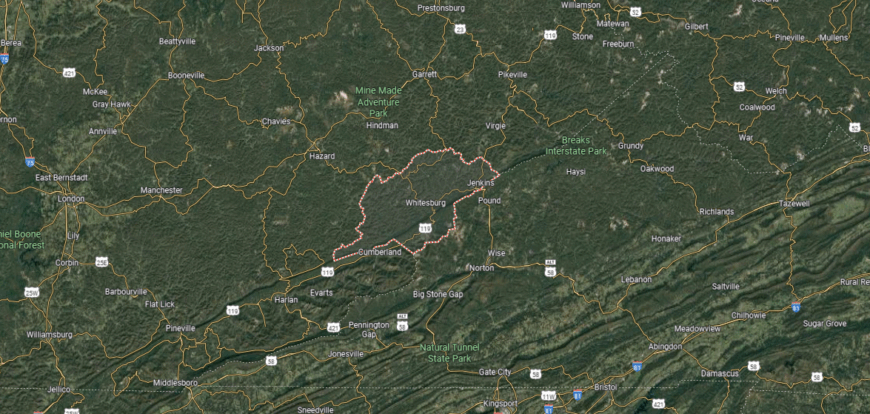
Letcher County is found in the southeastern corner of Kentucky, along the state’s border with Virginia. It lies about 120 miles southeast of Lexington and sits entirely within the Appalachian Mountains, with steep ridges, narrow valleys, and numerous creeks feeding into the Kentucky River. Coal mining has historically shaped much of the county’s development and identity.
Whitesburg, the county seat, is located near the center along the North Fork of the Kentucky River and serves as the cultural and governmental hub. Other communities such as Jenkins, Fleming-Neon, and Blackey are spread across the mountain valleys. With its rugged terrain, coal heritage, and cross-border location, Letcher County reflects the character of Kentucky’s mountain region.
#9. Leslie County (tie)
– Life expectancy: 68.8 years
— 5.2 years lower than the state average
About
Leslie County lies in the mountains of southeastern Kentucky, where steep ridges, narrow valleys, and dense forests define its setting. Hyden, the county seat, provides a center for schools, commerce, and local institutions that link its rural communities. The county’s character reflects both its rugged land and its Appalachian heritage.
Cultural traditions remain strong through church gatherings, festivals, and music that highlight local identity. Families often trace their roots back for generations, carrying forward a deep sense of continuity. Leslie County endures as a place where land, heritage, and community remain closely tied.
Where is Leslie County?
Leslie County lies in southeastern Kentucky within the Appalachian Mountains, about 100 miles southeast of Lexington. The landscape is dominated by steep ridges, deep hollows, and forested valleys, much of which falls inside the Daniel Boone National Forest. The Middle Fork of the Kentucky River cuts through the county, shaping valleys where communities developed along winding roads and waterways.
Hyden, the county seat, rests along the Middle Fork and serves as the primary hub for government and local institutions. Smaller communities such as Stinnett, Wooton, and Cutshin are tucked into the mountain hollows, linked by narrow state highways. Rather than bordering Tennessee, Leslie County sits north of Clay and Bell Counties, positioned firmly in Kentucky’s rugged mountain interior.
#9. Floyd County (tie)
– Life expectancy: 68.8 years
— 5.2 years lower than the state average
About
Floyd County carries a legacy rooted in coal mining, river trade, and the endurance of Appalachian communities. Prestonsburg, the county seat, has long served as a hub for education, culture, and regional commerce in eastern Kentucky. The county’s story reflects resilience shaped by both industry and heritage.
Hills, valleys, and winding rivers frame the landscape, offering both livelihood and recreation. Music, festivals, and church-centered traditions strengthen the bonds between neighbors and families. Floyd County continues to stand as a place where history, land, and culture remain deeply connected.
Where is Floyd County?
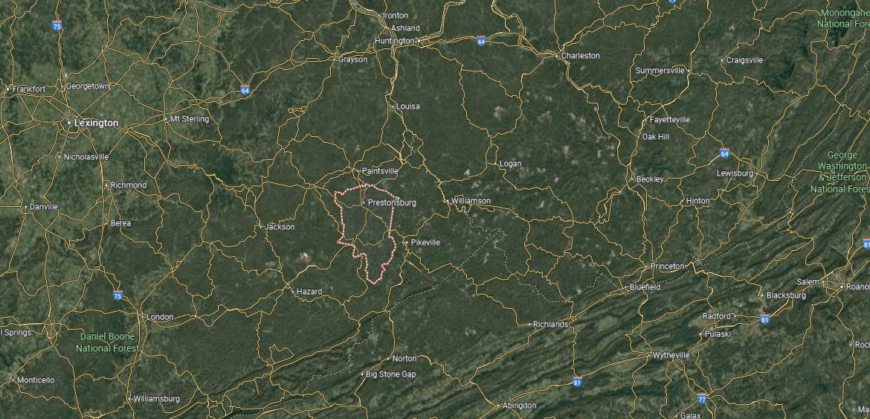
Floyd County is located in eastern Kentucky within the Appalachian coalfields. It lies about 130 miles east of Lexington and 25 miles northwest of Pikeville, covering a landscape of steep ridges, narrow valleys, and creeks that flow into the Big Sandy River system. The terrain is heavily forested, with communities often built along winding hollows and riverbanks.
Prestonsburg, the county seat, is positioned near the center along the Levisa Fork of the Big Sandy River and serves as the cultural and commercial hub. Martin, Allen, and Wheelwright are among the smaller towns spread across the county, each tied to the region’s coal and railroad history. With its mountain geography and long ties to mining, Floyd County is deeply rooted in Appalachian heritage.
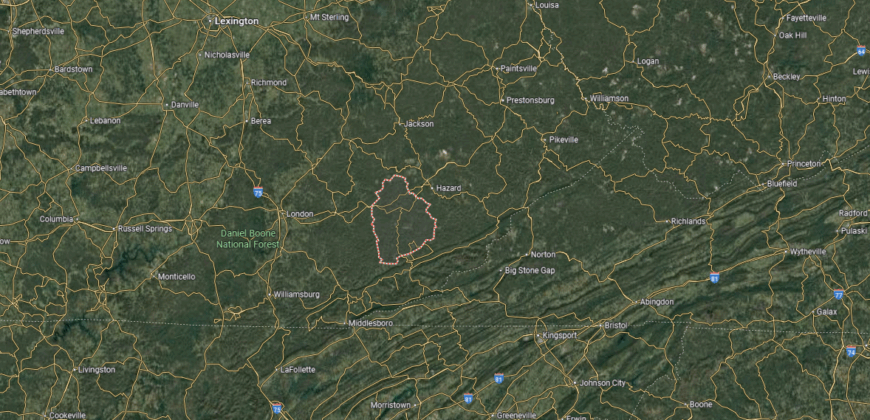
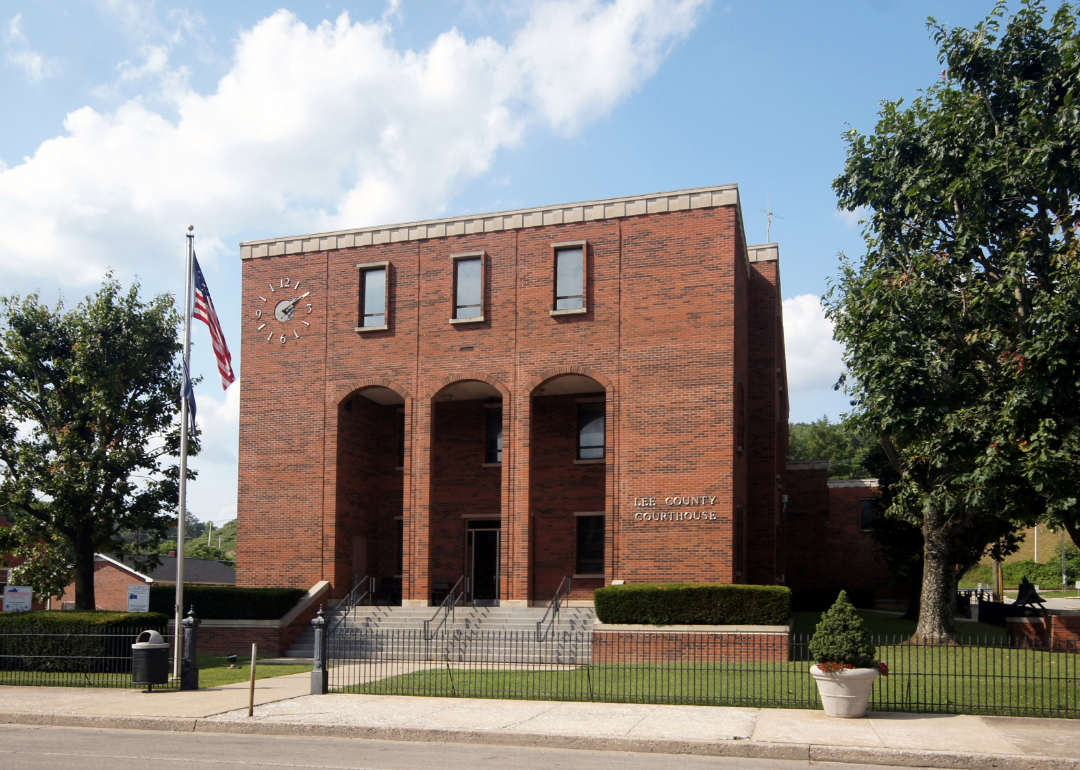
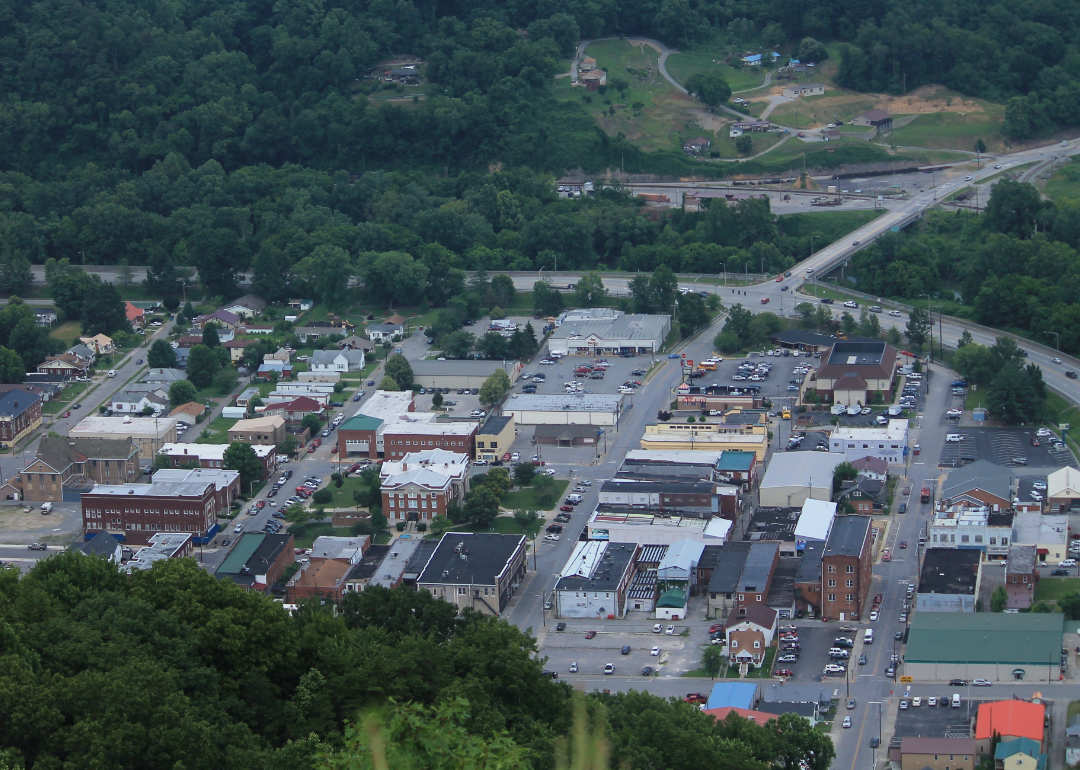
#8. Lee County
– Life expectancy: 68.1 years
— 5.9 years lower than the state average
About
Lee County is defined by its close-knit communities, where church gatherings, school events, and festivals sustain local traditions. Beattyville, the county seat, serves as the hub for commerce, education, and civic life, tying together the surrounding rural areas. The county’s character reflects both Appalachian culture and the resilience of small-town living.
Forested hills, valleys, and rivers shape the land, offering both challenges and connections for generations of families. Heritage remains strong as families pass down customs rooted in faith, music, and storytelling. Lee County endures as a place where culture, landscape, and community remain firmly bound.
Where is Lee County?
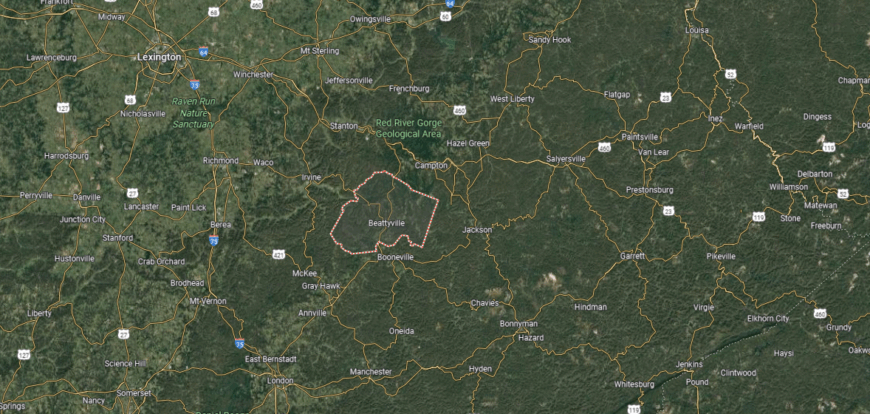
Lee County is situated in eastern Kentucky where the Bluegrass region meets the Appalachian foothills. It lies about 65 miles southeast of Lexington and spans just over 200 square miles of rugged hills, river valleys, and forestland. The Kentucky River, formed by the meeting of its North, Middle, and South Forks, converges within the county, shaping much of its geography.
Beattyville, the county seat, is positioned at this river confluence and serves as the hub for government and community life. Smaller communities such as Heidelberg and St. Helens lie along the river valleys and state highways. With its river crossroads and mountain setting, Lee County reflects both the natural and cultural heart of eastern Kentucky.
#7. Bell County
– Life expectancy: 67.7 years
— 6.3 years lower than the state average
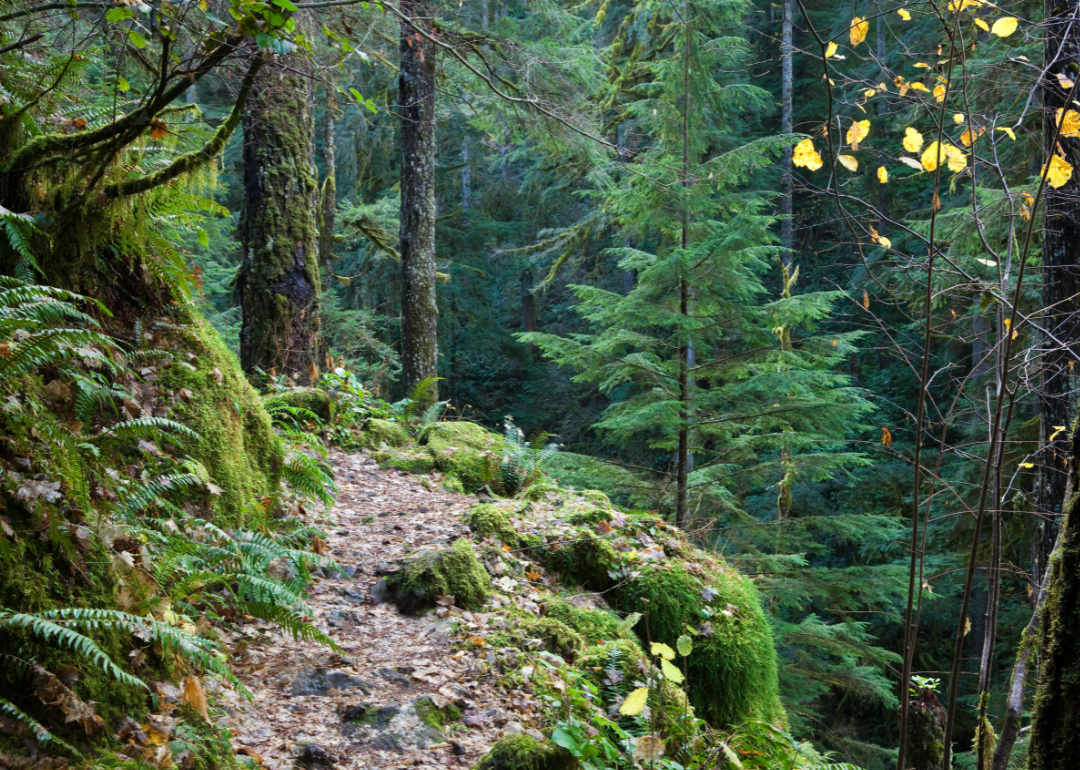
About
Bell County sits at Kentucky’s southeastern border, where the Cumberland Gap and Appalachian ridges shape both history and daily life. Pineville, the county seat, and Middlesboro together serve as centers of commerce, education, and community activity. The county’s identity reflects a blend of mountain landscape and its pivotal role as a gateway through the Appalachians.
Traditions endure through festivals, church life, and cultural events that highlight its Appalachian heritage. Families often remain rooted for generations, carrying forward ties to both land and community. Bell County stands as a place where geography, history, and culture are inseparably linked.
Where is Bell County?
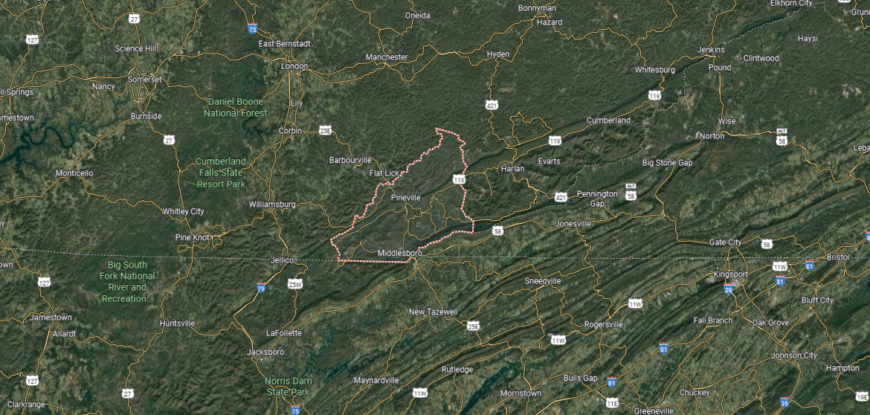
Bell County is located in the southeastern corner of Kentucky, sharing borders with both Tennessee and Virginia. It lies about 95 miles southeast of Lexington and is entirely within the Appalachian Mountains, where steep ridges and winding valleys dominate the landscape. The Cumberland Gap, a historic passage through the mountains, sits at the county’s southeastern edge.
Pineville, the county seat, rests along the Cumberland River and serves as the administrative and commercial center. Middlesboro, the largest city, is positioned in a natural basin near the Gap and functions as a major hub for the region. With its mountain terrain, historic crossings, and river valleys, Bell County is a gateway between Kentucky and its neighboring states.
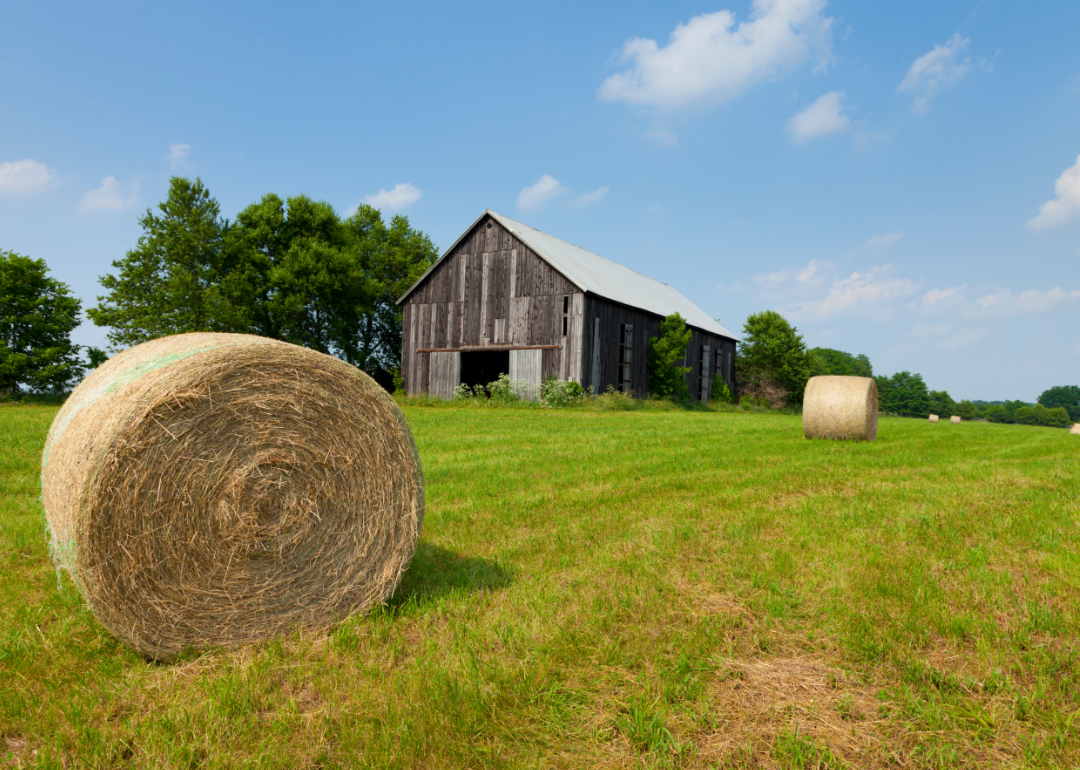
#5. Fulton County (tie)
– Life expectancy: 67.5 years
— 6.5 years lower than the state average
You may also like: Cheddar cheese, ham, and other groceries that dropped in price in the South last month
About
Fulton County carries a legacy shaped by its position on the Mississippi River, where trade and river travel once defined its development. Hickman, the county seat, reflects this heritage through its historic riverfront and role as a civic and cultural hub. The county’s story blends agricultural traditions with its ties to the river.
Flat farmland and waterways form the backdrop of daily life, supporting both livelihood and recreation. Community gatherings, festivals, and deep family roots sustain connections across generations. Fulton County remains a place where history, land, and community are closely bound together.
Where is Fulton County?
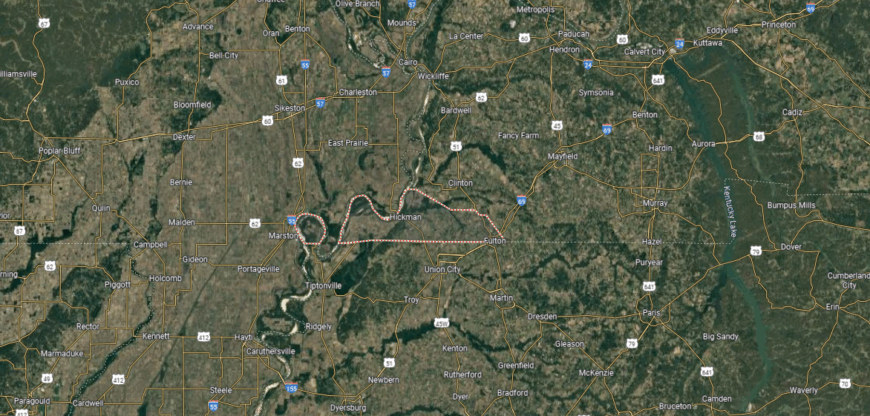
Fulton County sits at the far western tip of Kentucky, uniquely positioned with borders along both Tennessee and the Mississippi River. It lies about 125 miles southwest of Paducah and is the only county in Kentucky that includes territory west of the Mississippi, known as the “Kentucky Bend.” The landscape is largely flat, with fertile bottomlands shaped by the river’s path.
Hickman, the county seat, is located on the Mississippi River and serves as the main hub for government and commerce. The city of Fulton, on the Tennessee line, anchors the southern part of the county and connects directly with South Fulton, Tennessee. With its riverfront setting, agricultural base, and geographic distinction, Fulton County stands apart as one of Kentucky’s most unusual counties.
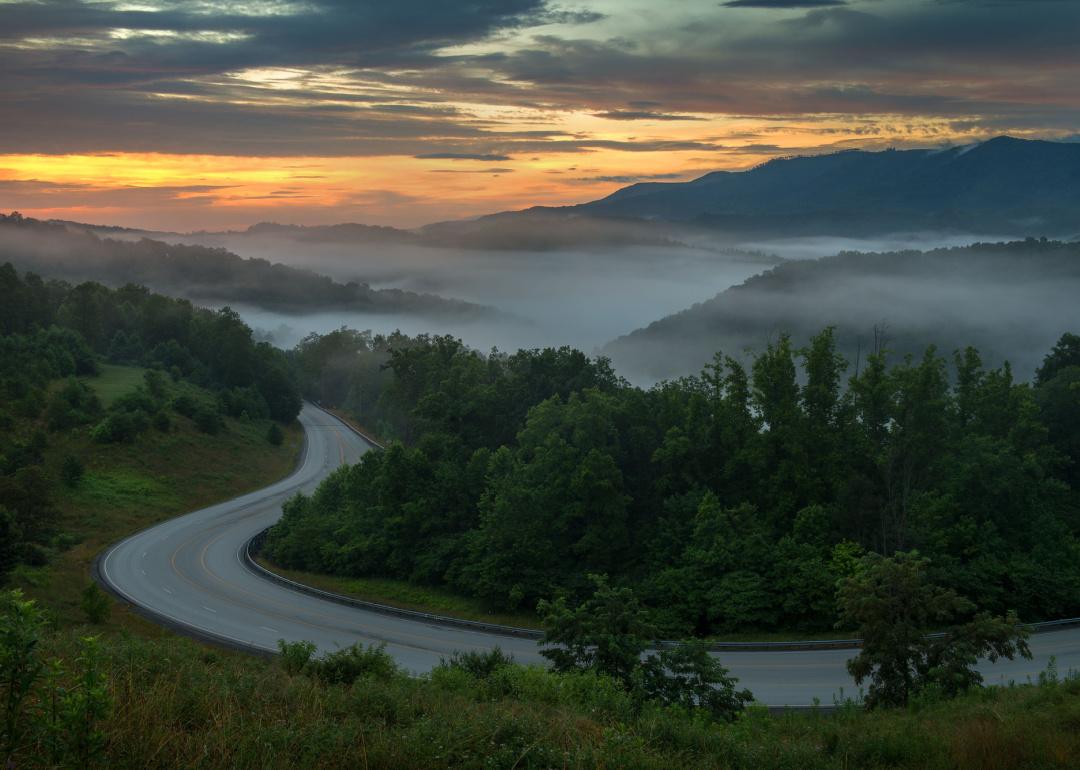
#5. Breathitt County (tie)
– Life expectancy: 67.5 years
— 6.5 years lower than the state average
About
Breathitt County is known for its strong Appalachian traditions, where church gatherings, storytelling, and music continue to shape daily life. Jackson, the county seat, provides the hub for schools, commerce, and civic activity, linking the surrounding mountain communities. The county’s identity reflects both cultural heritage and the resilience of its people.
Forested hills, rivers, and winding valleys create a rugged backdrop that has long influenced settlement and work. Generational ties to the land give families a lasting sense of continuity and belonging. Breathitt County endures as a place where culture, geography, and community remain deeply connected.
Where is Breathitt County?
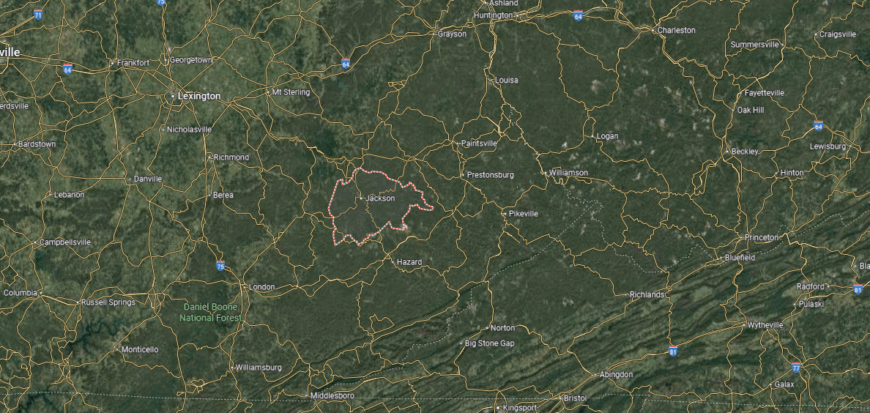
Breathitt County is set in eastern Kentucky within the Appalachian foothills. It lies about 90 miles southeast of Lexington and covers a landscape dominated by rugged hills, narrow valleys, and winding creeks that feed into the Kentucky River. Much of the land is forested, giving the county a strong mountain character.
Jackson, the county seat, is located along the North Fork of the Kentucky River and serves as the county’s main center for government and commerce. Smaller communities such as Rousseau, Lost Creek, and Vancleve are scattered across the valleys and hollows. With its mountain terrain, river valleys, and rural settlements, Breathitt County reflects the geography and traditions of eastern Kentucky.
#4. Harlan County
– Life expectancy: 67.0 years
— 7.0 years lower than the state average
About
Harlan County lies deep in southeastern Kentucky, where steep ridges, coal seams, and winding valleys define its Appalachian setting. Harlan, the county seat, serves as a hub for schools, commerce, and civic traditions that tie scattered mountain communities together. The county’s story reflects both the power of its land and the endurance of its people.
Coal mining shaped much of its history, leaving behind a legacy of hard work and resilience that still influences community identity. Festivals, church gatherings, and family traditions continue to sustain connections across generations. Harlan County stands as a place where land, history, and culture remain tightly interwoven.
Where is Harlan County?
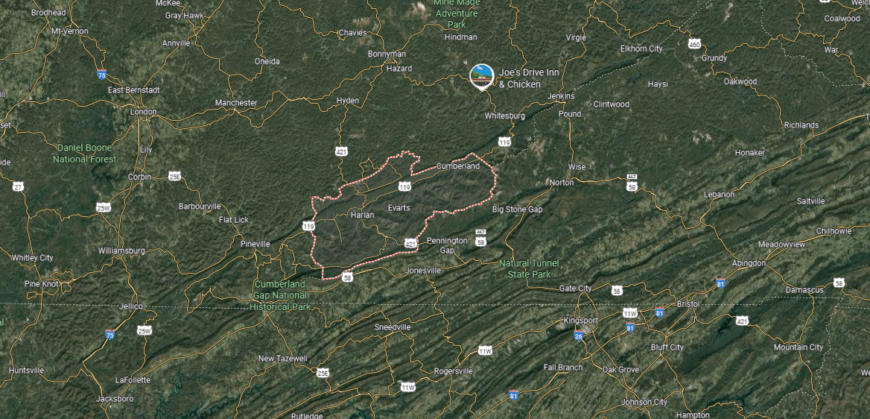
Harlan County is located in southeastern Kentucky along the state’s border with Virginia. It lies about 120 miles southeast of Lexington and covers more than 460 square miles of Appalachian terrain, with steep mountains, deep hollows, and numerous creeks feeding into the Cumberland River. The county has long been associated with coal mining, which shaped much of its history and communities.
Harlan, the county seat, sits in the central valley along the Cumberland River and serves as the main hub for commerce and government. Other towns such as Cumberland, Evarts, and Loyall are spread throughout the mountain valleys, often following old mining and rail corridors. With its rugged landscape, cross-border location, and coal heritage, Harlan County remains a defining part of southeastern Kentucky’s mountain region.
#2. Owsley County (tie)
– Life expectancy: 65.8 years
— 8.2 years lower than the state average

About
Owsley County carries a legacy rooted in the Appalachian experience, shaped by farming, coal, and generations of mountain families. Booneville, the county seat, provides a focal point for schools, commerce, and civic life, tying together its small, close-knit communities. The county’s identity reflects resilience built on both heritage and place.
Forested hills, creeks, and winding valleys frame the daily life of residents, offering both challenge and connection to the land. Traditions endure through church gatherings, local events, and the passing down of family customs. Owsley County stands as a place where history, landscape, and community remain deeply bound.
Where is Owsley County?
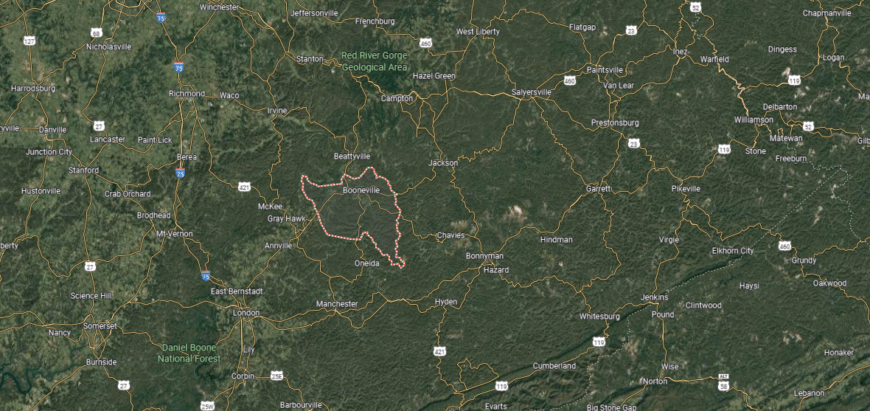
Owsley County is situated in eastern Kentucky, about 110 miles southeast of Lexington. It is one of the state’s smallest counties by population and land area, covering just over 190 square miles. The terrain is mountainous, with forested ridges, narrow hollows, and the South Fork of the Kentucky River running through its valleys.
Booneville, the county seat, lies near the river and serves as the center of local government and community life. Smaller settlements and family farms are scattered across the hills, linked by winding state highways. Defined by its remote setting and Appalachian landscape, Owsley County maintains a quiet, rural character.
#2. Wolfe County (tie)
– Life expectancy: 65.8 years
— 8.2 years lower than the state average

About
Wolfe County is marked by close-knit communities, where church gatherings, school events, and seasonal festivals help sustain Appalachian traditions. Campton, the county seat, serves as the hub for schools, commerce, and civic institutions that link scattered rural areas. The county’s character reflects both its cultural heritage and its enduring mountain spirit.
The rugged landscape of cliffs, ridges, and forests—part of the Red River Gorge region—shapes both work and recreation. Families often remain rooted for generations, carrying forward a way of life closely tied to the land. Wolfe County stands as a place where culture, geography, and community remain inseparably connected.
Where is Wolfe County?
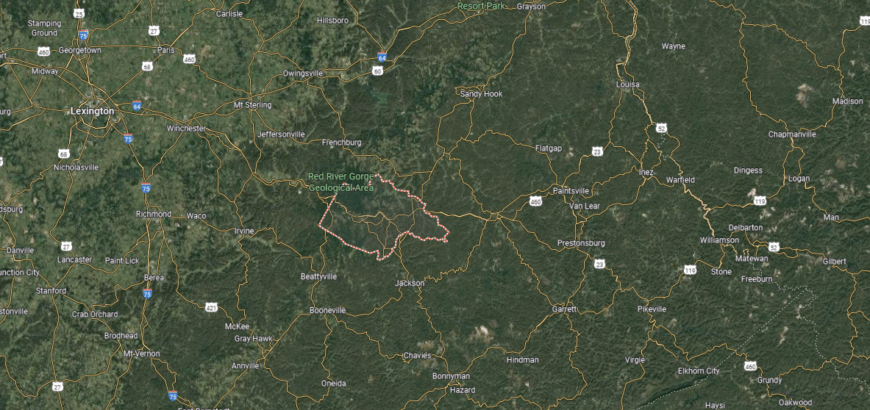
Wolfe County is located in eastern Kentucky, about 75 miles southeast of Lexington. It spans just over 220 square miles, much of it rugged and heavily forested, with steep ridges, narrow valleys, and winding creeks. Portions of the Daniel Boone National Forest and the Red River Gorge lie within its boundaries, making the county part of a major outdoor recreation region.
Campton, the county seat, sits near the center and serves as the hub for government and commerce. Other small communities such as Hazel Green and Rogers connect the surrounding hills and rural areas. With its mountain setting and access to nationally known natural landmarks, Wolfe County is closely tied to both Appalachian life and outdoor tourism.
#1. Perry County
– Life expectancy: 65.4 years
— 8.6 years lower than the state average
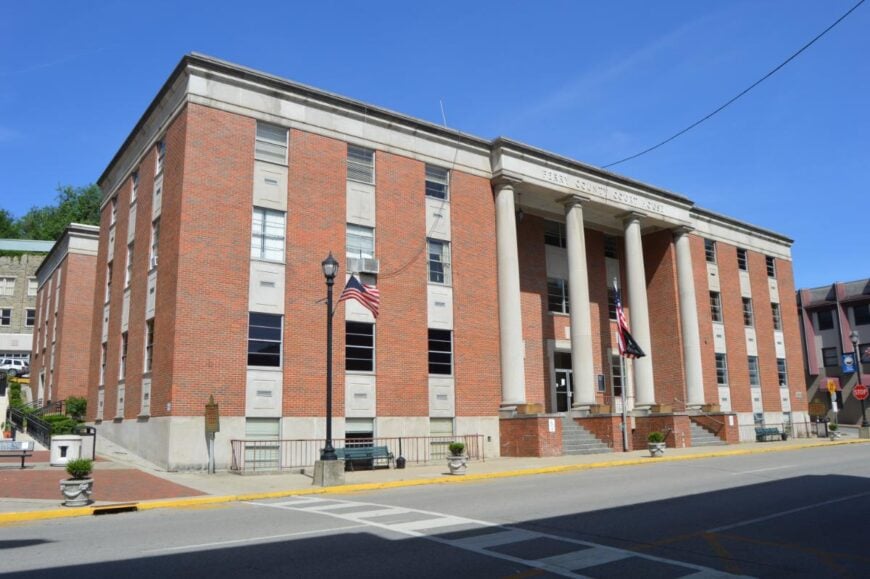
About
Perry County lies in the Appalachian Mountains, where steep ridges, valleys, and winding waterways shape its setting. Hazard, the county seat, serves as a hub for schools, commerce, and civic life, connecting surrounding rural communities. The county’s identity reflects both its mountain landscape and its coalfield history.
Music, festivals, and church traditions keep cultural life strong, offering continuity across generations. Families often trace their roots back for decades, linking identity to both land and heritage. Perry County remains a place where geography, history, and community come together as one.
Where is Perry County?
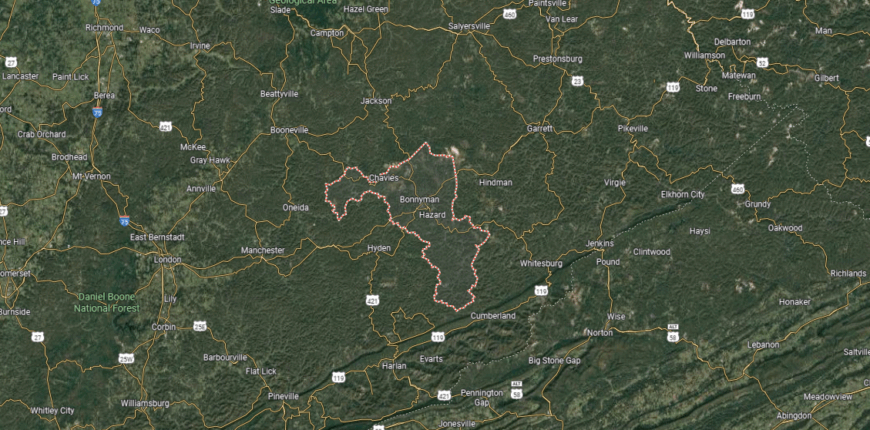
Perry County is set in southeastern Kentucky within the Appalachian Mountains. It lies about 125 miles southeast of Lexington and covers more than 340 square miles of steep ridges, narrow hollows, and forested terrain. The North Fork of the Kentucky River flows through the county, shaping valleys where many communities developed.
Hazard, the county seat, sits along the river and serves as the region’s commercial and cultural center. Smaller towns such as Vicco, Buckhorn, and Cornettsville are scattered across the hills and valleys, connected by winding highways. With its mountainous geography, river valleys, and coalfield heritage, Perry County reflects the heart of Kentucky’s Appalachian region.
This story features data reporting by Karim Noorani, writing by Kiersten Hickman, and is part of a series utilizing data automation across 49 states.
You may also like: Kentucky ranks #16 in mental health care deserts
By Stacker