🔥 Would you like to save this?
Home price data from the Zillow Home Value Index reveals the priciest communities across Texas as of 2025. These figures offer a deep look into where the state’s real estate market has climbed the most — sometimes steadily, and sometimes with dramatic leaps.
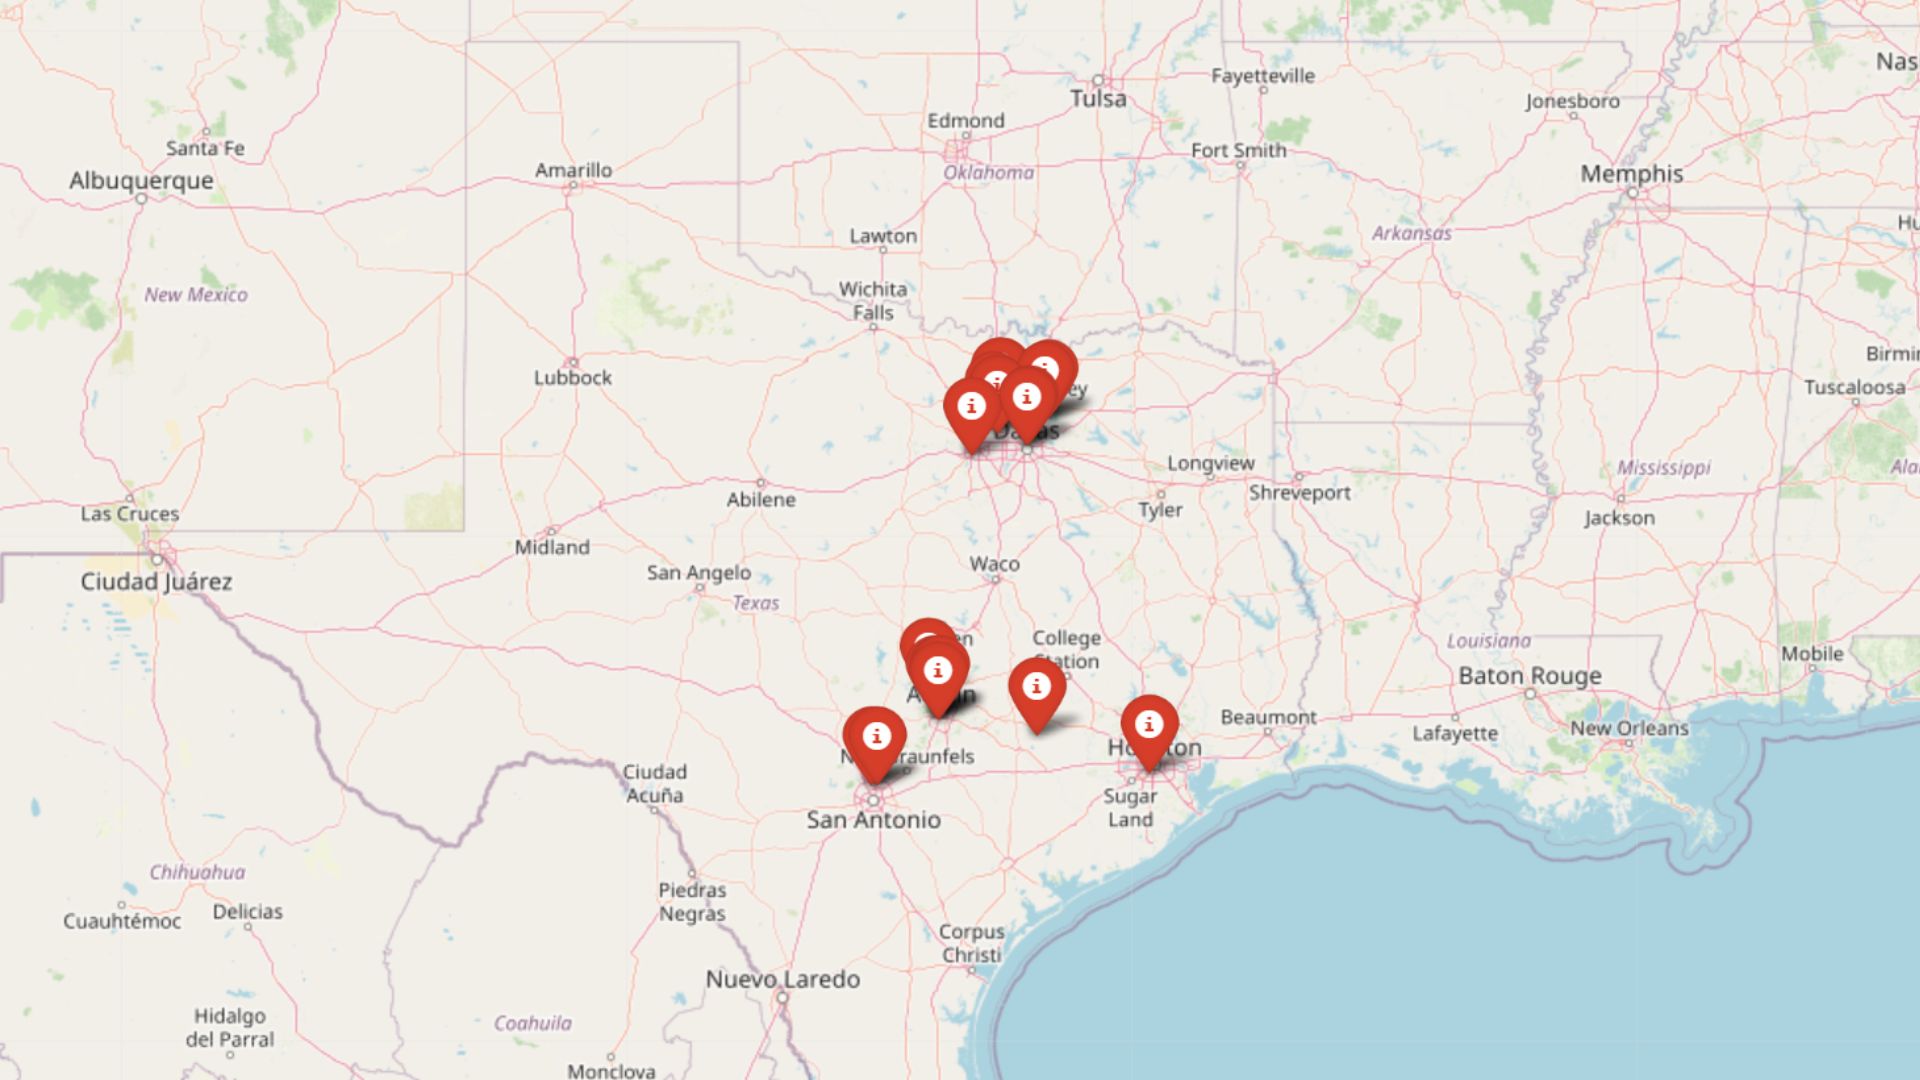
From upscale enclaves in Dallas and Austin to luxurious small towns with limited housing stock, these places command top dollar thanks to location, amenities, demand, and in many cases, sheer prestige. Whether you’re a buyer, investor, or just curious about where Texas’ wealth is concentrating, this ranking highlights where prices have risen the most in raw dollar terms and percentage growth since 2010 (or the earliest available year).
In order to come up with the very specific design ideas, we create most designs with the assistance of state-of-the-art AI interior design software.
Each entry includes the complete year-by-year price record, along with expert context to help explain what’s driving the market in each town. This isn’t just a list — it’s a state-wide snapshot of high-end housing in 2025.
18. Shavano Park – 77% Home Price Increase Since 2010

- 2010: $537,759
- 2011: $518,760 (-$18,999, -3.53% from previous year)
- 2012: $525,507 (+$6,747, +1.30% from previous year)
- 2013: $545,258 (+$19,751, +3.76% from previous year)
- 2014: $562,550 (+$17,292, +3.17% from previous year)
- 2015: $594,216 (+$31,666, +5.63% from previous year)
- 2016: $597,294 (+$3,078, +0.52% from previous year)
- 2017: $611,887 (+$14,593, +2.44% from previous year)
- 2018: $625,251 (+$13,363, +2.18% from previous year)
- 2019: $638,414 (+$13,164, +2.11% from previous year)
- 2020: $654,156 (+$15,742, +2.47% from previous year)
- 2021: $730,291 (+$76,135, +11.64% from previous year)
- 2022: $876,984 (+$146,693, +20.09% from previous year)
- 2023: $901,341 (+$24,357, +2.78% from previous year)
- 2024: $940,562 (+$39,221, +4.35% from previous year)
- 2025: $951,635 (+$11,073, +1.18% from previous year)
Home values in Shavano Park have risen by 77% since 2010, climbing from just over $537K to nearly $952K in 2025. The sharpest jump came in 2022, with a 20% increase from the prior year, while more recent growth has leveled off. This affluent enclave has consistently added value year over year, reflecting sustained demand in the northern San Antonio metro area.
Shavano Park – Strong Upswing Near San Antonio

Located just 15 miles north of downtown San Antonio, Shavano Park is a quiet, upscale city known for large lots, mature trees, and a small-town feel despite being inside the I-410 loop. With a population under 4,000, the community’s limited housing inventory plays a role in keeping prices elevated.
The city’s zoning and development restrictions help preserve its exclusivity, while proximity to The University of Texas at San Antonio and top-rated NEISD schools enhance its appeal to families. Its highest annual gain of more than $146,000 in 2022 coincided with a statewide housing boom, and while recent years have shown slower growth, the long-term trajectory remains strongly upward.
17. Sunset Valley – 154% Home Price Increase Since 2010

- 2010: $394,428
- 2011: $405,541 (+$11,113, +2.82% from previous year)
- 2012: $433,656 (+$28,116, +6.93% from previous year)
- 2013: $473,878 (+$40,221, +9.27% from previous year)
- 2014: $511,281 (+$37,403, +7.89% from previous year)
- 2015: $551,810 (+$40,530, +7.93% from previous year)
- 2016: $576,285 (+$24,475, +4.44% from previous year)
- 2017: $586,502 (+$10,217, +1.77% from previous year)
- 2018: $613,219 (+$26,717, +4.56% from previous year)
- 2019: $676,777 (+$63,558, +10.36% from previous year)
- 2020: $701,859 (+$25,082, +3.71% from previous year)
- 2021: $907,663 (+$205,804, +29.32% from previous year)
- 2022: $1,188,862 (+$281,199, +30.98% from previous year)
- 2023: $1,066,130 (-$122,732, -10.32% from previous year)
- 2024: $1,047,542 (-$18,589, -1.74% from previous year)
- 2025: $1,002,960 (-$44,581, -4.26% from previous year)
Sunset Valley home values have more than doubled since 2010, surging 154% over 15 years. The sharpest increases came between 2020 and 2022, including a staggering 31% gain in a single year. While prices have dropped slightly since peaking, the long-term climb remains impressive.
Sunset Valley – Austin’s Pricey Pocket Community

Technically a separate city but surrounded by Austin, Sunset Valley is a tiny municipality with its own zoning and government. It spans less than one square mile but has managed to command outsized home values thanks to its location and character. Access to major highways, the Barton Creek Greenbelt, and a short commute to downtown Austin all add value.
The extraordinary price spikes in 2021 and 2022 likely reflect Austin’s explosive pandemic-era housing demand, with a cooling trend afterward. As of 2025, Sunset Valley homes still top $1 million on average, reflecting the area’s continued desirability despite the recent dip.
16. Volente – 138% Home Price Increase Since 2010

- 2010: $430,843
- 2011: $422,265 (-$8,578, -1.99% from previous year)
- 2012: $460,755 (+$38,491, +9.12% from previous year)
- 2013: $509,830 (+$49,075, +10.65% from previous year)
- 2014: $528,538 (+$18,708, +3.67% from previous year)
- 2015: $540,650 (+$12,112, +2.29% from previous year)
- 2016: $557,187 (+$16,537, +3.06% from previous year)
- 2017: $586,330 (+$29,142, +5.23% from previous year)
- 2018: $595,617 (+$9,287, +1.58% from previous year)
- 2019: $660,454 (+$64,837, +10.89% from previous year)
- 2020: $698,546 (+$38,092, +5.77% from previous year)
- 2021: $951,099 (+$252,553, +36.15% from previous year)
- 2022: $1,273,516 (+$322,417, +33.90% from previous year)
- 2023: $1,137,021 (-$136,495, -10.72% from previous year)
- 2024: $1,077,515 (-$59,505, -5.23% from previous year)
- 2025: $1,027,207 (-$50,308, -4.67% from previous year)
Volente’s home values have jumped by 138% since 2010, more than doubling from under $431K to over $1 million in 2025. The pandemic years saw massive spikes, including a 36% increase in 2021 and another 34% in 2022. Recent years have seen slight corrections, but values remain far above pre-2020 levels.
Volente – Lake Travis Views with High Demand

Located along the north shore of Lake Travis, Volente offers water access and scenic views just northwest of Austin. Its semi-rural charm, custom homes, and lake lifestyle attract buyers looking for space and serenity within reach of the city.
Though modest in population, Volente saw huge appreciation during the pandemic housing rush, which pushed prices well above $1.2 million by 2022. While 2023–2025 brought moderate declines, prices remain strong due to location and limited inventory. Lakefront property has always held a premium, and that hasn’t changed here.
15. Lucas – 176% Home Price Increase Since 2010

- 2010: $399,228
- 2011: $391,197 (-$8,031, -2.01% from previous year)
- 2012: $403,589 (+$12,392, +3.17% from previous year)
- 2013: $440,778 (+$37,189, +9.21% from previous year)
- 2014: $483,481 (+$42,702, +9.69% from previous year)
- 2015: $535,451 (+$51,971, +10.75% from previous year)
- 2016: $574,802 (+$39,351, +7.35% from previous year)
- 2017: $605,313 (+$30,510, +5.31% from previous year)
- 2018: $640,710 (+$35,398, +5.85% from previous year)
- 2019: $649,917 (+$9,206, +1.44% from previous year)
- 2020: $674,067 (+$24,150, +3.72% from previous year)
- 2021: $802,628 (+$128,561, +19.07% from previous year)
- 2022: $1,096,204 (+$293,576, +36.58% from previous year)
- 2023: $1,055,156 (-$41,048, -3.74% from previous year)
- 2024: $1,104,213 (+$49,057, +4.65% from previous year)
- 2025: $1,101,232 (-$2,980, -0.27% from previous year)
Lucas home prices have climbed by 176% since 2010, driven by strong growth from 2013 onward. The town peaked in 2022, with a nearly 37% single-year jump. Though values dipped slightly in the following years, prices remain far higher than a decade ago.
Lucas – Spacious Living North of Dallas

Located in Collin County northeast of Dallas, Lucas is known for its acreage lots, equestrian properties, and upscale custom homes. It’s especially attractive to buyers who want open space without sacrificing access to urban conveniences.
The town saw a massive leap in values between 2020 and 2022, possibly driven by the post-pandemic flight to larger homes in semi-rural settings. While values dipped slightly in 2023 and 2025, the long-term trend has pushed median prices up to over $1.1 million. Its appeal to families and proximity to Plano ISD schools continues to sustain demand.
14. Copper Canyon – 174% Home Price Increase Since 2010

- 2010: $403,564
- 2011: $392,785 (-$10,780, -2.67% from previous year)
- 2012: $397,518 (+$4,734, +1.21% from previous year)
- 2013: $425,757 (+$28,238, +7.10% from previous year)
- 2014: $455,070 (+$29,313, +6.88% from previous year)
- 2015: $501,424 (+$46,355, +10.19% from previous year)
- 2016: $529,638 (+$28,213, +5.63% from previous year)
- 2017: $562,207 (+$32,569, +6.15% from previous year)
- 2018: $604,971 (+$42,765, +7.61% from previous year)
- 2019: $625,909 (+$20,938, +3.46% from previous year)
- 2020: $653,583 (+$27,674, +4.42% from previous year)
- 2021: $768,798 (+$115,215, +17.63% from previous year)
- 2022: $972,809 (+$204,011, +26.54% from previous year)
- 2023: $961,869 (-$10,940, -1.12% from previous year)
- 2024: $1,062,577 (+$100,708, +10.47% from previous year)
- 2025: $1,105,287 (+$42,710, +4.02% from previous year)
Home values in Copper Canyon have risen 174% since 2010. After steady growth through the 2010s, prices surged dramatically between 2020 and 2022. Following a slight dip in 2023, values have resumed climbing, with strong gains in 2024 and 2025.
Copper Canyon – Gaining Value in Denton County

Situated between Flower Mound and Highland Village, Copper Canyon offers a blend of country feel and suburban convenience. The town is known for large estates, equestrian zoning, and a commitment to low-density development.
The big jump in prices around 2021 and 2022 mirrors regional trends in Denton County, where demand outpaced supply during the pandemic real estate rush. Prices have remained above $1 million since 2022, and the continued upward trend in 2024–2025 suggests persistent demand and limited housing turnover.
13. Parker – 152% Home Price Increase Since 2010

- 2010: $440,898
- 2011: $427,163 (-$13,735, -3.12% from previous year)
- 2012: $439,844 (+$12,681, +2.97% from previous year)
- 2013: $470,945 (+$31,101, +7.07% from previous year)
- 2014: $513,256 (+$42,311, +8.98% from previous year)
- 2015: $565,721 (+$52,466, +10.22% from previous year)
- 2016: $598,295 (+$32,573, +5.76% from previous year)
- 2017: $622,636 (+$24,341, +4.07% from previous year)
- 2018: $639,674 (+$17,038, +2.74% from previous year)
- 2019: $653,502 (+$13,828, +2.16% from previous year)
- 2020: $673,353 (+$19,850, +3.04% from previous year)
- 2021: $794,076 (+$120,723, +17.93% from previous year)
- 2022: $1,073,988 (+$279,912, +35.25% from previous year)
- 2023: $1,051,403 (-$22,585, -2.10% from previous year)
- 2024: $1,108,666 (+$57,262, +5.45% from previous year)
- 2025: $1,112,091 (+$3,425, +0.31% from previous year)
Since 2010, home values in Parker have jumped more than 152%, rising from about $441K to over $1.1 million in 2025. The most dramatic leap came in 2022, when home prices surged over 35%. While price growth has moderated recently, the overall trend remains strongly positive.
Parker – Premium Suburb with Room to Grow

Parker is a small but desirable city in Collin County, just east of Plano and Allen. It offers large properties, top-ranked public schools, and a semi-rural feel that’s attractive to families and professionals alike. It’s also famously home to Southfork Ranch, of “Dallas” TV fame, which still draws visitors and adds a bit of glamor to the town’s image.
Real estate values in Parker have reflected the wider Dallas-Fort Worth housing boom, especially during 2021–2022 when demand for more space and fewer neighbors was at a high. Although price growth has tapered off, homes here remain in high demand thanks to limited inventory and its strong school district.
12. Bellaire – 68% Home Price Increase Since 2010

🔥 Would you like to save this?
- 2010: $670,317
- 2011: $637,496 (-$32,820, -4.90% from previous year)
- 2012: $648,988 (+$11,491, +1.80% from previous year)
- 2013: $711,664 (+$62,677, +9.66% from previous year)
- 2014: $799,563 (+$87,899, +12.35% from previous year)
- 2015: $894,898 (+$95,334, +11.92% from previous year)
- 2016: $903,143 (+$8,245, +0.92% from previous year)
- 2017: $881,986 (-$21,157, -2.34% from previous year)
- 2018: $864,063 (-$17,923, -2.03% from previous year)
- 2019: $858,502 (-$5,561, -0.64% from previous year)
- 2020: $833,886 (-$24,616, -2.87% from previous year)
- 2021: $886,819 (+$52,933, +6.35% from previous year)
- 2022: $975,721 (+$88,902, +10.02% from previous year)
- 2023: $1,013,585 (+$37,864, +3.88% from previous year)
- 2024: $1,076,827 (+$63,242, +6.24% from previous year)
- 2025: $1,127,064 (+$50,237, +4.67% from previous year)
Bellaire’s home prices have risen 68% since 2010. After a sharp increase from 2012–2015, values flattened and even dipped slightly during the late 2010s. Since 2020, however, prices have climbed steadily again, passing $1.1 million in 2025.
Bellaire – Affluent Living Inside Houston

Sometimes referred to as the “City of Homes,” Bellaire is an independent city surrounded by Houston, located just southwest of downtown. With tree-lined streets, large lots, and access to top private and public schools, it’s long been a favorite for families and professionals.
Although the area experienced modest declines in the late 2010s — partly due to flooding concerns from Hurricane Harvey — it has rebounded impressively in recent years. Bellaire’s enduring appeal lies in its blend of suburban calm and big-city access, which helps explain the renewed price growth since 2020.
11. Round Top – 290% Home Price Increase Since 2010

- 2010: $305,583
- 2011: $305,939 (+$356, +0.12% from previous year)
- 2012: $325,838 (+$19,899, +6.50% from previous year)
- 2013: $343,661 (+$17,823, +5.47% from previous year)
- 2014: $395,472 (+$51,811, +15.08% from previous year)
- 2015: $432,721 (+$37,250, +9.42% from previous year)
- 2016: $475,296 (+$42,575, +9.84% from previous year)
- 2017: $498,064 (+$22,768, +4.79% from previous year)
- 2018: $545,093 (+$47,029, +9.44% from previous year)
- 2019: $608,922 (+$63,828, +11.71% from previous year)
- 2020: $630,291 (+$21,369, +3.51% from previous year)
- 2021: $861,496 (+$231,205, +36.68% from previous year)
- 2022: $1,164,406 (+$302,910, +35.16% from previous year)
- 2023: $1,099,941 (-$64,466, -5.54% from previous year)
- 2024: $1,149,776 (+$49,835, +4.53% from previous year)
- 2025: $1,190,465 (+$40,690, +3.54% from previous year)
Round Top has experienced a staggering 290% rise in home values since 2010. While prices have cooled slightly since peaking in 2022, this small town’s long-term appreciation has been remarkable — especially for a rural community of its size.
Round Top – Small Town, Big Value Growth

Famous for its antique fairs and artsy charm, Round Top in Fayette County is home to fewer than 100 people, yet commands home prices nearing $1.2 million. Its draw lies in the quiet countryside, cultural events, and an abundance of high-end vacation properties and second homes.
The post-2020 housing boom drove dramatic spikes, especially in 2021–2022. Its transformation from sleepy rural town to upscale weekend retreat has helped prices soar. And while prices dipped slightly in 2023, they quickly rebounded, continuing to inch upward into 2025.
10. Hill Country Village – 85% Home Price Increase Since 2010

- 2010: $684,226
- 2011: $670,238 (-$13,989, -2.04% from previous year)
- 2012: $673,184 (+$2,947, +0.44% from previous year)
- 2013: $693,676 (+$20,492, +3.04% from previous year)
- 2014: $718,815 (+$25,138, +3.62% from previous year)
- 2015: $768,859 (+$50,045, +6.96% from previous year)
- 2016: $770,327 (+$1,468, +0.19% from previous year)
- 2017: $767,144 (-$3,183, -0.41% from previous year)
- 2018: $790,314 (+$23,169, +3.02% from previous year)
- 2019: $814,259 (+$23,945, +3.03% from previous year)
- 2020: $849,949 (+$35,690, +4.38% from previous year)
- 2021: $996,239 (+$146,290, +17.21% from previous year)
- 2022: $1,209,314 (+$213,075, +21.39% from previous year)
- 2023: $1,184,754 (-$24,560, -2.03% from previous year)
- 2024: $1,226,897 (+$42,143, +3.56% from previous year)
- 2025: $1,264,598 (+$37,701, +3.07% from previous year)
Home prices in Hill Country Village have increased by 85% since 2010. While growth was modest for much of the 2010s, prices jumped during 2020–2022, reflecting the broader surge in luxury suburban housing demand.
Hill Country Village – Luxury Living Near San Antonio

Hill Country Village is one of the wealthiest towns in Texas, located about 10 miles north of downtown San Antonio. With only a few hundred homes and large wooded lots, it offers privacy and space while still providing easy access to city amenities.
The town saw some of its sharpest home price gains in 2021 and 2022, with values crossing the $1.2 million threshold. Its small size and exclusivity continue to support high property values, making it a standout among San Antonio’s high-end suburbs.
9. Southlake – 149% Home Price Increase Since 2010

- 2010: $513,755
- 2011: $500,864 (-$12,891, -2.51% from previous year)
- 2012: $506,876 (+$6,011, +1.20% from previous year)
- 2013: $538,400 (+$31,525, +6.22% from previous year)
- 2014: $576,616 (+$38,215, +7.10% from previous year)
- 2015: $619,994 (+$43,379, +7.52% from previous year)
- 2016: $653,977 (+$33,983, +5.48% from previous year)
- 2017: $677,992 (+$24,015, +3.67% from previous year)
- 2018: $703,657 (+$25,665, +3.79% from previous year)
- 2019: $724,198 (+$20,541, +2.92% from previous year)
- 2020: $750,363 (+$26,166, +3.61% from previous year)
- 2021: $876,962 (+$126,599, +16.87% from previous year)
- 2022: $1,171,174 (+$294,212, +33.55% from previous year)
- 2023: $1,162,644 (-$8,530, -0.73% from previous year)
- 2024: $1,250,219 (+$87,574, +7.53% from previous year)
- 2025: $1,282,228 (+$32,009, +2.56% from previous year)
Southlake home prices have surged nearly 149% since 2010, climbing from just over $513K to more than $1.28 million by 2025. The biggest year of growth came in 2022 with a 33.5% spike. Despite a brief decline in 2023, prices resumed their climb in the following two years.
Southlake – DFW Suburb with Sky-High Appeal

Situated northwest of Dallas-Fort Worth International Airport, Southlake is one of the most sought-after communities in North Texas. Known for its exemplary Carroll ISD schools, walkable Town Square, and high-end homes, the town has long attracted wealthy professionals and families.
Home values skyrocketed during the pandemic, with the 2022 jump reflecting intense demand for luxury housing. Even with some slowing since, Southlake remains among the most consistently expensive markets in the region, thanks to its blend of strong schools, shopping, and exclusive neighborhoods.
8. Lost Creek – 200% Home Price Increase Since 2010

- 2010: $436,700
- 2011: $440,760 (+$4,060, +0.93% from previous year)
- 2012: $475,076 (+$34,316, +7.79% from previous year)
- 2013: $533,754 (+$58,678, +12.35% from previous year)
- 2014: $589,348 (+$55,594, +10.42% from previous year)
- 2015: $650,074 (+$60,725, +10.30% from previous year)
- 2016: $692,001 (+$41,927, +6.45% from previous year)
- 2017: $699,807 (+$7,806, +1.13% from previous year)
- 2018: $734,538 (+$34,731, +4.96% from previous year)
- 2019: $757,239 (+$22,701, +3.09% from previous year)
- 2020: $821,470 (+$64,231, +8.48% from previous year)
- 2021: $1,055,671 (+$234,201, +28.51% from previous year)
- 2022: $1,499,074 (+$443,403, +42.00% from previous year)
- 2023: $1,374,770 (-$124,304, -8.29% from previous year)
- 2024: $1,303,086 (-$71,683, -5.21% from previous year)
- 2025: $1,310,299 (+$7,212, +0.55% from previous year)
Lost Creek home values have tripled since 2010, growing by 200%. Most of that growth occurred between 2020 and 2022, with a staggering 42% jump in 2022 alone. Although the market cooled off in 2023 and 2024, prices began to stabilize in 2025.
Lost Creek – West Austin Enclave on the Rise

Lost Creek is a well-established neighborhood just west of Austin, prized for its hill country feel, access to downtown, and proximity to the Barton Creek Greenbelt. It’s also served by the Eanes ISD, one of the highest-ranked school districts in Texas.
The neighborhood experienced outsized gains during the pandemic boom, with limited inventory and strong demand pushing prices past $1.5 million in 2022. While a correction followed, the area remains a stronghold of affluence within Austin’s competitive housing market.
7. Bartonville – 181% Home Price Increase Since 2010

- 2010: $478,582
- 2011: $472,683 (-$5,899, -1.23% from previous year)
- 2012: $470,040 (-$2,644, -0.56% from previous year)
- 2013: $494,191 (+$24,151, +5.14% from previous year)
- 2014: $535,325 (+$41,134, +8.32% from previous year)
- 2015: $578,816 (+$43,492, +8.12% from previous year)
- 2016: $629,326 (+$50,510, +8.73% from previous year)
- 2017: $670,981 (+$41,656, +6.62% from previous year)
- 2018: $710,475 (+$39,493, +5.89% from previous year)
- 2019: $731,947 (+$21,473, +3.02% from previous year)
- 2020: $766,180 (+$34,233, +4.68% from previous year)
- 2021: $937,610 (+$171,430, +22.37% from previous year)
- 2022: $1,232,614 (+$295,005, +31.46% from previous year)
- 2023: $1,199,902 (-$32,712, -2.65% from previous year)
- 2024: $1,312,005 (+$112,102, +9.34% from previous year)
- 2025: $1,347,840 (+$35,835, +2.73% from previous year)
Bartonville’s home values have grown by 181% over 15 years, with major appreciation occurring between 2020 and 2022. Despite a dip in 2023, the market rebounded with solid gains in both 2024 and 2025, surpassing $1.3 million.
Bartonville – Rural Feel, Luxury Prices

Located in Denton County, Bartonville offers spacious estates, horse properties, and large homes on wooded lots. It appeals to buyers looking for privacy and luxury away from urban congestion, yet it’s within reach of DFW job centers.
Like many Texas towns with land to spare, Bartonville saw a surge in interest during the remote work boom, driving massive price increases. As of 2025, it remains a top-tier market with strong appeal for buyers seeking luxury and space combined.
6. West Lake Hills – 194% Home Price Increase Since 2010

🔥 Would you like to save this?
- 2010: $688,947
- 2011: $656,630 (-$32,317, -4.69% from previous year)
- 2012: $684,972 (+$28,342, +4.32% from previous year)
- 2013: $801,880 (+$116,908, +17.07% from previous year)
- 2014: $902,344 (+$100,464, +12.53% from previous year)
- 2015: $984,563 (+$82,219, +9.11% from previous year)
- 2016: $1,046,372 (+$61,809, +6.28% from previous year)
- 2017: $1,081,196 (+$34,824, +3.33% from previous year)
- 2018: $1,126,161 (+$44,965, +4.16% from previous year)
- 2019: $1,197,013 (+$70,852, +6.29% from previous year)
- 2020: $1,272,612 (+$75,600, +6.32% from previous year)
- 2021: $1,680,204 (+$407,592, +32.03% from previous year)
- 2022: $2,478,512 (+$798,308, +47.51% from previous year)
- 2023: $2,232,895 (-$245,617, -9.91% from previous year)
- 2024: $2,143,916 (-$88,978, -3.98% from previous year)
- 2025: $2,023,092 (-$120,824, -5.64% from previous year)
West Lake Hills home prices have soared 194% since 2010, peaking at nearly $2.5 million in 2022. Although prices have declined modestly since then, they remain among the highest in Texas.
West Lake Hills – Elite Austin Address with Soaring Values

Located west of downtown Austin, West Lake Hills is one of the most prestigious neighborhoods in the region. With views of the Texas Hill Country, proximity to Zilker Park, and access to Eanes ISD schools, it’s no surprise that home prices here have reached elite levels.
Values exploded in 2021 and 2022 during the height of Austin’s housing frenzy. Though some correction followed, the town remains in high demand, especially among buyers seeking privacy and proximity to Austin’s tech and business hubs.
5. Rollingwood – 241% Home Price Increase Since 2010

- 2010: $659,446
- 2011: $600,673 (-$58,773, -8.91% from previous year)
- 2012: $686,628 (+$85,955, +14.31% from previous year)
- 2013: $816,280 (+$129,652, +18.88% from previous year)
- 2014: $893,680 (+$77,400, +9.48% from previous year)
- 2015: $985,559 (+$91,879, +10.28% from previous year)
- 2016: $1,060,223 (+$74,664, +7.58% from previous year)
- 2017: $1,071,897 (+$11,674, +1.10% from previous year)
- 2018: $1,147,473 (+$75,576, +7.05% from previous year)
- 2019: $1,194,506 (+$47,033, +4.10% from previous year)
- 2020: $1,338,099 (+$143,593, +12.02% from previous year)
- 2021: $1,812,070 (+$473,971, +35.42% from previous year)
- 2022: $2,631,070 (+$819,001, +45.20% from previous year)
- 2023: $2,464,689 (-$166,381, -6.32% from previous year)
- 2024: $2,425,416 (-$39,273, -1.59% from previous year)
- 2025: $2,247,920 (-$177,496, -7.32% from previous year)
Rollingwood’s home values have surged 241% since 2010, reaching a high of $2.6 million in 2022. Despite a drop in prices over the last few years, the long-term trajectory places Rollingwood near the top of Texas’ luxury real estate market.
Rollingwood – High-End Living in the Heart of Austin

Rollingwood sits just west of downtown Austin, offering a rare blend of exclusivity and central location. This small, independent city is known for its peaceful streets, green spaces, and direct access to Zilker Park and Lady Bird Lake.
The area experienced explosive growth during the pandemic, as affluent buyers flocked to its limited housing stock. With zoning laws that favor single-family homes and large lots, new development is tightly controlled, keeping inventory scarce and prices sky-high. Even with recent corrections, values remain among the highest in Texas.
4. University Park – 158% Home Price Increase Since 2010

- 2010: $902,205
- 2011: $852,306 (-$49,899, -5.53% from previous year)
- 2012: $862,389 (+$10,083, +1.18% from previous year)
- 2013: $956,711 (+$94,322, +10.94% from previous year)
- 2014: $1,058,979 (+$102,268, +10.69% from previous year)
- 2015: $1,158,260 (+$99,281, +9.38% from previous year)
- 2016: $1,230,337 (+$72,077, +6.22% from previous year)
- 2017: $1,250,669 (+$20,332, +1.65% from previous year)
- 2018: $1,268,797 (+$18,127, +1.45% from previous year)
- 2019: $1,295,845 (+$27,049, +2.13% from previous year)
- 2020: $1,298,285 (+$2,439, +0.19% from previous year)
- 2021: $1,485,251 (+$186,967, +14.40% from previous year)
- 2022: $1,933,104 (+$447,853, +30.15% from previous year)
- 2023: $1,980,850 (+$47,745, +2.47% from previous year)
- 2024: $2,222,968 (+$242,118, +12.22% from previous year)
- 2025: $2,331,853 (+$108,885, +4.90% from previous year)
Since 2010, University Park home values have jumped 158%, rising from just over $900K to more than $2.3 million. After moderate growth in the 2010s, values spiked from 2021 through 2024 and continue to climb into 2025.
University Park – Prestige and Stability in North Dallas

Located just north of downtown Dallas and home to Southern Methodist University, University Park is one of the wealthiest and most prestigious neighborhoods in Texas. Its tree-lined streets, historic architecture, and top-tier public schools have long drawn affluent residents.
Strong local amenities and a reputation for stability helped fuel price appreciation during and after the pandemic. With limited housing supply and high demand, the area continues to attract buyers even as broader market conditions cool elsewhere.
3. Westover Hills – 146% Home Price Increase Since 2010

- 2010: $1,038,493
- 2011: $1,091,006 (+$52,514, +5.06% from previous year)
- 2012: $1,231,289 (+$140,283, +12.86% from previous year)
- 2013: $1,380,752 (+$149,463, +12.14% from previous year)
- 2014: $1,398,573 (+$17,821, +1.29% from previous year)
- 2015: $1,448,537 (+$49,964, +3.57% from previous year)
- 2016: $1,413,591 (-$34,946, -2.41% from previous year)
- 2017: $1,495,160 (+$81,569, +5.77% from previous year)
- 2018: $1,514,033 (+$18,874, +1.26% from previous year)
- 2019: $1,505,919 (-$8,114, -0.54% from previous year)
- 2020: $1,448,431 (-$57,488, -3.82% from previous year)
- 2021: $1,725,865 (+$277,434, +19.15% from previous year)
- 2022: $2,105,836 (+$379,972, +22.02% from previous year)
- 2023: $2,003,771 (-$102,065, -4.85% from previous year)
- 2024: $2,362,678 (+$358,907, +17.91% from previous year)
- 2025: $2,551,769 (+$189,092, +8.00% from previous year)
Westover Hills has seen a 146% increase in home prices since 2010, pushing values from just over $1 million to more than $2.5 million. Notably, prices surged during 2021–2022 and rebounded quickly after a brief dip in 2023.
Westover Hills – Fort Worth’s Crown Jewel

Westover Hills is a small, exclusive enclave adjacent to Fort Worth’s Cultural District. It’s known for stately mansions, expansive lots, and a private, secluded atmosphere. The town has one of the highest per capita incomes in Texas and a very low housing turnover rate.
Thanks to its elite status and tight inventory, Westover Hills real estate is resilient even during economic uncertainty. Its values skyrocketed with pandemic demand and show no sign of reversing, firmly placing it among the priciest ZIP codes in the state.
2. Highland Park – 172% Home Price Increase Since 2010

- 2010: $1,026,859
- 2011: $981,505 (-$45,355, -4.42% from previous year)
- 2012: $992,225 (+$10,721, +1.09% from previous year)
- 2013: $1,105,448 (+$113,223, +11.41% from previous year)
- 2014: $1,226,716 (+$121,268, +10.97% from previous year)
- 2015: $1,345,607 (+$118,891, +9.69% from previous year)
- 2016: $1,441,049 (+$95,442, +7.09% from previous year)
- 2017: $1,430,607 (-$10,442, -0.72% from previous year)
- 2018: $1,454,367 (+$23,760, +1.66% from previous year)
- 2019: $1,470,973 (+$16,606, +1.14% from previous year)
- 2020: $1,458,284 (-$12,689, -0.86% from previous year)
- 2021: $1,673,463 (+$215,179, +14.76% from previous year)
- 2022: $2,215,918 (+$542,455, +32.42% from previous year)
- 2023: $2,326,516 (+$110,598, +4.99% from previous year)
- 2024: $2,665,210 (+$338,695, +14.56% from previous year)
- 2025: $2,792,688 (+$127,478, +4.78% from previous year)
Home prices in Highland Park have jumped 172% since 2010, with values nearing $2.8 million in 2025. Consistent gains, especially in the early 2020s, have cemented this community’s elite market status.
Highland Park – Iconic Dallas Luxury

🔥 Would you like to save this?
One of the most prestigious neighborhoods in Dallas, Highland Park features tree-lined boulevards, upscale shopping at Highland Park Village, and some of the finest public schools in Texas. It’s also home to some of the most expensive residential real estate in the state.
With classic architecture, a historic setting, and strict zoning, Highland Park has always commanded premium prices. Strong appreciation in the last five years has pushed values to new highs, making it one of the top real estate markets in Texas in 2025.
1. Westlake – 137% Home Price Increase Since 2010

- 2010: $1,287,422
- 2011: $1,228,926 (-$58,495, -4.54% from previous year)
- 2012: $1,225,612 (-$3,315, -0.27% from previous year)
- 2013: $1,300,232 (+$74,620, +6.09% from previous year)
- 2014: $1,361,440 (+$61,209, +4.71% from previous year)
- 2015: $1,509,122 (+$147,682, +10.85% from previous year)
- 2016: $1,540,341 (+$31,219, +2.07% from previous year)
- 2017: $1,528,555 (-$11,787, -0.77% from previous year)
- 2018: $1,545,343 (+$16,788, +1.10% from previous year)
- 2019: $1,589,299 (+$43,956, +2.84% from previous year)
- 2020: $1,649,745 (+$60,447, +3.80% from previous year)
- 2021: $1,965,481 (+$315,736, +19.14% from previous year)
- 2022: $2,678,829 (+$713,348, +36.29% from previous year)
- 2023: $2,572,787 (-$106,042, -3.96% from previous year)
- 2024: $2,856,115 (+$283,329, +11.01% from previous year)
- 2025: $3,044,287 (+$188,171, +6.59% from previous year)
Westlake’s home values have increased 137% since 2010, with prices surpassing $3 million in 2025. The town saw its biggest jump in 2022, with a 36% rise in a single year, and has remained among the most elite markets in the state.
Westlake – Texas’ Pinnacle of Luxury Real Estate

Westlake, straddling Tarrant and Denton counties, is home to sprawling estates, championship golf courses, and prestigious private schools like Westlake Academy. Its reputation for exclusivity and refined living has attracted high-net-worth individuals from across the country.
Limited inventory, strict architectural guidelines, and growing demand have fueled Westlake’s meteoric price growth. With its blend of privacy and proximity to DFW business centers, Westlake tops Texas’ most expensive towns in 2025.


