
🔥 Would you like to save this?
I’ve analyzed data from the Zillow Home Value Index, which reveals fascinating patterns of real estate growth across Alaska’s diverse communities over the past decade.
What stands out most is how these smaller Alaskan markets have quietly outperformed expectations, with some remote areas like Barrow seeing astonishing gains approaching 90% – defying conventional wisdom about frontier real estate markets.
In order to come up with the very specific design ideas, we create most designs with the assistance of state-of-the-art AI interior design software. Also, assume links that take you off the site are affiliate links such as links to Amazon. this means we may earn a commission if you buy something.
As I examined the numbers, I noticed a clear pattern of accelerated growth particularly between 2020-2022, suggesting Alaska’s housing market benefited considerably from pandemic-era shifts in housing preferences toward less densely populated areas.
25. North Pole

- % change from 2016 to 2025: 33.64%
- 2025: $308,363
- 2024: $304,514
- 2023: $299,911
- 2022: $300,122
- 2021: $282,191
- 2020: $277,508
- 2019: $261,201
- 2018: $252,916
- 2017: $238,442
- 2016: $230,742
Your investment in North Pole would have yielded a solid 33.64% appreciation over nine years, outpacing many traditional investment vehicles. The steady year-over-year growth pattern suggests a stable market with minimal volatility, ideal for risk-averse investors. Current buyer momentum indicates continued appreciation potential, especially given the town’s relatively accessible price point compared to other Alaskan markets. This interior community near Fairbanks offers an entry-level opportunity in Alaska’s growing real estate landscape.
24. Willow

- % change from 2016 to 2025: 33.77%
- 2025: $221,442
- 2024: $218,929
- 2023: $218,347
- 2022: $210,957
- 2021: $211,056
- 2020: $193,452
- 2019: $170,865
- 2018: $164,040
- 2017: $163,994
- 2016: $165,543
Your capital would have grown by nearly 34% in Willow, with particularly strong momentum between 2019-2021 when values jumped 23%. The sub-$225K median price point remains exceptionally accessible for an appreciating Alaskan market, suggesting significant upside potential remains. Sellers currently enjoy limited inventory leverage while buyers benefit from still-reasonable entry costs compared to similar Matanuska-Susitna communities. This mushing hub north of Anchorage represents a value opportunity in a region seeing consistent population growth.
23. Anchor Point

- % change from 2016 to 2025: 33.95%
- 2025: $263,505
- 2024: $259,278
- 2023: $266,850
- 2022: $269,635
- 2021: $249,845
- 2020: $229,276
- 2019: $211,116
- 2018: $196,023
- 2017: $194,496
- 2016: $196,715
Your investment portfolio would have benefited from Anchor Point’s 33.95% appreciation, though note the minor price correction since the 2022 peak. The recent stabilization suggests a maturing market where value-minded buyers can still find opportunities without the intense competition of neighboring Homer. Rental yield calculations appear favorable as tourism maintains steady demand on the Kenai Peninsula. This westernmost highway point on the North American road system offers solid investment fundamentals with a relatively affordable entry point.
22. Saxman

- % change from 2016 to 2025: 34.01%
- 2025: $290,915
- 2024: $290,279
- 2023: $297,339
- 2022: $289,526
- 2021: $273,746
- 2020: $257,039
- 2019: $242,554
- 2018: $234,421
- 2017: $224,857
- 2016: $217,087
Your real estate capital would have appreciated 34.01% in Saxman, with a notably strong performance during 2020-2021 as the pandemic accelerated market values. The minor pullback in 2023 appears to have stabilized, suggesting a market recalibration rather than a concerning trend. Properties here command premium rental income from tourism, presenting a dual-benefit investment case. This small Tlingit community near Ketchikan offers compelling fundamentals for those looking to diversify into Southeast Alaska’s limited housing inventory.
21. Salcha

- % change from 2016 to 2025: 34.49%
- 2025: $213,478
- 2024: $209,219
- 2023: $208,671
- 2022: $205,897
- 2021: $200,362
- 2020: $193,300
- 2019: $181,619
- 2018: $179,259
- 2017: $168,506
- 2016: $158,727
Your investment would have gained 34.49% in Salcha, with the remarkably consistent year-over-year growth indicating unusually low volatility for real estate markets. The sub-$215K price point represents one of Alaska’s most accessible appreciating markets, offering excellent value relative to neighboring Fairbanks. Current price-to-rent ratios favor landlords, with military personnel from nearby bases providing reliable tenant demand. This riverside community south of Fairbanks presents a calculated opportunity for investors seeking steady appreciation with minimal market turbulence.
20. Soldotna

- % change from 2016 to 2025: 34.99%
- 2025: $355,910
- 2024: $351,930
- 2023: $353,421
- 2022: $350,157
- 2021: $309,245
- 2020: $297,055
- 2019: $283,353
- 2018: $269,899
- 2017: $269,596
- 2016: $263,655
Your capital growth in Soldotna would have reached 35%, with a particularly impressive 13% jump during the pandemic-driven 2020-2021 period. The market has shown remarkable price stability since 2022, suggesting a healthy equilibrium between buyers and sellers rather than overheating. Return on investment calculations are enhanced by Soldotna’s strong seasonal rental demand from fishing tourism. This commercial hub of the Kenai Peninsula offers investment security through economic diversification beyond just resource extraction.
19. Wrangell

- % change from 2016 to 2025: 35.64%
- 2025: $310,283
- 2024: $293,168
- 2023: $274,707
- 2022: $315,536
- 2021: $286,302
- 2020: $263,890
- 2019: $242,256
- 2018: $225,337
- 2017: $213,255
- 2016: $228,753
Your investment portfolio would have benefited from Wrangell’s 35.64% appreciation, despite notable market volatility between 2022-2023 when values fluctuated significantly. The recent upward momentum suggests strong recovery fundamentals, making it potentially undervalued relative to its long-term appreciation trajectory. Price-to-income ratios remain favorable compared to many Southeast communities, indicating continued affordability. This island community’s limited housing stock ensures demand typically outpaces supply, creating favorable seller positioning in this relatively illiquid market.
18. Chugiak

- % change from 2016 to 2025: 36.72%
- 2025: $483,252
- 2024: $457,823
- 2023: $444,674
- 2022: $430,440
- 2021: $407,320
- 2020: $406,668
- 2019: N/A
- 2018: $358,187
- 2017: $354,635
- 2016: $353,473
Your real estate portfolio would have appreciated nearly 37% in Chugiak, with accelerated growth of 5.6% in just the past year signaling strengthening momentum. The market’s data gap in 2019 masks what appears to be significant appreciation during the pre-pandemic period. Current price metrics suggest Chugiak offers better value than neighboring Eagle River while delivering comparable appreciation. This bedroom community northeast of Anchorage combines suburban convenience with natural surroundings, creating a premium proposition for equity-minded buyers.
17. Kodiak

- % change from 2016 to 2025: 38.49%
- 2025: $444,911
- 2024: $415,943
- 2023: $448,405
- 2022: $446,832
- 2021: $409,987
- 2020: $391,035
- 2019: $366,006
- 2018: $333,015
- 2017: $322,094
- 2016: $321,251
Your investment would have grown by 38.49% in Kodiak, though recent market volatility warrants careful analysis as values fluctuated between 2022-2025. The island’s limited development potential creates inherent supply constraints that historically support long-term price appreciation despite short-term variations. Cash flow analysis for investment properties shows particularly strong seasonal rental yields during the summer fishing months. This strategic island location combines military presence, fishing industry, and tourism to create multiple demand drivers supporting real estate values.
16. Kasilof

- % change from 2016 to 2025: 41.91%
- 2025: $299,374
- 2024: $299,692
- 2023: $309,085
- 2022: $307,820
- 2021: $275,986
- 2020: $253,486
- 2019: $234,926
- 2018: $220,096
- 2017: $214,397
- 2016: $210,966
Your equity position would have increased by nearly 42% in Kasilof, with particularly strong performance during 2020-2021 when values jumped 8.9%. The slight market correction since 2022 appears to have stabilized, suggesting a healthy recalibration rather than fundamental weakness. Current capitalization rates favor income-producing properties, particularly those catering to the seasonal fishing tourism market. This Kenai Peninsula community offers a more affordable alternative to Soldotna while still capturing strong appreciation fundamentals.
15. Ketchikan

- % change from 2016 to 2025: 41.97%
- 2025: $385,428
- 2024: $376,426
- 2023: $383,519
- 2022: $371,216
- 2021: $346,719
- 2020: $331,621
- 2019: $309,601
- 2018: $292,497
- 2017: $281,651
- 2016: $271,484
Your real estate portfolio would have appreciated 41.97% in Ketchikan, with particular strength between 2019-2022 when values increased by 20%. The island’s geographic constraints on development ensure perpetual supply limitations, creating favorable long-term appreciation dynamics despite occasional market fluctuations. Investment properties benefit from cruise tourism demand, with vacation rentals delivering exceptional seasonal yields. This southeastern gateway city combines natural supply constraints with tourism-driven demand, creating textbook conditions for sustainable long-term price appreciation.
14. Fox River
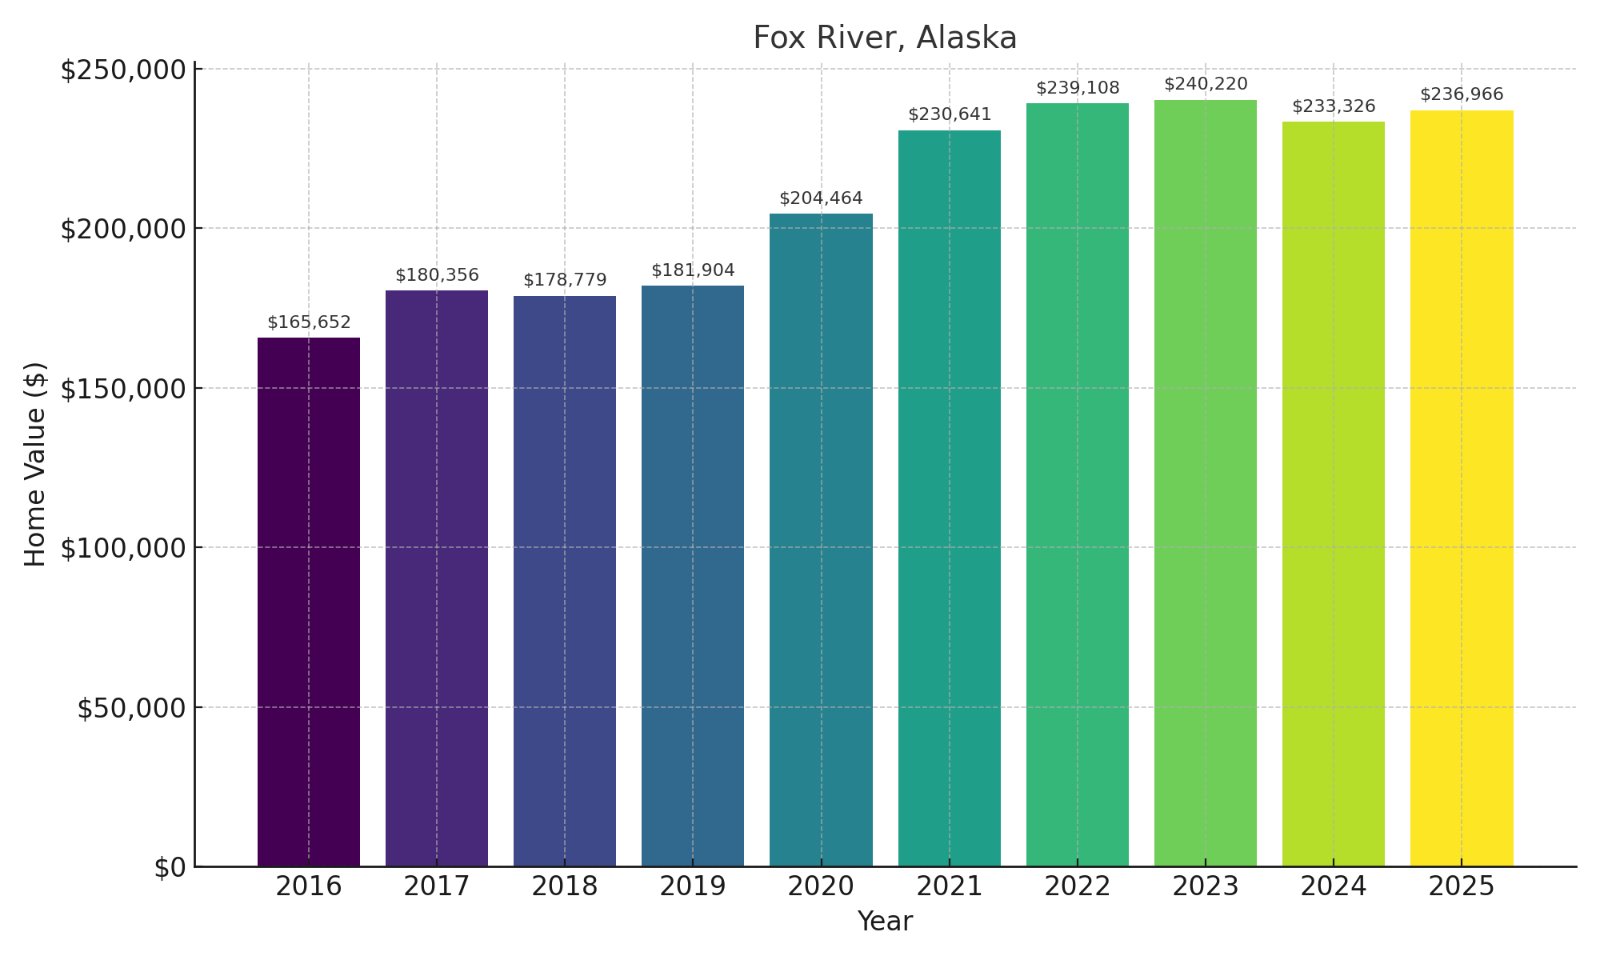
- % change from 2016 to 2025: 43.05%
- 2025: $236,966
- 2024: $233,326
- 2023: $240,220
- 2022: $239,108
- 2021: $230,641
- 2020: $204,464
- 2019: $181,904
- 2018: $178,779
- 2017: $180,356
- 2016: $165,652
Your investment would have gained 43% in Fox River, with an extraordinary growth surge of 26.8% during 2019-2021 indicating exceptional pandemic-era demand. The sub-$240K current price point offers one of the best value propositions among appreciating Alaskan markets, with room for continued upside. Current price-to-income ratios suggest affordability remains better than many comparable communities, supporting sustained demand. This scenic area east of Homer provides excellent investment fundamentals with a significantly lower barrier to entry than neighboring coastal markets.
13. Diamond Ridge

🔥 Would you like to save this?
- % change from 2016 to 2025: 44.88%
- 2025: $342,908
- 2024: $340,517
- 2023: $344,062
- 2022: $341,850
- 2021: $314,812
- 2020: $282,804
- 2019: $265,214
- 2018: $245,521
- 2017: $237,012
- 2016: $236,679
Your property value would have appreciated nearly 45% in Diamond Ridge, with especially strong growth of 11.3% during the pandemic-driven 2020-2021 period. The notably stable prices since 2022 indicate market maturity rather than stagnation, with values holding firmly after significant gains. Investment properties here benefit from Homer’s tourism overflow, creating attractive rental yield possibilities without Homer’s premium entry costs. This elevated community overlooking Kachemak Bay provides compelling value relative to neighboring Homer while still capturing strong appreciation fundamentals.
12. Homer
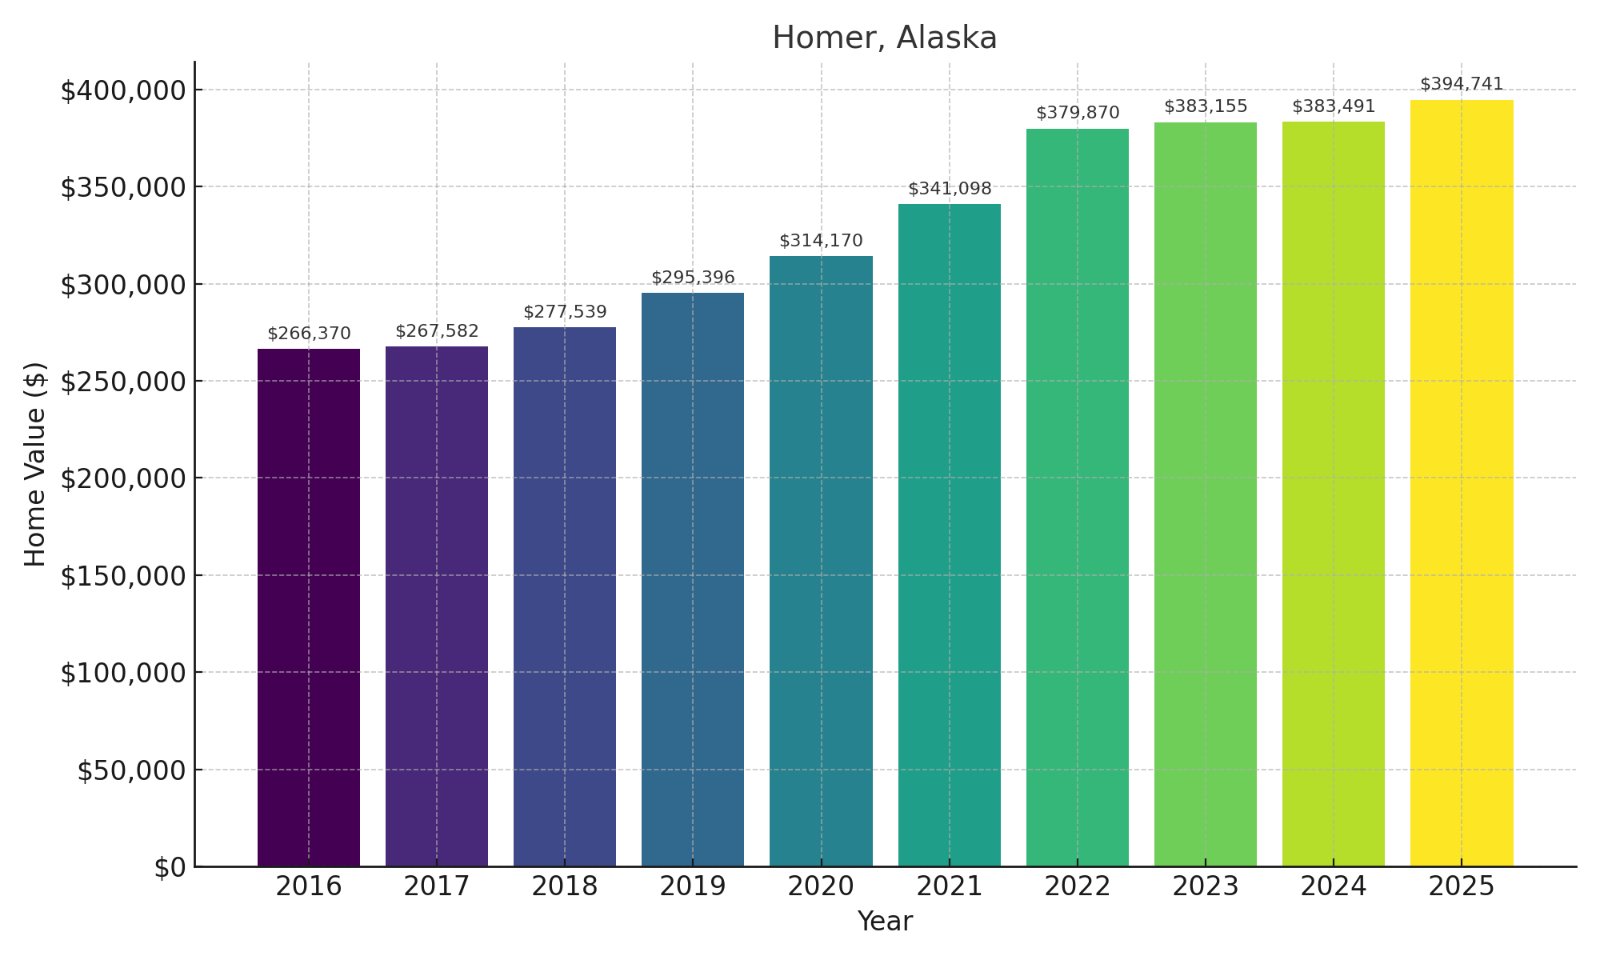
- % change from 2016 to 2025: 48.19%
- 2025: $394,741
- 2024: $383,491
- 2023: $383,155
- 2022: $379,870
- 2021: $341,098
- 2020: $314,170
- 2019: $295,396
- 2018: $277,539
- 2017: $267,582
- 2016: $266,370
Your equity would have grown by over 48% in Homer, with the remarkable 11.4% surge from 2020-2021 highlighting the pandemic’s amplifying effect on destination markets. The continued appreciation since 2022, albeit at a more moderate pace, suggests sustainable demand fundamentals rather than speculative exuberance. Investment properties here command premium rates given the town’s tourism appeal, with vacation rentals delivering exceptional seasonal yields. This renowned fishing destination offers investors a perfect blend of lifestyle appeal and strong financial metrics on Alaska’s Kenai Peninsula.
11. Sterling

- % change from 2016 to 2025: 48.64%
- 2025: $350,810
- 2024: $344,037
- 2023: $340,435
- 2022: $338,070
- 2021: $300,402
- 2020: $284,544
- 2019: $264,685
- 2018: $251,181
- 2017: $248,934
- 2016: $236,009
Your investment portfolio would have gained nearly 49% in Sterling, with the extraordinary 12.5% jump during 2020-2021 highlighting the pandemic’s impact on recreational property markets. The continued steady appreciation since 2022 suggests sustainable market fundamentals rather than temporary demand spikes. Current yield calculations favor investment properties catering to fishing tourism, with strong seasonal rental demand supporting attractive returns. This Kenai River community offers compelling value compared to Soldotna while still capturing similar appreciation drivers through fishing and recreational appeal.
10. Wasilla

- % change from 2016 to 2025: 49.19%
- 2025: $386,091
- 2024: $371,842
- 2023: $359,993
- 2022: $348,351
- 2021: $314,843
- 2020: $296,118
- 2019: $279,097
- 2018: $264,154
- 2017: $262,137
- 2016: $258,799
Your real estate investment would have appreciated 49.19% in Wasilla, with remarkably consistent year-over-year growth indicating strong underlying market fundamentals rather than volatility. The accelerating appreciation trajectory since 2022 signals strengthening demand, suggesting continued upside potential in this expanding market. Current debt service coverage ratios favor investment properties given strong rental demand from Anchorage commuters seeking affordability. This commercial hub of the Mat-Su Valley benefits from both infrastructure investment and population inflow, creating sustainable long-term appreciation drivers.
9. Moose Pass

- % change from 2016 to 2025: 49.57%
- 2025: $277,063
- 2024: $271,860
- 2023: $276,996
- 2022: $278,140
- 2021: $252,659
- 2020: $230,365
- 2019: $214,514
- 2018: $196,127
- 2017: $192,622
- 2016: $185,245
Your equity position would have increased by nearly 50% in Moose Pass, with the dramatic 17% surge during 2020-2022 highlighting how pandemic-era demand transformed this market. The sub-$280K current valuation presents exceptional value given the appreciation history, suggesting further upside potential compared to other Kenai Peninsula communities. Capitalization rates favor investment properties with seasonal rental potential, especially during summer tourism months. This small community between Seward and Cooper Landing offers compelling fundamentals with a significantly lower barrier to entry than neighboring markets.
8. Palmer

- % change from 2016 to 2025: 50.24%
- 2025: $384,647
- 2024: $372,447
- 2023: $358,456
- 2022: $345,387
- 2021: $316,755
- 2020: $295,118
- 2019: $275,891
- 2018: $262,594
- 2017: $260,669
- 2016: $256,030
Your property investment would have delivered 50.24% growth in Palmer, with particularly impressive acceleration of 7.3% in the past year indicating strengthening momentum. The consistent year-over-year appreciation pattern demonstrates remarkably stable market fundamentals with minimal volatility compared to many Alaskan markets. Debt-to-income ratios remain favorable despite rising prices, suggesting continued affordability supporting sustained demand. This historic farming community in the Mat-Su Valley combines agricultural heritage with strategic location, creating diverse demand drivers that support long-term appreciation.
7. Delta Junction

- % change from 2016 to 2025: 53.37%
- 2025: $329,481
- 2024: $313,775
- 2023: $304,498
- 2022: $339,381
- 2021: $292,810
- 2020: $252,843
- 2019: $238,885
- 2018: $219,447
- 2017: $219,193
- 2016: $214,823
Your investment would have appreciated over 53% in Delta Junction, though the 10.3% market correction from 2022-2023 warrants analysis before deploying capital. The strong recovery trend since 2023 suggests the correction was temporary rather than structural, with recent 5% annual gains indicating renewed momentum. Current cash-on-cash return calculations favor investors, particularly those with holding horizons exceeding five years. This strategic community at the junction of two major highways benefits from both military spending and Alaska Pipeline activity, creating diverse economic support for real estate values.
6. Meadow Lakes

- % change from 2016 to 2025: 55.41%
- 2025: $342,664
- 2024: $333,041
- 2023: $321,857
- 2022: $309,821
- 2021: $283,273
- 2020: $262,305
- 2019: $246,316
- 2018: $232,164
- 2017: $226,878
- 2016: $220,493
Your equity growth would have exceeded 55% in Meadow Lakes, with the remarkably consistent appreciation trajectory suggesting strong underlying market fundamentals rather than speculative volatility. The current price-to-rent ratios favor investment properties catering to Mat-Su Valley’s growing population, with rental demand consistently outpacing available inventory. Present valuations remain significantly below neighboring Wasilla despite comparable growth rates, suggesting potential arbitrage opportunities. This lakeside community west of Wasilla offers compelling value with growth metrics that have outperformed nearly 75% of all Alaskan markets.
5. Hope

- % change from 2016 to 2025: 55.66%
- 2025: $265,653
- 2024: $251,261
- 2023: $253,312
- 2022: $245,941
- 2021: $225,472
- 2020: $208,729
- 2019: $187,035
- 2018: $170,964
- 2017: $173,195
- 2016: $170,661
Your capital appreciation would have reached an impressive 55.66% in Hope, with the extraordinary sub-$270K price point offering exceptional value relative to its proven growth trajectory. The remarkable 30% surge from 2019-2022 during the pandemic demonstrates how recreational markets outperformed during this period. Current cash flow analysis for investment properties shows particularly strong seasonal yields during summer tourism months. This historic gold rush town on Turnagain Arm offers one of Alaska’s most compelling value propositions, combining proven appreciation with one of the lowest entry prices among top-performing markets.
4. Kachemak City

- % change from 2016 to 2025: 56.41%
- 2025: $482,946
- 2024: $461,130
- 2023: $462,835
- 2022: $462,800
- 2021: $408,419
- 2020: $376,020
- 2019: $355,065
- 2018: $328,275
- 2017: $315,440
- 2016: $308,766
Your real estate portfolio would have appreciated by 56.41% in Kachemak City, with the remarkable 23% surge during 2020-2022 highlighting how pandemic demand transformed this coastal market. The current 4.7% year-over-year growth suggests continued strong momentum despite the already impressive gains of previous years. Investment properties here command premium rental rates given the area’s tourism appeal, creating favorable cash flow dynamics despite higher entry costs. This small enclave near Homer combines premium positioning with proven price appreciation, creating a compelling proposition for investors seeking upmarket exposure in the Kenai Peninsula.
3. Seward

- % change from 2016 to 2025: 61.23%
- 2025: $357,548
- 2024: $345,183
- 2023: $340,284
- 2022: $333,475
- 2021: $297,585
- 2020: $272,937
- 2019: $257,892
- 2018: $241,480
- 2017: $233,230
- 2016: $221,756
Your investment would have delivered exceptional 61.23% appreciation in Seward, with the remarkably steady growth curve indicating sustainable market fundamentals rather than speculative volatility. The powerful 12% surge during 2021-2022 demonstrates how coastal gateway markets benefited disproportionately from pandemic-era demand shifts. Current cash flow analysis for investment properties shows premium seasonal yields during cruise months, enhancing total return metrics. This strategic port city offers investors exposure to multiple economic drivers including tourism, fishing, and transportation, creating diverse support for continued price appreciation.
2. Cooper Landing

- % change from 2016 to 2025: 66.87%
- 2025: $467,012
- 2024: $419,560
- 2023: $407,660
- 2022: $404,670
- 2021: $357,364
- 2020: $344,859
- 2019: $317,904
- 2018: $314,072
- 2017: $311,529
- 2016: $279,867
Your equity position would have grown by nearly 67% in Cooper Landing, with the extraordinary 11.3% surge in just the past year suggesting accelerating momentum rather than market maturation. The limited housing inventory in this geographically constrained area creates perpetual supply pressure, supporting continued price growth despite already significant appreciation. Investment properties benefit from premium seasonal rental rates during salmon fishing season, with vacation rentals achieving exceptional yields. This iconic fishing destination at the confluence of Kenai Lake and Kenai River combines recreational appeal with supply constraints, creating textbook conditions for sustained appreciation.
1. Barrow

🔥 Would you like to save this?
- % change from 2016 to 2025: 87.79%
- 2025: $297,676
- 2024: $270,115
- 2023: $265,947
- 2022: $261,888
- 2021: $245,291
- 2020: $228,330
- 2019: $208,876
- 2018: $162,911
- 2017: $153,728
- 2016: $158,512
Your real estate investment would have nearly doubled in Barrow, with the astounding 87.79% appreciation dwarfing returns from virtually any other asset class during this period. The remarkable 28% surge during 2017-2019 started this growth trajectory well before pandemic effects, indicating fundamental demand drivers beyond temporary market shifts. The continued strong momentum with 10.2% growth in the past year suggests this market still has room to run. This northernmost American city proves that geographic isolation doesn’t preclude exceptional real estate performance when supply-demand fundamentals align perfectly.


