🔥 Would you like to save this?
Counties with the shortest life expectancy in Ohio
Life expectancy can be affected by a variety of factors. About 25% of your lifespan is determined by genetics, according to the National Library of Medicine. Health and wellness habits—like following a balanced, nutrient-rich diet; not smoking; drinking minimal alcohol; maintaining a healthy weight; and staying physically active—can add more than a decade to your life, research from the National Institutes of Health shows. While these factors are significant, another important element that you might not have considered is your environment and community.
While life expectancy generally increases annually in the United States—jumping from about 70.8 years old to 77.5 between 1970 and 2022, according to the Centers for Disease Control and Prevention—this particular metric can vary from state to state or even county to county. In some parts of the country, the average lifespan is getting shorter based on a variety of risk factors on top of health, including socioeconomic factors like poverty, unemployment, income, and education.
According to a 2020 study from researchers at Penn State, West Virginia, and Michigan State Universities, communities with a higher population density, more fast food restaurants, and a high number of extraction industry-based jobs tend to have shorter life expectancies.
To find out how life expectancy varies within Ohio, Stacker used 2024 County Health Rankings & Roadmaps from the University of Wisconsin Population Health Institute to identify the counties with the shortest life expectancy. Life expectancy measures the average number of years from birth a person can expect to live and is calculated based on the number of deaths in a given time period and the average number of people at risk of dying during that period. Counties with unreliable or insufficient data were excluded from the analysis. Mortality data came from the National Vital Statistics System.
Read on to see if your county is on the list.
You may also like: How road conditions in Ohio have deteriorated since 2000
#42. Shelby County (tie)
– Life expectancy: 75.6 years
— Same as state average
In order to come up with the very specific design ideas, we create most designs with the assistance of state-of-the-art AI interior design software. Also, assume links that take you off the site are affiliate links such as links to Amazon. this means we may earn a commission if you buy something.
About
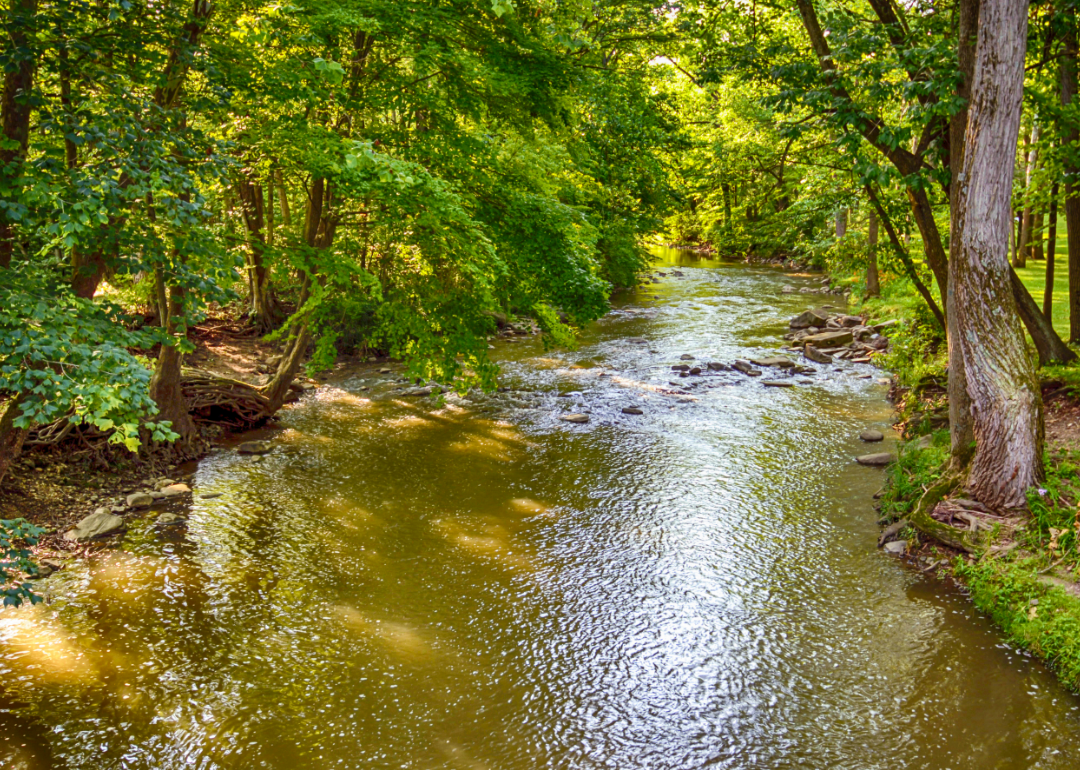
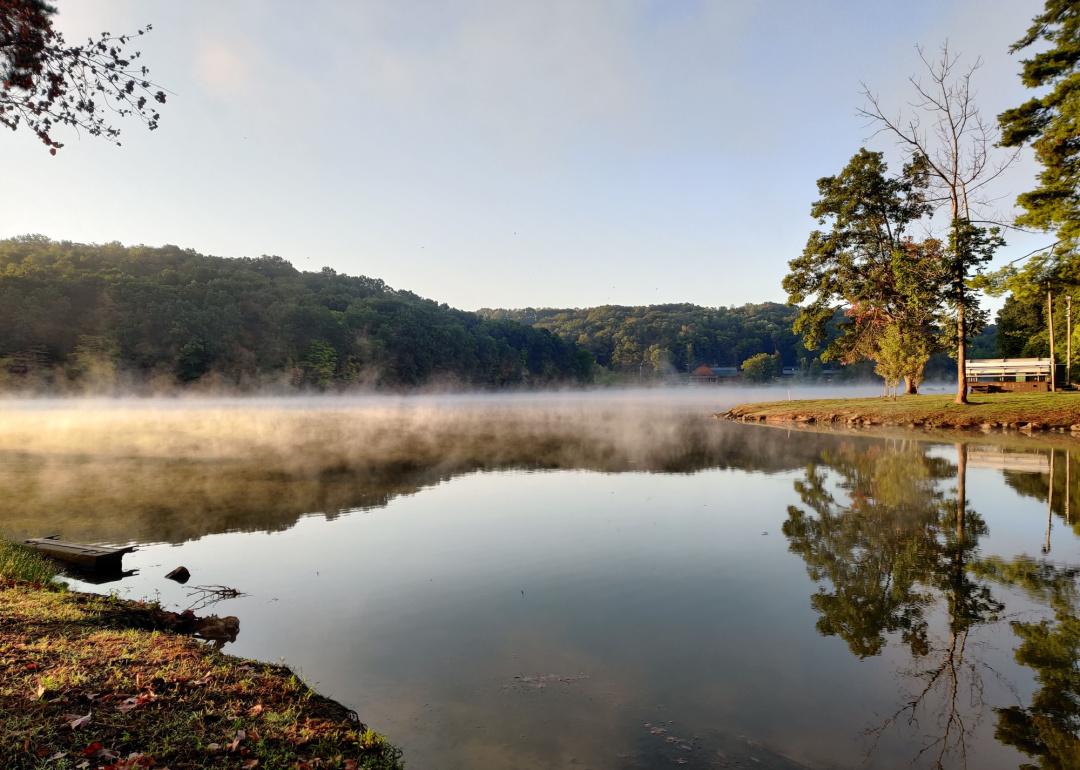
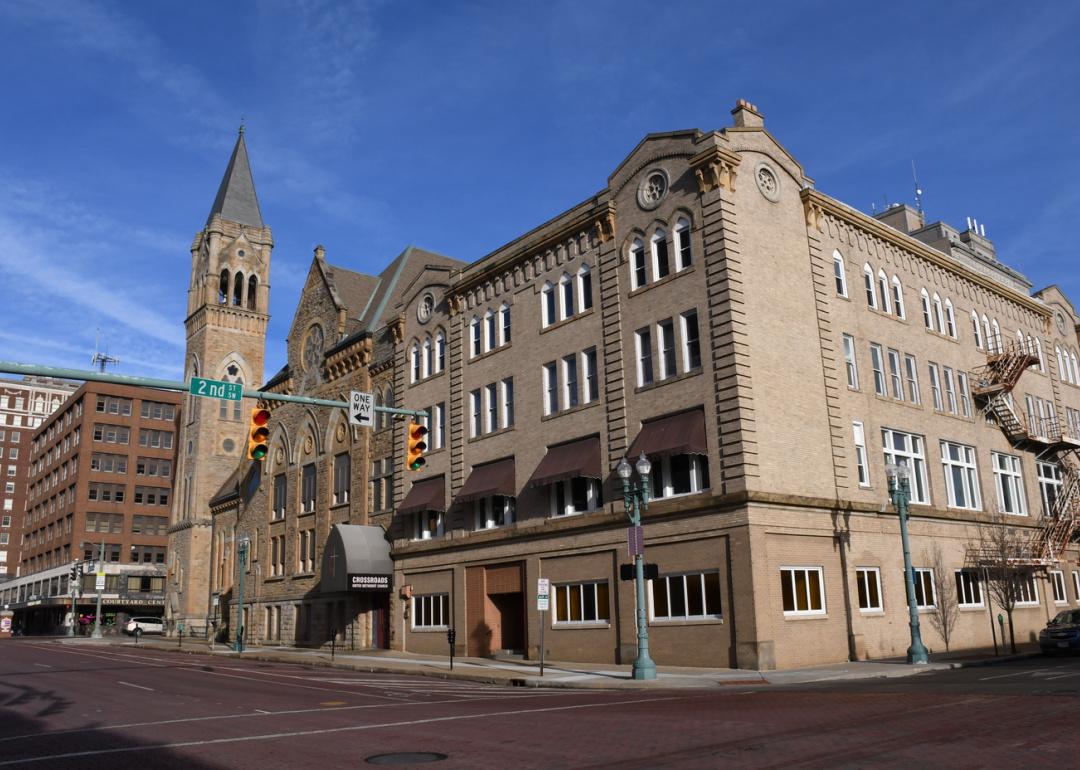
Shelby County is anchored by Sidney, where a strong manufacturing base blends with small-town living. The economy centers on automotive and machinery production, with healthcare and logistics adding stability. Surrounding towns like Anna, Botkins, and Fort Loramie contribute identity through schools, parks, and local traditions.
Sidney provides the county’s hub for hospitals, schools, and cultural life. Residents enjoy lakes, bike trails, and festivals that highlight both history and community spirit. With agriculture shaping the land and industry offering jobs, Shelby County combines steady opportunity with a close-knit way of life.
Where is Shelby County?
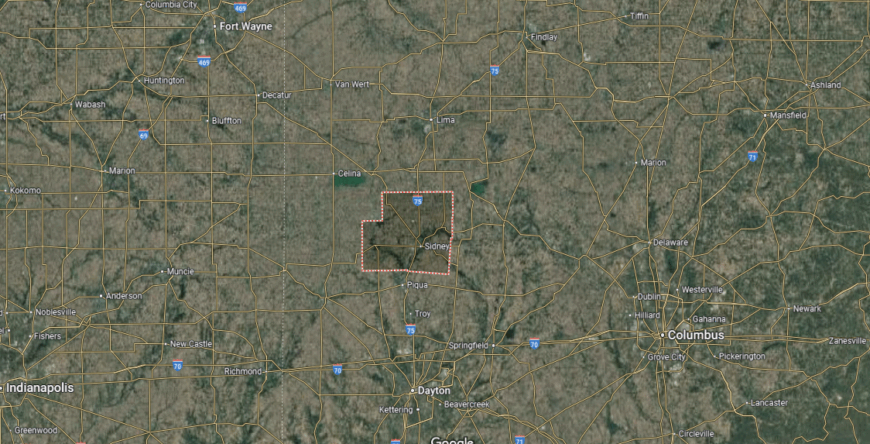
Shelby County sits in west-central Ohio, about halfway between Dayton and Lima. It’s roughly 40 miles north of Dayton and about 90 miles west of Columbus, placing it in a central corridor that still feels distinctly rural and close-knit.
Most travelers arrive via Interstate 75, which runs straight through the county and connects its communities with the larger cities of southern and northern Ohio. Beyond the interstate, the landscape opens into farm fields, small towns, and winding county roads that showcase its agricultural roots. It’s an area that balances easy access to regional hubs with the quiet rhythms of Midwestern life.
#42. Carroll County (tie)
– Life expectancy: 75.6 years
— Same as state average
About
Carroll County is defined by Carrollton, a small-town hub set among farmland, lakes, and wooded hills. The economy leans on agriculture, energy development, and local manufacturing, providing steady jobs across the region. Communities such as Malvern, Sherrodsville, and Dellroy add character through schools, events, and lake-centered activity.
Carrollton supports the county with healthcare, schools, and government services. Outdoor recreation thrives at Atwood and Leesville Lakes, where fishing, boating, and trails draw residents year-round. Combining natural beauty with reliable industries, Carroll County maintains a balance of work, tradition, and leisure.
Where is Carroll County?
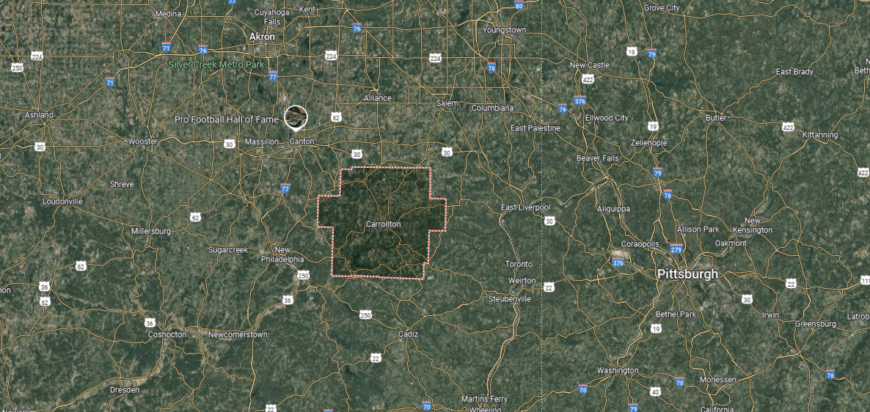
Carroll County is set in eastern Ohio, about 30 miles southeast of Canton and roughly 70 miles west of Pittsburgh. It sits at the edge of the Appalachian foothills, giving it a landscape of wooded valleys and gently rising hills.
U.S. Route 30 and State Routes 9 and 43 provide the main pathways in, linking the county to surrounding regions while keeping it slightly off the busiest travel corridors. Its position makes it close enough to Ohio’s industrial centers for convenience, yet firmly rooted in a more rural and scenic stretch of the state.
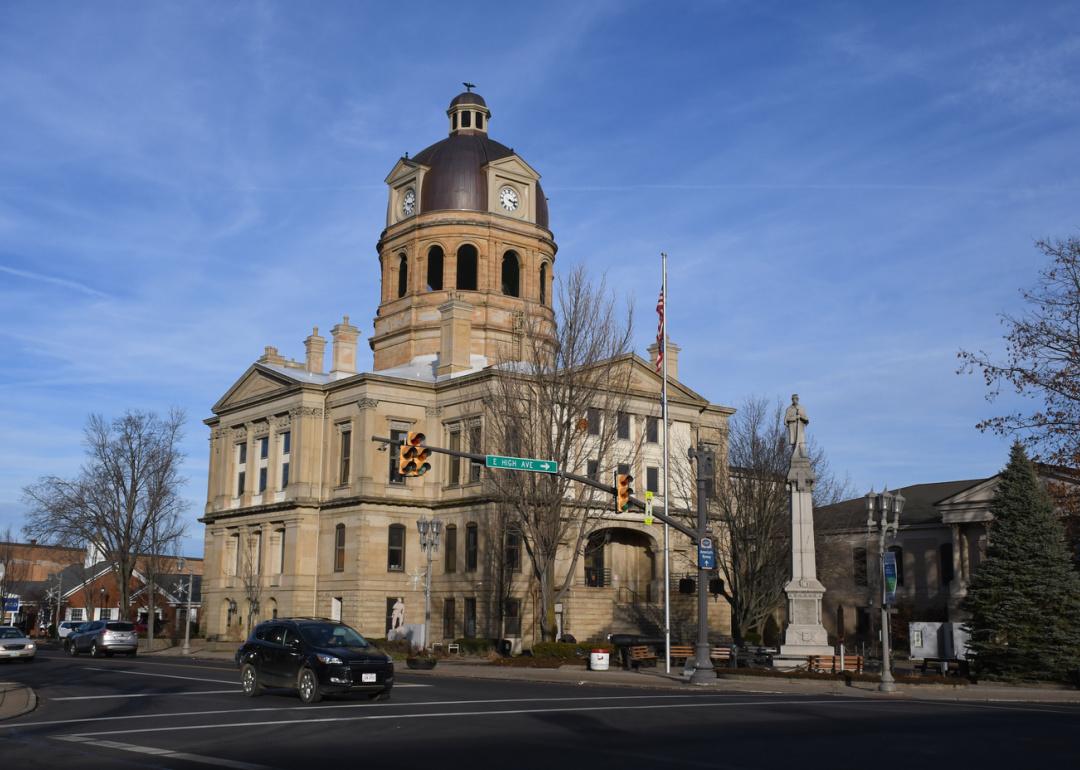
#41. Stark County
– Life expectancy: 75.4 years
— 0.2 years lower than the state average
About
Stark County revolves around Canton, a city known for its industrial heritage and the Pro Football Hall of Fame. Manufacturing remains a core of the economy, joined by strong sectors in healthcare, education, and retail. Towns like Massillon, Alliance, and North Canton each bring their own mix of neighborhoods, schools, and local culture.
Canton serves as the county’s center with universities, hospitals, and civic venues shaping daily life. Residents enjoy a wide network of parks, museums, and seasonal events that showcase both history and community spirit. With its blend of industry, services, and cultural institutions, Stark County stands as a regional anchor in northeast Ohio.
Where is Stark County?
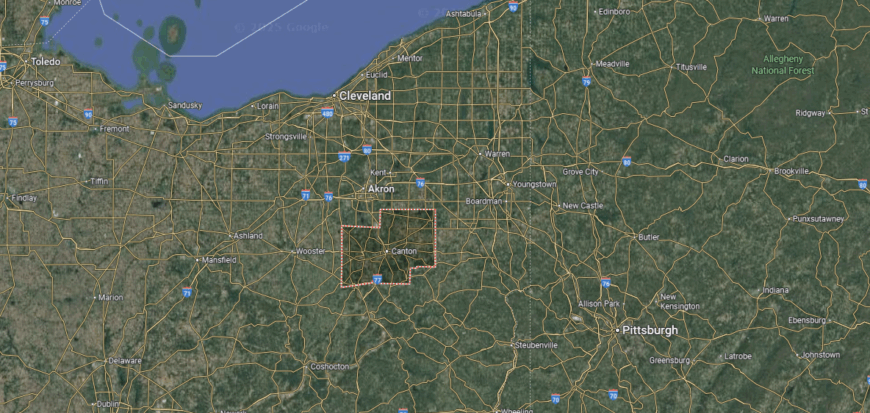
Stark County is located in northeast Ohio, anchored by the city of Canton and about 20 miles south of Akron. It lies roughly 50 miles south of Cleveland, placing it within reach of the state’s major urban centers while remaining surrounded by smaller towns and open countryside.
The county is crossed by Interstate 77 and U.S. Route 30, which make travel to and from the region straightforward. Its position along these routes ties it to Ohio’s larger cities, yet its neighborhoods, farmland edges, and historic downtowns give it a distinct regional identity.
#39. Tuscarawas County (tie)
– Life expectancy: 75.3 years
— 0.3 years lower than the state average
About
Tuscarawas County is anchored by New Philadelphia, a city that blends small-town living with historic roots. The local economy benefits from manufacturing, oil and gas, and a strong service sector, while agriculture continues to shape the landscape. Surrounding towns like Dover, Dennison, and Uhrichsville add depth with rail heritage, schools, and community traditions.
New Philadelphia serves as the county’s hub, offering healthcare, education, and civic life. Residents enjoy access to museums, riverfront trails, and events that highlight the county’s rich history. With industries creating opportunity and culture providing connection, Tuscarawas County balances progress with a strong sense of place.
Where is Tuscarawas County?
Tuscarawas County stretches across east-central Ohio, about 70 miles south of Cleveland and 25 miles south of Canton. It sits along the Tuscarawas River valley, a landscape shaped by rolling hills, farmland, and pockets of forest that signal the beginning of the Appalachian foothills.
Interstate 77 runs directly through the county, connecting it north to Akron and south toward Marietta. Smaller highways and rural roads weave through its towns and countryside, making it both accessible and firmly rooted in Ohio’s scenic heartland.
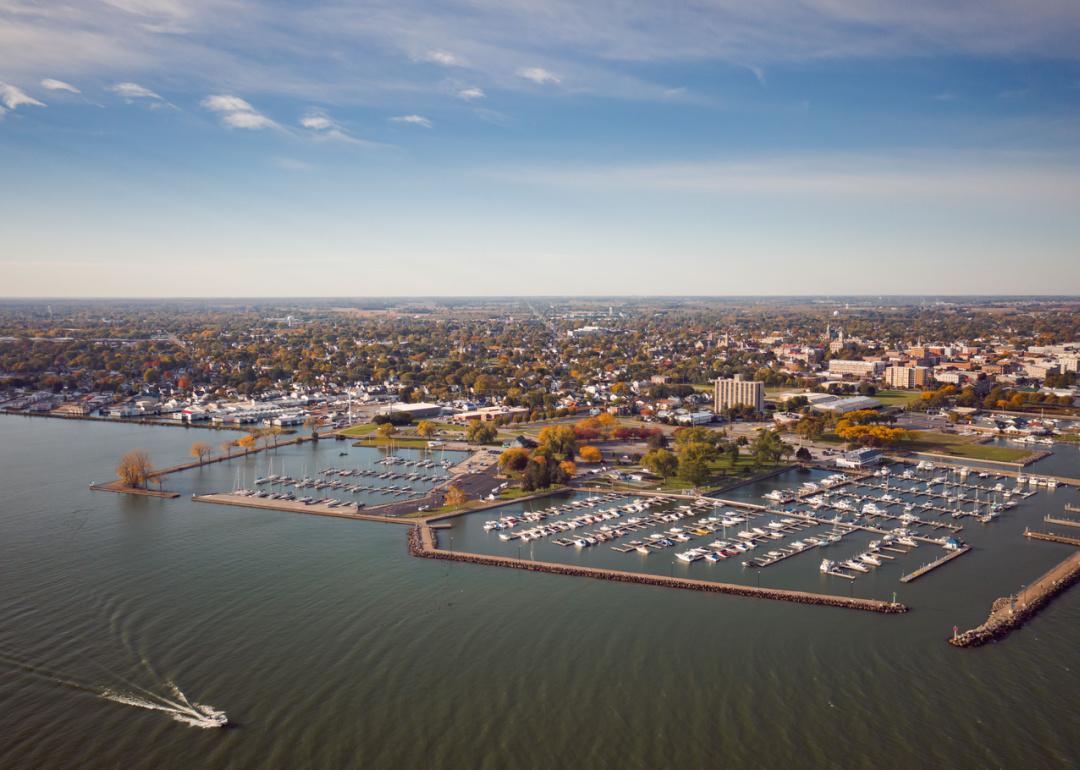
#39. Erie County (tie)
– Life expectancy: 75.3 years
— 0.3 years lower than the state average
You may also like: How drunk driving fatalities in Ohio compare to the rest of the US
About
Erie County is anchored by Sandusky, a city on Lake Erie’s shoreline that connects industry with tourism. The economy thrives on manufacturing and healthcare, but it is equally supported by lakefront attractions and seasonal visitors. Smaller communities like Huron, Vermilion, and Milan add depth with harbors, historic sites, and neighborhoods.
Sandusky provides the county’s core services with hospitals, schools, and cultural venues. Residents and visitors alike enjoy boating, fishing, and destinations such as Cedar Point that highlight the county’s waterfront setting. Blending industry with recreation, Erie County ties its future closely to both the lake and its people.
Where is Erie County?
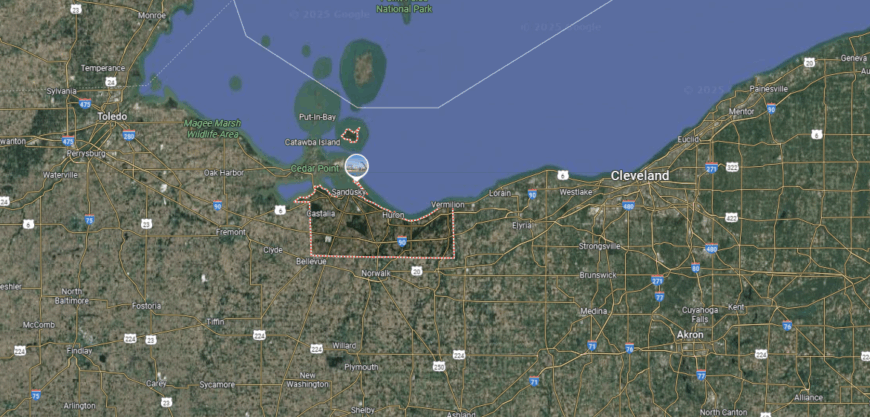
Erie County sits along the southern shore of Lake Erie in north-central Ohio, about 60 miles west of Cleveland and 45 miles east of Toledo. Its location on the lakefront makes it one of the state’s gateways to the water, with islands, beaches, and marinas shaping much of its identity.
Interstate 80/90 (the Ohio Turnpike) and State Route 2 provide the main east–west routes through the county, while U.S. Route 250 links travelers southward. With Sandusky as its hub, the county’s position blends the accessibility of major roadways with the pull of Lake Erie’s shoreline just steps away.
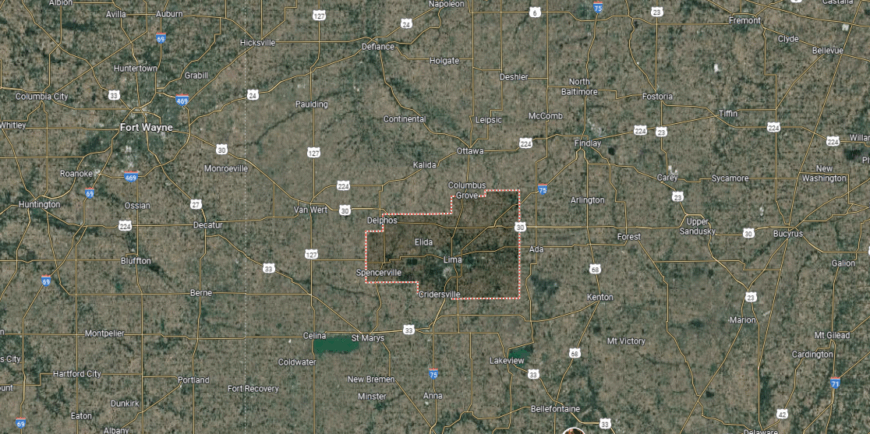
#37. Allen County (tie)
– Life expectancy: 75.2 years
— 0.4 years lower than the state average

About
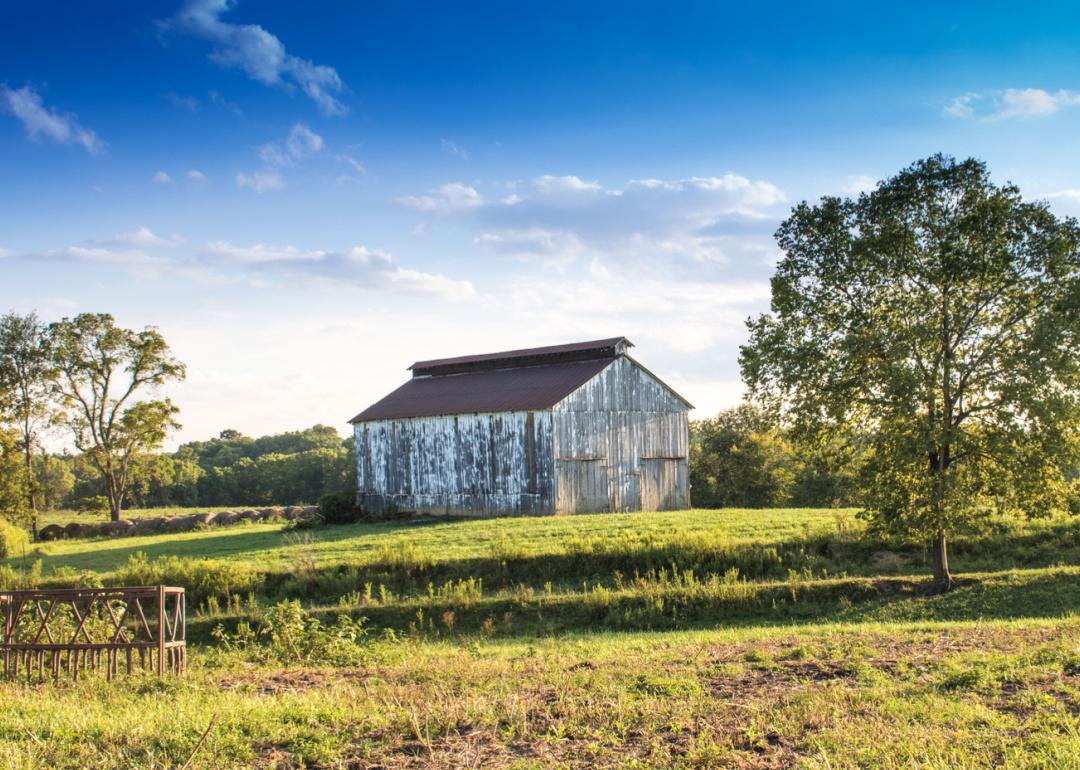
In Allen County, Lima stands at the center, once known as an oil town and still marked by its industrial strength. The county’s economy today blends manufacturing with healthcare and education, while farming communities continue to shape the landscape. Beyond Lima, places like Bluffton and Delphos carry their own identities through colleges, local businesses, and neighborhood ties.
The county offers a mix of urban and rural life, from cultural venues and hospitals in the city to parks, trails, and reservoirs across the countryside. Residents take pride in strong schools and community traditions that span generations. Industry, agriculture, and education together give Allen County both resilience and a forward-looking spirit.
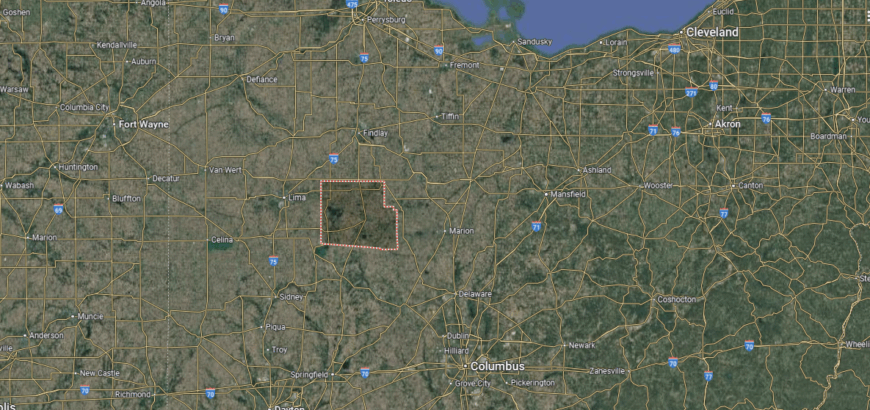
Where is Allen County?
🔥 Would you like to save this?
Allen County is found in northwest Ohio, with Lima as its central hub. It lies about 70 miles south of Toledo and 90 miles northwest of Columbus, placing it within a comfortable reach of both northern and central parts of the state.
Interstate 75 cuts directly through the county, making north–south travel easy, while U.S. Routes 30 and 309 provide important east–west connections. Its location positions it as a crossroads between larger cities, yet the surrounding farmland and small towns highlight its more regional character.
#37. Sandusky County (tie)
– Life expectancy: 75.2 years
— 0.4 years lower than the state average

About
Sandusky County stretches across fertile farmland, with Fremont serving as its anchor along the Sandusky River. Agriculture and food processing drive much of the local economy, while manufacturing and healthcare add stability for residents. Towns such as Clyde, Gibsonburg, and Woodville weave in their own traditions through schools, festivals, and close-knit neighborhoods.
Fremont stands out with its role as home to the Rutherford B. Hayes Presidential Library and Museum, tying history to community pride. Outdoor life is shaped by parks, trails, and easy access to Lake Erie just north of the county line. Blending strong industries with heritage and recreation, Sandusky County offers both opportunity and a deep sense of place.
Where is Sandusky County?
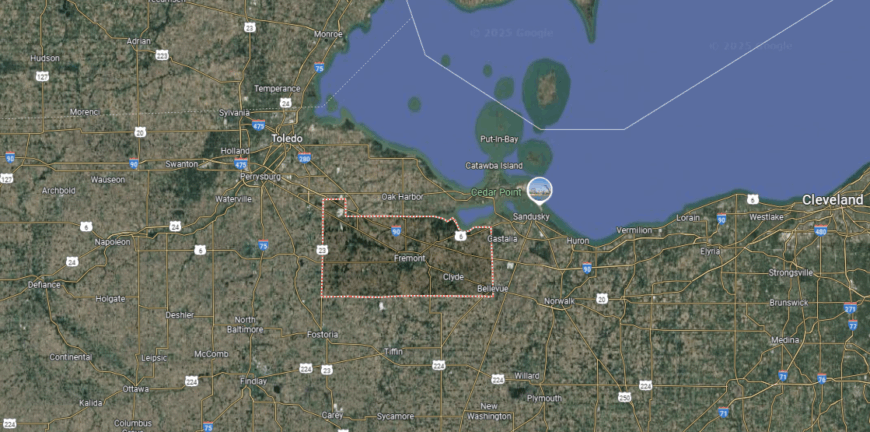
Sandusky County lies in northwestern Ohio, about 25 miles southeast of Toledo and 75 miles west of Cleveland. Its setting along the Sandusky River and near the shores of Lake Erie places it in a transitional zone between Ohio’s agricultural interior and its lakefront corridor.
Travelers often reach the county via the Ohio Turnpike (Interstate 80/90) or U.S. Route 20, both of which run east–west through the region. This position makes it a natural pass-through between major cities, while its towns and rural stretches keep it grounded in a quieter corner of the state.
#36. Richland County
– Life expectancy: 74.7 years
— 0.9 years lower than the state average
About
Richland County is known for its rolling hills, outdoor parks, and the draw of destinations like Snow Trails and the Mohican State Forest nearby. Recreation pairs with a diverse economy built on manufacturing, healthcare, and education, which provide steady jobs for the region. Communities such as Ontario, Shelby, and Bellville add variety with schools, local businesses, and hometown traditions.
Mansfield anchors the county with hospitals, colleges, and cultural institutions that tie people together. Residents enjoy theater, museums, and festivals that highlight the area’s creative energy. With its mix of outdoor activity, strong industries, and cultural presence, Richland County offers a balance that appeals to both workers and families.
Where is Richland County?
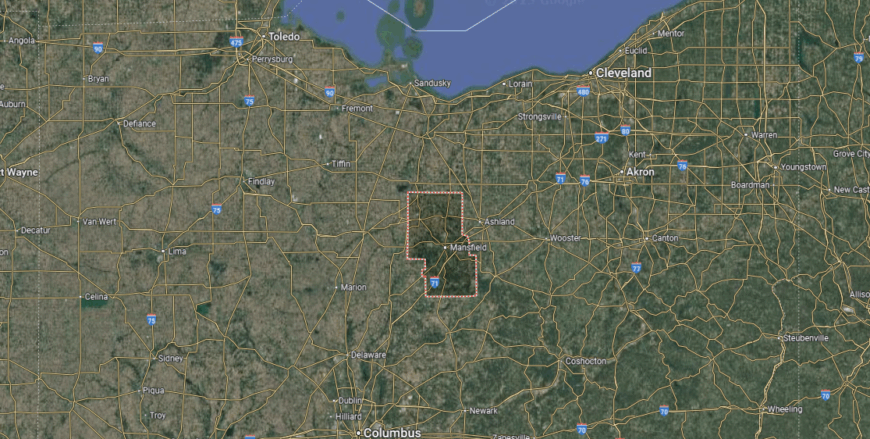
Richland County sits in north-central Ohio, about 65 miles northeast of Columbus and 80 miles southwest of Cleveland. It lies at the junction of Ohio’s agricultural flatlands and the rolling foothills that lead toward the Appalachian region, giving it a mix of open farmland and wooded terrain.
Interstate 71 runs along the county’s eastern edge, linking it quickly to Cleveland and Columbus, while U.S. Routes 30 and 42 connect its communities across the region. Its position places it squarely in the center of the state, with Mansfield serving as the county seat and a natural meeting point between Ohio’s urban corridors and rural landscapes.
#34. Belmont County (tie)
– Life expectancy: 74.6 years
— 1.0 years lower than the state average
About
Belmont County traces its roots to Ohio’s early statehood, with St. Clairsville serving as the county seat along the historic National Road. Once fueled by coal mining and river trade, the economy has shifted toward energy, health services, and small-scale manufacturing. Towns such as Martins Ferry, Bellaire, and Barnesville add strength through schools, traditions, and local pride.
St. Clairsville anchors the county with government, healthcare, and retail that support everyday life. Outdoor opportunities range from hiking and boating at Barkcamp State Park to events like the Barnesville Pumpkin Festival. By blending its historic foundations with evolving industries, Belmont County continues to balance heritage with resilience.
Where is Belmont County?
Belmont County is positioned in far eastern Ohio along the West Virginia border, with the Ohio River forming its southeastern edge. It sits about 125 miles east of Columbus and roughly 60 miles southwest of Pittsburgh, placing it squarely in the state’s Appalachian region.
Interstate 70 crosses the county from east to west, serving as a major route that links Wheeling, West Virginia, directly to communities across Ohio. State Route 7 follows the river, tying together its small towns, while the rugged hills beyond highlight its place on the edge of the Allegheny Plateau.
#34. Huron County (tie)
– Life expectancy: 74.6 years
— 1.0 years lower than the state average
You may also like: Best colleges in Ohio
About
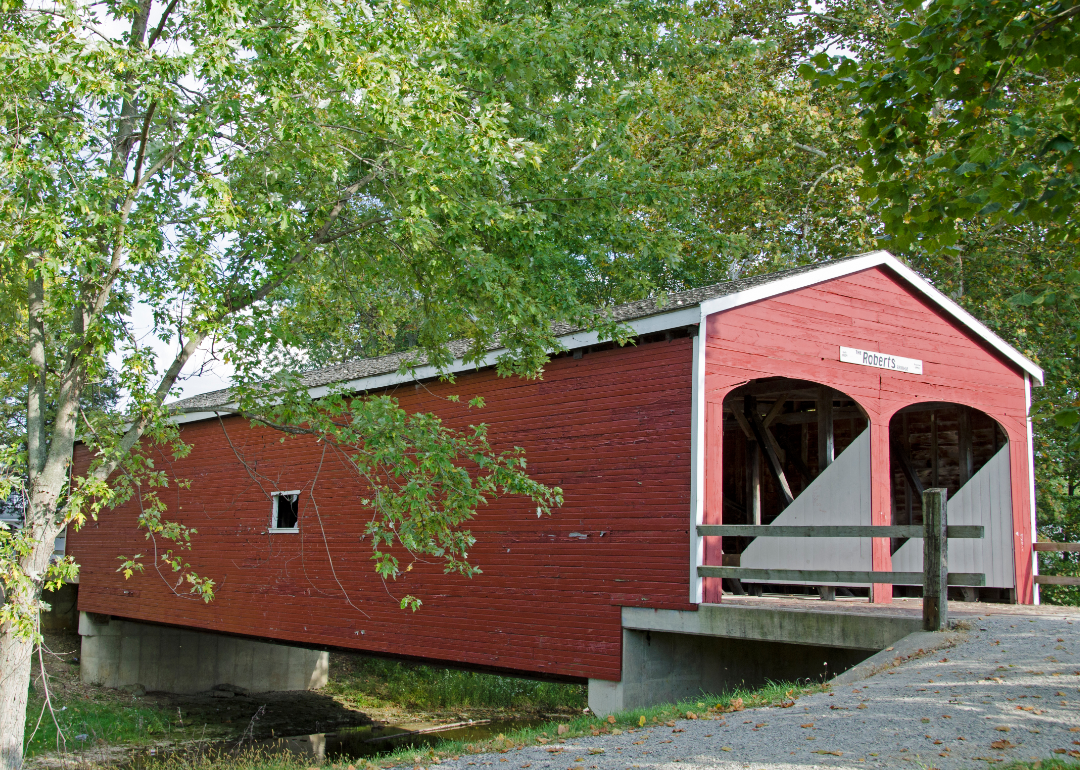
Huron County thrives on its network of towns and villages, where schools, churches, and local festivals bring people together year-round. Norwalk, the county seat, stands as a hub for education and healthcare while smaller places like Willard, Bellevue, and New London add their own community traditions. Daily life is marked by a mix of small-town ties and open farmland that shapes the county’s identity.
The economy is supported by agriculture, food processing, and manufacturing, with services and retail playing key roles as well. Parks, fairgrounds, and nearby reservoirs give residents space for recreation and connection. Blending work, heritage, and close-knit neighborhoods, Huron County maintains a steady rhythm rooted in both tradition and progress.
Where is Huron County?
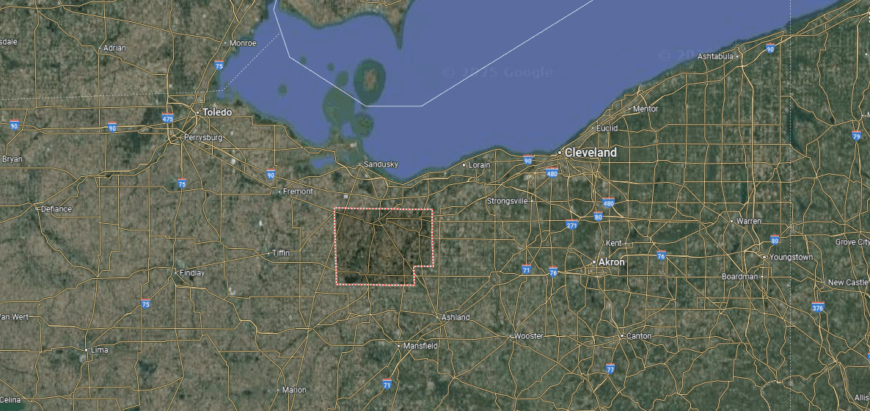
Huron County is set in north-central Ohio, about 60 miles southwest of Cleveland and 65 miles north of Columbus. It rests just inland from the Lake Erie shoreline, with flat farmland stretching across much of its landscape.
U.S. Route 20 and State Route 4 provide the main east–west and north–south connections, while smaller highways link its rural towns to nearby lakefront communities. Its location keeps it close to the amenities of the northern cities, yet firmly rooted in Ohio’s agricultural heart.
#33. Columbiana County
– Life expectancy: 74.5 years
— 1.1 years lower than the state average
About
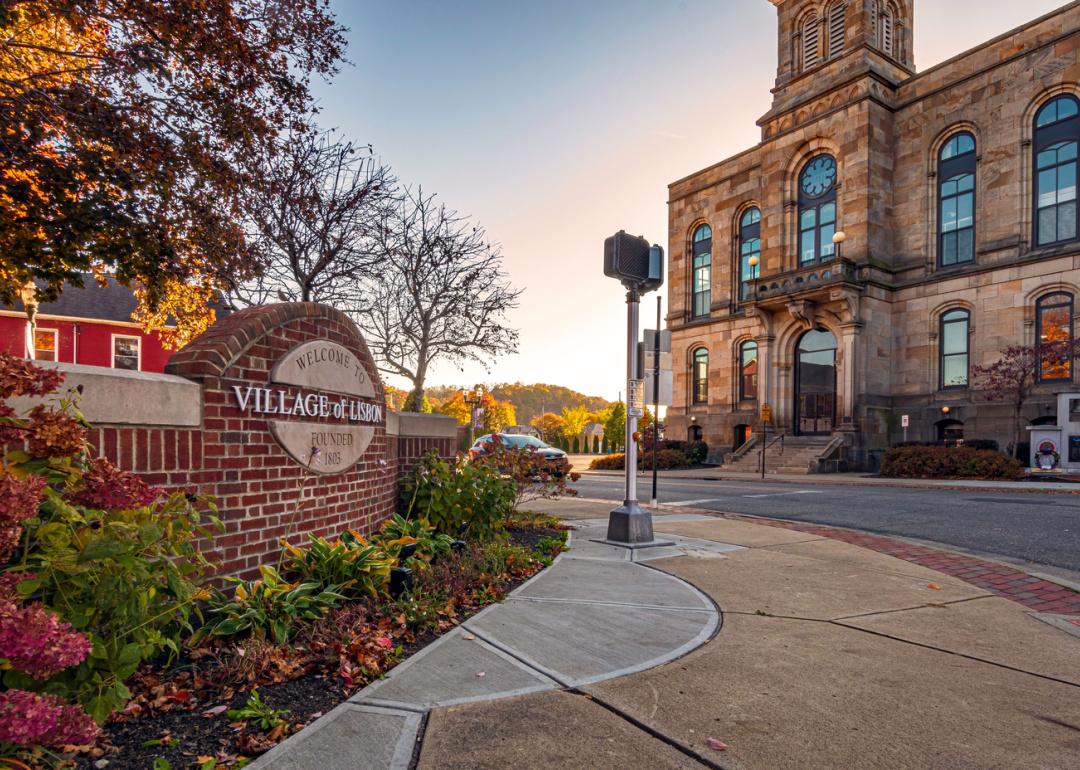
Columbiana County lies along Ohio’s eastern border, where the Ohio River shapes both commerce and daily life. The economy blends manufacturing, energy, and agriculture, with small businesses and services anchoring local communities. East Liverpool, Salem, and Columbiana each carry their own history, from pottery traditions to vibrant downtowns.
Lisbon serves as the county seat, providing government, schools, and healthcare for the region. Residents enjoy riverfront parks, historic districts, and events that tie neighbors together. With its mix of river industry, farmland, and cultural traditions, Columbiana County reflects both resilience and rooted identity.
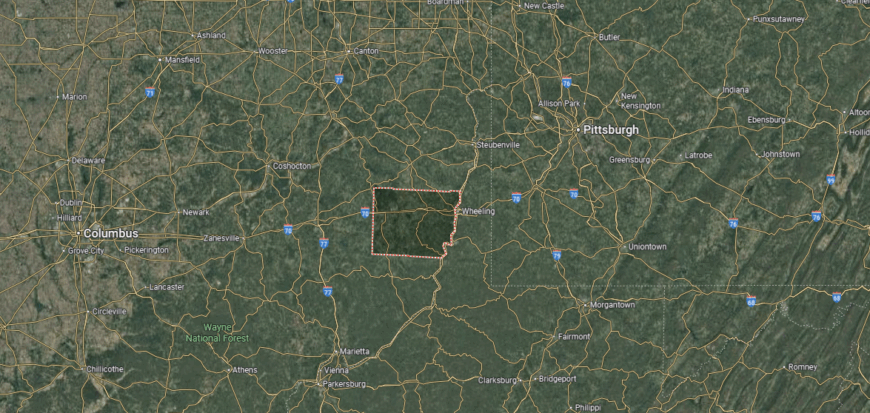
Where is Columbiana County?
Columbiana County sits in the far eastern corner of Ohio, where the state meets both Pennsylvania and West Virginia. It lies about 60 miles northwest of Pittsburgh and 90 miles southeast of Cleveland, giving it a strategic position along the upper Ohio Valley.
The county is crossed by U.S. Route 30 and State Route 11, which connect its towns to larger regional hubs while still winding through stretches of farmland and wooded hills. Its borderland location ties it closely to the industries and river heritage of the Ohio Valley, while keeping it distinctly Ohio in character.
#32. Preble County
– Life expectancy: 74.4 years
— 1.2 years lower than the state average
About
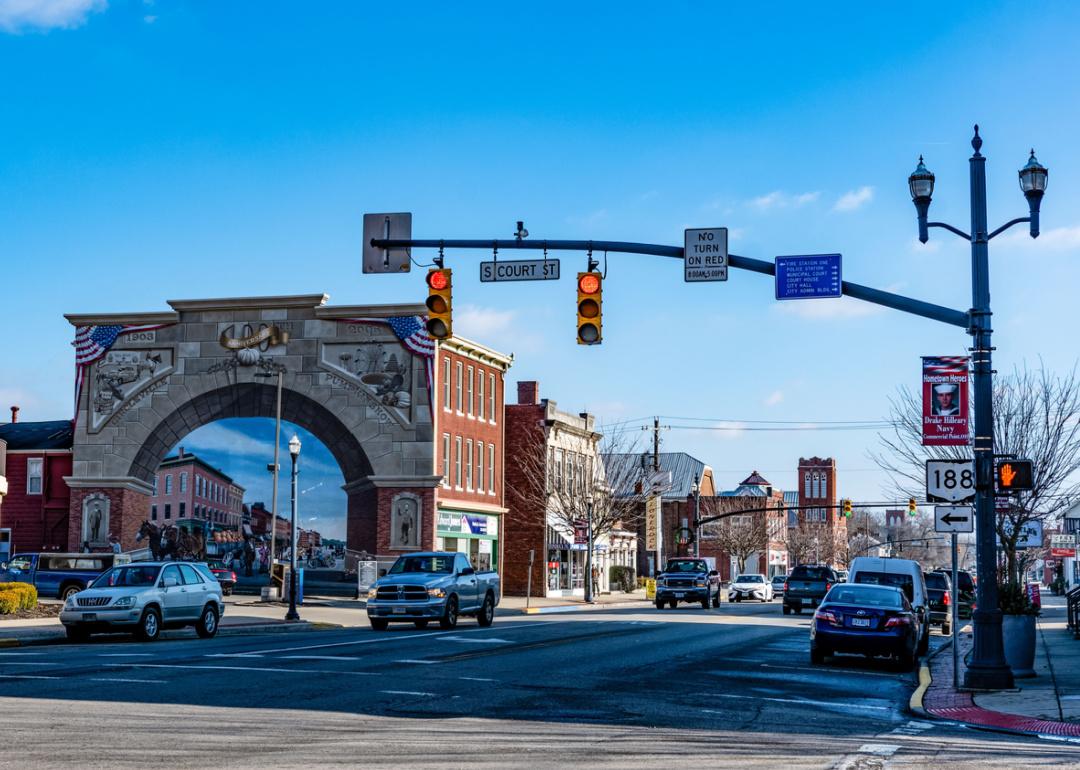
Preble County’s economy leans on agriculture, food production, and small manufacturing that sustain both local jobs and regional trade. Logistics and retail also support growth, while family-owned businesses remain at the heart of its towns. Eaton, the county seat, anchors this activity with schools, services, and civic life.
Beyond Eaton, villages like Camden, Lewisburg, and West Alexandria maintain strong ties through community events and local traditions. Residents enjoy parks, trails, and rural landscapes that define the county’s character. With work rooted in farming and industry, Preble County balances productivity with a deeply connected way of life.
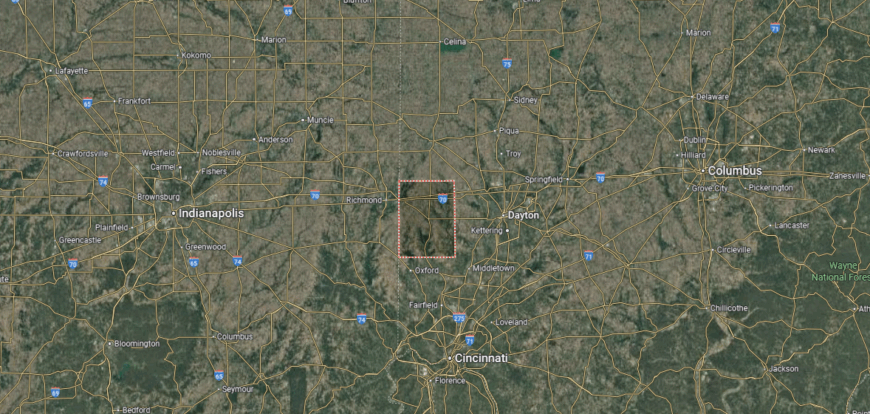
Where is Preble County?
🔥 Would you like to save this?
Preble County is tucked into Ohio’s southwest corner along the Indiana border, about 20 miles west of Dayton and 70 miles north of Cincinnati. Its placement makes it a gateway between the Miami Valley and eastern Indiana’s farm country.
Interstate 70 cuts across the northern part of the county, while U.S. Route 35 and several state highways provide access through its rural interior. Though close to major urban centers, its position along the state line gives it a distinctly crossroads feel where Ohio and Indiana meet.
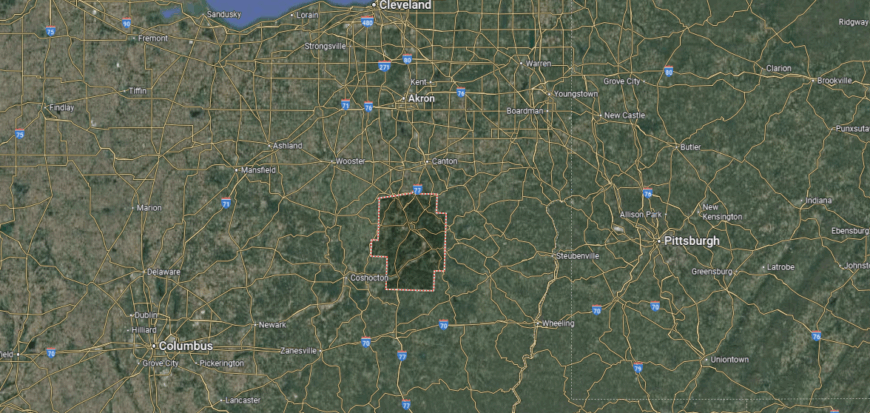
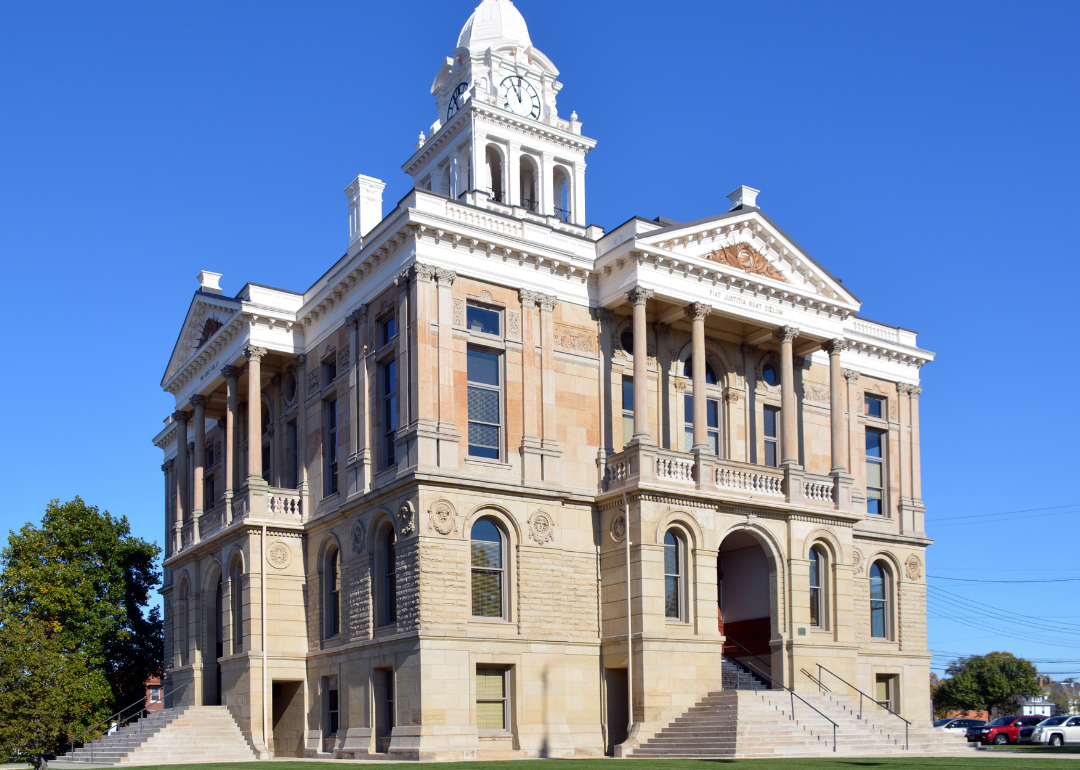
#29. Coshocton County (tie)
– Life expectancy: 74.3 years
— 1.3 years lower than the state average
About
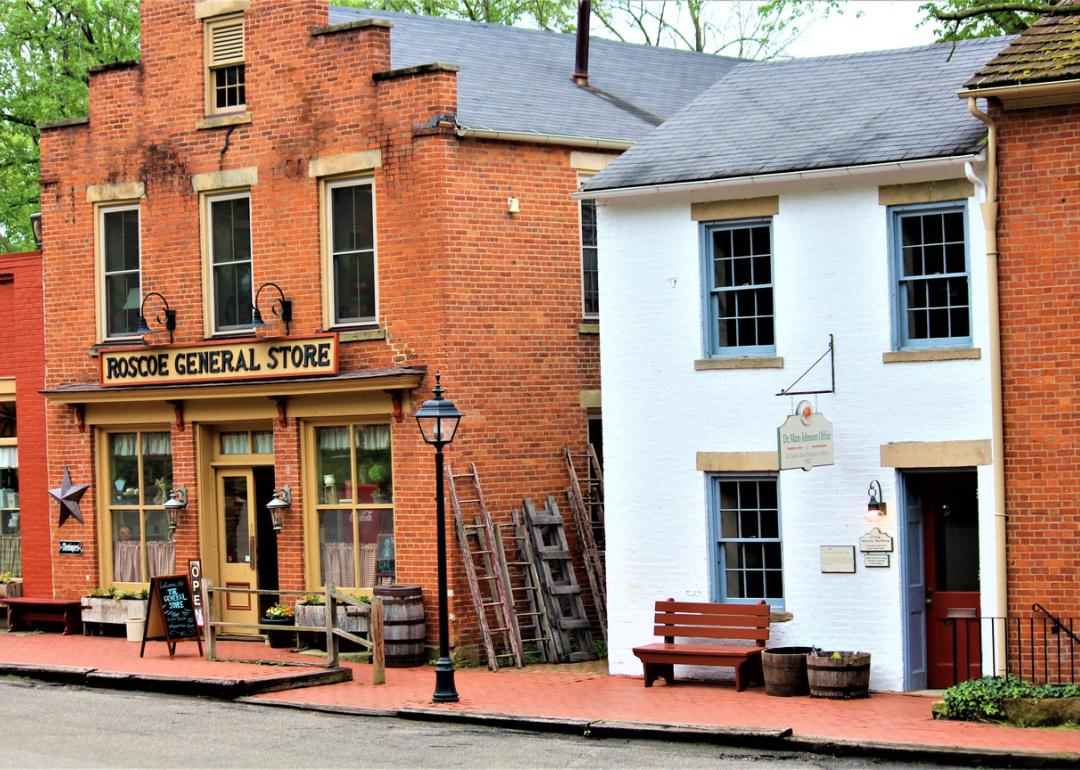
Coshocton County carries a deep historical identity, once a meeting ground for Native American cultures and later a hub of canal and river trade. Today, its economy combines manufacturing, agriculture, and a growing tourism sector tied to local heritage sites. The towns of West Lafayette and Warsaw add their own rhythms with schools, markets, and community events.
Coshocton city, the county seat, is home to Roscoe Village, a restored canal town that celebrates 19th-century life. Residents enjoy access to parks, trails, and the confluence of rivers that define the county’s landscape. By weaving history, industry, and recreation together, Coshocton County offers both a strong sense of place and steady opportunity.
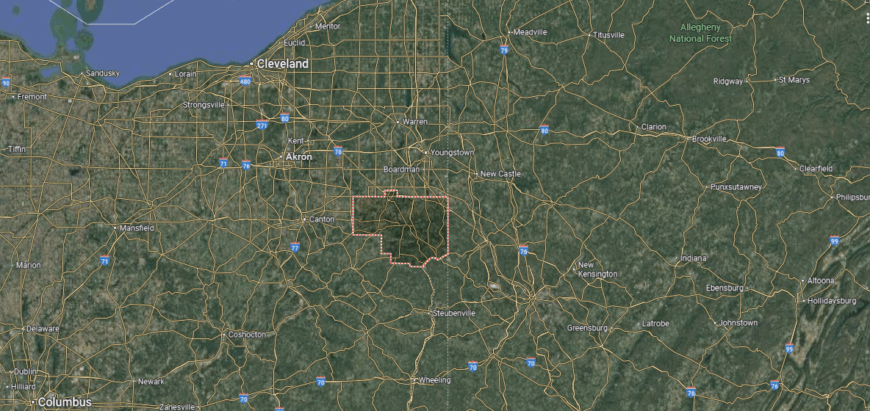
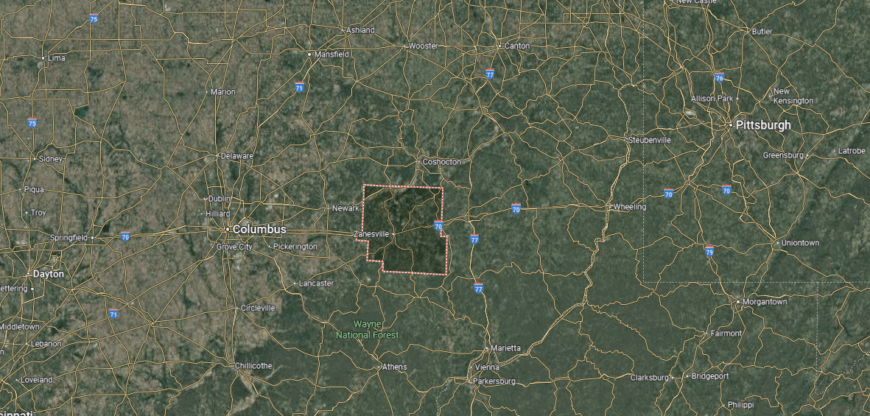
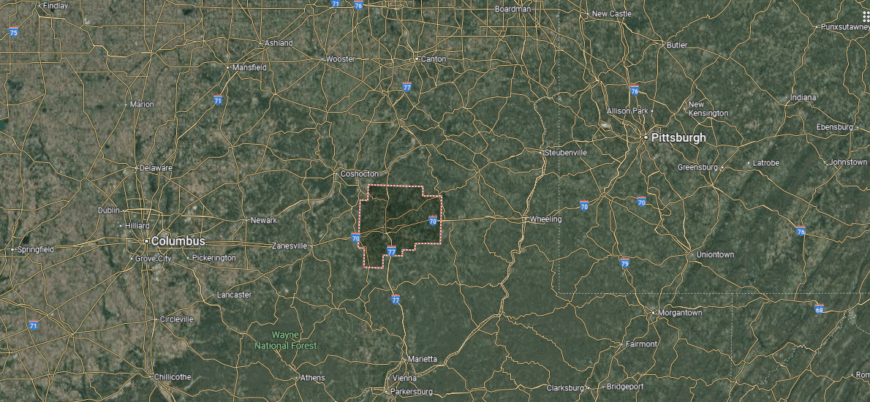
Where is Coshocton County?
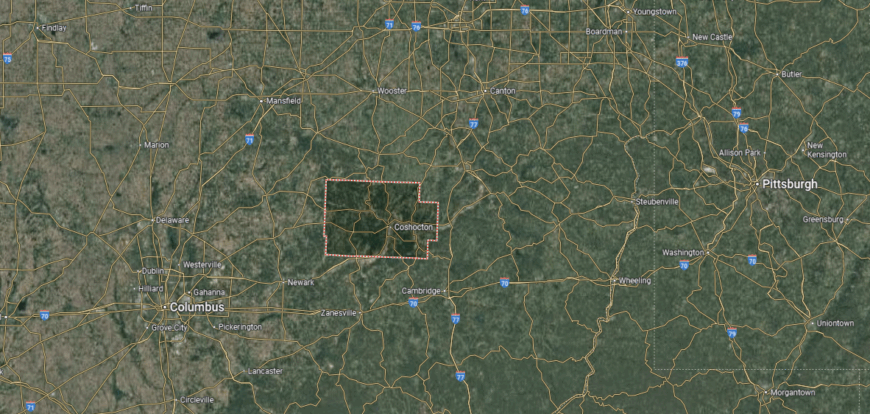
Coshocton County is located in east-central Ohio, about 70 miles northeast of Columbus and 30 miles west of New Philadelphia. It sits where the Tuscarawas and Walhonding Rivers meet to form the Muskingum, placing the county at a natural crossroads in the state’s interior.
U.S. Routes 36 and 16 provide the main east–west travel corridors, while State Routes 83 and 60 run north–south through the rolling hills. Its setting in the Appalachian foothills gives it a more secluded position, yet it remains within driving distance of Ohio’s larger cities.
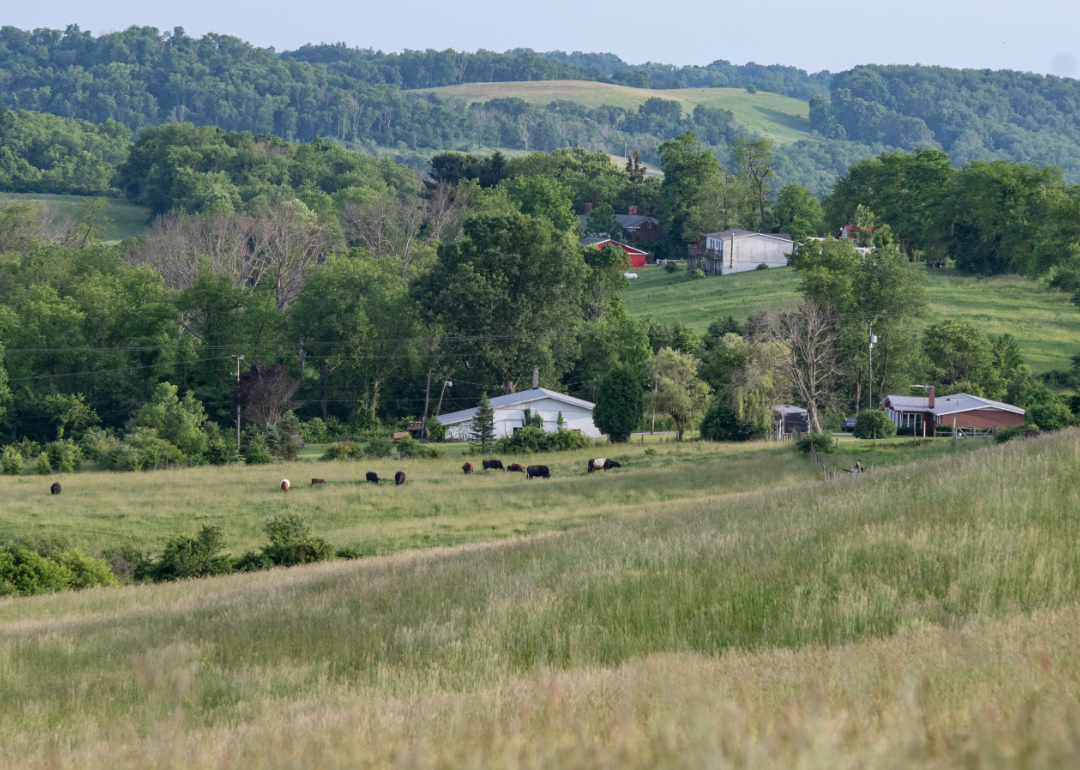
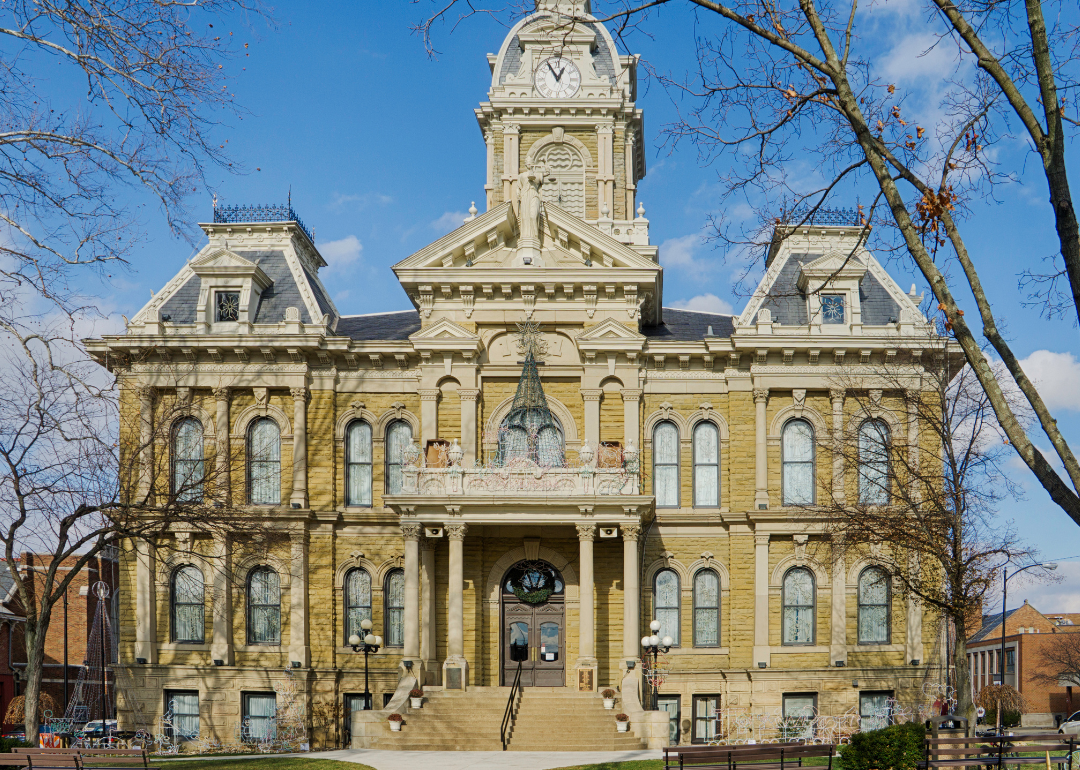
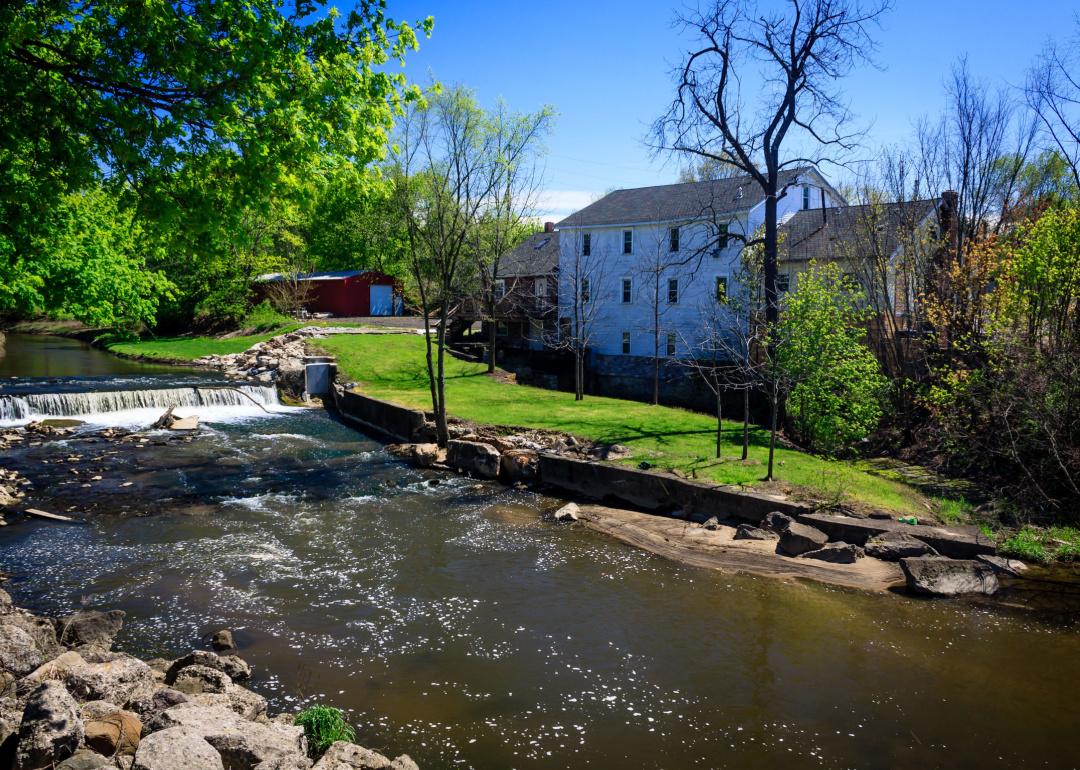
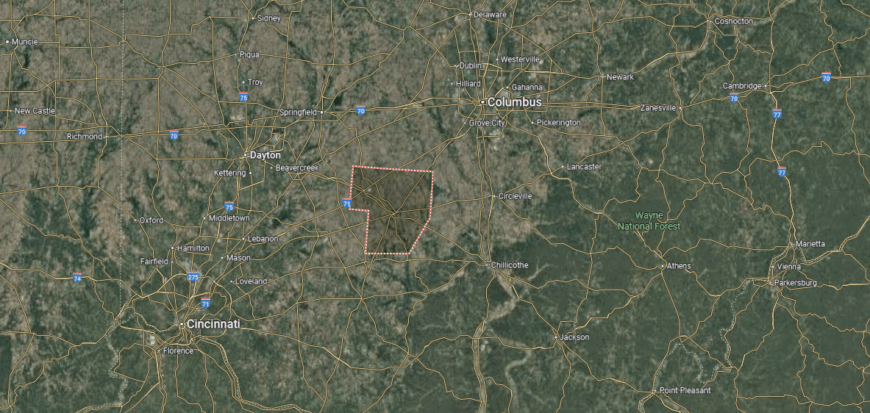
#29. Pickaway County (tie)
– Life expectancy: 74.3 years
— 1.3 years lower than the state average
About
Pickaway County is shaped by open farmland and the flow of the Scioto River, which runs through its center. Agriculture is the backbone of the economy, supported by logistics, manufacturing, and small businesses that connect the county to the Columbus metro area. Circleville, the county seat, is known for its schools, healthcare, and the long-running Pumpkin Show that draws visitors from across Ohio.
Beyond Circleville, towns like Ashville, South Bloomfield, and Williamsport bring their own traditions and neighborhood ties. Residents enjoy parks, trails, and easy access to both rural countryside and city life. With fertile land, strong industries, and a growing link to Columbus, Pickaway County continues to blend heritage with opportunity.
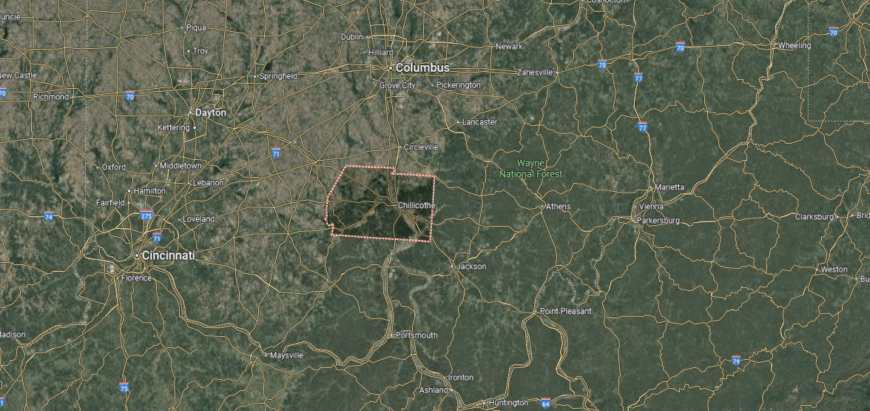
Where is Pickaway County?
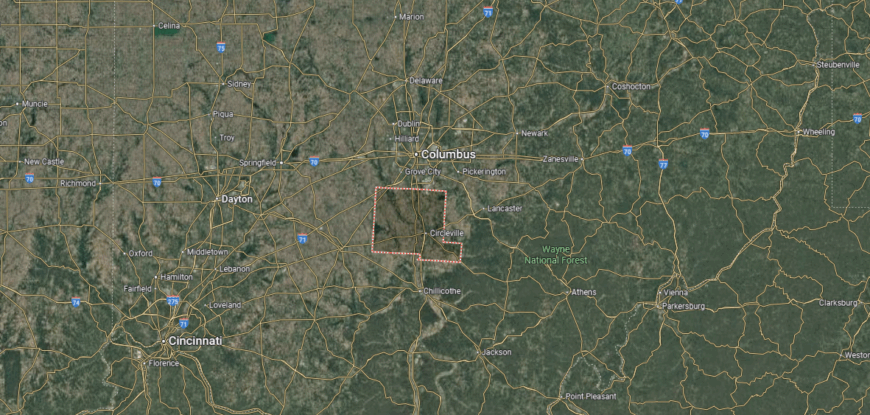
Pickaway County lies in central Ohio, just south of Columbus, making it part of the greater metropolitan area while still maintaining a rural landscape. It is about 25 miles north of Chillicothe and sits along the Scioto River, which cuts through the county on its way toward the Ohio River.
U.S. Route 23 is the main north–south corridor, linking Pickaway directly to Columbus and southern Ohio, while State Routes 22 and 56 provide east–west access. Its location places it firmly at the edge of Ohio’s capital city, blending farmland and small towns with easy urban connectivity.
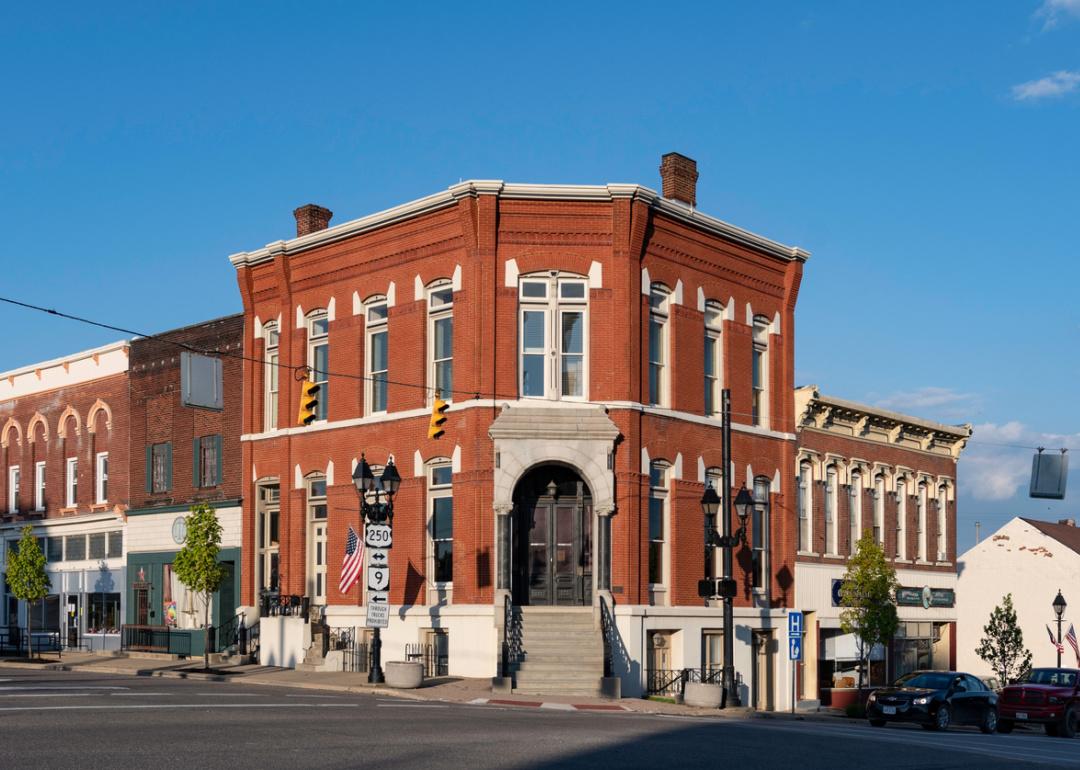
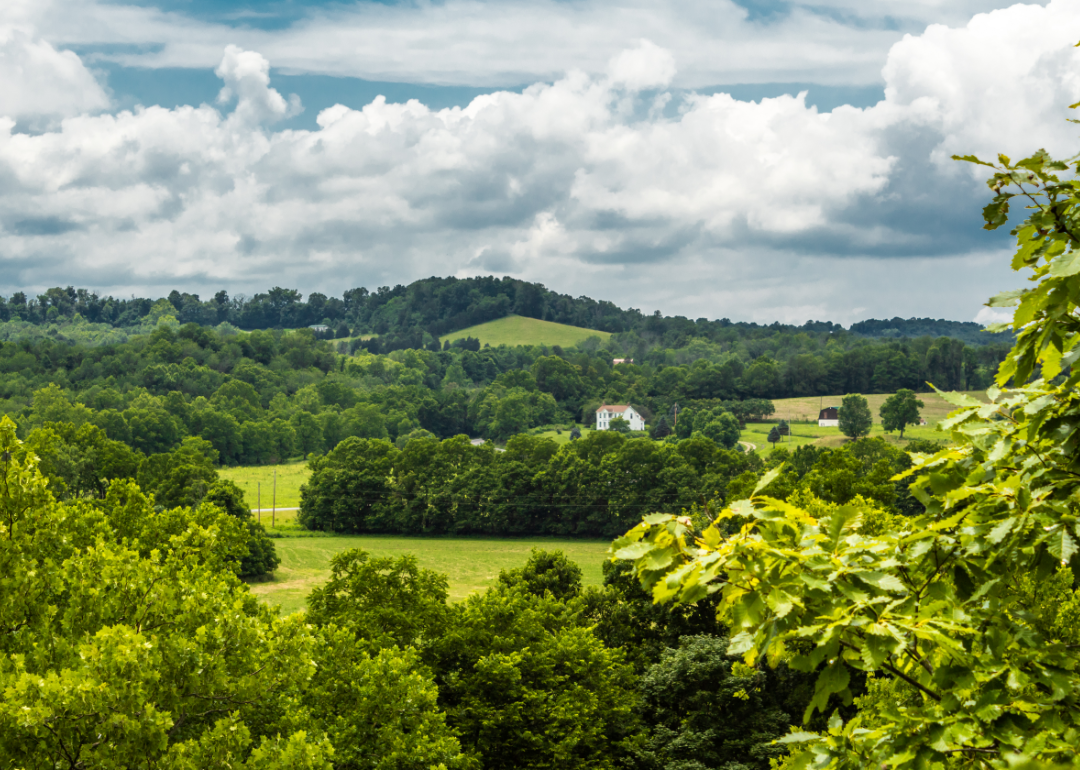
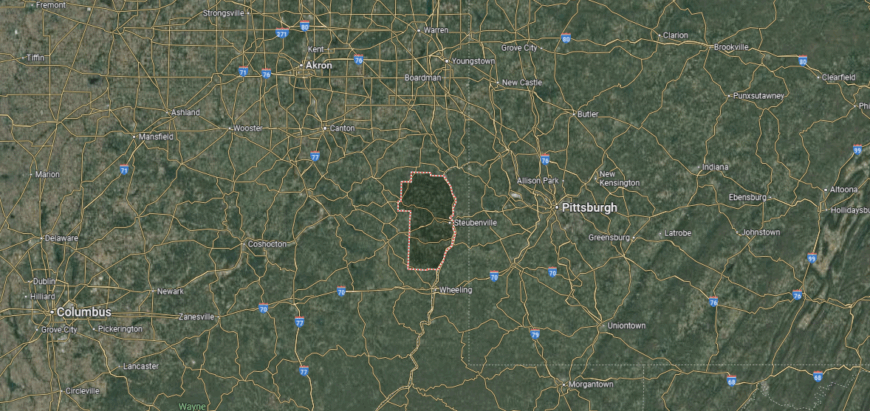
#29. Harrison County (tie)
– Life expectancy: 74.3 years
— 1.3 years lower than the state average
You may also like: How gas prices have changed in Ohio in the last week
About
Harrison County is known for the annual Harrison Coal & Reclamation Historical Park events, which honor the region’s mining legacy. Energy and agriculture form the core of the economy, with natural gas development joining traditional farming in shaping local life. Towns such as Cadiz, Freeport, and Scio provide schools, small businesses, and community traditions that tie residents together.
Cadiz, the county seat, anchors services with government, healthcare, and education at its center. Outdoor recreation thrives at Tappan Lake and Clendening Lake, where boating, fishing, and camping attract residents year-round. By blending history, natural resources, and community pride, Harrison County maintains a character rooted in both work and heritage.
Where is Harrison County?
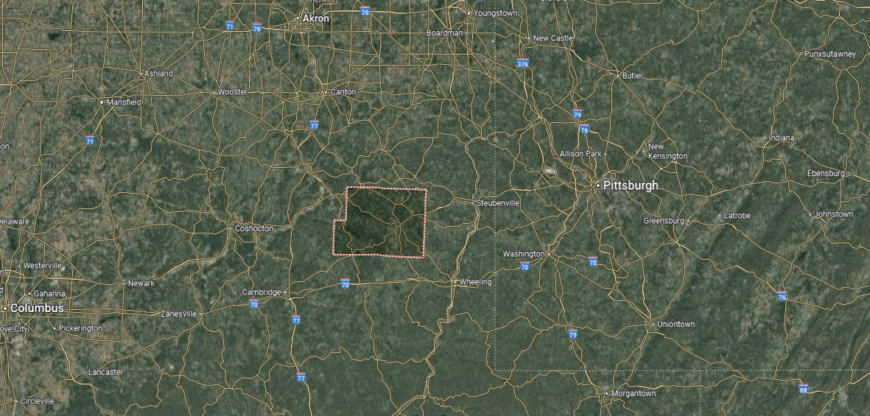
Harrison County is set in eastern Ohio, about 35 miles southeast of Canton and roughly 60 miles west of Wheeling, West Virginia. It lies in the Appalachian foothills, where ridges, valleys, and reservoirs shape much of the landscape.
U.S. Route 22 runs through the northern part of the county, while State Routes 9 and 151 wind across its interior, connecting small towns tucked into the hills. Its position offers proximity to larger cities yet keeps it firmly rooted in a quiet, rural stretch of Ohio’s hill country.
#26. Morgan County (tie)
– Life expectancy: 74.2 years
— 1.4 years lower than the state average
About
A day in Morgan County might begin with the sun rising over rolling farmland and end with quiet views along the Muskingum River. Farming and small manufacturing shape much of the economy, while energy and local services provide steady jobs. Communities like Malta, Stockport, and Chesterhill add rhythm through markets, schools, and long-held traditions.
McConnelsville, the county seat, serves as the center with its historic courthouse, theaters, and healthcare facilities. Residents find recreation in Burr Oak State Park, river trails, and festivals that celebrate the area’s heritage. Morgan County weaves together rural charm, resilient industries, and a pace of life grounded in community ties.
Where is Morgan County?
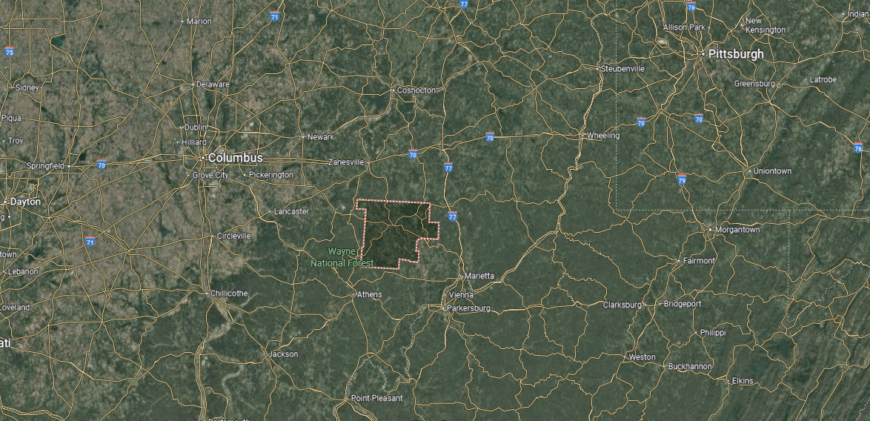
Morgan County sits in southeastern Ohio, about 30 miles southeast of Zanesville and 35 miles northwest of Marietta. It lies within the Appalachian Plateau, where rolling ridges and the Muskingum River valley give the area a rugged, scenic character.
State Routes 60, 78, and 83 form the main travel corridors, linking the county’s small towns to neighboring regions while winding through stretches of forest and farmland. Its location places it deep in Ohio’s hill country, offering a sense of remoteness while still connected by river and road to the state’s broader network.
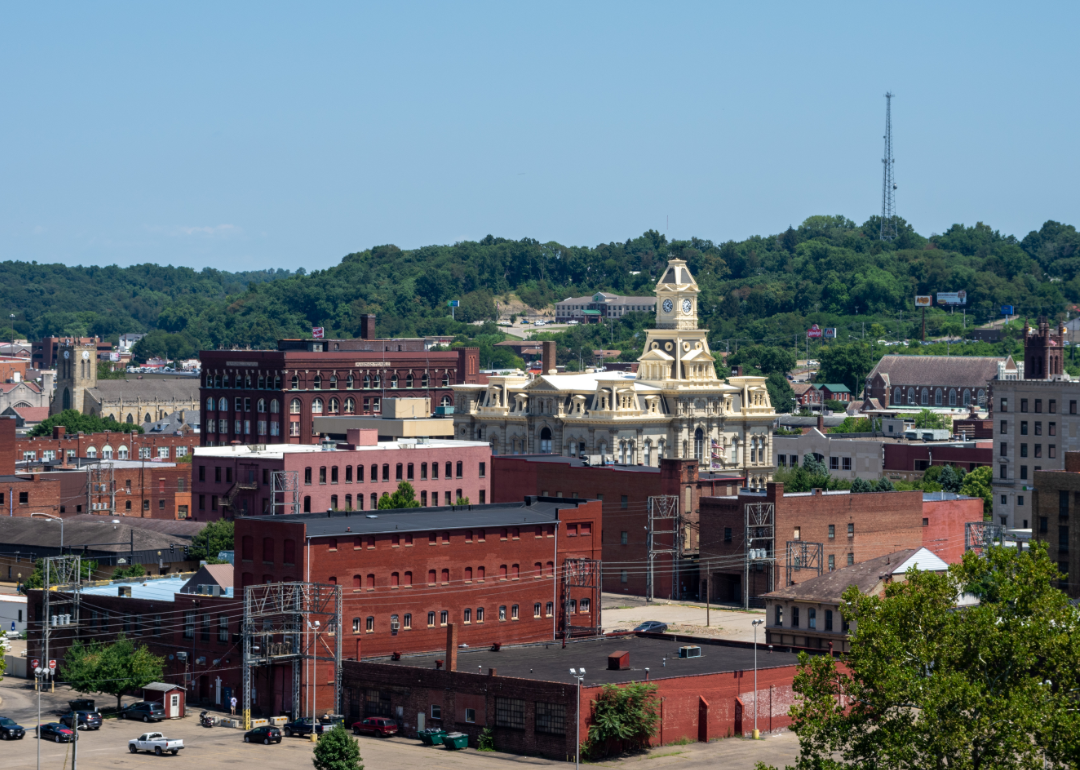
#26. Muskingum County (tie)
– Life expectancy: 74.2 years
— 1.4 years lower than the state average
🔥 Would you like to save this?
About
Muskingum County is anchored by Zanesville, a historic city at the meeting of the Muskingum and Licking Rivers. The economy is supported by healthcare, education, and manufacturing, with retail and logistics adding further stability. Surrounding towns such as Dresden, New Concord, and Philo contribute with schools, small businesses, and community traditions.
Zanesville provides hospitals, colleges, and cultural venues that serve the wider region. Parks, trails, and riverfront access offer residents space for recreation and connection. With its mix of industry, history, and natural resources, Muskingum County stands as a key hub in southeastern Ohio.
Where is Muskingum County?
Muskingum County is located in east-central Ohio, about 55 miles east of Columbus and centered around the city of Zanesville. It sits where the Licking and Muskingum Rivers meet, a historic transportation corridor that has long tied the county to trade and travel across the state.
Interstate 70 runs directly through the county, providing a major east–west route, while U.S. Routes 22, 40, and 60 connect it to surrounding regions. Its position places it firmly on Ohio’s main travel artery while still surrounded by the rolling hills and valleys of the Appalachian Plateau.
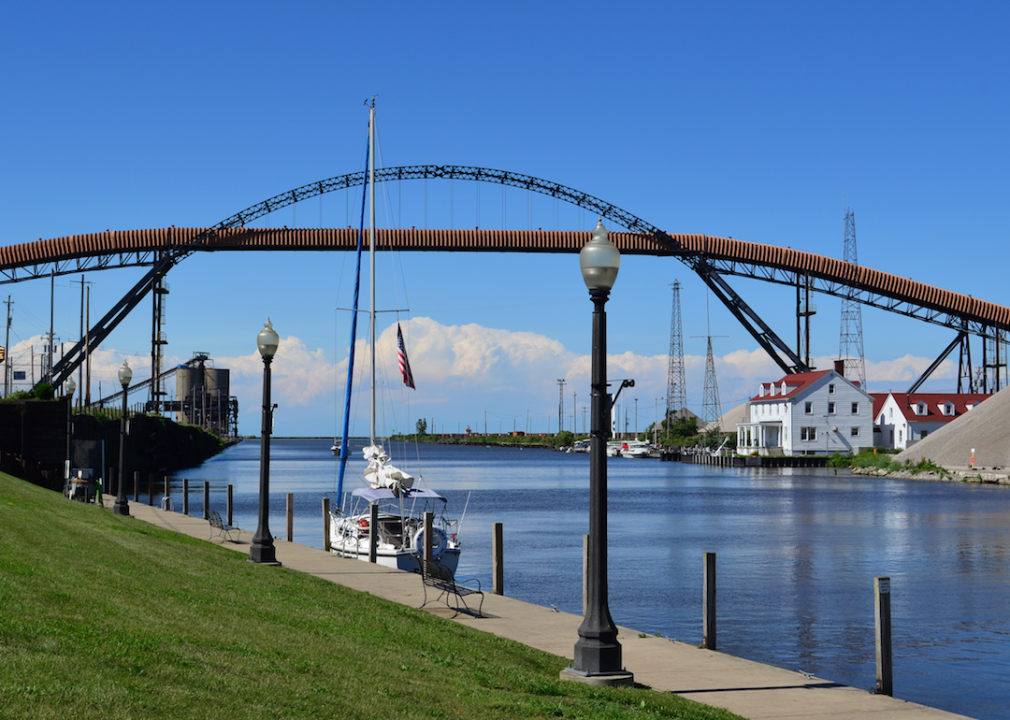
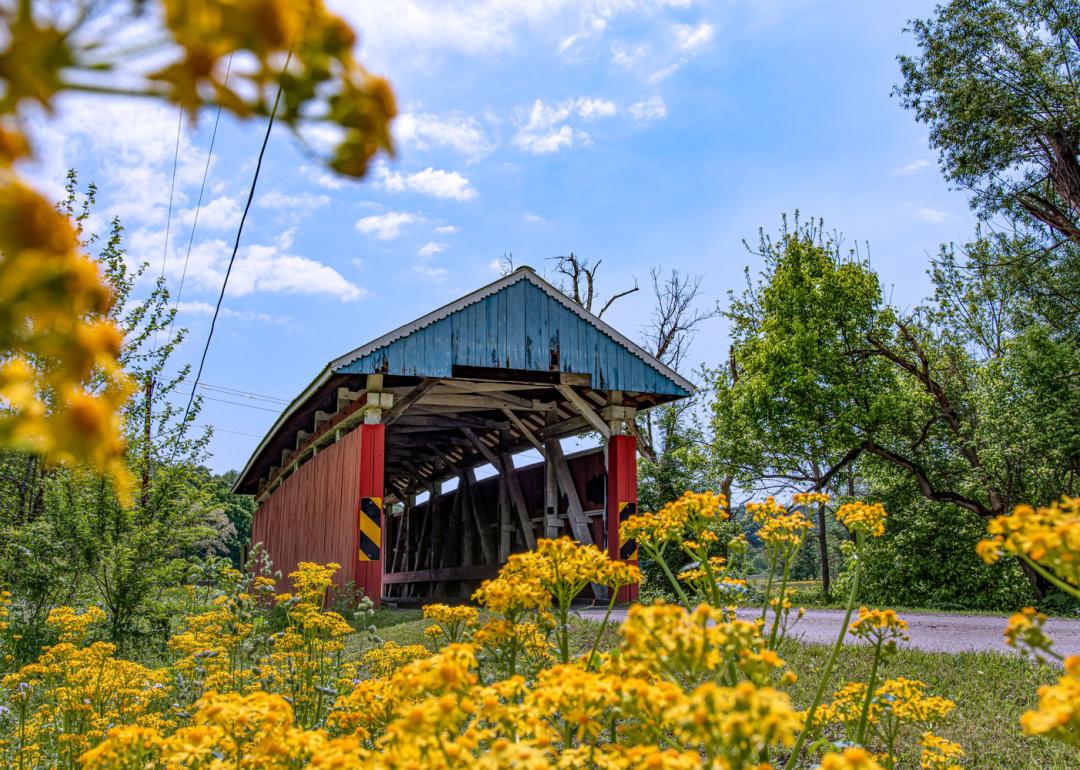
#26. Ashtabula County (tie)
– Life expectancy: 74.2 years
— 1.4 years lower than the state average

About
Ashtabula County stretches along Lake Erie, with vineyards, covered bridges, and shoreline views defining its landscape. Tourism, wine production, and agriculture join manufacturing and healthcare as central pieces of the local economy. Towns like Geneva, Conneaut, and Jefferson add their own character through festivals, harbors, and historic squares.
Jefferson serves as the county seat, offering government, schools, and community services. Residents and visitors enjoy lakefront recreation, the region’s famous covered bridge tours, and access to parks and trails that highlight the countryside. With its balance of natural beauty, industry, and culture, Ashtabula County thrives as both a destination and a home.
Where is Ashtabula County?
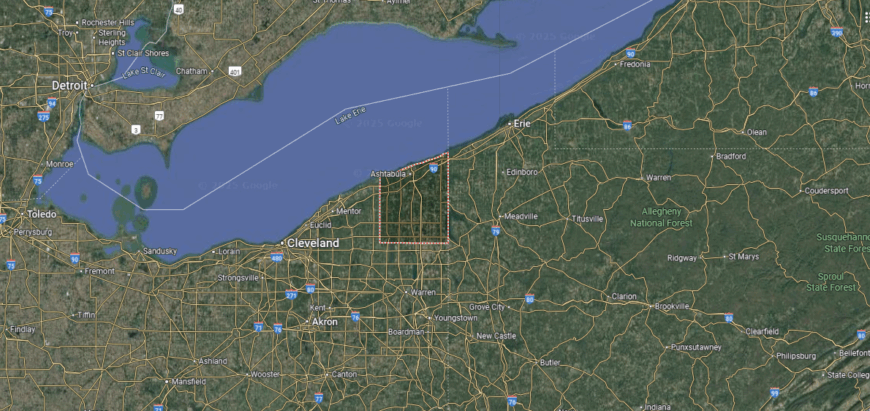
Ashtabula County lies in Ohio’s far northeastern corner, bordered by Pennsylvania to the east and Lake Erie to the north. It’s about 55 miles east of Cleveland and 45 miles west of Erie, Pennsylvania, giving it a spot midway between two Great Lakes cities.
Interstate 90 runs east–west across the county, while State Route 11 cuts south toward Youngstown, making it a key corridor for regional travel. Its lakefront location, combined with its inland farmland and covered bridges, marks it as both a gateway to Ohio’s wine country and a crossroads along the Lake Erie shoreline.
#25. Mahoning County
– Life expectancy: 74.1 years
— 1.5 years lower than the state average
About
Mahoning County is anchored by Youngstown, a city that has transitioned from steelmaking roots into a center for healthcare, education, and research. The economy is reinforced by manufacturing, logistics, and a growing service sector, while nearby communities like Austintown, Boardman, and Struthers contribute schools, retail, and neighborhood life. The county’s position along the Pennsylvania border also strengthens regional trade and opportunity.
Youngstown serves as the cultural and civic hub, offering universities, hospitals, theaters, and museums that shape daily life. Residents enjoy Mill Creek Park’s trails and lakes, festivals that celebrate local heritage, and a strong sports tradition. By blending new industries with historic grit, Mahoning County continues to redefine itself as a regional anchor in northeastern Ohio.
Where is Mahoning County?
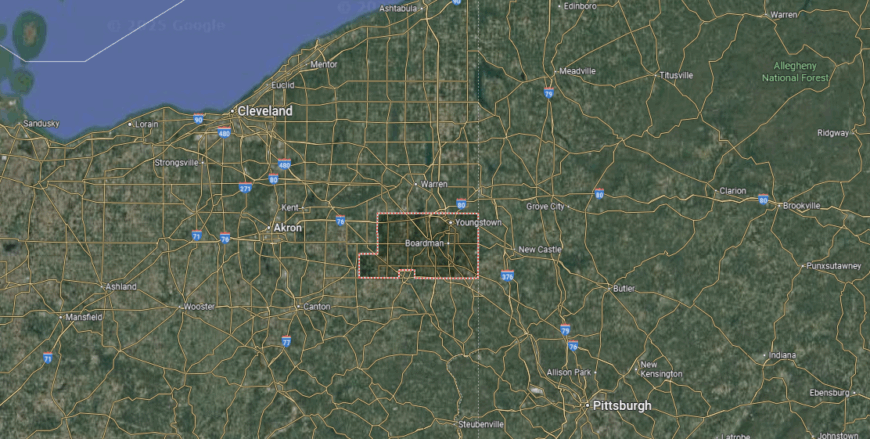
Mahoning County is positioned in northeastern Ohio, anchored by the city of Youngstown. It lies about 65 miles southeast of Cleveland and roughly 60 miles northwest of Pittsburgh, placing it near the Pennsylvania border in the Mahoning Valley.
Interstate 80 and the Ohio Turnpike cut through the northern portion of the county, while Interstates 76 and 680 provide additional access into Youngstown and beyond. Its location makes it a natural link between Ohio’s industrial centers and western Pennsylvania, with easy reach to both major metropolitan areas.
#23. Marion County (tie)
– Life expectancy: 74.0 years
— 1.6 years lower than the state average
You may also like: These are the most prevalent disabilities in Ohio

About
Marion County is tied closely to its history, from serving as the hometown of President Warren G. Harding to its legacy in agriculture and industry. Manufacturing and logistics remain pillars of the economy, while farming and retail sustain local communities. Towns such as Prospect, LaRue, and Caledonia contribute schools, traditions, and small-town pride.
Marion, the county seat, anchors the region with hospitals, colleges, and civic institutions. Residents enjoy parks, museums, and festivals that highlight both history and community life. With its strong roots and evolving industries, Marion County blends the past with opportunities for the future.
Where is Marion County?
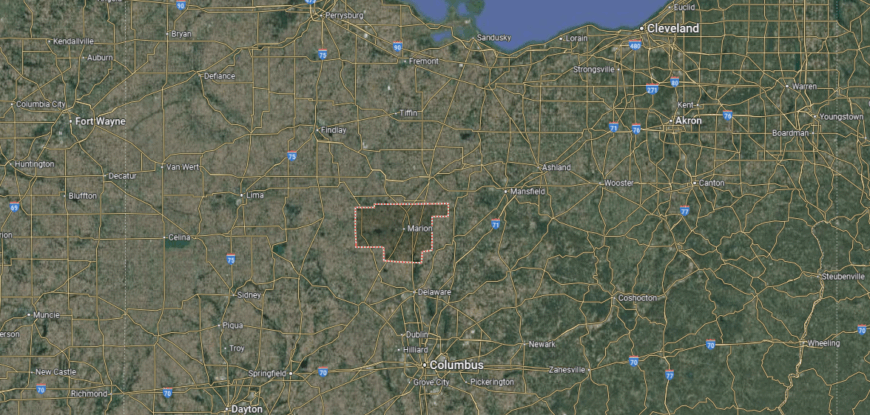
Marion County sits in north-central Ohio, about 50 miles north of Columbus and 15 miles west of Mansfield. Its position places it squarely within Ohio’s agricultural belt, where wide stretches of farmland surround the city of Marion at the county’s center.
U.S. Route 23 runs north–south through the county, providing a direct link to Columbus, while State Routes 4, 95, and 309 connect it to neighboring towns. Its location balances easy access to the state capital with the quieter pace of Ohio’s rural heartland.
#23. Trumbull County (tie)
– Life expectancy: 74.0 years
— 1.6 years lower than the state average

About
Trumbull County is shaped by the Mahoning River and Mosquito Creek Lake, where boating, fishing, and trails define much of its outdoor life. The economy blends manufacturing, healthcare, and retail, while agriculture continues to play a steady role across rural townships. Warren, the county seat, is joined by towns like Niles, Hubbard, and Cortland, each adding schools, businesses, and local culture.
Warren anchors the county with hospitals, colleges, and civic spaces that support the wider region. Residents enjoy museums, sports venues, and seasonal festivals alongside parks and reservoirs that highlight the landscape. With its combination of industry, recreation, and community ties, Trumbull County offers both opportunity and a strong sense of place.
Where is Trumbull County?
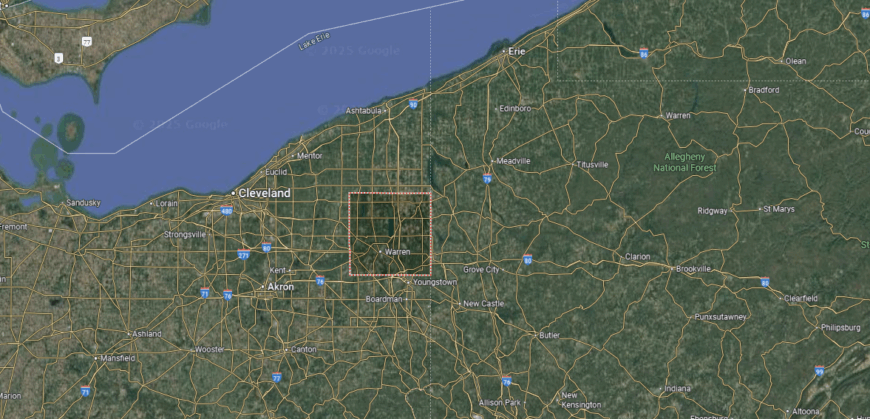
Trumbull County is located in northeastern Ohio, directly along the Pennsylvania border. It lies about 60 miles southeast of Cleveland and 55 miles northwest of Pittsburgh, with Warren serving as the county seat at the center of the Mahoning Valley.
Interstate 80 and the Ohio Turnpike cross the southern part of the county, while State Route 11 provides a key north–south connection. Its position makes it a natural corridor between Ohio and western Pennsylvania, while its mix of towns, farmland, and valleys ties it closely to the region’s industrial and rural heritage.
#20. Crawford County (tie)
– Life expectancy: 73.9 years
— 1.7 years lower than the state average
About
Crawford County is defined by the strength of its communities, where schools, churches, and local events bring neighbors together. Bucyrus, the county seat, is known for its Bratwurst Festival and serves as a hub for education, healthcare, and small businesses. Towns such as Galion, Crestline, and New Washington contribute their own traditions and neighborhood pride.
The economy balances agriculture, manufacturing, and retail, giving residents a steady mix of work opportunities. Parks, fairgrounds, and nearby reservoirs provide recreation while festivals highlight the county’s character. Rooted in close-knit towns and supported by diverse industries, Crawford County continues to thrive on both tradition and connection.
Where is Crawford County?
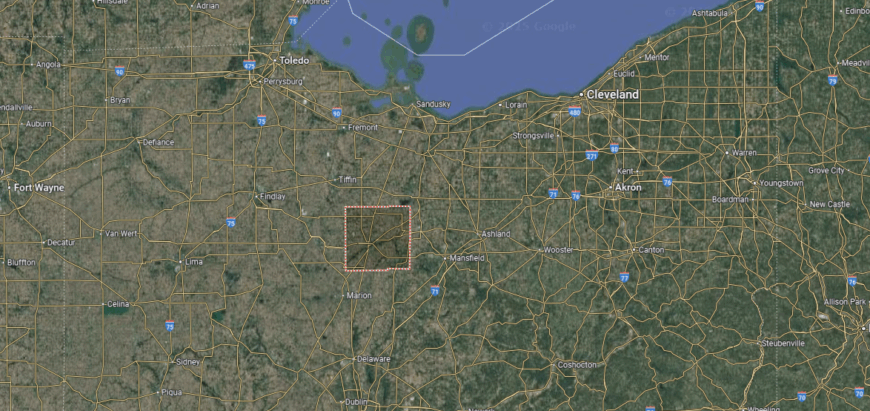
Crawford County lies in north-central Ohio, about 60 miles north of Columbus and 35 miles west of Mansfield. It sits between the agricultural plains and the rolling terrain of the state’s interior, with Bucyrus serving as the county seat.
U.S. Routes 30 and 224 provide the primary east–west access, while State Routes 4 and 19 connect north–south through the county. Its location places it within reach of larger cities yet firmly rooted in Ohio’s farming country, where small towns and rural landscapes define much of the area.
#20. Perry County (tie)
– Life expectancy: 73.9 years
— 1.7 years lower than the state average
About
Perry County’s economy reflects its Appalachian setting, where coal mining once dominated and energy, manufacturing, and healthcare now provide stability. Agriculture remains important across the hills and valleys, while small businesses sustain the county’s villages. New Lexington, the county seat, serves as a hub for schools, government, and local commerce.
Residents enjoy the natural beauty of Burr Oak State Park, hiking trails, and fishing spots that highlight the county’s landscape. Festivals and community gatherings in villages like Somerset and Thornville add culture and tradition. With its mix of industry, farming, and outdoor recreation, Perry County blends work with a grounded rural lifestyle.
Where is Perry County?
Perry County is set in southeastern Ohio, about 55 miles southeast of Columbus and 25 miles west of Zanesville. It lies within the Appalachian Plateau, where wooded hills, winding valleys, and scattered farmlands shape the landscape.
State Routes 13, 37, and 93 serve as the main travel corridors, linking its towns to the surrounding counties while winding through the rugged terrain. Its location places it just beyond the bustle of central Ohio, offering a quieter setting that reflects the character of Ohio’s hill country.
#20. Highland County (tie)
– Life expectancy: 73.9 years
— 1.7 years lower than the state average

About
Highland County carries a long history tied to early settlement and the agricultural traditions that shaped its rolling hills. Farming remains central to the economy, joined by manufacturing, healthcare, and small businesses that sustain daily life. Hillsboro, the county seat, provides schools, hospitals, and government services while towns like Greenfield and Leesburg add their own local heritage.
The county is home to historic sites such as Fort Hill Earthworks & Nature Preserve, which preserves ancient Hopewell culture earthworks within a forested setting. Residents and visitors alike enjoy Rocky Fork State Park and Paint Creek Lake, where boating, fishing, and trails connect the community with the land. With its blend of history, agriculture, and natural beauty, Highland County maintains both resilience and identity.
Where is Highland County?
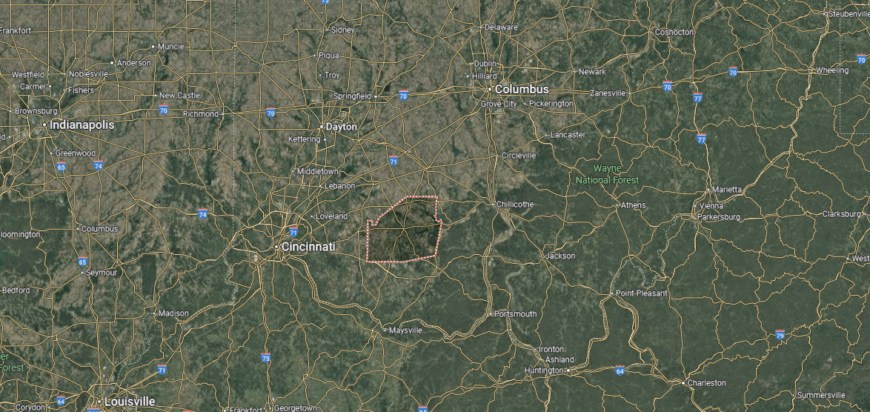
Highland County is located in south-central Ohio, about 60 miles east of Cincinnati and 55 miles west of Chillicothe. It rests on the edge of the Appalachian Plateau, where rolling hills meet stretches of farmland and small town centers.
U.S. Routes 50 and 62 run through the county, providing the main east–west and north–south connections, while State Routes 73 and 138 link its more rural areas. Its location places it within reach of larger cities yet rooted in a landscape defined by valleys, ridges, and open country roads.
#18. Lucas County (tie)
– Life expectancy: 73.8 years
— 1.8 years lower than the state average
You may also like: Highest-rated breweries in Ohio

About
Lucas County is known for its cultural attractions, from the Toledo Museum of Art to the city’s vibrant music and theater scene. Toledo, the county seat, also drives the economy with strengths in healthcare, manufacturing, and a growing solar energy sector. Suburban communities like Sylvania, Maumee, and Oregon add schools, parks, and neighborhood life that round out the region.
The county’s position on Lake Erie and the Maumee River creates opportunities for recreation and trade alike. Residents enjoy metroparks, waterfront access, and festivals that highlight both heritage and innovation. With its mix of culture, industry, and natural resources, Lucas County stands as a major hub in northwest Ohio.
Where is Lucas County?
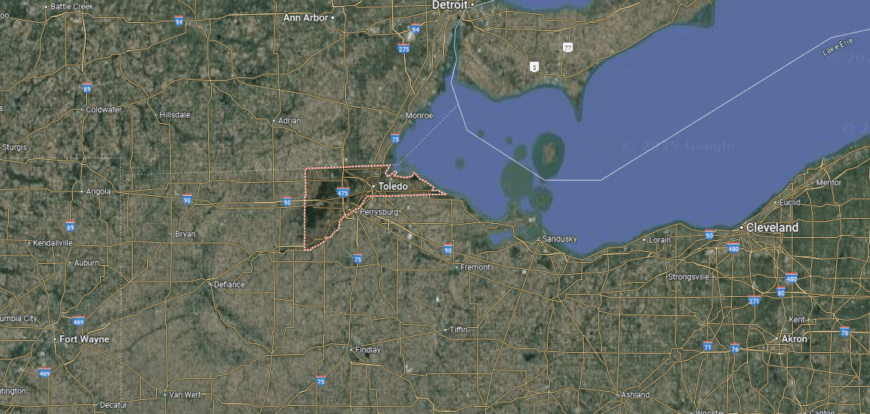
Lucas County anchors the far northwest corner of Ohio, with Toledo as both its county seat and major urban hub. It borders Michigan to the north and sits along the western edge of Lake Erie, about 115 miles west of Cleveland and 60 miles south of Detroit.
Interstate 75 runs north–south through the county, while the Ohio Turnpike (Interstate 80/90) provides an east–west corridor. Its position on the lake and near the state line makes it a gateway between Ohio and Michigan, as well as a key link in the Great Lakes region.
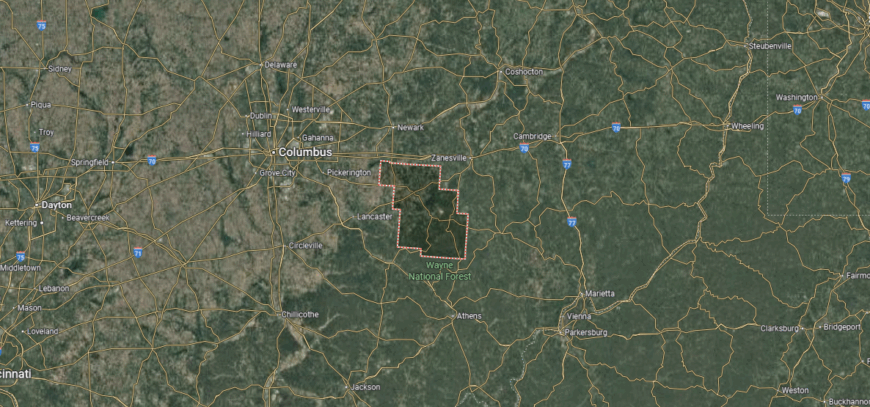
#18. Hocking County (tie)
– Life expectancy: 73.8 years
— 1.8 years lower than the state average

About
Hocking County is defined by its rugged hills, caves, and forests, forming one of Ohio’s most scenic landscapes. Tourism fuels much of the economy, with visitors drawn to Hocking Hills State Park alongside local hospitality and small businesses. Agriculture and light manufacturing also play a role in supporting the county’s residents.
Logan, the county seat, provides schools, healthcare, and community services while serving as a gateway to the parklands. Residents enjoy trails, waterfalls, and festivals that celebrate the area’s natural setting. With its blend of outdoor recreation, rural work, and a strong tourism base, Hocking County thrives on both land and community.
Where is Hocking County?
Hocking County is found in southeastern Ohio, about 50 miles southeast of Columbus and 30 miles northwest of Athens. It sits in the heart of the Hocking Hills, a region known for sandstone cliffs, deep gorges, and dense forests that define the Appalachian foothills.
U.S. Route 33 runs diagonally through the county, connecting it to Columbus and Athens, while State Routes 56 and 93 weave through its valleys and small towns. Its location places it within easy reach of central Ohio, yet firmly rooted in one of the state’s most scenic and rugged landscapes.
#17. Montgomery County
– Life expectancy: 73.7 years
— 1.9 years lower than the state average
About
Montgomery County thrives on the strength of its communities, where education, healthcare, and cultural life connect residents across the region. Dayton, the county seat, anchors the area with universities, hospitals, and a history of innovation that continues to shape its identity. Suburbs like Kettering, Centerville, and Vandalia add schools, parks, and neighborhood ties that sustain family life.
The economy blends aerospace, healthcare, logistics, and advanced manufacturing, giving the county a broad base of opportunity. Residents enjoy performing arts venues, museums, and expansive park systems that highlight both culture and recreation. With its mix of strong industries and community traditions, Montgomery County remains a key hub in southwest Ohio.
Where is Montgomery County?
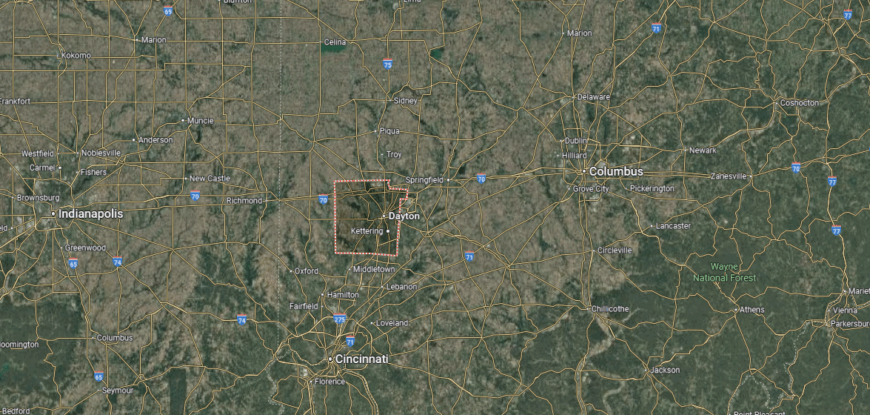
Montgomery County sits in southwestern Ohio, anchored by the city of Dayton at its center. It lies about 55 miles west of Columbus and 50 miles north of Cincinnati, placing it squarely in the Miami Valley along the Great Miami River.
Interstate 70 runs east–west across the northern edge, while Interstate 75 cuts north–south through Dayton, making the county one of the state’s key transportation crossroads. Its location ties it closely to both central and southern Ohio, while also positioning it as a gateway to Indiana just a short drive west.
#16. Clinton County
– Life expectancy: 73.6 years
— 2.0 years lower than the state average

About
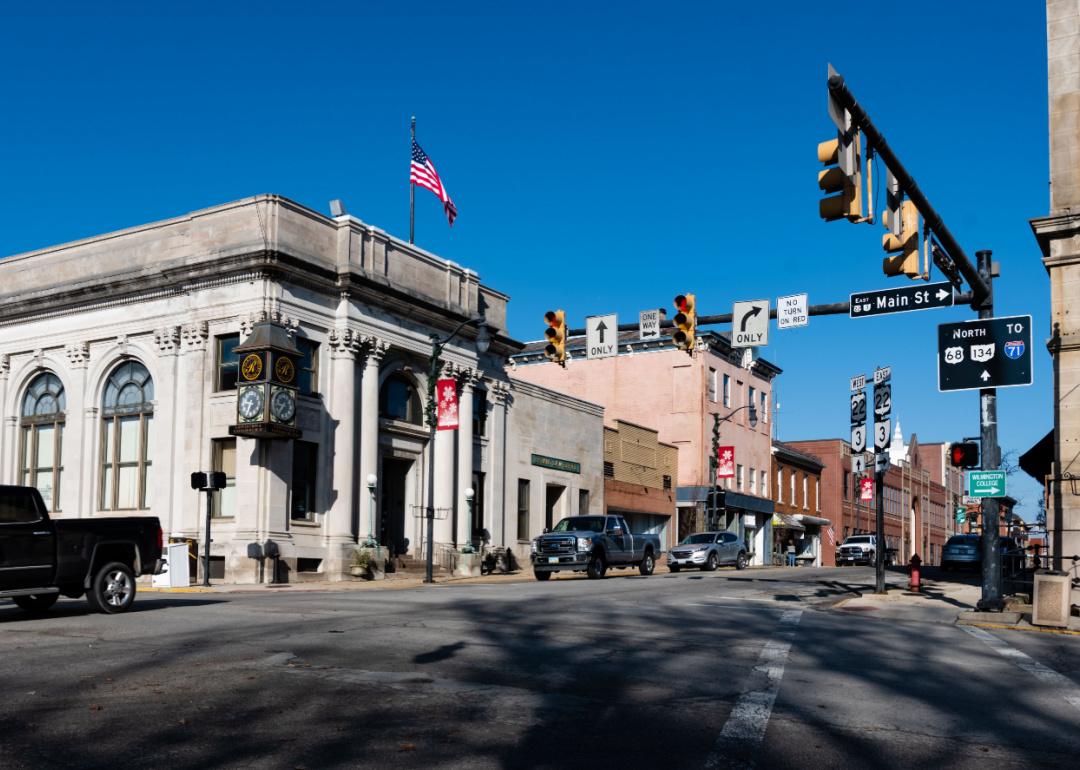
Clinton County welcomes visitors with events like the Clinton County Fair and attractions that highlight its agricultural roots. Wilmington, the county seat, serves as a hub for both travel and commerce, with a regional airport and downtown venues that bring people together. Smaller towns such as Blanchester, Sabina, and New Vienna contribute festivals, schools, and community traditions.
The economy is anchored by farming, food production, and logistics, supported by retail and local services. Parks, fairgrounds, and trails give residents and visitors alike opportunities to enjoy the landscape. By combining steady industries with tourism and cultural events, Clinton County maintains both vibrancy and small-town appeal.
Where is Clinton County?
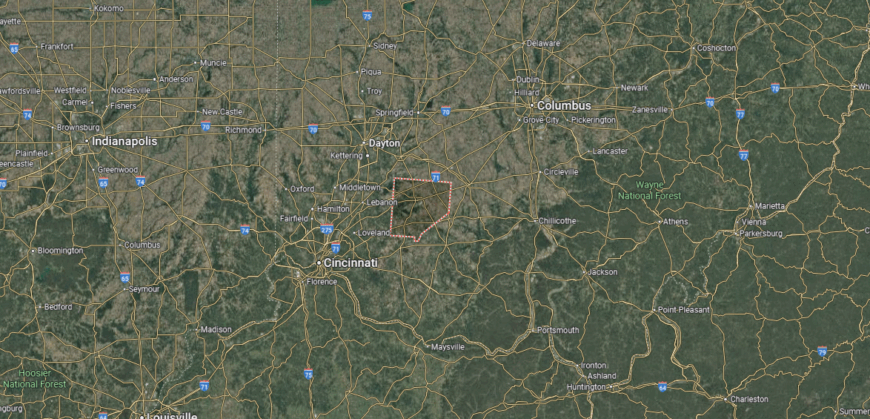
Clinton County is located in southwest Ohio, about 40 miles northeast of Cincinnati and 35 miles southeast of Dayton. It sits between the Little Miami River valley and the rolling farmland that stretches toward central Ohio, giving it both rural character and regional connectivity.
Interstate 71 passes through the county, linking it directly to Columbus and Cincinnati, while U.S. Routes 22 and 68 cross through Wilmington, the county seat. Its position places it at the midpoint of two major cities, making it a natural junction in Ohio’s southwestern corridor.
#14. Hardin County (tie)
– Life expectancy: 73.4 years
— 2.2 years lower than the state average
About
Hardin County’s economy is rooted in agriculture, with corn and soybean production defining much of its land use. Manufacturing, education, and healthcare add stability, while Ohio Northern University in Ada provides both jobs and cultural presence. Kenton, the county seat, anchors this activity with government, retail, and community services.
Beyond Kenton, towns like Ada, Forest, and Dunkirk bring their own traditions through schools, festivals, and local businesses. Residents enjoy parks, reservoirs, and outdoor recreation that highlight the county’s rural setting. With farming at its base and institutions providing balance, Hardin County blends industry, education, and community life.
Where is Hardin County?
Hardin County is set in west-central Ohio, about 65 miles northwest of Columbus and 70 miles south of Toledo. It sits within the state’s agricultural belt, where flat farmland spreads around the county seat of Kenton.
U.S. Route 68 provides the main north–south connection, while State Routes 31 and 309 link it east–west to nearby regions. Its location keeps it firmly tied to Ohio’s farming landscape while still within reach of the state’s larger urban centers.
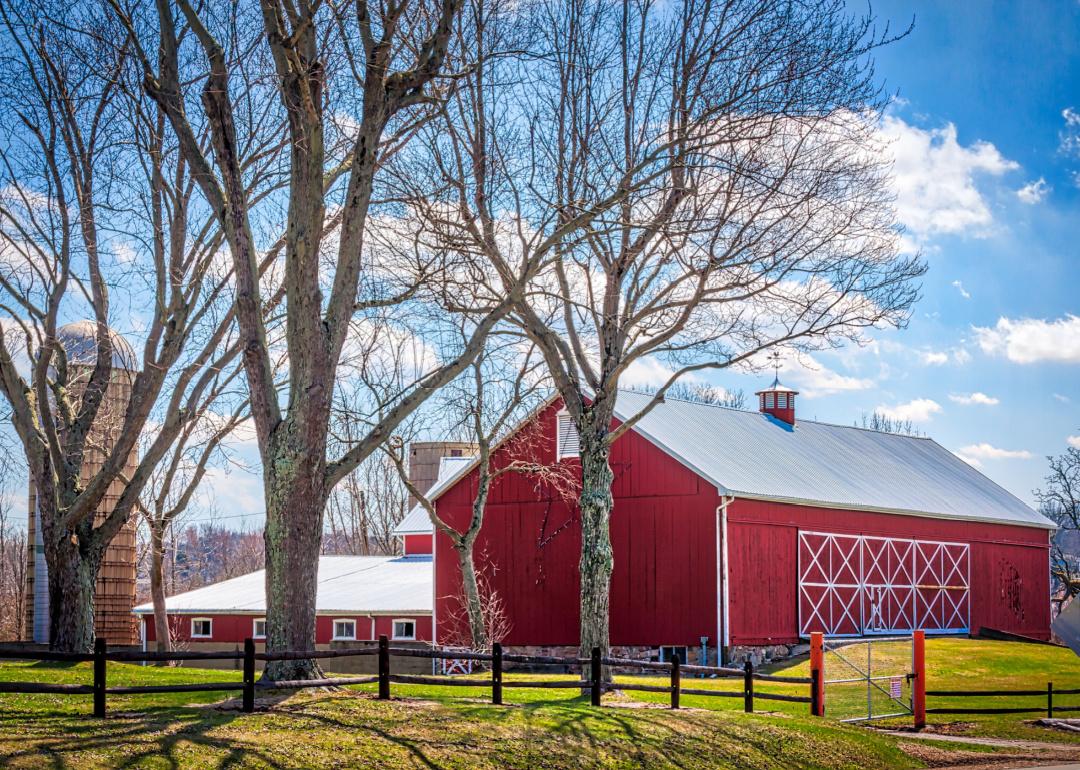
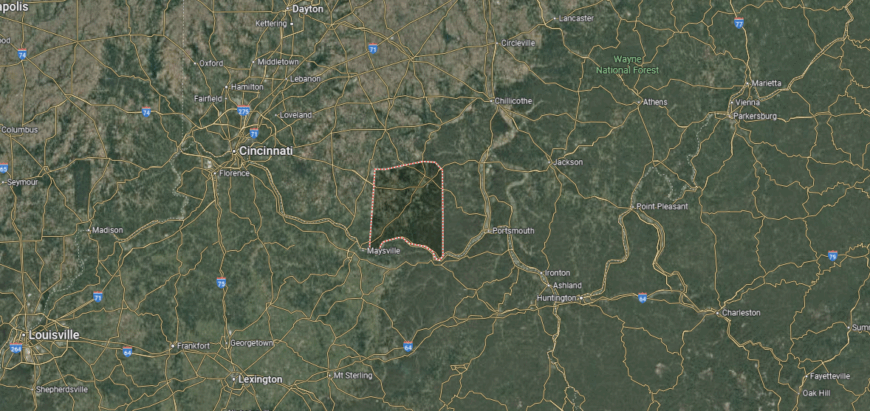
#14. Brown County (tie)
– Life expectancy: 73.4 years
— 2.2 years lower than the state average
You may also like: How many people are receiving substance use treatment in Ohio
About
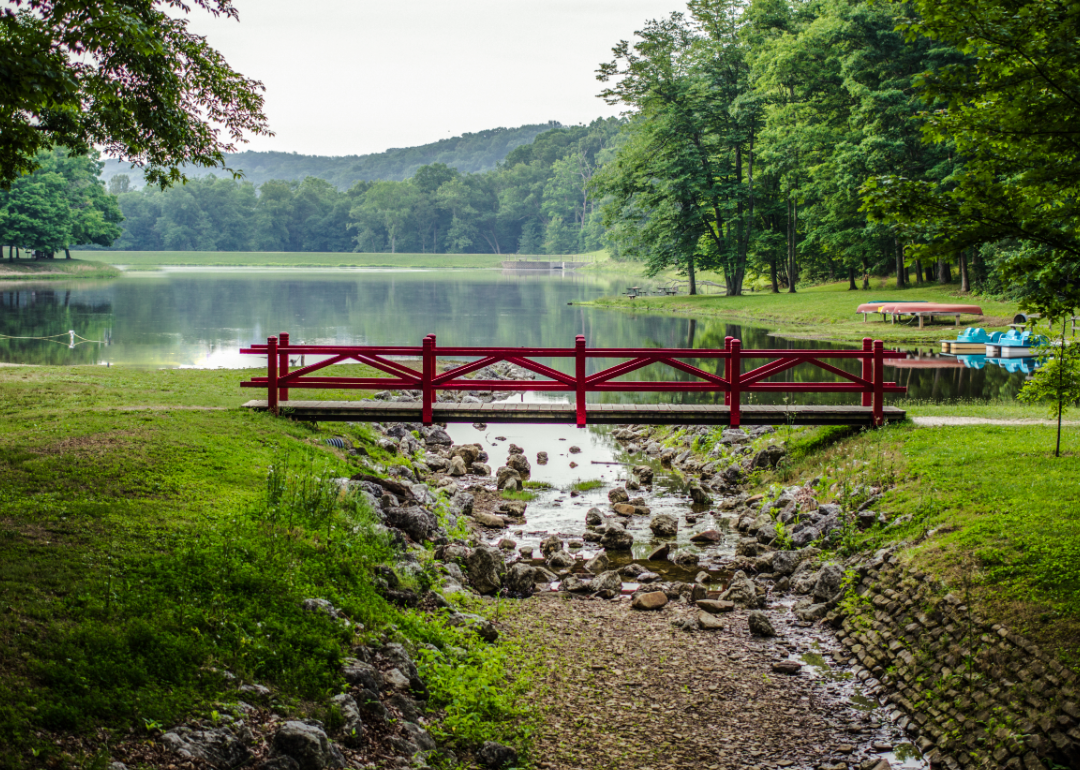
In Brown County, mornings begin with sunlight over wide fields and the Ohio River winding past quiet towns. Farming has long been the backbone of the economy, while small manufacturing, healthcare, and local businesses provide steady support. Communities like Georgetown, Mount Orab, and Ripley add their own character through schools, markets, and festivals.
Georgetown, the county seat, connects residents with hospitals, schools, and government services. Life along the river and in the countryside offers fishing, boating, and trails that shape daily routines. Blending agriculture, community traditions, and scenic landscapes, Brown County moves at a pace rooted in both work and heritage.
Where is Brown County?
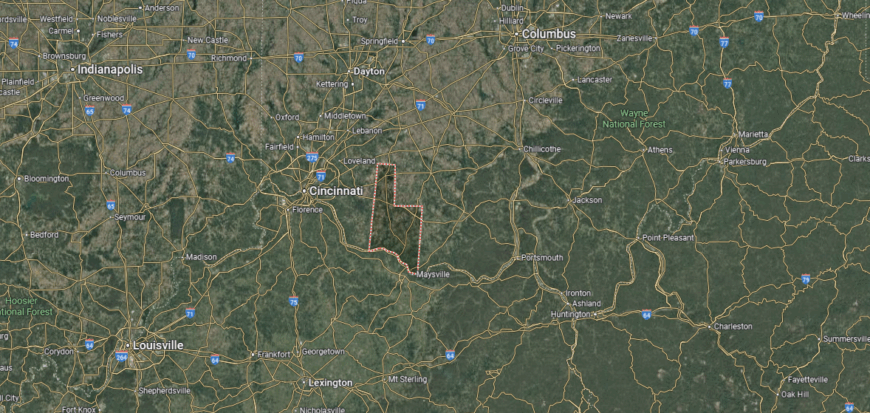
Brown County is positioned in southern Ohio along the Ohio River, directly across from northern Kentucky. It lies about 45 miles southeast of Cincinnati and 25 miles west of Portsmouth, giving it a riverfront setting with quick access to both urban and rural regions.
U.S. Route 52 follows the river through the county, while U.S. Route 68 runs north–south, connecting the interior towns to the river corridor. Its location along the Ohio River makes it both a gateway to Kentucky and a link between the Appalachian foothills and southwest Ohio.
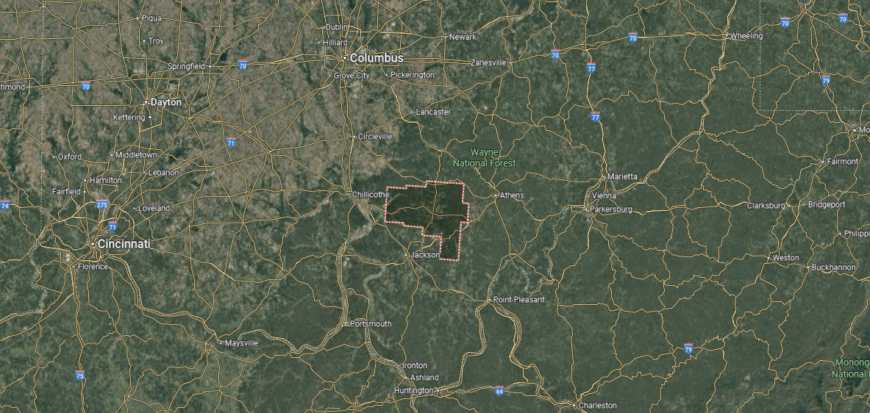
#12. Ross County (tie)
– Life expectancy: 73.2 years
— 2.4 years lower than the state average
About
Ross County is anchored by Chillicothe, the county seat and Ohio’s first state capital. The economy is supported by healthcare, manufacturing, education, and government services, with agriculture still important across rural areas. Other communities such as Frankfort, Kingston, and Bainbridge add local schools, small businesses, and community life.
Chillicothe provides hospitals, colleges, and cultural institutions that serve the wider region. Residents enjoy Hopewell Culture National Historical Park, outdoor recreation areas, and seasonal festivals. With its mix of history, industry, and natural resources, Ross County remains a key hub in southern Ohio.
Where is Ross County?
Ross County lies in south-central Ohio, with Chillicothe as its county seat and largest city. It sits about 50 miles south of Columbus and 45 miles north of Portsmouth, resting squarely along the Scioto River valley.
U.S. Route 23 provides the main north–south corridor through the county, while U.S. Route 35 connects it east–west. Its location places it at a historic and geographic crossroads in Ohio, bridging the state’s central farmlands with the rolling hills of southern Ohio.
#12. Guernsey County (tie)
– Life expectancy: 73.2 years
— 2.4 years lower than the state average
About
Guernsey County carries a strong historic identity, with Cambridge known for its glassmaking legacy and role as a stop along early transportation routes. The economy today blends manufacturing, energy development, and healthcare, while agriculture continues to shape the rural landscape. Towns like Byesville and Senecaville contribute schools, businesses, and traditions that connect residents.
Cambridge, the county seat, provides hospitals, cultural venues, and government services for the region. Recreation thrives at Seneca Lake and Salt Fork State Park, where boating, camping, and trails attract both locals and visitors. With its blend of history, industry, and outdoor opportunity, Guernsey County balances tradition with growth.
Where is Guernsey County?
Guernsey County is located in east-central Ohio, about 80 miles east of Columbus and 25 miles west of Wheeling, West Virginia. It sits within the Appalachian Plateau, with Cambridge as its county seat at the junction of several historic travel routes.
Interstate 70 and Interstate 77 intersect in Cambridge, making the county one of the state’s key crossroads for regional travel. Its location ties it to both central Ohio and the Ohio Valley, while the surrounding hills and valleys keep it rooted in a distinctly Appalachian setting.
#10. Fayette County (tie)
– Life expectancy: 72.9 years
— 2.7 years lower than the state average
About
Life in Fayette County revolves around its close-knit communities, where schools, churches, and local events bring neighbors together year-round. Washington Court House, the county seat, serves as the center for education, healthcare, and shopping while anchoring the county’s civic life. Villages like Jeffersonville, Bloomingburg, and New Holland add their own traditions through festivals and small-town pride.
Agriculture is the foundation of the economy, supported by logistics, retail, and manufacturing that connect the county to regional markets. Residents enjoy parks, fairgrounds, and open farmland that provide both recreation and identity. With strong community ties and steady industries, Fayette County maintains a balance of tradition and opportunity.
Where is Fayette County?
Fayette County sits in south-central Ohio, about 45 miles southwest of Columbus and 55 miles northeast of Cincinnati. It rests in a wide stretch of flat farmland, with Washington Court House at its center serving as the county seat.
U.S. Route 35 and U.S. Route 62 run directly through the county, while Interstate 71 crosses its eastern edge, linking it quickly to Ohio’s largest cities. Its location makes it a natural midpoint between Columbus and Cincinnati, firmly grounded in the agricultural heart of the state.
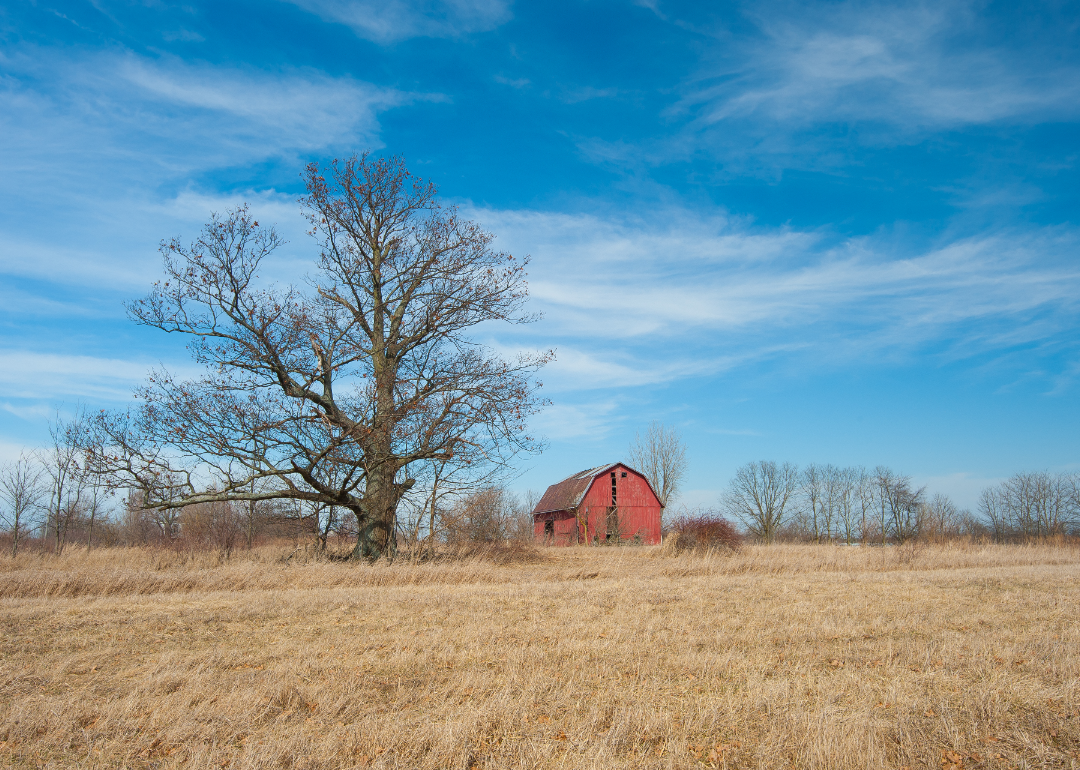
#10. Clark County (tie)
– Life expectancy: 72.9 years
— 2.7 years lower than the state average
About
Clark County lies between Dayton and Columbus, with open farmland, rivers, and parks shaping both its landscape and identity. Agriculture remains a key part of the economy, joined by strong sectors in manufacturing, healthcare, and education. Springfield, the county seat, provides schools, hospitals, and cultural venues that anchor the wider region.
Residents enjoy Buck Creek State Park, bike trails, and historic districts that highlight both natural beauty and heritage. Surrounding communities like New Carlisle, Enon, and South Charleston add schools, small businesses, and local traditions. With its mix of fertile land, industries, and accessible location, Clark County connects rural life with regional opportunity.
Where is Clark County?
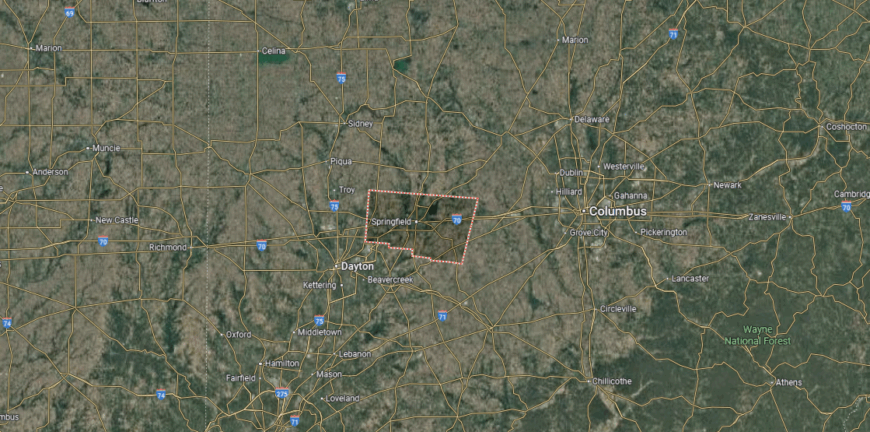
Clark County is located in west-central Ohio, with Springfield as its county seat. It lies about 25 miles northeast of Dayton and 45 miles west of Columbus, placing it squarely between two of the state’s major cities.
Interstate 70 runs east–west through the county, while U.S. Route 68 provides a north–south connection. Its position makes it both a transportation hub and a transitional space between Ohio’s Miami Valley and the rolling farmland of central Ohio.
#9. Meigs County
– Life expectancy: 72.7 years
— 2.9 years lower than the state average
You may also like: Counties with the highest rates of strokes in Ohio
About
Meigs County is known for its traditions and gatherings, from county fairs to music events that bring neighbors together. The local economy leans on farming, small manufacturing, and natural gas development, with river trade adding to its foundation. Pomeroy, the county seat along the Ohio River, anchors civic life with schools, healthcare, and local businesses.
Residents enjoy fishing, boating, and scenic drives that highlight the county’s hills and waterways. Villages such as Middleport, Rutland, and Racine carry their own community pride through festivals, markets, and schools. With its blend of culture, natural resources, and small-town ties, Meigs County keeps both heritage and opportunity at the center of daily life.
Where is Meigs County?
Meigs County rests in southeastern Ohio along the Ohio River, directly across from West Virginia. It sits about 30 miles southeast of Athens and roughly 100 miles southeast of Columbus, placing it deep in the Appalachian foothills.
U.S. Route 33 runs along the northern part of the county, while State Routes 7 and 124 trace the river’s edge and connect its small towns. Its location along the Ohio River gives it a strong river valley identity while remaining tied to the rugged, rural hills of southern Ohio.
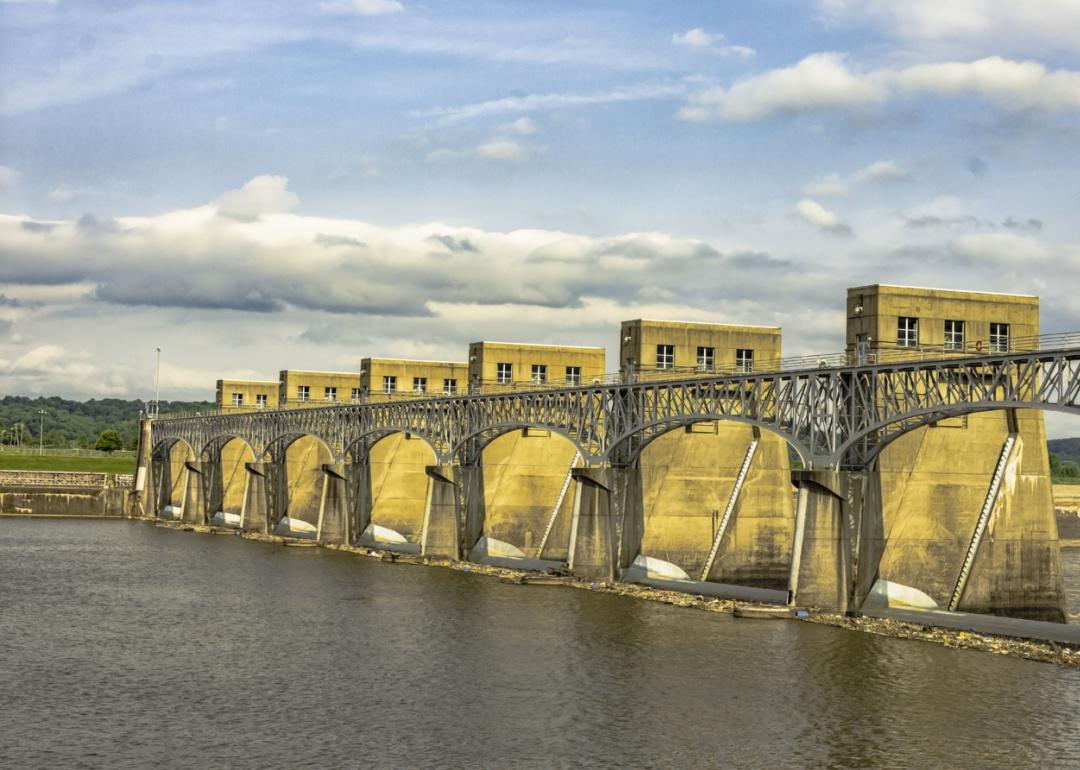
#7. Gallia County (tie)
– Life expectancy: 72.6 years
— 3.0 years lower than the state average
About
Gallia County traces its roots to early French settlers who founded Gallipolis in the late 1700s, leaving a lasting cultural imprint on the region. The economy has shifted from river trade and farming to a mix of healthcare, education, manufacturing, and agriculture that still defines much of the countryside. Villages like Rio Grande, Crown City, and Cheshire add their own contributions through schools, festivals, and community life.
Gallipolis, the county seat along the Ohio River, anchors the area with hospitals, colleges, and cultural venues. Residents enjoy parks, riverfront trails, and historic landmarks that tie the present to the past. With its blend of heritage, industry, and scenic setting, Gallia County continues to balance tradition with steady growth.
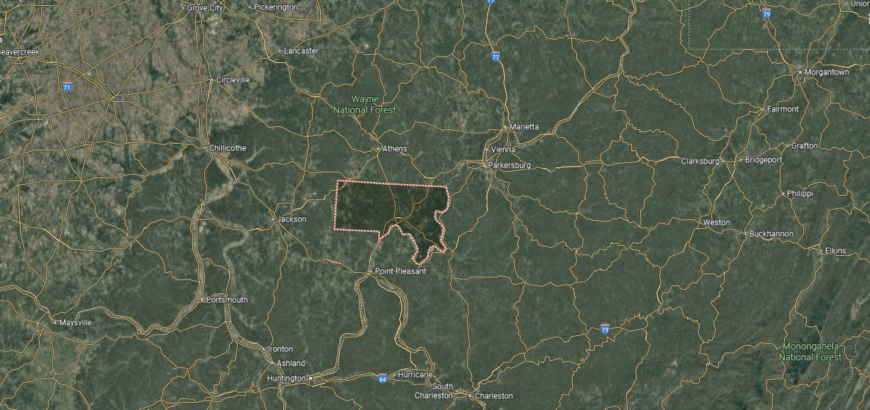
Where is Gallia County?
Gallia County is positioned in southeastern Ohio along the Ohio River, across from West Virginia. It lies about 30 miles south of Athens and 65 miles southeast of Chillicothe, anchoring a stretch of river valley framed by wooded hills.
U.S. Route 35 provides the main east–west corridor, linking the county to both Charleston, West Virginia, and Dayton, Ohio. State Route 7 parallels the river, tying together its towns, while the broader landscape highlights its place at the meeting point of river country and Appalachian foothills.
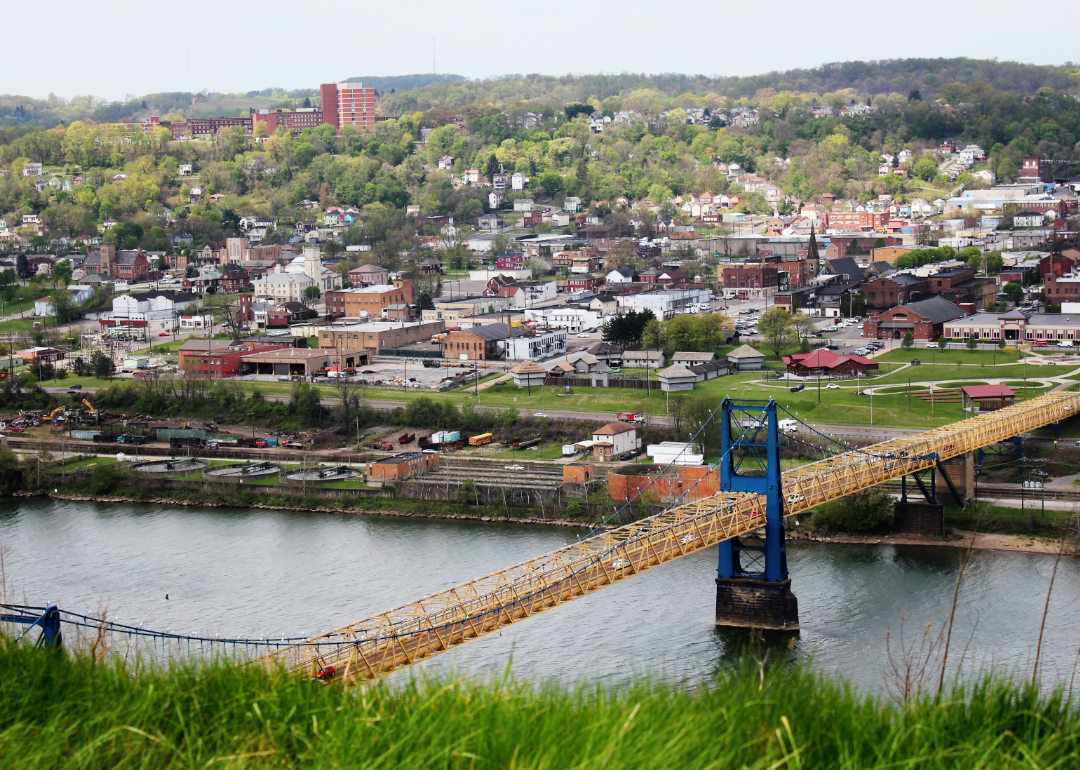
#7. Jefferson County (tie)
– Life expectancy: 72.6 years
— 3.0 years lower than the state average
About
Jefferson County stretches along the Ohio River, where residents enjoy riverfront views, boating, and parks set against rolling Appalachian foothills. The economy is anchored by energy, manufacturing, and healthcare, while agriculture remains part of the rural townships. Steubenville, the county seat, is joined by communities like Toronto, Wintersville, and Mingo Junction, each contributing schools, businesses, and traditions.
Steubenville stands out for its murals, festivals, and Franciscan University, tying education and culture into daily life. Residents balance work with recreation at nearby trails, historic sites, and community events. With its mix of industry, outdoor activity, and strong civic identity, Jefferson County blends opportunity with a landscape that shapes its rhythm of life.
Where is Jefferson County?
Jefferson County is situated in eastern Ohio along the Ohio River, directly across from West Virginia. It lies about 40 miles west of Pittsburgh and 30 miles south of Youngstown, giving it a prime spot in the upper Ohio Valley.
U.S. Route 22 and State Route 7 serve as the county’s main corridors, with the river guiding much of its travel and settlement. Its location places it firmly in the Ohio Valley’s industrial and riverfront belt, while the hills rising beyond the river towns tie it to the Appalachian Plateau.
#6. Adams County
– Life expectancy: 71.4 years
— 4.2 years lower than the state average
About
Adams County’s economy is driven by agriculture, with tobacco, corn, and livestock long shaping its rural identity. Small manufacturing, healthcare, and retail add balance, while tourism tied to nature preserves and historic sites continues to grow. West Union, the county seat, provides schools, hospitals, and government services for the region.
Residents enjoy the Edge of Appalachia Preserve, hiking trails, and scenic drives through the county’s hills and valleys. Towns such as Peebles, Manchester, and Seaman contribute their own character through schools, fairs, and community traditions. With farming at its core and natural beauty drawing visitors, Adams County blends work and heritage in equal measure.
Where is Adams County?
Adams County sits in the far southern edge of Ohio along the Ohio River, directly across from Kentucky. It lies about 60 miles southeast of Cincinnati and 75 miles west of Portsmouth, set within the rolling terrain of the Appalachian foothills.
U.S. Route 52 follows the river’s path through the county, while State Routes 32 and 41 cut across its interior, linking rural towns to the broader region. Its riverfront location and hilly landscape place it in one of Ohio’s more rugged corners, where the state meets the Kentucky border.
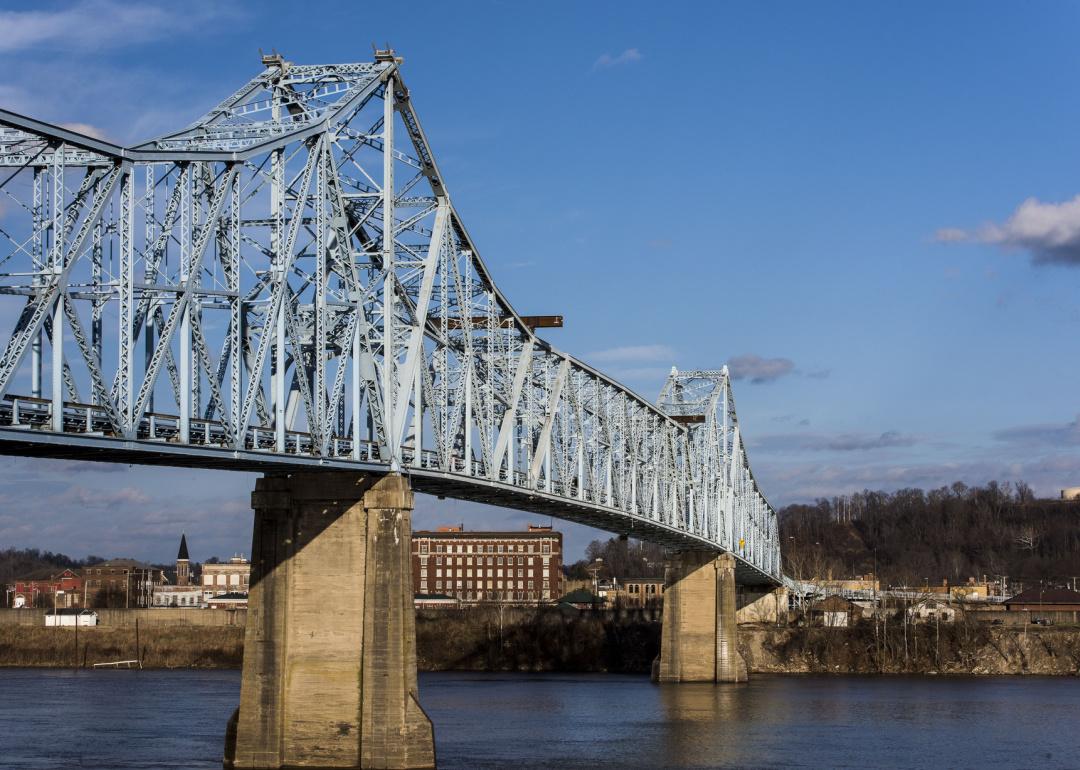
#5. Jackson County
– Life expectancy: 71.3 years
— 4.3 years lower than the state average
About
In Jackson County, the day might begin with the sight of rolling hills dotted with farms and end with gatherings at local festivals or high school games. The economy has roots in mining and brickmaking, but today it rests on manufacturing, healthcare, farming, and retail that support the community. Jackson, the county seat, along with Wellston and Oak Hill, give rhythm to life through schools, traditions, and small-town businesses.
Residents enjoy Lake Katharine State Nature Preserve, parks, and trails that bring nature into daily routines. Festivals like the Jackson County Apple Festival highlight local pride and draw visitors each year. By combining industry, tradition, and outdoor life, Jackson County offers both steady opportunity and a strong community spirit.
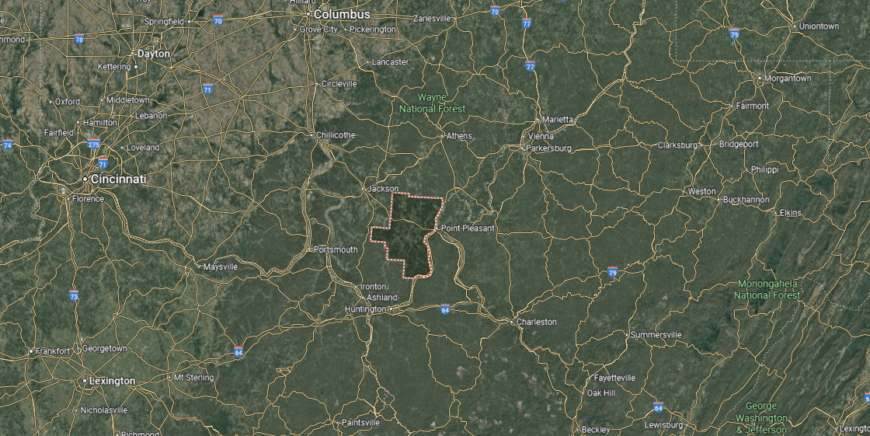
Where is Jackson County?
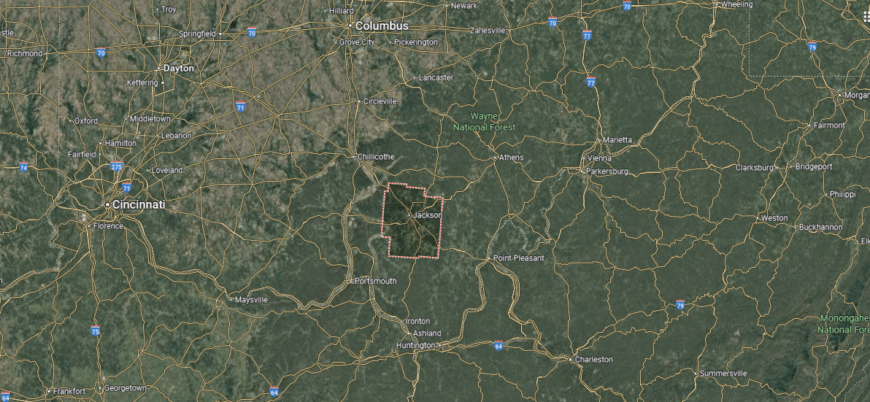
Jackson County is located in southern Ohio, about 30 miles southeast of Chillicothe and 30 miles west of Athens. It lies within the Appalachian foothills, where wooded ridges and narrow valleys shape much of the landscape.
U.S. Routes 35 and 50 provide the main highways through the county, connecting it westward toward Chillicothe and eastward toward Athens and beyond. Its position gives it both accessibility to regional hubs and the character of a more secluded, hill-country setting.
#4. Lawrence County
– Life expectancy: 71.0 years
— 4.6 years lower than the state average
You may also like: Metros in Ohio that are best for nurses
About
Lawrence County is Ohio’s southernmost county, anchored by Ironton along the Ohio River. The economy is supported by healthcare, education, and retail, with manufacturing and river trade adding to its base. Other communities like South Point, Chesapeake, and Proctorville provide schools, businesses, and neighborhood life.
Ironton serves as the hub for hospitals, colleges, and government services. Residents enjoy riverfront parks, trails, and events such as the annual Memorial Day Parade, one of the oldest in the nation. With its mix of industries, traditions, and location on the river, Lawrence County connects local life with regional opportunity.
Where is Lawrence County?
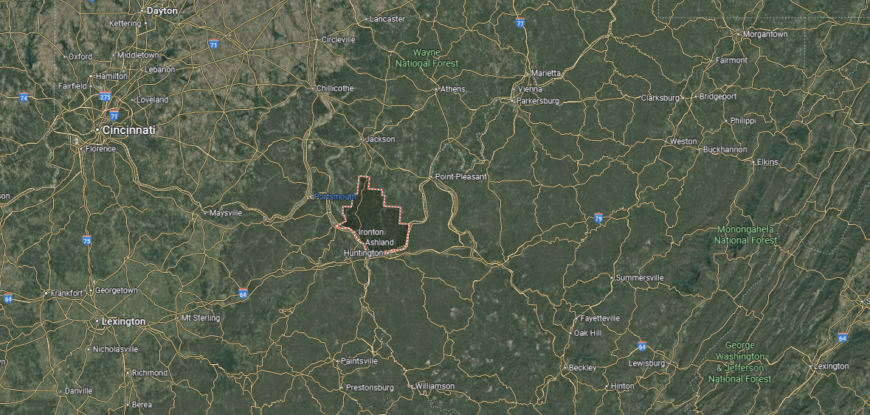
Lawrence County anchors the southern tip of Ohio, where the state meets both Kentucky and West Virginia along the Ohio River. It lies about 30 miles southeast of Portsmouth and directly across the river from Huntington, West Virginia, with Ironton serving as the county seat.
U.S. Route 52 runs the length of the county beside the river, while State Routes 7 and 93 extend north through the hills toward central Ohio. Its position at the tri-state border makes it a gateway between Appalachia and the Ohio River Valley, firmly tying it to the crossroads of three states.
#3. Vinton County
– Life expectancy: 70.9 years
— 4.7 years lower than the state average

About
Vinton County, the least populated in Ohio, is rooted in a history of small farming communities and early industries tied to timber and mining. Today, the economy leans on agriculture, tourism, and local services, with residents valuing the county’s quiet pace of life. McArthur, the county seat, provides schools, government, and healthcare as the center of activity.
Heritage festivals, historic landmarks, and family traditions shape community identity across its villages. Residents and visitors enjoy Zaleski State Forest and Lake Hope State Park, where trails, camping, and fishing highlight the natural setting. With its blend of history, rural life, and outdoor recreation, Vinton County offers both resilience and retreat.
Where is Vinton County?
Vinton County is set in southeastern Ohio, about 65 miles southeast of Columbus and 30 miles southwest of Athens. It is Ohio’s least populated county, known for its vast stretches of forest, rolling hills, and secluded valleys within the Appalachian foothills.
State Routes 32, 93, and 160 form the main travel corridors, linking its small towns and parklands to neighboring regions. Its location places it off the state’s busiest highways, giving it a remote character while still within reach of central and southern Ohio.
#2. Pike County
– Life expectancy: 70.6 years
— 5.0 years lower than the state average
About
Pike County is best known for its traditions, from county fairs to seasonal festivals that bring residents together. The economy is supported by agriculture, energy, and manufacturing, with small businesses and services anchoring community life. Waverly, the county seat, provides schools, healthcare, and government functions for the region.
Residents enjoy Shawnee State Forest, hiking trails, and fishing spots that highlight the county’s natural beauty. Towns like Piketon, Beaver, and Jasper contribute schools, markets, and local gatherings that build strong ties. With culture at its heart and industries providing stability, Pike County maintains a steady balance between work and community pride.
Where is Pike County?
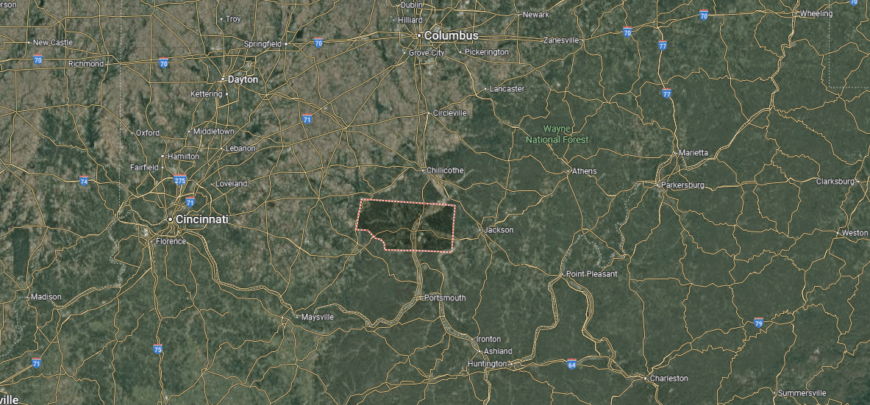
Pike County lies in south-central Ohio, about 70 miles south of Columbus and 25 miles north of Portsmouth. It rests along the Scioto River valley, surrounded by rolling hills that mark the edge of the Appalachian region.
U.S. Route 23 provides the main north–south connection through the county, linking it directly to Columbus and the Ohio River. Smaller highways like State Routes 32 and 124 branch out across the hills, tying its rural communities to the broader region.
#1. Scioto County
– Life expectancy: 69.7 years
— 5.9 years lower than the state average

About
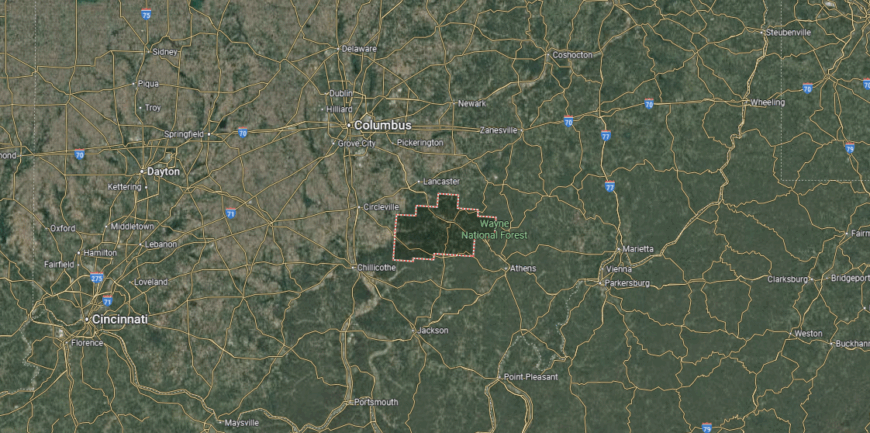
Scioto County sits along the Ohio River in the state’s southern region, framed by rolling hills and the edge of the Wayne National Forest. Its economy draws from healthcare, manufacturing, and education, while agriculture and river transport remain part of the local base. Portsmouth, the county seat, anchors services with hospitals, schools, and cultural institutions.
Outdoor life centers on riverfront parks, hiking trails, and access to Shawnee State Park, known as Ohio’s “Little Smokies.” Communities such as Wheelersburg, New Boston, and South Webster add local businesses and traditions that tie residents together. With its river setting, industrial presence, and recreational spaces, Scioto County connects natural landscapes with everyday community life.
Where is Scioto County?
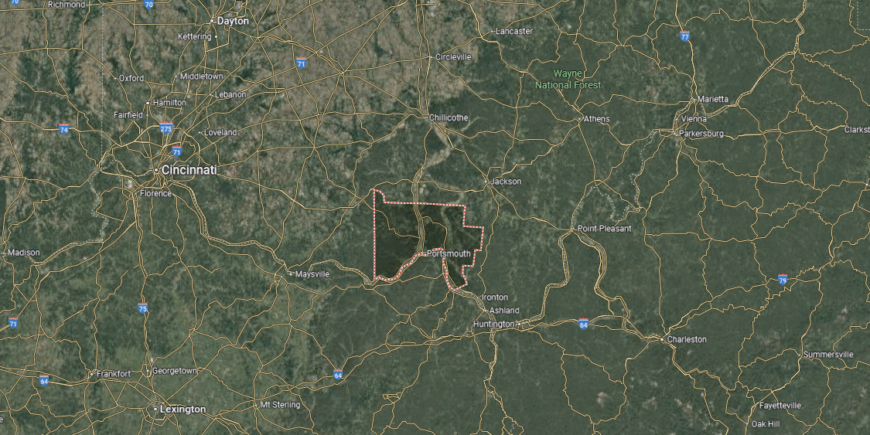
Scioto County is located in southern Ohio along the Ohio River, directly across from Kentucky. The county seat, Portsmouth, sits where the Scioto River meets the Ohio, about 90 miles south of Columbus and 90 miles east of Cincinnati.
U.S. Route 23 runs north–south through the county, while U.S. Route 52 follows the Ohio River, connecting communities along the waterfront. Its position on the river and at the edge of the Appalachian foothills makes it a key gateway between central Ohio, Kentucky, and West Virginia.
This story features data reporting by Karim Noorani, writing by Kiersten Hickman, and is part of a series utilizing data automation across 49 states.
By Stacker