🔥 Would you like to save this?
The Zillow Home Value Index shows a surprising side of Missouri in 2025: some towns aren’t just pricey—they’re climbing fast. While the state is still known for budget-friendly living, these 18 communities have broken away from the pack, with home values well above the state average.
From waterfront escapes to upscale suburbs near St. Louis and Kansas City, these towns combine location, charm, and long-term growth. Whether prices rose steadily or spiked post-pandemic, each place on this list reflects what Missouri’s most expensive markets look like today.
In order to come up with the very specific design ideas, we create most designs with the assistance of state-of-the-art AI interior design software. Also, assume links that take you off the site are affiliate links such as links to Amazon. this means we may earn a commission if you buy something.
18. Weatherby Lake – 124% Home Price Increase Since 2012
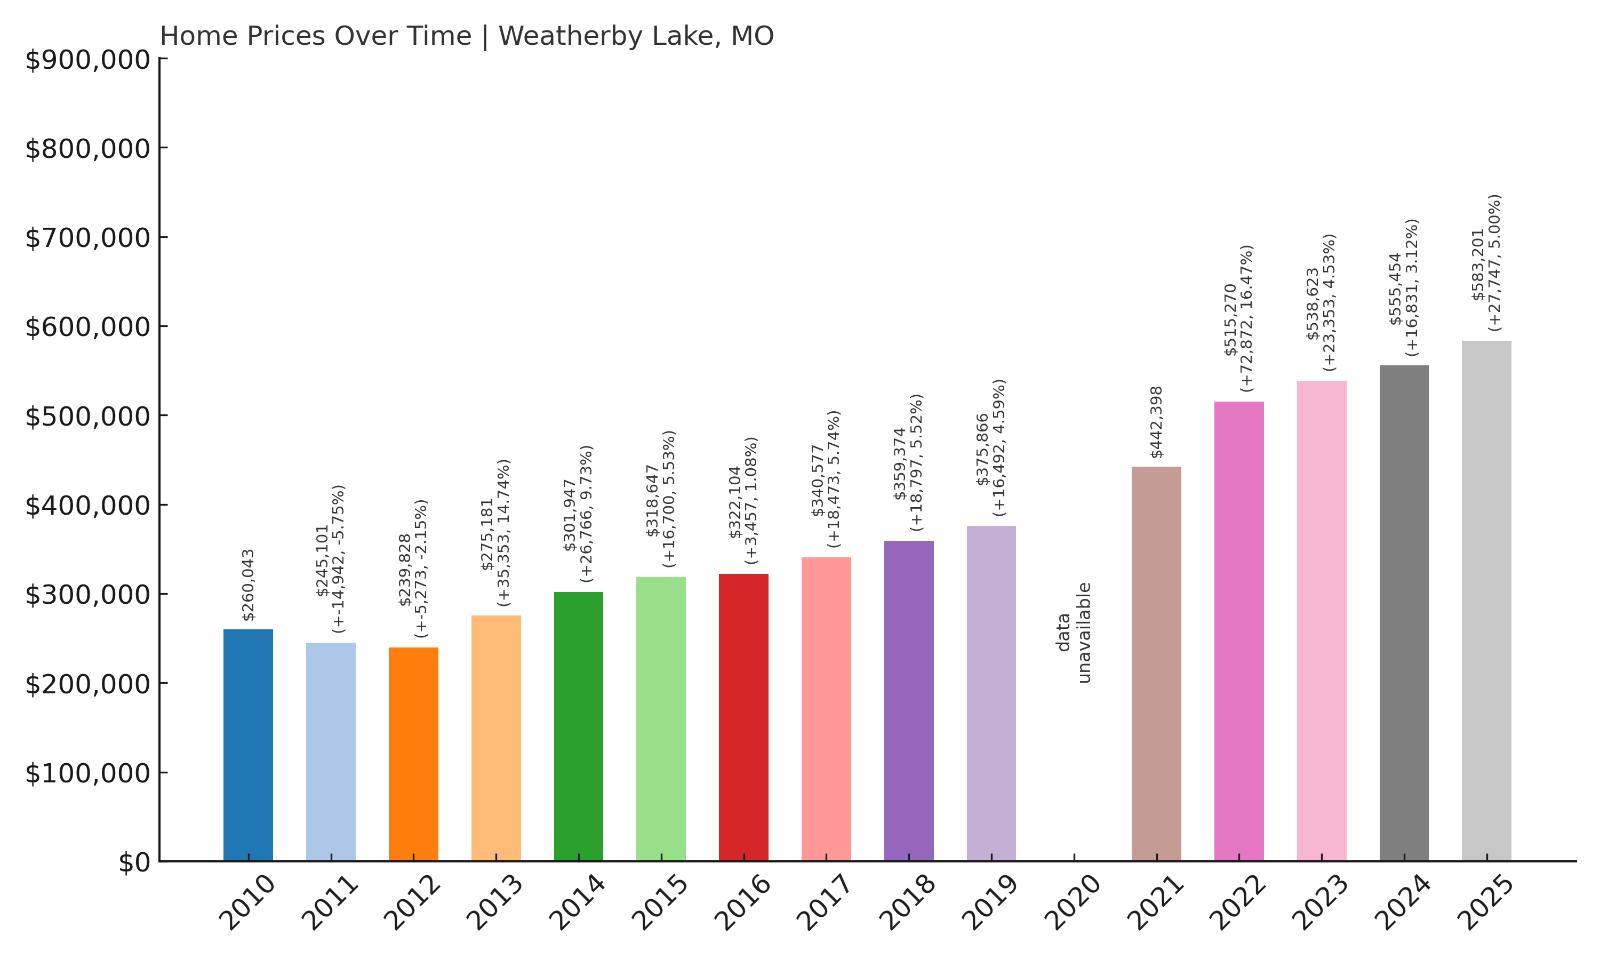
- 2010: $260,043
- 2011: $245,101 ($-14,942, -5.75% from previous year)
- 2012: $239,828 ($-5,273, -2.15% from previous year)
- 2013: $275,181 (+$35,353, +14.74% from previous year)
- 2014: $301,947 (+$26,766, +9.73% from previous year)
- 2015: $318,647 (+$16,700, +5.53% from previous year)
- 2016: $322,104 (+$3,457, +1.08% from previous year)
- 2017: $340,577 (+$18,473, +5.74% from previous year)
- 2018: $359,374 (+$18,797, +5.52% from previous year)
- 2019: $375,866 (+$16,493, +4.59% from previous year)
- 2020: N/A
- 2021: $442,398
- 2022: $515,270 (+$72,873, +16.47% from previous year)
- 2023: $538,623 (+$23,353, +4.53% from previous year)
- 2024: $555,454 (+$16,831, +3.12% from previous year)
- 2025: $583,201 (+$27,746, +5.00% from previous year)
Since 2012, home prices in Weatherby Lake have climbed from around $240K to over $583K in 2025—marking a steep 124% increase. The town experienced strong growth from 2013 onward, with a particularly sharp uptick post-2021, mirroring broader suburban demand trends. Even recent years have maintained steady gains, suggesting lasting buyer interest.
Weatherby Lake – Lakeside Living Close to Kansas City
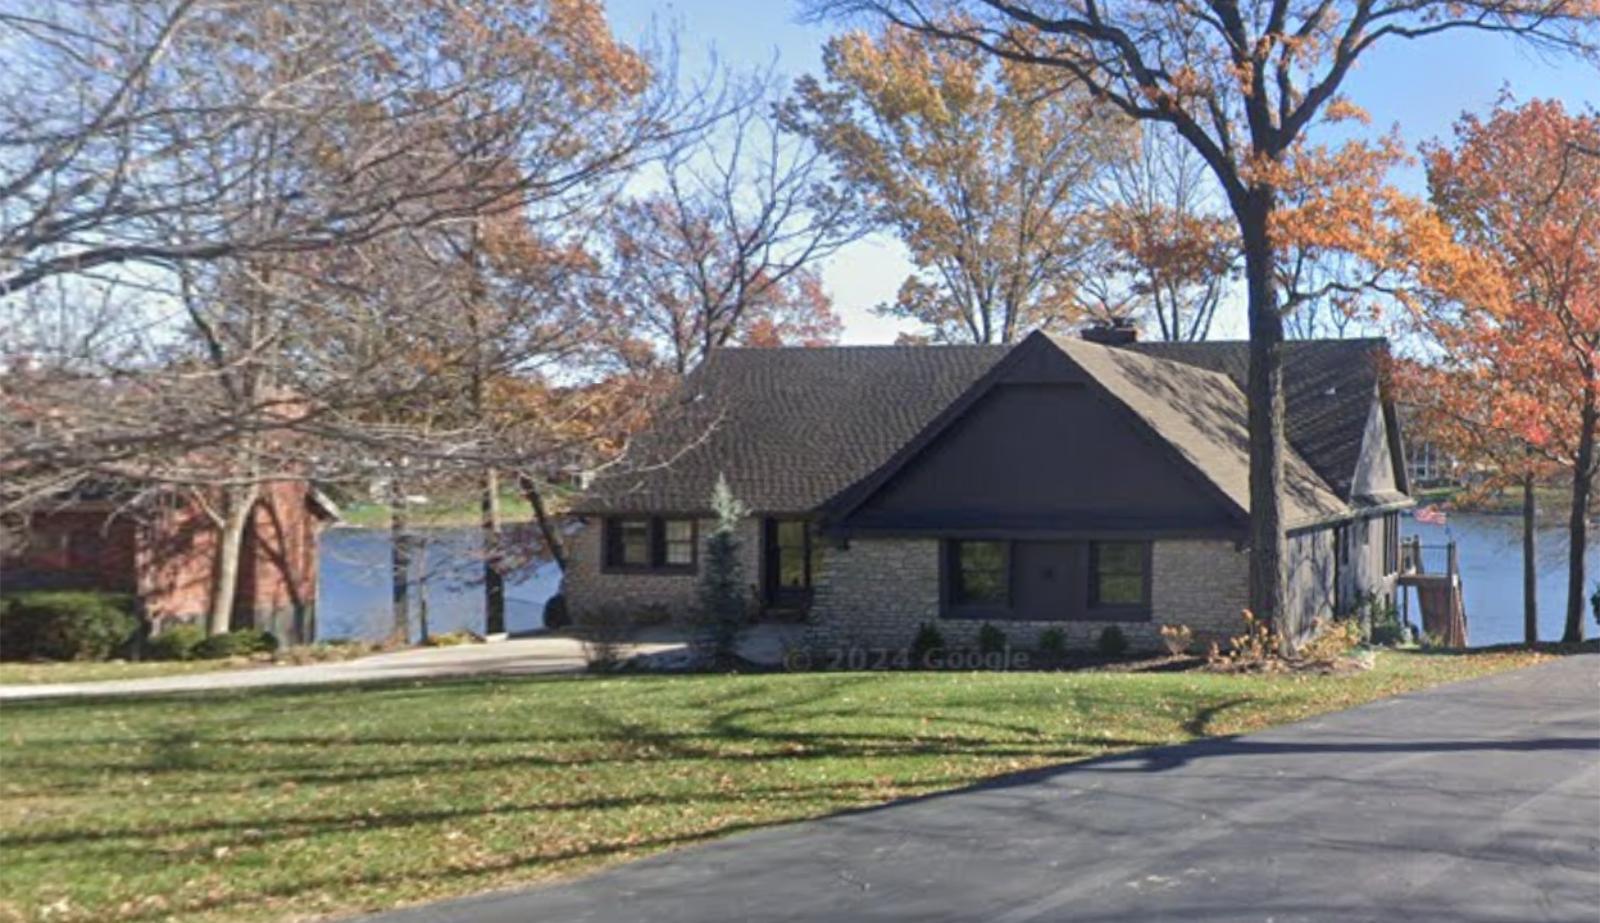
Nestled in Platte County, Weatherby Lake offers a unique mix of small-town calm and big-city convenience. The town centers around its namesake lake, a private body of water popular for boating, fishing, and peaceful views. With direct access to the Kansas City metro area just 20 minutes away, it’s a highly desirable option for professionals and retirees alike.
The steady appreciation in property values reflects the town’s limited housing stock and high quality of life. Homes here are spacious and well-kept, often with lake access or views, which commands premium pricing. As demand continues, Weatherby Lake remains one of Missouri’s standout examples of how natural amenities and metro proximity can shape long-term value.
17. Parkville – 91% Home Price Increase Since 2012
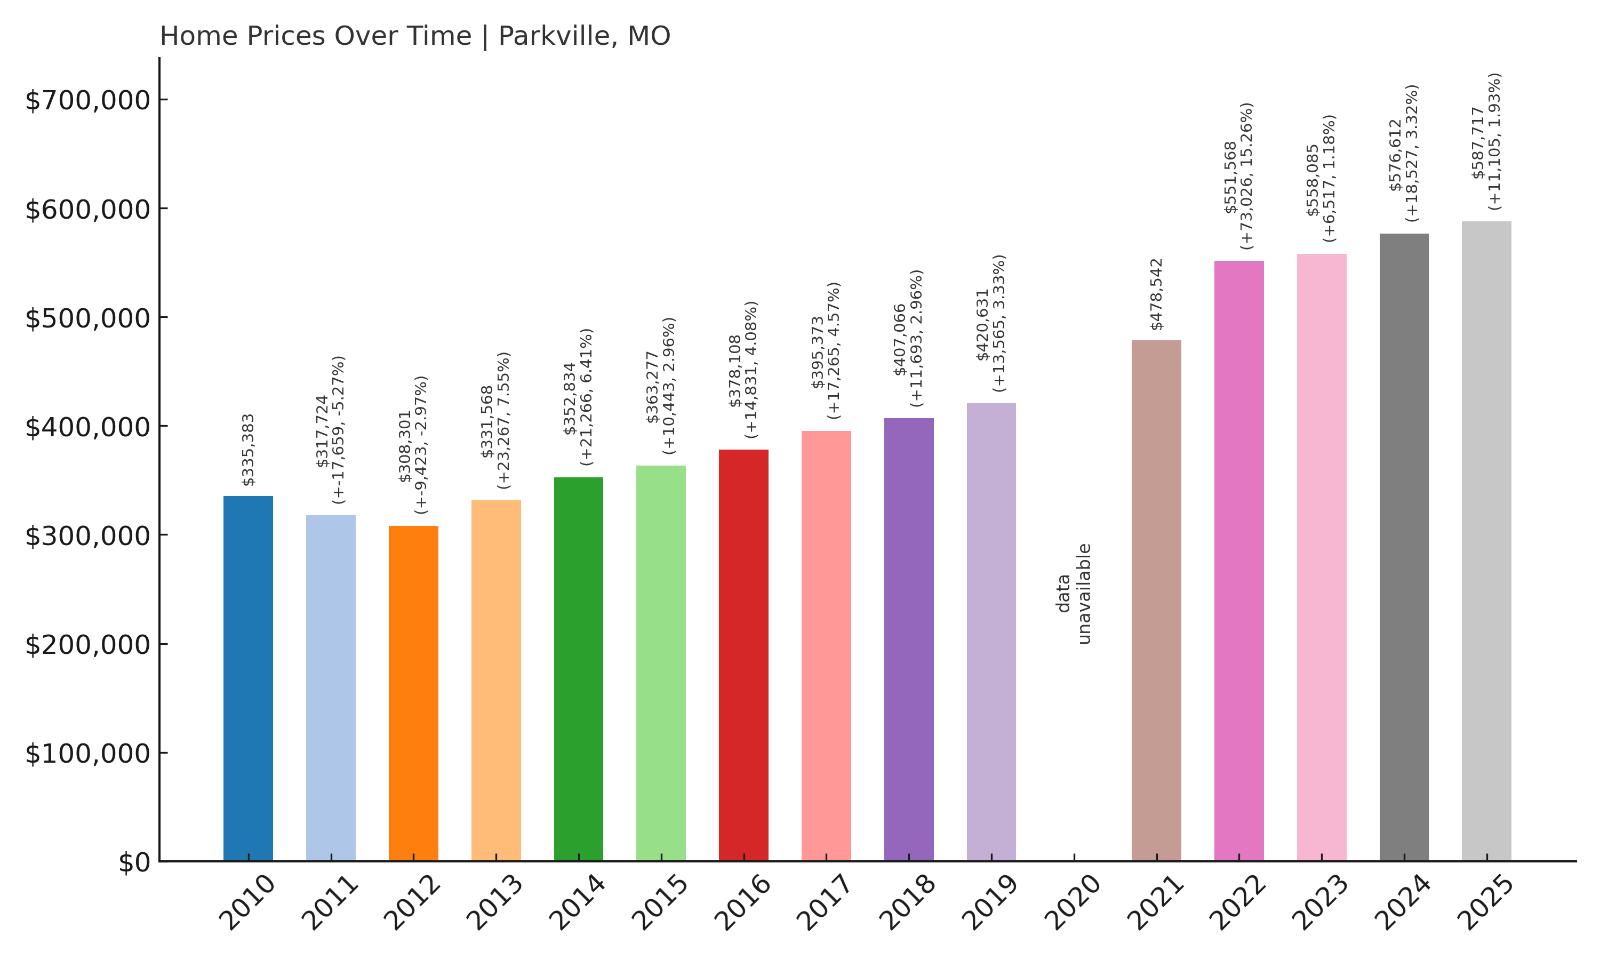
- 2010: $335,383
- 2011: $317,724 ($-17,659, -5.27% from previous year)
- 2012: $308,301 ($-9,423, -2.97% from previous year)
- 2013: $331,568 (+$23,266, +7.55% from previous year)
- 2014: $352,834 (+$21,267, +6.41% from previous year)
- 2015: $363,277 (+$10,443, +2.96% from previous year)
- 2016: $378,108 (+$14,831, +4.08% from previous year)
- 2017: $395,373 (+$17,265, +4.57% from previous year)
- 2018: $407,066 (+$11,692, +2.96% from previous year)
- 2019: $420,631 (+$13,565, +3.33% from previous year)
- 2020: N/A
- 2021: $478,542
- 2022: $551,568 (+$73,026, +15.26% from previous year)
- 2023: $558,085 (+$6,517, +1.18% from previous year)
- 2024: $576,612 (+$18,527, +3.32% from previous year)
- 2025: $587,717 (+$11,105, +1.93% from previous year)
Parkville’s home prices have grown by 91% since 2012, with a notable post-2020 surge. Though earlier years saw moderate, steady increases, values jumped dramatically after 2021, peaking above $587K by 2025. The rise points to growing demand in this attractive Kansas City suburb.
Parkville – Historic Charm and River Views
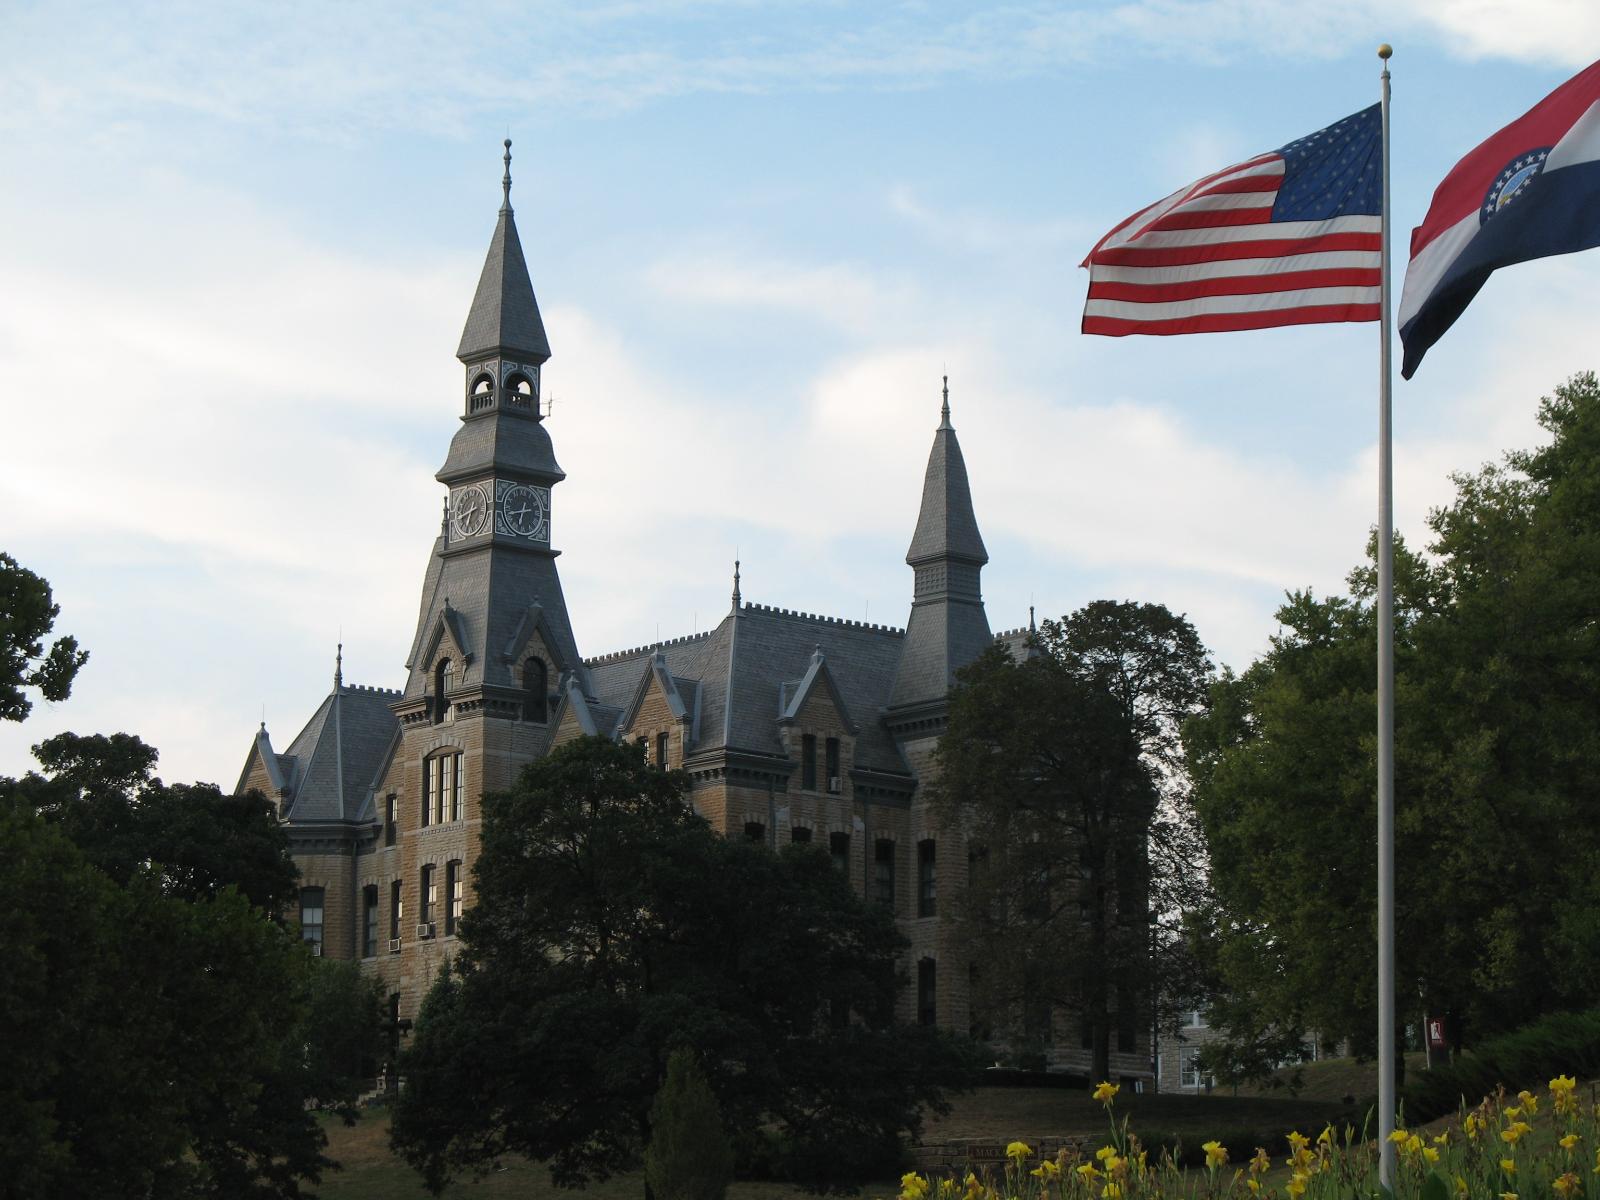
Parkville sits along the Missouri River in the northwest corner of the Kansas City metro. Its historic downtown, cobblestone streets, and antique shops give it a timeless feel, while top-rated schools and a scenic landscape make it attractive to families and retirees alike. It also boasts a vibrant arts scene and is home to Park University.
The town’s housing market has strengthened thanks to its unique blend of history and convenience. With limited new construction and rising regional demand, home prices have steadily climbed. Buyers seeking character homes with easy access to urban amenities continue to fuel Parkville’s premium real estate values.
16. Sunset Hills – 85% Home Price Increase Since 2012

- 2010: $340,004
- 2011: $326,550 ($-13,454, -3.96% from previous year)
- 2012: $319,782 ($-6,768, -2.07% from previous year)
- 2013: $325,707 (+$5,925, +1.85% from previous year)
- 2014: $353,851 (+$28,145, +8.64% from previous year)
- 2015: $366,181 (+$12,330, +3.48% from previous year)
- 2016: $386,652 (+$20,471, +5.59% from previous year)
- 2017: $400,171 (+$13,519, +3.50% from previous year)
- 2018: $410,805 (+$10,634, +2.66% from previous year)
- 2019: $422,295 (+$11,490, +2.80% from previous year)
- 2020: N/A
- 2021: $475,795
- 2022: $520,220 (+$44,425, +9.34% from previous year)
- 2023: $549,982 (+$29,763, +5.72% from previous year)
- 2024: $574,603 (+$24,620, +4.48% from previous year)
- 2025: $591,662 (+$17,060, +2.97% from previous year)
Sunset Hills has seen an 85% rise in home values since 2012. From a post-recession slowdown to consistent year-over-year gains, especially after 2020, the city has grown into one of the more expensive areas in the St. Louis metro. Homes now average nearly $592K.
Sunset Hills – Suburban Sophistication in St. Louis County
Located in western St. Louis County, Sunset Hills combines suburban space with urban access. It’s known for large lots, established neighborhoods, and proximity to major roadways like I-270 and Route 30. The area is also home to several parks and a popular community center.
The city’s real estate market has benefited from its balance of tranquility and convenience. Buyers are drawn to the high-performing Lindbergh School District and a range of housing options that include mid-century ranch homes and modern estates. As families look beyond the core city, Sunset Hills has emerged as a high-value alternative.
15. Lake Lotawana – 138% Home Price Increase Since 2012
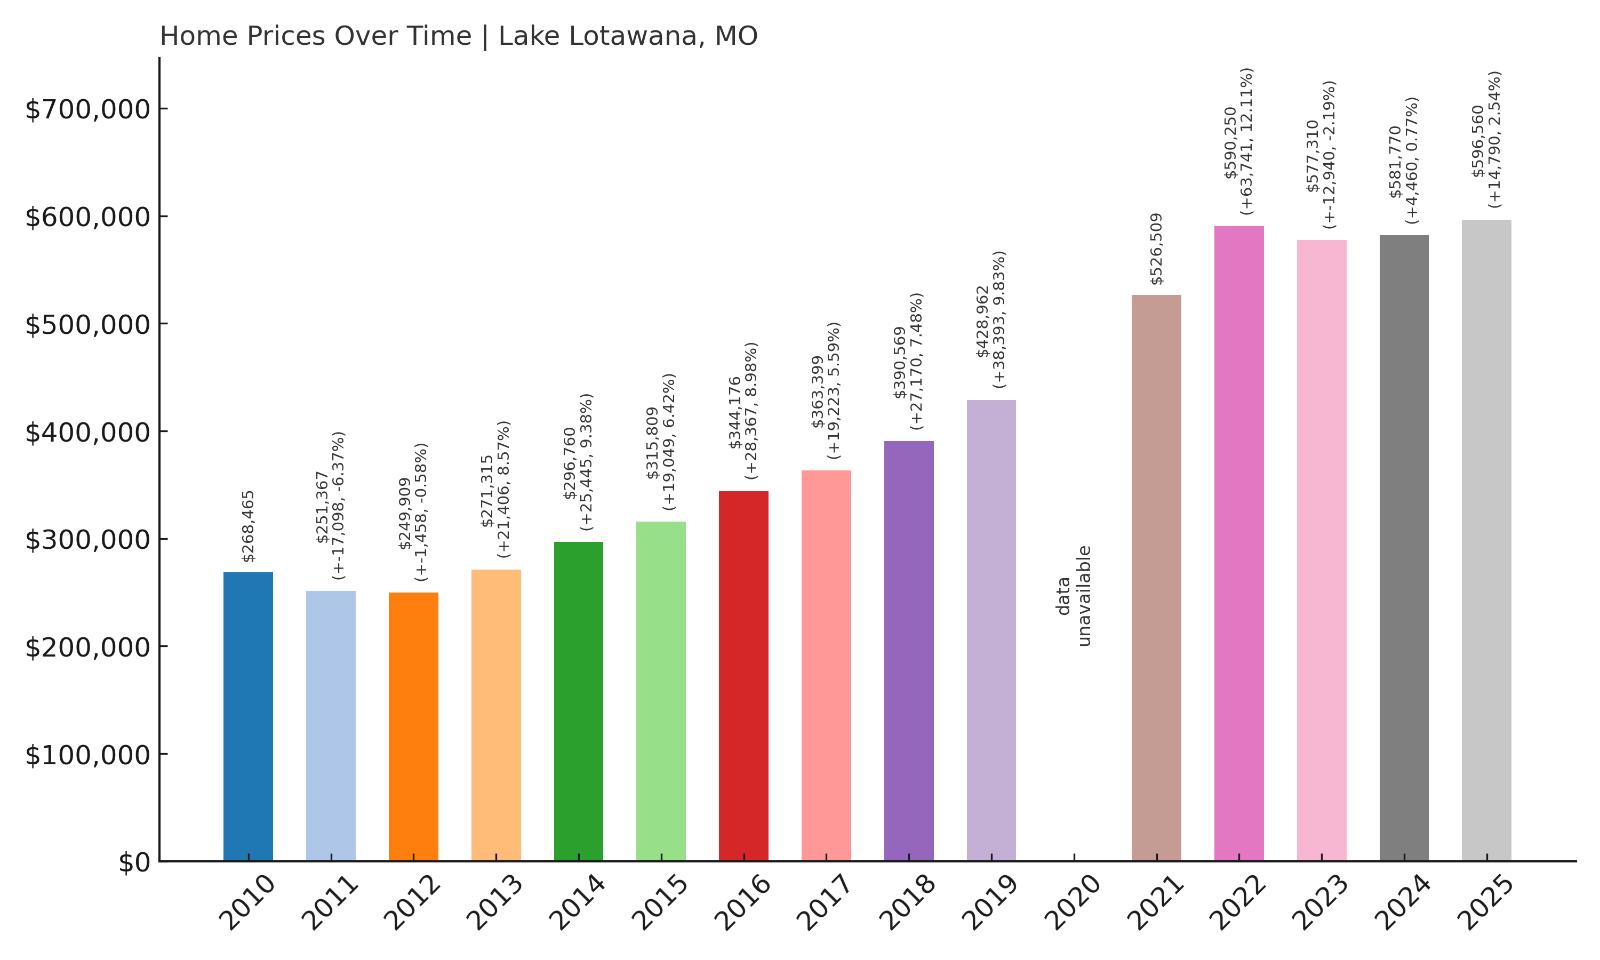
- 2010: $268,465
- 2011: $251,367 ($-17,098, -6.37% from previous year)
- 2012: $249,909 ($-1,458, -0.58% from previous year)
- 2013: $271,315 (+$21,406, +8.57% from previous year)
- 2014: $296,760 (+$25,446, +9.38% from previous year)
- 2015: $315,809 (+$19,049, +6.42% from previous year)
- 2016: $344,176 (+$28,367, +8.98% from previous year)
- 2017: $363,399 (+$19,223, +5.59% from previous year)
- 2018: $390,569 (+$27,170, +7.48% from previous year)
- 2019: $428,962 (+$38,393, +9.83% from previous year)
- 2020: N/A
- 2021: $526,509
- 2022: $590,250 (+$63,741, +12.11% from previous year)
- 2023: $577,310 ($-12,940, -2.19% from previous year)
- 2024: $581,770 (+$4,460, +0.77% from previous year)
- 2025: $596,560 (+$14,790, +2.54% from previous year)
Lake Lotawana’s home values have surged by 138% since 2012, among the steepest increases in this list. Prices jumped especially between 2016 and 2022, with only a minor dip in 2023. The current average sits just under $600K in 2025, reflecting sustained buyer interest.
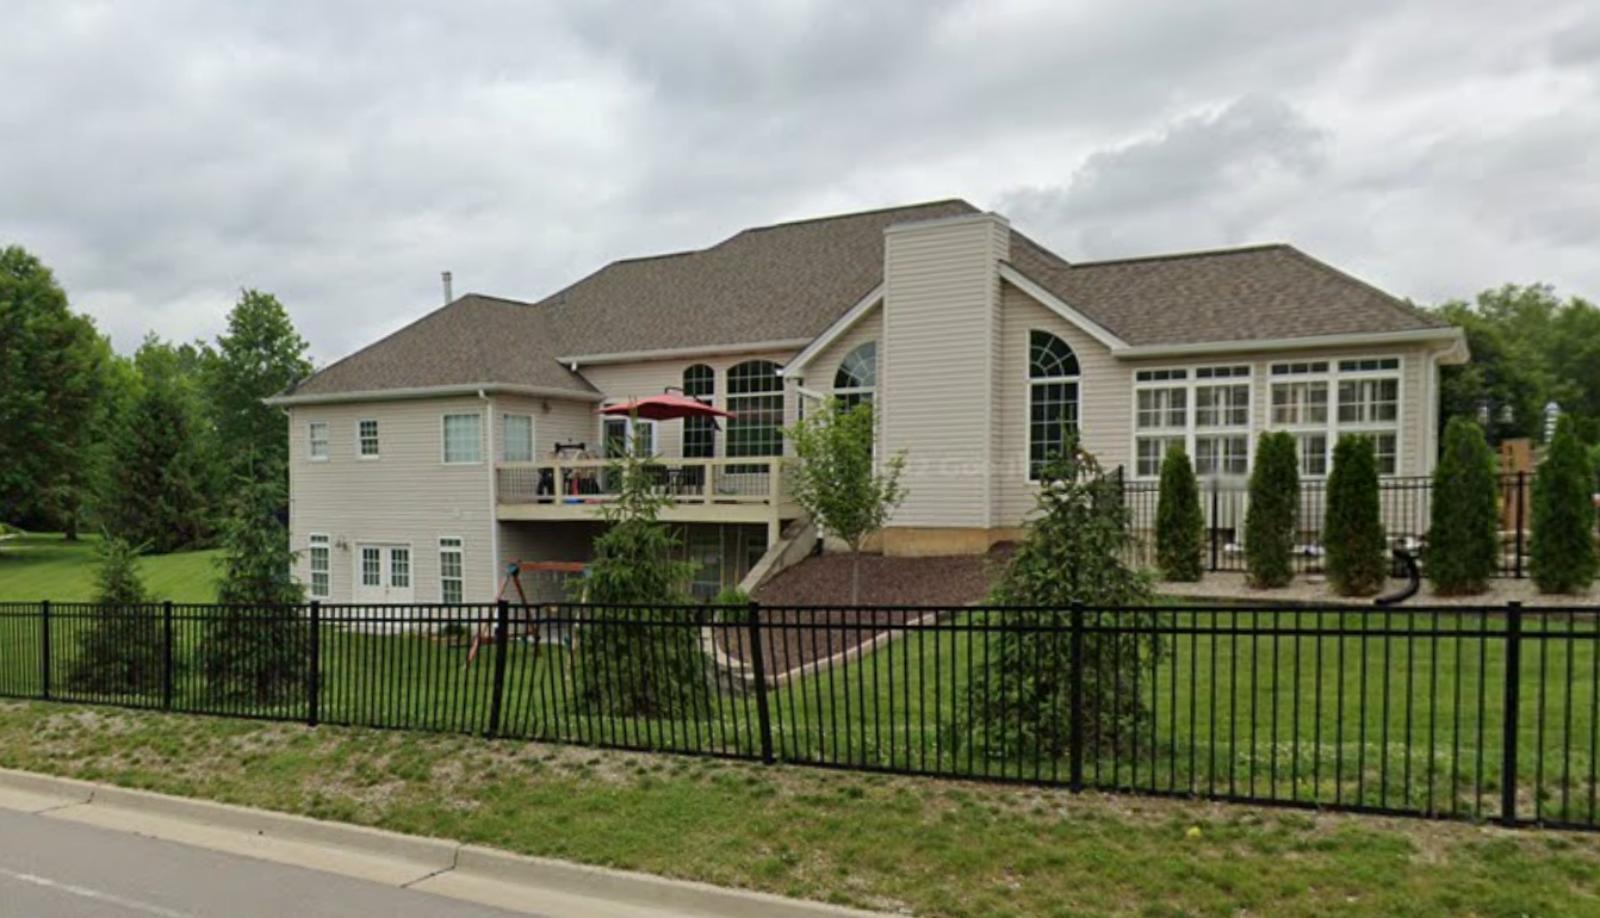
Lake Lotawana – Waterfront Property Drives Growth
Lake Lotawana is a small, lake-centered community in Jackson County, southeast of Kansas City. Its main attraction is its namesake lake, Missouri’s largest private body of water, which supports boating, fishing, and waterfront living. The area has become a magnet for those seeking vacation-style homes with real community infrastructure.
Real estate here commands a premium, with many properties featuring private docks, lake views, and extensive upgrades. As urban dwellers seek peaceful retreats without leaving the metro entirely, Lake Lotawana has become one of the region’s most desirable and fastest-growing luxury housing spots.
14. Creve Coeur – 83% Home Price Increase Since 2012

- 2010: $359,543
- 2011: $348,369 ($-11,174, -3.11% from previous year)
- 2012: $331,985 ($-16,384, -4.70% from previous year)
- 2013: $343,960 (+$11,975, +3.61% from previous year)
- 2014: $372,102 (+$28,142, +8.18% from previous year)
- 2015: $383,885 (+$11,783, +3.17% from previous year)
- 2016: $397,319 (+$13,434, +3.50% from previous year)
- 2017: $407,374 (+$10,055, +2.53% from previous year)
- 2018: $423,346 (+$15,971, +3.92% from previous year)
- 2019: $434,491 (+$11,146, +2.63% from previous year)
- 2020: N/A
- 2021: $492,730
- 2022: $537,471 (+$44,741, +9.08% from previous year)
- 2023: $557,593 (+$20,122, +3.74% from previous year)
- 2024: $587,958 (+$30,365, +5.45% from previous year)
- 2025: $607,380 (+$19,422, +3.30% from previous year)
Creve Coeur’s housing market has seen an 83% increase since 2012, with particularly strong gains since 2020. The average home now tops $607K, a reflection of continued demand and steady appreciation. Post-2021 trends show consistent growth with no major setbacks.
Creve Coeur – Affluence Meets Accessibility
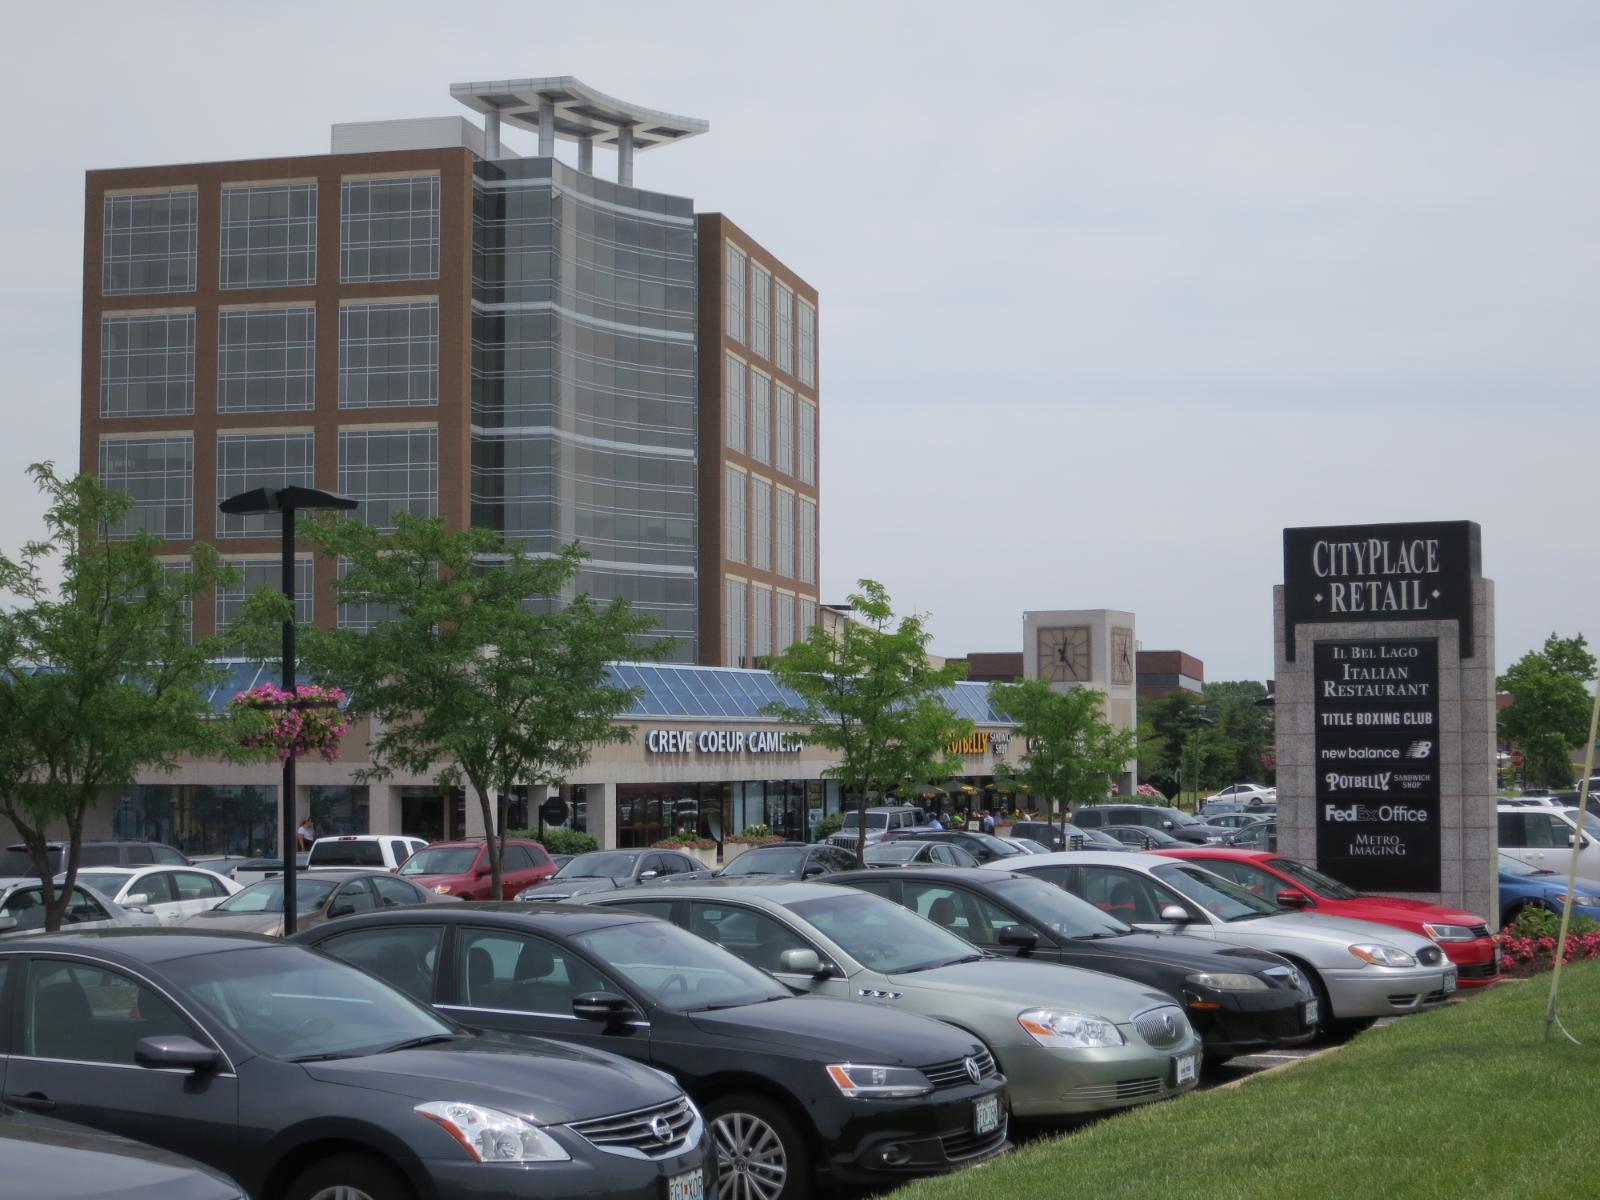
Situated in west St. Louis County, Creve Coeur is a hub for corporate offices, medical centers, and top-tier schools. It’s a well-established suburb with a strong commercial core and leafy residential neighborhoods. Major employers and roadways make it ideal for professionals and families alike.
The town’s desirability comes from its mix of convenience and comfort. Larger homes, private schools, and access to dining and recreation have kept demand high. The rising prices reflect buyers’ willingness to invest in long-term value in one of the area’s most stable upscale markets.
13. Weldon Spring – 93% Home Price Increase Since 2012
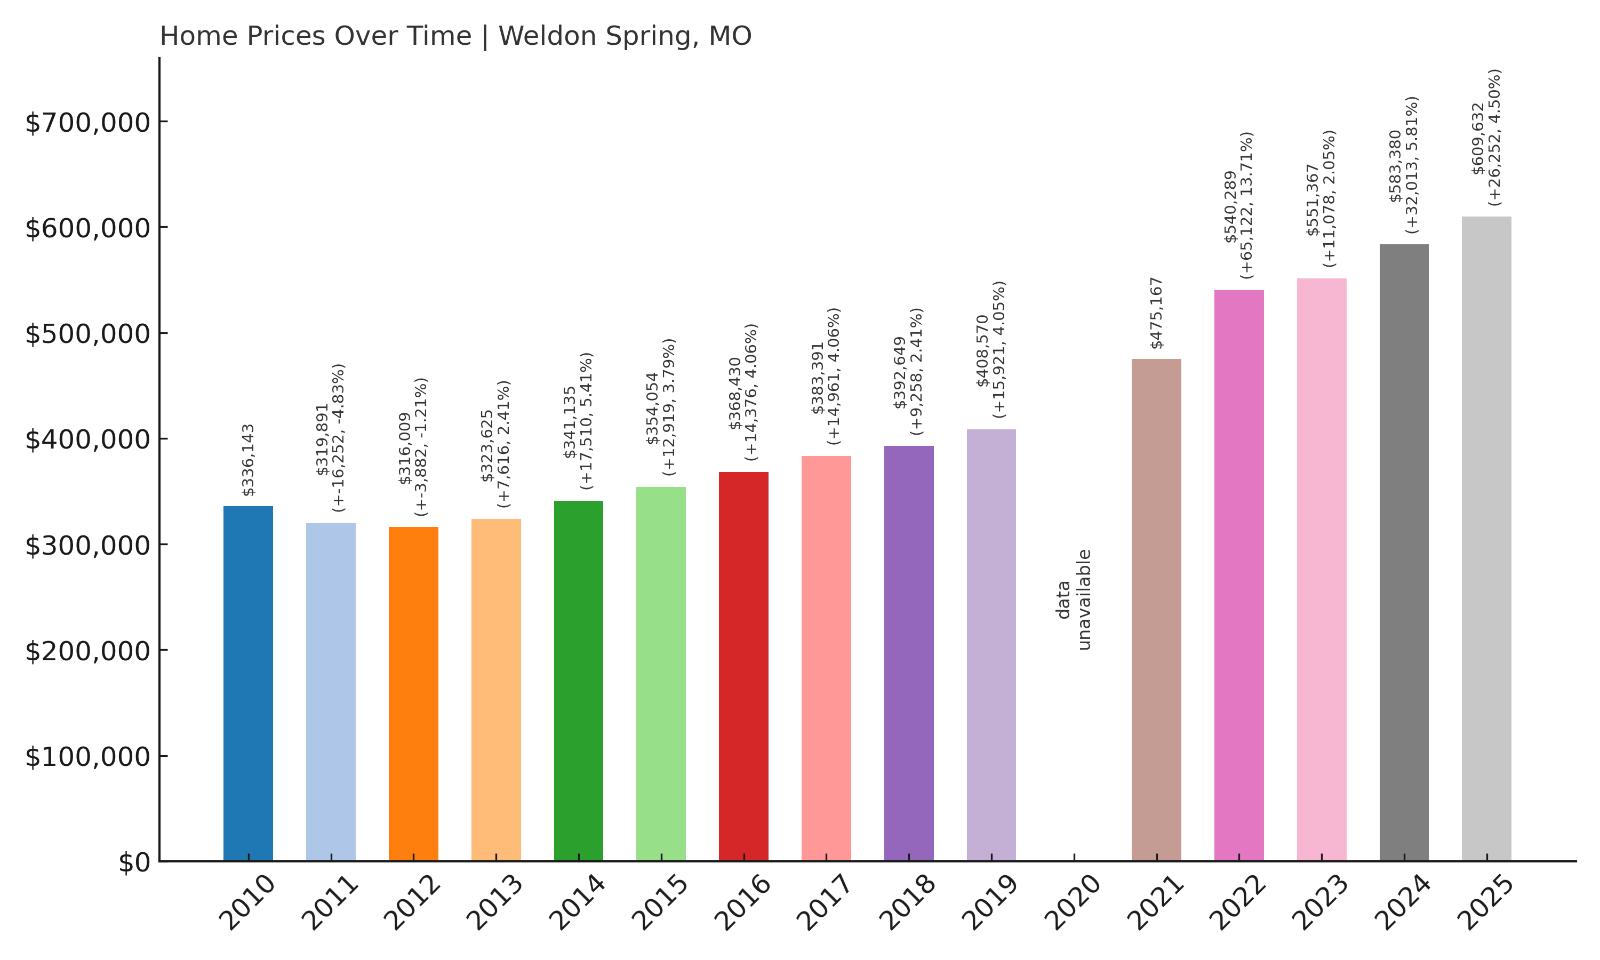
- 2010: $336,143
- 2011: $319,891 ($-16,252, -4.83% from previous year)
- 2012: $316,009 ($-3,882, -1.21% from previous year)
- 2013: $323,625 (+$7,616, +2.41% from previous year)
- 2014: $341,135 (+$17,510, +5.41% from previous year)
- 2015: $354,054 (+$12,919, +3.79% from previous year)
- 2016: $368,430 (+$14,376, +4.06% from previous year)
- 2017: $383,391 (+$14,961, +4.06% from previous year)
- 2018: $392,649 (+$9,258, +2.41% from previous year)
- 2019: $408,570 (+$15,921, +4.05% from previous year)
- 2020:
- 2021: $475,167
- 2022: $540,289 (+$65,122, +13.71% from previous year)
- 2023: $551,367 (+$11,078, +2.05% from previous year)
- 2024: $583,380 (+$32,013, +5.81% from previous year)
- 2025: $609,632 (+$26,252, +4.50% from previous year)
Weldon Spring has seen its home values jump from just over $316K in 2012 to more than $609K in 2025—a 93% increase over 13 years. Price growth accelerated notably after 2021, with strong gains in both 2022 and 2024 pointing to persistent demand in this upscale suburb.
Weldon Spring – A Quiet Enclave with Rising Appeal
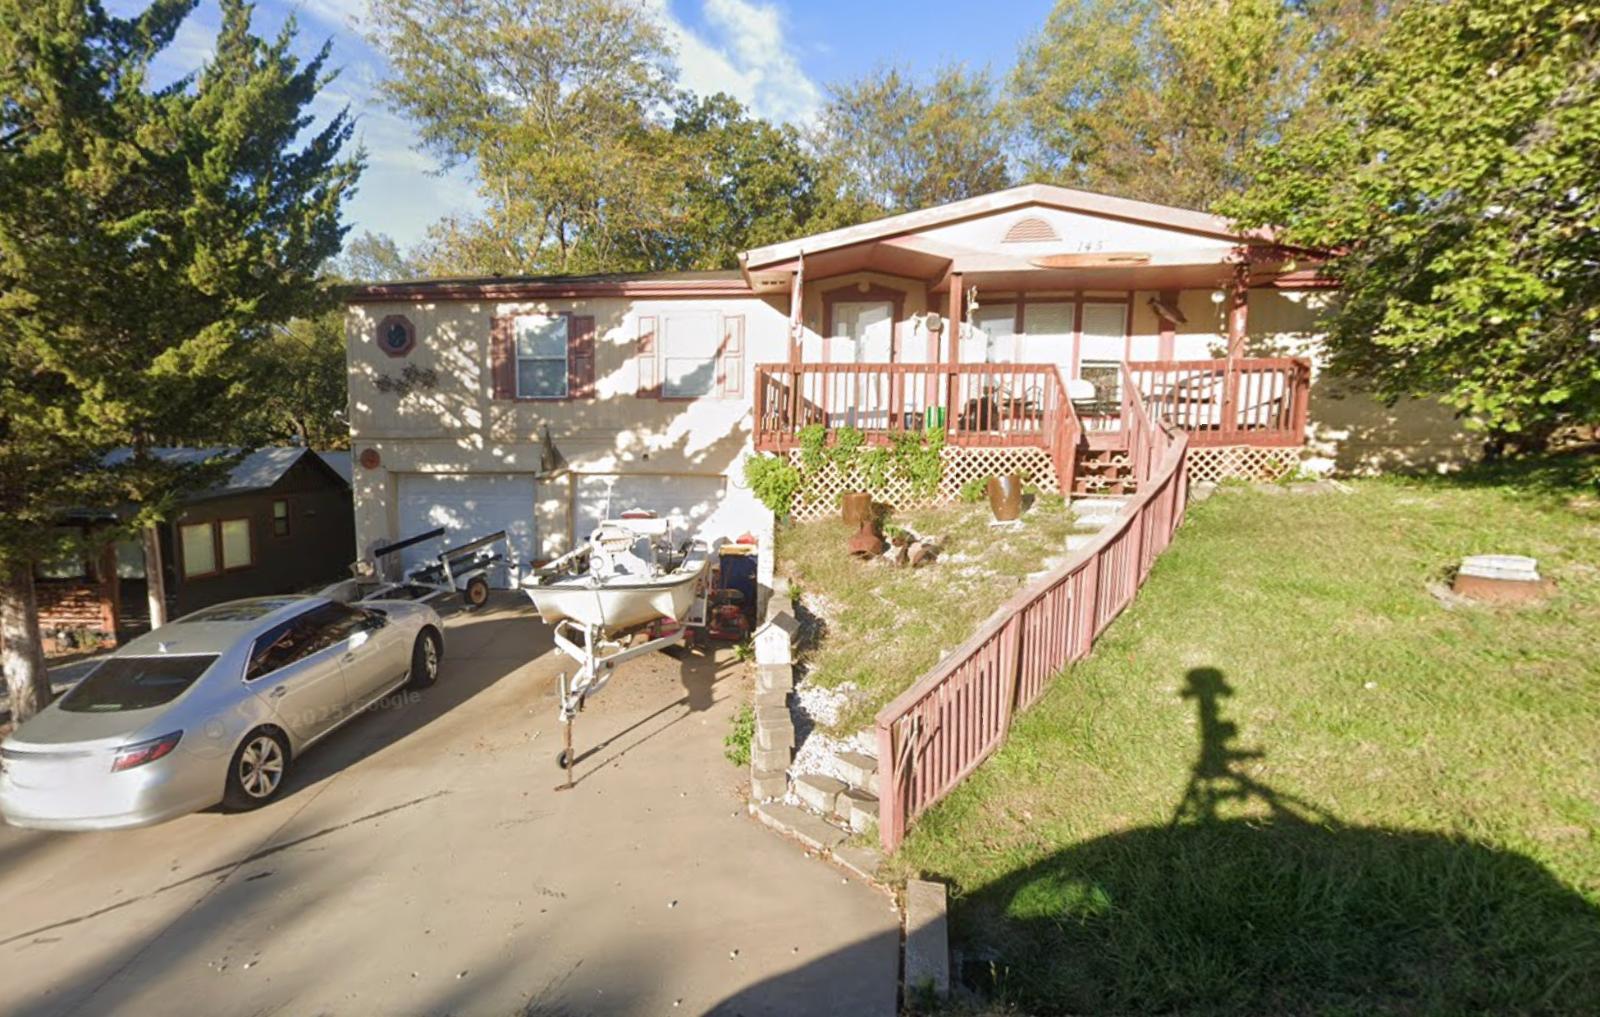
Weldon Spring, located in St. Charles County, offers a peaceful, semi-rural lifestyle with easy access to the Greater St. Louis area. It’s known for its rolling terrain, large residential lots, and proximity to parks and conservation areas, including the Weldon Spring Conservation Area and Katy Trail.
The town’s appeal lies in its blend of open space and suburban comfort. Many homes are custom-built, featuring large footprints and modern amenities. As families look for more space without straying too far from urban conveniences, Weldon Spring’s housing market has gained steadily. The strong appreciation since 2021 highlights just how popular it’s become.
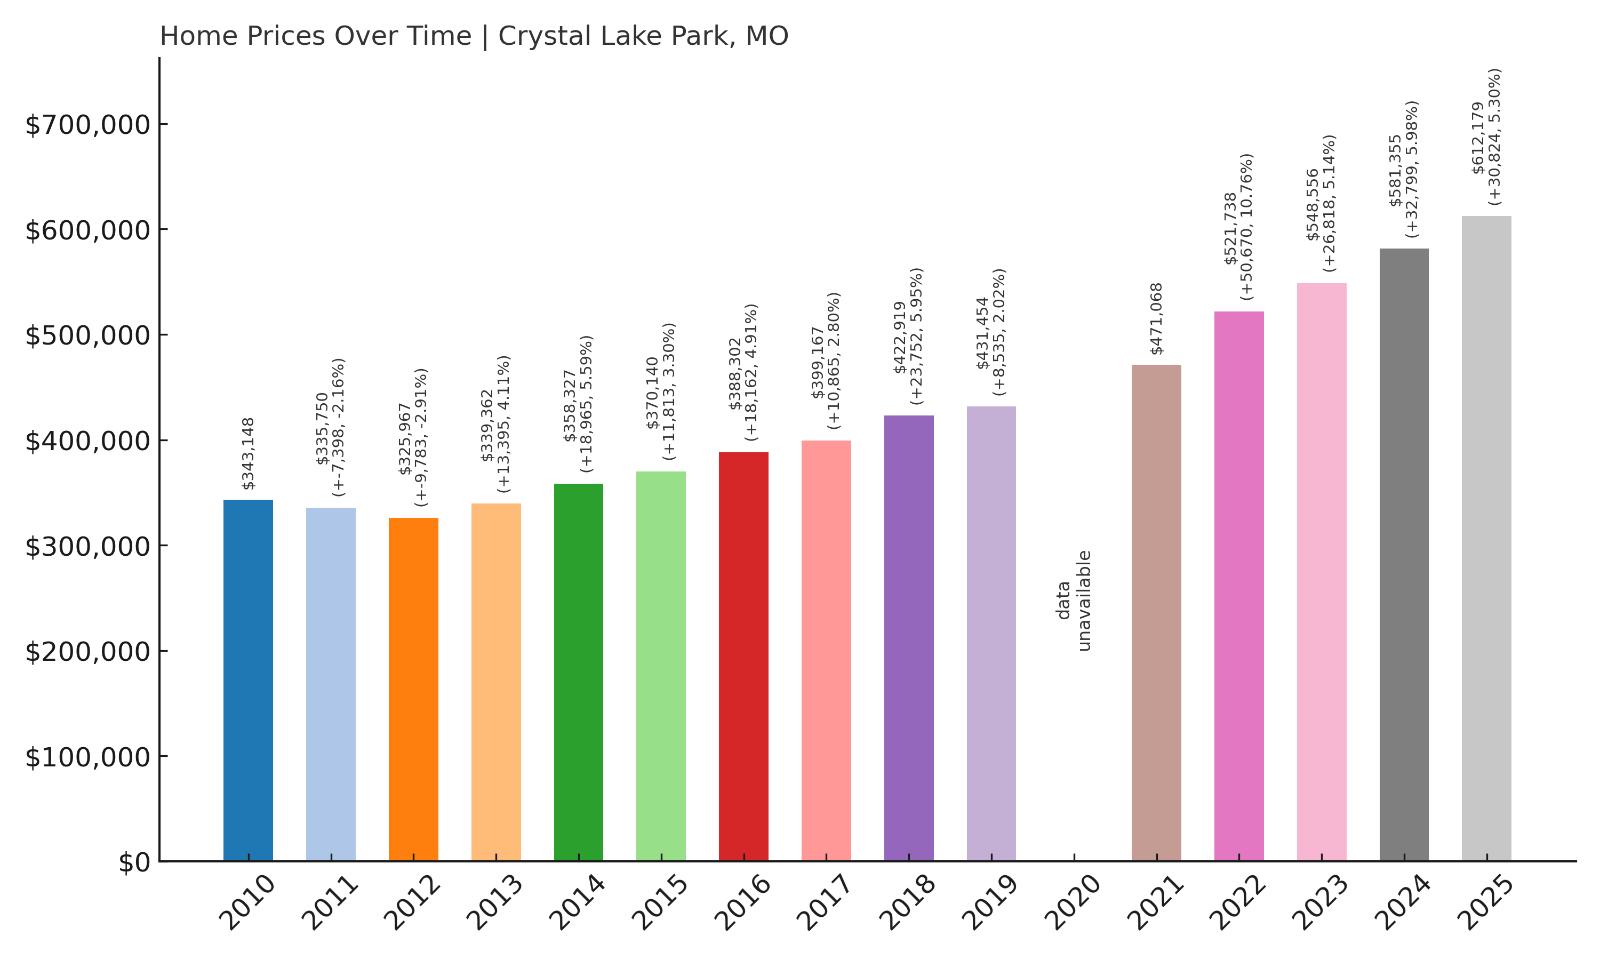
12. Crystal Lake Park – 88% Home Price Increase Since 2012
🔥 Would you like to save this?
- 2010: $343,148
- 2011: $335,750 ($-7,397, -2.16% from previous year)
- 2012: $325,967 ($-9,784, -2.91% from previous year)
- 2013: $339,362 (+$13,395, +4.11% from previous year)
- 2014: $358,327 (+$18,965, +5.59% from previous year)
- 2015: $370,140 (+$11,812, +3.30% from previous year)
- 2016: $388,302 (+$18,162, +4.91% from previous year)
- 2017: $399,167 (+$10,864, +2.80% from previous year)
- 2018: $422,919 (+$23,753, +5.95% from previous year)
- 2019: $431,454 (+$8,534, +2.02% from previous year)
- 2020: N/A
- 2021: $471,068
- 2022: $521,738 (+$50,670, +10.76% from previous year)
- 2023: $548,556 (+$26,817, +5.14% from previous year)
- 2024: $581,355 (+$32,799, +5.98% from previous year)
- 2025: $612,179 (+$30,824, +5.30% from previous year)
Home prices in Crystal Lake Park have risen nearly 88% since 2012, crossing the $600K mark in 2025. While price increases were steady through the 2010s, the biggest jumps came after 2021, reflecting a surge in interest in this compact yet desirable inner-ring suburb.
Crystal Lake Park – Prestige in a Small Package
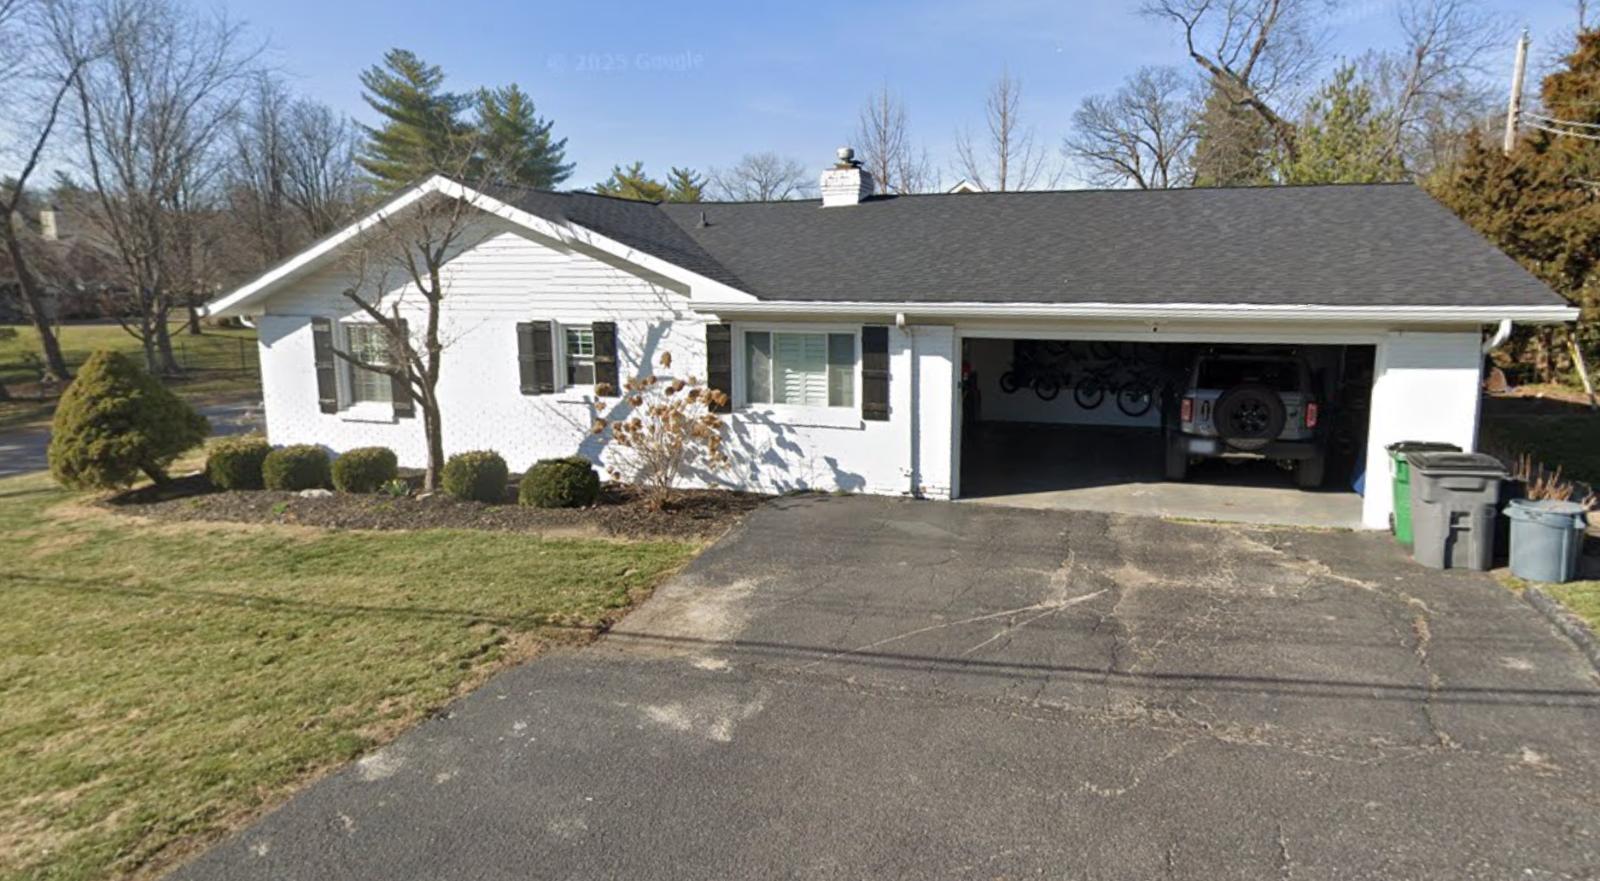
Just west of downtown St. Louis, Crystal Lake Park is one of the smallest municipalities in the region—but what it lacks in size, it makes up for in charm and exclusivity. With just a few hundred homes, the area offers a close-knit community feel that’s hard to replicate.
The neighborhood is prized for its quiet, tree-lined streets and proximity to upscale shopping and top-rated schools. Its small footprint means limited housing supply, which in turn has helped drive prices higher. Buyers looking for character and community find this tiny enclave highly attractive, keeping demand consistently strong.
11. Warson Woods – 89% Home Price Increase Since 2012
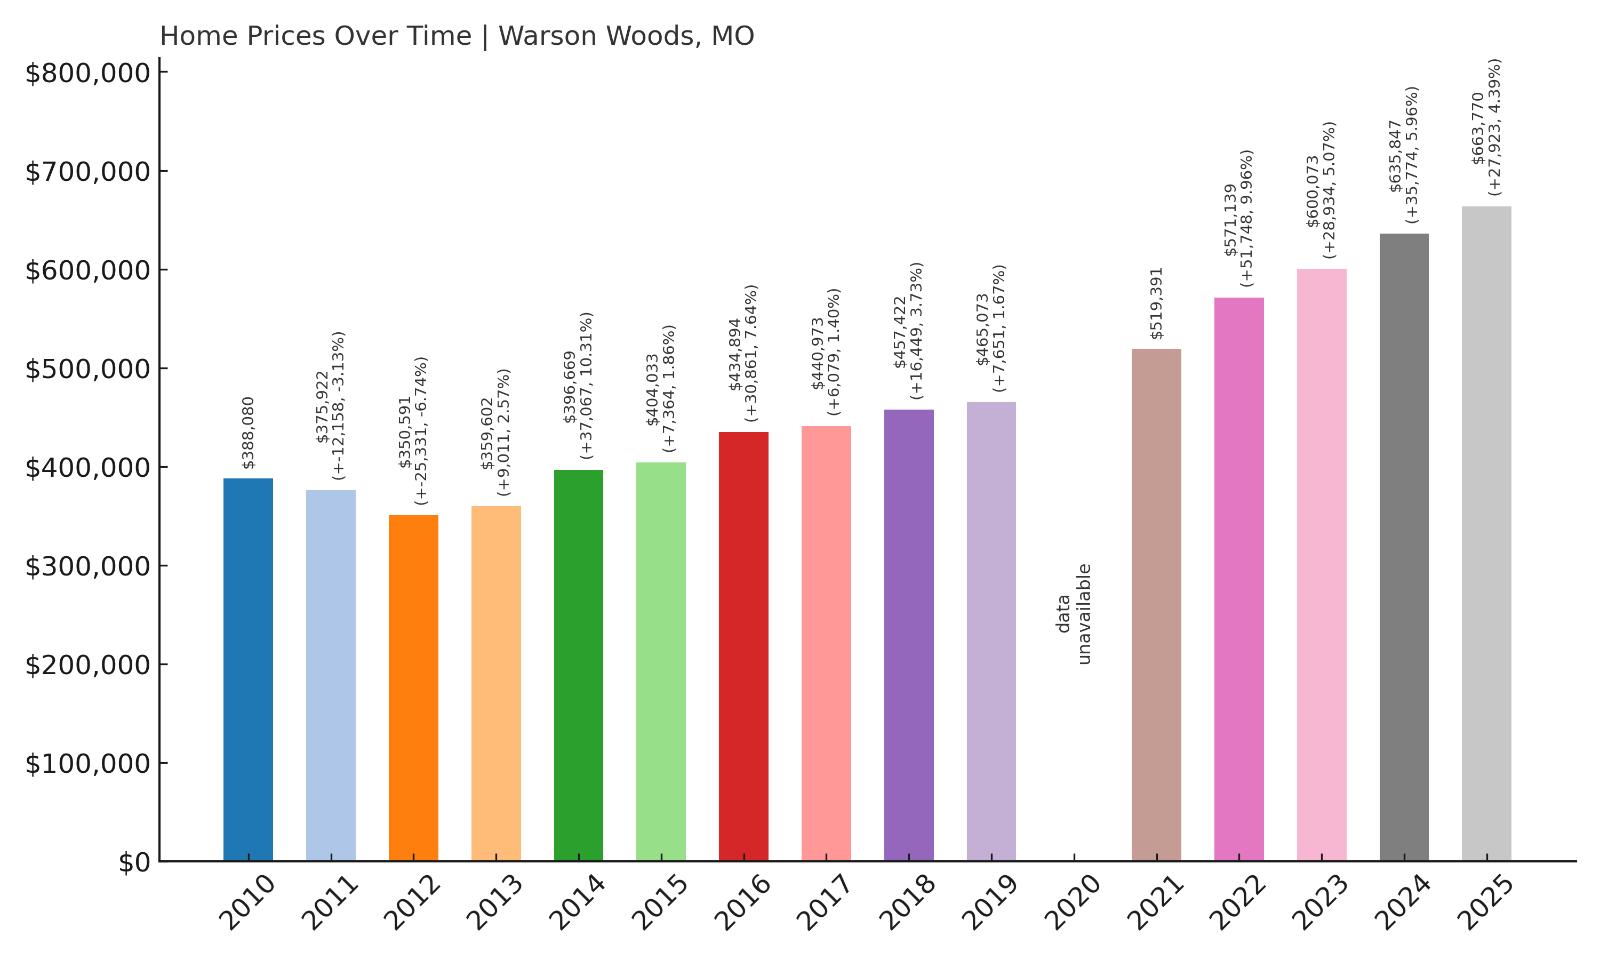
- 2010: $388,080
- 2011: $375,922 ($-12,159, -3.13% from previous year)
- 2012: $350,591 ($-25,331, -6.74% from previous year)
- 2013: $359,602 (+$9,011, +2.57% from previous year)
- 2014: $396,669 (+$37,068, +10.31% from previous year)
- 2015: $404,033 (+$7,364, +1.86% from previous year)
- 2016: $434,894 (+$30,861, +7.64% from previous year)
- 2017: $440,973 (+$6,080, +1.40% from previous year)
- 2018: $457,422 (+$16,449, +3.73% from previous year)
- 2019: $465,073 (+$7,650, +1.67% from previous year)
- 2020: N/A
- 2021: $519,391
- 2022: $571,139 (+$51,748, +9.96% from previous year)
- 2023: $600,073 (+$28,934, +5.07% from previous year)
- 2024: $635,847 (+$35,774, +5.96% from previous year)
- 2025: $663,770 (+$27,923, +4.39% from previous year)
Warson Woods has enjoyed a steady 89% gain in home values since 2012. Prices surged past the $600K mark in 2023 and have continued to climb each year since. The trend reflects growing demand for well-located, livable communities in the inner suburbs of St. Louis.
Warson Woods – Walkability and Classic Homes
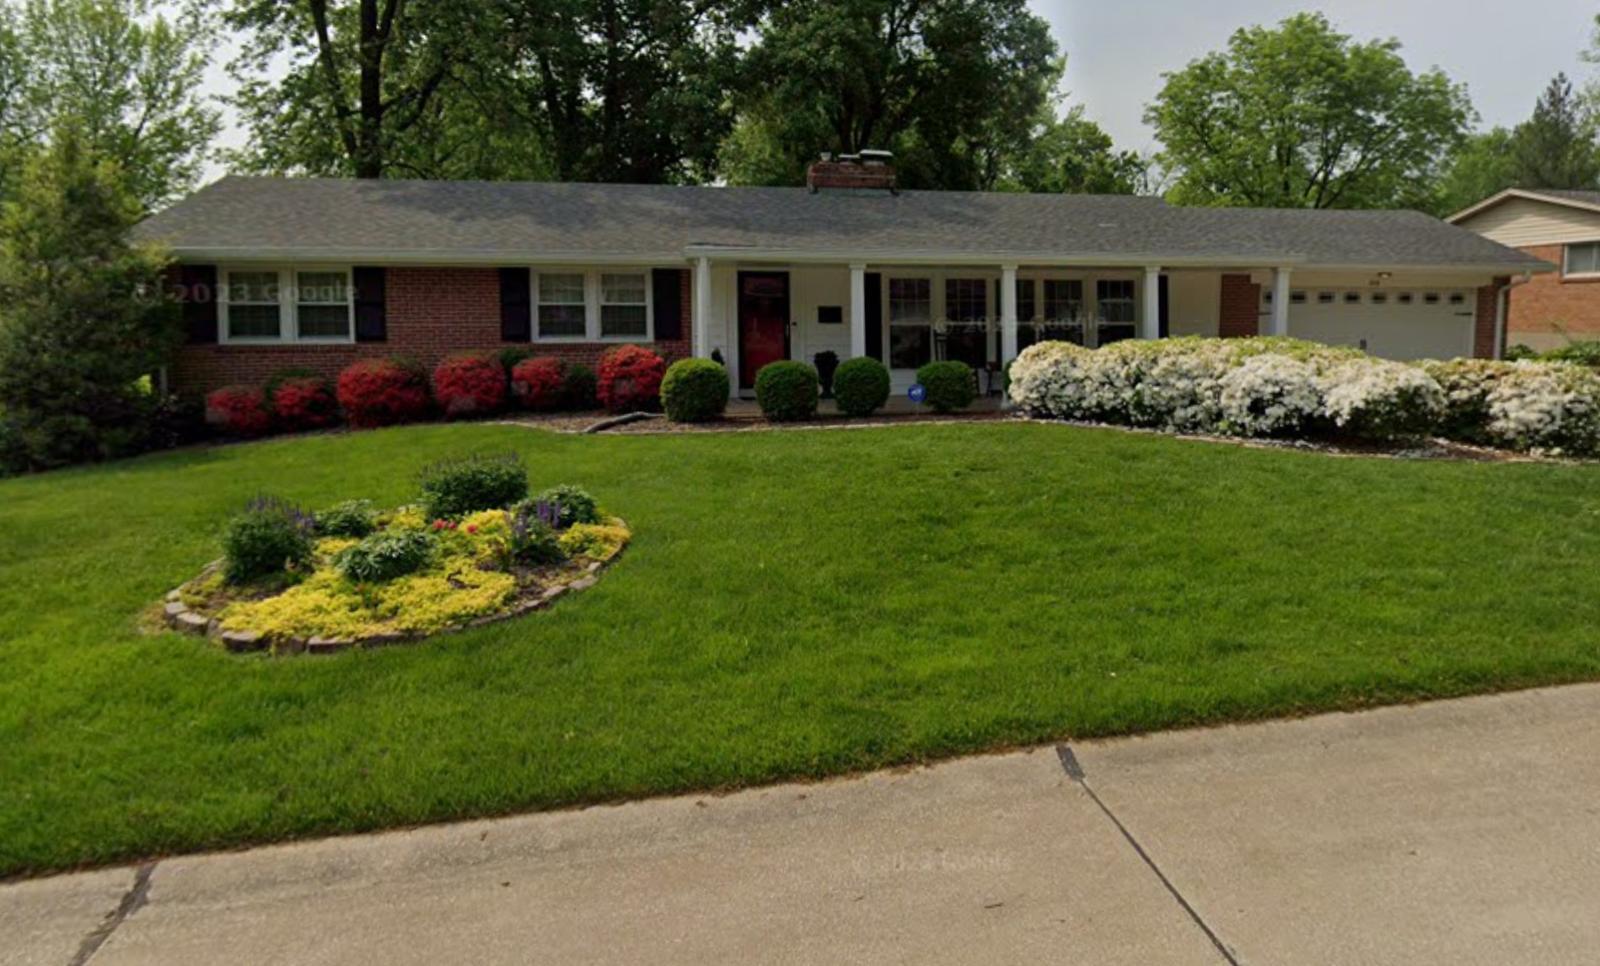
Located in Mid St. Louis County, Warson Woods blends mid-century charm with walkable convenience. The town features a mix of brick colonial homes and ranch-style houses, many of which have been updated with modern finishes. It’s a favorite among buyers seeking timeless style and mature landscaping.
Close to retail corridors like Manchester Road, Warson Woods is both convenient and residential. The city’s small-business vibe, combined with proximity to good schools and local parks, has helped it hold value through economic shifts. The consistent uptick in prices shows it’s a stable investment for long-term homeowners.
10. Des Peres – 91% Home Price Increase Since 2012
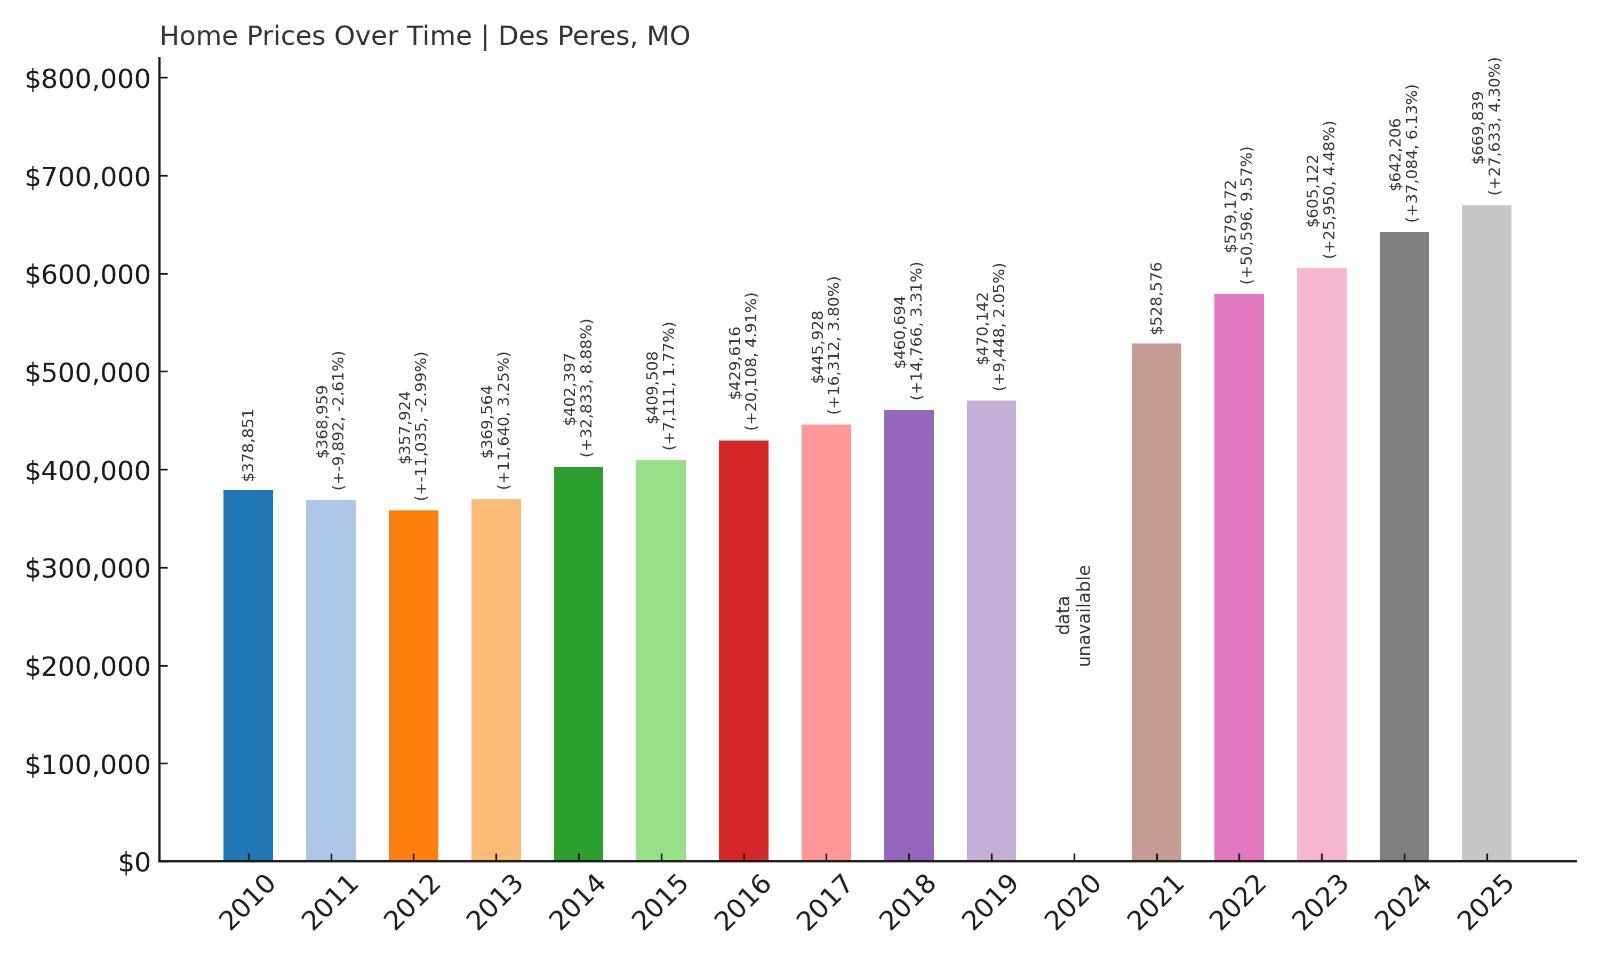
- 2010: $378,851
- 2011: $368,959 ($-9,892, -2.61% from previous year)
- 2012: $357,924 ($-11,035, -2.99% from previous year)
- 2013: $369,564 (+$11,640, +3.25% from previous year)
- 2014: $402,397 (+$32,833, +8.88% from previous year)
- 2015: $409,508 (+$7,111, +1.77% from previous year)
- 2016: $429,616 (+$20,108, +4.91% from previous year)
- 2017: $445,928 (+$16,312, +3.80% from previous year)
- 2018: $460,694 (+$14,766, +3.31% from previous year)
- 2019: $470,142 (+$9,447, +2.05% from previous year)
- 2020: N/A
- 2021: $528,576
- 2022: $579,172 (+$50,597, +9.57% from previous year)
- 2023: $605,122 (+$25,950, +4.48% from previous year)
- 2024: $642,206 (+$37,084, +6.13% from previous year)
- 2025: $669,839 (+$27,633, +4.30% from previous year)
Home values in Des Peres have surged 91% since 2012. Growth has remained steady since the mid-2010s, but values accelerated significantly after 2021, pushing the average home value close to $670K in 2025.
Des Peres – Affluent Suburb with Retail Power

Des Peres is a key residential and commercial hub in west St. Louis County. It’s home to West County Center, a major regional shopping mall, as well as top-performing schools and lush residential neighborhoods. The town balances luxury living with retail access and major employers.
The market here appeals to upper-middle-class families, professionals, and empty nesters alike. With limited turnover and strong schools, Des Peres has consistently held its value—and now leads among the St. Louis metro’s priciest communities. Newer homes and renovations have only added to its appeal.
9. Lake Winnebago – 143% Home Price Increase Since 2012
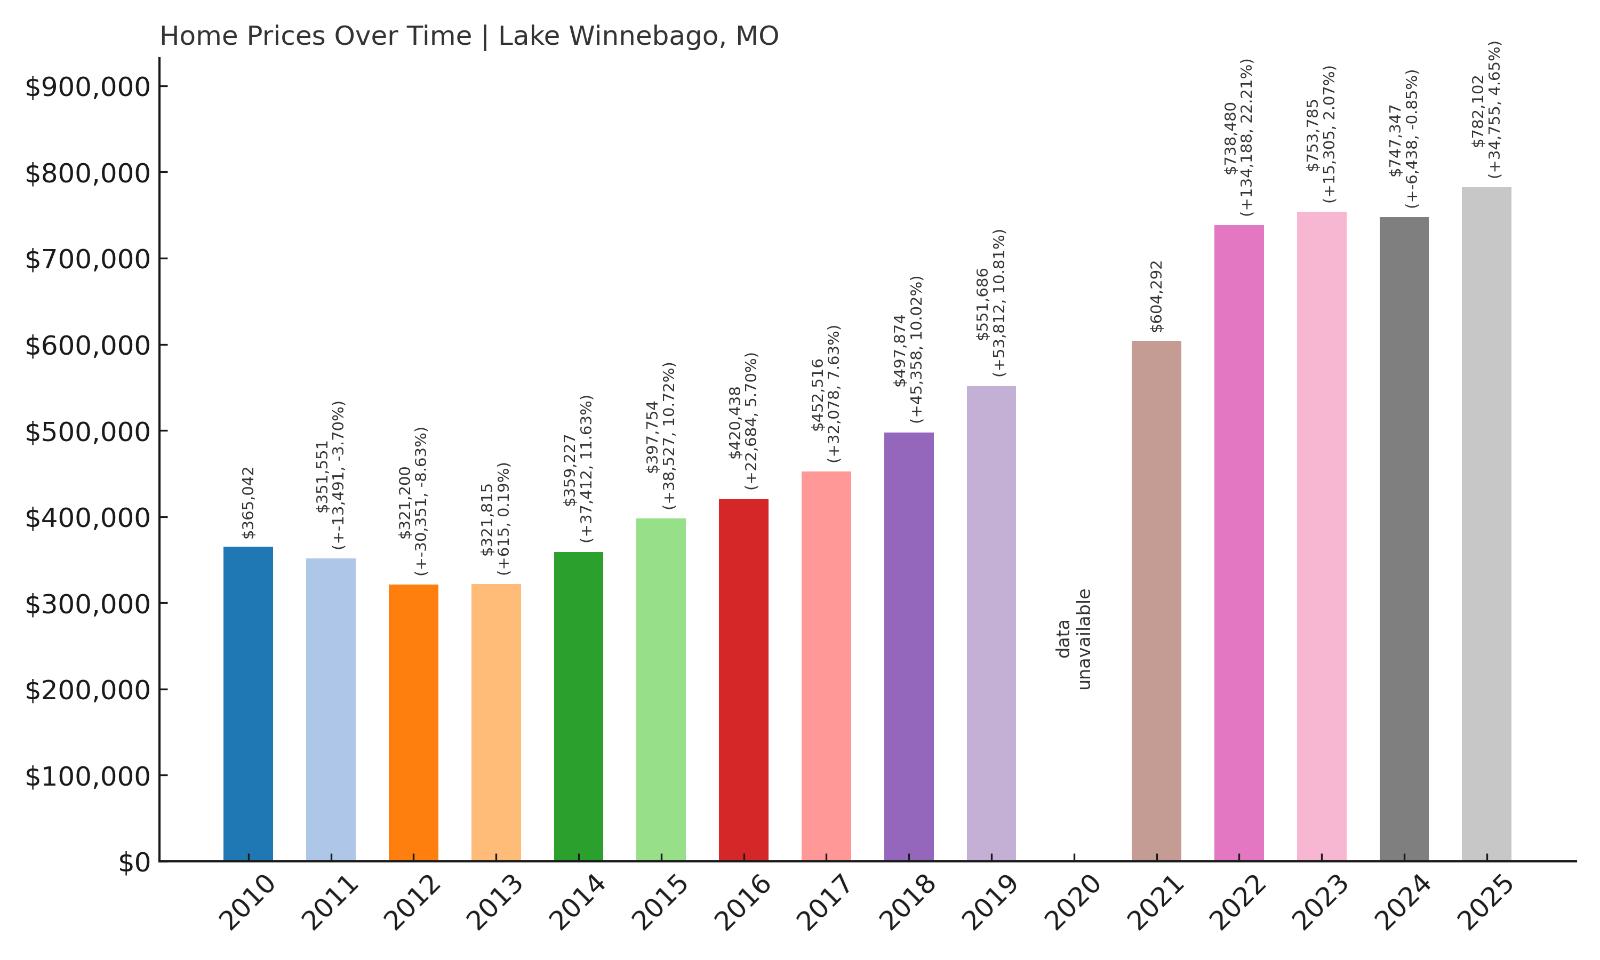
- 2010: $365,042
- 2011: $351,551 ($-13,491, -3.70% from previous year)
- 2012: $321,200 ($-30,351, -8.63% from previous year)
- 2013: $321,815 (+$615, +0.19% from previous year)
- 2014: $359,227 (+$37,412, +11.63% from previous year)
- 2015: $397,754 (+$38,527, +10.72% from previous year)
- 2016: $420,438 (+$22,683, +5.70% from previous year)
- 2017: $452,516 (+$32,079, +7.63% from previous year)
- 2018: $497,874 (+$45,358, +10.02% from previous year)
- 2019: $551,686 (+$53,812, +10.81% from previous year)
- 2020: N/A
- 2021: $604,292
- 2022: $738,480 (+$134,189, +22.21% from previous year)
- 2023: $753,785 (+$15,304, +2.07% from previous year)
- 2024: $747,347 ($-6,438, -0.85% from previous year)
- 2025: $782,102 (+$34,755, +4.65% from previous year)
Lake Winnebago has experienced one of the sharpest home price increases in the state, growing an astonishing 143% since 2012. What began as a modest recovery from the 2011 dip quickly escalated into double-digit annual gains between 2014 and 2019. The biggest spike came in 2022, with a jump of over $134K in a single year. Even with a slight pullback in 2024, the market rebounded immediately, pushing 2025 prices past $780K. This kind of sustained and explosive growth underscores the strong demand for lakeside living and limited inventory in the area.
Lake Winnebago – Premium Living on the Water
Located in Cass County, just southeast of Kansas City, Lake Winnebago is centered around a private, 405-acre lake that serves as both a scenic centerpiece and a key driver of property value. Many of the homes here are custom-built, with private docks and panoramic lake views that are rare in Missouri. This makes the community not just desirable, but exclusive.
The town is undergoing careful expansion, including a dam enhancement and lake enlargement project that has attracted both second-home buyers and affluent families looking to upgrade their primary residences. With limited waterfront parcels available and a tight-knit community atmosphere, demand continues to outpace supply. The price trends reflect this premium status—Lake Winnebago is increasingly seen as a luxury retreat within commuting distance of Kansas City.
8. Clayton – 71% Home Price Increase Since 2012

- 2010: $552,686
- 2011: $537,727 ($-14,959, -2.71% from previous year
- 2012: $503,952 ($-33,775, -6.28% from previous year)
- 2013: $510,994 (+$7,042, +1.40% from previous year)
- 2014: $555,981 (+$44,987, +8.80% from previous year)
- 2015: $577,425 (+$21,444, +3.86% from previous year)
- 2016: $613,445 (+$36,021, +6.24% from previous year)
- 2017: $627,333 (+$13,888, +2.26% from previous year)
- 2018: $649,680 (+$22,347, +3.56% from previous year)
- 2019: $669,750 (+$20,069, +3.09% from previous year)
- 2020: N/A
- 2021: $732,305
- 2022: $778,256 (+$45,951, +6.27% from previous year)
- 2023: $785,355 (+$7,099, +0.91% from previous year)
- 2024: $824,152 (+$38,798, +4.94% from previous year)
- 2025: $862,298 (+$38,146, +4.63% from previous year)
Clayton has maintained one of the most consistent appreciation patterns among Missouri’s high-end markets, growing 71% in value since 2012. After bottoming out in 2012, home values steadily climbed each year, with strong performance from 2014 onward. Despite some moderation in recent years, the town remains firmly above $860K in 2025. The area continues to attract deep-pocketed buyers drawn to its combination of prestige, walkability, and cultural vibrancy.
Clayton – Missouri’s Urban Luxury Capital
Clayton is widely regarded as the economic and legal epicenter of St. Louis County. It’s home to top law firms, financial institutions, upscale condos, and luxury boutiques—all nestled within a compact, urban framework. The walkable downtown is packed with award-winning restaurants, galleries, and year-round events that attract professionals and families alike.
The Clayton School District is among the best in the state, further increasing the area’s desirability. Buyers here are often long-term residents or investors looking for stable appreciation and excellent amenities. With its blend of historic homes, new developments, and tight inventory, Clayton remains a benchmark for high-end urban living in Missouri. The prices reflect both scarcity and ongoing demand from buyers who value both location and lifestyle.
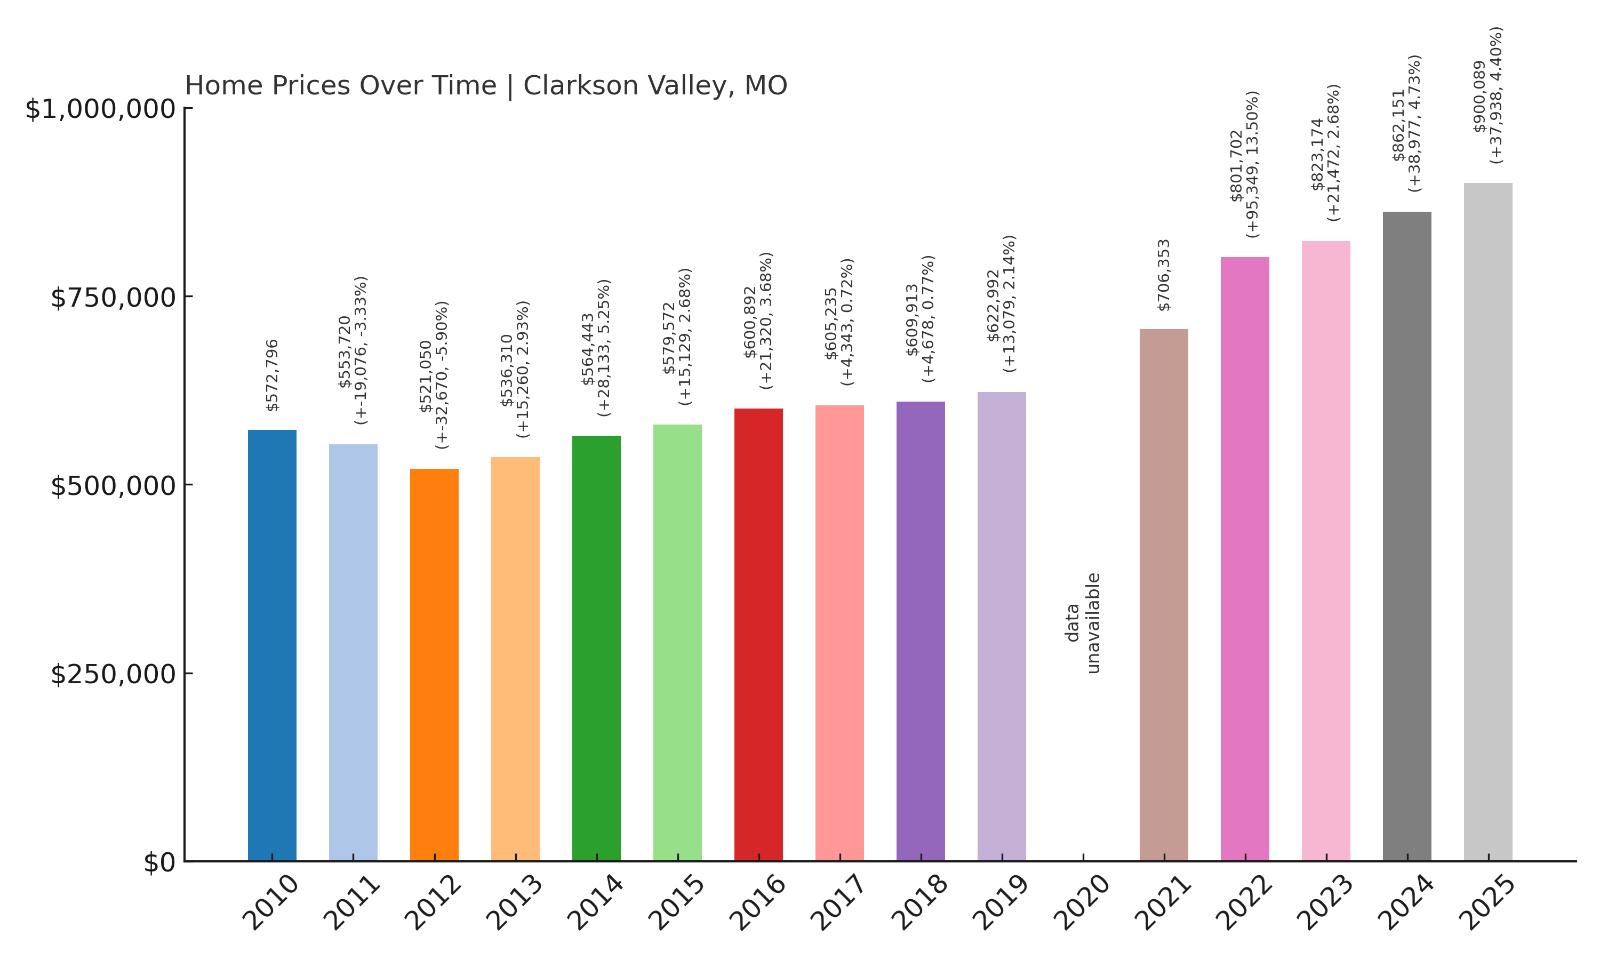
7. Clarkson Valley – 73% Home Price Increase Since 2012
- 2010: $572,796
- 2011: $553,720 ($-19,076, -3.33% from previous year)
- 2012: $521,050 ($-32,670, -5.90% from previous year)
- 2013: $536,310 (+$15,260, +2.93% from previous year)
- 2014: $564,443 (+$28,133, +5.25% from previous year)
- 2015: $579,572 (+$15,129, +2.68% from previous year)
- 2016: $600,892 (+$21,320, +3.68% from previous year)
- 2017: $605,235 (+$4,343, +0.72% from previous year)
- 2018: $609,913 (+$4,679, +0.77% from previous year)
- 2019: $622,992 (+$13,079, +2.14% from previous year)
- 2020: N/A
- 2021: $706,353
- 2022: $801,702 (+$95,348, +13.50% from previous year)
- 2023: $823,174 (+$21,472, +2.68% from previous year)
- 2024: $862,151 (+$38,977, +4.73% from previous year)
- 2025: $900,089 (+$37,938, +4.40% from previous year)
Clarkson Valley has seen a 73% jump in home prices since 2012, reaching an average of $900K in 2025. Much of that growth has occurred in just the past few years, with a dramatic spike in 2022 pushing values upward by nearly $100K in one year. This acceleration points to renewed interest in the suburb, especially among those looking for high-end, move-in-ready homes within reach of West St. Louis County’s job hubs.
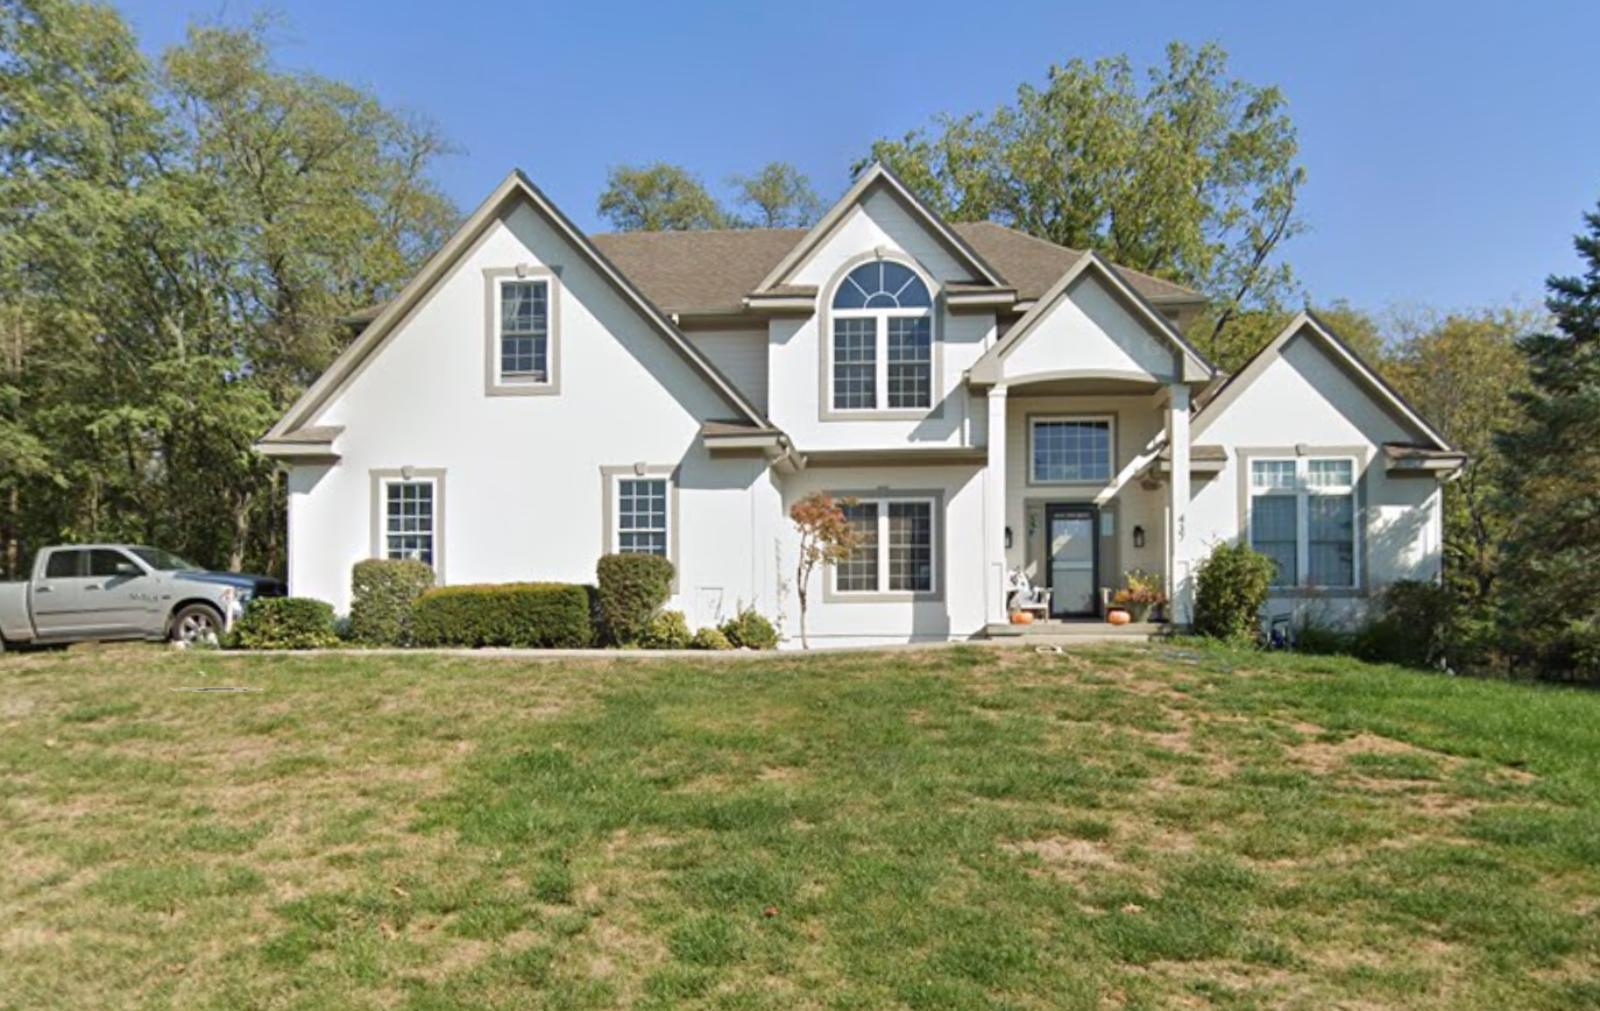
Clarkson Valley – Spacious Homes and Secluded Streets
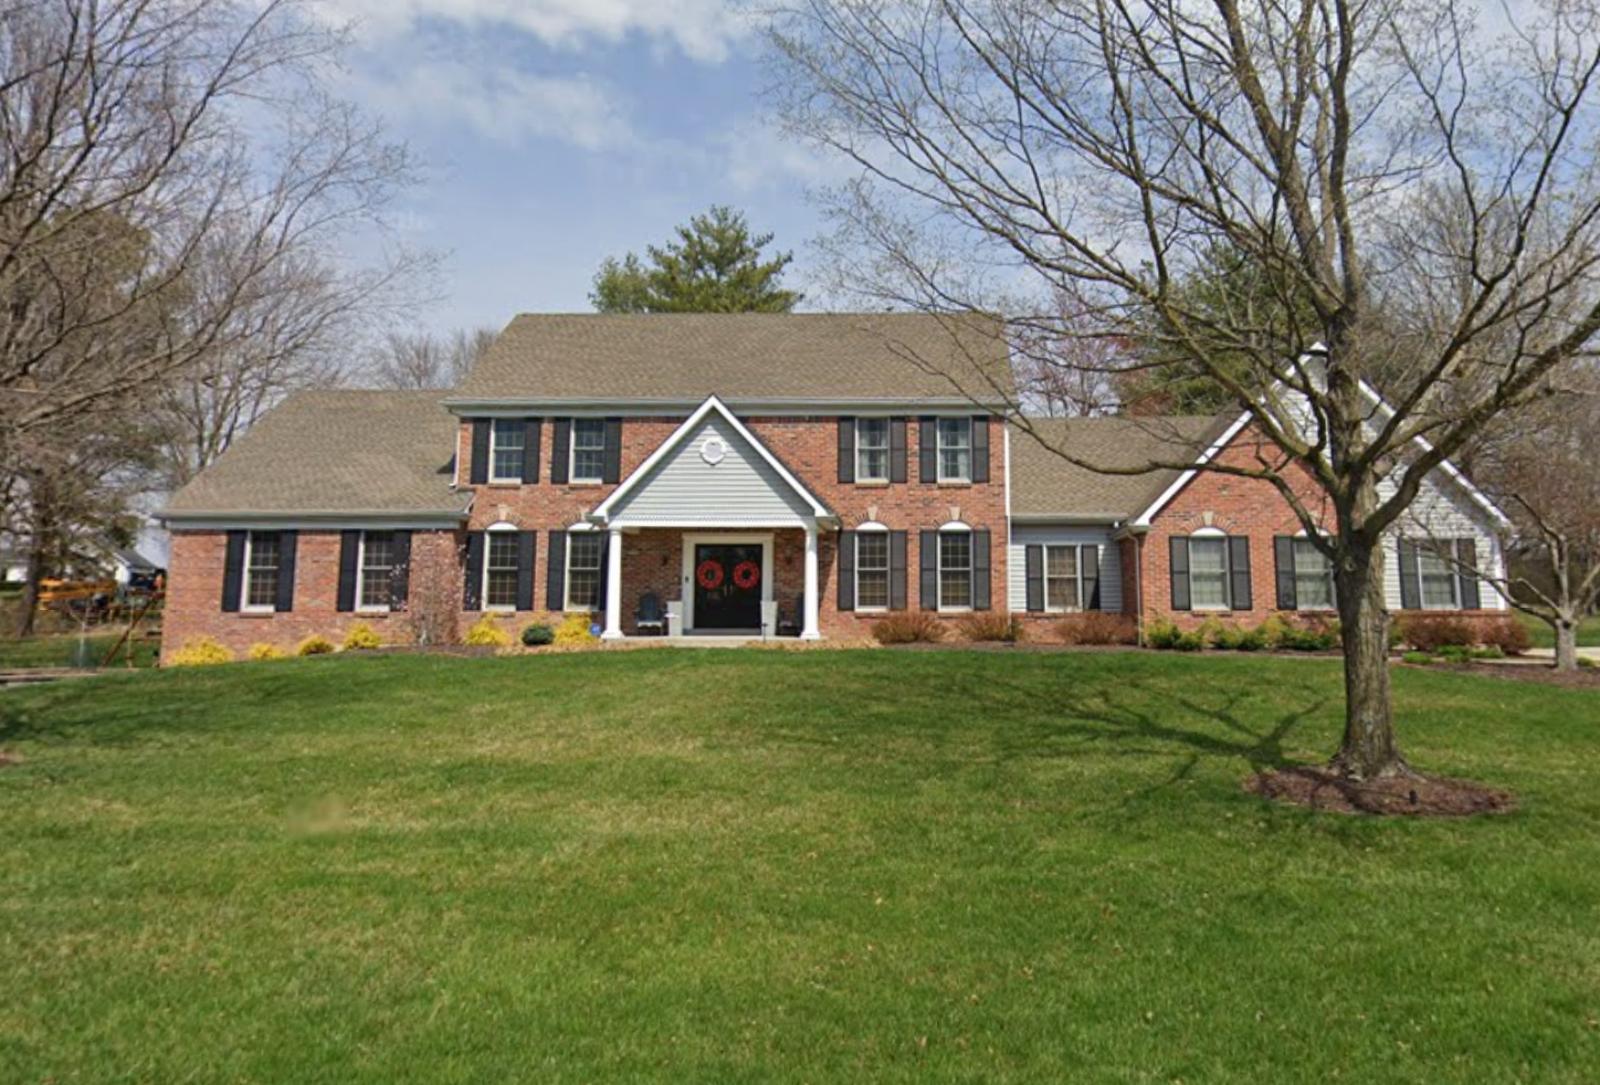
Tucked between Chesterfield and Ballwin, Clarkson Valley is known for its large single-family homes, wooded lots, and winding residential streets. It’s almost entirely residential, with minimal commercial development, which adds to its quiet, secluded character. Many of the properties here were built in the 1980s and 90s and offer generous square footage, finished basements, and well-maintained landscaping.
The town’s high-performing public schools, including those in the Rockwood School District, continue to attract families willing to pay a premium for stability and quality of life. With more people prioritizing home space and privacy post-pandemic, Clarkson Valley has benefited from a new wave of buyers pushing values steadily higher. Inventory remains tight, and that scarcity helps preserve the area’s upscale pricing trajectory.
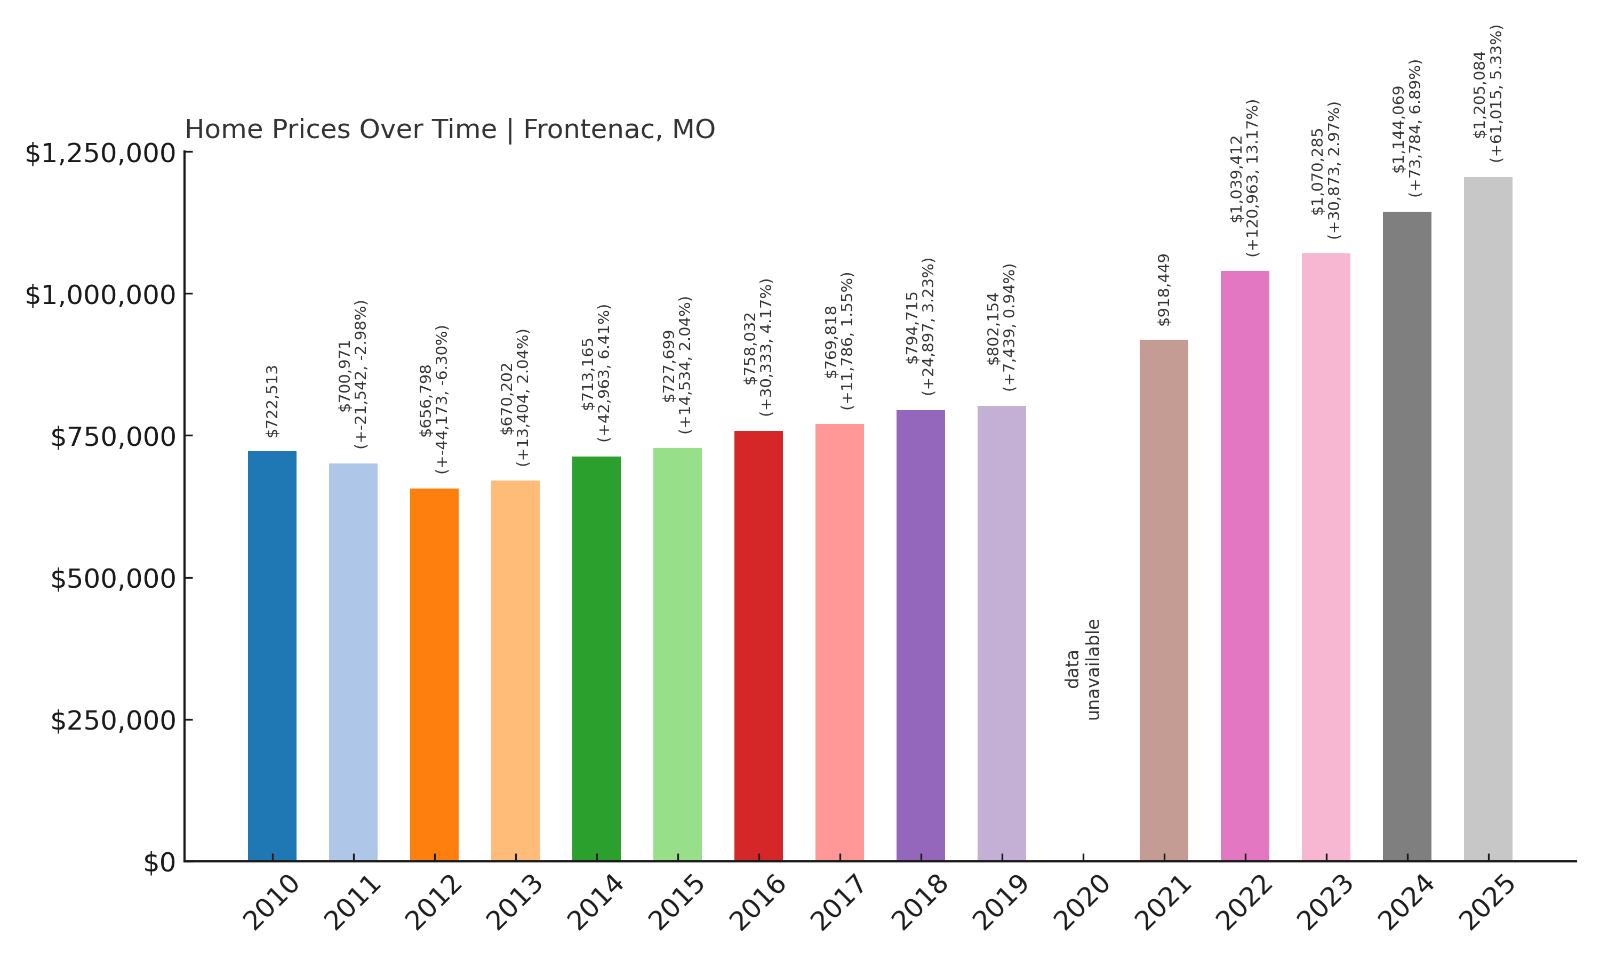
4. Frontenac – 84% Home Price Increase Since 2012
🔥 Would you like to save this?
- 2010: $722,513
- 2011: $700,971 ($-21,542, -2.98% from previous year)
- 2012: $656,798 ($-44,174, -6.30% from previous year)
- 2013: $670,202 (+$13,404, +2.04% from previous year)
- 2014: $713,165 (+$42,964, +6.41% from previous year)
- 2015: $727,699 (+$14,533, +2.04% from previous year)
- 2016: $758,032 (+$30,333, +4.17% from previous year)
- 2017: $769,818 (+$11,786, +1.55% from previous year)
- 2018: $794,715 (+$24,897, +3.23% from previous year)
- 2019: $802,154 (+$7,438, +0.94% from previous year)
- 2020: N/A
- 2021: $918,449
- 2022: $1,039,412 (+$120,962, +13.17% from previous year)
- 2023: $1,070,285 (+$30,873, +2.97% from previous year)
- 2024: $1,144,069 (+$73,784, +6.89% from previous year)
- 2025: $1,205,084 (+$61,016, +5.33% from previous year)
Frontenac home values have grown 84% since 2012, fueled by consistent high-end demand and limited housing availability. The area saw moderate but steady gains through the 2010s, followed by a steep rise in 2022 that pushed prices well above the $1 million mark. In 2025, the average home value stands at over $1.2 million, underscoring the continued strength of this luxury submarket.
Frontenac – St. Louis Luxury at Its Finest
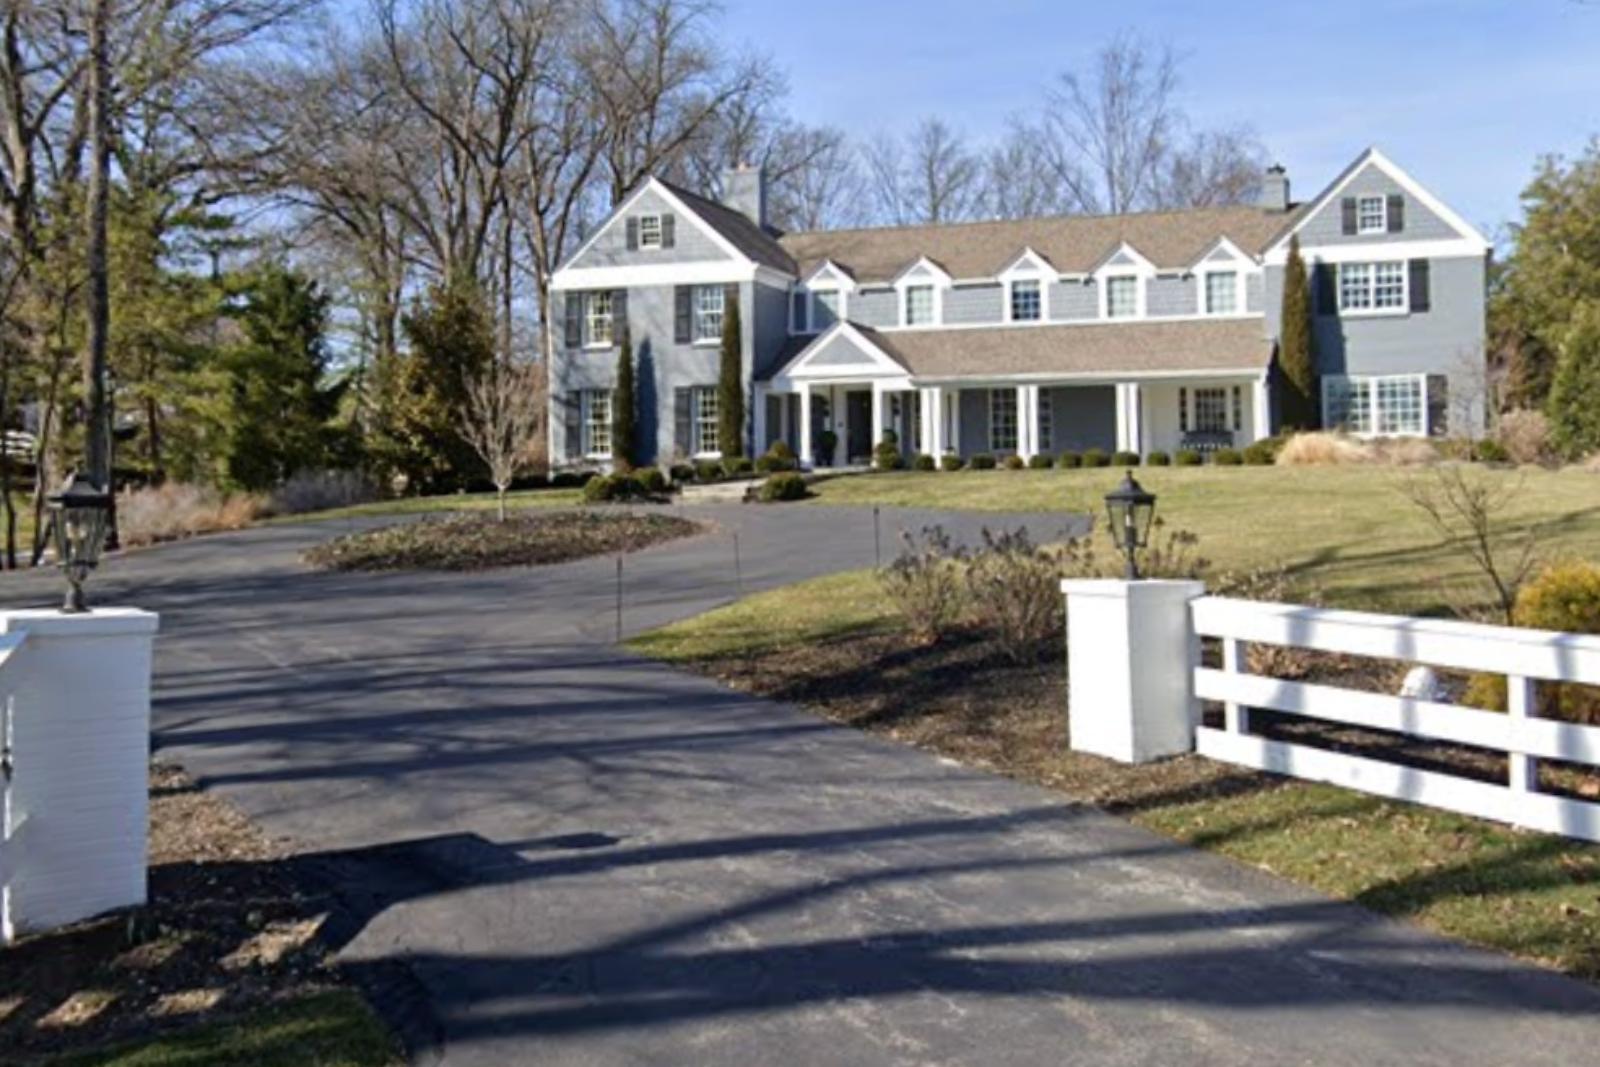
Frontenac is synonymous with upscale suburban living in the St. Louis area. It’s home to sprawling estates, gated communities, and top-tier private schools like Villa Duchesne and Chaminade. Residents enjoy access to Plaza Frontenac, one of Missouri’s premier luxury shopping centers, and quick commutes to business hubs like Clayton and downtown St. Louis.
The town’s prestige is rooted in both its amenities and its exclusivity. Zoning laws keep development low-density, while architectural guidelines ensure consistent quality. As the data shows, prices here have not only held their value—they’ve soared. This makes Frontenac a top choice for buyers prioritizing both elegance and long-term investment security.
3. Village of Loch Lloyd – 134% Home Price Increase Since 2012
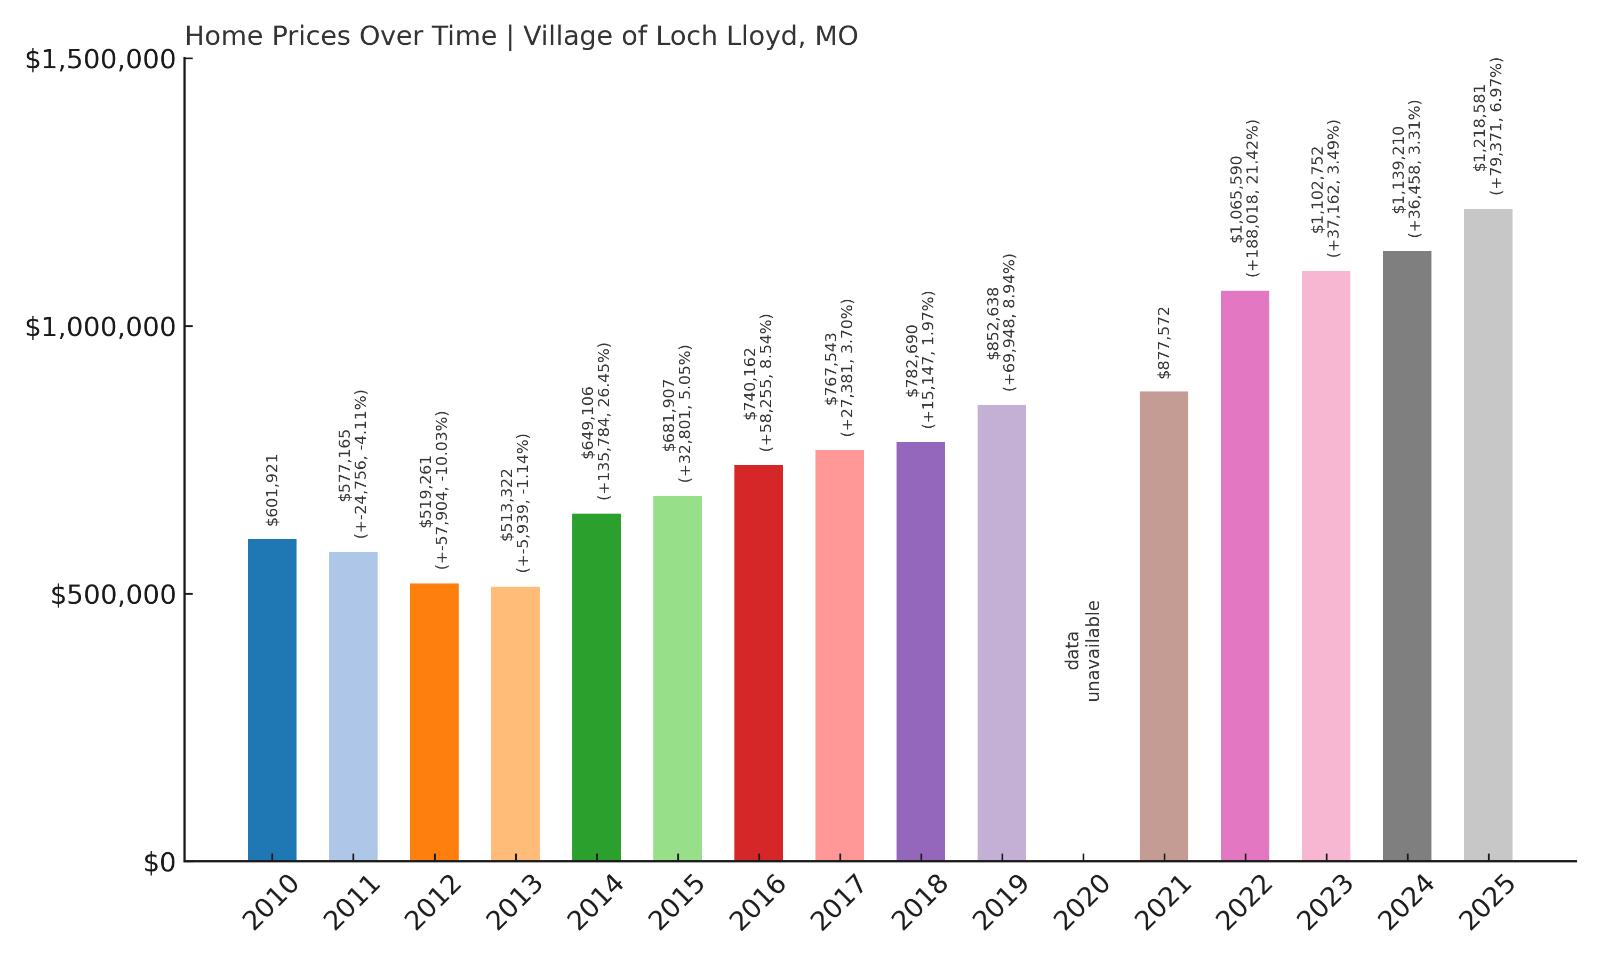
- 2010: $601,921
- 2011: $577,165 ($-24,756, -4.11% from previous year)
- 2012: $519,261 ($-57,904, -10.03% from previous year)
- 2013: $513,322 ($-5,939, -1.14% from previous year)
- 2014: $649,106 (+$135,784, +26.45% from previous year)
- 2015: $681,907 (+$32,801, +5.05% from previous year)
- 2016: $740,162 (+$58,256, +8.54% from previous year)
- 2017: $767,543 (+$27,381, +3.70% from previous year)
- 2018: $782,690 (+$15,147, +1.97% from previous year)
- 2019: $852,638 (+$69,948, +8.94% from previous year)
- 2020:
- 2021: $877,572
- 2022: $1,065,590 (+$188,018, +21.42% from previous year)
- 2023: $1,102,752 (+$37,162, +3.49% from previous year)
- 2024: $1,139,210 (+$36,458, +3.31% from previous year)
- 2025: $1,218,581 (+$79,371, +6.97% from previous year)
The Village of Loch Lloyd has experienced a remarkable 134% increase in home values since 2012, driven by its position as a premier gated golf community. The most dramatic gains came in 2014 and again in 2022, both years posting six-figure value jumps. With home prices now averaging over $1.2 million, Loch Lloyd is one of the fastest-rising luxury housing markets in Missouri.
Village of Loch Lloyd – Exclusive, Gated, and Growing
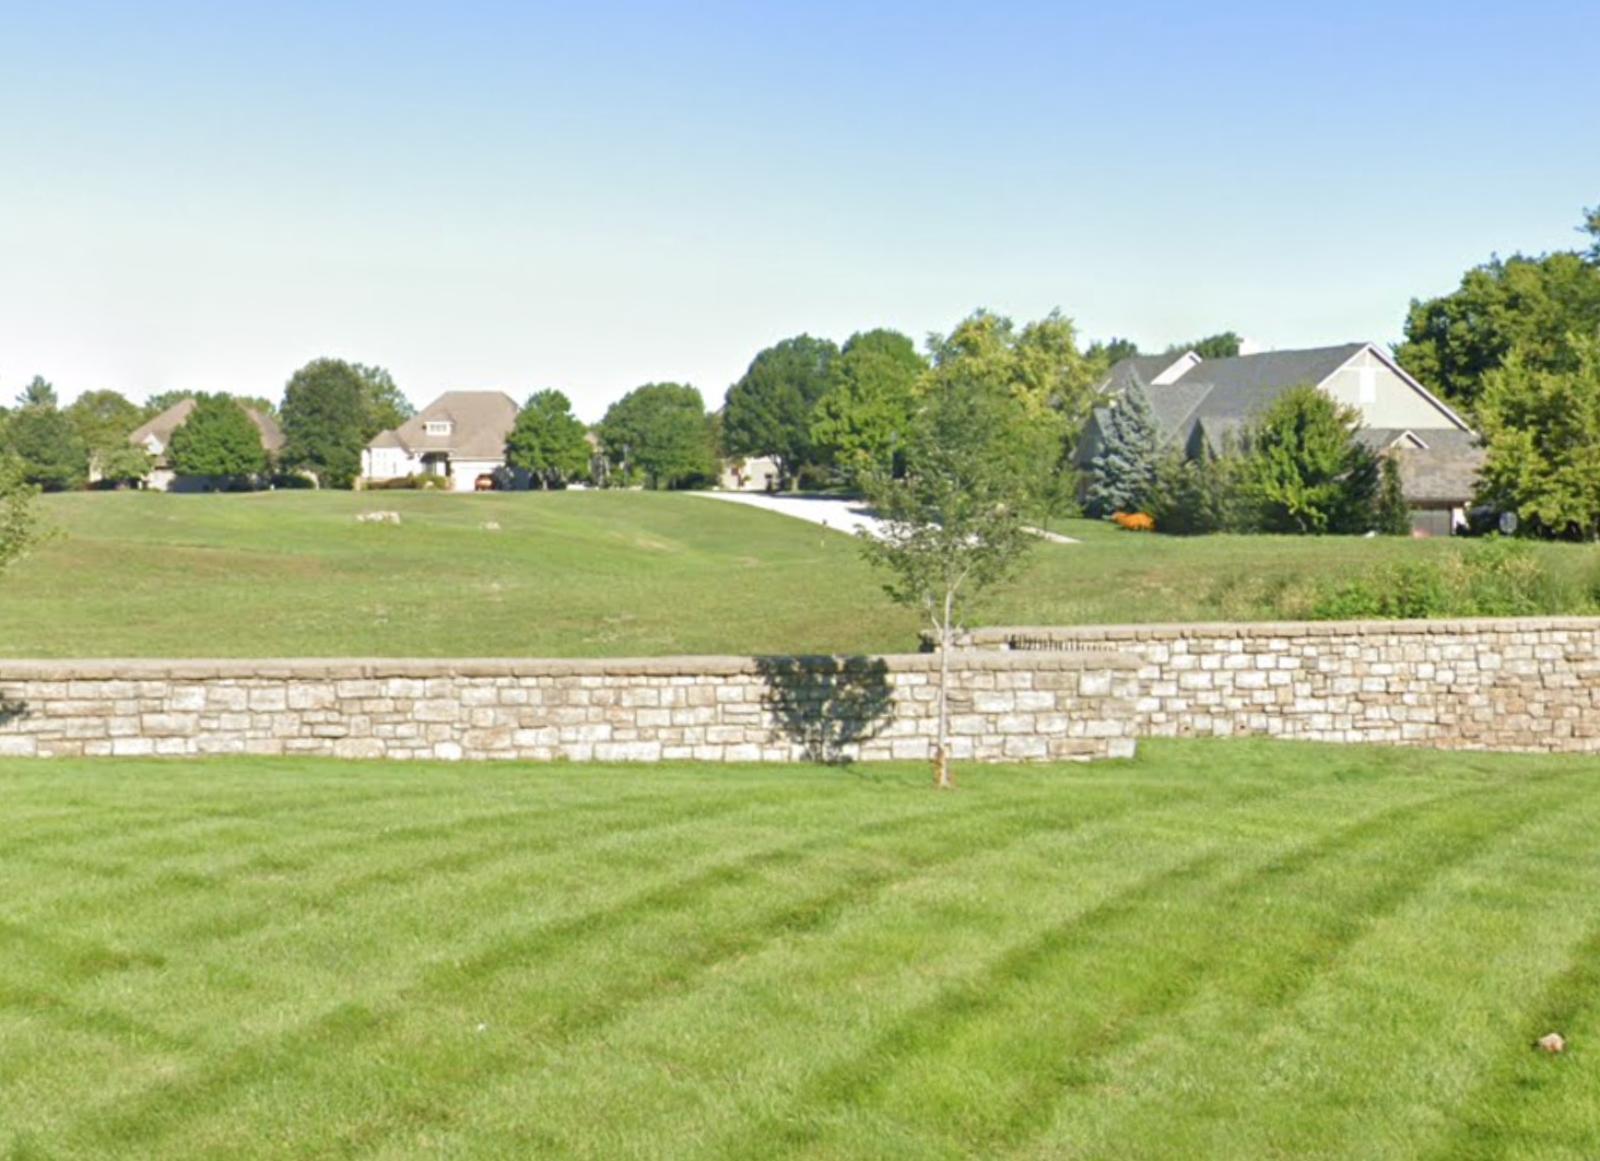
Located on the Missouri-Kansas border just south of Kansas City, Loch Lloyd is built around a private lake and championship golf course designed by Tom Watson. This meticulously planned gated community features large custom homes, 24/7 security, and resort-style amenities that attract high-net-worth individuals and retirees.
The area is still expanding with carefully phased luxury home developments and modern estate designs. Its controlled growth, combined with elite offerings and proximity to Kansas City’s southern suburbs, has driven sustained demand. As homebuyers continue to prioritize privacy, exclusivity, and high-end living, Loch Lloyd’s home values have soared accordingly.
2. Ladue – 90% Home Price Increase Since 2012
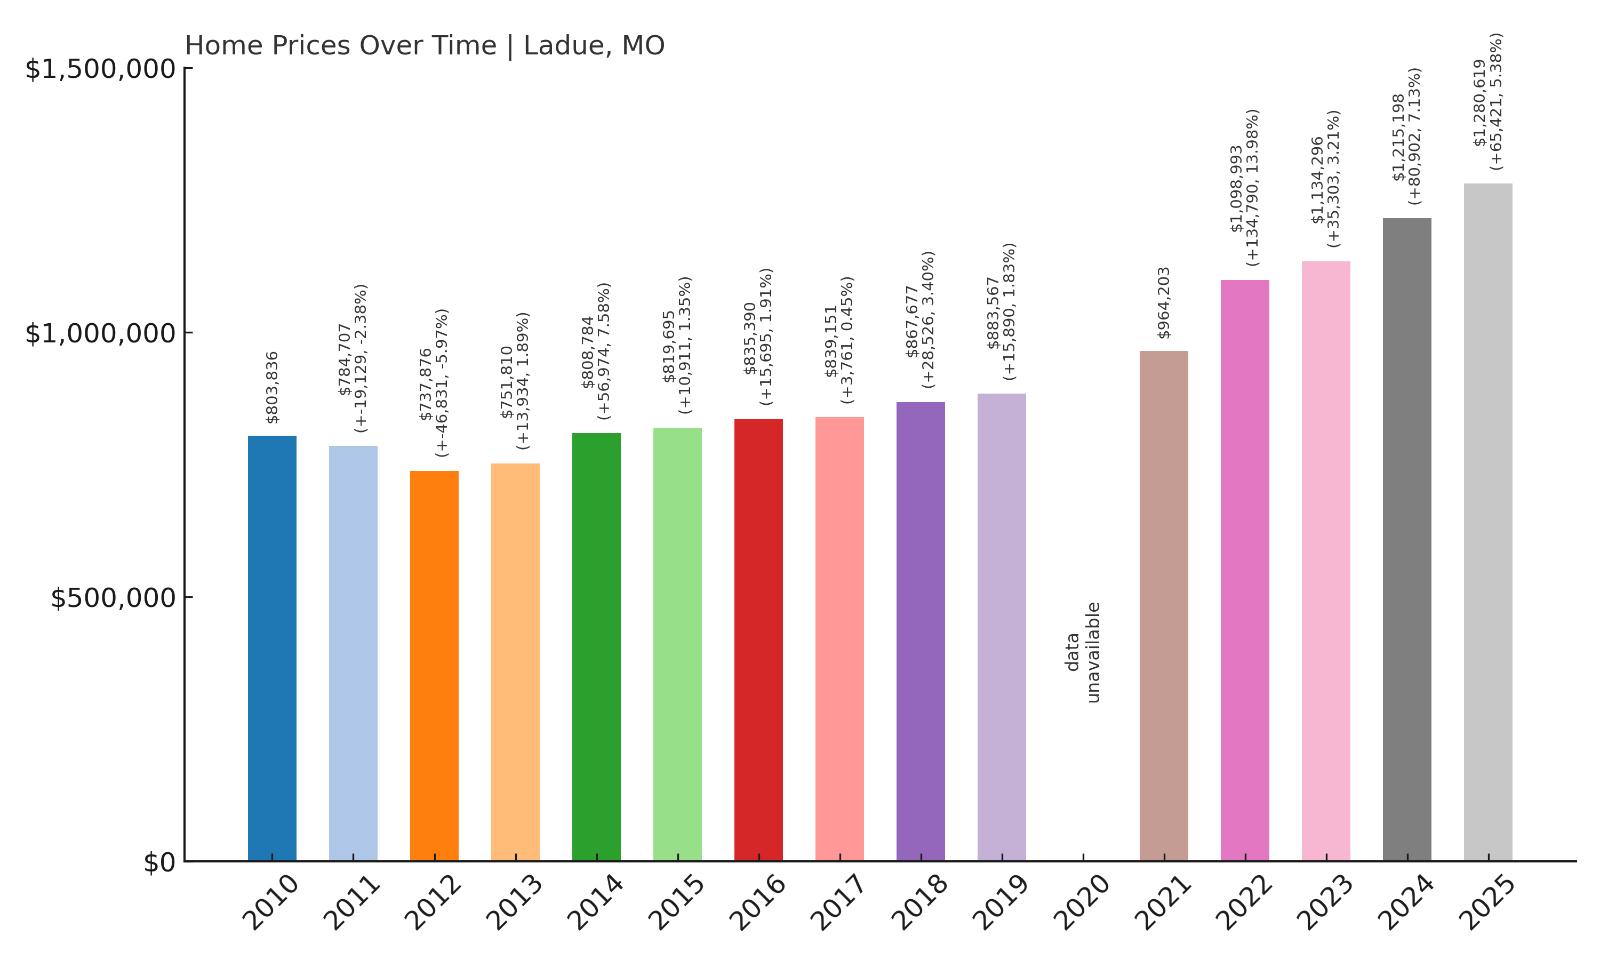
- 2010: $803,836
- 2011: $784,707 ($-19,129, -2.38% from previous year)
- 2012: $737,876 ($-46,831, -5.97% from previous year)
- 2013: $751,810 (+$13,935, +1.89% from previous year)
- 2014: $808,784 (+$56,974, +7.58% from previous year)
- 2015: $819,695 (+$10,911, +1.35% from previous year)
- 2016: $835,390 (+$15,694, +1.91% from previous year)
- 2017: $839,151 (+$3,762, +0.45% from previous year)
- 2018: $867,677 (+$28,525, +3.40% from previous year)
- 2019: $883,567 (+$15,890, +1.83% from previous year)
- 2020: N/A
- 2021: $964,203
- 2022: $1,098,993 (+$134,791, +13.98% from previous year)
- 2023: $1,134,296 (+$35,302, +3.21% from previous year)
- 2024: $1,215,198 (+$80,902, +7.13% from previous year)
- 2025: $1,280,619 (+$65,421, +5.38% from previous year)
Ladue home prices have risen 90% since 2012, cementing its place as one of the most prestigious addresses in the state. The post-2020 market brought some of the biggest annual gains, including a jump of nearly $135K in 2022 alone. With average values now pushing $1.3 million, the Ladue market continues to attract the state’s wealthiest homebuyers.
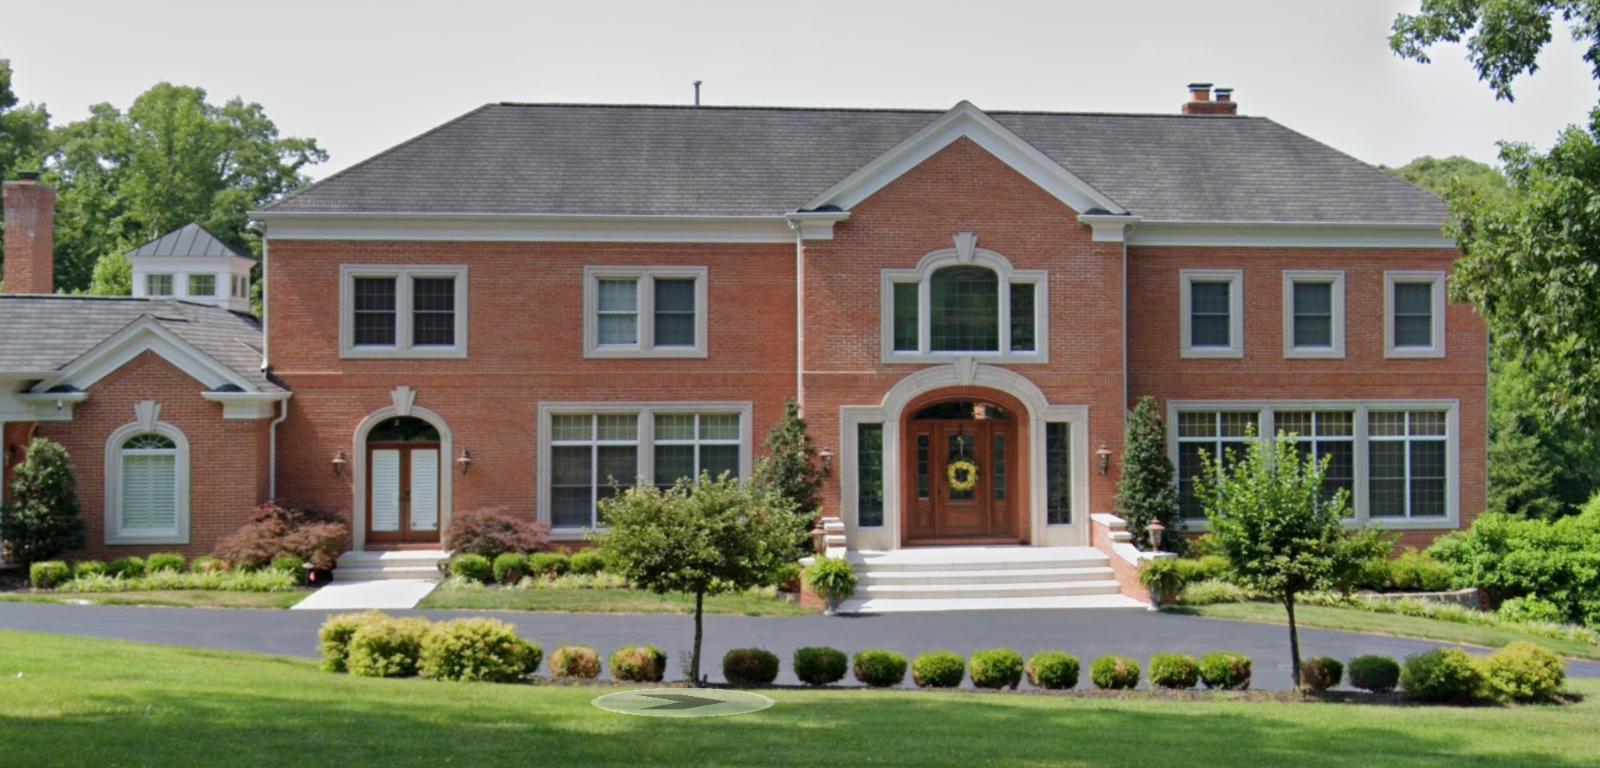
Ladue – Old Money, Lasting Value
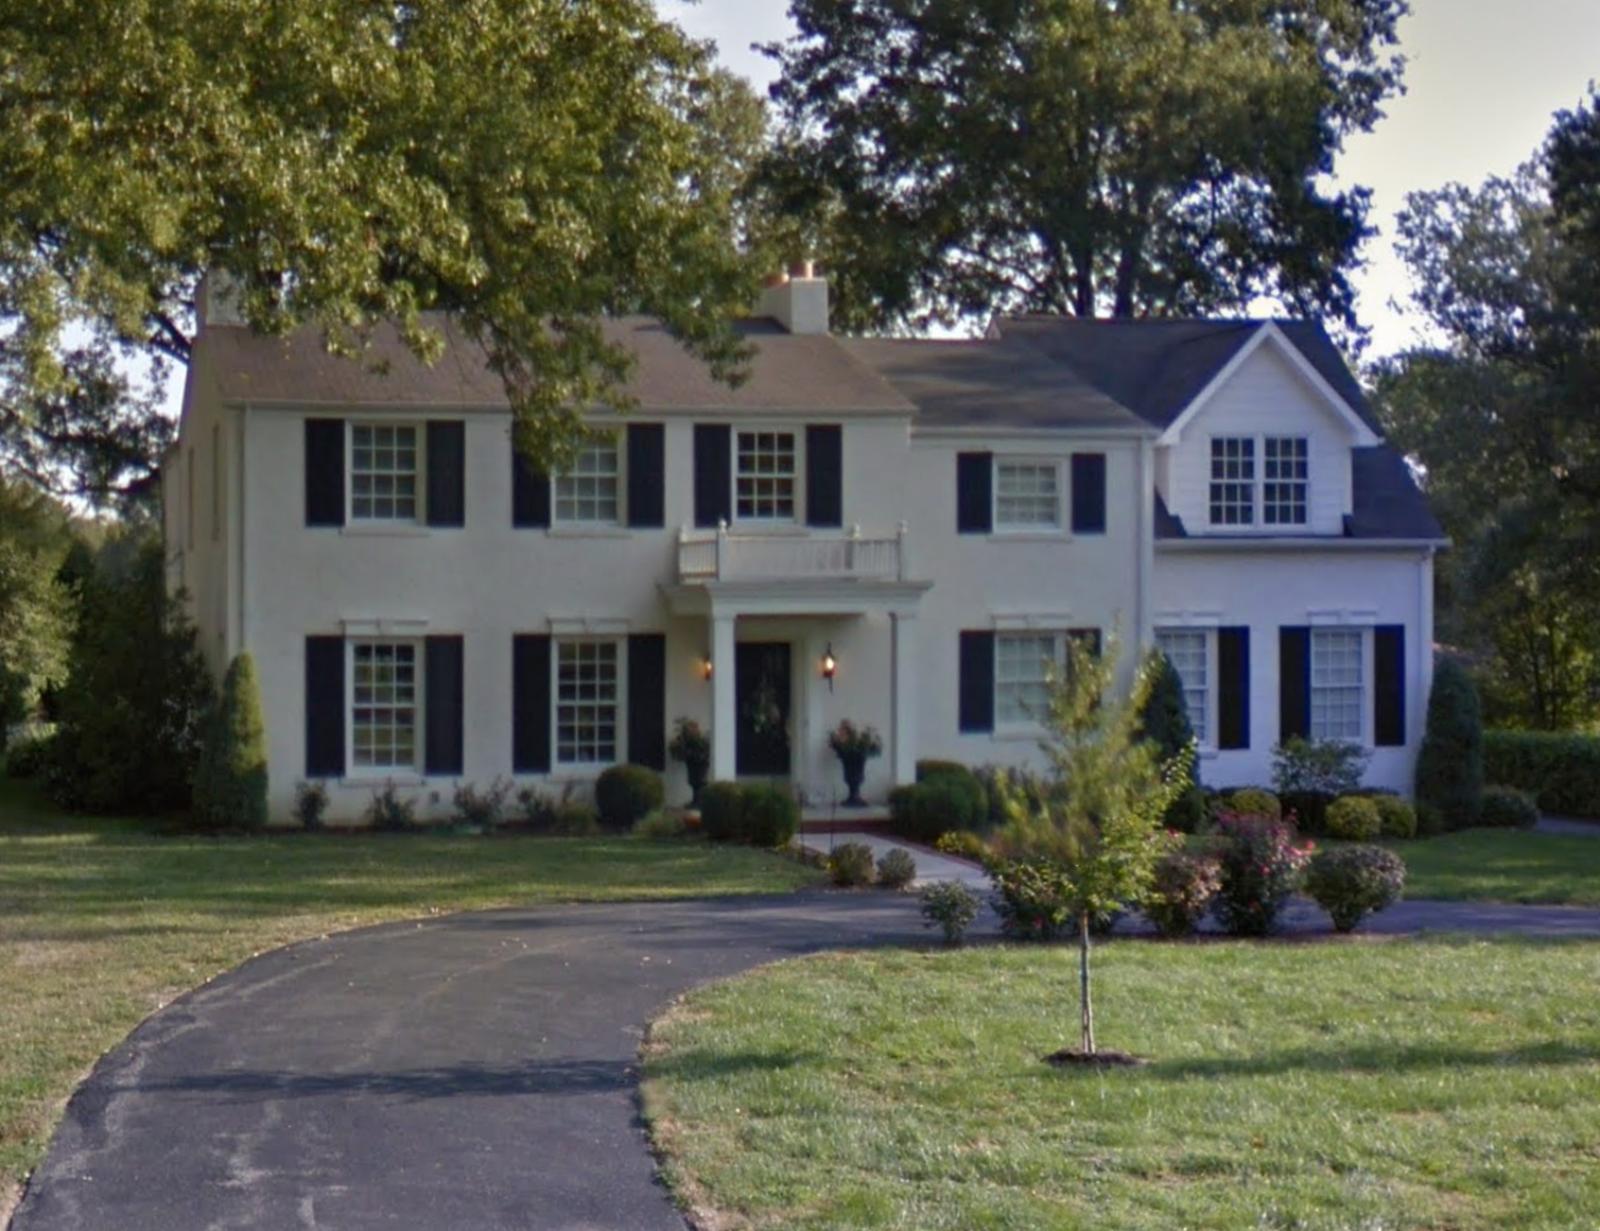
Ladue has long been the gold standard for affluence in the St. Louis area. With its stately mansions, winding roads, and elite private schools like MICDS and John Burroughs, the town has maintained an image of timeless wealth and discretion. It’s known for its country club culture, historic estates, and tree-lined streets that offer both prestige and privacy.
Limited development and strong zoning laws preserve its character, while top public schools and proximity to downtown St. Louis add everyday appeal. The price growth in recent years shows that Ladue is not only holding its own—it’s thriving. In a high-end market where stability and long-term appreciation matter, Ladue remains an unmatched destination.
1. Huntleigh – 139% Home Price Increase Since 2012

- 2010: $1,532,543
- 2011: $1,427,603 ($-104,940, -6.85% from previous year)
- 2012: $1,346,194 ($-81,408, -5.70% from previous year)
- 2013: $1,364,353 (+$18,158, +1.35% from previous year)
- 2014: $1,470,614 (+$106,262, +7.79% from previous year)
- 2015: $1,521,456 (+$50,842, +3.46% from previous year)
- 2016: $1,577,628 (+$56,172, +3.69% from previous year)
- 2017: $1,559,702 ($-17,926, -1.14% from previous year)
- 2018: $1,589,721 (+$30,018, +1.92% from previous year)
- 2019: $1,617,795 (+$28,074, +1.77% from previous year)
- 2020: N/A
- 2021: $1,833,027
- 2022: $2,087,225 (+$254,199, +13.87% from previous year)
- 2023: $2,054,876 ($-32,350, -1.55% from previous year)
- 2024: $2,216,343 (+$161,467, +7.86% from previous year)
- 2025: $2,323,146 (+$106,803, +4.82% from previous year)
Huntleigh tops the list with a staggering 139% increase in home prices since 2012. Already one of the wealthiest towns in Missouri, it has continued to outpace even other luxury markets. Home values surged again in 2022 and 2024, with the average price now sitting at a record-breaking $2.32 million in 2025. These figures reflect not just appreciation, but exclusivity at the highest level.
Huntleigh – Missouri’s Most Prestigious Zip Code
Huntleigh is more than just a town—it’s a symbol of old-money wealth and understated luxury. Located in the heart of St. Louis County, it covers less than two square miles but is home to sprawling estates, gated mansions, and some of the state’s most influential families. Zoning laws limit development to single-family homes on large lots, preserving the town’s secluded feel.
There are no commercial zones, no apartment buildings, and no public parks—just private wealth and expansive grounds. Huntleigh’s residents value privacy and exclusivity above all else, and that’s reflected in the town’s meteoric price growth. For those who can afford it, there is no more elite address in the state of Missouri.