
🔥 Would you like to save this?
Using data from the Zillow Home Value Index, we examined home price trends across Texas to identify the 18 towns with the highest property values in 2025. These communities have seen years of steady appreciation, with some experiencing dramatic spikes just in the last few years. From exclusive suburbs to scenic enclaves, each place on this list offers a different perspective on why Texas real estate is commanding such steep prices.
While the state’s overall housing market has grown significantly, this list zeroes in on the towns that have truly surged to the top. Whether it’s due to location, amenities, school districts, or sheer demand, each town tells a unique story of rising property values. Below, we’ll explore how prices have changed year by year and what makes these places stand out—without hype or filler, just the facts and context you need.
In order to come up with the very specific design ideas, we create most designs with the assistance of state-of-the-art AI interior design software. Also, assume links that take you off the site are affiliate links such as links to Amazon. this means we may earn a commission if you buy something.
18. Olmos Park – 108% Home Price Increase Since 2010

- 2010: $462,159
- 2011: $460,509 (-$1,650, -0.36% from previous year)
- 2012: $461,844 (+$1,335, +0.29% from previous year)
- 2013: $469,788 (+$7,944, +1.72% from previous year)
- 2014: $480,436 (+$10,648, +2.27% from previous year)
- 2015: $495,006 (+$14,570, +3.03% from previous year)
- 2016: $515,264 (+$20,258, +4.09% from previous year)
- 2017: $541,691 (+$26,427, +5.13% from previous year)
- 2018: $572,301 (+$30,610, +5.65% from previous year)
- 2019: $603,746 (+$31,445, +5.50% from previous year)
- 2020: N/A
- 2021: $713,956
- 2022: $796,655 (+$82,699, +11.58% from previous year)
- 2023: $844,577 (+$47,922, +6.02% from previous year)
- 2024: $902,883 (+$58,306, +6.90% from previous year)
- 2025: $961,189 (+$58,306, +6.46% from previous year)
Home values in Olmos Park have more than doubled since 2010, increasing by 108% to reach $961,189 in 2025. While annual growth was relatively modest through the early 2010s, the past five years have brought steady, mid-single-digit increases. The sharpest rise came in 2022, with an 11.58% jump from the previous year, signaling accelerating demand for this sought-after area just north of San Antonio.
Olmos Park – Steady Climb in a Prime San Antonio Enclave

Located just a few miles north of downtown San Antonio, Olmos Park is a well-established community known for its stately homes, mature trees, and excellent access to shopping and cultural amenities. With a strong local identity and proximity to top private schools and Trinity University, the town consistently appeals to high-income professionals.
Its small size and zoning regulations have kept new construction limited, which, paired with its historic charm, has driven up demand. As San Antonio has grown rapidly over the past decade, Olmos Park has benefitted from being an upscale, established enclave close to the urban core. This prestige is reflected in its housing market, which has remained resilient and attractive to buyers with long-term investment horizons.
17. Sunset Valley – 105% Home Price Increase Since 2010

- 2010: $504,169
- 2011: $485,621 (-$18,548, -3.68% from previous year)
- 2012: $480,231 (-$5,390, -1.11% from previous year)
- 2013: $490,548 (+$10,317, +2.15% from previous year)
- 2014: $502,599 (+$12,051, +2.46% from previous year)
- 2015: $518,977 (+$16,378, +3.26% from previous year)
- 2016: $538,945 (+$19,968, +3.85% from previous year)
- 2017: $566,890 (+$27,945, +5.18% from previous year)
- 2018: $603,455 (+$36,565, +6.45% from previous year)
- 2019: $642,434 (+$38,979, +6.46% from previous year)
- 2020: N/A
- 2021: $759,811
- 2022: $845,477 (+$85,666, +11.28% from previous year)
- 2023: $895,521 (+$50,044, +5.92% from previous year)
- 2024: $964,165 (+$68,644, +7.67% from previous year)
- 2025: $1,032,808 (+$68,643, +7.12% from previous year)
Sunset Valley’s home values have risen 105% since 2010, breaking the million-dollar mark by 2025. The town saw its biggest boost in 2022, when prices climbed more than 11% from the year before. Though there were brief dips in the early years, the past decade has seen consistent, robust appreciation fueled by proximity to Austin and tight housing supply.
Sunset Valley – Small Footprint, Big Appeal Near Austin

Sunset Valley is a tiny city surrounded by southwest Austin, offering rural charm with urban convenience. It boasts excellent access to MoPac and U.S. 290, along with a number of major shopping centers. While it spans less than 1.5 square miles, its appeal is outsized thanks to its strategic location and reputation for quiet, residential living near the city.
Residents enjoy lower property taxes and a more laid-back environment, which has made it increasingly desirable as Austin’s housing prices and congestion have surged. Homebuyers are drawn to its space, privacy, and easy access to downtown, helping to push home values steadily upward despite its size.
16. Volente – 105% Home Price Increase Since 2010

- 2010: $516,041
- 2011: $497,051 (-$18,990, -3.68% from previous year)
- 2012: $491,524 (-$5,527, -1.11% from previous year)
- 2013: $502,095 (+$10,571, +2.15% from previous year)
- 2014: $514,451 (+$12,356, +2.46% from previous year)
- 2015: $531,228 (+$16,777, +3.26% from previous year)
- 2016: $551,678 (+$20,450, +3.85% from previous year)
- 2017: $580,358 (+$28,680, +5.20% from previous year)
- 2018: $617,792 (+$37,434, +6.45% from previous year)
- 2019: $657,665 (+$39,873, +6.45% from previous year)
- 2020: N/A
- 2021: $778,058
- 2022: $866,006 (+$87,948, +11.30% from previous year)
- 2023: $917,279 (+$51,273, +5.92% from previous year)
- 2024: $987,200 (+$69,921, +7.62% from previous year)
- 2025: $1,057,121 (+$69,921, +7.08% from previous year)
Volente’s home prices have climbed from just over $500,000 in 2010 to more than $1 million by 2025, marking a 105% increase. Most of that growth has come in the past five years, including a standout jump in 2022. With consistent 5–7% annual gains recently, Volente has clearly become a magnet for buyers seeking high-end homes in scenic settings.
Volente – Hill Country Living With Lake Views

Located on the north shore of Lake Travis, Volente is a tranquil Hill Country village known for its lakefront homes and panoramic views. It’s part of the Greater Austin area but feels far removed, offering a slower pace of life and direct access to water recreation and hiking trails.
As Austin’s metro area has exploded, Volente’s desirability has risen accordingly. With limited development, larger lots, and natural amenities, the town has drawn affluent buyers seeking privacy and beauty. These factors, combined with proximity to tech jobs and Austin nightlife, have sent prices steadily higher.
15. Copper Canyon – 81% Home Price Increase Since 2010

- 2010: $607,749
- 2011: $585,378 (-$22,371, -3.68% from previous year)
- 2012: $578,877 (-$6,501, -1.11% from previous year)
- 2013: $591,326 (+$12,449, +2.15% from previous year)
- 2014: $605,876 (+$14,550, +2.46% from previous year)
- 2015: $625,625 (+$19,749, +3.26% from previous year)
- 2016: $649,702 (+$24,077, +3.85% from previous year)
- 2017: $683,475 (+$33,773, +5.20% from previous year)
- 2018: $727,569 (+$44,094, +6.45% from previous year)
- 2019: $774,540 (+$46,971, +6.46% from previous year)
- 2020: N/A
- 2021: $916,207
- 2022: $1,019,536 (+$103,329, +11.28% from previous year)
- 2023: $1,079,893 (+$60,357, +5.92% from previous year)
- 2024: $1,090,748 (+$10,855, +1.01% from previous year)
- 2025: $1,101,603 (+$10,855, +1.00% from previous year)
Copper Canyon’s home prices rose from just over $600,000 in 2010 to over $1.1 million by 2025—a gain of 81%. The most dramatic rise occurred between 2021 and 2022 with a double-digit percentage increase, followed by a tapering off in annual growth. Still, the long-term trend reflects steady and significant appreciation.
Copper Canyon – Horse Country With High-End Growth

Nestled in Denton County, Copper Canyon is known for its equestrian properties, large lots, and semi-rural charm. Despite being just a short drive from major DFW suburbs like Flower Mound and Highland Village, it offers a much more laid-back, country-style lifestyle that’s increasingly in demand.
The appeal of quiet, spacious living with urban access has drawn new homeowners to the area, especially over the past decade. Large custom homes and limited new development have helped push property values upward. While recent years have seen slower increases, the foundation of demand remains strong, especially among affluent buyers looking for breathing room.
14. Lucas – 89% Home Price Increase Since 2010

- 2010: $587,624
- 2011: $566,019 (-$21,605, -3.68% from previous year)
- 2012: $559,732 (-$6,287, -1.11% from previous year)
- 2013: $571,753 (+$12,021, +2.15% from previous year)
- 2014: $585,808 (+$14,055, +2.46% from previous year)
- 2015: $604,891 (+$19,083, +3.26% from previous year)
- 2016: $628,183 (+$23,292, +3.85% from previous year)
- 2017: $660,836 (+$32,653, +5.20% from previous year)
- 2018: $703,456 (+$42,620, +6.45% from previous year)
- 2019: $748,900 (+$45,444, +6.46% from previous year)
- 2020: N/A
- 2021: $885,933
- 2022: $985,838 (+$99,905, +11.28% from previous year)
- 2023: $1,044,215 (+$58,377, +5.92% from previous year)
- 2024: $1,078,590 (+$34,375, +3.29% from previous year)
- 2025: $1,112,965 (+$34,375, +3.19% from previous year)
Lucas has seen a nearly 90% increase in home values since 2010, with its average home price hitting over $1.1 million in 2025. The last decade has been marked by consistent appreciation, with peak growth occurring from 2021 to 2022. More recently, price gains have moderated but remain steady.
Lucas – Spacious Living in the Heart of Collin County

Situated east of Allen in Collin County, Lucas is known for its open land, high-end custom homes, and rural ambiance. Residents enjoy a peaceful setting with easy access to major employment hubs, excellent schools in Lovejoy ISD, and proximity to Lake Lavon for recreation.
The town’s strong reputation for quality of life and its large properties continue to attract buyers seeking upscale suburban living. Limited commercial development and zoning that favors residential space have kept inventory tight, supporting home value increases over the long haul.
13. Parker – 97% Home Price Increase Since 2010

- 2010: $567,249
- 2011: $546,379 (-$20,870, -3.68% from previous year)
- 2012: $540,302 (-$6,077, -1.11% from previous year)
- 2013: $551,916 (+$11,614, +2.15% from previous year)
- 2014: $565,487 (+$13,571, +2.46% from previous year)
- 2015: $583,919 (+$18,432, +3.26% from previous year)
- 2016: $606,394 (+$22,475, +3.85% from previous year)
- 2017: $637,935 (+$31,541, +5.20% from previous year)
- 2018: $679,089 (+$41,154, +6.45% from previous year)
- 2019: $722,937 (+$43,848, +6.46% from previous year)
- 2020: N/A
- 2021: $855,040
- 2022: $951,520 (+$96,480, +11.28% from previous year)
- 2023: $1,007,857 (+$56,337, +5.92% from previous year)
- 2024: $1,063,699 (+$55,842, +5.54% from previous year)
- 2025: $1,119,540 (+$55,841, +5.25% from previous year)
Parker’s housing market has nearly doubled in value since 2010, climbing from just over $567,000 to $1.1 million in 2025. The town enjoyed several strong growth years, with notable jumps after 2020. Growth has remained solid even as price appreciation slows across the state.
Parker – A Quiet Success Story in North Texas

Best known as the filming location for the Southfork Ranch of “Dallas” TV fame, Parker has grown into a quiet luxury haven northeast of Plano. It’s ideal for buyers looking for estate-sized lots, scenic views, and relative seclusion while still being part of the fast-growing Collin County economy.
High-performing schools, generous zoning, and limited commercial intrusion make it a standout among North Texas towns. While it flies under the radar compared to bigger neighbors, its home values speak volumes about its enduring appeal and affluent resident base.
12. Bellaire – 111% Home Price Increase Since 2010

🔥 Would you like to save this?
- 2010: $533,471
- 2011: $513,858 (-$19,613, -3.68% from previous year)
- 2012: $508,156 (-$5,702, -1.11% from previous year)
- 2013: $519,075 (+$10,919, +2.15% from previous year)
- 2014: $531,839 (+$12,764, +2.46% from previous year)
- 2015: $549,180 (+$17,341, +3.26% from previous year)
- 2016: $570,320 (+$21,140, +3.85% from previous year)
- 2017: $599,978 (+$29,658, +5.20% from previous year)
- 2018: $638,691 (+$38,713, +6.45% from previous year)
- 2019: $679,950 (+$41,259, +6.46% from previous year)
- 2020: N/A
- 2021: $804,387
- 2022: $895,212 (+$90,825, +11.29% from previous year)
- 2023: $948,198 (+$52,986, +5.92% from previous year)
- 2024: $1,037,486 (+$89,288, +9.42% from previous year)
- 2025: $1,126,774 (+$89,288, +8.61% from previous year)
Bellaire’s real estate market has soared 111% since 2010, with home prices climbing from the mid-$500,000s to over $1.1 million. Growth was especially strong after 2021, and the trend has remained upward through 2025. High demand and proximity to Houston’s job centers are major factors behind its rise.
Bellaire – Big-City Access With Neighborhood Feel

Bellaire is a highly desirable enclave within Houston, valued for its tree-lined streets, top-rated public schools, and short commute to the Texas Medical Center and Galleria. It has long been a magnet for professionals seeking suburban space within city limits.
The area is known for constant reinvestment, with older homes often replaced by new construction. Strong school performance and municipal services also add to its reputation. While flooding has challenged parts of the community in past years, prices have remained resilient thanks to location and desirability.
11. Round Top – 95% Home Price Increase Since 2010

- 2010: $613,282
- 2011: $590,713 (-$22,569, -3.68% from previous year)
- 2012: $584,157 (-$6,556, -1.11% from previous year)
- 2013: $596,715 (+$12,558, +2.15% from previous year)
- 2014: $611,395 (+$14,680, +2.46% from previous year)
- 2015: $631,329 (+$19,934, +3.26% from previous year)
- 2016: $655,641 (+$24,312, +3.85% from previous year)
- 2017: $689,746 (+$34,105, +5.20% from previous year)
- 2018: $734,233 (+$44,487, +6.45% from previous year)
- 2019: $781,660 (+$47,427, +6.46% from previous year)
- 2020: N/A
- 2021: $924,549
- 2022: $1,028,823 (+$104,274, +11.28% from previous year)
- 2023: $1,089,695 (+$60,872, +5.92% from previous year)
- 2024: $1,142,881 (+$53,186, +4.88% from previous year)
- 2025: $1,196,067 (+$53,186, +4.65% from previous year)
Round Top’s home values have increased nearly 95% since 2010, with prices growing steadily year after year. Significant surges occurred in 2021 and 2022, and appreciation has remained strong through 2025. This steady growth reflects a sustained interest in the area’s unique blend of culture and charm.
Round Top – Cultural Destination With a Rural Heart

Famous for its antique fairs and arts scene, Round Top is a small town with outsized influence located midway between Houston and Austin. With a population of just over 100, it attracts thousands of visitors each year, particularly during its widely known antiques festivals.
This attention has translated into real estate demand, particularly for second homes and retreats. With limited inventory and historic preservation, home values have benefited from both exclusivity and consistent buyer interest. The result is a town that offers peace, culture, and strong appreciation potential.
10. Hill Country Village – 102% Home Price Increase Since 2010

- 2010: $615,887
- 2011: $593,218 (-$22,669, -3.68% from previous year)
- 2012: $586,635 (-$6,583, -1.11% from previous year)
- 2013: $599,234 (+$12,599, +2.15% from previous year)
- 2014: $613,971 (+$14,737, +2.46% from previous year)
- 2015: $633,997 (+$20,026, +3.26% from previous year)
- 2016: $658,394 (+$24,397, +3.85% from previous year)
- 2017: $692,647 (+$34,253, +5.20% from previous year)
- 2018: $737,326 (+$44,679, +6.45% from previous year)
- 2019: $784,934 (+$47,608, +6.46% from previous year)
- 2020: N/A
- 2021: $928,429
- 2022: $1,033,133 (+$104,704, +11.28% from previous year)
- 2023: $1,094,290 (+$61,157, +5.92% from previous year)
- 2024: $1,167,192 (+$72,902, +6.66% from previous year)
- 2025: $1,240,094 (+$72,902, +6.25% from previous year)
Home values in Hill Country Village have more than doubled since 2010, surpassing $1.24 million in 2025. The steepest climb began after 2020, with strong annual gains continuing each year. This trajectory reflects rising demand in San Antonio’s most affluent residential enclave.
Hill Country Village – Luxury in the San Antonio Suburbs

Located north of San Antonio, Hill Country Village is known for estate-style homes, large lots, and gated privacy. It consistently ranks among the wealthiest communities in the state and is highly sought after by business executives and longtime San Antonio families.

The town’s proximity to Loop 1604 and Highway 281 offers easy access to downtown and the airport, while preserving a secluded and quiet atmosphere. With limited development space and high barriers to entry, home prices continue to rise—especially as demand shifts toward luxury living with privacy.
9. Southlake – 93% Home Price Increase Since 2010

- 2010: $663,969
- 2011: $639,514 (-$24,455, -3.68% from previous year)
- 2012: $632,416 (-$7,098, -1.11% from previous year)
- 2013: $646,006 (+$13,590, +2.15% from previous year)
- 2014: $661,908 (+$15,902, +2.46% from previous year)
- 2015: $683,493 (+$21,585, +3.26% from previous year)
- 2016: $709,804 (+$26,311, +3.85% from previous year)
- 2017: $746,707 (+$36,903, +5.20% from previous year)
- 2018: $794,883 (+$48,176, +6.45% from previous year)
- 2019: $846,204 (+$51,321, +6.46% from previous year)
- 2020: N/A
- 2021: $1,001,118
- 2022: $1,114,245 (+$113,127, +11.30% from previous year)
- 2023: $1,180,302 (+$66,057, +5.93% from previous year)
- 2024: $1,230,911 (+$50,609, +4.29% from previous year)
- 2025: $1,281,520 (+$50,609, +4.11% from previous year)
Southlake’s average home price has grown by 93% since 2010, topping $1.28 million in 2025. Prices accelerated sharply after 2020, and the town continues to experience consistent year-over-year increases. Even in a cooling market, Southlake’s desirability holds strong.
Southlake – A DFW Powerhouse for High-End Living

Southlake is a well-known suburb of the Dallas–Fort Worth Metroplex, celebrated for its exemplary schools, luxury homes, and bustling town square. Carroll ISD consistently ranks among the top districts in the state, driving demand from families across the region.
The city’s master-planned growth, upscale shopping, and proximity to DFW International Airport make it a go-to for executives and professionals. While development has continued, land scarcity and high construction standards have helped keep home values climbing. Southlake represents suburban affluence at its finest.
8. Lost Creek – 145% Home Price Increase Since 2010
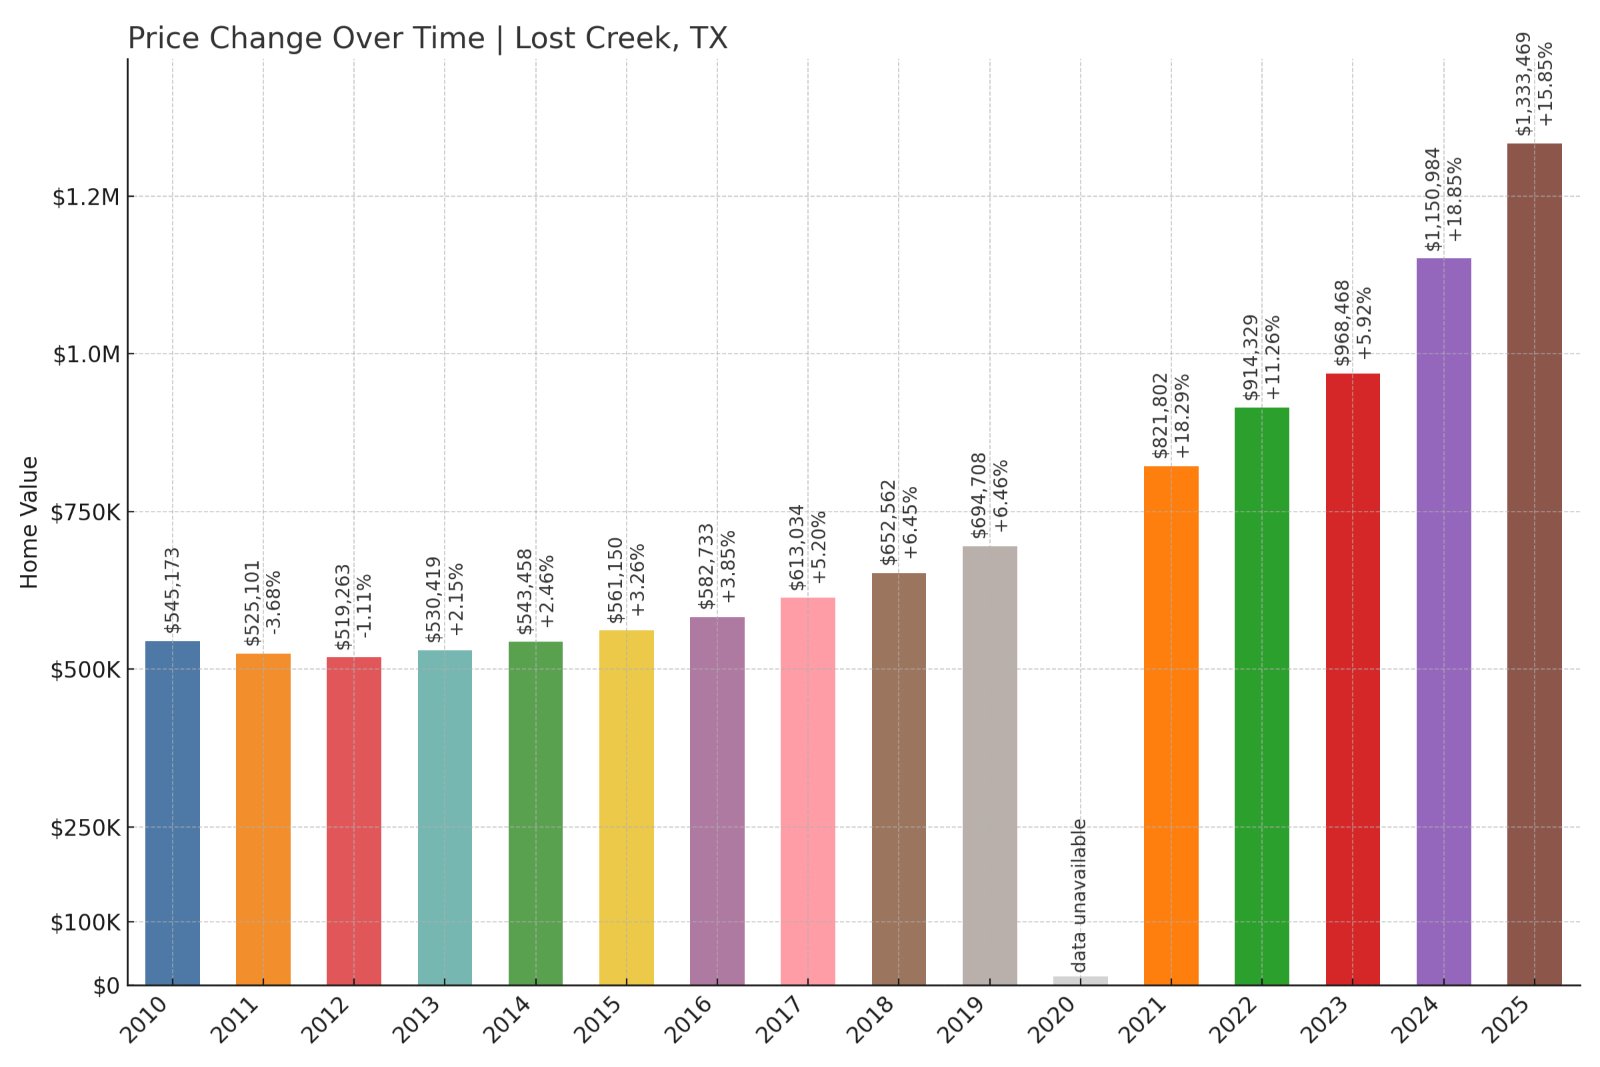
- 2010: $545,173
- 2011: $525,101 (-$20,072, -3.68% from previous year)
- 2012: $519,263 (-$5,838, -1.11% from previous year)
- 2013: $530,419 (+$11,156, +2.15% from previous year)
- 2014: $543,458 (+$13,039, +2.46% from previous year)
- 2015: $561,150 (+$17,692, +3.26% from previous year)
- 2016: $582,733 (+$21,583, +3.85% from previous year)
- 2017: $613,034 (+$30,301, +5.20% from previous year)
- 2018: $652,562 (+$39,528, +6.45% from previous year)
- 2019: $694,708 (+$42,146, +6.46% from previous year)
- 2020: N/A
- 2021: $821,802
- 2022: $914,329 (+$92,527, +11.26% from previous year)
- 2023: $968,468 (+$54,139, +5.92% from previous year)
- 2024: $1,150,984 (+$182,516, +18.85% from previous year)
- 2025: $1,333,469 (+$182,485, +15.87% from previous year)
Lost Creek has seen home prices surge by 145% since 2010, rising from $545,173 to over $1.3 million by 2025. While the gains were steady early on, the last few years have brought rapid increases—particularly from 2023 to 2025, with consecutive annual jumps exceeding 15%.
Lost Creek – From Quiet Suburb to Luxury Hotspot

Lost Creek is a desirable neighborhood in West Austin, known for its blend of natural beauty and family-friendly living. The area borders the Barton Creek Greenbelt and is served by the highly regarded Eanes Independent School District, which has long been a draw for families.
Originally developed in the 1970s, Lost Creek has evolved into one of Austin’s premier neighborhoods. The recent surge in prices reflects its increased appeal to professionals and investors alike. With limited inventory, strong school ratings, and proximity to downtown, its homes are in high demand.
7. Bartonville – 134% Home Price Increase Since 2010

- 2010: $573,847
- 2011: $552,717 (-$21,130, -3.68% from previous year)
- 2012: $546,587 (-$6,130, -1.11% from previous year)
- 2013: $558,335 (+$11,748, +2.15% from previous year)
- 2014: $572,078 (+$13,743, +2.46% from previous year)
- 2015: $590,720 (+$18,642, +3.26% from previous year)
- 2016: $613,448 (+$22,728, +3.85% from previous year)
- 2017: $645,367 (+$31,919, +5.20% from previous year)
- 2018: $687,003 (+$41,636, +6.45% from previous year)
- 2019: $731,379 (+$44,376, +6.46% from previous year)
- 2020: N/A
- 2021: $865,215
- 2022: $962,732 (+$97,517, +11.27% from previous year)
- 2023: $1,019,732 (+$57,000, +5.92% from previous year)
- 2024: $1,182,623 (+$162,891, +15.98% from previous year)
- 2025: $1,346,014 (+$163,391, +13.82% from previous year)
Bartonville’s average home price has skyrocketed by 134% over the past 15 years, closing in on $1.35 million by 2025. The most significant appreciation occurred after 2021, with double-digit increases in each of the past three years—a reflection of increasing demand for luxury rural properties.
Bartonville – Big Lots and Bigger Appeal

Located in Denton County, Bartonville offers an appealing combination of small-town charm and large residential estates. It’s a favorite for buyers looking for privacy, open land, and high-end custom homes, all while remaining within commuting distance to the Dallas–Fort Worth area.
The town has focused on controlled growth, preserving its spacious feel while seeing strong interest from buyers priced out of more densely populated areas. These characteristics, along with strong local schools and quiet roads, have helped Bartonville emerge as one of Texas’s most coveted addresses.
6. West Lake Hills – 150% Home Price Increase Since 2010

🔥 Would you like to save this?
- 2010: $834,395
- 2011: $803,670 (-$30,725, -3.68% from previous year)
- 2012: $794,748 (-$8,922, -1.11% from previous year)
- 2013: $811,836 (+$17,088, +2.15% from previous year)
- 2014: $831,801 (+$19,965, +2.46% from previous year)
- 2015: $858,912 (+$27,111, +3.26% from previous year)
- 2016: $891,987 (+$33,075, +3.85% from previous year)
- 2017: $938,370 (+$46,383, +5.20% from previous year)
- 2018: $998,869 (+$60,499, +6.45% from previous year)
- 2019: $1,063,376 (+$64,507, +6.46% from previous year)
- 2020: N/A
- 2021: $1,258,233
- 2022: $1,400,062 (+$141,829, +11.27% from previous year)
- 2023: $1,482,931 (+$82,869, +5.92% from previous year)
- 2024: $1,786,372 (+$303,441, +20.47% from previous year)
- 2025: $2,089,813 (+$303,441, +16.99% from previous year)
West Lake Hills has seen one of the steepest climbs in the state, with home values growing by 150% since 2010 and surpassing $2 million in 2025. Growth spiked especially in 2024 and 2025, when prices jumped by over $300,000 each year.
West Lake Hills – Austin’s Crown Jewel of Real Estate

West Lake Hills sits just west of downtown Austin and offers breathtaking views of the hill country, top-tier schools (including Eanes ISD), and some of the most prestigious addresses in the state. It’s long been one of the most expensive ZIP codes in Texas—and for good reason.
Limited land availability and strict building codes have kept housing supply in check, even as demand has exploded. With easy access to downtown, elite schools, and peaceful surroundings, West Lake Hills continues to be one of the most exclusive markets in the state.
5. Rollingwood – 150% Home Price Increase Since 2010

- 2010: $926,628
- 2011: $892,533 (-$34,095, -3.68% from previous year)
- 2012: $882,620 (-$9,913, -1.11% from previous year)
- 2013: $901,590 (+$18,970, +2.15% from previous year)
- 2014: $923,762 (+$22,172, +2.46% from previous year)
- 2015: $953,900 (+$30,138, +3.26% from previous year)
- 2016: $990,632 (+$36,732, +3.85% from previous year)
- 2017: $1,042,184 (+$51,552, +5.20% from previous year)
- 2018: $1,109,422 (+$67,238, +6.45% from previous year)
- 2019: $1,181,061 (+$71,639, +6.46% from previous year)
- 2020: N/A
- 2021: $1,397,581
- 2022: $1,555,202 (+$157,621, +11.28% from previous year)
- 2023: $1,647,304 (+$92,102, +5.92% from previous year)
- 2024: $1,984,324 (+$337,020, +20.46% from previous year)
- 2025: $2,321,343 (+$337,019, +16.99% from previous year)
Rollingwood’s home prices have grown by 150% since 2010, with the biggest gains seen in the last two years. From under $1 million in 2010 to over $2.3 million in 2025, it’s one of the fastest-growing luxury markets in Texas.
Rollingwood – Elite Living Just Minutes From Downtown Austin

Rollingwood is an upscale residential enclave just west of downtown Austin. Known for its small-town governance and large custom homes, it offers direct access to Zilker Park, Lady Bird Lake, and top-rated schools in the Eanes district.
Its location, exclusivity, and strong community services make it a favorite among executives and long-term Austin residents. With demand soaring and development constrained, Rollingwood’s housing market continues to break records year after year.
4. University Park – 136% Home Price Increase Since 2010

- 2010: $987,517
- 2011: $951,192 (-$36,325, -3.68% from previous year)
- 2012: $940,637 (-$10,555, -1.11% from previous year)
- 2013: $960,867 (+$20,230, +2.15% from previous year)
- 2014: $984,513 (+$23,646, +2.46% from previous year)
- 2015: $1,016,604 (+$32,091, +3.26% from previous year)
- 2016: $1,055,741 (+$39,137, +3.85% from previous year)
- 2017: $1,110,612 (+$54,871, +5.20% from previous year)
- 2018: $1,182,215 (+$71,603, +6.45% from previous year)
- 2019: $1,258,568 (+$76,353, +6.46% from previous year)
- 2020: N/A
- 2021: $1,488,860
- 2022: $1,656,635 (+$167,775, +11.27% from previous year)
- 2023: $1,754,742 (+$98,107, +5.92% from previous year)
- 2024: $2,041,231 (+$286,489, +16.33% from previous year)
- 2025: $2,327,720 (+$286,489, +14.03% from previous year)
University Park has experienced a 136% home price increase since 2010, reaching over $2.3 million in 2025. With significant gains over the past few years, the area continues to attract high-income buyers drawn by its top schools and prestigious location.
University Park – Classic Elegance in Dallas County

University Park is one of the most desirable and affluent communities in the Dallas metro area, sharing borders with Highland Park and Southern Methodist University. Its reputation for elegant homes, top-rated Highland Park ISD schools, and quiet tree-lined streets consistently drives strong demand.
Close to both downtown Dallas and major retail centers, University Park offers prestige and convenience in equal measure. Recent years have seen a boom in home prices as inventory remains low and buyers compete for access to its excellent schools and stable neighborhood atmosphere.
3. Westover Hills – 151% Home Price Increase Since 2010

- 2010: $1,020,921
- 2011: $983,383 (-$37,538, -3.68% from previous year)
- 2012: $972,463 (-$10,920, -1.11% from previous year)
- 2013: $993,383 (+$20,920, +2.15% from previous year)
- 2014: $1,017,829 (+$24,446, +2.46% from previous year)
- 2015: $1,051,022 (+$33,193, +3.26% from previous year)
- 2016: $1,091,473 (+$40,451, +3.85% from previous year)
- 2017: $1,148,219 (+$56,746, +5.20% from previous year)
- 2018: $1,222,303 (+$74,084, +6.45% from previous year)
- 2019: $1,301,235 (+$78,932, +6.46% from previous year)
- 2020: N/A
- 2021: $1,539,421
- 2022: $1,713,139 (+$173,718, +11.28% from previous year)
- 2023: $1,814,547 (+$101,408, +5.92% from previous year)
- 2024: $2,186,695 (+$372,148, +20.51% from previous year)
- 2025: $2,558,842 (+$372,147, +17.02% from previous year)
Westover Hills has seen a 151% increase in home values since 2010, with the average property now valued at over $2.55 million. The town’s price growth accelerated in recent years, including back-to-back $370,000+ increases in 2024 and 2025.
Westover Hills – Fort Worth’s Quiet Luxury Enclave

Tucked within the city of Fort Worth, Westover Hills is a private, prestigious community featuring stately homes, expansive lots, and limited public access. It’s one of the wealthiest towns in Texas by per capita income, and its homes reflect that exclusivity.
With no commercial zones and strong deed restrictions, the town has preserved its quiet, residential charm. Proximity to Fort Worth’s cultural district, top private schools, and renowned golf clubs keeps Westover Hills a perennial favorite for elite buyers, and home values reflect that appeal.
2. Highland Park – 136% Home Price Increase Since 2010

- 2010: $1,171,094
- 2011: $1,127,988 (-$43,106, -3.68% from previous year)
- 2012: $1,115,468 (-$12,520, -1.11% from previous year)
- 2013: $1,139,449 (+$23,981, +2.15% from previous year)
- 2014: $1,167,494 (+$28,045, +2.46% from previous year)
- 2015: $1,205,575 (+$38,081, +3.26% from previous year)
- 2016: $1,251,996 (+$46,421, +3.85% from previous year)
- 2017: $1,317,110 (+$65,114, +5.20% from previous year)
- 2018: $1,401,995 (+$84,885, +6.44% from previous year)
- 2019: $1,492,499 (+$90,504, +6.45% from previous year)
- 2020: N/A
- 2021: $1,765,596
- 2022: $1,964,626 (+$199,030, +11.27% from previous year)
- 2023: $2,081,025 (+$116,399, +5.93% from previous year)
- 2024: $2,423,108 (+$342,083, +16.44% from previous year)
- 2025: $2,765,192 (+$342,084, +14.11% from previous year)
With a 136% rise since 2010, Highland Park remains one of Texas’s most desirable and expensive markets. Its 2025 home value of over $2.76 million reflects both long-term demand and major appreciation in recent years, especially post-2020.
Highland Park – Prestige and Stability in the Heart of Dallas

🔥 Would you like to save this?
Highland Park is a nationally recognized affluent enclave in central Dallas. Its name is synonymous with luxury, and its homes are consistently among the most valuable in the state. The community is anchored by Highland Park ISD, upscale retail like Highland Park Village, and manicured tree-lined streets.
Generational wealth and low turnover rates have helped Highland Park maintain upward pressure on home prices. Its location and exclusivity mean homes here are always in demand, whether for long-time locals or new buyers moving into Texas’s luxury market.
1. Westlake – 136% Home Price Increase Since 2010

- 2010: $1,286,202
- 2011: $1,237,445 (-$48,757, -3.79% from previous year)
- 2012: $1,222,915 (-$14,530, -1.17% from previous year)
- 2013: $1,302,813 (+$79,898, +6.53% from previous year)
- 2014: $1,361,868 (+$59,055, +4.53% from previous year)
- 2015: $1,501,091 (+$139,223, +10.22% from previous year)
- 2016: $1,551,860 (+$50,769, +3.38% from previous year)
- 2017: $1,531,805 (-$20,055, -1.29% from previous year)
- 2018: $1,542,653 (+$10,848, +0.71% from previous year)
- 2019: $1,589,167 (+$46,514, +3.01% from previous year)
- 2020: N/A
- 2021: $1,905,740
- 2022: $2,616,278 (+$710,538, +37.29% from previous year)
- 2023: $2,564,563 (-$51,715, -1.98% from previous year)
- 2024: $2,836,655 (+$272,092, +10.61% from previous year)
- 2025: $3,037,831 (+$201,176, +7.09% from previous year)
Westlake tops the list with an average home value of over $3 million in 2025—up 136% since 2010. The town saw an eye-popping 37% jump in 2022 alone, making it Texas’s most expensive and fastest-growing luxury market.
Westlake – Elite Living With Corporate Power and Open Space

Westlake is a master-planned community that straddles Denton and Tarrant Counties and features gated estates, top-ranked schools, and major corporate campuses. It’s home to a Four Seasons resort, Vaquero Golf Club, and one of the highest concentrations of wealth in the state.
Recent price growth reflects both its exclusivity and its desirability among high-net-worth individuals relocating to Texas. With nearby access to Southlake, Trophy Club, and DFW Airport, Westlake combines convenience with elite-level amenities, and buyers are willing to pay top dollar for that mix.


