
🔥 Would you like to save this?
Pennsylvania has seen significant changes in real estate trends over the last 15 years, with some towns experiencing remarkable home value growth. Using data from the Zillow Home Value Index, we’ve compiled a list of the 18 most expensive towns across the state. This data reveals which places have become real estate powerhouses — and why. Whether you’re buying, selling, or just curious, this list shows where home values have surged the most. We’ll look at long-term growth patterns, recent trends, and some surprising downturns as well.
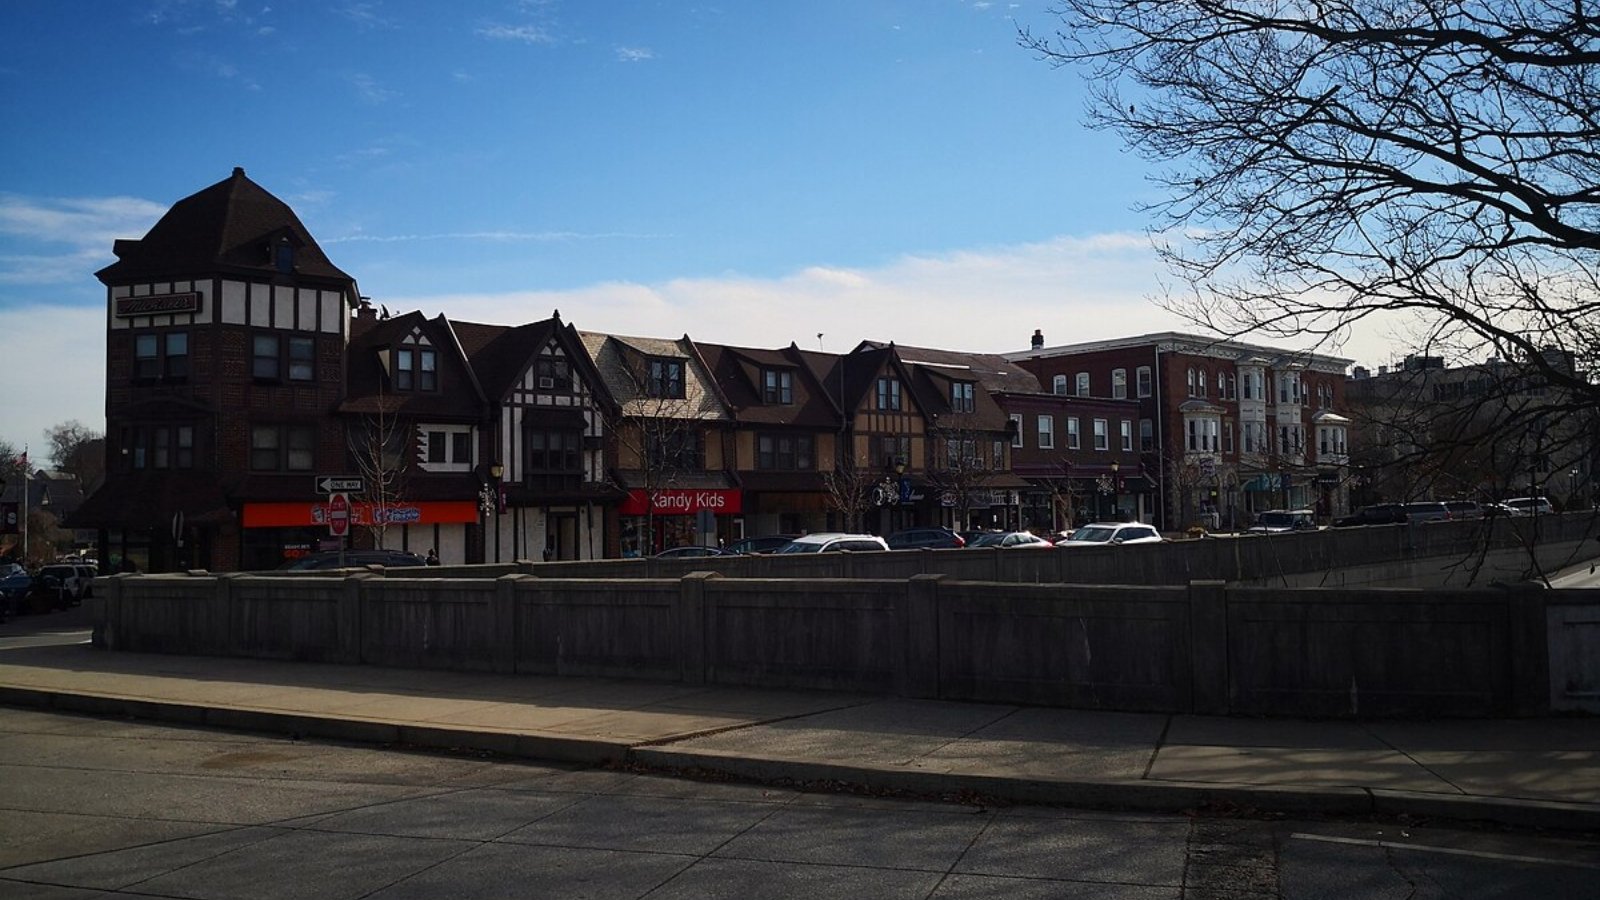
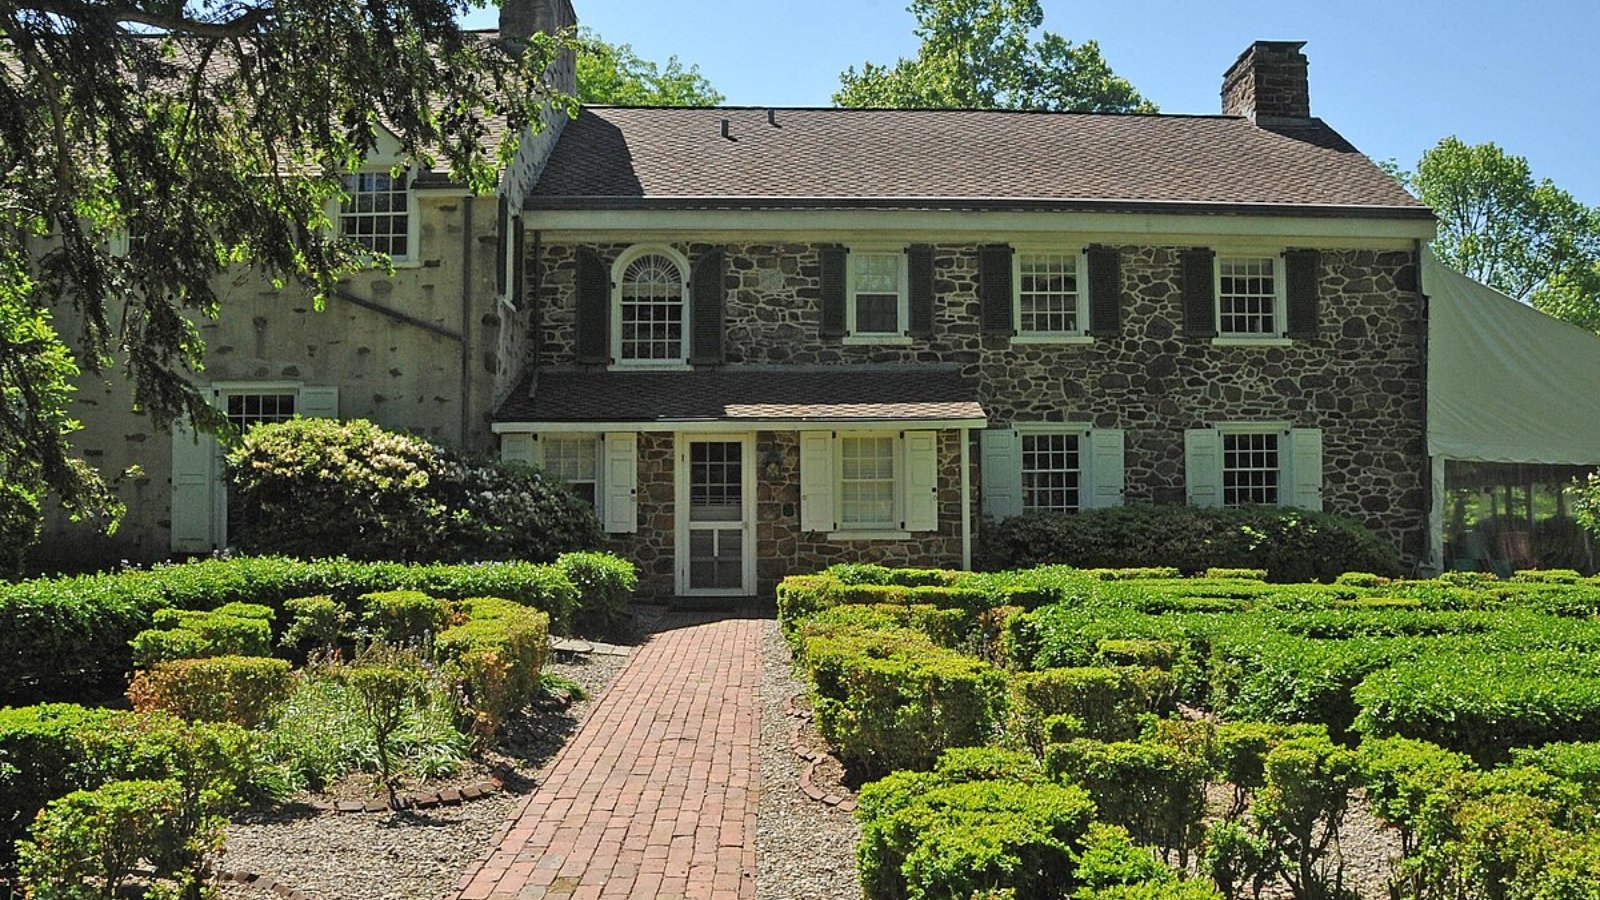
18. Media – 68% Home Price Increase Since 2010
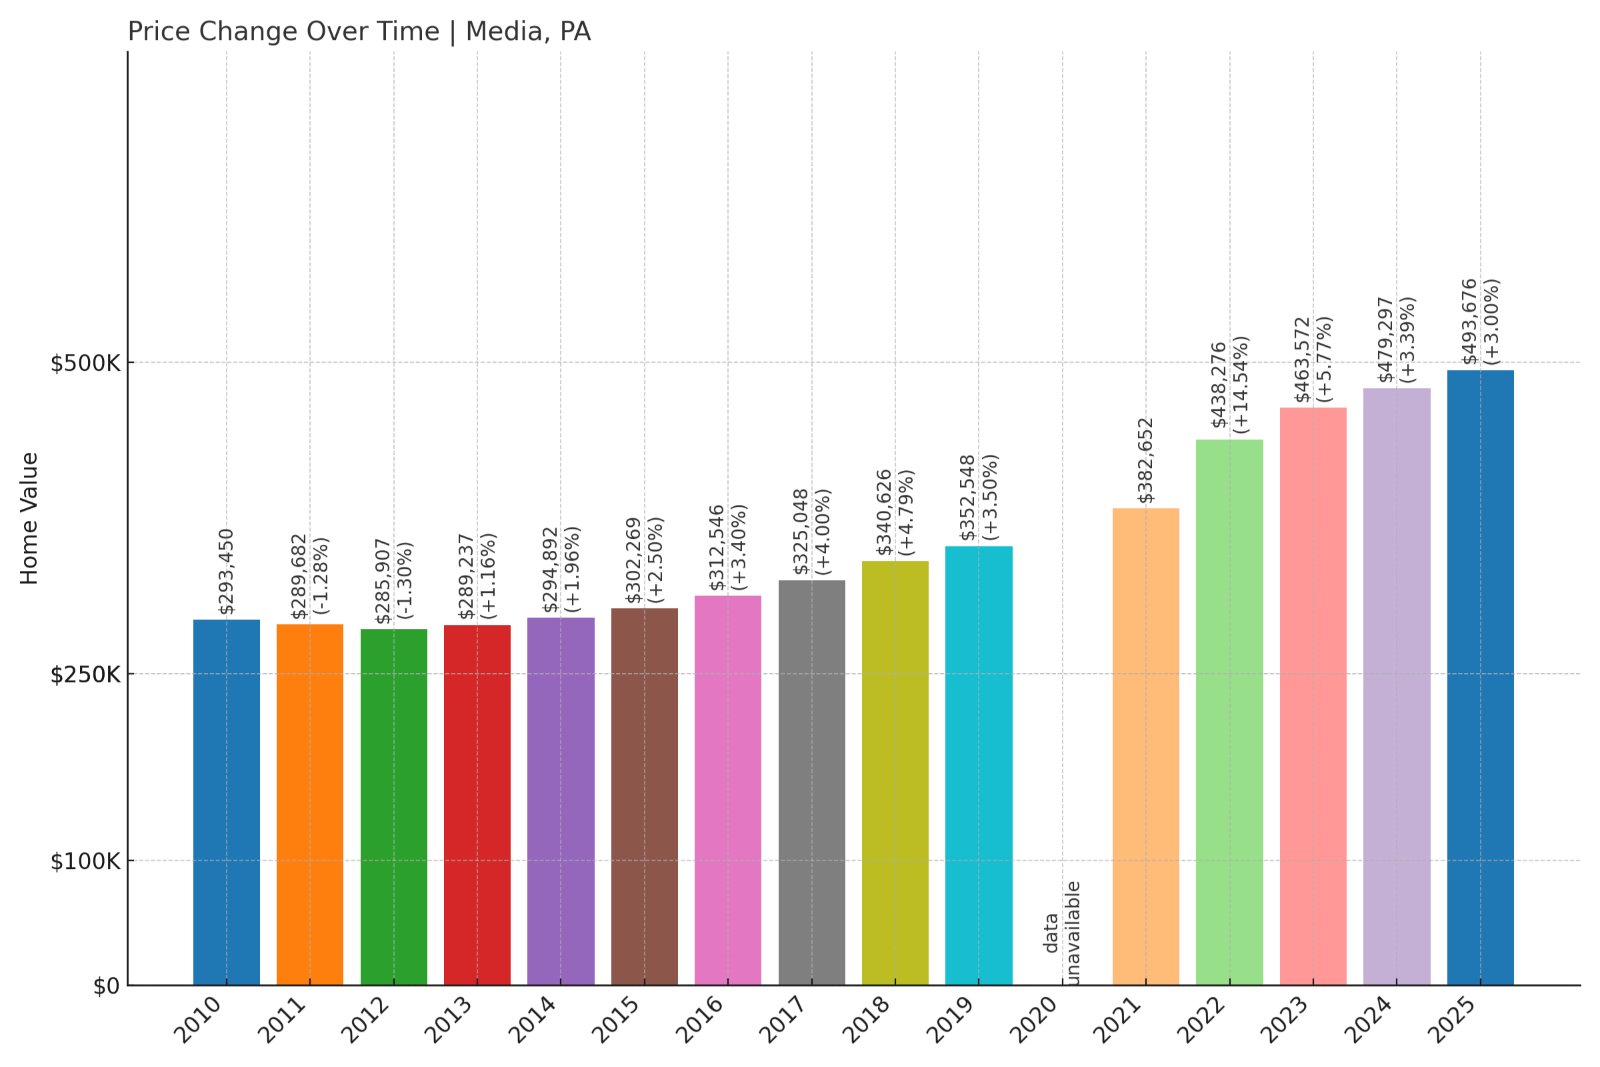
- 2010: $293,450
- 2011: $289,682 (-$3,768, -1.28% from previous year)
- 2012: $285,907 (-$3,775, -1.30% from previous year)
- 2013: $289,237 (+$3,330, +1.16% from previous year)
- 2014: $294,892 (+$5,655, +1.96% from previous year)
- 2015: $302,269 (+$7,377, +2.50% from previous year)
- 2016: $312,546 (+$10,277, +3.40% from previous year)
- 2017: $325,048 (+$12,502, +4.00% from previous year)
- 2018: $340,626 (+$15,578, +4.79% from previous year)
- 2019: $352,548 (+$11,922, +3.50% from previous year)
- 2020: N/A
- 2021: $382,652
- 2022: $438,276 (+$55,624, +14.54% from previous year)
- 2023: $463,572 (+$25,296, +5.77% from previous year)
- 2024: $479,297 (+$15,725, +3.39% from previous year)
- 2025: $493,676 (+$14,379, +3.00% from previous year)
Since 2010, Media has seen home prices climb by 68%, with the median value rising from just under $294,000 to nearly $494,000 in 2025. The town weathered slow gains early in the decade, followed by steady, moderate growth, and a notable leap in 2022. That year alone saw prices jump more than 14%, signaling increased demand and a robust market.
In order to come up with the very specific design ideas, we create most designs with the assistance of state-of-the-art AI interior design software. Also, assume links that take you off the site are affiliate links such as links to Amazon. this means we may earn a commission if you buy something.
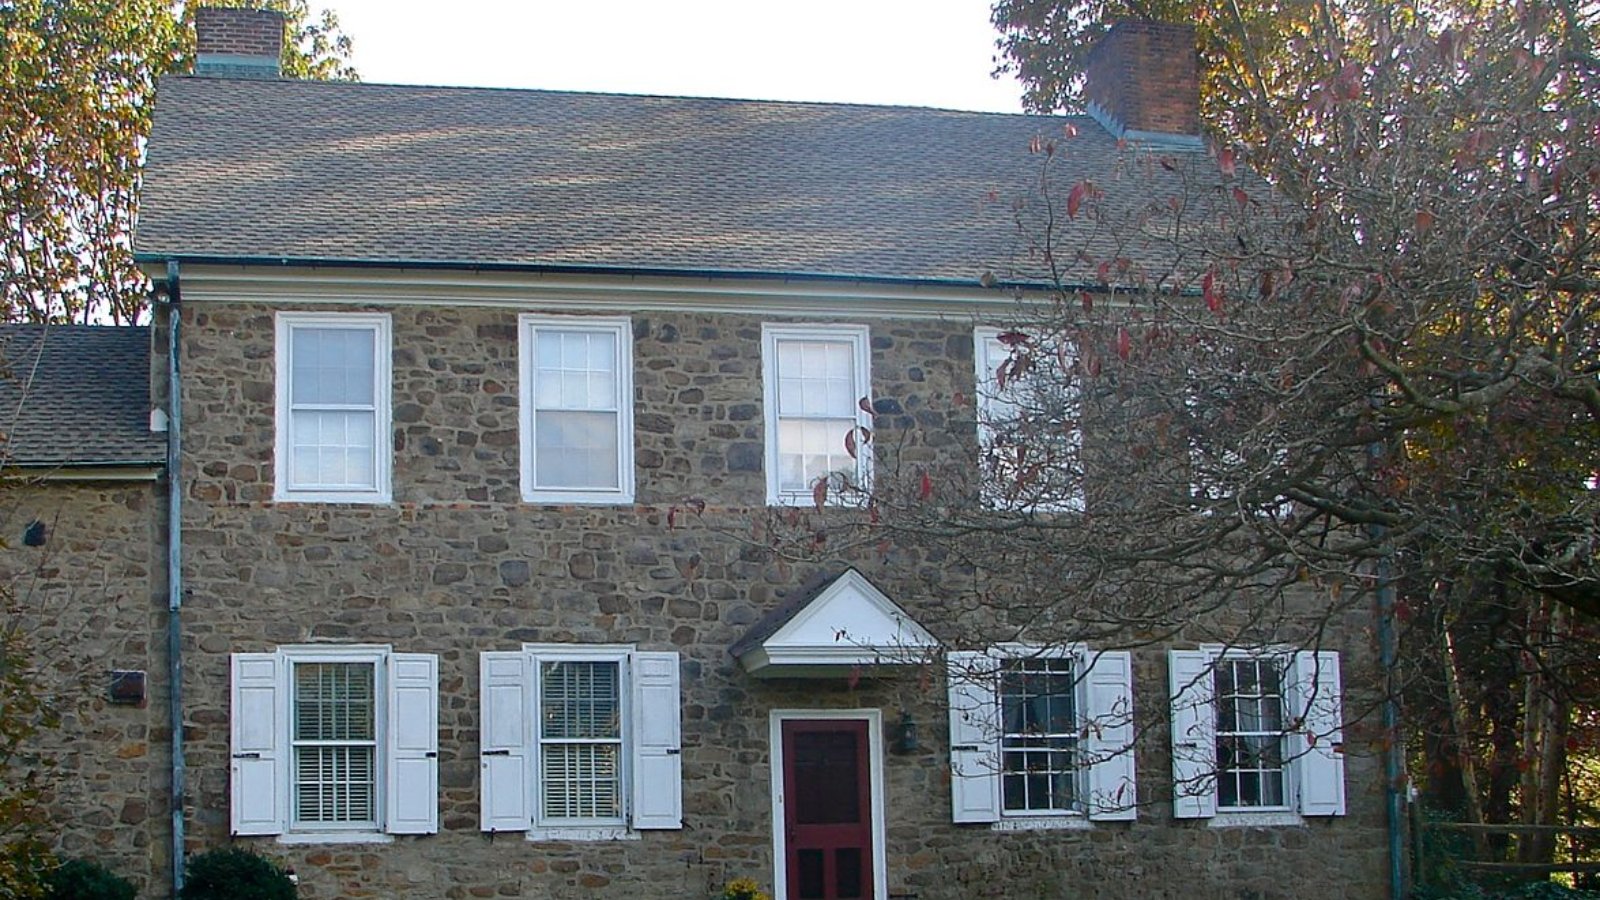
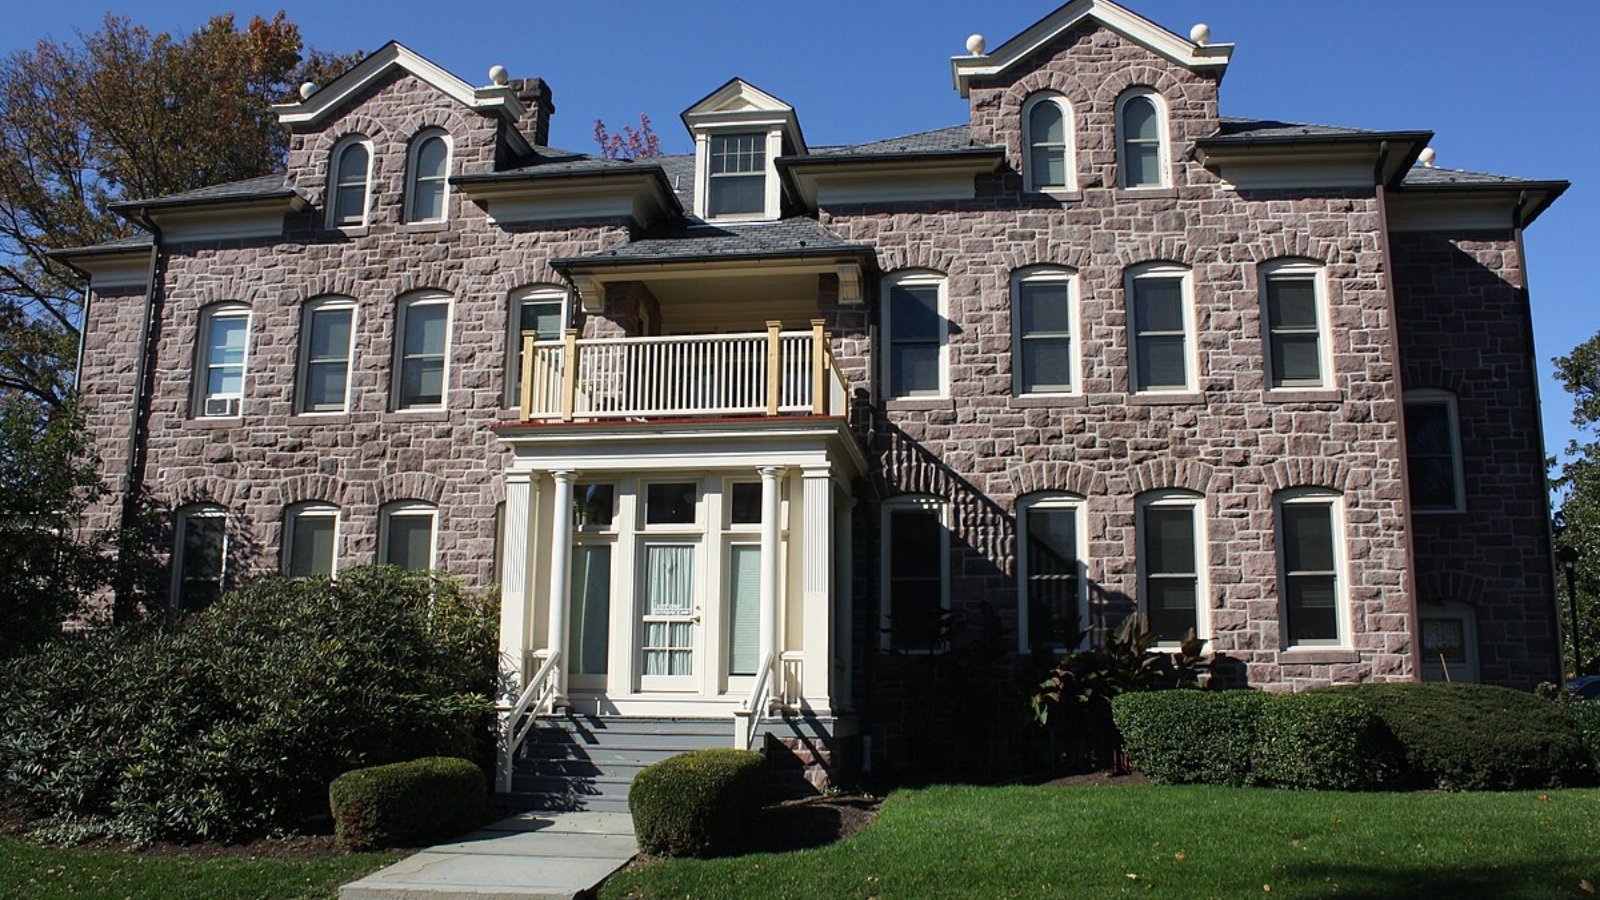
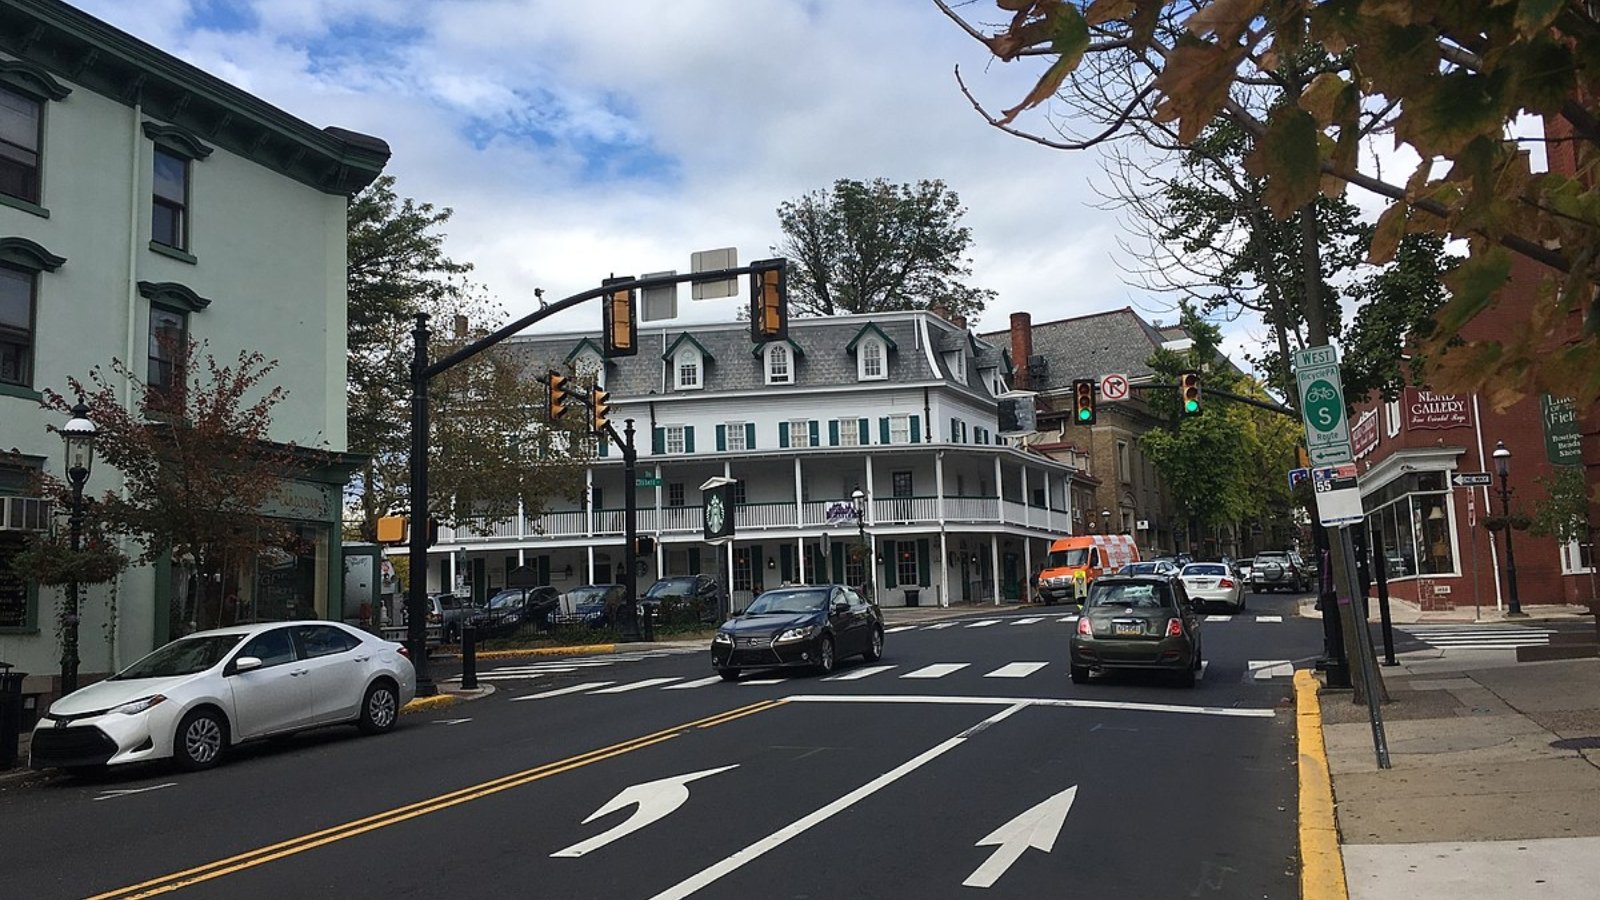
Media – Strong, Consistent Growth Over the Last Decade
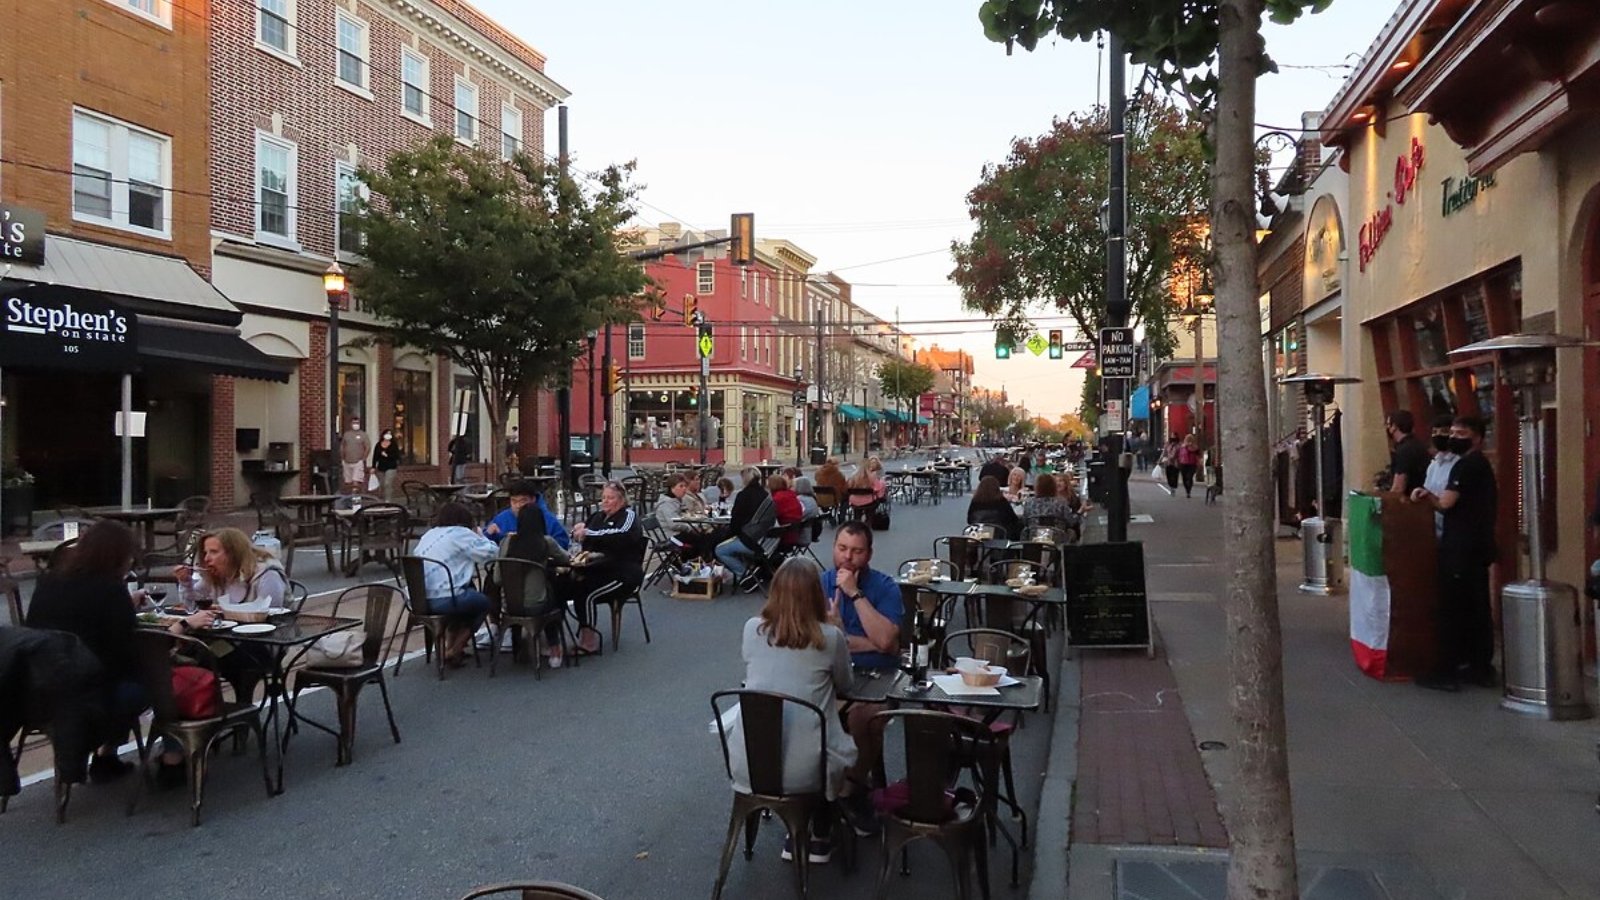
Located just west of Philadelphia, Media is the county seat of Delaware County and one of the most desirable small towns in southeastern Pennsylvania. It’s known for its lively downtown, walkability, and access to regional rail, which makes commuting into the city easy. The town’s steady real estate appreciation reflects its enduring popularity, quality schools, and limited housing supply.
Media blends suburban charm with urban convenience, making it particularly attractive to professionals and families. Its historic core and proximity to Ridley Creek State Park add to the area’s appeal, helping drive consistent value appreciation over time. The surge in 2022 likely reflects renewed interest post-pandemic and a tight housing inventory.
17. Malvern – 59% Home Price Increase Since 2010

- 2010: $321,726
- 2011: $319,892 (-$1,834, -0.57% from previous year)
- 2012: $321,249 (+$1,357, +0.42% from previous year)
- 2013: $329,280 (+$8,031, +2.50% from previous year)
- 2014: $338,812 (+$9,532, +2.90% from previous year)
- 2015: $348,976 (+$10,164, +3.00% from previous year)
- 2016: $359,446 (+$10,470, +3.00% from previous year)
- 2017: $376,679 (+$17,233, +4.79% from previous year)
- 2018: $394,729 (+$18,050, +4.79% from previous year)
- 2019: $408,545 (+$13,816, +3.50% from previous year)
- 2020: N/A
- 2021: $446,957
- 2022: $486,371 (+$39,414, +8.82% from previous year)
- 2023: $508,227 (+$21,856, +4.49% from previous year)
- 2024: $531,097 (+$22,870, +4.50% from previous year)
- 2025: $512,835 (-$18,262, -3.44% from previous year)
Malvern’s home prices rose from $321,726 in 2010 to $512,835 in 2025, marking a 59% increase. Much of this growth occurred after 2016, when price gains consistently topped 4% annually. Despite a modest drop in 2025, the market overall has trended sharply upward, particularly between 2021 and 2024.
Malvern – Big Gains, Brief Dip

Located in Chester County, Malvern combines upscale neighborhoods with a charming small-town center. The area is part of the Philadelphia Main Line, with easy access to Route 30 and SEPTA service. Malvern’s appeal includes top-rated schools and major employers like Vanguard and Siemens in nearby corporate hubs.
The town’s housing market surged during the pandemic and continued strong through 2024. The small pullback in 2025 may reflect buyer caution or market correction after a strong run. Still, long-term growth remains solid, backed by job stability, commuter convenience, and an affluent, family-oriented population.
16. Fort Washington – 52% Home Price Increase Since 2010

- 2010: $342,185
- 2011: $336,052 (-$6,133, -1.79% from previous year)
- 2012: $333,371 (-$2,681, -0.80% from previous year)
- 2013: $340,039 (+$6,668, +2.00% from previous year)
- 2014: $351,580 (+$11,541, +3.39% from previous year)
- 2015: $362,128 (+$10,548, +3.00% from previous year)
- 2016: $374,802 (+$12,674, +3.50% from previous year)
- 2017: $390,544 (+$15,742, +4.20% from previous year)
- 2018: $413,977 (+$23,433, +6.00% from previous year)
- 2019: $430,536 (+$16,559, +4.00% from previous year)
- 2020: N/A
- 2021: $464,979
- 2022: $507,827 (+$42,848, +9.22% from previous year)
- 2023: $525,601 (+$17,774, +3.50% from previous year)
- 2024: $541,369 (+$15,768, +3.00% from previous year)
- 2025: $520,517 (-$20,852, -3.85% from previous year)
Home values in Fort Washington grew from $342,185 in 2010 to $520,517 in 2025, a 52% rise. The biggest leaps occurred between 2018 and 2022. After peaking in 2024, prices dipped slightly in 2025 — likely a reflection of broader market cooling trends.
Fort Washington – Stable Growth in a Prime Location
Situated in Montgomery County, Fort Washington is an affluent suburb known for its business parks and historic battle site. It’s close to the Pennsylvania Turnpike and has a high-performing school district, making it attractive to professionals and families alike. The town’s mature housing stock and stable local economy helped fuel steady appreciation.
Even with the dip in 2025, Fort Washington continues to command high property values. Easy access to Center City and robust infrastructure give it strong investment appeal. The presence of Fortune 500 employers nearby also helps underpin housing demand in the area.
15. Newtown – 53% Home Price Increase Since 2010

- 2010: $349,837
- 2011: $348,687 (-$1,150, -0.33% from previous year)
- 2012: $347,540 (-$1,147, -0.33% from previous year)
- 2013: $354,491 (+$6,951, +2.00% from previous year)
- 2014: $365,125 (+$10,634, +3.00% from previous year)
- 2015: $374,253 (+$9,128, +2.50% from previous year)
- 2016: $389,224 (+$14,971, +4.00% from previous year)
- 2017: $404,792 (+$15,568, +4.00% from previous year)
- 2018: $422,008 (+$17,216, +4.25% from previous year)
- 2019: $443,108 (+$21,100, +5.00% from previous year)
- 2020: N/A
- 2021: $480,172
- 2022: $528,189 (+$48,017, +10.00% from previous year)
- 2023: $544,035 (+$15,846, +3.00% from previous year)
- 2024: $555,916 (+$11,881, +2.18% from previous year)
- 2025: $533,679 (-$22,237, -4.00% from previous year)
Newtown’s median home value rose from $349,837 in 2010 to $533,679 in 2025 — a gain of over 53%. Growth was steady throughout the 2010s, with a surge in 2022 followed by slight declines after. The town remains one of the stronger real estate performers in Bucks County.
Newtown – Strong Appeal, Slight Rebalancing
Newtown blends history and modern living in Bucks County, northeast of Philadelphia. With a charming town center, historic homes, and great schools, it’s been a sought-after location for years. Newtown Borough and its surrounding township offer different housing styles, from early American homes to newer suburban builds.
The sharp rise in 2022 home prices likely reflects national pandemic-driven demand, while the recent correction may just indicate stabilization. Its proximity to Princeton, Trenton, and Philadelphia continues to support long-term property demand.
14. Doylestown – 51% Home Price Increase Since 2010

- 2010: $368,524
- 2011: $365,207 (-$3,317, -0.90% from previous year)
- 2012: $369,224 (+$4,017, +1.10% from previous year)
- 2013: $380,301 (+$11,077, +3.00% from previous year)
- 2014: $391,710 (+$11,409, +3.00% from previous year)
- 2015: $407,378 (+$15,668, +4.00% from previous year)
- 2016: $419,600 (+$12,222, +3.00% from previous year)
- 2017: $438,482 (+$18,882, +4.50% from previous year)
- 2018: $460,406 (+$21,924, +5.00% from previous year)
- 2019: $483,426 (+$23,020, +5.00% from previous year)
- 2020: N/A
- 2021: $517,266
- 2022: $558,647 (+$41,381, +8.00% from previous year)
- 2023: $581,993 (+$23,346, +4.18% from previous year)
- 2024: $598,453 (+$16,460, +2.83% from previous year)
- 2025: $556,561 (-$41,892, -7.00% from previous year)
From 2010 to 2025, Doylestown’s home values climbed 51%, with the median rising from $368,524 to $556,561. Most of the gains occurred steadily across the years, especially during 2018 to 2022. The price dip in 2025 is the largest on this list so far but comes after years of strong performance.
Doylestown – Historic Charm, Strong Housing Demand
Doylestown, the county seat of Bucks County, is renowned for its arts scene, cultural landmarks, and walkable downtown. Attractions like the Mercer Museum and Fonthill Castle bring in visitors, while local shops and eateries contribute to a strong sense of community. The town is also a hub for regional employment and healthcare.
The robust growth through the 2010s and early 2020s reflects high demand from homebuyers who value character, location, and good schools. While the 2025 decline is notable, Doylestown’s fundamentals remain strong, suggesting the dip may be temporary.
13. Blue Bell – 52.8% Home Price Increase Since 2010

- 2010: $375,894
- 2011: $372,135 (-$3,759, -1.00% from previous year)
- 2012: $375,856 (+$3,721, +1.00% from previous year)
- 2013: $386,257 (+$10,401, +2.77% from previous year)
- 2014: $401,707 (+$15,450, +4.00% from previous year)
- 2015: $413,758 (+$12,051, +3.00% from previous year)
- 2016: $430,309 (+$16,551, +4.00% from previous year)
- 2017: $451,824 (+$21,515, +5.00% from previous year)
- 2018: $474,415 (+$22,591, +5.00% from previous year)
- 2019: $493,392 (+$18,977, +4.00% from previous year)
- 2020: N/A
- 2021: $532,863
- 2022: $581,821 (+$48,958, +9.19% from previous year)
- 2023: $599,276 (+$17,455, +3.00% from previous year)
- 2024: $611,262 (+$11,986, +2.00% from previous year)
- 2025: $574,586 (-$36,676, -6.00% from previous year)
Blue Bell’s property values have increased from $375,894 in 2010 to $574,586 in 2025, a 52.8% increase. After a gradual climb through the mid-2010s, the market hit a high in 2022 before cooling slightly. The dip in 2025 reflects a broader statewide correction, but the overall trend remains solid.
Blue Bell – Luxury Homes and Strong Infrastructure
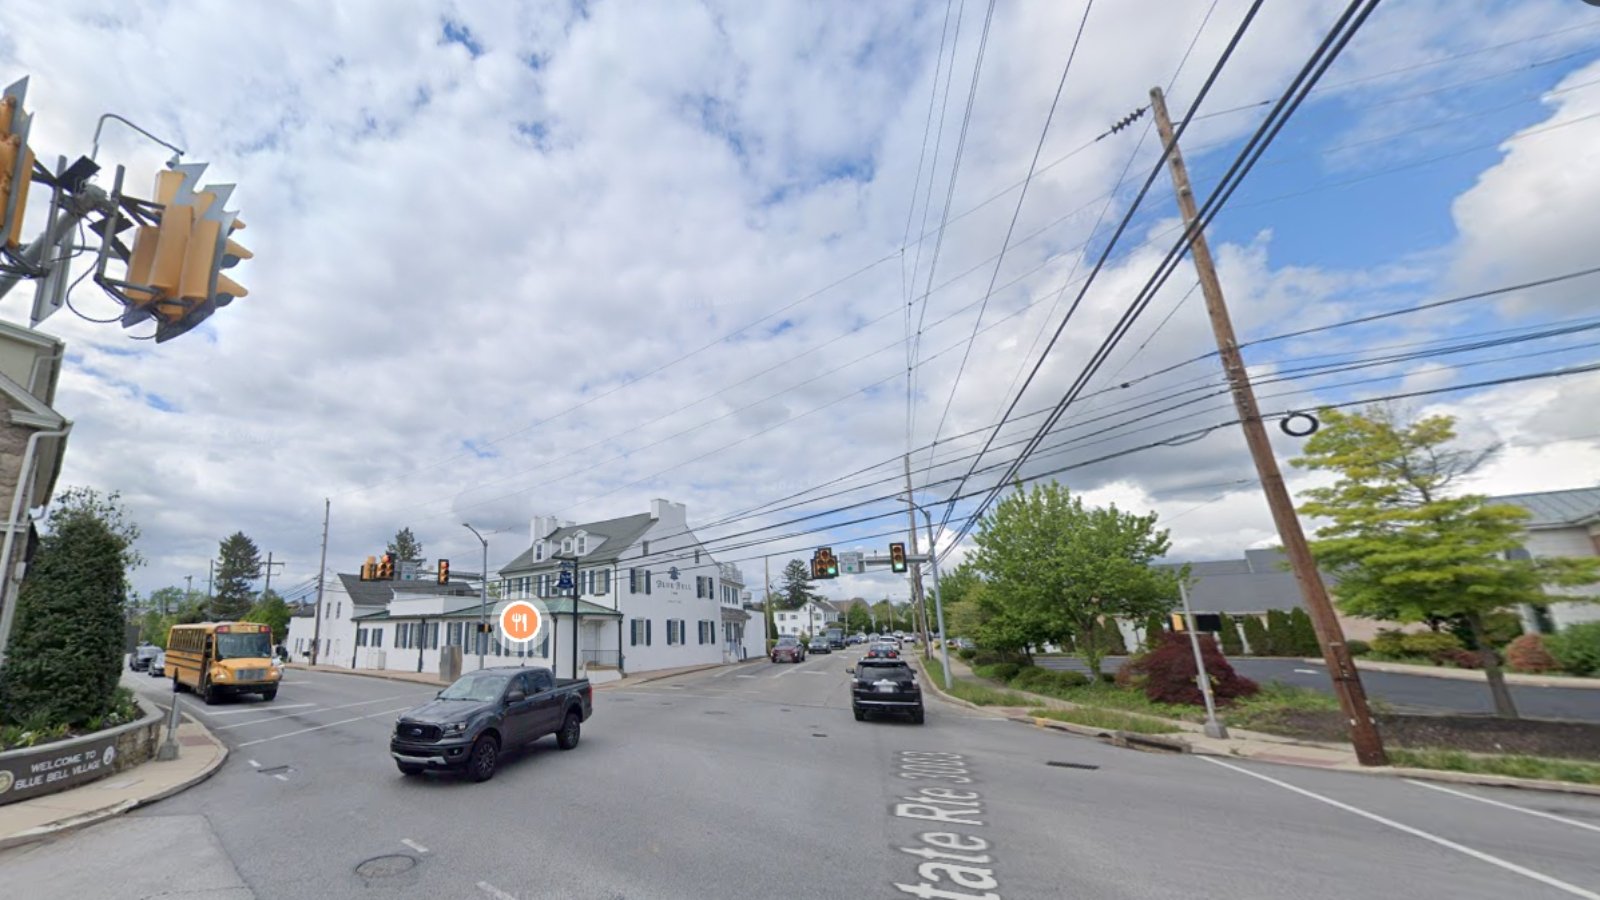
Located in Montgomery County, Blue Bell is known for its large, stately homes and its reputation as one of the wealthiest Philadelphia suburbs. Corporate offices, golf courses, and Blue Bell Country Club are central to its identity, attracting executives and professionals.
The post-2020 housing surge here is typical of affluent enclaves that gained attention during the remote work era. Although prices pulled back slightly in 2025, Blue Bell’s top-tier schools and proximity to major highways keep it a desirable long-term bet.
12. Wynnewood – 49% Home Price Increase Since 2010

🔥 Would you like to save this?
- 2010: $396,482
- 2011: $392,517 (-$3,965, -1.00% from previous year)
- 2012: $398,405 (+$5,888, +1.50% from previous year)
- 2013: $406,373 (+$7,968, +2.00% from previous year)
- 2014: $418,564 (+$12,191, +3.00% from previous year)
- 2015: $439,492 (+$20,928, +5.00% from previous year)
- 2016: $456,893 (+$17,401, +3.96% from previous year)
- 2017: $475,169 (+$18,276, +4.00% from previous year)
- 2018: $499,877 (+$24,708, +5.20% from previous year)
- 2019: $519,872 (+$19,995, +4.00% from previous year)
- 2020: N/A
- 2021: $567,661
- 2022: $612,074 (+$44,413, +7.82% from previous year)
- 2023: $636,557 (+$24,483, +4.00% from previous year)
- 2024: $649,288 (+$12,731, +2.00% from previous year)
- 2025: $591,052 (-$58,236, -8.97% from previous year)
From 2010 to 2025, Wynnewood’s median home price climbed by 49%, reaching $591,052. The town saw strong, steady increases through 2022, when prices peaked, followed by a moderate two-year drop. Despite this correction, it remains one of Montgomery County’s most valuable areas.
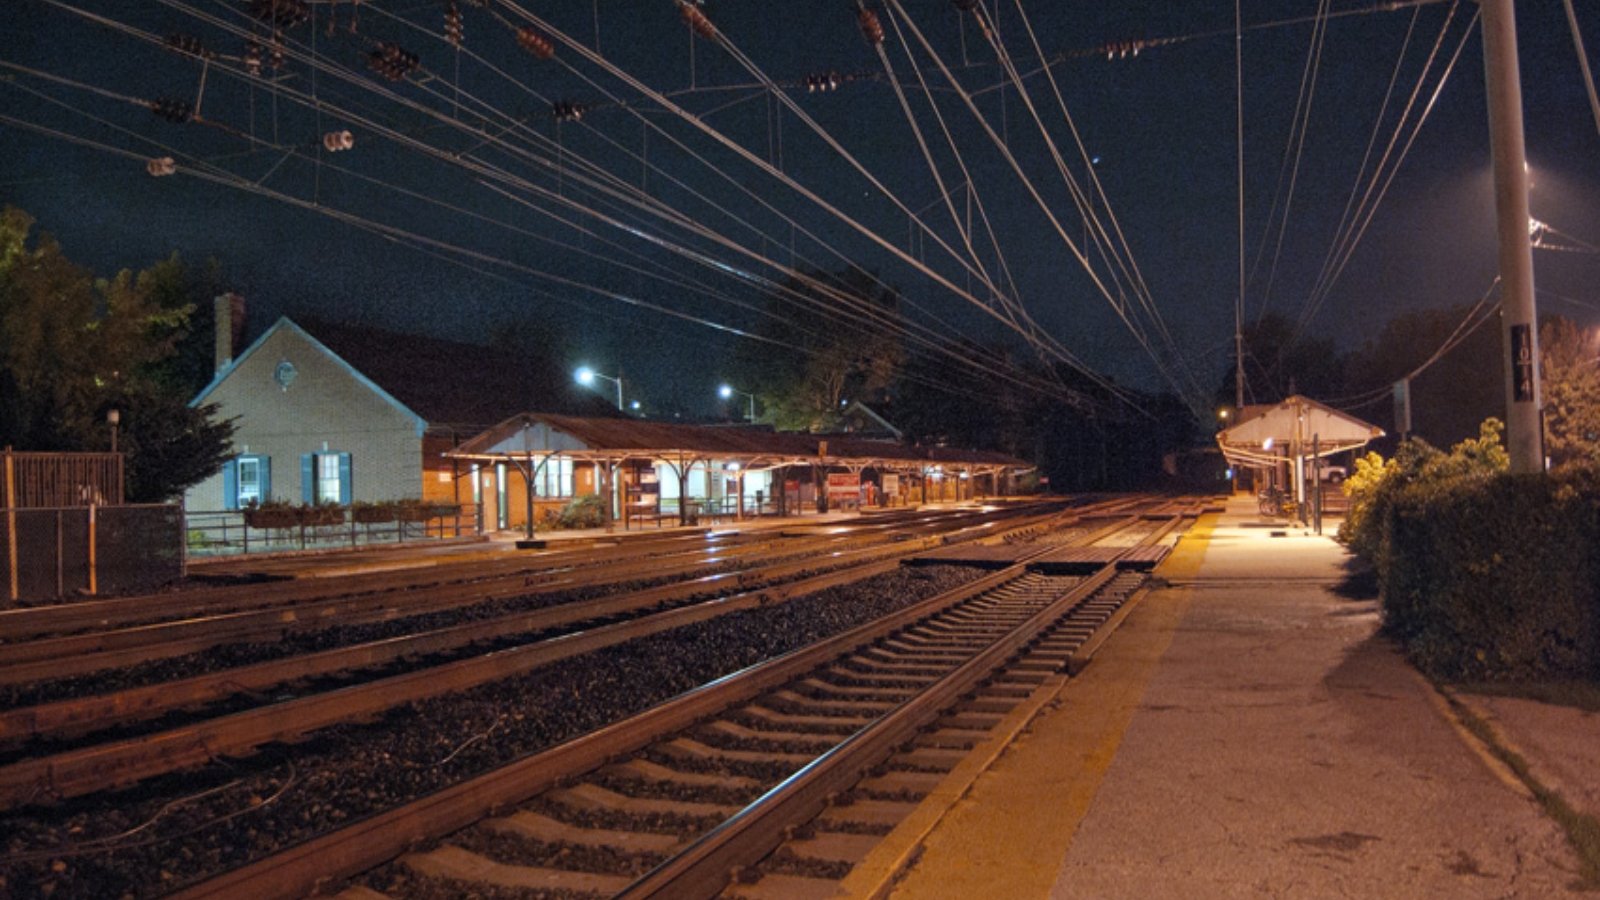
Wynnewood – Rail Access and Neighborhood Appeal

Part of Lower Merion Township on the Main Line, Wynnewood offers a classic suburban setting just minutes from Philadelphia. Its regional rail station, tree-lined streets, and diverse housing stock make it especially attractive to commuters and families.
With high-performing schools and a thriving local economy, Wynnewood’s rise was largely driven by buyers seeking access to both urban and suburban lifestyles. The recent price dip likely reflects market normalization after several years of heightened demand.
11. Ambler – 48.4% Home Price Increase Since 2010

- 2010: $418,627
- 2011: $414,441 (-$4,186, -1.00% from previous year)
- 2012: $422,730 (+$8,289, +2.00% from previous year)
- 2013: $435,412 (+$12,682, +3.00% from previous year)
- 2014: $448,474 (+$13,062, +3.00% from previous year)
- 2015: $461,928 (+$13,454, +3.00% from previous year)
- 2016: $480,405 (+$18,477, +4.00% from previous year)
- 2017: $499,621 (+$19,216, +4.00% from previous year)
- 2018: $524,602 (+$24,981, +5.00% from previous year)
- 2019: $545,586 (+$20,984, +4.00% from previous year)
- 2020: N/A
- 2021: $595,718
- 2022: $643,376 (+$47,658, +8.00% from previous year)
- 2023: $662,677 (+$19,301, +3.00% from previous year)
- 2024: $682,557 (+$19,880, +3.00% from previous year)
- 2025: $621,127 (-$61,430, -9.00% from previous year)
Ambler saw prices rise from $418,627 to $621,127 over 15 years, up 48.4%. Like many of its peers, Ambler’s sharpest growth came post-2020. The 2025 decline is steep, but it follows a period of rapid appreciation and may reflect temporary cooling.
Ambler – Thriving Downtown and Post-2020 Boom

Ambler blends historic character with modern vibrancy. Located in Montgomery County, its revitalized downtown is filled with restaurants, boutiques, and the Ambler Theater, drawing interest from young professionals and families alike.
Transit access to Philadelphia, plus demand for walkable suburbs during the pandemic, helped push prices higher in recent years. With consistent improvements in housing stock and commercial development, Ambler has built a strong foundation for sustained value despite the 2025 pullback.
10. Wayne – 48.4% Home Price Increase Since 2010

- 2010: $448,731
- 2011: $444,244 (-$4,487, -1.00% from previous year)
- 2012: $457,571 (+$13,327, +3.00% from previous year)
- 2013: $466,722 (+$9,151, +2.00% from previous year)
- 2014: $480,724 (+$14,002, +3.00% from previous year)
- 2015: $500,717 (+$19,993, +4.16% from previous year)
- 2016: $515,739 (+$15,022, +3.00% from previous year)
- 2017: $536,368 (+$20,629, +4.00% from previous year)
- 2018: $563,186 (+$26,818, +5.00% from previous year)
- 2019: $580,082 (+$16,896, +3.00% from previous year)
- 2020: N/A
- 2021: $632,289
- 2022: $683,877 (+$51,588, +8.16% from previous year)
- 2023: $708,345 (+$24,468, +3.58% from previous year)
- 2024: $729,595 (+$21,250, +3.00% from previous year)
- 2025: $665,932 (-$63,663, -8.73% from previous year)
Wayne’s median home prices climbed 48.4% from 2010 to 2025. It experienced strong gains especially between 2015 and 2022, with a modest correction in 2025 after several years of significant appreciation.
Wayne – Classic Main Line Living
Wayne is one of the signature towns along Philadelphia’s Main Line, known for its charming downtown, prestigious schools, and stately homes. It spans parts of Delaware and Chester counties and is a favorite for commuters, thanks to its robust rail connections.
The town’s housing market surged during the pandemic and held firm for several years. The recent dip may indicate price adjustments as inventory builds slightly or buyers become more selective, but Wayne’s enduring popularity suggests long-term strength.

9. Swarthmore – 47.4% Home Price Increase Since 2010

- 2010: $467,862
- 2011: $463,183 (-$4,679, -1.00% from previous year)
- 2012: $477,079 (+$13,896, +3.00% from previous year)
- 2013: $486,621 (+$9,542, +2.00% from previous year)
- 2014: $501,219 (+$14,598, +3.00% from previous year)
- 2015: $516,256 (+$15,037, +3.00% from previous year)
- 2016: $536,906 (+$20,650, +4.00% from previous year)
- 2017: $558,382 (+$21,476, +4.00% from previous year)
- 2018: $580,718 (+$22,336, +4.00% from previous year)
- 2019: $604,755 (+$24,037, +4.14% from previous year)
- 2020: N/A
- 2021: $661,590
- 2022: $714,517 (+$52,927, +8.00% from previous year)
- 2023: $735,953 (+$21,436, +3.00% from previous year)
- 2024: $758,031 (+$22,078, +3.00% from previous year)
- 2025: $689,808 (-$68,223, -9.00% from previous year)
Swarthmore’s home prices have risen by 47.4% since 2010, from $467,862 to $689,808 in 2025. Most of this growth occurred between 2016 and 2022. Prices peaked in 2024 before declining sharply in 2025 — a correction that reflects similar trends in other high-performing towns.
Swarthmore – Academic Roots and Price Resilience
Swarthmore, home to the prestigious liberal arts college of the same name, is located in Delaware County. It offers a unique mix of academic ambiance, quiet tree-lined streets, and tight-knit community life that appeals to professionals, faculty, and retirees alike.
The college’s presence has historically helped support stable property values. With limited housing stock and strong buyer interest post-2020, prices climbed quickly. The recent drop may be temporary, as Swarthmore’s fundamental appeal remains intact.
8. Devon – 48.6% Home Price Increase Since 2010

- 2010: $487,251
- 2011: $482,378 (-$4,873, -1.00% from previous year)
- 2012: $496,849 (+$14,471, +3.00% from previous year)
- 2013: $511,755 (+$14,906, +3.00% from previous year)
- 2014: $527,107 (+$15,352, +3.00% from previous year)
- 2015: $542,920 (+$15,813, +3.00% from previous year)
- 2016: $564,637 (+$21,717, +4.00% from previous year)
- 2017: $587,223 (+$22,586, +4.00% from previous year)
- 2018: $610,712 (+$23,489, +4.00% from previous year)
- 2019: $635,628 (+$24,916, +4.08% from previous year)
- 2020: N/A
- 2021: $693,840
- 2022: $749,347 (+$55,507, +8.00% from previous year)
- 2023: $771,827 (+$22,480, +3.00% from previous year)
- 2024: $795,837 (+$24,010, +3.11% from previous year)
- 2025: $724,212 (-$71,625, -9.00% from previous year)
Devon’s median home price grew 48.6% between 2010 and 2025, from $487,251 to $724,212. After a long period of steady 3–4% annual increases, the town saw rapid appreciation post-2020. The 2025 downturn reflects a broader cooling after intense market gains.
Devon – Steady Riser With Main Line Prestige

Located in Easttown Township in Chester County, Devon is another standout along the Main Line corridor. Known for the Devon Horse Show and its tranquil residential streets, the area has long appealed to those seeking luxury in a quiet setting.
High-quality schools, excellent rail access, and a refined suburban atmosphere helped propel its real estate market through the 2010s. The steep rise in the early 2020s reflects increased buyer interest and limited inventory. Even with a dip in 2025, Devon remains a top-tier housing market.
7. Narberth – 50.9% Home Price Increase Since 2010

- 2010: $506,531
- 2011: $501,466 (-$5,065, -1.00% from previous year)
- 2012: $516,510 (+$15,044, +3.00% from previous year)
- 2013: $534,587 (+$18,077, +3.50% from previous year)
- 2014: $550,625 (+$16,038, +3.00% from previous year)
- 2015: $572,650 (+$22,025, +4.00% from previous year)
- 2016: $595,556 (+$22,906, +4.00% from previous year)
- 2017: $619,378 (+$23,822, +4.00% from previous year)
- 2018: $650,347 (+$30,969, +5.00% from previous year)
- 2019: $676,361 (+$26,014, +4.00% from previous year)
- 2020: N/A
- 2021: $737,633
- 2022: $784,063 (+$46,430, +6.29% from previous year)
- 2023: $815,426 (+$31,363, +4.00% from previous year)
- 2024: $839,889 (+$24,463, +3.00% from previous year)
- 2025: $764,299 (-$75,590, -9.00% from previous year)
Narberth saw a 50.9% increase in home values over 15 years, growing from $506,531 to $764,299. It maintained consistent 3–5% yearly growth, with peak values in 2024. Prices pulled back sharply in 2025, but the town’s fundamentals remain solid.
Narberth – Small Borough, Big Demand
Narberth is one of the most walkable and tight-knit boroughs on the Main Line, known for its charming downtown, community events, and regional rail service. At just half a square mile, space is limited — and that scarcity has helped keep values high.
Buyers are drawn to Narberth’s strong public schools, its independent businesses, and its close-knit feel. Its real estate has long been resilient, and though 2025 brought a downturn, the market’s overall health remains strong due to location and demand.
6. Berwyn – 51.6% Home Price Increase Since 2010

🔥 Would you like to save this?
- 2010: $524,582
- 2011: $519,336 (-$5,246, -1.00% from previous year)
- 2012: $534,916 (+$15,580, +3.00% from previous year)
- 2013: $550,964 (+$16,048, +3.00% from previous year)
- 2014: $572,002 (+$21,038, +3.82% from previous year)
- 2015: $594,882 (+$22,880, +4.00% from previous year)
- 2016: $618,677 (+$23,795, +4.00% from previous year)
- 2017: $643,424 (+$24,747, +4.00% from previous year)
- 2018: $675,596 (+$32,172, +5.00% from previous year)
- 2019: $702,619 (+$27,023, +4.00% from previous year)
- 2020: N/A
- 2021: $769,858
- 2022: $823,748 (+$53,890, +7.00% from previous year)
- 2023: $848,460 (+$24,712, +3.00% from previous year)
- 2024: $873,914 (+$25,454, +3.00% from previous year)
- 2025: $795,263 (-$78,651, -9.00% from previous year)
Berwyn experienced a 51.6% increase in home values between 2010 and 2025, with a steady trajectory upward and a post-2020 surge. The 2025 decrease aligns with the general cooling observed across the region’s high-end markets.
Berwyn – Education and Elegance in Chester County
Berwyn is part of the highly regarded Tredyffrin/Easttown School District, a major factor in its consistent housing demand. Located along the Main Line, it’s prized for its blend of suburban peace and convenience, plus a well-kept town center.
Buyers during the pandemic years drove up prices quickly, particularly those seeking homes in top districts. Even with recent price declines, Berwyn’s appeal remains strong thanks to top schools, easy access to SEPTA rail, and a high quality of life.
5. Gladwyne – 52.1% Home Price Increase Since 2010
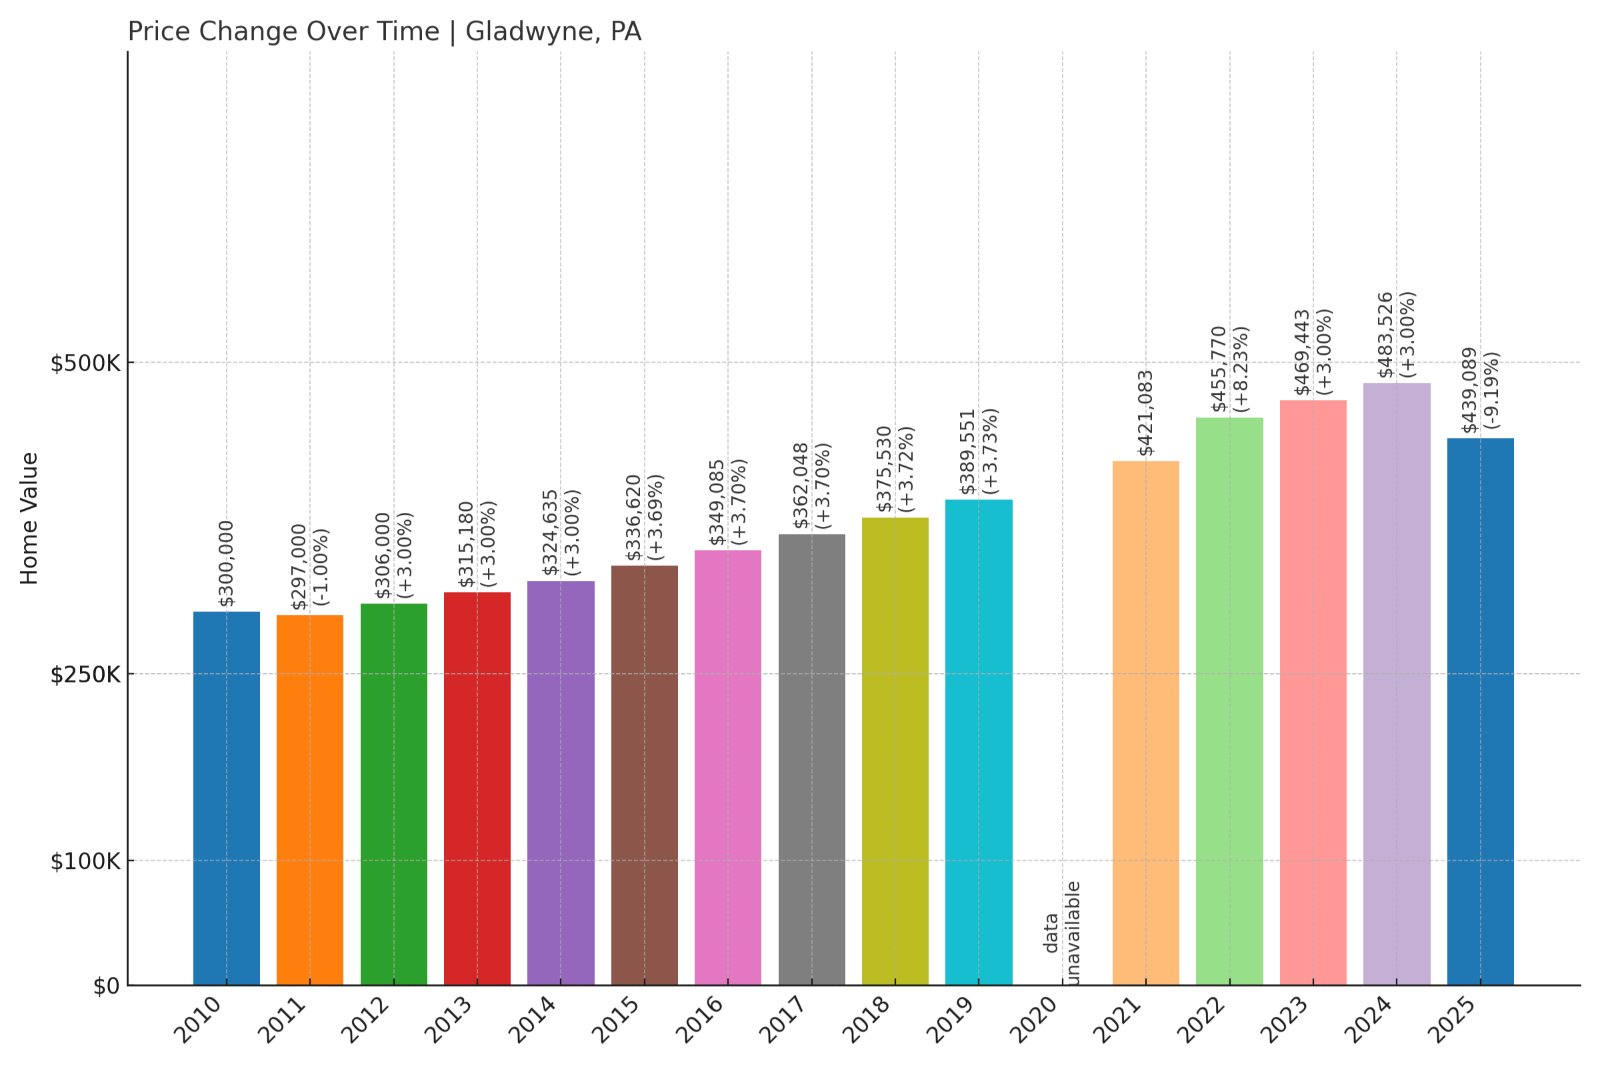
- 2010: $583,751
- 2011: $577,914 (-$5,837, -1.00% from previous year)
- 2012: $595,251 (+$17,337, +3.00% from previous year)
- 2013: $613,108 (+$17,857, +3.00% from previous year)
- 2014: $637,633 (+$24,525, +4.00% from previous year)
- 2015: $663,138 (+$25,505, +4.00% from previous year)
- 2016: $689,664 (+$26,526, +4.00% from previous year)
- 2017: $717,250 (+$27,586, +4.00% from previous year)
- 2018: $753,113 (+$35,863, +5.00% from previous year)
- 2019: $783,237 (+$30,124, +4.00% from previous year)
- 2020: N/A
- 2021: $861,561
- 2022: $930,486 (+$68,925, +8.00% from previous year)
- 2023: $958,401 (+$27,915, +3.00% from previous year)
- 2024: $987,153 (+$28,752, +3.00% from previous year)
- 2025: $888,437 (-$98,716, -10.00% from previous year)
From 2010 to 2025, Gladwyne home values jumped 52.1%, increasing from $583,751 to $888,437. The town saw steady increases through 2024, with a sizable drop in 2025. That decline mirrors national softening trends, especially in high-value zip codes.
Gladwyne – Philadelphia’s Most Exclusive Suburb

Gladwyne, located in Lower Merion Township, is widely considered one of the wealthiest and most exclusive suburbs in Pennsylvania. Its expansive estates, wooded landscapes, and proximity to the Schuylkill River Trail and Center City make it a haven for high-income buyers.
Real estate here consistently commands top-tier prices thanks to its low-density zoning, historical architecture, and prestige. The 2025 dip in prices may be the result of a market correction after years of luxury appreciation, but Gladwyne remains a long-term stronghold in the regional real estate market.
4. Villanova – 49.3% Home Price Increase Since 2010

- 2010: $627,589
- 2011: $621,313 (-$6,276, -1.00% from previous year)
- 2012: $639,953 (+$18,640, +3.00% from previous year)
- 2013: $659,151 (+$19,198, +3.00% from previous year)
- 2014: $672,334 (+$13,183, +2.00% from previous year)
- 2015: $699,227 (+$26,893, +4.00% from previous year)
- 2016: $727,196 (+$27,969, +4.00% from previous year)
- 2017: $756,284 (+$29,088, +4.00% from previous year)
- 2018: $794,099 (+$37,815, +5.00% from previous year)
- 2019: $825,863 (+$31,764, +4.00% from previous year)
- 2020: N/A
- 2021: $900,190
- 2022: $972,206 (+$72,016, +8.00% from previous year)
- 2023: $1,001,372 (+$29,166, +3.00% from previous year)
- 2024: $1,041,427 (+$40,055, +4.00% from previous year)
- 2025: $937,284 (-$104,143, -10.00% from previous year)
Villanova’s housing market saw a 49.3% increase in values from $627,589 in 2010 to $937,284 in 2025. The area enjoyed consistent growth for more than a decade before a significant pullback in 2025. Still, it remains one of the most valuable areas in the state.
Villanova – Upscale Appeal With Academic Anchors
Home to Villanova University and stately residential neighborhoods, Villanova offers a unique mix of collegiate atmosphere and quiet affluence. Spanning both Delaware and Montgomery counties, it sits near the geographic heart of the Main Line.
The university presence adds cultural value and stability, while multimillion-dollar homes and wooded lots draw affluent buyers. The 2025 price drop, while sharp, follows several high-growth years and is consistent with market rebalancing seen in other top-tier areas.
3. Bryn Mawr – 52.2% Home Price Increase Since 2010

- 2010: $694,257
- 2011: $687,314 (-$6,943, -1.00% from previous year)
- 2012: $707,934 (+$20,620, +3.00% from previous year)
- 2013: $729,172 (+$21,238, +3.00% from previous year)
- 2014: $758,339 (+$29,167, +4.00% from previous year)
- 2015: $788,672 (+$30,333, +4.00% from previous year)
- 2016: $820,219 (+$31,547, +4.00% from previous year)
- 2017: $853,028 (+$32,809, +4.00% from previous year)
- 2018: $895,679 (+$42,651, +5.00% from previous year)
- 2019: $931,506 (+$35,827, +4.00% from previous year)
- 2020: N/A
- 2021: $1,015,342
- 2022: $1,096,569 (+$81,227, +8.00% from previous year)
- 2023: $1,129,466 (+$32,897, +3.00% from previous year)
- 2024: $1,174,645 (+$45,179, +4.00% from previous year)
- 2025: $1,057,180 (-$117,465, -10.00% from previous year)
Bryn Mawr’s median home price climbed from $694,257 in 2010 to $1,057,180 in 2025, a 52.2% gain. The town reached its peak in 2024 before seeing the sharpest year-over-year drop on this list in 2025 — a 10% decrease.
Bryn Mawr – Cultural Center With Lasting Value
Bryn Mawr is a cultural and educational hub, home to the historic Bryn Mawr College and surrounded by grand homes, elite schools, and strong Main Line infrastructure. Its name is almost synonymous with wealth and prestige in the Philadelphia suburbs.
Real estate values here were buoyed by consistent demand and limited inventory. The recent downturn might seem dramatic, but in context, it is a market correction following years of uninterrupted gains. Bryn Mawr’s long-term outlook remains strong.
2. Haverford – 55.2% Home Price Increase Since 2010

- 2010: $763,915
- 2011: $756,276 (-$7,639, -1.00% from previous year)
- 2012: $778,964 (+$22,688, +3.00% from previous year)
- 2013: $802,333 (+$23,369, +3.00% from previous year)
- 2014: $834,426 (+$32,093, +4.00% from previous year)
- 2015: $867,803 (+$33,377, +4.00% from previous year)
- 2016: $902,515 (+$34,712, +4.00% from previous year)
- 2017: $938,616 (+$36,101, +4.00% from previous year)
- 2018: $985,547 (+$46,931, +5.00% from previous year)
- 2019: $1,024,969 (+$39,422, +4.00% from previous year)
- 2020: N/A
- 2021: $1,117,216
- 2022: $1,229,938 (+$112,722, +10.09% from previous year)
- 2023: $1,266,836 (+$36,898, +3.00% from previous year)
- 2024: $1,317,509 (+$50,673, +4.00% from previous year)
- 2025: $1,185,758 (-$131,751, -10.00% from previous year)
Haverford’s home prices surged from $763,915 in 2010 to $1,185,758 in 2025 — a 55.2% increase. The town experienced consistent gains through 2024 before dropping 10% in 2025, the largest nominal decrease among the towns listed.
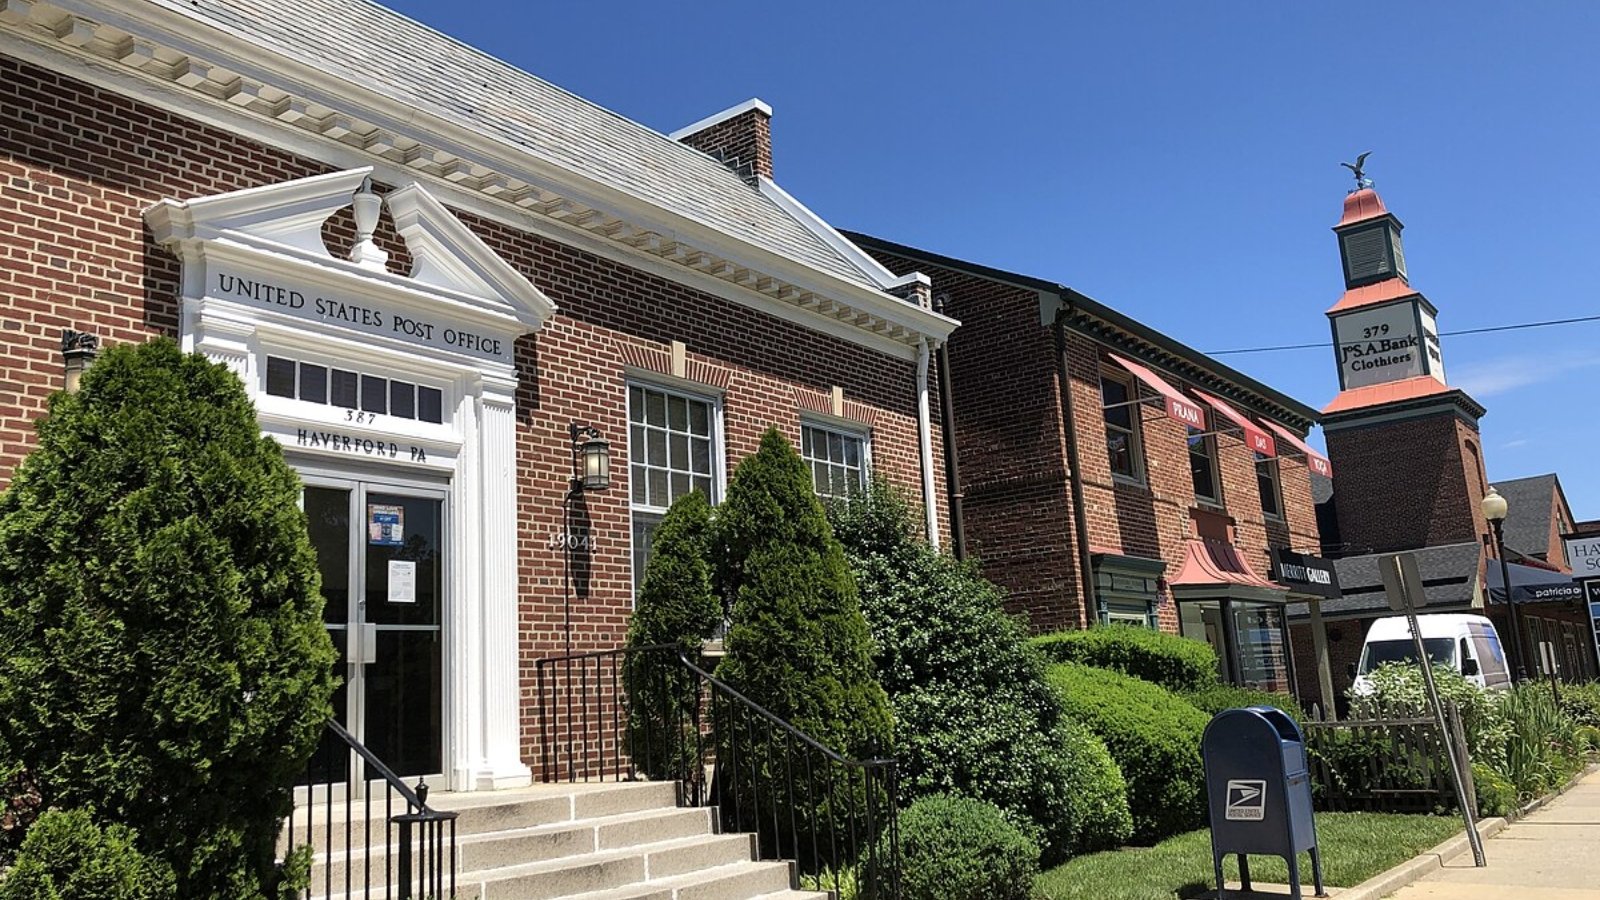
Haverford – Steep Growth With Elite Demand
🔥 Would you like to save this?
Haverford sits at the core of the Main Line, marked by stately homes, historic architecture, and proximity to Haverford College. It draws high-income residents seeking refined living, top-rated schools, and access to regional rail.
The sharp increase post-2020 reflects intense demand during the housing boom. The recent downturn is noteworthy but doesn’t erase over a decade of solid appreciation. Haverford continues to be a prime destination for luxury buyers.
1. Chesterbrook – 55.1% Home Price Increase Since 2010

- 2010: $865,274
- 2011: $856,621 (-$8,653, -1.00% from previous year)
- 2012: $882,320 (+$25,699, +3.00% from previous year)
- 2013: $908,789 (+$26,469, +3.00% from previous year)
- 2014: $945,141 (+$36,352, +4.00% from previous year)
- 2015: $982,946 (+$37,805, +4.00% from previous year)
- 2016: $1,022,264 (+$39,318, +4.00% from previous year)
- 2017: $1,063,155 (+$40,891, +4.00% from previous year)
- 2018: $1,116,313 (+$53,158, +5.00% from previous year)
- 2019: $1,160,965 (+$44,652, +4.00% from previous year)
- 2020: N/A
- 2021: $1,265,452
- 2022: $1,391,997 (+$126,545, +10.00% from previous year)
- 2023: $1,433,757 (+$41,760, +3.00% from previous year)
- 2024: $1,491,107 (+$57,350, +4.00% from previous year)
- 2025: $1,341,997 (-$149,110, -10.00% from previous year)
Chesterbrook tops the list with a 55.1% increase in home prices since 2010, peaking in 2024 at nearly $1.5 million. The drop to $1.34 million in 2025 is the largest year-over-year nominal loss on the list, but the market remains one of Pennsylvania’s most elite.
Chesterbrook – Top Dollar in Tredyffrin Township

Located in Chester County’s Tredyffrin Township, Chesterbrook is known for its planned layout, proximity to Valley Forge National Historical Park, and consistent high rankings for quality of life. It blends luxury living with practical access to King of Prussia and the Pennsylvania Turnpike.
The post-2020 price explosion was driven by ultra-low inventory, affluent buyers, and top-tier amenities. While the 2025 drop is significant, Chesterbrook’s fundamentals remain strong, with prices still far above pre-pandemic levels.


