Would you like to save this?
Maine’s charm has never been a secret, but in 2025, the price tags on homes in some of its towns are turning heads. Zillow’s Home Value Index shows these 17 communities hitting all-time highs, driven by a potent mix of scenic beauty, low housing supply, and growing interest from out-of-state buyers. Whether it’s a rugged seaside retreat or a quaint inland village, each town on this list has seen values soar—some more than doubling in just a decade.
17. Bar Harbor – 116% Home Price Increase Since 2013
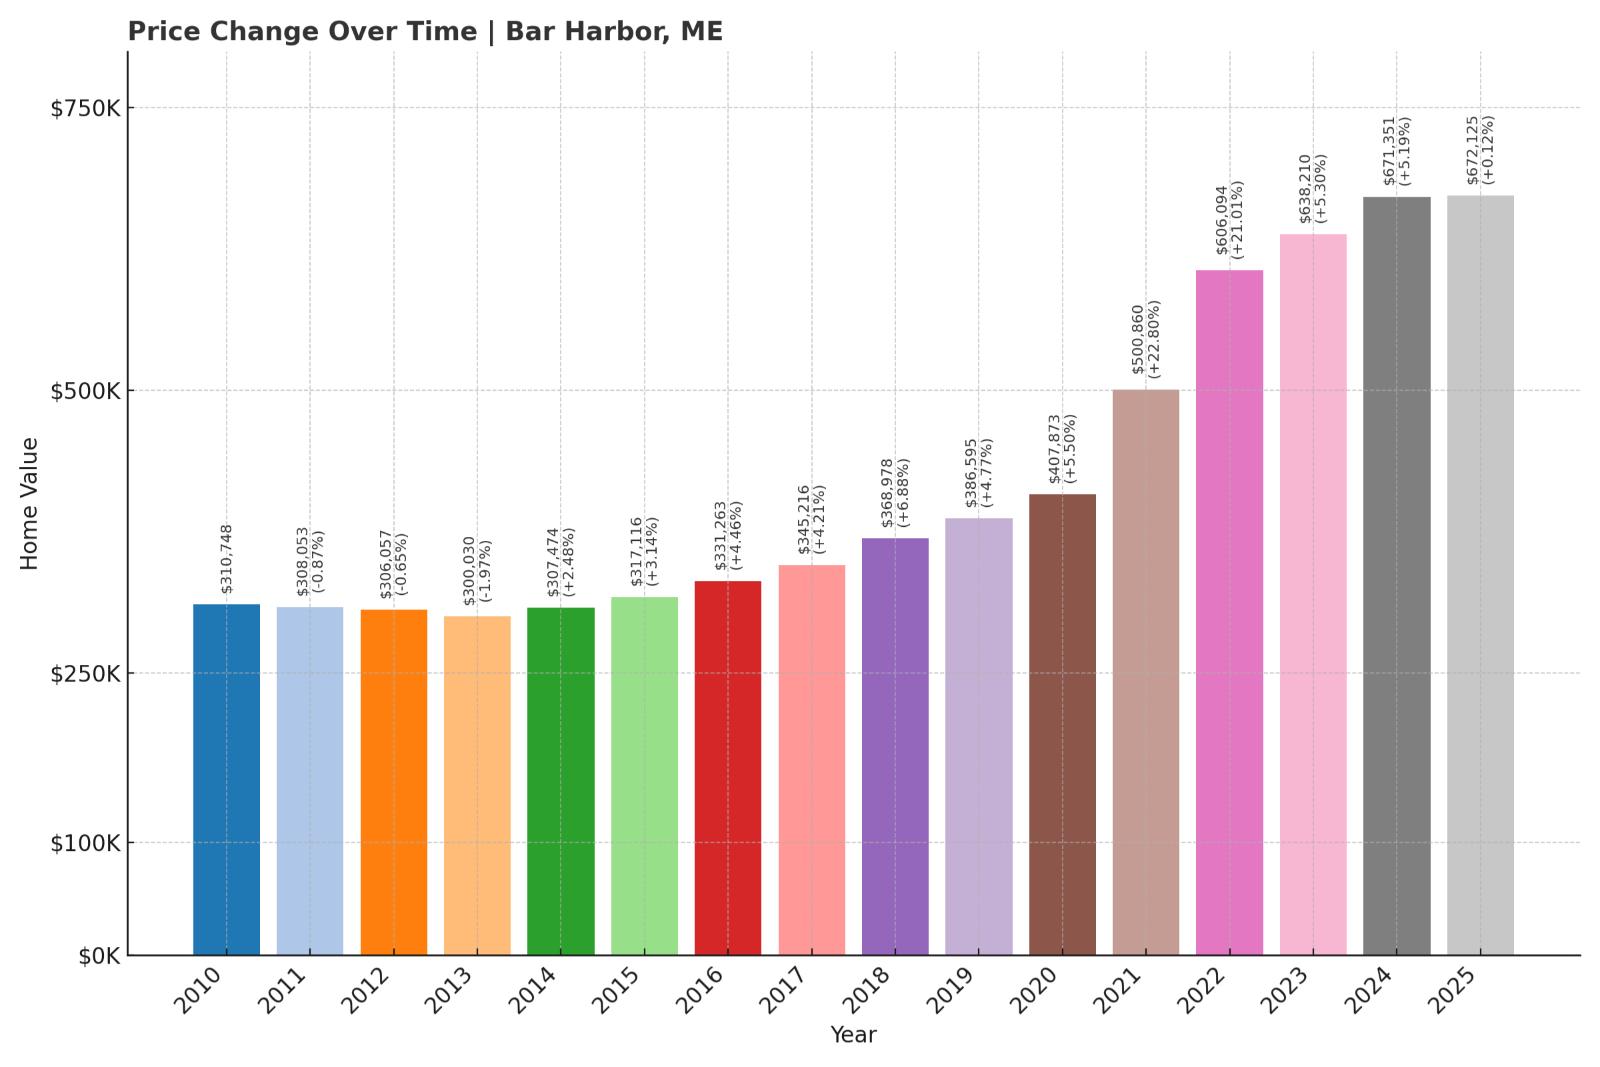
- 2010: $310,748
- 2011: $308,053 (-$2,694, -0.87% from previous year)
- 2012: $306,057 (-$1,996, -0.65% from previous year)
- 2013: $300,030 (-$6,028, -1.97% from previous year)
- 2014: $307,474 (+$7,445, +2.48% from previous year)
- 2015: $317,116 (+$9,642, +3.14% from previous year)
- 2016: $331,263 (+$14,147, +4.46% from previous year)
- 2017: $345,216 (+$13,954, +4.21% from previous year)
- 2018: $368,978 (+$23,761, +6.88% from previous year)
- 2019: $386,595 (+$17,617, +4.77% from previous year)
- 2020: $407,873 (+$21,278, +5.50% from previous year)
- 2021: $500,860 (+$92,988, +22.80% from previous year)
- 2022: $606,094 (+$105,233, +21.01% from previous year)
- 2023: $638,210 (+$32,116, +5.30% from previous year)
- 2024: $671,351 (+$33,141, +5.19% from previous year)
- 2025: $672,125 (+$774, +0.12% from previous year)
Bar Harbor’s home prices have more than doubled since 2013, climbing from $300,030 to $672,125 by 2025. Much of the growth came during the pandemic boom, especially between 2020 and 2022, when values jumped by nearly $200,000 in just two years. Although appreciation has slowed recently, prices remain significantly elevated from their previous levels.
Bar Harbor – Tourist Magnet and Real Estate Pressure

Bar Harbor sits on Mount Desert Island and serves as the primary gateway to Acadia National Park, one of the most visited parks in the U.S. This popularity helps explain why home prices have surged, especially during the pandemic when remote work and rural appeal drove a fresh wave of buyers into town.
Limited land, strict zoning, and a significant portion of seasonal rentals have made inventory tight, adding even more pressure on prices. While growth has steadied since 2023, Bar Harbor’s desirability ensures it stays among Maine’s costliest places to live.
16. Freeport – 114% Home Price Increase Since 2012
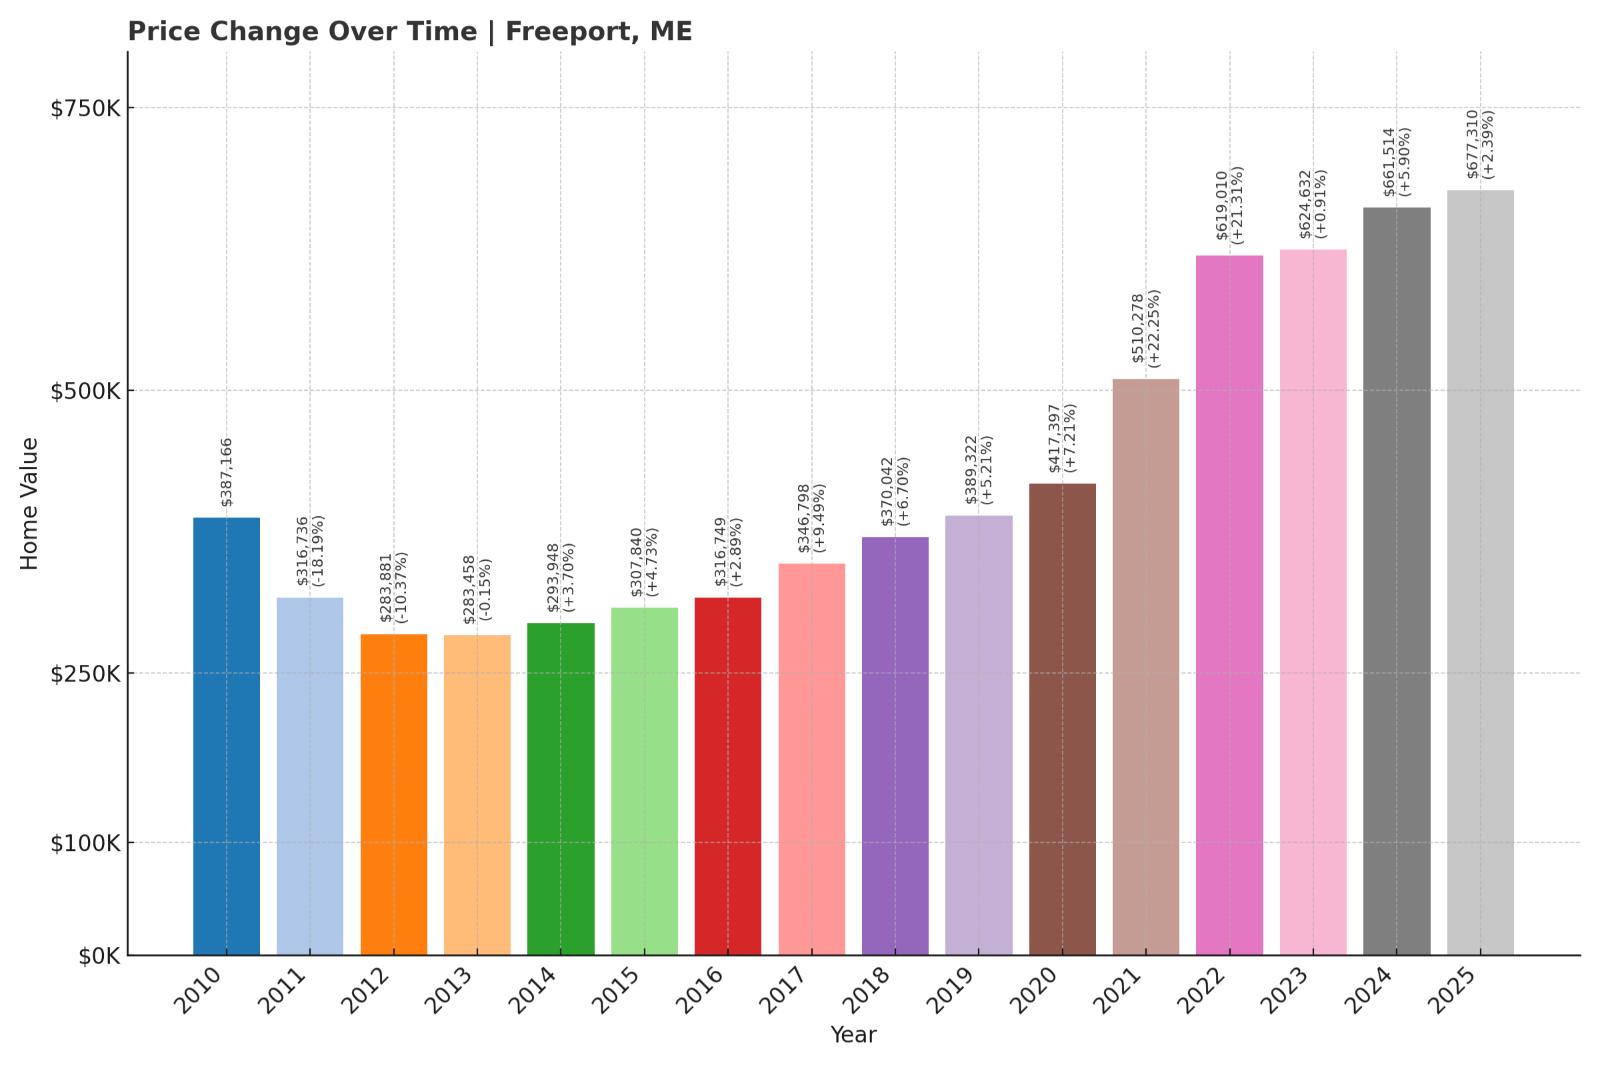
- 2010: $387,166
- 2011: $316,736 (-$70,430, -18.19% from previous year)
- 2012: $283,881 (-$32,855, -10.37% from previous year)
- 2013: $283,458 (-$423, -0.15% from previous year)
- 2014: $293,948 (+$10,490, +3.70% from previous year)
- 2015: $307,840 (+$13,892, +4.73% from previous year)
- 2016: $316,749 (+$8,909, +2.89% from previous year)
- 2017: $346,798 (+$30,050, +9.49% from previous year)
- 2018: $370,042 (+$23,244, +6.70% from previous year)
- 2019: $389,322 (+$19,279, +5.21% from previous year)
- 2020: $417,397 (+$28,075, +7.21% from previous year)
- 2021: $510,278 (+$92,881, +22.25% from previous year)
- 2022: $619,010 (+$108,731, +21.31% from previous year)
- 2023: $624,632 (+$5,622, +0.91% from previous year)
- 2024: $661,514 (+$36,882, +5.90% from previous year)
- 2025: $677,310 (+$15,796, +2.39% from previous year)
Freeport home prices bottomed out in 2012 after a steep drop from the 2008 recession, but the town has rebounded dramatically. Since then, prices have more than doubled. The post-2020 surge was especially steep, with gains of over $200,000 in just three years.
Freeport – Retail Hub Turned Hot Housing Market

Were You Meant
to Live In?
Known as the headquarters of L.L. Bean and a major shopping destination, Freeport combines New England charm with walkable retail and coastal scenery. Though it was once more affordable, today’s buyers face high competition and low inventory.
Much of the recent appreciation reflects pandemic-era demand, but ongoing interest in Freeport’s blend of convenience and coastal access keeps its home values high. Despite a brief leveling off in 2023, prices jumped again in 2024 and 2025.
15. Georgetown – 118% Home Price Increase Since 2012

- 2010: N/A
- 2011: N/A
- 2012: $313,059
- 2013: $323,658 (+$10,599, +3.39% from previous year)
- 2014: $330,151 (+$6,493, +2.01% from previous year)
- 2015: $344,935 (+$14,784, +4.48% from previous year)
- 2016: $401,181 (+$56,246, +16.31% from previous year)
- 2017: $393,929 (-$7,252, -1.81% from previous year)
- 2018: $399,100 (+$5,171, +1.31% from previous year)
- 2019: $411,976 (+$12,876, +3.23% from previous year)
- 2020: $414,588 (+$2,612, +0.63% from previous year)
- 2021: $509,124 (+$94,536, +22.80% from previous year)
- 2022: $608,904 (+$99,780, +19.60% from previous year)
- 2023: $609,058 (+$154, +0.03% from previous year)
- 2024: $702,747 (+$93,688, +15.38% from previous year)
- 2025: $681,296 (-$21,450, -3.05% from previous year)
Georgetown’s home values have surged since 2012, peaking in 2024 at just over $700,000. Although prices dipped slightly in 2025, they remain more than double their value from a decade ago. The town has seen steady growth interrupted by brief plateaus or minor pullbacks.
Georgetown – Secluded Setting With Soaring Values

Located on a peninsula along the midcoast, Georgetown offers dramatic ocean views and proximity to Reid State Park. It’s sparsely populated, with many homes used seasonally, which contributes to its high housing costs.
The limited supply and unique natural setting have drawn high-income buyers, particularly in recent years. While 2025 saw a slight pullback, the overall trend shows long-term growth rooted in location-driven demand.
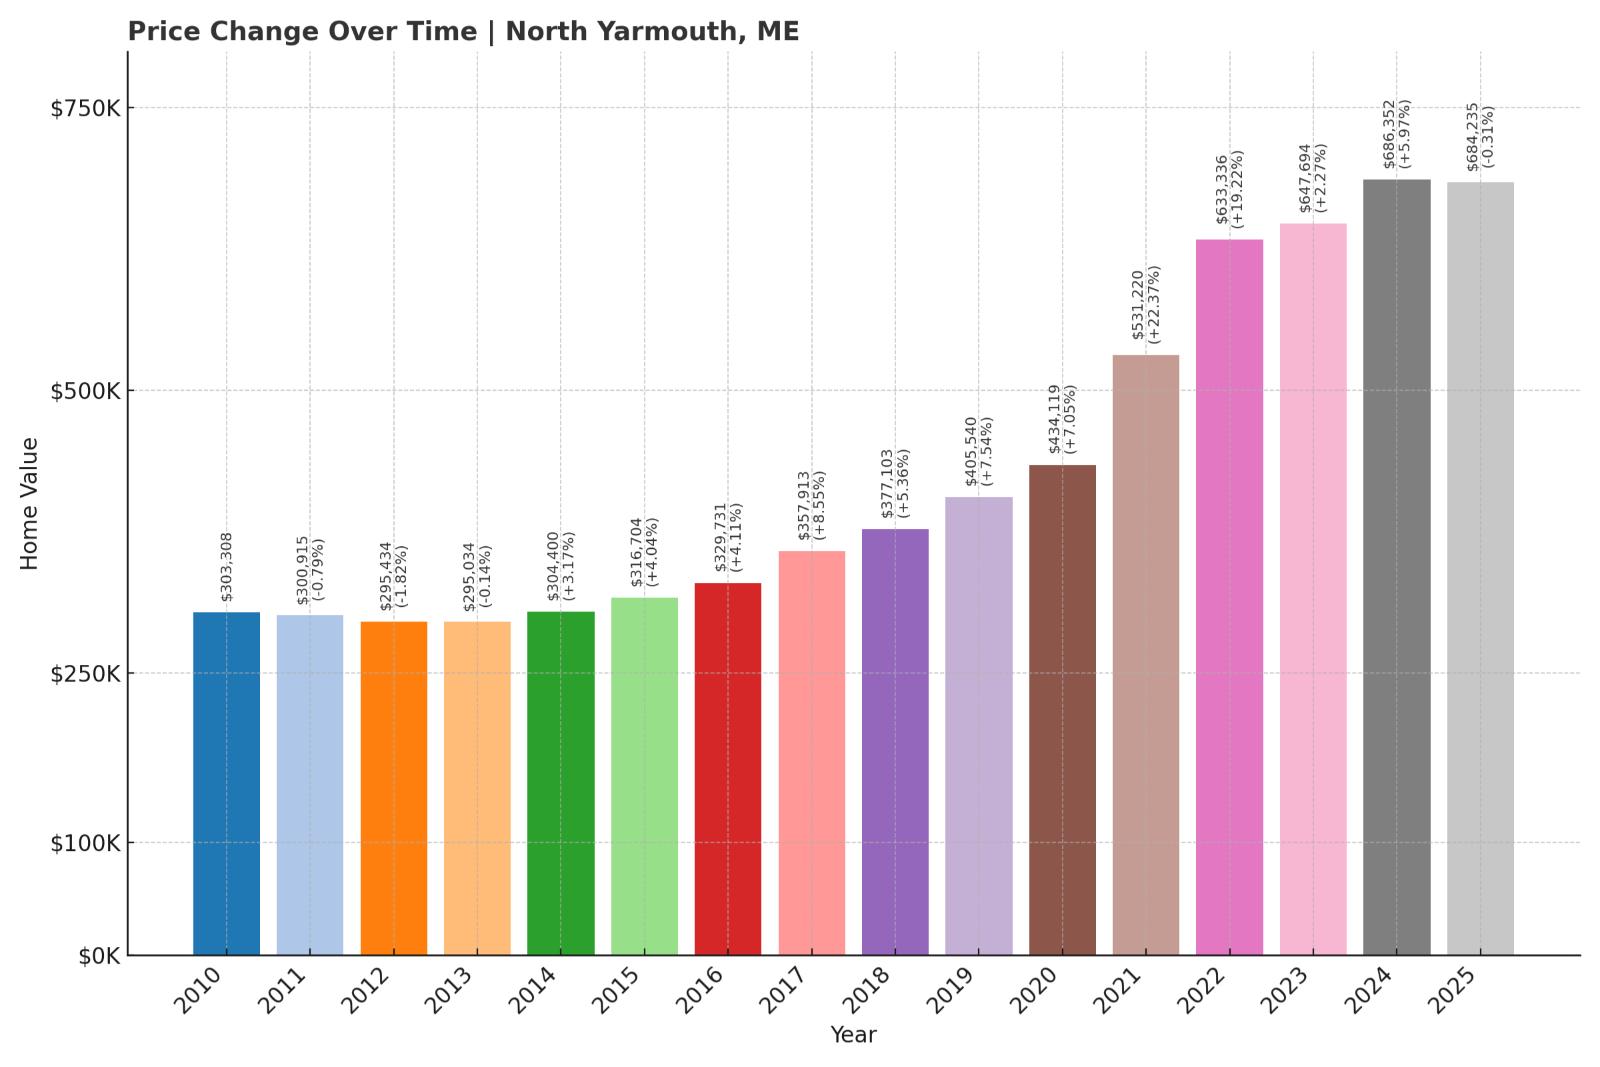
14. North Yarmouth – 132% Home Price Increase Since 2013
Home Stratosphere Guide
Your Personality Already Knows
How Your Home Should Feel
113 pages of room-by-room design guidance built around your actual brain, your actual habits, and the way you actually live.
You might be an ISFJ or INFP designer…
You design through feeling — your spaces are personal, comforting, and full of meaning. The guide covers your exact color palettes, room layouts, and the one mistake your type always makes.
The full guide maps all 16 types to specific rooms, palettes & furniture picks ↓
You might be an ISTJ or INTJ designer…
You crave order, function, and visual calm. The guide shows you how to create spaces that feel both serene and intentional — without ending up sterile.
The full guide maps all 16 types to specific rooms, palettes & furniture picks ↓
You might be an ENFP or ESTP designer…
You design by instinct and energy. Your home should feel alive. The guide shows you how to channel that into rooms that feel curated, not chaotic.
The full guide maps all 16 types to specific rooms, palettes & furniture picks ↓
You might be an ENTJ or ESTJ designer…
You value quality, structure, and things done right. The guide gives you the framework to build rooms that feel polished without overthinking every detail.
The full guide maps all 16 types to specific rooms, palettes & furniture picks ↓
- 2010: $303,308
- 2011: $300,915 (-$2,393, -0.79% from previous year)
- 2012: $295,434 (-$5,481, -1.82% from previous year)
- 2013: $295,034 (-$400, -0.14% from previous year)
- 2014: $304,400 (+$9,366, +3.17% from previous year)
- 2015: $316,704 (+$12,304, +4.04% from previous year)
- 2016: $329,731 (+$13,027, +4.11% from previous year)
- 2017: $357,913 (+$28,182, +8.55% from previous year)
- 2018: $377,103 (+$19,190, +5.36% from previous year)
- 2019: $405,540 (+$28,437, +7.54% from previous year)
- 2020: $434,119 (+$28,580, +7.05% from previous year)
- 2021: $531,220 (+$97,101, +22.37% from previous year)
- 2022: $633,336 (+$102,116, +19.22% from previous year)
- 2023: $647,694 (+$14,358, +2.27% from previous year)
- 2024: $686,352 (+$38,659, +5.97% from previous year)
- 2025: $684,235 (-$2,117, -0.31% from previous year)
North Yarmouth home prices have climbed from under $300,000 in 2013 to nearly $685,000 in 2025. Like many Maine towns, most of the acceleration came between 2020 and 2022, followed by smaller gains and a modest dip this year.
North Yarmouth – A Commuter Town With Rural Roots

This semi-rural suburb of Portland has become a magnet for families seeking more space while staying within reach of the city. North Yarmouth combines farmland charm with upscale new developments, which has fueled demand and higher values.
Despite a slight price slip in 2025, the town remains one of the fastest-appreciating in the state. Large lot sizes, a strong school district, and proximity to Yarmouth and Portland all contribute to its high ranking.
13. Scarborough – 133% Home Price Increase Since 2011

- 2010: $312,941
- 2011: $299,621 (-$13,319, -4.26% from previous year)
- 2012: $302,290 (+$2,669, +0.89% from previous year)
- 2013: $298,517 (-$3,773, -1.25% from previous year)
- 2014: $314,935 (+$16,417, +5.50% from previous year)
- 2015: $322,368 (+$7,433, +2.36% from previous year)
- 2016: $335,858 (+$13,490, +4.18% from previous year)
- 2017: $368,850 (+$32,992, +9.82% from previous year)
- 2018: $396,869 (+$28,019, +7.60% from previous year)
- 2019: $405,440 (+$8,571, +2.16% from previous year)
- 2020: $428,322 (+$22,882, +5.64% from previous year)
- 2021: $524,478 (+$96,156, +22.45% from previous year)
- 2022: $615,945 (+$91,467, +17.44% from previous year)
- 2023: $637,570 (+$21,625, +3.51% from previous year)
- 2024: $691,453 (+$53,882, +8.45% from previous year)
- 2025: $705,190 (+$13,737, +1.99% from previous year)
Scarborough’s real estate prices have grown steadily over the past decade and a half, up from around $300,000 in 2011 to over $700,000 in 2025. Even small dips have been short-lived, and 2021 through 2024 saw especially strong gains.
Scarborough – Beaches, Suburbs, and High Demand

Scarborough’s appeal lies in its balance: it offers beaches, suburban neighborhoods, and close proximity to Portland. The town has experienced both residential growth and significant infrastructure investment in recent years.
These factors, combined with strong schools and job access, have contributed to fast-rising home values. It continues to attract professionals, retirees, and second-home buyers, keeping demand consistently strong.
12. North Haven – 0.49% Home Price Increase Since 2024

- 2010: N/A
- 2011: N/A
- 2012: N/A
- 2013: N/A
- 2014: N/A
- 2015: N/A
- 2016: N/A
- 2017: N/A
- 2018: N/A
- 2019: N/A
- 2020: N/A
- 2021: N/A
- 2022: N/A
- 2023: N/A
- 2024: $706,391
- 2025: $709,855 (+$3,464, +0.49% from previous year)
North Haven’s home values have only recently entered Zillow’s dataset, but the current figures already place it among Maine’s most expensive towns. Between 2024 and 2025, home values rose modestly by just under 0.5%, indicating a market that may be plateauing at a high level.
North Haven – Remote, Rugged, and In Demand

North Haven is an island community in Penobscot Bay, accessible only by ferry. With fewer than 400 year-round residents and a strong seasonal population, it offers a quiet, exclusive lifestyle that commands premium prices.
The limited inventory and challenging access mean homes don’t turn over often, which helps explain the small price movement between 2024 and 2025. But even modest changes in such a small, high-end market can represent major shifts in buyer demand.
11. Harpswell – 97% Home Price Increase Since 2013

- 2010: $362,951
- 2011: $318,548 (-$44,403, -12.23% from previous year)
- 2012: $322,009 (+$3,461, +1.09% from previous year)
- 2013: $319,346 (-$2,663, -0.83% from previous year)
- 2014: $339,161 (+$19,816, +6.21% from previous year)
- 2015: $350,450 (+$11,289, +3.33% from previous year)
- 2016: $359,670 (+$9,219, +2.63% from previous year)
- 2017: $384,567 (+$24,897, +6.92% from previous year)
- 2018: $400,590 (+$16,022, +4.17% from previous year)
- 2019: $423,828 (+$23,238, +5.80% from previous year)
- 2020: $438,317 (+$14,489, +3.42% from previous year)
- 2021: $550,941 (+$112,624, +25.69% from previous year)
- 2022: $675,656 (+$124,715, +22.64% from previous year)
- 2023: $660,887 (-$14,769, -2.19% from previous year)
- 2024: $731,521 (+$70,634, +10.69% from previous year)
- 2025: $715,944 (-$15,578, -2.13% from previous year)
Harpswell home values have nearly doubled since 2013, even with a few dips in recent years. The town reached a peak in 2024 before declining slightly in 2025, but overall, the long-term trend remains sharply upward.
Harpswell – A Scenic Coastal Retreat

Spread across peninsulas and islands on Casco Bay, Harpswell is one of Maine’s most picturesque waterfront towns. Its appeal lies in oceanfront homes, peaceful surroundings, and access to outdoor recreation like boating and hiking.
The housing market here reflects strong demand for coastal living, especially during and after the pandemic. Price softening in 2023 and 2025 may reflect market correction after steep increases, but Harpswell’s natural beauty keeps it in high demand.
10. Cumberland – 127% Home Price Increase Since 2012

- 2010: $335,807
- 2011: $331,550 (-$4,257, -1.27% from previous year)
- 2012: $322,280 (-$9,270, -2.80% from previous year)
- 2013: $326,693 (+$4,413, +1.37% from previous year)
- 2014: $343,328 (+$16,635, +5.09% from previous year)
- 2015: $350,930 (+$7,602, +2.21% from previous year)
- 2016: $372,659 (+$21,728, +6.19% from previous year)
- 2017: $395,287 (+$22,628, +6.07% from previous year)
- 2018: $413,909 (+$18,622, +4.71% from previous year)
- 2019: $430,117 (+$16,209, +3.92% from previous year)
- 2020: $454,287 (+$24,169, +5.62% from previous year)
- 2021: $559,341 (+$105,054, +23.13% from previous year)
- 2022: $668,299 (+$108,959, +19.48% from previous year)
- 2023: $688,502 (+$20,202, +3.02% from previous year)
- 2024: $732,424 (+$43,922, +6.38% from previous year)
- 2025: $736,686 (+$4,262, +0.58% from previous year)
Since bottoming out in 2012, home values in Cumberland have surged, adding more than $400,000 to the typical home price over 13 years. While growth has moderated recently, the market remains one of Maine’s most valuable.
Cumberland – Suburban Living With Coastal Access

Just north of Portland, Cumberland is a popular residential community with a blend of rural and suburban character. It offers access to the coast, top-rated schools, and easy commuting into the metro area.
Much of the price growth happened between 2020 and 2022, fueled by demand for larger homes in commuter-friendly areas. Recent gains have been smaller, suggesting stabilization rather than decline.
9. Yarmouth – 145% Home Price Increase Since 2012
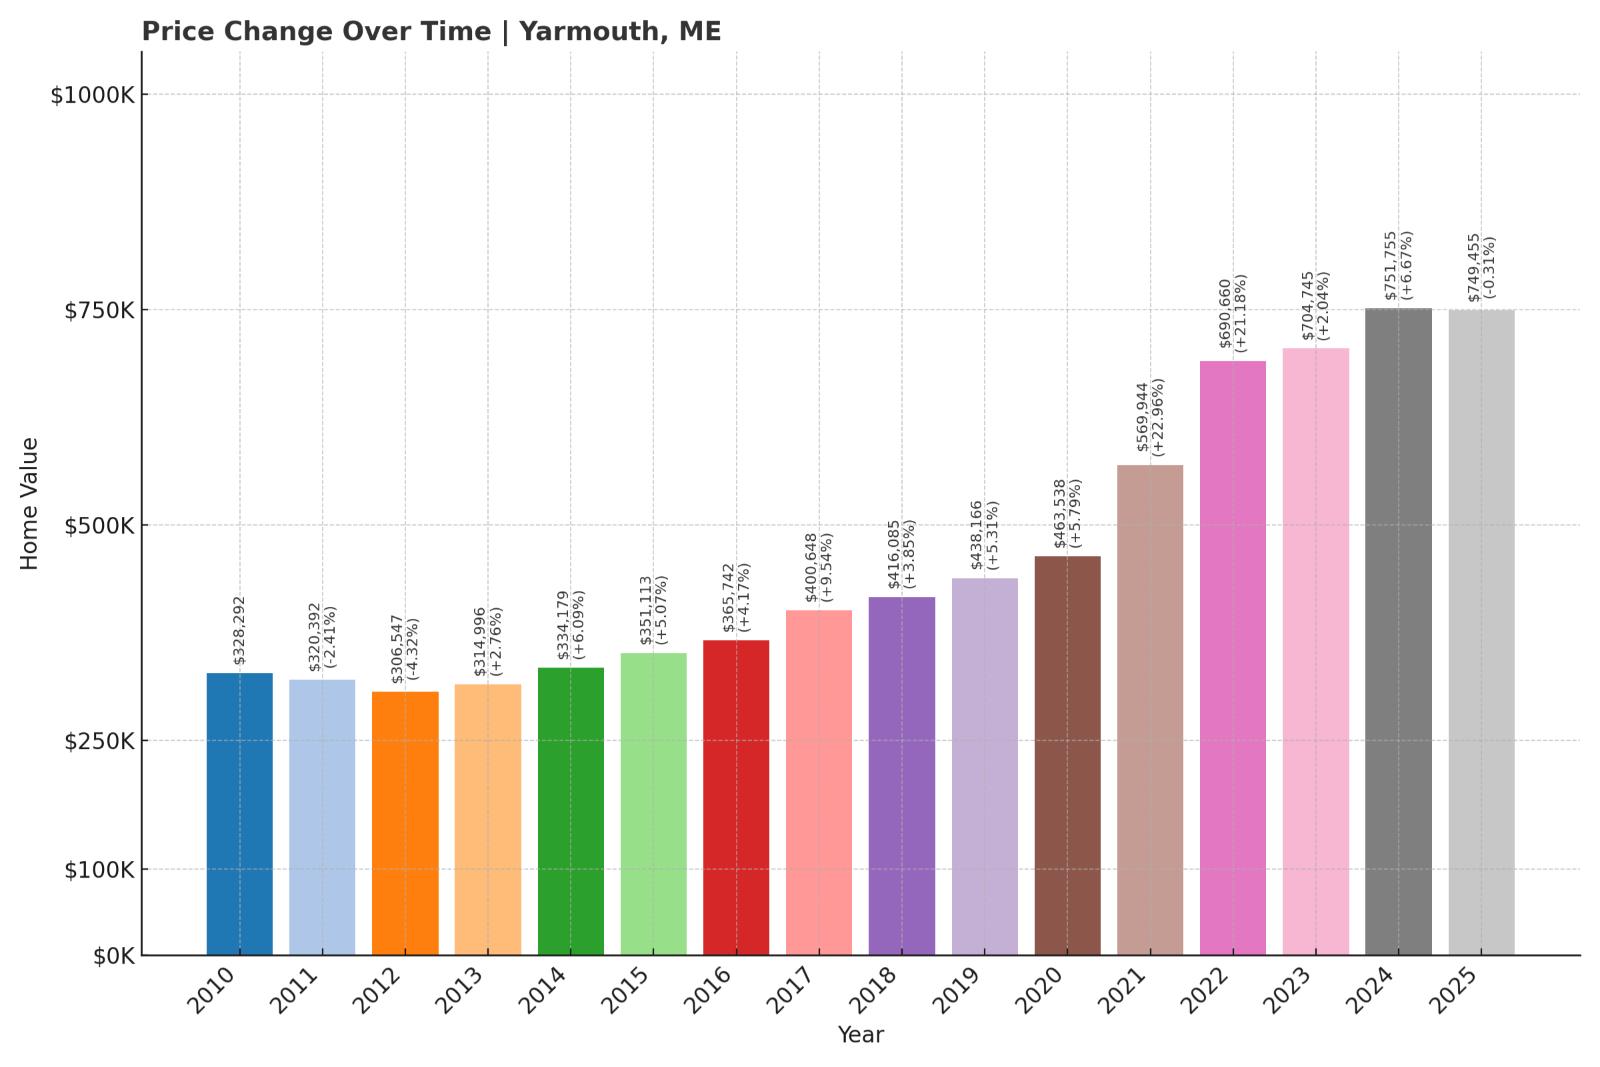
- 2010: $328,292
- 2011: $320,392 (-$7,899, -2.41% from previous year)
- 2012: $306,547 (-$13,845, -4.32% from previous year)
- 2013: $314,996 (+$8,449, +2.76% from previous year)
- 2014: $334,179 (+$19,183, +6.09% from previous year)
- 2015: $351,113 (+$16,934, +5.07% from previous year)
- 2016: $365,742 (+$14,629, +4.17% from previous year)
- 2017: $400,648 (+$34,906, +9.54% from previous year)
- 2018: $416,085 (+$15,437, +3.85% from previous year)
- 2019: $438,166 (+$22,081, +5.31% from previous year)
- 2020: $463,538 (+$25,371, +5.79% from previous year)
- 2021: $569,944 (+$106,407, +22.96% from previous year)
- 2022: $690,660 (+$120,715, +21.18% from previous year)
- 2023: $704,745 (+$14,085, +2.04% from previous year)
- 2024: $751,755 (+$47,011, +6.67% from previous year)
- 2025: $749,455 (-$2,301, -0.31% from previous year)
Yarmouth’s home values have more than doubled since 2012, with some of the steepest increases happening between 2020 and 2022. Though 2025 shows a slight decrease, the long-term growth remains impressive.
Yarmouth – Waterfront Charm Meets Small-Town Appeal

Yarmouth combines walkability, excellent schools, and a harbor setting that appeals to both full-time residents and vacation home buyers. Located just north of Portland, it’s a top choice for those seeking both convenience and charm.
Though recent price drops may suggest a cooling market, limited supply and strong demand ensure that Yarmouth remains a pricey and sought-after location.
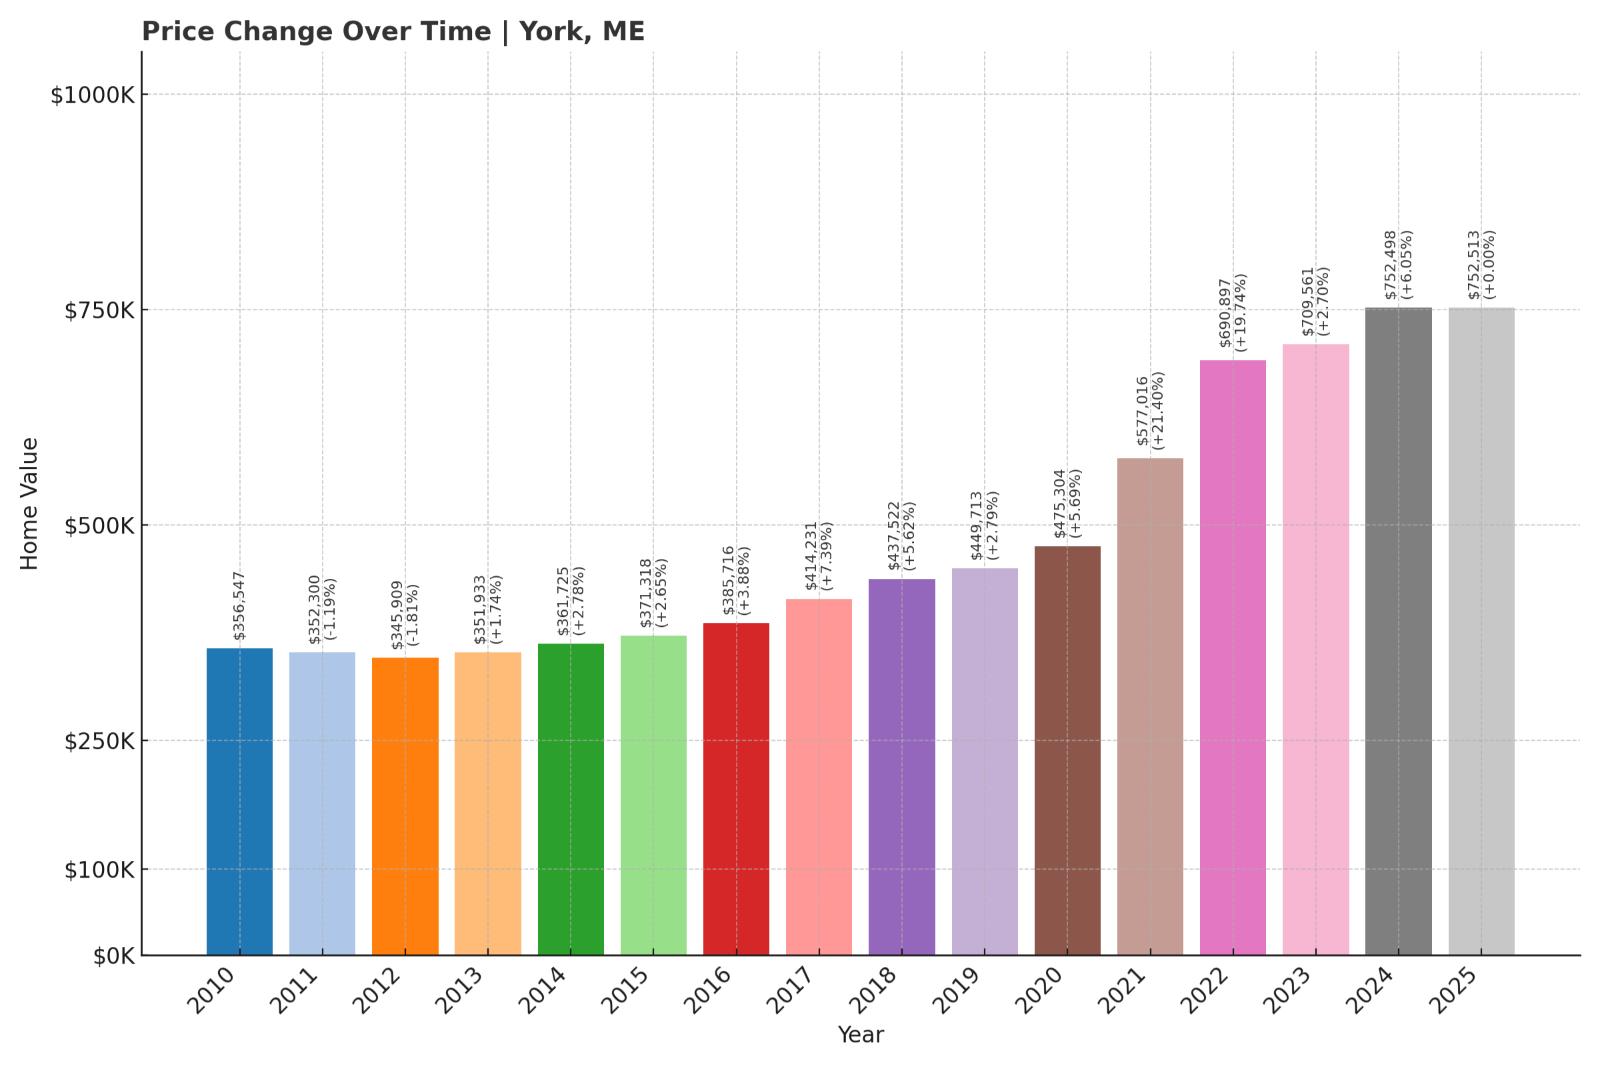
8. York – 117% Home Price Increase Since 2012
Would you like to save this?
- 2010: $356,547
- 2011: $352,300 (-$4,246, -1.19% from previous year)
- 2012: $345,909 (-$6,391, -1.81% from previous year)
- 2013: $351,933 (+$6,024, +1.74% from previous year)
- 2014: $361,725 (+$9,791, +2.78% from previous year)
- 2015: $371,318 (+$9,593, +2.65% from previous year)
- 2016: $385,716 (+$14,398, +3.88% from previous year)
- 2017: $414,231 (+$28,516, +7.39% from previous year)
- 2018: $437,522 (+$23,290, +5.62% from previous year)
- 2019: $449,713 (+$12,191, +2.79% from previous year)
- 2020: $475,304 (+$25,592, +5.69% from previous year)
- 2021: $577,016 (+$101,712, +21.40% from previous year)
- 2022: $690,897 (+$113,881, +19.74% from previous year)
- 2023: $709,561 (+$18,663, +2.70% from previous year)
- 2024: $752,498 (+$42,937, +6.05% from previous year)
- 2025: $752,513 (+$16, +0.00% from previous year)
York’s home prices have climbed steadily from under $350,000 in 2012 to over $750,000 in 2025. Price growth was especially dramatic between 2020 and 2022, when values rose by more than $200,000 in just two years. Growth has since slowed, with 2025 showing virtually no change from the prior year.
York – Coastal Living and Historic Appeal

One of Maine’s oldest towns, York is a longtime favorite for vacationers thanks to its beaches, lighthouses, and preserved colonial architecture. It’s just over an hour from Boston, which makes it attractive to out-of-state buyers as well.
That consistent demand, especially for second homes and investment properties, has helped York become one of the state’s most expensive towns. While the recent price plateau may reflect cooling demand or affordability pressures, the overall trend remains firmly upward.
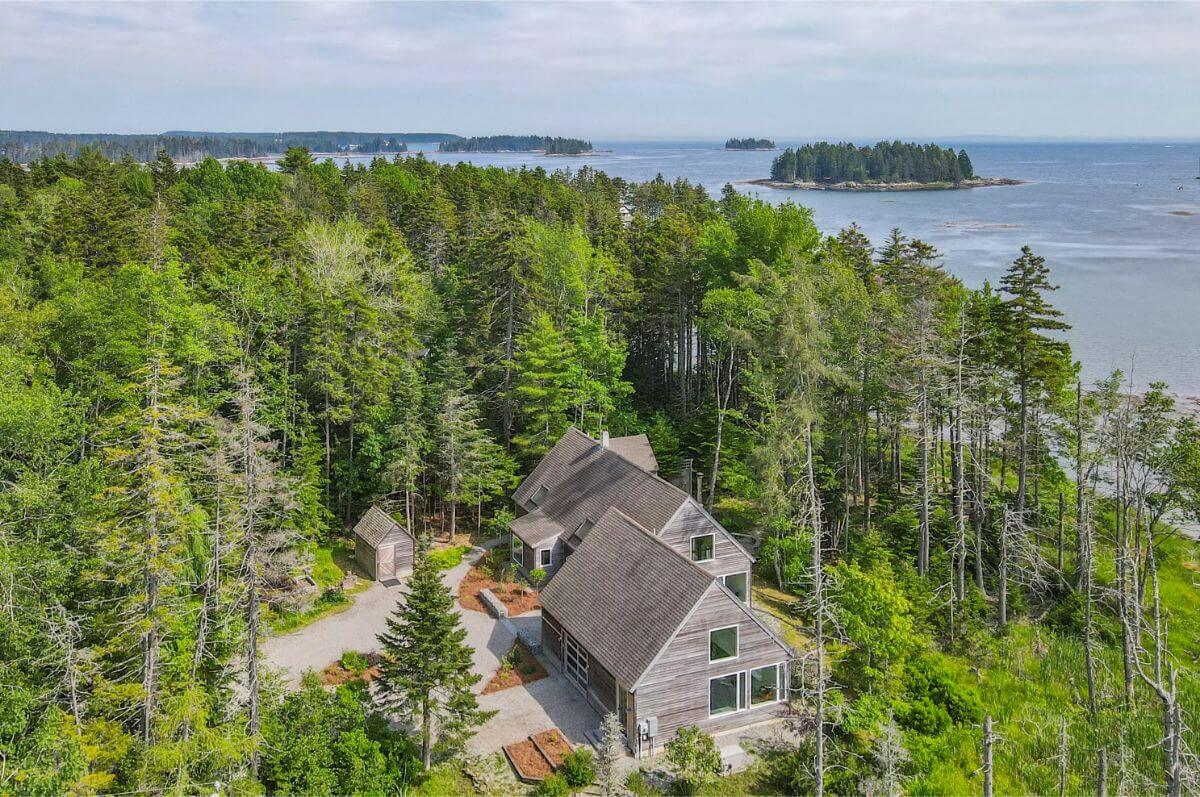
7. South Bristol – 77% Home Price Increase Since 2012

- 2010: N/A
- 2011: N/A
- 2012: $449,548
- 2013: $492,520 (+$42,973, +9.56% from previous year)
- 2014: $524,787 (+$32,266, +6.55% from previous year)
- 2015: $519,663 (-$5,124, -0.98% from previous year)
- 2016: $514,315 (-$5,347, -1.03% from previous year)
- 2017: $488,314 (-$26,001, -5.06% from previous year)
- 2018: $531,520 (+$43,206, +8.85% from previous year)
- 2019: $543,262 (+$11,742, +2.21% from previous year)
- 2020: $600,881 (+$57,619, +10.61% from previous year)
- 2021: $698,012 (+$97,131, +16.16% from previous year)
- 2022: $786,292 (+$88,280, +12.65% from previous year)
- 2023: $746,810 (-$39,482, -5.02% from previous year)
- 2024: $790,199 (+$43,389, +5.81% from previous year)
- 2025: $795,309 (+$5,110, +0.65% from previous year)
South Bristol’s home values have climbed from $449,548 in 2012 to over $795,000 in 2025. Prices soared during the pandemic but have seen some fluctuations in recent years, including a dip in 2023 followed by modest gains.
South Bristol – Waterfront Living in a Quiet Community

Located on the Pemaquid Peninsula, South Bristol is known for its peaceful harbors and working waterfront. Its seclusion and scenic beauty attract second-home buyers and retirees looking for a slower pace of life.
The area’s desirability has pushed prices sharply upward since 2020, though its small size and seasonal nature can lead to volatility. Even with minor recent setbacks, home values remain among the highest in Maine.
6. Cape Elizabeth – 115% Home Price Increase Since 2012

- 2010: $426,803
- 2011: $422,150 (-$4,653, -1.09% from previous year)
- 2012: $405,685 (-$16,465, -3.90% from previous year)
- 2013: $434,607 (+$28,922, +7.13% from previous year)
- 2014: $457,152 (+$22,545, +5.19% from previous year)
- 2015: $462,541 (+$5,389, +1.18% from previous year)
- 2016: $490,553 (+$28,011, +6.06% from previous year)
- 2017: $531,025 (+$40,472, +8.25% from previous year)
- 2018: $554,770 (+$23,745, +4.47% from previous year)
- 2019: $570,456 (+$15,686, +2.83% from previous year)
- 2020: $602,643 (+$32,187, +5.64% from previous year)
- 2021: $750,639 (+$147,995, +24.56% from previous year)
- 2022: $871,100 (+$120,461, +16.05% from previous year)
- 2023: $880,751 (+$9,651, +1.11% from previous year)
- 2024: $869,227 (-$11,524, -1.31% from previous year)
- 2025: $871,135 (+$1,908, +0.22% from previous year)
Home prices in Cape Elizabeth have risen from just over $400,000 in 2012 to more than $870,000 in 2025. Price spikes between 2020 and 2022 accounted for most of the recent growth, while the last two years have seen minimal movement.
Cape Elizabeth – High-End Living on the Coast

With iconic landmarks like Portland Head Light and Fort Williams Park, Cape Elizabeth is one of southern Maine’s most desirable addresses. It offers oceanfront properties, proximity to Portland, and a tight-knit residential feel.
Strong demand has kept prices high even as appreciation slowed. Despite some flattening since 2023, this coastal suburb remains one of Maine’s top-tier housing markets.
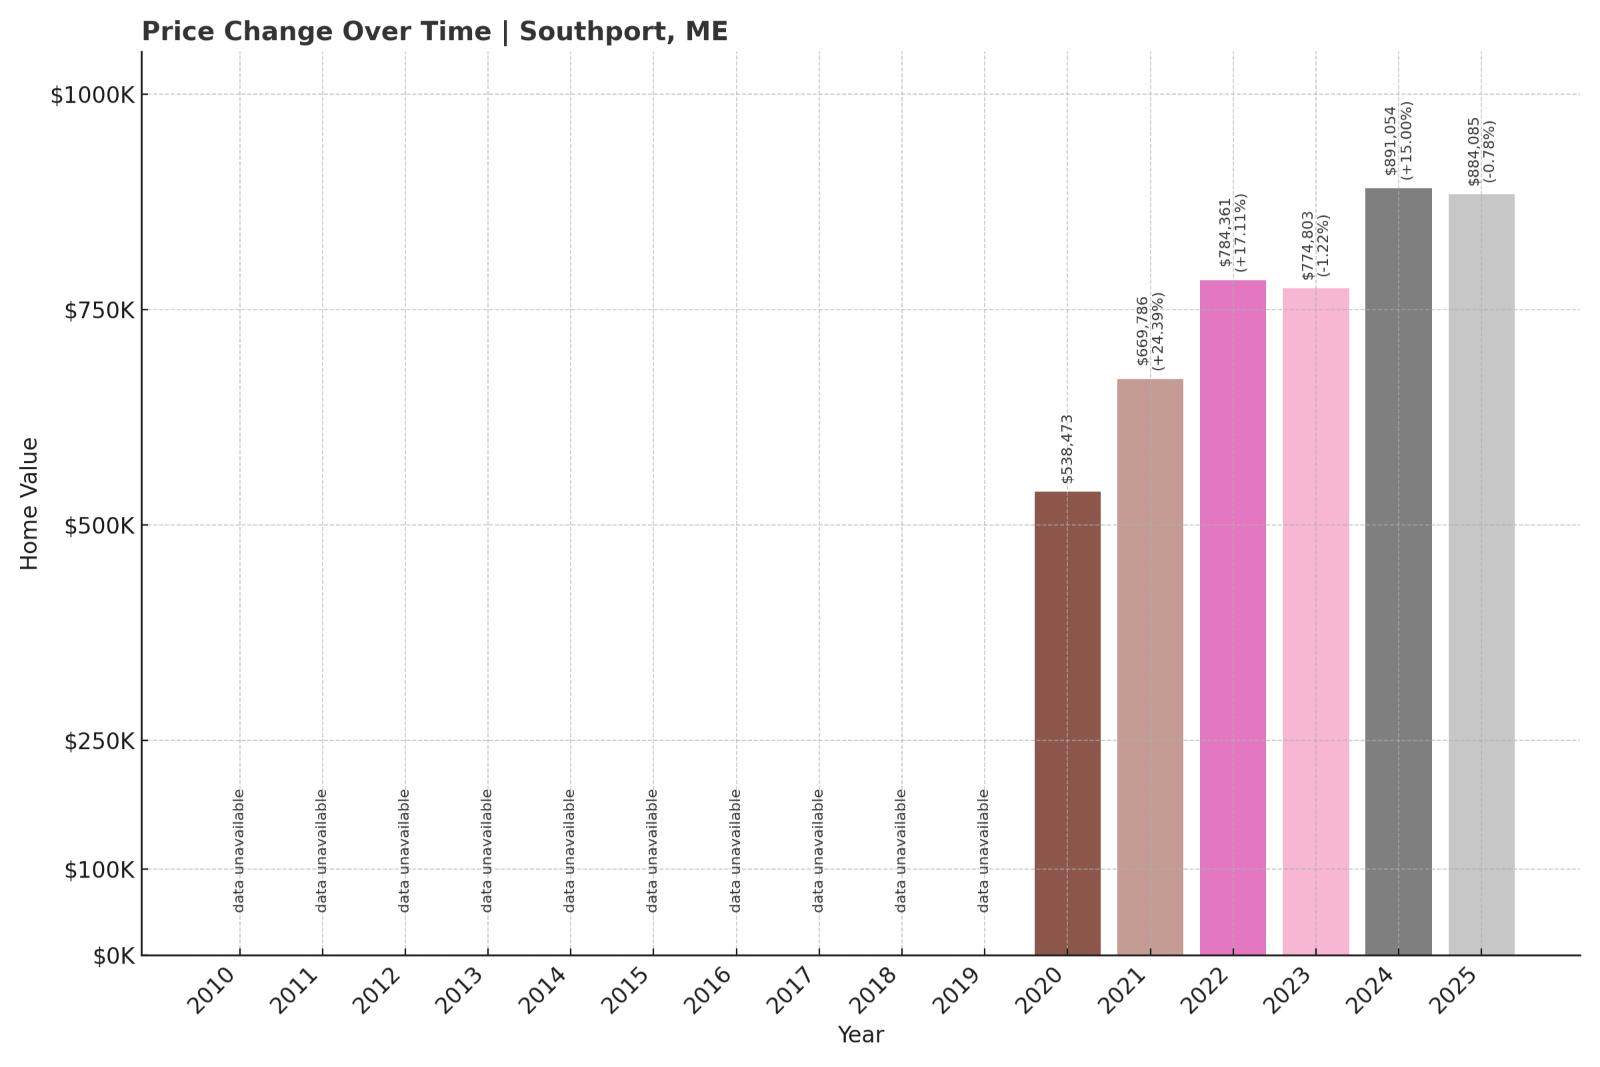
5. Southport – 64% Home Price Increase Since 2020
- 2010: N/A
- 2011: N/A
- 2012: N/A
- 2013: N/A
- 2014: N/A
- 2015: N/A
- 2016: N/A
- 2017: N/A
- 2018: N/A
- 2019: N/A
- 2020: $538,473
- 2021: $669,786 (+$131,313, +24.39% from previous year)
- 2022: $784,361 (+$114,576, +17.11% from previous year)
- 2023: $774,803 (-$9,559, -1.22% from previous year)
- 2024: $891,054 (+$116,251, +15.00% from previous year)
- 2025: $884,085 (-$6,968, -0.78% from previous year)
Since Zillow began tracking Southport in 2020, home values have increased by more than $345,000. After explosive growth between 2020 and 2022, prices briefly declined in 2023, bounced back sharply in 2024, and softened slightly again in 2025.
Southport – Exclusive Island Living

Southport is a small island town just south of Boothbay Harbor. It’s known for its summer population, rocky coastline, and scenic harbor views. With limited housing stock and high demand, prices here have jumped rapidly in a short time.
While its seasonal nature can lead to price swings, Southport’s unique setting and wealthier clientele have kept it near the top of Maine’s most expensive towns.
4. Falmouth – 137% Home Price Increase Since 2012

- 2010: $392,054
- 2011: $384,002 (-$8,052, -2.05% from previous year)
- 2012: $373,787 (-$10,215, -2.66% from previous year)
- 2013: $378,660 (+$4,873, +1.30% from previous year)
- 2014: $396,931 (+$18,271, +4.83% from previous year)
- 2015: $413,808 (+$16,877, +4.25% from previous year)
- 2016: $434,247 (+$20,439, +4.94% from previous year)
- 2017: $463,068 (+$28,820, +6.64% from previous year)
- 2018: $483,016 (+$19,948, +4.31% from previous year)
- 2019: $504,201 (+$21,185, +4.39% from previous year)
- 2020: $529,261 (+$25,060, +4.97% from previous year)
- 2021: $658,228 (+$128,967, +24.37% from previous year)
- 2022: $780,445 (+$122,217, +18.57% from previous year)
- 2023: $797,645 (+$17,200, +2.20% from previous year)
- 2024: $885,473 (+$87,828, +11.01% from previous year)
- 2025: $884,746 (-$727, -0.08% from previous year)
Falmouth home values have nearly doubled since 2012, rising from $373,787 to $884,746 in 2025. Prices accelerated sharply between 2020 and 2022 and have continued climbing, with only a minor dip in the most recent year.
Falmouth – Portland’s Prestigious Neighbor

Falmouth sits just north of Portland and is consistently ranked among Maine’s most desirable suburbs. It offers oceanfront homes, country clubs, yacht clubs, and a high-performing school district, making it especially attractive to affluent families.
Even with the slight price decline in 2025, the town’s long-term growth trend is strong. Falmouth’s reputation and proximity to the city help keep home values well above state averages.
3. Ogunquit – 165% Home Price Increase Since 2012
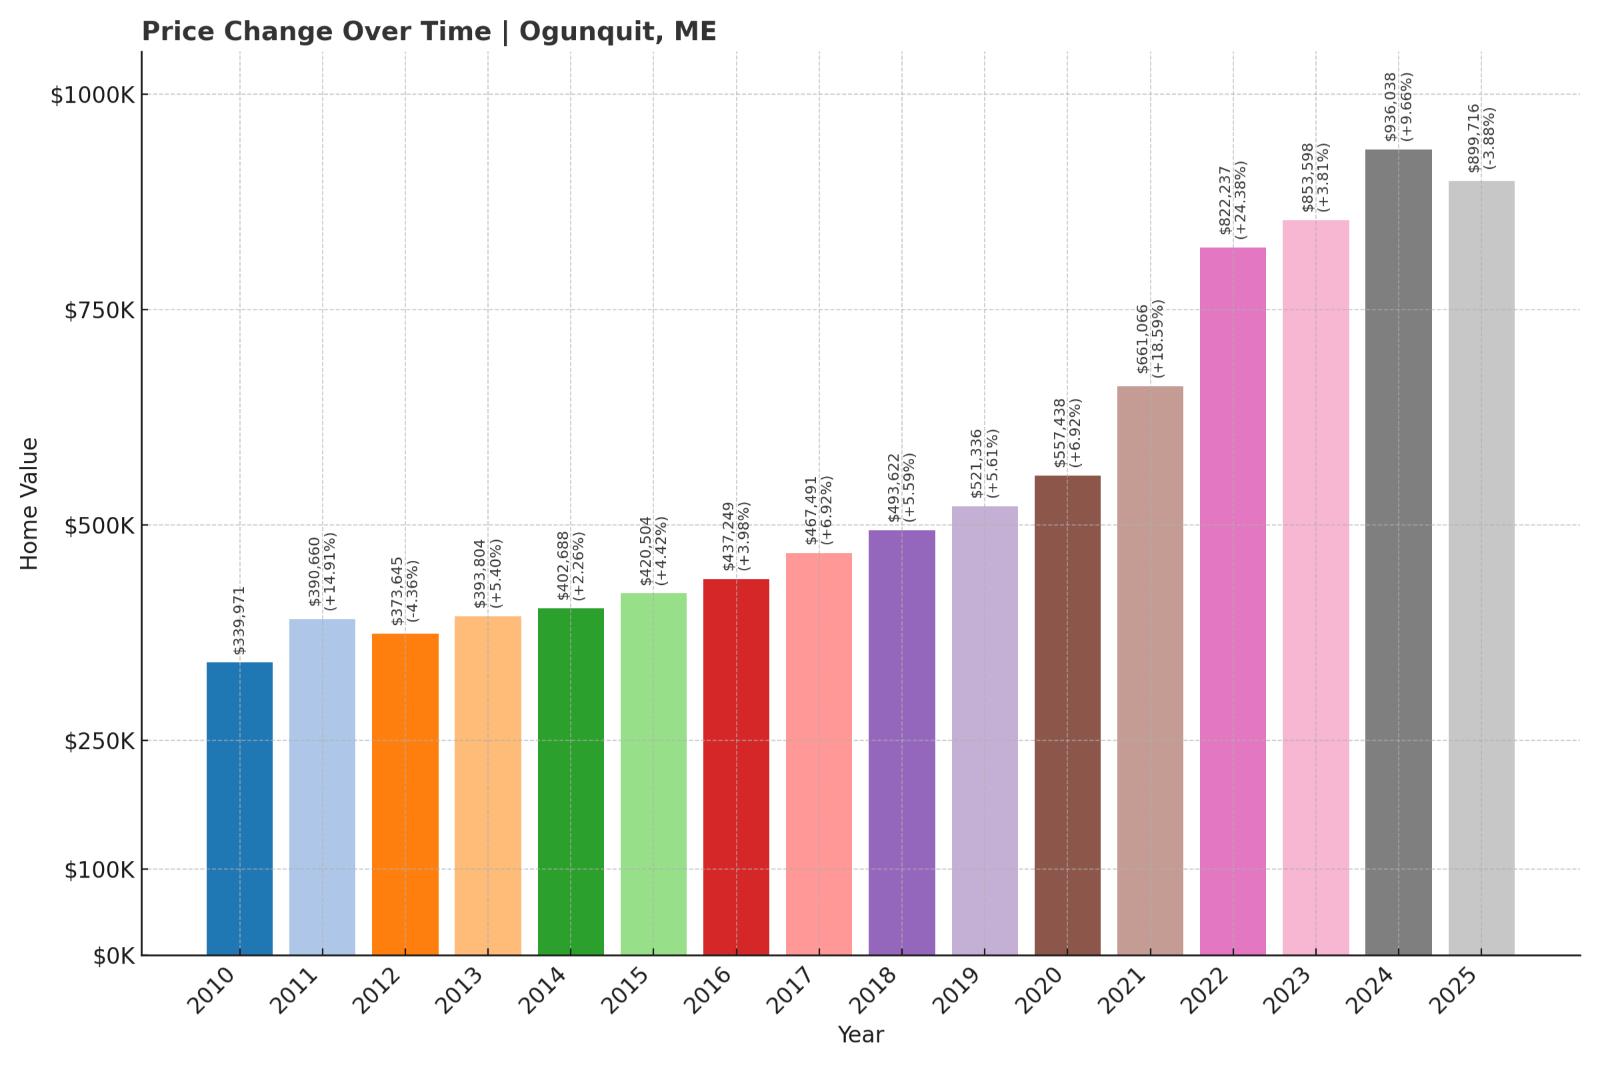
- 2010: $339,971
- 2011: $390,660 (+$50,689, +14.91% from previous year)
- 2012: $373,645 (-$17,015, -4.36% from previous year)
- 2013: $393,804 (+$20,159, +5.40% from previous year)
- 2014: $402,688 (+$8,884, +2.26% from previous year)
- 2015: $420,504 (+$17,815, +4.42% from previous year)
- 2016: $437,249 (+$16,745, +3.98% from previous year)
- 2017: $467,491 (+$30,242, +6.92% from previous year)
- 2018: $493,622 (+$26,131, +5.59% from previous year)
- 2019: $521,336 (+$27,715, +5.61% from previous year)
- 2020: $557,438 (+$36,102, +6.92% from previous year)
- 2021: $661,066 (+$103,628, +18.59% from previous year)
- 2022: $822,237 (+$161,171, +24.38% from previous year)
- 2023: $853,598 (+$31,362, +3.81% from previous year)
- 2024: $936,038 (+$82,439, +9.66% from previous year)
- 2025: $899,716 (-$36,321, -3.88% from previous year)
Ogunquit home prices have jumped from $373,645 in 2012 to $899,716 in 2025—a 165% increase. Although the most recent year saw a drop, the overall upward trend remains dramatic, especially following a massive rise between 2020 and 2022.
Ogunquit – Coastal Luxury and Vacation Appeal

Ogunquit is one of Maine’s best-known seaside towns, popular with vacationers and artists for its beaches, galleries, and walkable village center. Its limited inventory and high desirability have pushed home values sharply upward in the past decade.
Recent declines may reflect a correction after years of rapid appreciation, but the town’s charm and location all but guarantee continued long-term demand for property.
2. Mount Desert – 138% Home Price Increase Since 2012
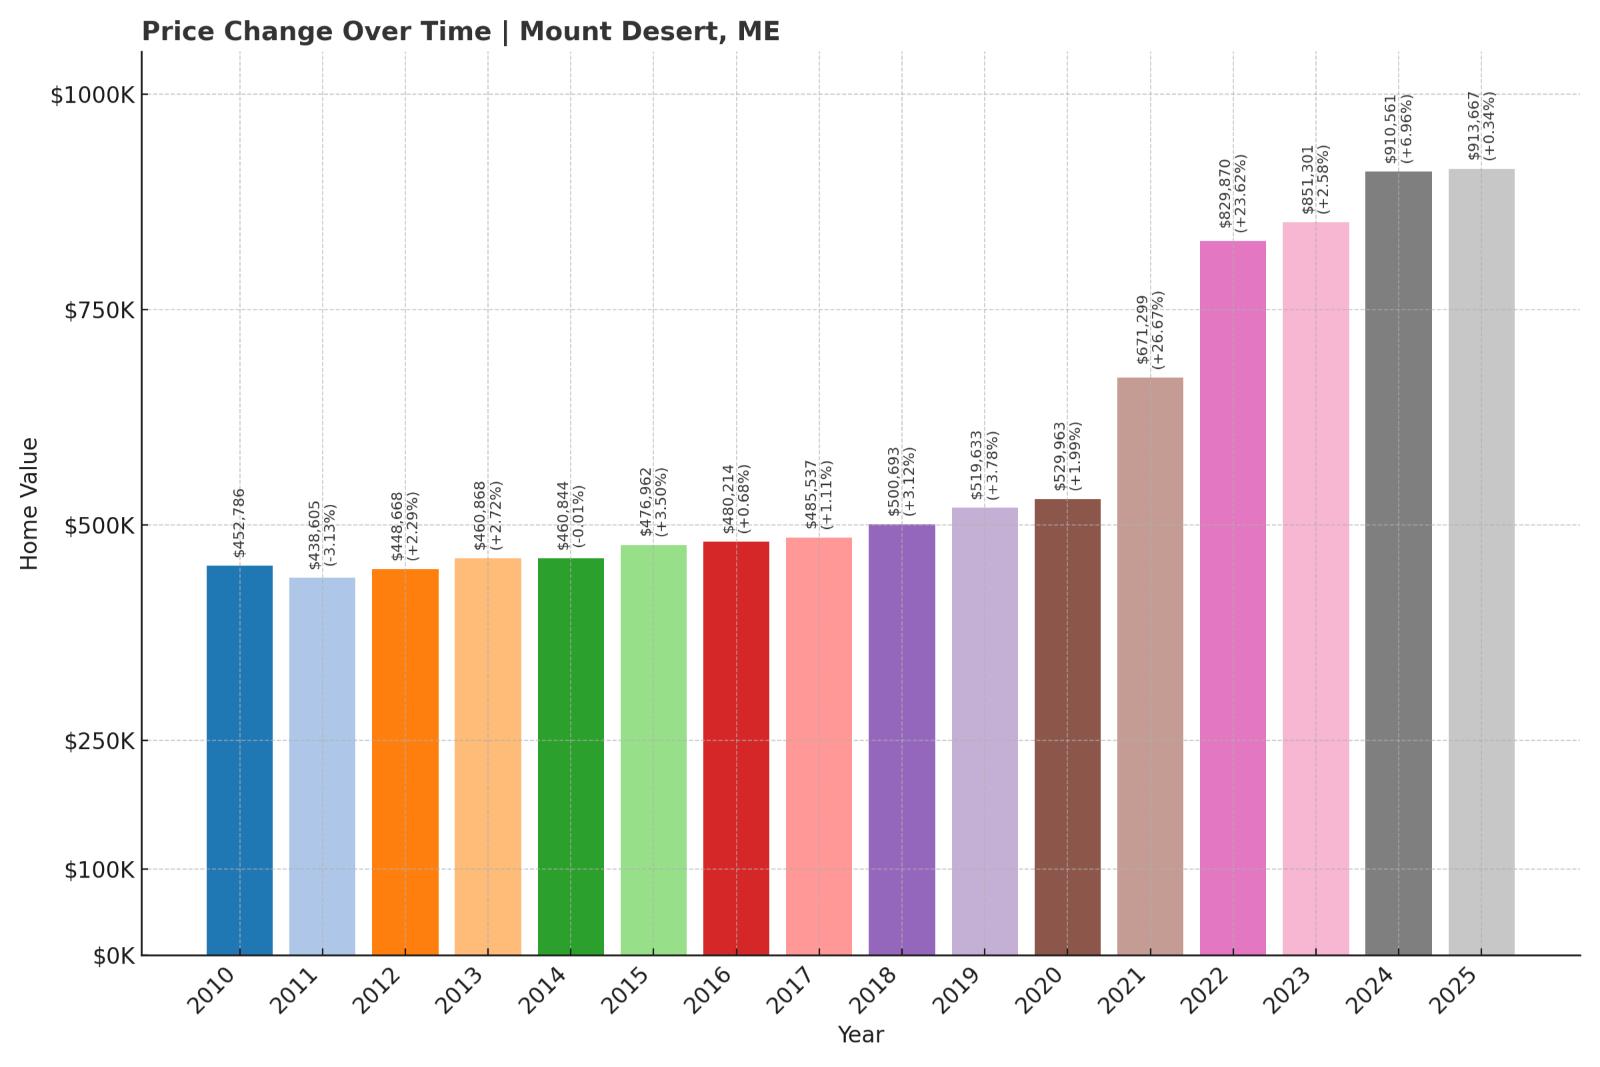
- 2010: $452,786
- 2011: $438,605 (-$14,181, -3.13% from previous year)
- 2012: $448,668 (+$10,063, +2.29% from previous year)
- 2013: $460,868 (+$12,200, +2.72% from previous year)
- 2014: $460,844 (-$23, -0.01% from previous year)
- 2015: $476,962 (+$16,117, +3.50% from previous year)
- 2016: $480,214 (+$3,253, +0.68% from previous year)
- 2017: $485,537 (+$5,323, +1.11% from previous year)
- 2018: $500,693 (+$15,156, +3.12% from previous year)
- 2019: $519,633 (+$18,941, +3.78% from previous year)
- 2020: $529,963 (+$10,329, +1.99% from previous year)
- 2021: $671,299 (+$141,336, +26.67% from previous year)
- 2022: $829,870 (+$158,572, +23.62% from previous year)
- 2023: $851,301 (+$21,431, +2.58% from previous year)
- 2024: $910,561 (+$59,260, +6.96% from previous year)
- 2025: $913,667 (+$3,106, +0.34% from previous year)
Mount Desert’s housing market has grown steadily since 2012, with home values increasing by more than $465,000. A huge portion of this growth occurred in just two years, 2021 and 2022, with triple-digit annual gains. Since then, the market has calmed but not reversed.
Mount Desert – Island Living With National Park Prestige

Home to parts of Acadia National Park and the affluent village of Northeast Harbor, Mount Desert offers natural splendor and exclusivity. It’s a favorite for wealthy seasonal residents and a consistent contender for Maine’s highest home values.
The market has stabilized in recent years, but demand remains strong. Its island setting and limited supply ensure that Mount Desert will remain one of the state’s most expensive towns for years to come.
1. Kennebunkport – 153% Home Price Increase Since 2012

- 2010: $458,261
- 2011: $418,626 (-$39,634, -8.65% from previous year)
- 2012: $428,633 (+$10,007, +2.39% from previous year)
- 2013: $435,363 (+$6,730, +1.57% from previous year)
- 2014: $458,856 (+$23,493, +5.40% from previous year)
- 2015: $476,993 (+$18,137, +3.95% from previous year)
- 2016: $512,460 (+$35,467, +7.44% from previous year)
- 2017: $544,219 (+$31,759, +6.20% from previous year)
- 2018: $579,403 (+$35,184, +6.47% from previous year)
- 2019: $616,720 (+$37,318, +6.44% from previous year)
- 2020: $641,343 (+$24,622, +3.99% from previous year)
- 2021: $805,528 (+$164,185, +25.60% from previous year)
- 2022: $1,005,448 (+$199,920, +24.82% from previous year)
- 2023: $1,010,940 (+$5,492, +0.55% from previous year)
- 2024: $1,095,507 (+$84,567, +8.37% from previous year)
- 2025: $1,082,886 (-$12,620, -1.15% from previous year)
Kennebunkport tops the list with home values more than doubling since 2012. The town crossed the $1 million mark in 2022 and has hovered there since. Although 2025 saw a small price dip, it remains the most expensive town in Maine.
Kennebunkport – Luxury on the Southern Coast

Famous as a presidential summer retreat and upscale seaside destination, Kennebunkport has long attracted wealthy second-home buyers. Its combination of sandy beaches, resort amenities, and historic charm keeps demand high and inventory tight.
While price growth has slowed, the town’s status as a luxury destination ensures its home values stay well above the state average. Even with a modest decline in 2025, Kennebunkport’s real estate market remains one of the most elite in New England.