🔥 Would you like to save this?
I’ve analyzed the latest Zillow Home Value Index data to identify Connecticut’s most impressive real estate markets over the past decade. The numbers tell a fascinating story of transformation across the state’s urban centers and small towns alike.
What’s particularly striking is how some of Connecticut’s traditionally overlooked cities have delivered extraordinary returns. Previously industrial centers like Waterbury and Bridgeport now lead the state in appreciation, challenging old investment assumptions about where value can be found.
In order to come up with the very specific design ideas, we create most designs with the assistance of state-of-the-art AI interior design software. Also, assume links that take you off the site are affiliate links such as links to Amazon. this means we may earn a commission if you buy something.
Most remarkable is the fact that every town in our top 15 has doubled in value since 2016 – with growth ranging from 101% to an astonishing 173%. For context, this period encompasses both pre-pandemic stability and the dramatic post-2020 market surge.
15. East Hartford

Historic prices and percent change over time:
- % change from 2016 to 2025: 101.41%
- 2025: $288,683
- 2024: $270,091
- 2023: $235,467
- 2022: $217,729
- 2021: $195,660
- 2020: $169,025
- 2019: $161,845
- 2018: $158,016
- 2017: $151,119
- 2016: $143,331
About East Hartford

Your investment in East Hartford would have doubled since 2016, outpacing many traditional financial vehicles. With median prices now approaching $290,000, the town offers increasingly attractive equity-building potential while remaining relatively accessible compared to surrounding markets. Long-term investors should note the acceleration in growth particularly post-2020, suggesting structural market shifts rather than cyclical appreciation.
14. Winchester

Historic prices and percent change over time:
- % change from 2016 to 2025: 101.9%
- 2025: $378,423
- 2024: $361,623
- 2023: $317,028
- 2022: $293,903
- 2021: $258,611
- 2020: $210,453
- 2019: $206,160
- 2018: $202,882
- 2017: $192,266
- 2016: $187,433
About Winchester
Winchester’s property values have demonstrated exceptional resilience, delivering 101.9% appreciation to reach a median of $378,423. Your capital would have performed remarkably well here, with consistent year-over-year growth suggesting fundamental market strength rather than speculation. The town’s value trajectory reflects its increasing desirability among buyers seeking both lifestyle amenities and investment security in northwestern Connecticut.
13. Plainfield

Historic prices and percent change over time:
- % change from 2016 to 2025: 102.74%
- 2025: $326,373
- 2024: $308,230
- 2023: $270,064
- 2022: $257,740
- 2021: $231,174
- 2020: $199,171
- 2019: $188,990
- 2018: $178,830
- 2017: $165,187
- 2016: $160,979
About Plainfield

Plainfield’s real estate has yielded exceptional returns, with values more than doubling to $326,373 since 2016. Your investment horizon here would show particular acceleration after 2020, when values began increasing by nearly $30,000 annually. The eastern Connecticut community continues demonstrating strong fundamentals with balanced supply-demand dynamics, making it an increasingly attractive alternative to higher-priced markets within commuting distance to major employers.
12. Killingly

Historic prices and percent change over time:
- % change from 2016 to 2025: 103.79%
- 2025: $343,796
- 2024: $311,664
- 2023: $286,072
- 2022: $275,959
- 2021: $248,308
- 2020: $217,241
- 2019: $199,008
- 2018: $192,734
- 2017: $176,018
- 2016: $168,700
About Killingly

Killingly’s housing market has delivered exceptional ROI with median values climbing to $343,796, representing a 103.79% increase in just nine years. Your capital appreciation here would have significantly outperformed traditional investment vehicles, with particularly robust growth post-2021. The northeastern Connecticut community demonstrates strong price support even during broader market corrections, suggesting underlying economic fundamentals rather than speculative investment drives demand.
11. Canaan

Historic prices and percent change over time:
- % change from 2016 to 2025: 104.16%
- 2025: $361,185
- 2024: $348,351
- 2023: $301,817
- 2022: $271,163
- 2021: $236,612
- 2020: $192,892
- 2019: $190,946
- 2018: $193,132
- 2017: $185,397
- 2016: $176,909
About Canaan

Canaan’s property market has generated extraordinary wealth appreciation with values exceeding $361,000 today, representing 104.16% growth from 2016 levels. Your investment would have particularly accelerated post-2020, with average annual gains approaching $40,000 during peak growth years. The northwestern Connecticut town offers significant value proposition to investors seeking both rental yield potential and equity growth in an increasingly supply-constrained regional market.
10. Voluntown

Historic prices and percent change over time:
- % change from 2016 to 2025: 104.7%
- 2025: $380,293
- 2024: $362,891
- 2023: $330,092
- 2022: $301,917
- 2021: $266,658
- 2020: $225,785
- 2019: $217,167
- 2018: $207,896
- 2017: $199,166
- 2016: $185,782
About Voluntown

Voluntown’s property values have demonstrated remarkable financial performance, appreciating 104.7% to reach $380,293 median value. Your capital deployment here would have significantly outperformed traditional investment vehicles while providing both utility and wealth creation. The town’s consistent price trajectory suggests sustainable fundamentals rather than speculative forces, with relatively stable growth patterns even during broader market fluctuations.
9. Norwich

🔥 Would you like to save this?
Historic prices and percent change over time:
- % change from 2016 to 2025: 104.86%
- 2025: $277,459
- 2024: $248,453
- 2023: $223,498
- 2022: $209,775
- 2021: $183,107
- 2020: $157,904
- 2019: $151,262
- 2018: $148,025
- 2017: $139,636
- 2016: $135,435
About Norwich

Norwich’s housing market has delivered exceptional investment returns, with values more than doubling to $277,459 despite starting from a relatively affordable base. Your capital would have particularly benefited from accelerated appreciation since 2021, with average annual gains exceeding $20,000 during this period. The eastern Connecticut city continues offering investors compelling value with strong price momentum and relative affordability compared to surrounding markets.
8. New London

Historic prices and percent change over time:
- % change from 2016 to 2025: 104.96%
- 2025: $303,679
- 2024: $265,981
- 2023: $235,676
- 2022: $223,569
- 2021: $199,819
- 2020: $172,621
- 2019: $162,983
- 2018: $161,033
- 2017: $152,298
- 2016: $148,162
About New London

New London’s real estate has generated substantial wealth for owners, with median values rising 104.96% to surpass $303,000. Your investment portfolio would have benefited from particularly strong performance between 2023-2025, when values jumped nearly $70,000. The coastal community shows increasingly favorable supply-demand dynamics as employment centers expand and housing inventory remains constrained relative to growing interest in coastal Connecticut markets.
7. Naugatuck

Historic prices and percent change over time:
- % change from 2016 to 2025: 106.35%
- 2025: $332,543
- 2024: $307,807
- 2023: $276,957
- 2022: $258,782
- 2021: $225,534
- 2020: $194,871
- 2019: $182,231
- 2018: $173,554
- 2017: $166,823
- 2016: $161,156
About Naugatuck

Naugatuck offers compelling investment metrics with property values more than doubling to $332,543 since 2016. Your capital here would have significantly outperformed many traditional financial instruments while providing both utility and wealth accumulation. The western Connecticut community shows particularly robust fundamentals post-2020, with average annual appreciation exceeding $30,000 during peak growth phases and continued momentum in recent quarters.
6. Putnam

Historic prices and percent change over time:
- % change from 2016 to 2025: 106.9%
- 2025: $335,068
- 2024: $306,641
- 2023: $274,882
- 2022: $262,928
- 2021: $238,162
- 2020: $199,891
- 2019: $186,767
- 2018: $182,310
- 2017: $168,912
- 2016: $161,944
About Putnam

Putnam’s housing market demonstrates exceptional financial performance with 106.9% appreciation driving median values to $335,068. Your investment here would have benefited from both consistent growth and notable acceleration post-pandemic, with particularly strong momentum between 2021-2025. The northeastern Connecticut town presents increasingly attractive fundamentals with value-to-income ratios still favorable compared to neighboring states despite significant price appreciation.
5. South Windham

Historic prices and percent change over time:
- % change from 2016 to 2025: 107.3%
- 2025: $269,983
- 2024: $240,418
- 2023: $219,232
- 2022: $208,261
- 2021: $187,269
- 2020: $161,908
- 2019: $150,978
- 2018: $147,830
- 2017: $132,377
- 2016: $130,235
About South Windham

South Windham’s real estate has delivered exceptional financial performance with values more than doubling to $269,983 from 2016 levels. Your investment portfolio would show particularly compelling returns during 2021-2025, when annual appreciation averaged approximately $20,000. The eastern Connecticut community continues demonstrating strong fundamentals with buyer demand consistently outpacing available inventory, creating sustained price support despite broader economic fluctuations.
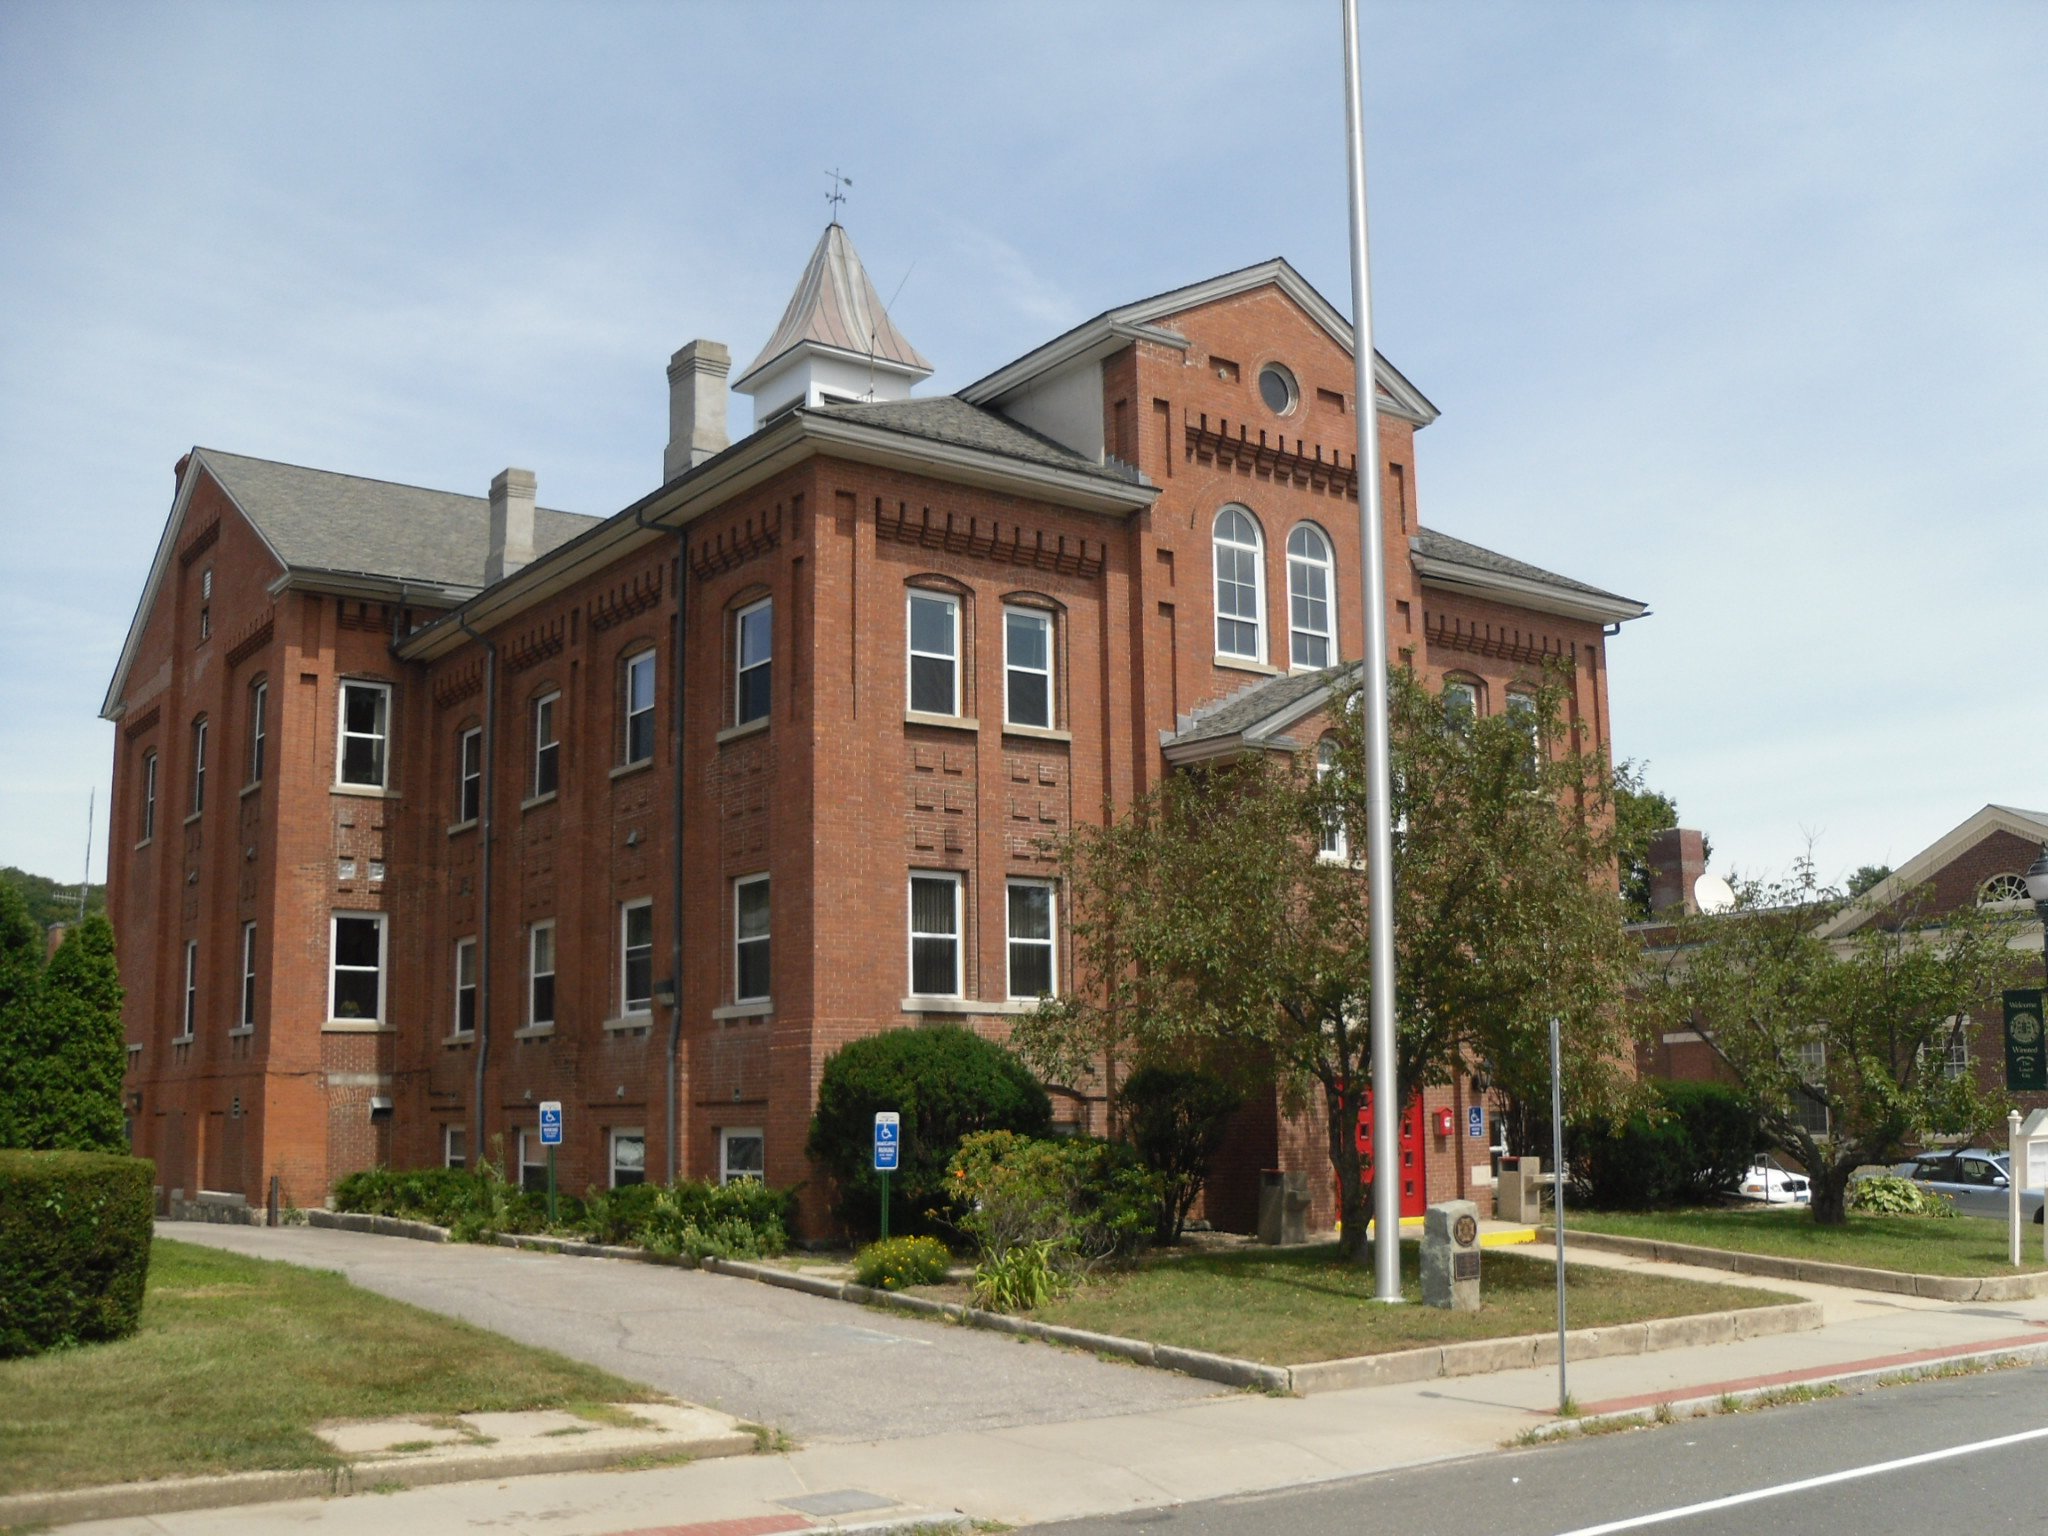
4. Winsted

Historic prices and percent change over time:
- % change from 2016 to 2025: 107.38%
- 2025: $267,596
- 2024: $252,056
- 2023: $217,629
- 2022: $206,711
- 2021: $179,256
- 2020: $151,199
- 2019: $149,330
- 2018: $149,426
- 2017: $140,080
- 2016: $129,036
About Winsted

Winsted’s housing market has generated remarkable investment returns with appreciation exceeding 107% to reach median values of $267,596. Your capital here would have particularly accelerated since 2021, with annual average gains approaching $22,000 during this period. The northwestern Connecticut community demonstrates increasingly favorable supply-demand dynamics with constrained inventory meeting growing buyer interest from both local residents and out-of-market investors.
3. Torrington

🔥 Would you like to save this?

Historic prices and percent change over time:
- % change from 2016 to 2025: 109.35%
- 2025: $274,819
- 2024: $257,460
- 2023: $222,083
- 2022: $201,785
- 2021: $171,791
- 2020: $143,477
- 2019: $137,244
- 2018: $136,895
- 2017: $131,593
- 2016: $131,273
About Torrington

Torrington’s real estate has delivered exceptional wealth generation, with median values now exceeding $274,000 – representing 109.35% appreciation since 2016. Your investment would have particularly accelerated post-2020, with values increasing by over $130,000 during this five-year period alone. The northwestern Connecticut community demonstrates strong fundamentals with buyer demand consistently outpacing available inventory, suggesting continued price support despite broader economic headwinds.
2. Bridgeport

Historic prices and percent change over time:
- % change from 2016 to 2025: 140.96%
- 2025: $340,358
- 2024: $324,006
- 2023: $287,227
- 2022: $272,563
- 2021: $238,416
- 2020: $200,025
- 2019: $181,910
- 2018: $173,631
- 2017: $152,767
- 2016: $141,252
About Bridgeport

Bridgeport’s housing market has delivered extraordinary financial performance with values surging nearly 141% to $340,358. Your investment capital here would have significantly outperformed traditional markets while benefiting from accelerating appreciation post-2019. Connecticut’s largest city demonstrates increasingly favorable market dynamics with revitalization efforts attracting both residential and commercial investment, creating a virtuous cycle of appreciation despite historically lower entry points.
1. Waterbury

Historic prices and percent change over time:
- % change from 2016 to 2025: 173.67%
- 2025: $262,251
- 2024: $244,068
- 2023: $208,127
- 2022: $188,424
- 2021: $154,702
- 2020: $127,902
- 2019: $117,027
- 2018: $109,129
- 2017: $101,547
- 2016: $95,827
About Waterbury

Waterbury stands as Connecticut’s ultimate real estate growth story, with values skyrocketing 173.67% to $262,251 from sub-$100,000 levels in 2016. Your investment capital here would have nearly tripled during this period, with particularly explosive appreciation post-2020 averaging over $33,000 annually. The central Connecticut city demonstrates extraordinary momentum despite starting from an accessible price point, suggesting fundamental economic recalibration rather than speculative forces driving this sustained performance.