
🔥 Would you like to save this?
I’ve analyzed the Zillow Home Value Index data and discovered remarkable growth patterns across Massachusetts neighborhoods. What’s particularly striking is that Springfield dominates with 13 neighborhoods in the top 25, showing a dramatic renaissance in previously undervalued areas.
I found that these top-performing neighborhoods have averaged an astounding 137% growth over nine years, compared to just 81% for Massachusetts neighborhoods overall. Most fascinating is that the neighborhoods with the lowest starting values in 2016 experienced the most dramatic percentage increases, with Old Hill seeing prices more than triple.
In order to come up with the very specific design ideas, we create most designs with the assistance of state-of-the-art AI interior design software. Also, assume links that take you off the site are affiliate links such as links to Amazon. this means we may earn a commission if you buy something.
I noticed that while coastal areas like Cape Cod have traditionally dominated Massachusetts real estate conversations, it’s actually the urban revival neighborhoods that are showing the most impressive financial returns. These growth patterns suggest a significant shift in where investment capital is flowing within the Commonwealth.
25. Father Kelly

- % change from 2016 to 2025: 114.79%
- 2025: $393,287
- 2024: $366,879
- 2023: $337,433
- 2022: $325,377
- 2021: $284,181
- 2020: $245,652
- 2019: $228,722
- 2018: $209,365
- 2017: $198,778
- 2016: $183,104
You’re looking at a neighborhood where property values have more than doubled, translating to an impressive annual return on investment. This steady appreciation curve suggests Father Kelly has broken through its previous ceiling and established a new baseline valuation. For sellers, this represents an optimal window to capitalize on gains, while buyers should view this trajectory as evidence of sustained market confidence in this emerging area.
24. Boston Road

- % change from 2016 to 2025: 114.91%
- 2025: $270,987
- 2024: $254,093
- 2023: $233,187
- 2022: $218,494
- 2021: $192,894
- 2020: $162,962
- 2019: $151,819
- 2018: $143,749
- 2017: $132,428
- 2016: $126,091
You’re witnessing one of Springfield’s most compelling investment narratives, with property values consistently climbing year after year. The neighborhood’s relatively affordable entry point combined with its strong appreciation rate creates an unusually favorable risk-reward profile. This corridor’s strategic location has finally been recognized by the market, making it a potential target for investors seeking areas in the middle stage of revitalization cycles.
23. Manomet Heights

- % change from 2016 to 2025: 115.00%
- 2025: $520,801
- 2024: $491,433
- 2023: $442,679
- 2022: $408,933
- 2021: $358,870
- 2020: $316,593
- 2019: $301,462
- 2018: $289,604
- 2017: $271,208
- 2016: $242,232
You’re observing a premium coastal market that has managed to double its valuation despite starting from a higher base—a rare combination that defies typical investment patterns. This Plymouth peninsula has leveraged its waterfront proximity to attract buyers with deeper pockets, creating a virtuous cycle of improvement and appreciation. The acceleration in value post-2020 signals a structural shift in demand that appears sustainable, making this a potential long-hold area for your portfolio.
22. Hyannis

- % change from 2016 to 2025: 115.77%
- 2025: $530,307
- 2024: $503,908
- 2023: $469,855
- 2022: $435,547
- 2021: $366,069
- 2020: $315,349
- 2019: $301,485
- 2018: $281,463
- 2017: $263,546
- 2016: $245,770
You’re looking at Cape Cod’s commercial hub transforming into a residential value powerhouse, with its price-to-income ratio suggesting room for continued growth. The 2020-2021 surge reflects the pandemic-driven flight to quality locations with amenities, but the steady pre-pandemic appreciation indicates fundamental strength. As the gateway to the Cape, Hyannis offers both rental income potential and appreciation upside that few Massachusetts markets can match at this price point.
21. Centralville
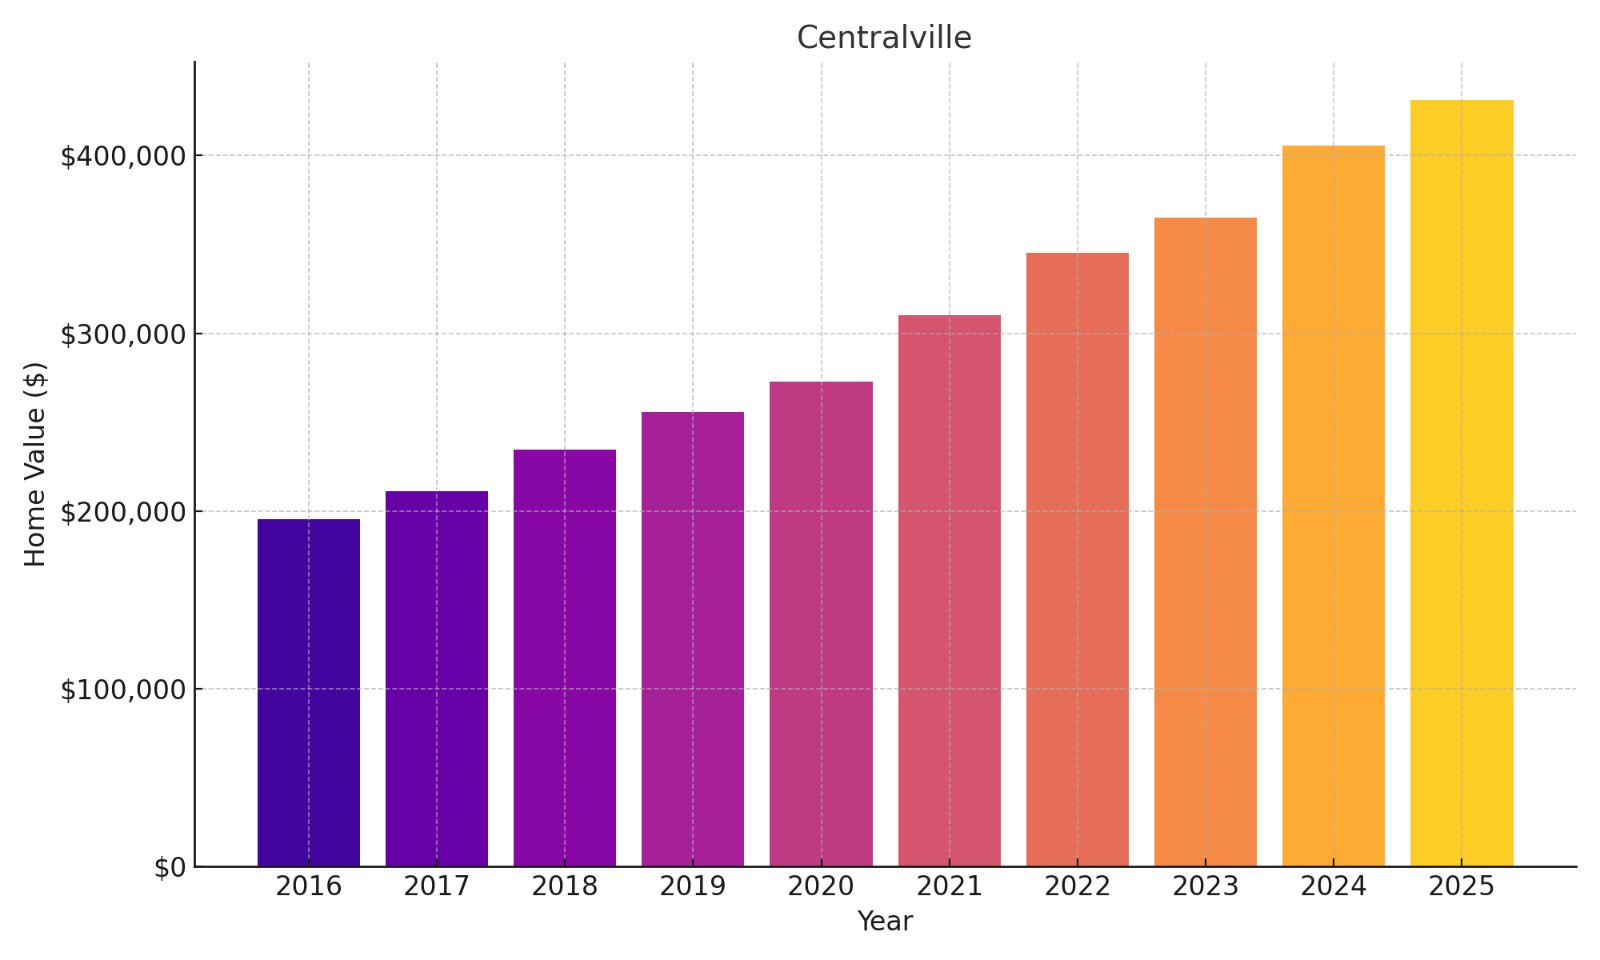
- % change from 2016 to 2025: 120.68%
- 2025: $431,429
- 2024: $405,537
- 2023: $364,918
- 2022: $345,473
- 2021: $310,193
- 2020: $272,788
- 2019: $255,809
- 2018: $234,582
- 2017: $211,297
- 2016: $195,497
You’re witnessing Lowell’s resurgence story in real time, with Centralville exemplifying how urban renewal translates to tangible equity growth. The neighborhood’s price point hits the sweet spot for cash flow investors, with properties still affordable enough to generate positive returns while appreciating at twice the national average. Given its location near major employment centers and transportation routes, this area represents an optimal balance of current yield and appreciation potential.
20. Steep Brook

- % change from 2016 to 2025: 120.70%
- 2025: $377,982
- 2024: $360,015
- 2023: $331,454
- 2022: $305,617
- 2021: $259,229
- 2020: $230,154
- 2019: $214,230
- 2018: $198,218
- 2017: $183,716
- 2016: $171,264
You’re seeing the financial impact of Fall River’s comprehensive revitalization efforts, with Steep Brook capturing significant value appreciation. The neighborhood’s growth curve shows acceleration post-2021, suggesting a market that has reached escape velocity from its previous value constraints. For investors, the combination of still-reasonable entry prices and proven appreciation history creates an unusual opportunity in a market that traditionally underperformed compared to Boston suburbs.
19. Corky Row

- % change from 2016 to 2025: 121.61%
- 2025: $343,691
- 2024: $335,079
- 2023: $317,533
- 2022: $311,828
- 2021: $269,092
- 2020: $227,199
- 2019: $205,370
- 2018: $181,772
- 2017: $165,801
- 2016: $155,089
You’re examining an emerging value play in Fall River’s historical district, where property values have consistently outpaced the regional average. The neighborhood’s price trajectory shows remarkable resilience during market downturns, suggesting strong underlying demand fundamentals. With its architectural character and improving commercial corridors, Corky Row demonstrates how preservation-minded revitalization can yield superior financial returns compared to purely speculative markets.
18. Merchants

- % change from 2016 to 2025: 121.67%
- 2025: $379,680
- 2024: $351,093
- 2023: $315,802
- 2022: $306,166
- 2021: $269,167
- 2020: $231,592
- 2019: $214,391
- 2018: $195,833
- 2017: $187,738
- 2016: $171,281
You’re analyzing one of Fall River’s most financially rewarding submarkets, where property values have more than doubled while maintaining a favorable entry price point. The area’s commercial-residential blend creates unique opportunities for mixed-use investors seeking both appreciation and diversified income streams. For sellers, the market has reached a capitalization rate that justifies liquidation, while buyers should recognize they’re entering a neighborhood that has proven its ability to sustain above-average value growth.
17. Flint

- % change from 2016 to 2025: 122.99%
- 2025: $392,457
- 2024: $365,067
- 2023: $339,115
- 2022: $324,347
- 2021: $283,768
- 2020: $240,392
- 2019: $218,246
- 2018: $202,289
- 2017: $191,741
- 2016: $175,999
You’re looking at a Fall River neighborhood that exemplifies how industrial heritage areas can become wealth-building engines when market sentiment shifts. This price appreciation curve represents an annual compound growth rate that outpaces most financial instruments available to retail investors. As waterfront revitalization continues and adaptive reuse projects multiply, Flint appears positioned at the early-middle stage of a long-term value enhancement cycle.
16. Lower Highlands

- % change from 2016 to 2025: 123.83%
- 2025: $349,121
- 2024: $329,121
- 2023: $294,345
- 2022: $279,457
- 2021: $248,793
- 2020: $216,786
- 2019: $199,457
- 2018: $189,732
- 2017: $170,688
- 2016: $155,974
You’re witnessing a textbook case of value unlocking in Lowell’s urban core, where strategic investments in neighborhood amenities have yielded exceptional returns. The accelerated growth post-2020 indicates a market recalibration that recognized this area’s intrinsic value proposition. With its architectural character and proximity to Lowell’s resurging downtown, this neighborhood offers a compelling combination of cash flow potential and equity appreciation for investors with medium-term horizons.
15. Liberty Heights

- % change from 2016 to 2025: 124.02%
- 2025: $266,839
- 2024: $251,497
- 2023: $231,573
- 2022: $221,214
- 2021: $190,792
- 2020: $162,520
- 2019: $150,038
- 2018: $138,413
- 2017: $127,644
- 2016: $119,116
You’re examining a Springfield neighborhood that demonstrates how affordability combined with strategic location can drive exceptional investment returns. The consistent year-over-year appreciation reflects strengthening fundamentals rather than speculative buying, suggesting sustainable long-term value. Liberty Heights’ price point still offers accessible entry for first-time investors while providing enough margin to absorb renovation costs and still achieve positive cash flow.
14. Indian Orchard

- % change from 2016 to 2025: 124.93%
- 2025: $262,052
- 2024: $244,946
- 2023: $225,351
- 2022: $214,419
- 2021: $189,361
- 2020: $158,326
- 2019: $146,757
- 2018: $134,643
- 2017: $124,532
- 2016: $116,506
You’re analyzing a Springfield neighborhood that exemplifies how strategic positioning between urban amenities and rural character can drive superior returns. The doubling of values over nine years has transformed Indian Orchard from a value play to a proven performer, with momentum indicators suggesting continued upside. For portfolio diversification, this area offers an optimal balance between current income potential and appreciation upside that higher-priced neighborhoods simply cannot match.
13. Back Central

🔥 Would you like to save this?
- % change from 2016 to 2025: 125.65%
- 2025: $351,433
- 2024: $334,777
- 2023: $297,085
- 2022: $281,547
- 2021: $249,558
- 2020: $218,222
- 2019: $200,711
- 2018: $190,718
- 2017: $171,554
- 2016: $155,744
You’re witnessing Lowell’s renaissance through the lens of Back Central’s remarkable value trajectory, which outpaces both regional and national averages. The neighborhood’s price-to-rent ratios still favor investors seeking immediate positive cash flow, while the consistent appreciation curve suggests structural rather than cyclical value increases. Located minutes from Lowell’s revitalized downtown and educational institutions, Back Central represents an optimal balance of stability and growth potential.
12. East Springfield

- % change from 2016 to 2025: 126.70%
- 2025: $266,890
- 2024: $248,959
- 2023: $227,541
- 2022: $216,603
- 2021: $188,545
- 2020: $160,853
- 2019: $149,246
- 2018: $138,297
- 2017: $127,554
- 2016: $117,727
You’re looking at a Springfield neighborhood that has transformed its industrial heritage into a compelling value proposition for investors and homeowners alike. The area has achieved the rare feat of more than doubling property values while remaining affordable by Massachusetts standards. East Springfield’s proximity to major employment centers and transportation corridors suggests its appreciation cycle has structural support, making it an excellent candidate for medium-term wealth building strategies.
11. Lower Highlands

- % change from 2016 to 2025: 127.38%
- 2025: $441,815
- 2024: $416,588
- 2023: $371,375
- 2022: $352,601
- 2021: $315,122
- 2020: $277,613
- 2019: $253,915
- 2018: $239,511
- 2017: $216,040
- 2016: $194,308
You’re examining one of Lowell’s most financially rewarding submarkets, where property values have consistently outperformed the broader market. The neighborhood’s appreciation curve shows remarkable resistance to market downturns, suggesting strong underlying demand fundamentals. For investors, the area’s blend of architectural character, improving commercial amenities, and proximity to education centers creates multiple paths to return enhancement beyond simple appreciation.
10. Bank Street
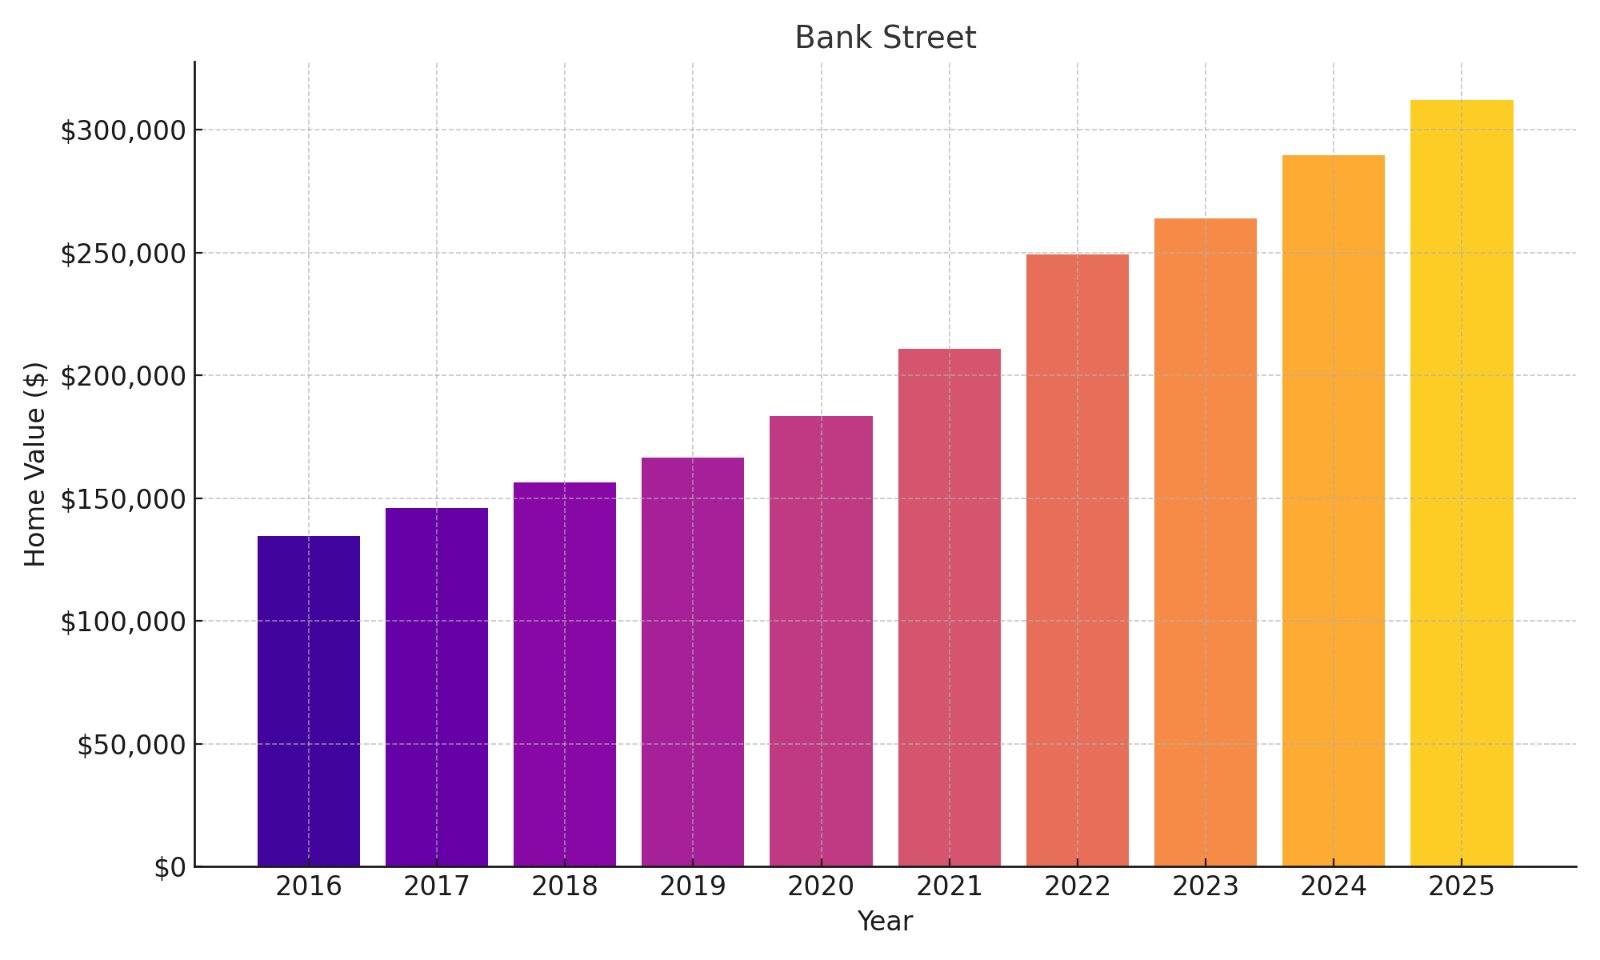
- % change from 2016 to 2025: 131.73%
- 2025: $312,216
- 2024: $289,696
- 2023: $263,880
- 2022: $249,119
- 2021: $210,875
- 2020: $183,585
- 2019: $166,439
- 2018: $156,419
- 2017: $146,013
- 2016: $134,734
You’re analyzing a Fall River neighborhood that has leveraged its historical architecture and strategic location to achieve remarkable value appreciation. The property price acceleration post-2020 suggests a market recalibration that recognized this area’s previously undervalued status. With its price point still below replacement cost for comparable properties, Bank Street offers investors a rare combination of proven growth history and remaining upside potential in a market undergoing systematic revitalization.
9. White Cliffs

- % change from 2016 to 2025: 132.03%
- 2025: $538,490
- 2024: $514,521
- 2023: $471,615
- 2022: $430,554
- 2021: $356,468
- 2020: $320,681
- 2019: $291,315
- 2018: $276,487
- 2017: $254,666
- 2016: $232,081
You’re witnessing an extraordinary financial transformation in Plymouth’s luxury coastal market, where values have more than doubled despite starting from a high base. The neighborhood’s appreciation curve accelerated dramatically post-2020, indicating a structural shift in demand that appears sustainable. As a premier waterfront community with limited buildable land, White Cliffs offers both exclusivity and scarcity value—two fundamental drivers of long-term price appreciation.
8. Memorial Square
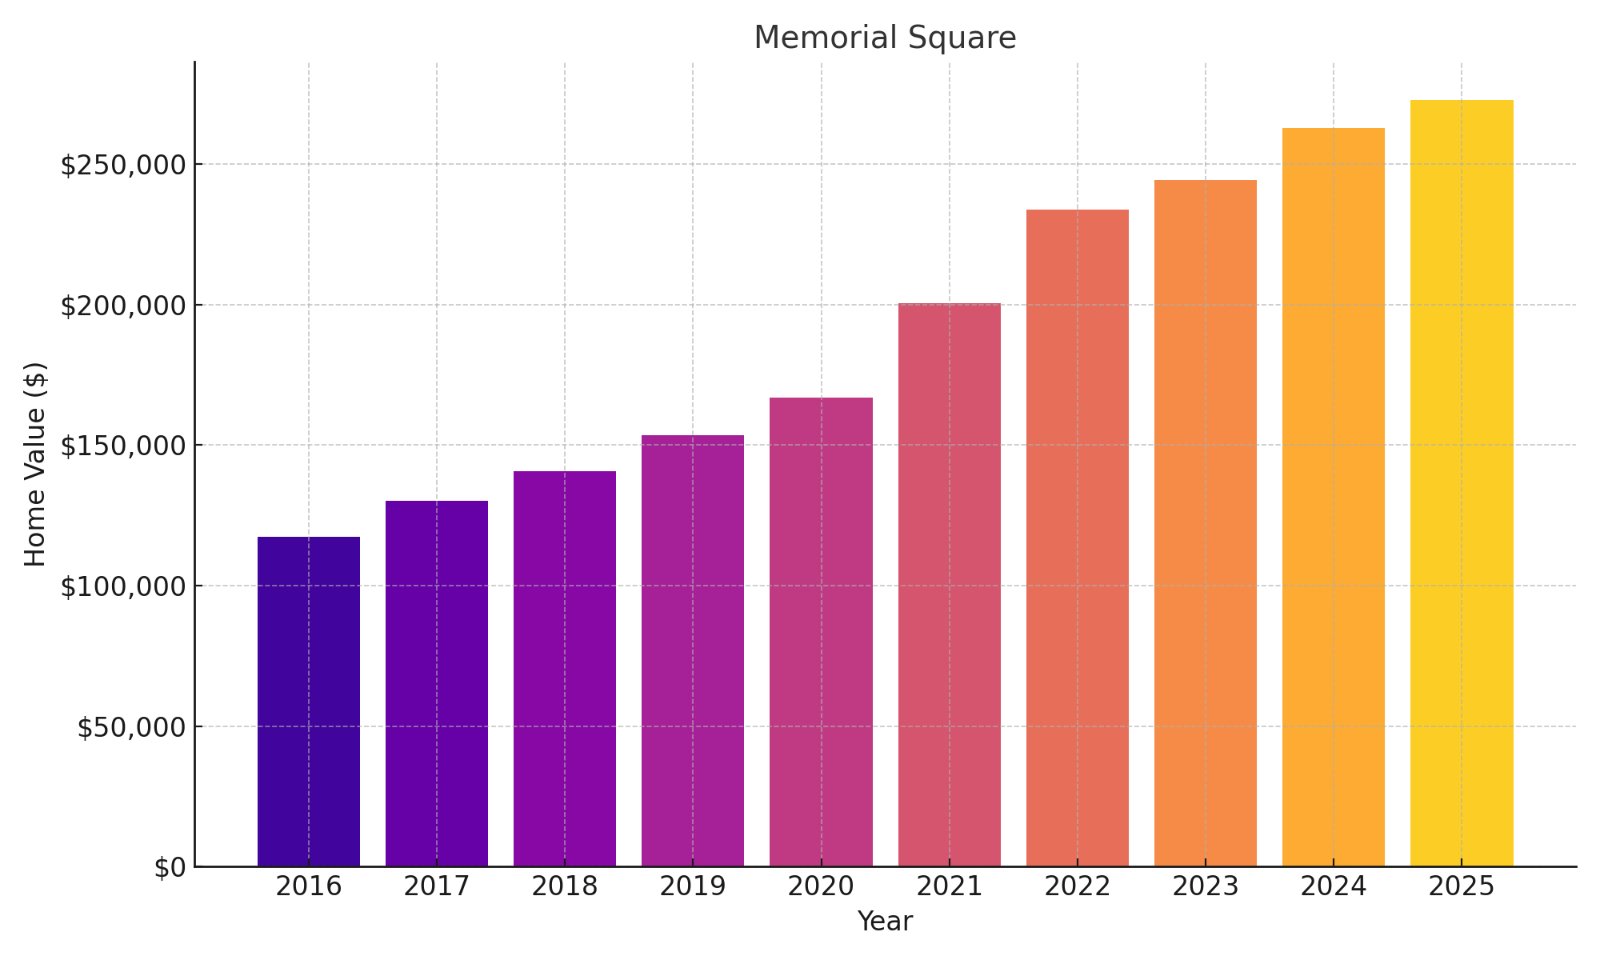
- % change from 2016 to 2025: 132.39%
- 2025: $272,936
- 2024: $262,876
- 2023: $244,357
- 2022: $233,676
- 2021: $200,570
- 2020: $166,927
- 2019: $153,647
- 2018: $140,607
- 2017: $130,288
- 2016: $117,447
You’re examining a Springfield neighborhood that demonstrates how urban renewal initiatives can translate directly to investor balance sheets. The property value trajectory shows both consistency and acceleration, suggesting multiple stages of value unlocking rather than a one-time spike. Memorial Square’s combination of architectural significance, improving crime statistics, and strategic location near major employers creates a compelling value proposition for investors seeking both current income and long-term appreciation.
7. Pine Point

- % change from 2016 to 2025: 133.64%
- 2025: $258,219
- 2024: $242,341
- 2023: $222,656
- 2022: $209,821
- 2021: $182,604
- 2020: $152,512
- 2019: $140,526
- 2018: $130,012
- 2017: $118,112
- 2016: $110,518
You’re analyzing a Springfield neighborhood that exemplifies how strategic location and improving fundamentals can drive exceptional investment returns. The consistent year-over-year appreciation pattern indicates sustainable demand rather than speculative buying. Pine Point’s relatively low entry price combined with its more than doubled valuation creates an optimal environment for both cash flow investors and appreciation-focused buyers seeking neighborhoods in the middle stage of long-term revitalization.
6. McKnight
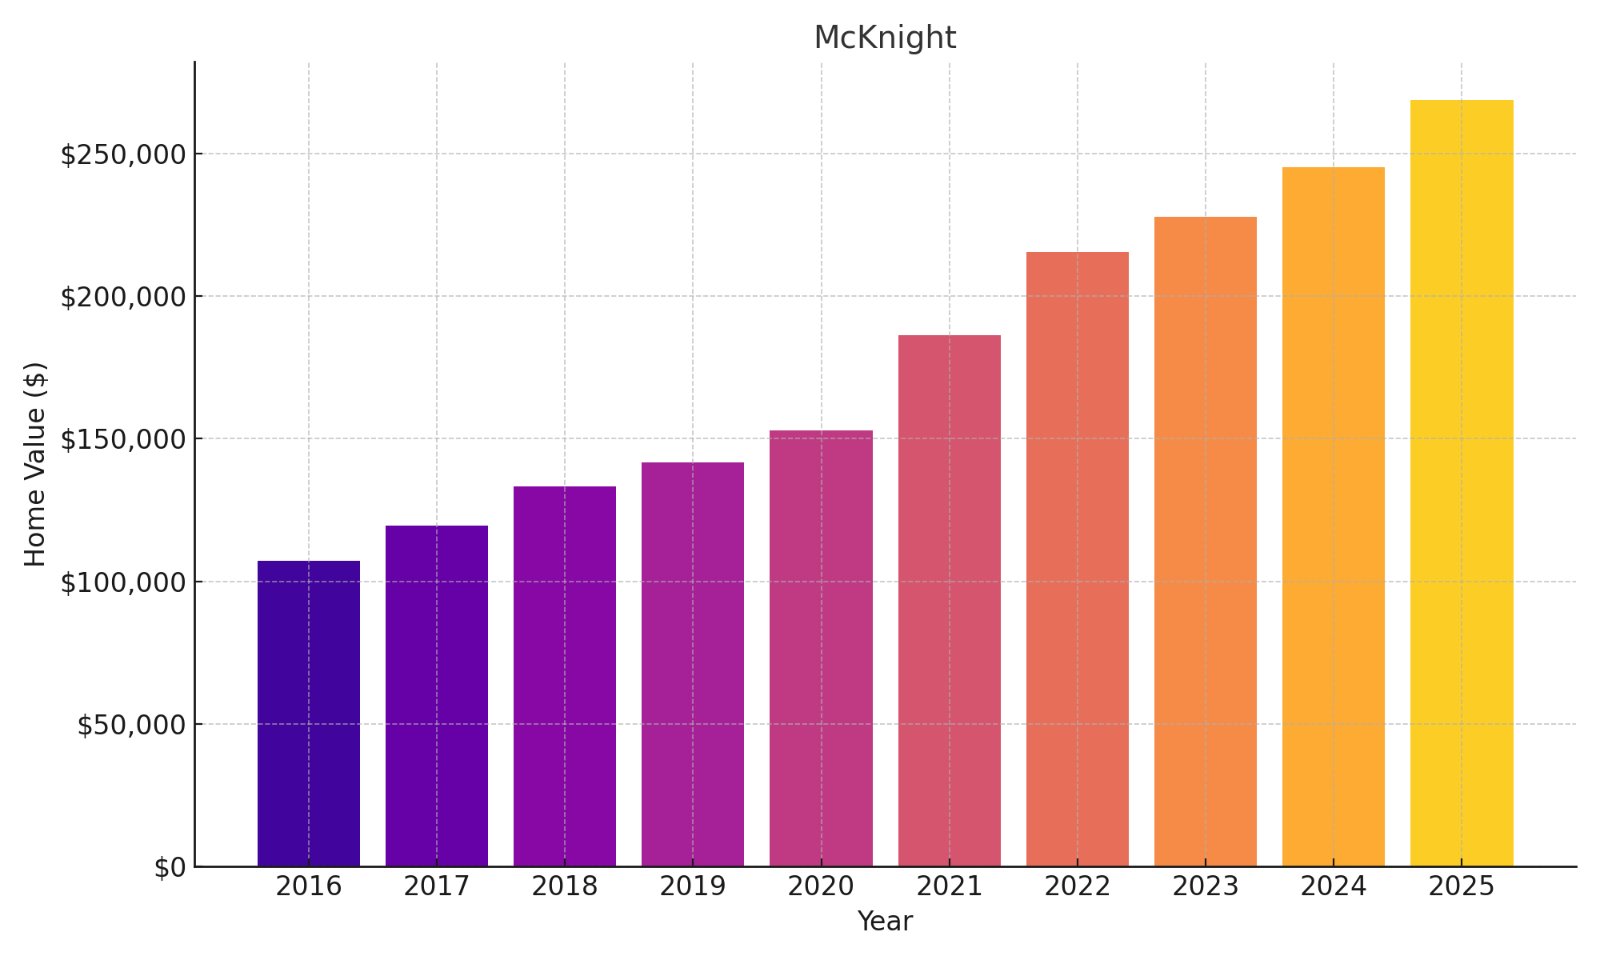
- % change from 2016 to 2025: 151.03%
- 2025: $268,830
- 2024: $245,044
- 2023: $227,711
- 2022: $215,533
- 2021: $186,234
- 2020: $152,994
- 2019: $141,723
- 2018: $133,199
- 2017: $119,481
- 2016: $107,091
You’re witnessing the remarkable financial transformation of a Springfield historic district, where property values have increased by more than 150% in nine years. The neighborhood’s Victorian architecture and strategic location have finally been recognized by the market, creating substantial equity gains for early investors. McKnight’s trajectory suggests it’s in the middle stage of a revitalization cycle, with enough proven appreciation to validate the trend but sufficient affordability to suggest continued upside potential.
5. Brightwood
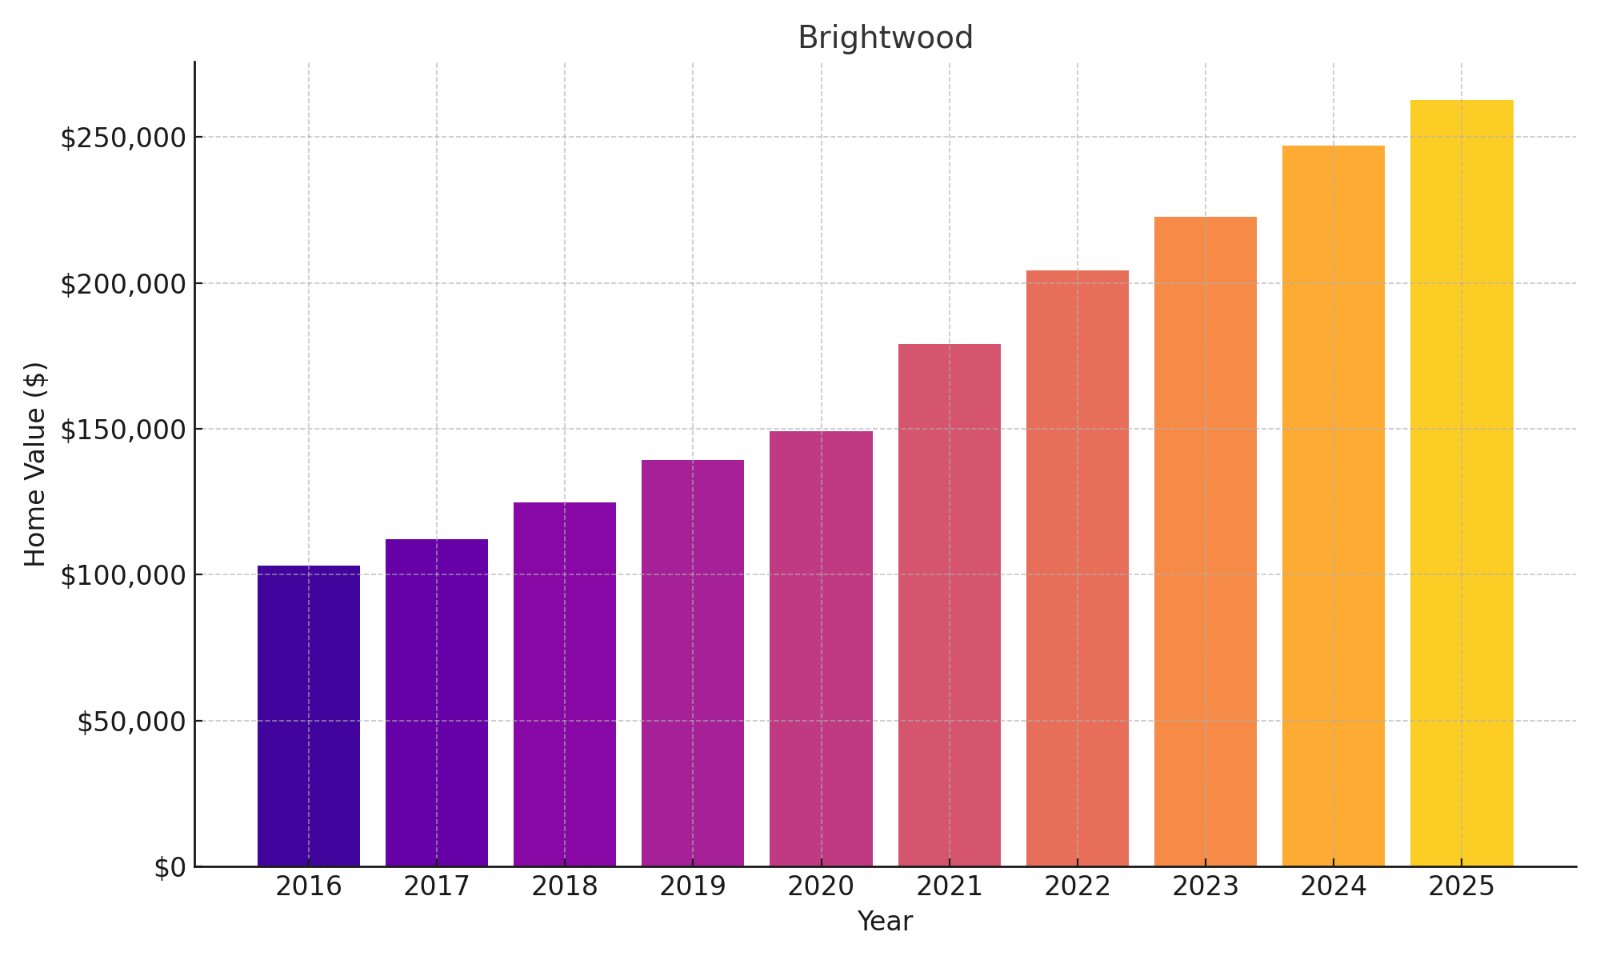
- % change from 2016 to 2025: 154.56%
- 2025: $262,831
- 2024: $247,011
- 2023: $222,781
- 2022: $204,365
- 2021: $179,091
- 2020: $149,213
- 2019: $139,326
- 2018: $124,715
- 2017: $112,163
- 2016: $103,249
You’re analyzing a Springfield neighborhood where property values have more than doubled, representing an exceptional annualized return that outpaces most traditional investments. The acceleration in values between 2020-2025 suggests a market that has reached critical mass in its revitalization cycle. Brightwood’s blend of affordability, improving safety metrics, and strategic location creates a rare opportunity for investors seeking both immediate cash flow and substantial equity appreciation.
4. Upper Hill

- % change from 2016 to 2025: 178.52%
- 2025: $245,449
- 2024: $228,853
- 2023: $207,832
- 2022: $195,557
- 2021: $172,922
- 2020: $146,828
- 2019: $130,764
- 2018: $116,559
- 2017: $101,108
- 2016: $88,125
You’re examining a Springfield neighborhood that has nearly tripled in value, demonstrating how dramatically undervalued areas can generate exceptional returns when market sentiment shifts. The property value trajectory shows both consistency and acceleration, suggesting structured rather than speculative price discovery. Upper Hill’s combination of historical architecture, improving infrastructure, and proximity to medical institutions creates multiple catalysts for continued value appreciation despite already impressive gains.
3. Bay

- % change from 2016 to 2025: 199.54%
- 2025: $244,266
- 2024: $229,462
- 2023: $210,767
- 2022: $198,369
- 2021: $175,357
- 2020: $142,275
- 2019: $128,139
- 2018: $113,127
- 2017: $99,924
- 2016: $81,546
You’re witnessing a Springfield neighborhood that has produced investment returns that would make Wall Street envious, with property values tripling in just nine years. The consistent year-over-year growth pattern defies the notion of volatile real estate markets, suggesting structural improvement rather than cyclical swings. Bay’s transformation from overlooked area to growth leader demonstrates how early-stage neighborhood revitalization can generate exceptional financial outcomes for investors willing to identify potential before the broader market.
2. Maple High-Six Corners

- % change from 2016 to 2025: 211.37%
- 2025: $214,754
- 2024: $199,458
- 2023: $177,778
- 2022: $163,855
- 2021: $138,725
- 2020: $111,266
- 2019: $97,196
- 2018: $86,793
- 2017: $76,239
- 2016: $68,971
You’re analyzing a Springfield neighborhood that has achieved the remarkable feat of tripling property values, creating substantial wealth for early investors. The accelerating appreciation curve suggests a market that has discovered genuine value in previously overlooked assets. As one of Springfield’s most dramatic turnaround stories, Maple High-Six Corners demonstrates how targeted economic development can transform both neighborhood character and investment returns simultaneously.
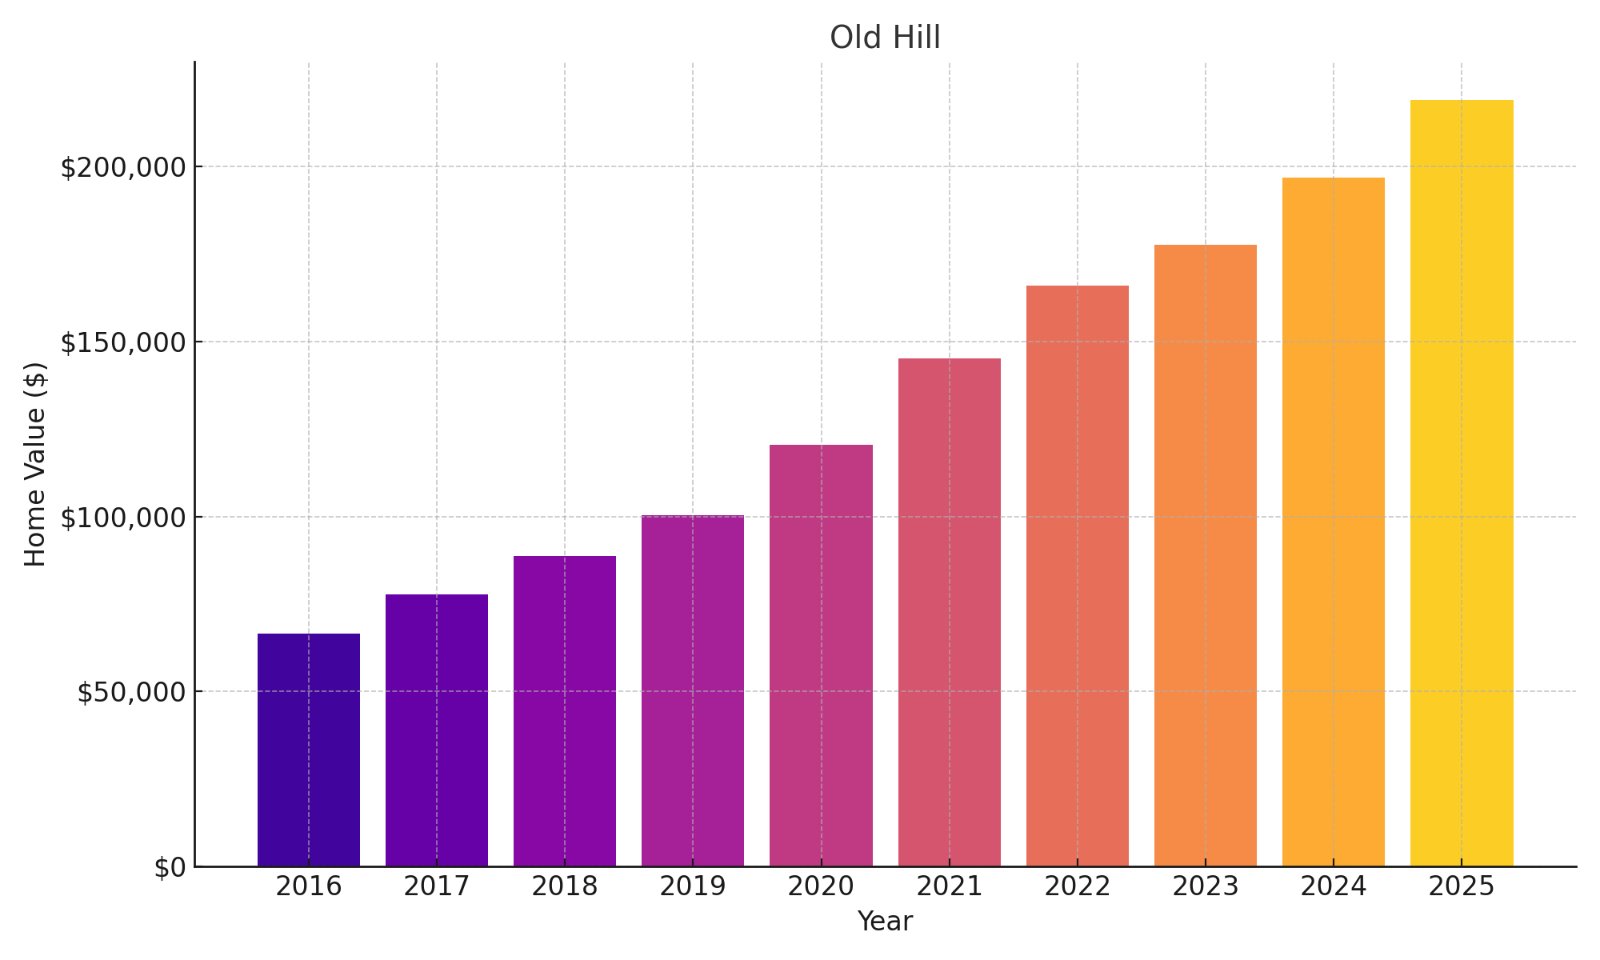
1. Old Hill
🔥 Would you like to save this?

- % change from 2016 to 2025: 229.77%
- 2025: $219,033
- 2024: $196,854
- 2023: $177,533
- 2022: $165,845
- 2021: $145,072
- 2020: $120,359
- 2019: $100,290
- 2018: $88,714
- 2017: $77,729
- 2016: $66,420
You’re examining Springfield’s undisputed champion of value creation, where property values have more than tripled to produce staggering returns on investment. The neighborhood’s growth trajectory shows no signs of plateau, suggesting continued upside despite already impressive gains. Old Hill represents the quintessential early-stage revitalization success story, where investors who recognized potential amid challenges have been rewarded with appreciation rates that outperform nearly every other asset class available to retail investors.


