
🔥 Would you like to save this?
I’ve analyzed data from the Zillow Home Value Index to identify Kansas neighborhoods with the most dramatic home value increases over the past decade. The results reveal fascinating patterns about where investment dollars are flowing in the Sunflower State.
In order to come up with the very specific design ideas, we create most designs with the assistance of state-of-the-art AI interior design software. Also, assume links that take you off the site are affiliate links such as links to Amazon. this means we may earn a commission if you buy something.
What struck me most was the concentration of growth in previously overlooked neighborhoods. Many of these areas have seen their property values triple or even quadruple since 2016, representing potentially life-changing returns for early investors. The remarkable growth trajectories suggest targeted revitalization efforts are succeeding beyond expectations.
I’ve ranked these neighborhoods from slowest to fastest growth, with each showing at least a 173% appreciation over the nine-year period. This level of consistent growth stands out even in today’s heated real estate market and points to fundamental changes in demand patterns across Kansas communities.
25. Central Park

- % change from 2016 to 2025: 173.46%
- 2025: $67,777
- 2024: $58,021
- 2023: $47,977
- 2022: $42,453
- 2021: $35,952
- 2020: $28,923
- 2019: $28,344
- 2018: $24,534
- 2017: $23,320
- 2016: $24,785
Your investment dollar stretches remarkably far in Central Park, where relatively low entry points have enabled substantial percentage gains. The neighborhood’s consistent year-over-year appreciation suggests a sustainable growth trajectory rather than a speculative bubble. For sellers, the market timing couldn’t be better, while buyers should note the area’s affordability compared to similar appreciating markets. Nestled in a convenient location with improving amenities, Central Park represents the classic “buy low, sell high” opportunity.
24. North Central

- % change from 2016 to 2025: 174.66%
- 2025: $78,826
- 2024: $67,411
- 2023: $58,642
- 2022: $49,303
- 2021: $40,300
- 2020: $33,822
- 2019: $33,196
- 2018: $30,851
- 2017: $30,437
- 2016: $28,699
North Central’s value proposition lies in its steady annual appreciation, averaging nearly 20% yearly since 2016. The accelerating price trajectory suggests market momentum is building, not slowing down, making this an opportune time for value investors. The sub-$80K price point in 2025 still represents an accessible entry level compared to statewide averages. Positioned within easy reach of commercial centers, North Central demonstrates the wealth-building potential of long-term property investment in emerging areas.
23. Power

- % change from 2016 to 2025: 190.92%
- 2025: $75,032
- 2024: $66,011
- 2023: $57,583
- 2022: $47,612
- 2021: $41,567
- 2020: $32,236
- 2019: $31,580
- 2018: $28,225
- 2017: $25,816
- 2016: $25,792
Power neighborhood has nearly tripled in value over nine years, representing exceptional ROI for early investors. The rapid price acceleration since 2020 indicates increased market demand that shows no sign of abating. First-time homebuyers can still find relative bargains here, though the window of opportunity is clearly closing. Located in a transitioning area with improving infrastructure, Power exemplifies how targeted community investment can translate to impressive financial returns.
22. Murdock

- % change from 2016 to 2025: 191.31%
- 2025: $80,063
- 2024: $63,808
- 2023: $57,572
- 2022: $47,706
- 2021: $40,139
- 2020: $31,644
- 2019: $29,457
- 2018: $29,572
- 2017: $27,810
- 2016: $27,484
Murdock’s particularly sharp value spike between 2024-2025 (25% in a single year) suggests the neighborhood has reached an inflection point in market recognition. Investors who purchased here in 2016 have realized capital gains of over $52,000 on relatively modest initial investments. The dramatic price trajectory indicates Murdock has overcome previous market hesitancy. This once-overlooked community now offers compelling evidence of successful neighborhood revitalization translating directly to homeowner equity.
21. Monroe

- % change from 2016 to 2025: 193.92%
- 2025: $62,734
- 2024: $56,957
- 2023: $46,217
- 2022: $39,042
- 2021: $34,038
- 2020: $27,478
- 2019: $26,498
- 2018: $23,905
- 2017: $20,694
- 2016: $21,344
Monroe offers an exceptional entry-level investment opportunity with its sub-$65K price point despite nearly 194% appreciation since 2016. The numbers reveal a classic neighborhood turnaround story, with consistent gains accelerating dramatically after 2021. Timing appears ideal for both buyers seeking affordable appreciation potential and sellers looking to capitalize on recent gains. Positioned within a revitalizing corridor, Monroe demonstrates how early neighborhood transition signals can translate to significant wealth creation opportunities.
20. Westheight Manor

- % change from 2016 to 2025: 195.68%
- 2025: $160,157
- 2024: $158,296
- 2023: $143,316
- 2022: $129,341
- 2021: $111,153
- 2020: $90,309
- 2019: $81,466
- 2018: $65,816
- 2017: $58,328
- 2016: $54,165
Westheight Manor stands out with both impressive percentage gains and substantial absolute dollar appreciation, netting owners over $105,000 in equity growth since 2016. The higher price point signals established neighborhood amenities while still delivering investment returns typical of emerging areas. The flattening price curve between 2024-2025 suggests a potential market plateau worth monitoring by prospective buyers. This historic district combines architectural character with demonstrable investment performance, exemplifying the financial benefits of heritage preservation.
19. Matlock Heights

- % change from 2016 to 2025: 202.60%
- 2025: $89,249
- 2024: $75,242
- 2023: $67,553
- 2022: $53,649
- 2021: $45,856
- 2020: $36,237
- 2019: $34,708
- 2018: $32,680
- 2017: $30,009
- 2016: $29,495
Matlock Heights has more than tripled homeowner equity in less than a decade, with particular acceleration visible in the past 24 months. The 18.6% year-over-year gain between 2024-2025 indicates momentum is still building, suggesting further appreciation potential for new investors. Current pricing remains below the psychological $100K threshold, still enabling accessible market entry. Strategically positioned near expanding commercial corridors, Matlock Heights demonstrates how location advantages eventually translate to market recognition and financial returns.
18. Cathedral

- % change from 2016 to 2025: 202.91%
- 2025: $135,964
- 2024: $126,658
- 2023: $113,174
- 2022: $97,888
- 2021: $88,614
- 2020: $69,983
- 2019: $64,192
- 2018: $55,606
- 2017: $51,780
- 2016: $44,886
Cathedral’s growth pattern reveals the wealth-building power of real estate, with initial investments tripling in just nine years to create over $91,000 in equity gains. The steady upward trajectory without significant plateaus suggests fundamental market strength rather than speculative buying. Current pricing still represents value compared to similar historic districts elsewhere in the region. With its distinctive architecture and established character, Cathedral illustrates how neighborhood identity can serve as a financial moat against market downturns.
17. Northeast Millair
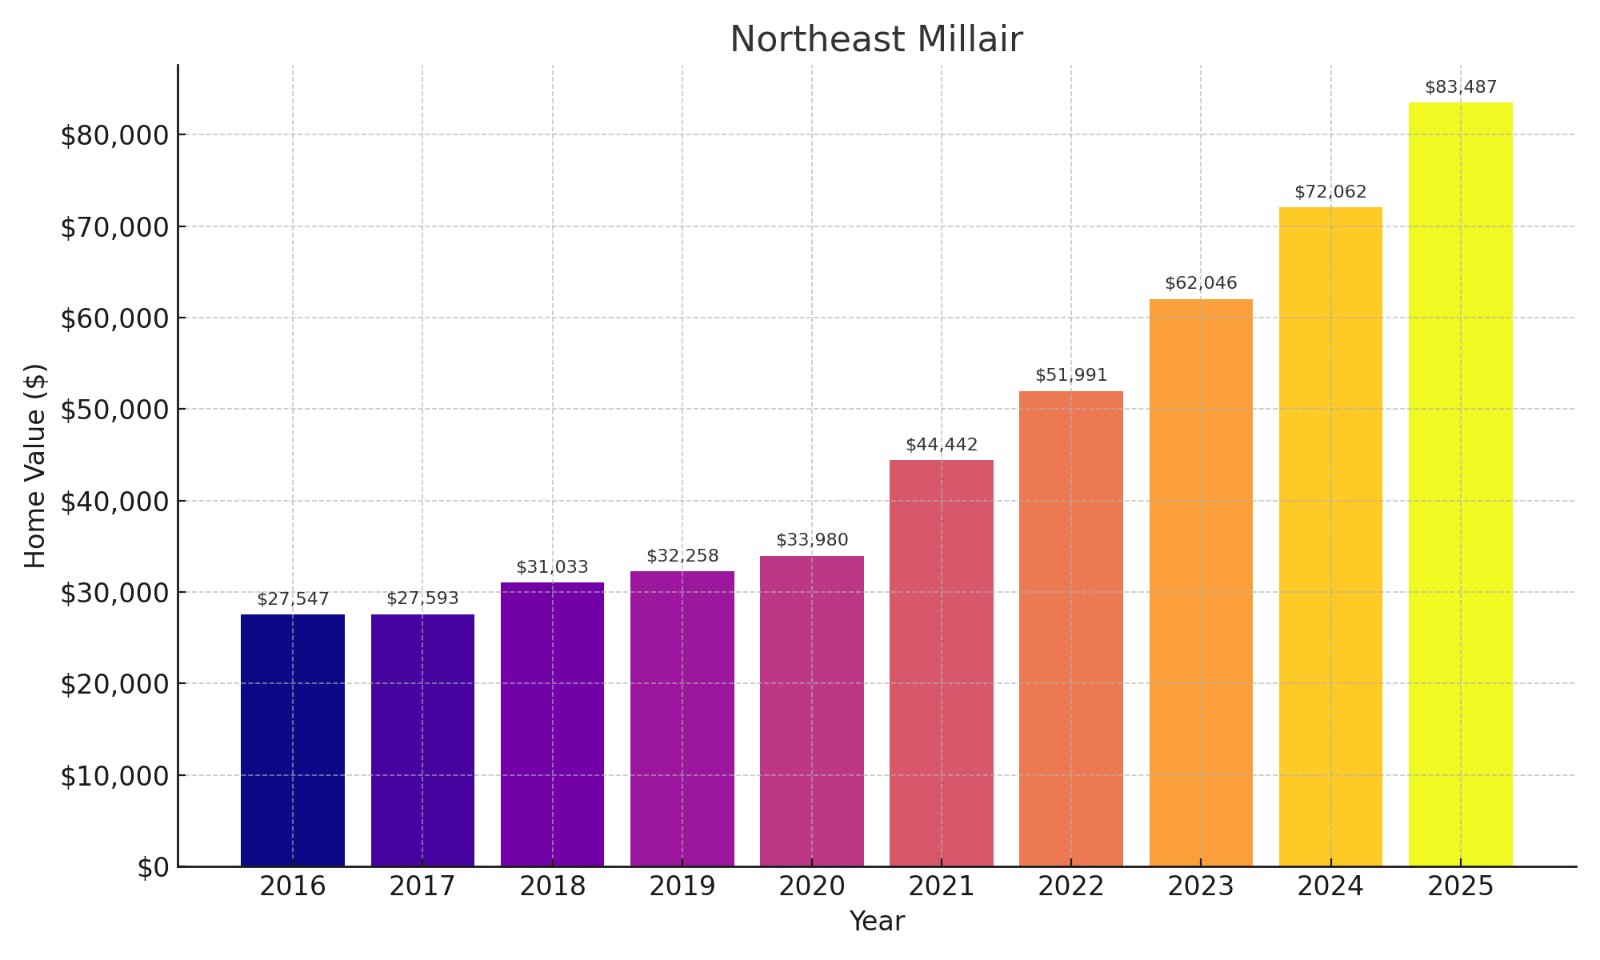
- % change from 2016 to 2025: 203.08%
- 2025: $83,487
- 2024: $72,062
- 2023: $62,046
- 2022: $51,991
- 2021: $44,442
- 2020: $33,980
- 2019: $32,258
- 2018: $31,033
- 2017: $27,593
- 2016: $27,547
Northeast Millair exemplifies the wealth-creating potential of strategic neighborhood selection, having delivered over 200% returns to early investors. The price acceleration curve steepened noticeably after 2020, indicating growing market recognition of the area’s value proposition. For buyers, the sub-$85K entry point still offers exceptional value relative to the demonstrated growth trajectory. Adjacent to improving transportation corridors, Northeast Millair shows how infrastructure improvements can catalyze sustained property appreciation and investment returns.
16. Coronodo Hills

- % change from 2016 to 2025: 205.90%
- 2025: $163,658
- 2024: $161,318
- 2023: $148,428
- 2022: $130,257
- 2021: $116,279
- 2020: $94,862
- 2019: $84,357
- 2018: $69,781
- 2017: $61,599
- 2016: $53,501
Coronodo Hills has rewarded property owners with substantial equity growth exceeding $110,000 since 2016, demonstrating both percentage and absolute dollar strength. The higher initial price point reflects established neighborhood amenities while still delivering remarkable investment performance. Recent price leveling between 2024-2025 warrants attention from potential buyers evaluating future appreciation potential. This established neighborhood shows how community stability combined with strategic location advantages can create exceptional long-term wealth-building opportunities.
15. Shawnee Heights

- % change from 2016 to 2025: 209.96%
- 2025: $148,457
- 2024: $138,503
- 2023: $122,873
- 2022: $113,267
- 2021: $102,845
- 2020: $77,053
- 2019: $71,327
- 2018: $60,126
- 2017: $53,652
- 2016: $47,895
Shawnee Heights has generated over $100,000 in equity growth for homeowners since 2016, with its triple-digit appreciation rate outpacing most managed investment alternatives. The particularly steep growth between 2019-2022 indicates a market inflection point that savvy investors capitalized on. Current pricing reflects established neighborhood status while still offering value compared to similar areas. Perched in an elevated location with scenic vistas, Shawnee Heights demonstrates how natural amenities eventually translate to price premiums in real estate markets.
14. Park Drive
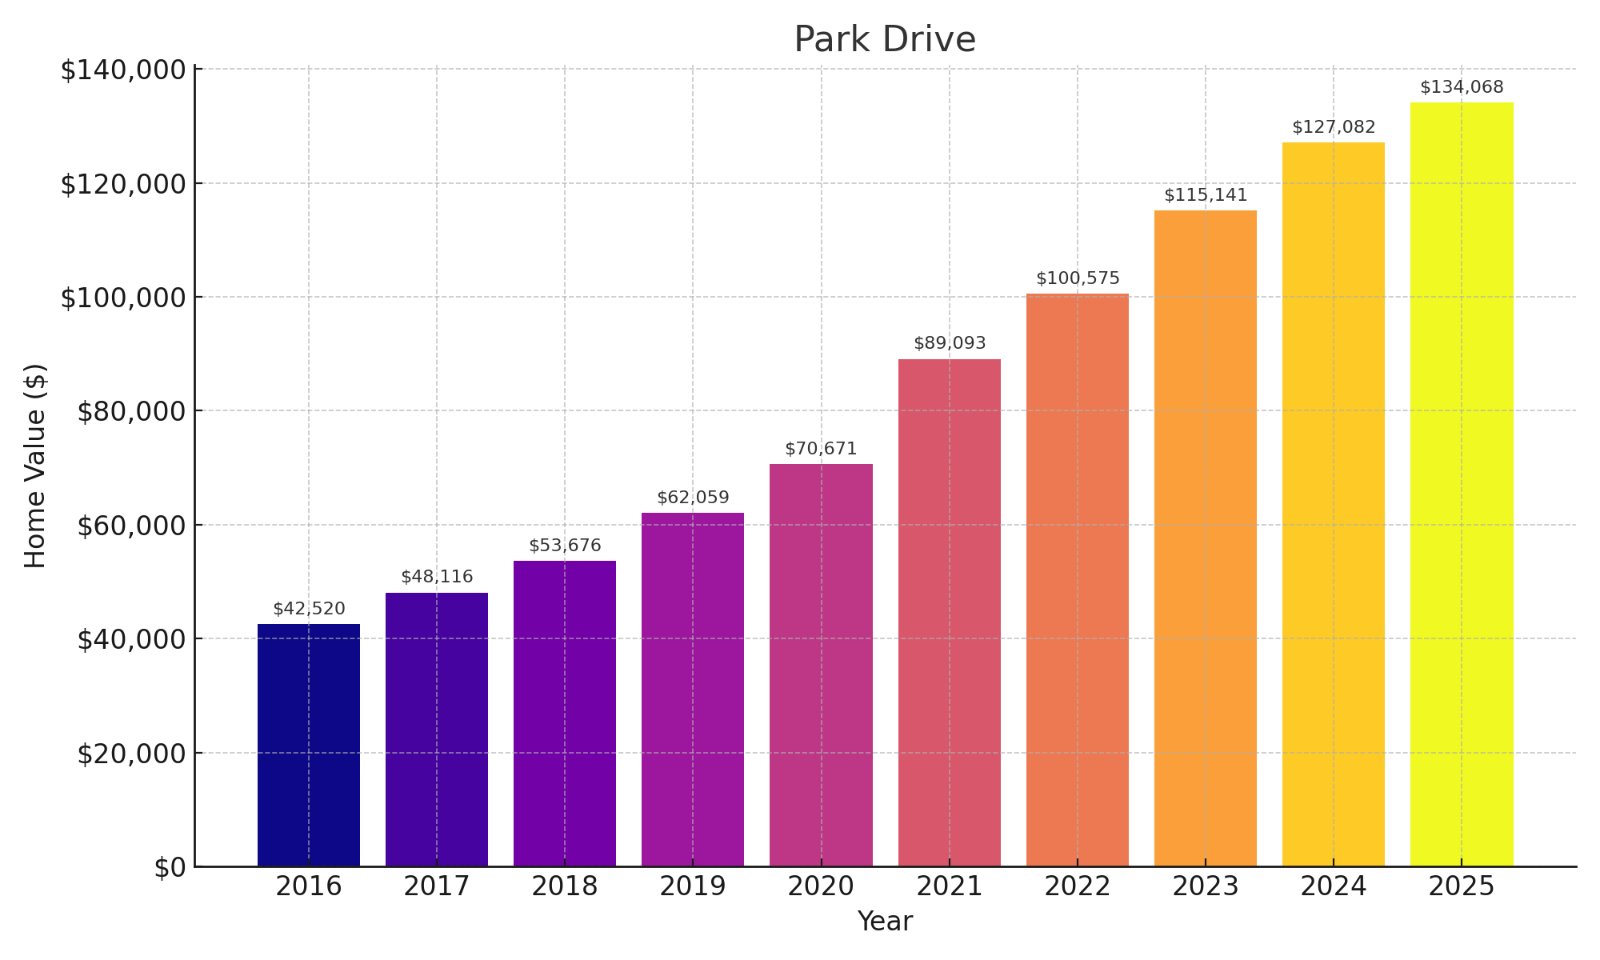
- % change from 2016 to 2025: 215.30%
- 2025: $134,068
- 2024: $127,082
- 2023: $115,141
- 2022: $100,575
- 2021: $89,093
- 2020: $70,671
- 2019: $62,059
- 2018: $53,676
- 2017: $48,116
- 2016: $42,520
Park Drive has delivered exceptional investment performance, turning $42,520 into $134,068 in just nine years—a wealth-building opportunity few other asset classes could match. The consistent year-over-year appreciation without significant plateaus suggests fundamental market strength rather than speculative buying. The current price point represents the sweet spot between established neighborhood stability and continued growth potential. Adjacent to green space amenities that increasingly command market premiums, Park Drive exemplifies how lifestyle features translate directly to financial performance.
13. Wyandotte Village

🔥 Would you like to save this?
- % change from 2016 to 2025: 230.41%
- 2025: $157,723
- 2024: $149,914
- 2023: $135,538
- 2022: $121,338
- 2021: $107,692
- 2020: $81,730
- 2019: $74,699
- 2018: $65,335
- 2017: $54,337
- 2016: $47,735
Wyandotte Village has generated life-changing equity growth of nearly $110,000 since 2016, outperforming virtually all traditional investment vehicles. The steepening price curve after 2020 indicates accelerating market recognition that continues to drive values upward. Sellers currently enjoy an ideal market position with demonstrated appreciation and strong buyer demand. This established community with improving amenities showcases how neighborhood reinvestment initiatives can create substantial financial returns for early-stage property investors.
12. Brentwood Hills

- % change from 2016 to 2025: 252.40%
- 2025: $162,747
- 2024: $156,427
- 2023: $142,918
- 2022: $129,187
- 2021: $111,991
- 2020: $89,293
- 2019: $78,742
- 2018: $65,173
- 2017: $55,284
- 2016: $46,182
Brentwood Hills represents a masterclass in wealth creation through real estate, having generated over $116,000 in equity in just nine years. The remarkably consistent upward trajectory without significant corrections points to sustainable market fundamentals rather than speculative fever. Despite the impressive appreciation, current valuations may still represent opportunity compared to similar neighborhoods in other markets. This established community with mature landscaping demonstrates how patient capital can leverage neighborhood amenities into substantial financial returns.
11. Strawberry Hill

- % change from 2016 to 2025: 253.96%
- 2025: $158,860
- 2024: $154,596
- 2023: $138,502
- 2022: $125,055
- 2021: $106,038
- 2020: $79,173
- 2019: $69,555
- 2018: $59,427
- 2017: $50,554
- 2016: $44,880
Strawberry Hill exemplifies financial transformation through real estate, having increased property values by nearly 254% and generating over $113,000 in equity since 2016. The dramatic acceleration between 2019-2022 suggests a fundamental market reevaluation that savvy investors capitalized on. Recent slowing growth between 2024-2025 warrants monitoring for potential market maturation. Known for its cultural heritage and distinctive architecture, Strawberry Hill demonstrates how neighborhood character can provide both lifestyle value and exceptional financial returns.
10. Armourdale

- % change from 2016 to 2025: 256.95%
- 2025: $106,712
- 2024: $98,670
- 2023: $82,836
- 2022: $71,713
- 2021: $72,918
- 2020: $54,316
- 2019: $48,179
- 2018: $40,230
- 2017: $31,030
- 2016: $29,896
Armourdale’s investment story has been nothing short of remarkable, with property values more than tripling and delivering over $76,000 in equity gains since 2016. The unusual price correction between 2021-2022 created a temporary buying opportunity before growth resumed its upward trajectory. At just over $106K in 2025, pricing still represents value compared to similar neighborhoods experiencing comparable appreciation. This historically industrial area demonstrates how economic transition zones often represent the most lucrative opportunities for real estate investment returns.
9. Riverview

- % change from 2016 to 2025: 261.59%
- 2025: $106,011
- 2024: $103,833
- 2023: $91,023
- 2022: $78,653
- 2021: $71,710
- 2020: $50,805
- 2019: $44,938
- 2018: $38,180
- 2017: $34,160
- 2016: $29,318
Riverview has delivered extraordinary financial performance, turning modest $29K properties into $106K assets in just nine years—a 261% return that few investment vehicles could match. The dramatic price acceleration after 2020 reveals a market inflection point that created wealth-building opportunities for property owners. The slower growth between 2024-2025 suggests monitoring for potential market plateau. With its waterfront proximity providing lasting value, Riverview demonstrates how natural amenities can serve as long-term drivers of real estate appreciation.
8. Prescott

- % change from 2016 to 2025: 295.69%
- 2025: $115,412
- 2024: $105,318
- 2023: $86,227
- 2022: $72,104
- 2021: $61,336
- 2020: $46,848
- 2019: $41,746
- 2018: $41,225
- 2017: $37,407
- 2016: $29,167
Prescott represents the epitome of wealth creation through real estate investment, having nearly quadrupled in value and generated over $86,000 in equity since 2016. The remarkable acceleration since 2021 indicates Prescott has reached a market inflection point with strong buyer recognition. Recent price trends suggest momentum is still building, with 9.6% appreciation between 2024-2025 alone. This emerging neighborhood exemplifies how strategic investment in transitioning areas can yield outsized returns compared to established, higher-priced communities.
7. Kensington
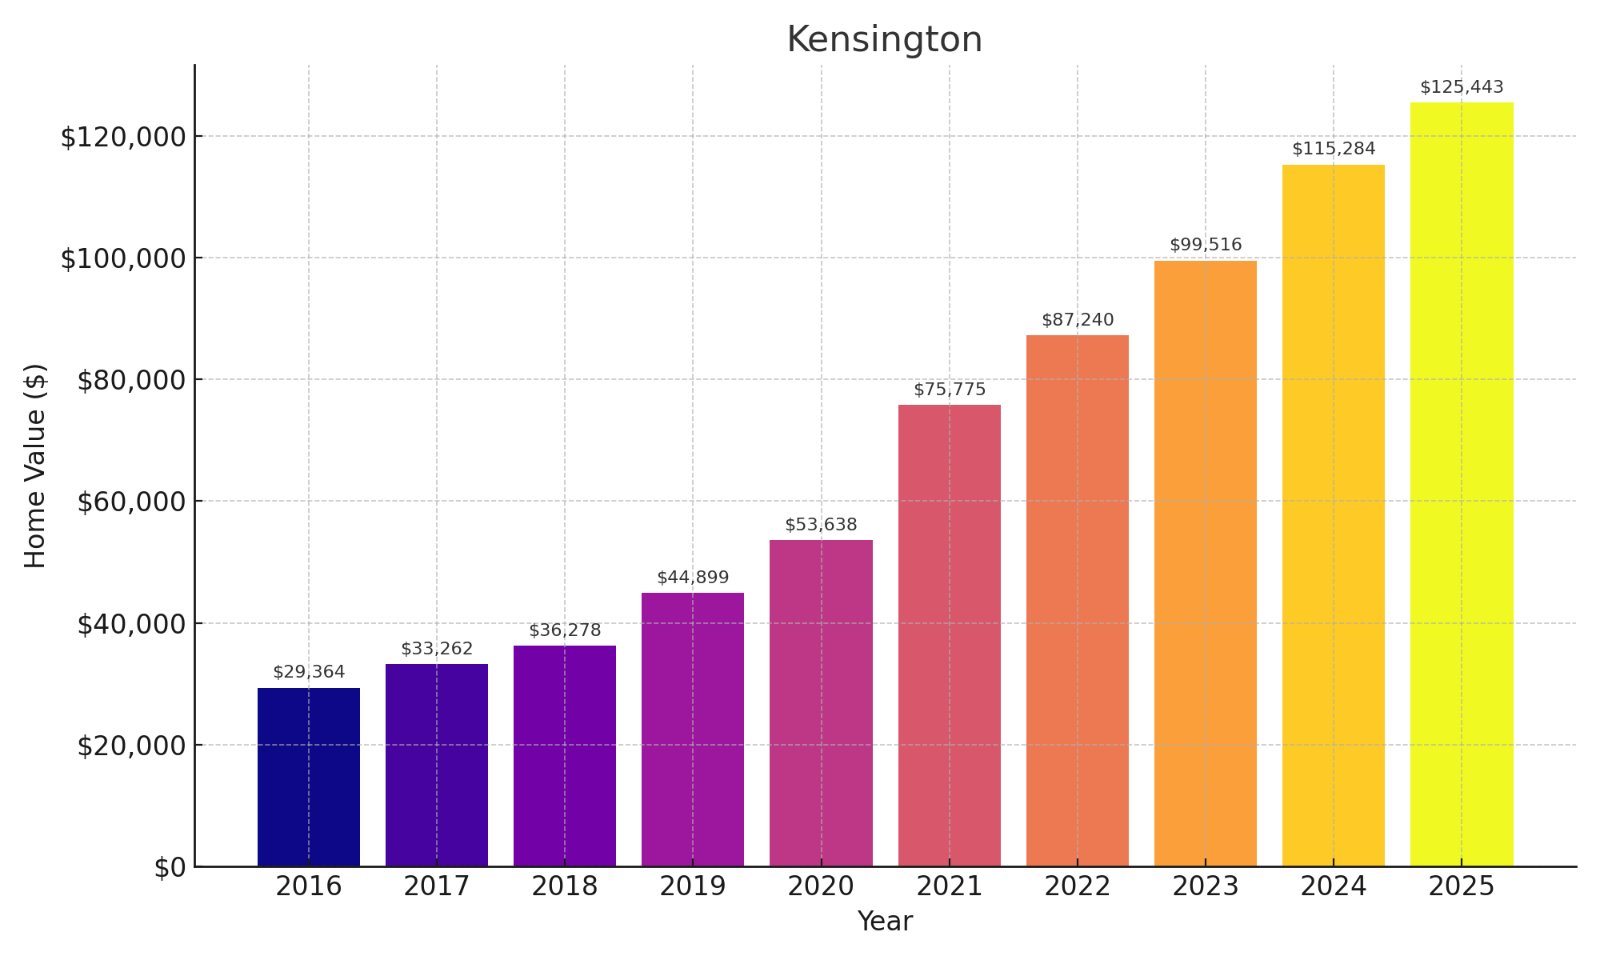
- % change from 2016 to 2025: 327.20%
- 2025: $125,443
- 2024: $115,284
- 2023: $99,516
- 2022: $87,240
- 2021: $75,775
- 2020: $53,638
- 2019: $44,899
- 2018: $36,278
- 2017: $33,262
- 2016: $29,364
Kensington exemplifies transformational wealth creation, with property values more than quadrupling from $29K to $125K since 2016. The extraordinary price acceleration between 2019-2022 created a wealth-building engine for homeowners, generating over $96,000 in equity. The continued strong appreciation of 8.8% between 2024-2025 suggests growth momentum remains robust. Nestled in a convenient location with improving infrastructure, Kensington demonstrates how strategic neighborhood selection can deliver investment returns far exceeding traditional financial assets.
6. Boulevard

- % change from 2016 to 2025: 359.51%
- 2025: $96,127
- 2024: $89,320
- 2023: $71,265
- 2022: $58,412
- 2021: $48,055
- 2020: $38,523
- 2019: $35,027
- 2018: $25,499
- 2017: $21,415
- 2016: $20,919
Boulevard’s investment performance has been exceptional, turning modest $21K properties into $96K assets—a 359% return that represents true wealth-building opportunity. The dramatic price acceleration between 2017-2025 has occurred without significant plateaus, suggesting fundamental market strength. Despite quadrupling in value, current pricing remains accessible compared to regional averages, potentially indicating further upside. This once-overlooked neighborhood demonstrates how strategic investment in early-stage revitalization areas can deliver returns that vastly outperform established property markets.
5. London Heights

- % change from 2016 to 2025: 377.05%
- 2025: $129,743
- 2024: $115,998
- 2023: $98,136
- 2022: $89,328
- 2021: $76,159
- 2020: $61,304
- 2019: $51,350
- 2018: $38,310
- 2017: $30,804
- 2016: $27,197
London Heights represents a financial transformation story, with property values nearly quintupling and generating over $102,000 in equity in just nine years. The steep and consistent price acceleration without significant corrections indicates strong fundamental demand rather than speculative buying. Recent appreciation of 11.8% between 2024-2025 suggests momentum remains robust with no signs of market saturation. Situated on elevated terrain with attractive views, London Heights demonstrates how natural features combine with revitalization efforts to deliver exceptional investment returns.
4. Strugglers Hill

- % change from 2016 to 2025: 382.67%
- 2025: $134,255
- 2024: $107,423
- 2023: $86,369
- 2022: $75,935
- 2021: $63,830
- 2020: $41,559
- 2019: $38,580
- 2018: $32,988
- 2017: $29,280
- 2016: $27,815
Strugglers Hill defies its name with extraordinary investment performance, turning $28K properties into $134K assets—a 383% return that has created generational wealth opportunity. The dramatic 25% price surge between 2024-2025 indicates accelerating market recognition, suggesting the growth story isn’t finished. The phenomenal post-2020 acceleration has generated over $106,000 in equity for early investors. This remarkable neighborhood transformation demonstrates how significant community reinvestment can fundamentally reposition market perception and property values.
3. Gerding Gardens

- % change from 2016 to 2025: 392.61%
- 2025: $123,392
- 2024: $114,173
- 2023: $99,976
- 2022: $82,321
- 2021: $72,180
- 2020: $51,260
- 2019: $41,659
- 2018: $33,347
- 2017: $28,633
- 2016: $25,049
Gerding Gardens exemplifies transformational wealth creation, with property values nearly quintupling and generating almost $100,000 in equity since 2016. The price explosion between 2019-2022 created a wealth-building engine for early investors who recognized the neighborhood’s potential. Despite the extraordinary appreciation, the continued 8.1% growth between 2024-2025 suggests ongoing momentum. This garden-focused community demonstrates how neighborhood themes and distinctive character can translate directly to exceptional financial performance in real estate markets.
2. Parkwood

- % change from 2016 to 2025: 406.40%
- 2025: $125,454
- 2024: $109,707
- 2023: $90,156
- 2022: $76,650
- 2021: $69,758
- 2020: $47,479
- 2019: $41,787
- 2018: $34,649
- 2017: $28,148
- 2016: $24,774
Parkwood represents an investment masterclass, with property values more than quintupling from $25K to $125K—generating life-changing returns of over 406%. The remarkable post-2019 acceleration has created over $100,000 in equity for property owners who recognized the area’s potential. Recent appreciation of 14.4% between 2024-2025 suggests growth momentum remains exceptionally strong. Adjacent to green space amenities with improving infrastructure, Parkwood demonstrates how location advantages eventually translate to premium pricing in real estate markets.

1. Quindaro

🔥 Would you like to save this?
- % change from 2016 to 2025: 454.63%
- 2025: $109,127
- 2024: $95,361
- 2023: $82,946
- 2022: $71,692
- 2021: $58,012
- 2020: $38,603
- 2019: $31,202
- 2018: $26,056
- 2017: $23,007
- 2016: $19,675
Quindaro stands as Kansas’ ultimate real estate success story, with property values skyrocketing 454% and turning modest $20K investments into $109K assets in just nine years. The exponential growth trajectory accelerated dramatically after 2019, generating almost $90,000 in equity for early investors who recognized the opportunity. Even now, with 14.4% appreciation between 2024-2025, momentum shows no signs of slowing. This historic area with significant cultural heritage demonstrates how neighborhood revitalization can completely transform both community identity and investment returns.


