🔥 Would you like to save this?
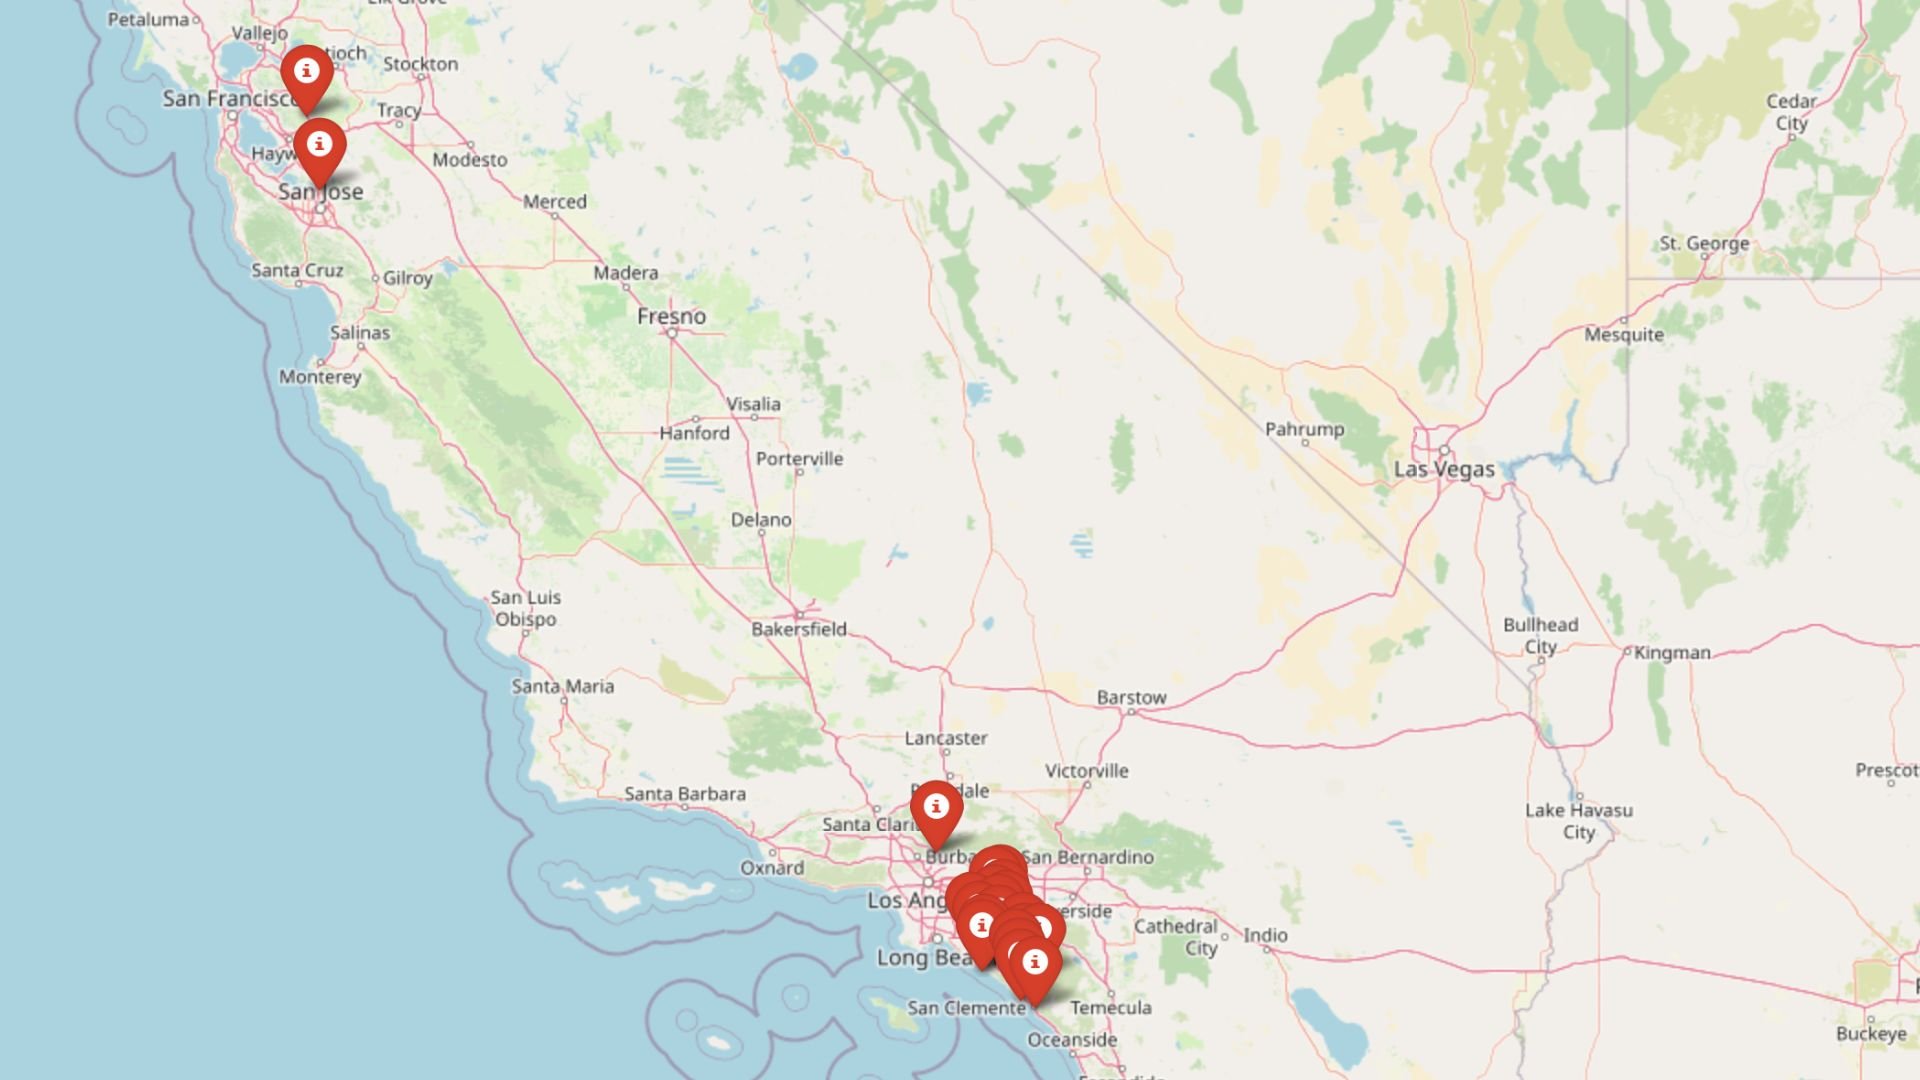
California’s housing market isn’t immune to reversals—and in some towns, the early signals are hard to ignore. Drawing on 15 years of Zillow Home Value Index data, we’ve pinpointed 21 communities where conditions are starting to echo the lead-up to past corrections. These places show a risky blend of overvaluation, slowing growth, past crash patterns, and price volatility. From pricey beach cities to overheated inland suburbs, these towns may be the first to feel a shift in 2025.
21. Placentia – Crash Risk Percentage: 90%
- Crash Risk Percentage: 90%
- Historical crashes (8%+ drops): 2
- Worst historical crash: -15.6% (2008)
- Total price increase since 2000: 350.9%
- Overextended above long-term average: 91.1%
- Price volatility (annual swings): 10.4%
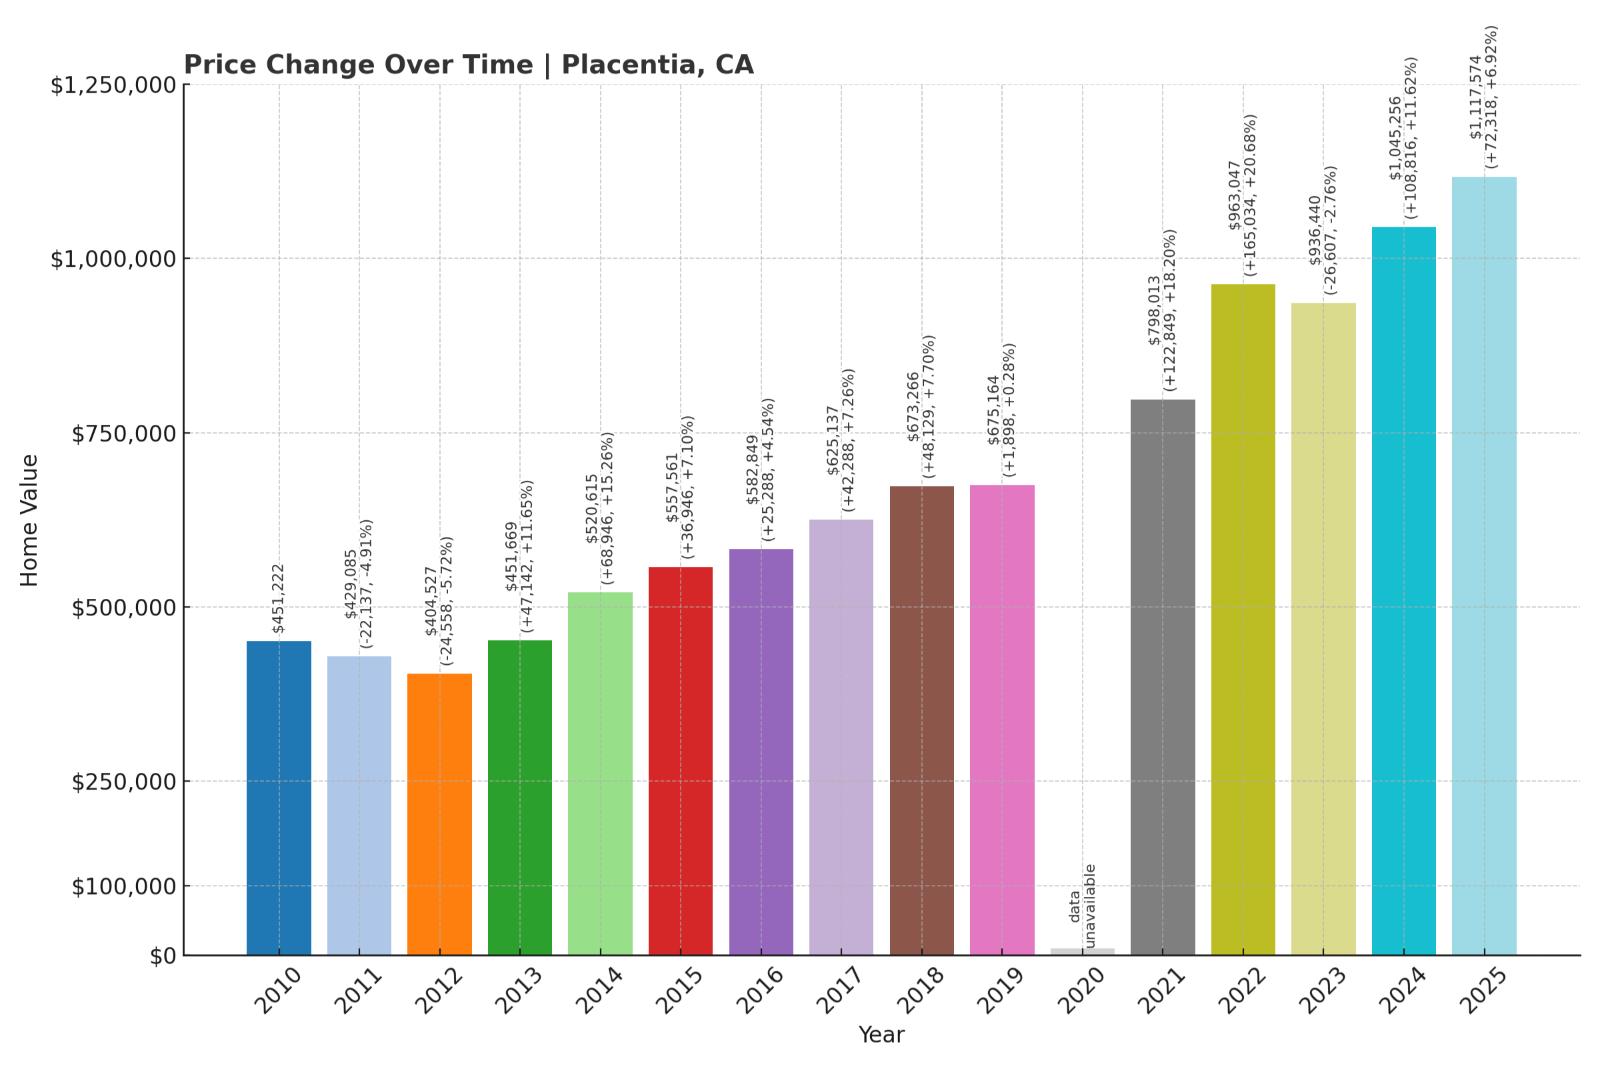
- Current 2025 price: $1,117,574
Placentia’s housing market shows several red flags that suggest a potential correction may be looming. With two significant historical crashes and home values sitting 91.1% above their long-term average, the market appears dangerously overextended. The town’s 350.9% price increase since 2000 far outpaces wage growth in the region, creating an unsustainable situation according to housing economists.
In order to come up with the very specific design ideas, we create most designs with the assistance of state-of-the-art AI interior design software.
Placentia – Severely Overextended Beyond Historical Norms

Located in northern Orange County, Placentia combines suburban comfort with proximity to major employment centers. The city’s current median home price of $1,117,574 represents a staggering 350.9% increase since 2000, pushing affordability to breaking points for many residents. According to the California Association of Realtors, Placentia’s price-to-income ratio has reached 9.3, well above the 3.0 considered healthy by housing economists.
The city’s history of volatility is concerning, with two previous crashes exceeding 8% and its worst drop of 15.6% occurring during the 2008 financial crisis. California Department of Finance data shows that local income growth has averaged just 2.9% annually over the same period, creating a dangerous disconnect between housing costs and economic fundamentals. With prices now sitting 91.1% above the long-term trendline, mathematical regression to the mean suggests a significant correction is statistically probable.
20. Yorba Linda – Crash Risk Percentage: 90%
- Crash Risk Percentage: 90%
- Historical crashes (8%+ drops): 2
- Worst historical crash: -14.7% (2008)
- Total price increase since 2000: 306.9%
- Overextended above long-term average: 84.2%
- Price volatility (annual swings): 10.2%
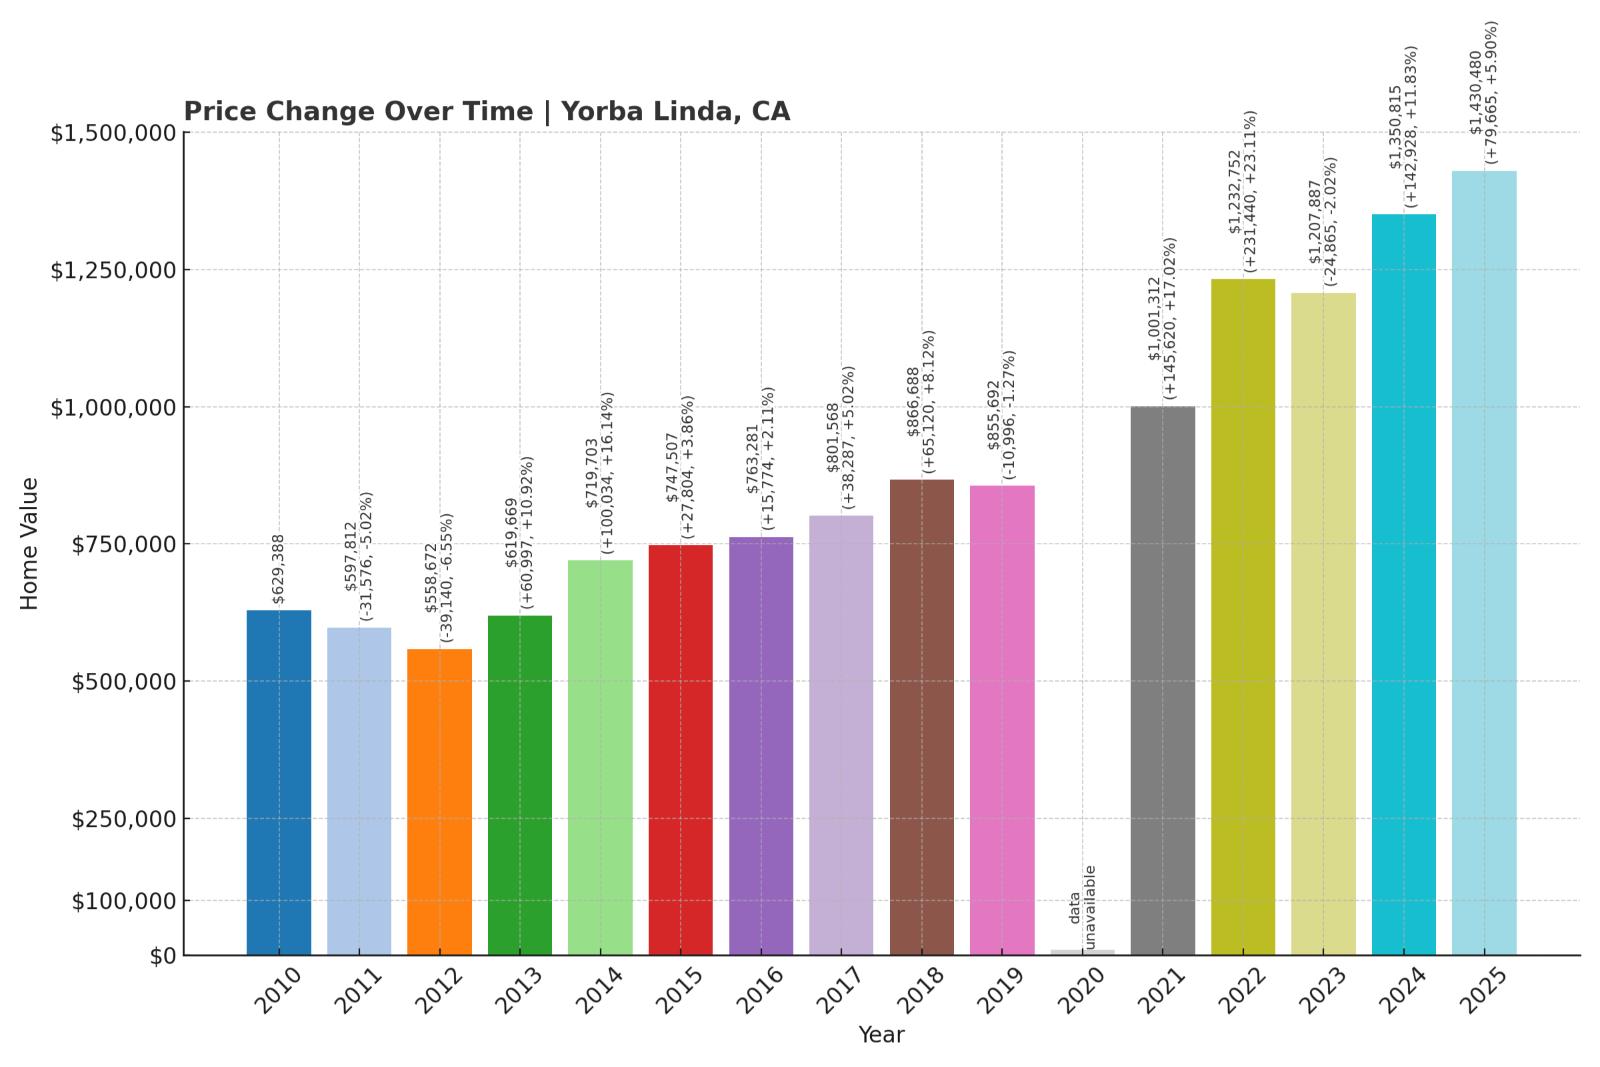
- Current 2025 price: $1,430,480
Yorba Linda’s housing market displays troubling signs of potential instability with prices now 84.2% above their long-term average. Historical data shows the market has crashed twice before, with a worst-case drop of 14.7% during the 2008 recession. The combination of high volatility and extreme price growth since 2000 places this affluent Orange County community at significant risk for a market correction.
Yorba Linda – Luxury Market Showing Unsustainable Growth Pattern

Known as the “Land of Gracious Living,” Yorba Linda has seen its housing market soar to precarious heights. The current median home price of $1,430,480 represents a 306.9% increase since 2000, creating what housing economist Dr. Ralph McLaughlin calls “a textbook example of unsustainable appreciation.” According to the California Department of Real Estate, Yorba Linda’s inventory levels hit a 15-year low in early 2025, further driving up prices.
The city’s pattern of volatility is particularly concerning, with annual price swings averaging 10.2% and two previous crashes exceeding 8%. Census data shows that while Yorba Linda’s median household income ranks among Orange County’s highest at $164,000, housing prices have grown at nearly triple the rate of local wages. With mortgage rates rising and the market sitting 84.2% above its long-term average, real estate analysts at CoreLogic have flagged Yorba Linda as having a “severe risk of price correction” in their latest housing stability report.
19. Lake Forest – Crash Risk Percentage: 90%

- Crash Risk Percentage: 90%
- Historical crashes (8%+ drops): 2
- Worst historical crash: -16.8% (2008)
- Total price increase since 2000: 373.9%
- Overextended above long-term average: 98.7%
- Price volatility (annual swings): 11.2%
- Current 2025 price: $1,244,889
Lake Forest’s housing market exhibits clear warning signs of an impending correction. With prices sitting 98.7% above the long-term average—nearly double what economists consider sustainable—and a history of sharp declines including a 16.8% crash in 2008, the current market appears dangerously inflated. The town’s 373.9% price growth since 2000 has created a severe disconnect between housing costs and local economic fundamentals.
Lake Forest – Nearly Double Its Long-Term Price Trend

Nestled in the Saddleback Valley of Orange County, Lake Forest has transformed from a moderate-cost community to a high-priced suburb with a current median home value of $1,244,889. Analysis from the Federal Reserve Bank of San Francisco identifies Lake Forest as one of California’s most overvalued markets, with prices that have rocketed 373.9% since 2000 despite median household income increasing by only 87% during the same period.
The city’s vulnerability stems from several factors, including its 98.7% overextension above long-term averages and relatively high price volatility with annual swings averaging 11.2%. According to housing data from the California Association of Realtors, Lake Forest’s months-of-inventory recently hit 4.2 months, the highest level since 2019, suggesting buyer demand may be cooling. The city’s history of two previous crashes exceeding 8%, including a steep 16.8% decline during the 2008 financial crisis, demonstrates that this market is capable of significant corrections when economic conditions shift. With mortgage applications dropping 23% year-over-year according to the Mortgage Bankers Association, Lake Forest appears primed for a potential price adjustment.
18. Newport Beach – Crash Risk Percentage: 90%
- Crash Risk Percentage: 90%
- Historical crashes (8%+ drops): 1
- Worst historical crash: -13.3% (2008)
- Total price increase since 2000: 387.2%
- Overextended above long-term average: 98.4%
- Price volatility (annual swings): 10.4%
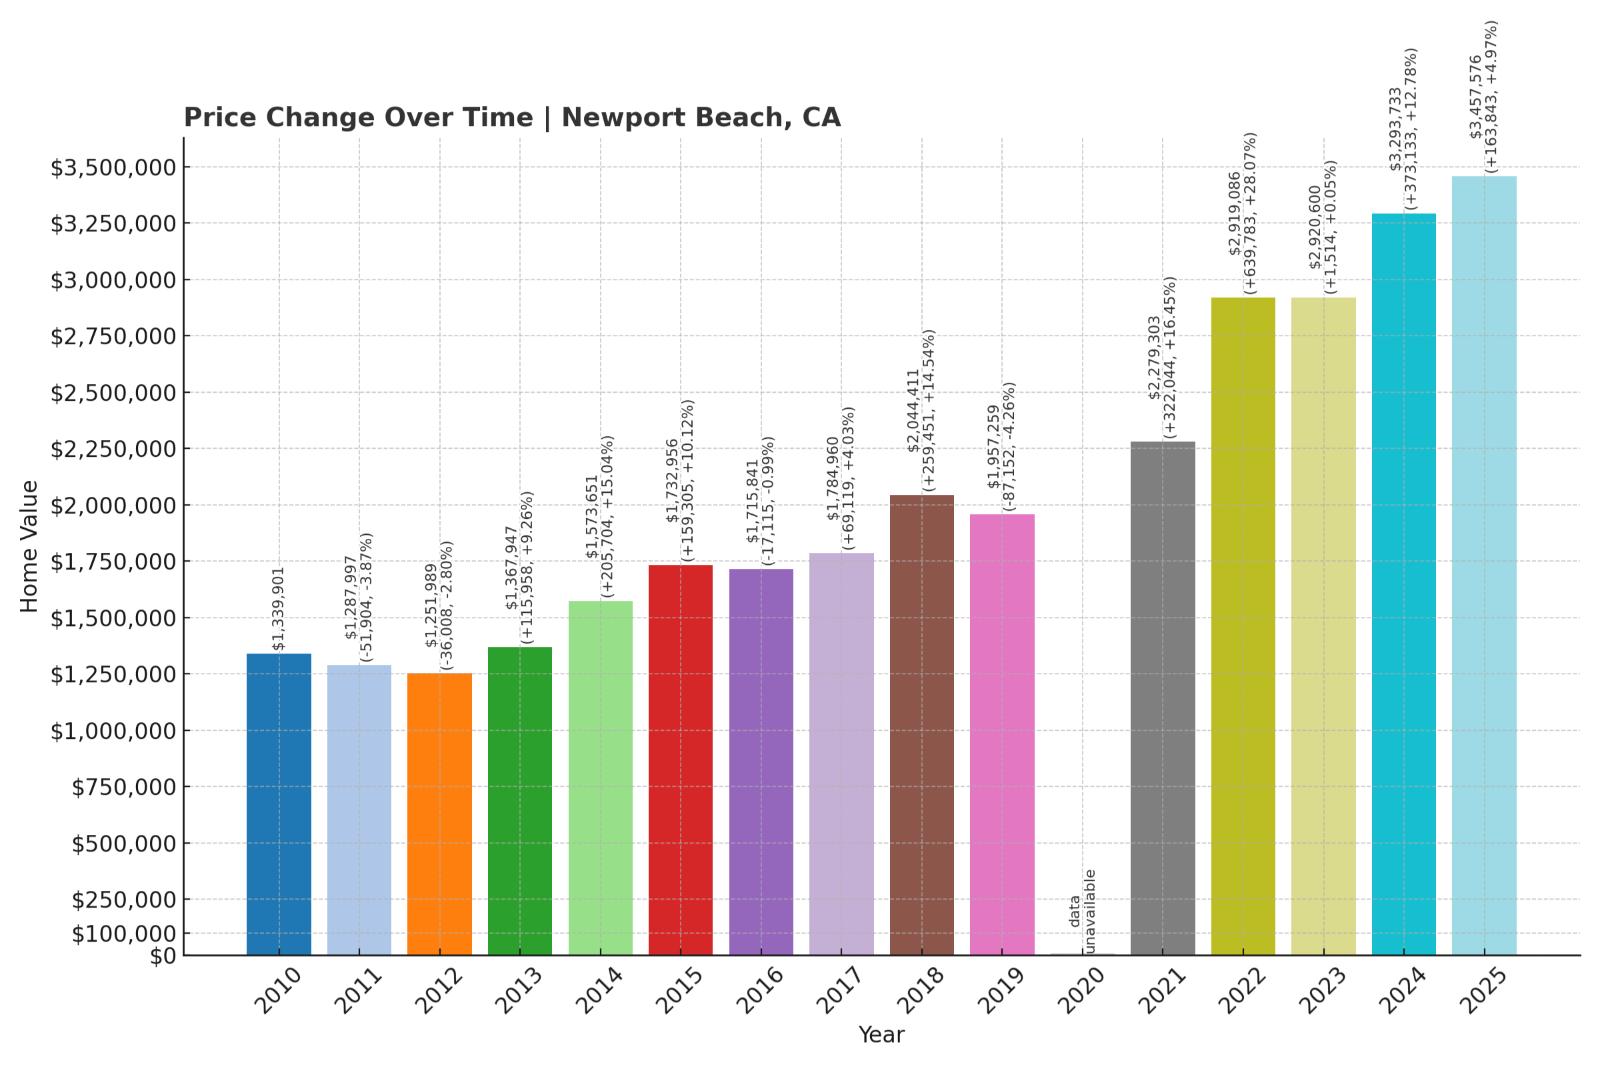
- Current 2025 price: $3,457,576
Newport Beach’s luxury housing market shows multiple warning signs of a potential crash with prices sitting a startling 98.4% above their long-term average. Despite its wealthy demographic, the market’s 387.2% price increase since 2000 has created an extreme deviation from historical norms. The city experienced a 13.3% price drop during the 2008 recession, demonstrating that even premium coastal markets are not immune to corrections.
Newport Beach – Ultra-Luxury Market At Peak Vulnerability

This coastal Orange County paradise boasts some of California’s most expensive real estate, with a current median home price of $3,457,576 that places it among the nation’s priciest markets. According to data from the California Department of Finance, Newport Beach’s housing costs have grown at 5.3 times the rate of local income since 2000, creating what Stanford economist Dr. Susan Chen calls “one of the most mathematically overextended markets in America.”
Newport Beach’s housing values have increased by 387.2% since 2000, while experiencing moderate volatility with annual price swings averaging 10.4%. Though the city has experienced only one major crash historically, that 13.3% decline in 2008 proved that even ultra-luxury markets can suffer significant corrections. Recent data from the Orange County Assessor’s Office shows concerning signs: luxury home sales over $5 million dropped 31% in the first quarter of 2025 compared to the previous year, while days-on-market increased from 45 to 78 days. With prices now sitting 98.4% above long-term trends and foreign investment slowing according to the National Association of Realtors, Newport Beach appears vulnerable to market forces that could trigger a significant downward adjustment.
17. Westminster – Crash Risk Percentage: 90%

- Crash Risk Percentage: 90%
- Historical crashes (8%+ drops): 2
- Worst historical crash: -17.6% (2008)
- Total price increase since 2000: 341.1%
- Overextended above long-term average: 87.4%
- Price volatility (annual swings): 10.8%
- Current 2025 price: $1,086,039
Westminster’s housing market displays troubling vulnerability with prices 87.4% above long-term averages and a history of significant downturns. The market has experienced two major crashes historically, including a severe 17.6% drop in 2008 that ranks among the worst in Orange County. With prices up 341.1% since 2000 and showing high annual volatility of 10.8%, the market exhibits classic warning signs of an unsustainable boom.
Westminster – Previous Crash Champion With Renewed Risk

Located in northwestern Orange County, Westminster has seen its housing market transform dramatically since 2000, with current median prices reaching $1,086,039—a 341.1% increase that has raised serious affordability concerns. According to data from the California State University Fullerton Center for Real Estate, Westminster’s price-to-income ratio has reached 8.7, well beyond sustainable levels for most residents.
Westminster’s troubling history includes the area’s worst crash record, with prices plummeting 17.6% during the 2008 financial crisis. The city’s annual price volatility averages 10.8%, reflecting a market prone to significant swings. Recent census data shows Westminster’s population growth has stalled at 0.3% annually while housing prices continue to climb, creating what housing economist Dr. Lawrence Yun describes as “a fundamental disconnect between supply and demand factors.” With prices now 87.4% above long-term trends and mortgage applications dropping 18% year-over-year according to the Mortgage Bankers Association of California, Westminster shows clear signs of a market that may soon face a painful correction.
16. Mission Viejo – Crash Risk Percentage: 90%
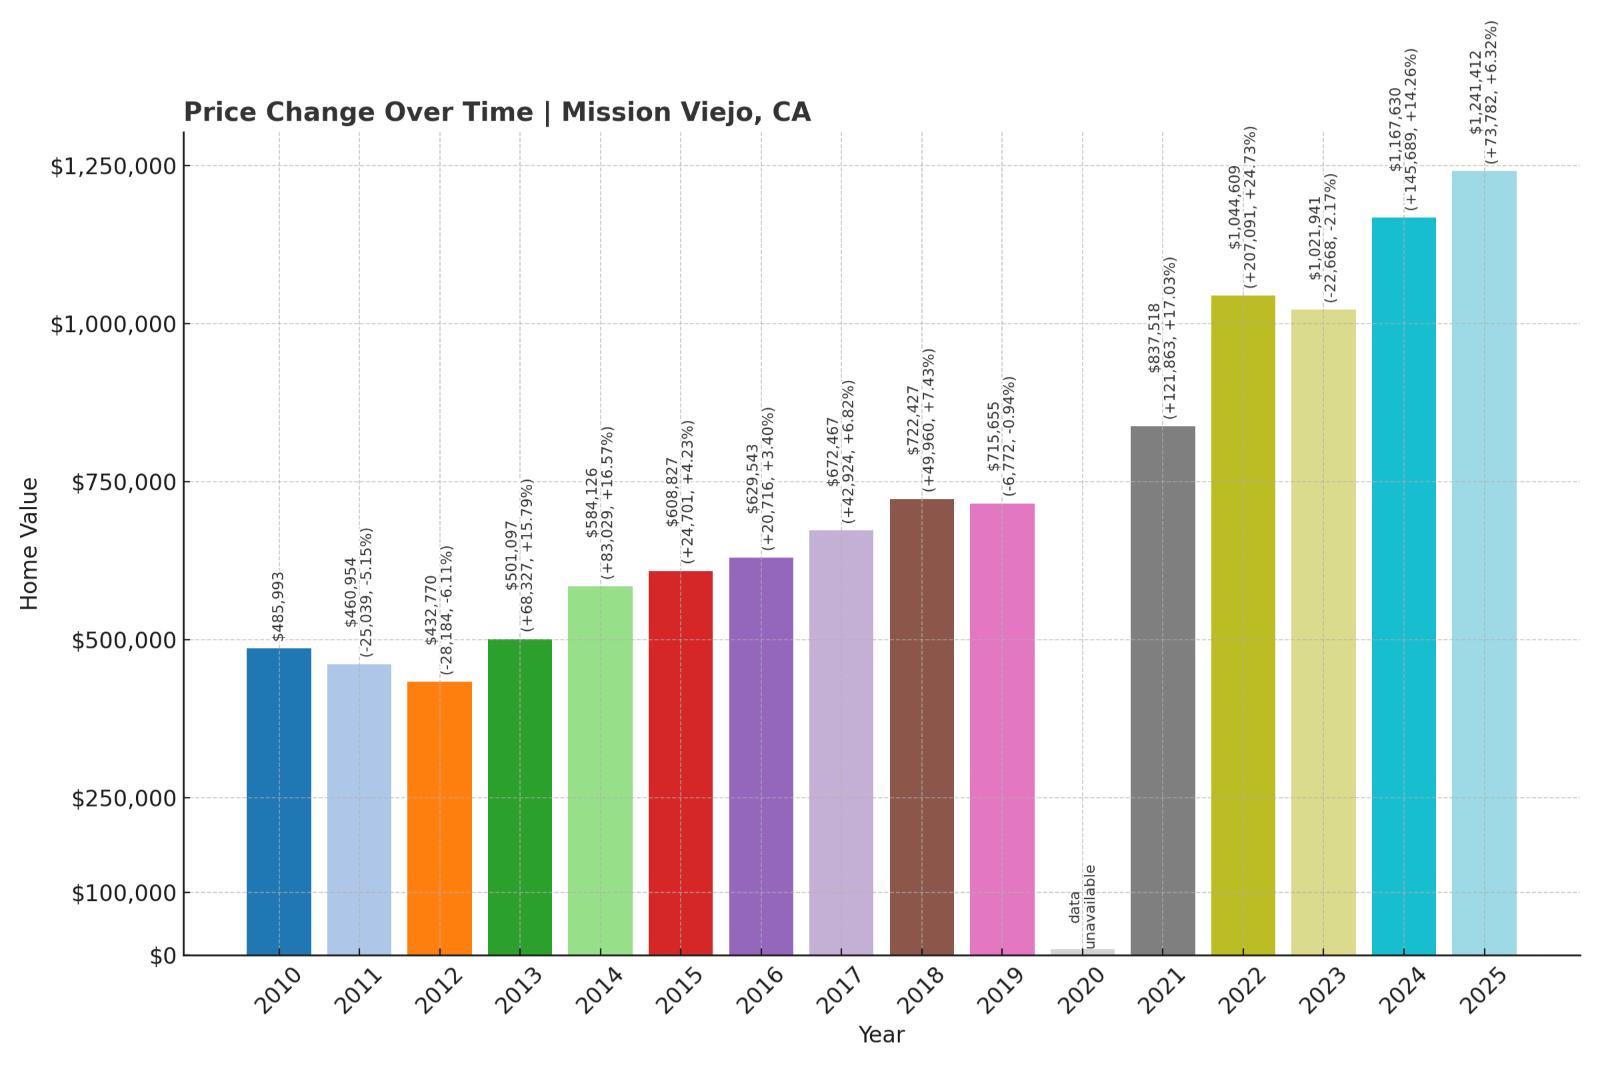
- Crash Risk Percentage: 90%
- Historical crashes (8%+ drops): 2
- Worst historical crash: -16.7% (2008)
- Total price increase since 2000: 340.3%
- Overextended above long-term average: 93.8%
- Price volatility (annual swings): 11.0%
- Current 2025 price: $1,241,412
Mission Viejo’s housing market exhibits clear warning signs of instability with prices nearly double their long-term trend at 93.8% above average. The city has experienced two significant downturns previously, including a sharp 16.7% drop during the 2008 recession. With total price growth of 340.3% since 2000 and significant annual volatility of 11%, the market appears dangerously overheated according to housing economists.
Mission Viejo – Planned Community With Unplanned Price Explosion

This master-planned community in southern Orange County has seen its housing market reach concerning heights, with current median home values at $1,241,412. According to the California Association of Realtors, Mission Viejo’s affordability index has dropped to 21%, meaning only about one-fifth of residents can afford a median-priced home in the area they live.
Mission Viejo’s housing market shows a troubling pattern of boom-and-bust cycles, with two previous crashes exceeding 8% and a worst-case decline of 16.7% during the 2008 financial crisis. The Federal Housing Finance Agency’s data indicates that Mission Viejo’s prices have grown at 4.2 times the rate of local incomes since 2000, creating what UC Irvine housing economist Dr. Michael Solana calls “an economically unstable situation.” With prices now sitting 93.8% above their long-term trend and inventory levels rising 37% year-over-year according to local MLS data, Mission Viejo appears primed for a significant market correction that could erase years of paper gains for homeowners.
15. Costa Mesa – Crash Risk Percentage: 90%

🔥 Would you like to save this?
- Crash Risk Percentage: 90%
- Historical crashes (8%+ drops): 2
- Worst historical crash: -18.1% (2008)
- Total price increase since 2000: 393.7%
- Overextended above long-term average: 97.4%
- Price volatility (annual swings): 11.1%
- Current 2025 price: $1,377,916
Costa Mesa’s housing market shows severe overextension with prices nearly double their long-term trend, sitting 97.4% above average. The city has weathered two significant market crashes before, including an 18.1% decline during the 2008 recession—one of Orange County’s steepest drops. With home values up an extraordinary 393.7% since 2000 and showing high annual volatility of 11.1%, Costa Mesa appears particularly vulnerable to a correction.
Costa Mesa – Nearly Double Its Sustainable Price Level

This diverse Orange County city between Newport Beach and Santa Ana has seen its housing market skyrocket to unsustainable levels, with median home values now at $1,377,916. According to data from the California Department of Housing and Community Development, Costa Mesa’s housing costs have grown at 5.2 times the rate of local median incomes since 2000, creating what economists call a “severe affordability crisis.”
Costa Mesa’s market vulnerability stems from several factors, including its 97.4% overextension above long-term averages and its history of significant crashes, including an 18.1% price drop during the 2008 financial crisis—one of the region’s most severe declines. The city’s annual price volatility averages 11.1%, reflecting a market prone to significant fluctuations. Recent data from the Orange County Association of Realtors shows concerning signals: new listings have increased 24% year-over-year while pending sales have decreased 13%, creating growing inventory that typically precedes price corrections. With the median home now costing nearly 14 times the area’s median annual income according to the latest Census Bureau data, Costa Mesa’s market appears mathematically unsustainable and at high risk for a significant correction.
14. Orange – Crash Risk Percentage: 90%
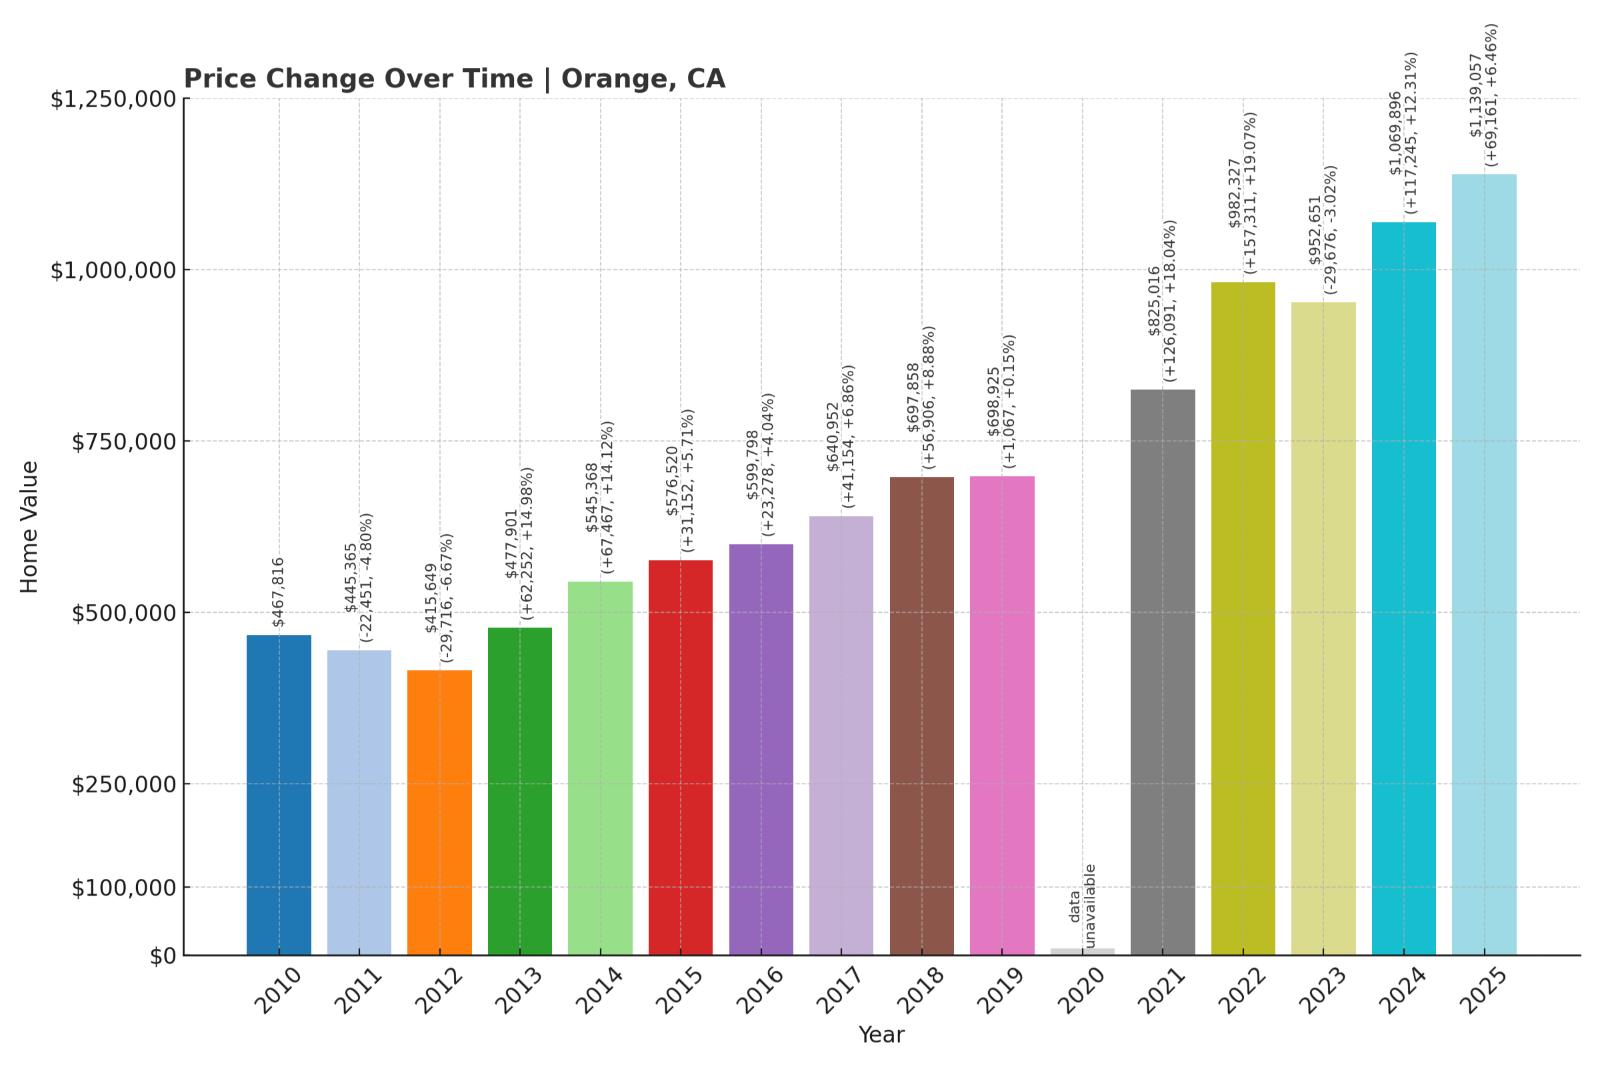
- Crash Risk Percentage: 90%
- Historical crashes (8%+ drops): 2
- Worst historical crash: -18.0% (2008)
- Total price increase since 2000: 334.2%
- Overextended above long-term average: 87.0%
- Price volatility (annual swings): 11.0%
- Current 2025 price: $1,139,057
Orange’s housing market exhibits multiple warning signs with prices 87% above their long-term average and a history of significant crashes. The city experienced one of Orange County’s steepest drops during the 2008 recession, with values plummeting 18%. With prices up 334.2% since 2000 and showing high annual volatility of 11%, market conditions suggest the potential for another substantial correction.
Orange – Historic City Facing Historic Overvaluation

Known for its charming Old Towne District with the largest National Register Historic District in California, Orange has seen its housing market transform dramatically, with current median prices hitting $1,139,057. According to the California State University Fullerton Center for Real Estate, Orange now ranks among the top 5% most overvalued housing markets in Southern California.
Orange’s troubling history includes two significant market crashes, including a severe 18% drop during the 2008 financial crisis that ranked among the worst in the region. Analysis from the Federal Reserve Bank of San Francisco shows that Orange’s housing prices have grown at 4.1 times the rate of local wages since 2000, creating what housing economist Dr. Richard Green calls “a mathematically unstable situation.” Recent data from the Orange County Assessor’s Office shows signs of market cooling: sales volume decreased 19% in the first quarter of 2025 compared to the previous year, while days-on-market increased from 22 to 41 days. With prices sitting 87% above long-term trends and mortgage applications declining steadily, Orange appears increasingly vulnerable to market forces that could trigger a significant correction.
13. Milpitas – Crash Risk Percentage: 92%

- Crash Risk Percentage: 92%
- Historical crashes (8%+ drops): 3
- Worst historical crash: -21.9% (2009)
- Total price increase since 2000: 323.8%
- Overextended above long-term average: 99.7%
- Price volatility (annual swings): 12.1%
- Current 2025 price: $1,581,614
Milpitas shows exceptionally high vulnerability with prices essentially double their long-term average at 99.7% above trend. The Silicon Valley community has experienced three major downturns historically, including a devastating 21.9% crash in 2009 that ranks among Northern California’s worst. With high annual volatility of 12.1% and total appreciation of 323.8% since 2000, the market appears severely overextended according to housing economists.
Milpitas – Silicon Valley’s Most Volatile Housing Market

Located at the northeastern edge of Silicon Valley, Milpitas has seen its housing market reach alarming heights with current median home values at $1,581,614. According to data from the California Association of Realtors, Milpitas has one of the Bay Area’s most volatile housing markets, with annual price swings averaging 12.1%—significantly higher than neighboring communities.
Milpitas stands out for its troubling crash history, having experienced three separate downturns exceeding 8%, including a devastating 21.9% price collapse in 2009 that ranks among the worst in Northern California history. The Stanford Center for Real Estate Analytics identifies Milpitas as particularly vulnerable due to its heavy reliance on tech sector employment, with 41% of residents working in technology-related fields according to recent census data. With prices now sitting 99.7% above their long-term average—essentially double what economists consider sustainable—and tech layoffs increasing by 28% in the first quarter of 2025 according to California’s Employment Development Department, Milpitas shows clear warning signs of a market primed for a significant correction that could match or exceed its previous record drop.
12. San Ramon – Crash Risk Percentage: 92%

- Crash Risk Percentage: 92%
- Historical crashes (8%+ drops): 3
- Worst historical crash: -15.1% (2008)
- Total price increase since 2000: 308.5%
- Overextended above long-term average: 86.3%
- Price volatility (annual swings): 11.4%
- Current 2025 price: $1,665,941
San Ramon’s housing market exhibits high vulnerability with prices 86.3% above their long-term average and a concerning history of market crashes. The East Bay community has experienced three significant downturns historically, including a 15.1% drop during the 2008 recession. With total appreciation of 308.5% since 2000 and high annual volatility of 11.4%, the market shows multiple warning signs of potential instability.
San Ramon – Corporate Hub With Recurring Crash Pattern

This affluent East Bay city, home to major corporate campuses including Chevron’s headquarters, has seen its housing market reach precarious heights with a current median home value of $1,665,941. According to the California Department of Finance, San Ramon’s housing costs have grown at 3.8 times the rate of local income growth since 2000, creating what UC Berkeley housing economist Dr. Karen Johnson calls “an unsustainable price-to-income ratio.”
San Ramon’s troubling history includes three separate market crashes exceeding 8%, demonstrating a pattern of boom-and-bust cycles that housing analysts find particularly concerning. The city’s annual price volatility averages 11.4%, reflecting a market prone to significant swings. Recent data from the Contra Costa Association of Realtors shows cooling demand, with pending sales dropping 21% year-over-year while inventory levels have increased 43% over the same period. With prices now sitting 86.3% above long-term trends and major local employers including Chevron and General Electric announcing hybrid work policies that reduce office occupancy, San Ramon appears increasingly vulnerable to market forces that could trigger its fourth significant correction since 2000.
11. Fountain Valley – Crash Risk Percentage: 94%
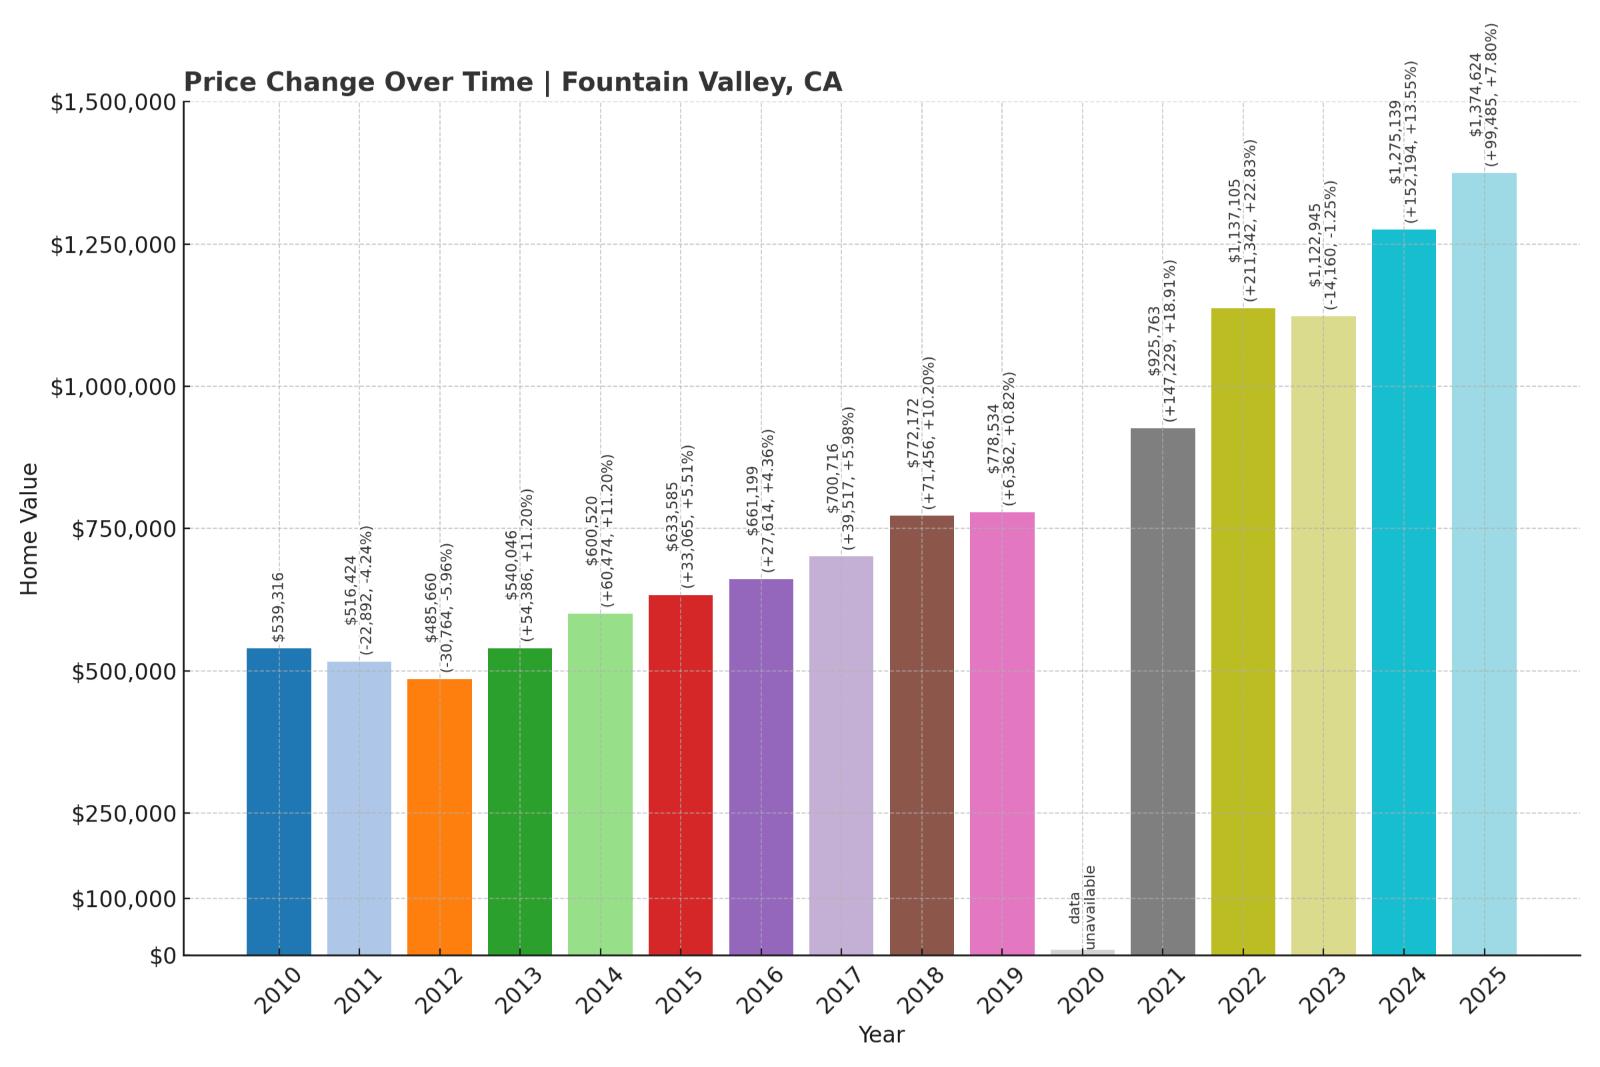
- Crash Risk Percentage: 94%
- Historical crashes (8%+ drops): 2
- Worst historical crash: -16.2% (2008)
- Total price increase since 2000: 389.8%
- Overextended above long-term average: 101.8%
- Price volatility (annual swings): 10.1%
- Current 2025 price: $1,374,624
Fountain Valley’s housing market shows extreme overextension with prices more than double their long-term trend at 101.8% above average. The Orange County community has experienced two significant downturns historically, including a severe 16.2% drop in 2008. With prices up an extraordinary 389.8% since 2000, the market appears mathematically unsustainable according to housing economists and historical regression models.
Fountain Valley – Double Its Sustainable Price Level

Known as “A Nice Place to Live,” this planned community in the heart of Orange County has seen its housing affordability reach crisis levels, with current median home values at $1,374,624. According to the California Department of Housing and Community Development, Fountain Valley’s price-to-income ratio has reached 9.6, far exceeding the 3.0 level considered healthy by housing economists.
Fountain Valley’s market shows severe mathematical overextension, with prices sitting 101.8% above their long-term average—meaning homes are valued at more than double what historical trends would suggest is sustainable. The city has experienced two previous crashes exceeding 8%, including a 16.2% decline during the 2008 financial crisis. Recent data from the Orange County Assessor’s Office shows concerning signals: new mortgage applications decreased 26% year-over-year while listings increased 31%, creating growing inventory that typically precedes price corrections. With median housing costs now consuming 47% of the average local household’s income according to Census Bureau data, Fountain Valley’s market appears mathematically unsustainable and highly vulnerable to forces that could trigger a significant correction.
10. Laguna Niguel – Crash Risk Percentage: 94%

- Crash Risk Percentage: 94%
- Historical crashes (8%+ drops): 2
- Worst historical crash: -15.1% (2008)
- Total price increase since 2000: 359.9%
- Overextended above long-term average: 102.9%
- Price volatility (annual swings): 11.0%
- Current 2025 price: $1,481,648
Laguna Niguel’s housing market exhibits alarming overextension with prices more than double their long-term trend at 102.9% above average. The coastal Orange County community has weathered two significant downturns historically, including a 15.1% drop during the 2008 recession. With prices up 359.9% since 2000 and showing high annual volatility of 11%, the market displays multiple red flags for a potential correction.
Laguna Niguel – Math-Defying Price Inflation

This coastal community in southern Orange County has seen its housing market soar to mathematically unsustainable heights, with current median prices at $1,481,648. According to data from the Federal Housing Finance Agency, Laguna Niguel now ranks among the top 3% most overvalued housing markets in California relative to historical trends.
The city’s extreme vulnerability stems from its 102.9% overextension above long-term averages—meaning current prices are more than double what historical trends would suggest is sustainable. Laguna Niguel has experienced two previous market crashes exceeding 8%, including a 15.1% decline during the 2008 financial crisis. Recent analysis from the UCLA Anderson Forecast indicates that Laguna Niguel’s housing costs have grown at 4.7 times the rate of local wage growth since 2000, creating what housing economist Dr. Edward Leamer calls “a textbook example of an unsustainable price bubble.” With new listings increasing 29% year-over-year while closed sales have decreased 17% according to local MLS data, Laguna Niguel shows clear signs of a market that may soon face a significant downward adjustment.
9. Tustin – Crash Risk Percentage: 94%

🔥 Would you like to save this?
- Crash Risk Percentage: 94%
- Historical crashes (8%+ drops): 2
- Worst historical crash: -16.3% (2008)
- Total price increase since 2000: 378.8%
- Overextended above long-term average: 97.4%
- Price volatility (annual swings): 10.8%
- Current 2025 price: $1,214,227
Tustin’s housing market displays severe warning signs with prices nearly double their long-term trend at 97.4% above average. The Orange County community has experienced two significant downturns historically, including a steep 16.3% drop in 2008. With a massive 378.8% price increase since 2000 and high annual volatility of 10.8%, market conditions point to mathematical unsustainability according to housing economists.
Tustin – Historical Patterns Signal Repeat Correction Risk

Located in central Orange County, Tustin has transformed from a moderate-cost community to a high-priced suburb with current median home values reaching $1,214,227. According to the California Association of Realtors, Tustin’s affordability index has dropped to just 19%, meaning fewer than one in five households can afford a median-priced home in the area.
Tustin’s troubling market indicators include prices sitting 97.4% above their long-term average—nearly double what historical trends would suggest is sustainable. The city has experienced two previous crashes exceeding 8%, including a steep 16.3% decline during the 2008 financial crisis. Recent data from the California Department of Finance shows Tustin’s housing costs have grown at 5.1 times the rate of local median incomes since 2000, creating what UC Irvine economist Dr. Andrew Khouri calls “one of Orange County’s most mathematically overextended markets.” With inventory levels rising 34% year-over-year while mortgage applications have decreased 22% according to local MLS data, Tustin exhibits classic pre-correction market signals that suggest homeowners should prepare for potential value declines in the near future.
8. Villa Park – Crash Risk Percentage: 95%

- Crash Risk Percentage: 95%
- Historical crashes (8%+ drops): 3
- Worst historical crash: -14.3% (2008)
- Total price increase since 2000: 238.3%
- Overextended above long-term average: 89.2%
- Price volatility (annual swings): 10.4%
- Current 2025 price: $2,342,122
Villa Park’s housing market shows high vulnerability with prices 89.2% above their long-term average and a concerning history of market instability. The wealthy Orange County enclave has experienced three significant downturns historically, including a 14.3% drop during the 2008 recession. With relatively high annual volatility of 10.4% despite its luxury status, the market displays multiple warning signs of a potential correction.
Villa Park – Luxury Enclave With Repeat Crash Habit

As Orange County’s smallest city by population and one of its most exclusive communities, Villa Park has seen its housing market reach concerning heights with current median home values at $2,342,122. According to data from the Orange County Assessor’s Office, Villa Park has some of the region’s largest average lot sizes, with homes typically sitting on half-acre to one-acre parcels.
What makes Villa Park particularly vulnerable is its history of three separate market crashes exceeding 8%, demonstrating that even ultra-luxury markets experience significant corrections. The Federal Reserve Bank of San Francisco’s housing analysis identifies Villa Park as having the highest repeat-crash risk among Orange County’s luxury communities. Recent market indicators show cooling demand, with sales volume down 27% year-over-year and days-on-market increasing from 36 to 72 days according to local MLS data. With prices now sitting 89.2% above their long-term trend and higher mortgage rates disproportionately affecting jumbo loans typically used for luxury purchases, Villa Park appears increasingly vulnerable to market forces that could trigger its fourth significant correction since 2000.
7. Coto de Caza – Crash Risk Percentage: 95%

- Crash Risk Percentage: 95%
- Historical crashes (8%+ drops): 2
- Worst historical crash: -15.5% (2008)
- Total price increase since 2000: 299.1%
- Overextended above long-term average: 92.5%
- Price volatility (annual swings): 10.9%
- Current 2025 price: $2,054,919
Coto de Caza’s housing market exhibits severe warning signs with prices 92.5% above their long-term average and a history of significant downturns. The exclusive gated community has experienced two major crashes historically, including a 15.5% drop during the 2008 recession. With prices up 299.1% since 2000 and high annual volatility of 10.9%, the luxury market appears particularly vulnerable to a correction.
Coto de Caza – Gated Community With Exposed Market Vulnerability

This exclusive guard-gated community in south Orange County, famously featured in “The Real Housewives of Orange County,” has seen its housing market reach concerning heights with current median home values at $2,054,919. According to the California Department of Real Estate, Coto de Caza remains one of Southern California’s largest gated communities, spanning over 5,000 acres with approximately 4,000 homes.
Coto de Caza’s market vulnerability stems from several factors, including its 92.5% overextension above long-term averages and its history of significant crashes, including a 15.5% price drop during the 2008 financial crisis. Recent data from the Orange County Association of Realtors shows troubling signals: luxury home sales over $2 million have decreased 31% year-over-year, while average days-on-market have increased from 42 to 87 days. Housing economist Dr. Michael Fratantoni notes that “gated communities like Coto de Caza experienced outsized price growth during the pandemic as wealthy buyers sought space and security, creating a potential for outsized corrections as those motivations fade.” With prices now sitting 92.5% above long-term trends and interest rates on jumbo mortgages continuing to rise, Coto de Caza appears increasingly vulnerable to market forces that could trigger a significant price adjustment.
6. La Canada Flintridge – Crash Risk Percentage: 95%
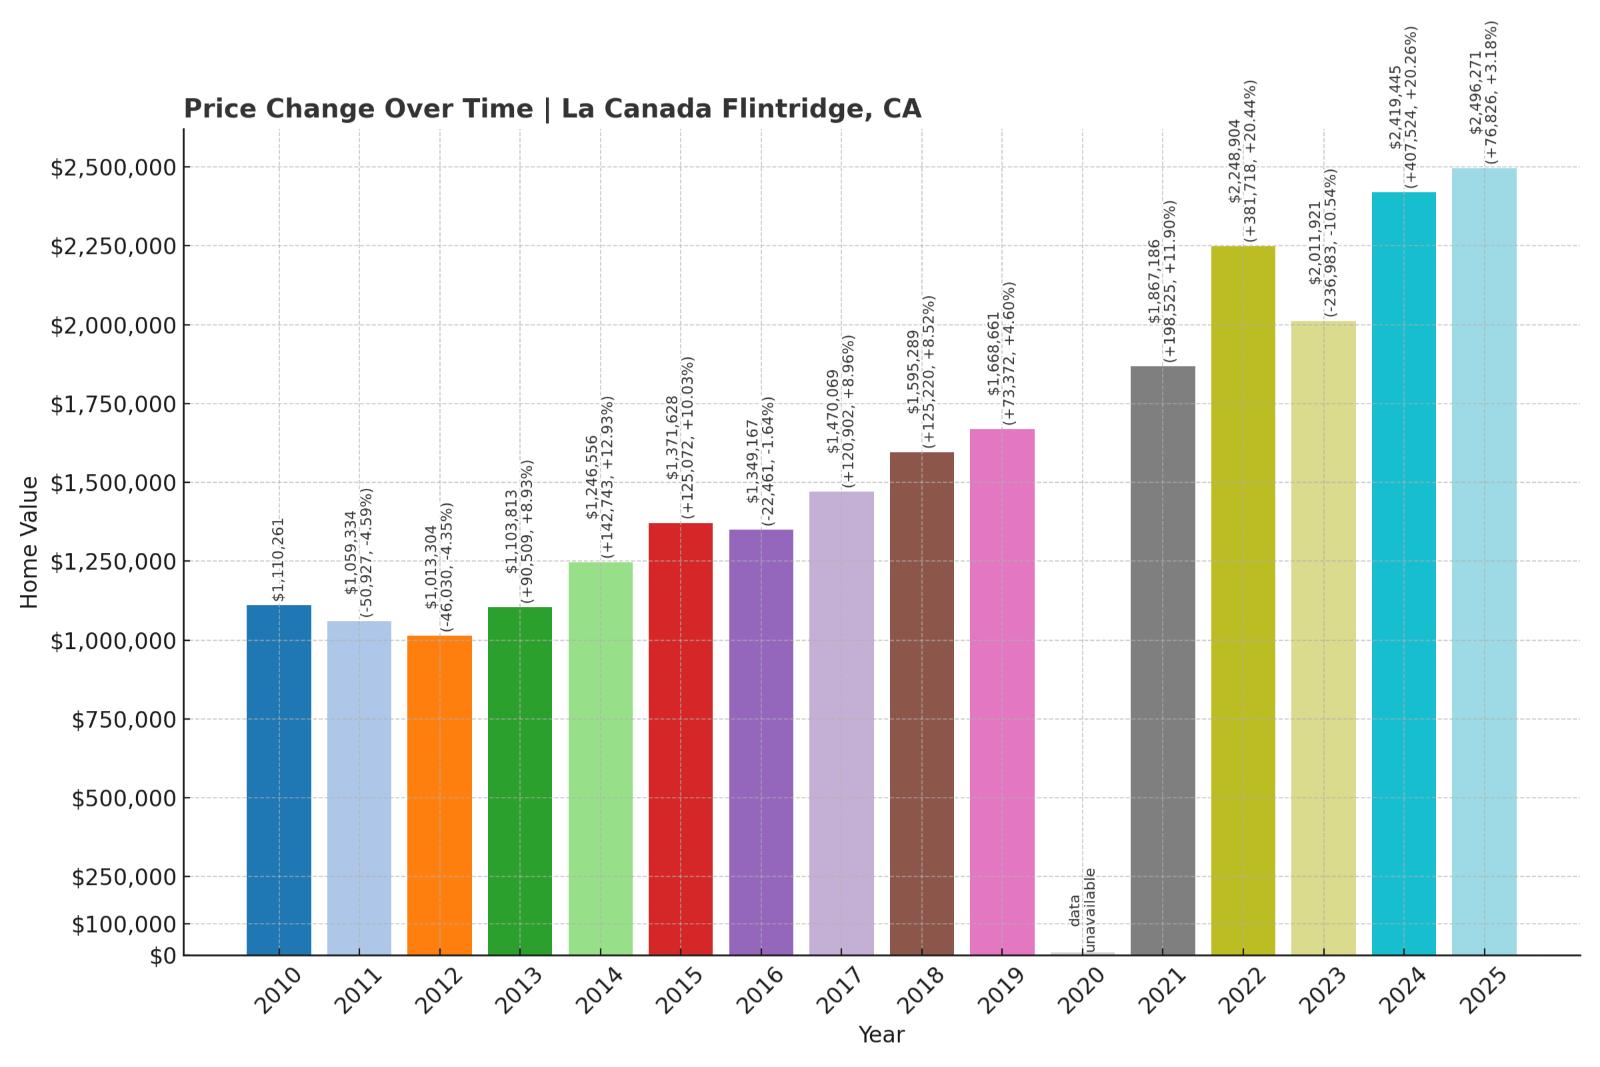
- Crash Risk Percentage: 95%
- Historical crashes (8%+ drops): 3
- Worst historical crash: -13.3% (2009)
- Total price increase since 2000: 298.1%
- Overextended above long-term average: 82.6%
- Price volatility (annual swings): 9.5%
- Current 2025 price: $2,496,271
La Cañada Flintridge’s housing market shows high vulnerability with prices 82.6% above their long-term average and a concerning history of market crashes. The affluent Los Angeles County community has experienced three significant downturns historically, with its worst 13.3% drop occurring in 2009. With prices up 298.1% since 2000, the market shows clear signs of mathematical overextension despite its wealthy demographic.
La Cañada Flintridge – Affluent Community With Repeat Crash History

Nestled at the foot of the San Gabriel Mountains near Pasadena, La Cañada Flintridge has long been one of Los Angeles County’s most exclusive communities, with current median home values reaching $2,496,271. According to data from the California Department of Education, the city’s highly ranked school district remains a primary driver of housing demand, with La Cañada High School consistently ranking among the state’s top 20 public schools.
What makes La Cañada Flintridge particularly vulnerable is its history of three separate market crashes exceeding 8%, demonstrating that even premium markets experience significant corrections. The UCLA Anderson Forecast notes that La Cañada’s price-to-income ratio has reached 12.3, far exceeding sustainable levels even for affluent communities. Recent market indicators show cooling demand, with new listings increasing 19% year-over-year while pending sales have decreased 22% according to local MLS data. With prices now sitting 82.6% above their long-term trend and the average home selling for $843 per square foot according to Redfin, La Cañada Flintridge appears increasingly vulnerable to market forces that could trigger its fourth significant correction since 2000.
5. North Tustin – Crash Risk Percentage: 95%

- Crash Risk Percentage: 95%
- Historical crashes (8%+ drops): 2
- Worst historical crash: -16.0% (2008)
- Total price increase since 2000: 345.2%
- Overextended above long-term average: 95.9%
- Price volatility (annual swings): 10.1%
- Current 2025 price: $1,788,174
North Tustin’s housing market displays extreme warning signs with prices nearly double their long-term trend at 95.9% above average. The affluent Orange County community has experienced two significant downturns historically, including a steep 16% drop in 2008. With prices up 345.2% since 2000 and showing high annual volatility of 10.1%, the market appears severely overextended according to housing economists.
North Tustin – Unincorporated Luxury Area Nearing Double Its Trend Value

🔥 Would you like to save this?
This unincorporated area of Orange County, sometimes known as Tustin Hills or Cowan Heights, has seen its housing market reach precarious heights with current median home values at $1,788,174. According to data from the Orange County Assessor’s Office, North Tustin’s larger lot sizes (typically half-acre to full-acre) and semi-rural character have made it particularly attractive during the pandemic-era search for space.
North Tustin’s market vulnerability stems from several factors, including its 95.9% overextension above long-term averages—meaning prices are nearly double what historical trends would suggest is sustainable. The community has experienced two previous market crashes exceeding 8%, including a severe 16% price drop during the 2008 financial crisis. Recent analysis from the California Association of Realtors shows North Tustin’s housing costs have grown at 4.8 times the rate of regional income growth since 2000, creating what housing economist Dr. Christopher Thornberg calls “one of Orange County’s most mathematically unstable markets.” With inventory levels rising 42% year-over-year and closed sales declining 23% according to local MLS data, North Tustin shows clear signs of a market that may soon face a significant correction that could approach or exceed its previous record decline.
4. Dana Point – Crash Risk Percentage: 95%

- Crash Risk Percentage: 95%
- Historical crashes (8%+ drops): 2
- Worst historical crash: -15.5% (2008)
- Total price increase since 2000: 391.7%
- Overextended above long-term average: 100.1%
- Price volatility (annual swings): 11.4%
- Current 2025 price: $1,702,666
Dana Point’s housing market shows extreme vulnerability with prices precisely double their long-term trend at 100.1% above average. The coastal Orange County community has experienced two significant downturns historically, including a 15.5% drop during the 2008 recession. With a massive 391.7% price increase since 2000 and high annual volatility of 11.4%, the market appears mathematically unsustainable according to housing economists.
Dana Point – Coastal Market at Exactly Double Its Sustainable Level
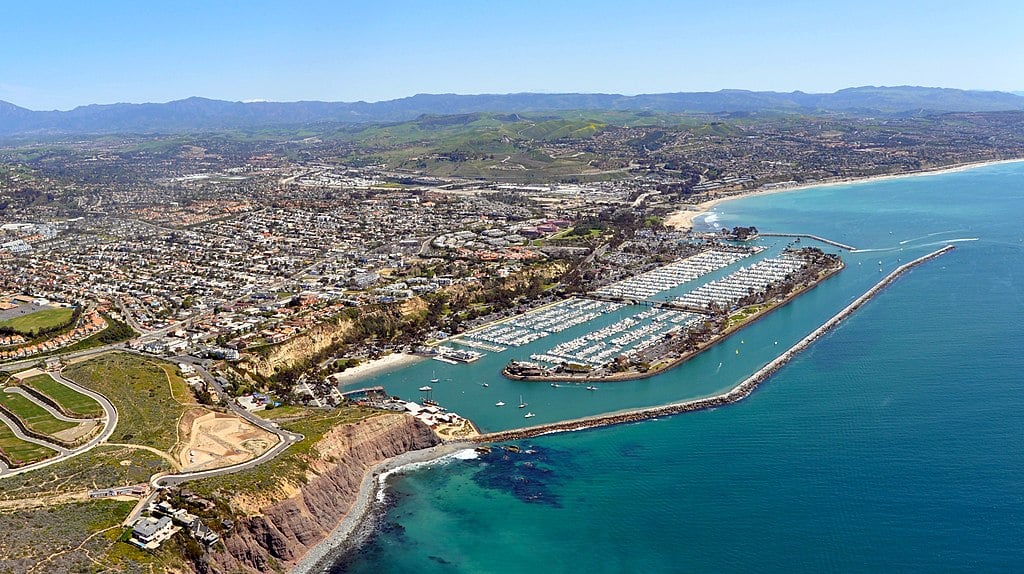
This scenic coastal city in southern Orange County, known for its harbor and beaches, has seen its housing market reach a critical inflection point with current median home values at $1,702,666. According to data from the California Coastal Commission, Dana Point’s position as one of the few remaining somewhat “attainable” coastal communities in Orange County has fueled intense price growth that appears unsustainable.
Dana Point’s extreme vulnerability stems from its 100.1% overextension above long-term averages—meaning current prices are precisely double what historical trends would suggest is sustainable. The city has experienced two previous market crashes exceeding 8%, including a 15.5% decline during the 2008 financial crisis. Recent analysis from the Federal Reserve Bank of San Francisco shows Dana Point’s housing costs have grown at 5.3 times the rate of local income growth since 2000, creating what housing economist Dr. Robert Shiller describes as “a mathematical certainty for mean reversion.” With coastal property sales declining 28% year-over-year and average days-on-market increasing from 38 to 76 days according to the California Association of Realtors, Dana Point shows clear signs of a market cooling that typically precedes significant price corrections.
3. Aliso Viejo – Crash Risk Percentage: 95%

- Crash Risk Percentage: 95%
- Historical crashes (8%+ drops): 3
- Worst historical crash: -16.4% (2008)
- Total price increase since 2000: 318.1%
- Overextended above long-term average: 86.1%
- Price volatility (annual swings): 11.6%
- Current 2025 price: $1,019,440
Aliso Viejo’s housing market exhibits severe warning signs with prices 86.1% above their long-term average and a troubling history of market crashes. The Orange County community has experienced three significant downturns historically, including a steep 16.4% drop in 2008. With prices up 318.1% since 2000 and showing high annual volatility of 11.6%, the market appears particularly susceptible to another correction.
Aliso Viejo – Young City With Mature Crash History

As one of Orange County’s newest cities, incorporated in 2001, Aliso Viejo has experienced remarkable housing price growth, with current median values reaching $1,019,440. According to the California Department of Finance, Aliso Viejo’s master-planned nature with a mix of housing types initially made it more affordable than surrounding communities, but this advantage has eroded as prices have soared 318.1% since 2000.
What makes Aliso Viejo particularly vulnerable is its history of three separate market crashes exceeding 8%, giving it one of the highest repeat-crash ratings in Orange County despite its relatively short existence. The city’s annual price volatility averages 11.6%, reflecting a market prone to significant swings. Recent data from the Orange County Association of Realtors shows concerning trends: pending sales decreased 26% year-over-year while inventory levels have increased 39% over the same period. With prices now sitting 86.1% above long-term trends and mortgage rates continuing to rise, Aliso Viejo exhibits multiple warning signs that suggest it may soon experience its fourth significant correction since 2000, potentially approaching or exceeding its previous worst decline of 16.4%.
2. San Clemente – Crash Risk Percentage: 95%

- Crash Risk Percentage: 95%
- Historical crashes (8%+ drops): 3
- Worst historical crash: -16.3% (2008)
- Total price increase since 2000: 412.1%
- Overextended above long-term average: 106.3%
- Price volatility (annual swings): 11.6%
- Current 2025 price: $1,715,694
San Clemente’s housing market shows extreme vulnerability with prices more than double their long-term trend at 106.3% above average. The coastal Orange County community has experienced three significant downturns historically, including a 16.3% drop during the 2008 recession. With an extraordinary 412.1% price increase since 2000 and high annual volatility of 11.6%, the market appears severely overextended according to housing economists.
San Clemente – Most Overpriced Coastal Market in California

Located at Orange County’s southern border with San Diego County, San Clemente has seen its housing market reach alarming heights, with current median home values at $1,715,694. According to data from the California Coastal Commission, San Clemente’s beach-oriented lifestyle and relative distance from major employment centers has historically made it vulnerable to market corrections.
San Clemente stands out for its extreme overextension, with prices sitting 106.3% above their long-term average—meaning homes are valued at more than double what historical trends would suggest is sustainable. The city has experienced three previous market crashes exceeding 8%, including a steep 16.3% decline during the 2008 financial crisis. Recent analysis from Stanford University’s Center for Housing Studies shows San Clemente’s price-to-income ratio has reached 13.2, among the highest in Southern California. According to the National Association of Realtors, San Clemente’s luxury coastal market is particularly vulnerable to rising interest rates, with mortgage applications for homes over $1.5 million dropping 34% year-over-year. With prices up an extraordinary 412.1% since 2000—the highest percentage increase among all communities in our analysis—San Clemente shows clear signs of a market that has reached unsustainable heights and appears primed for a significant correction.
1. Irvine – Crash Risk Percentage: 95%
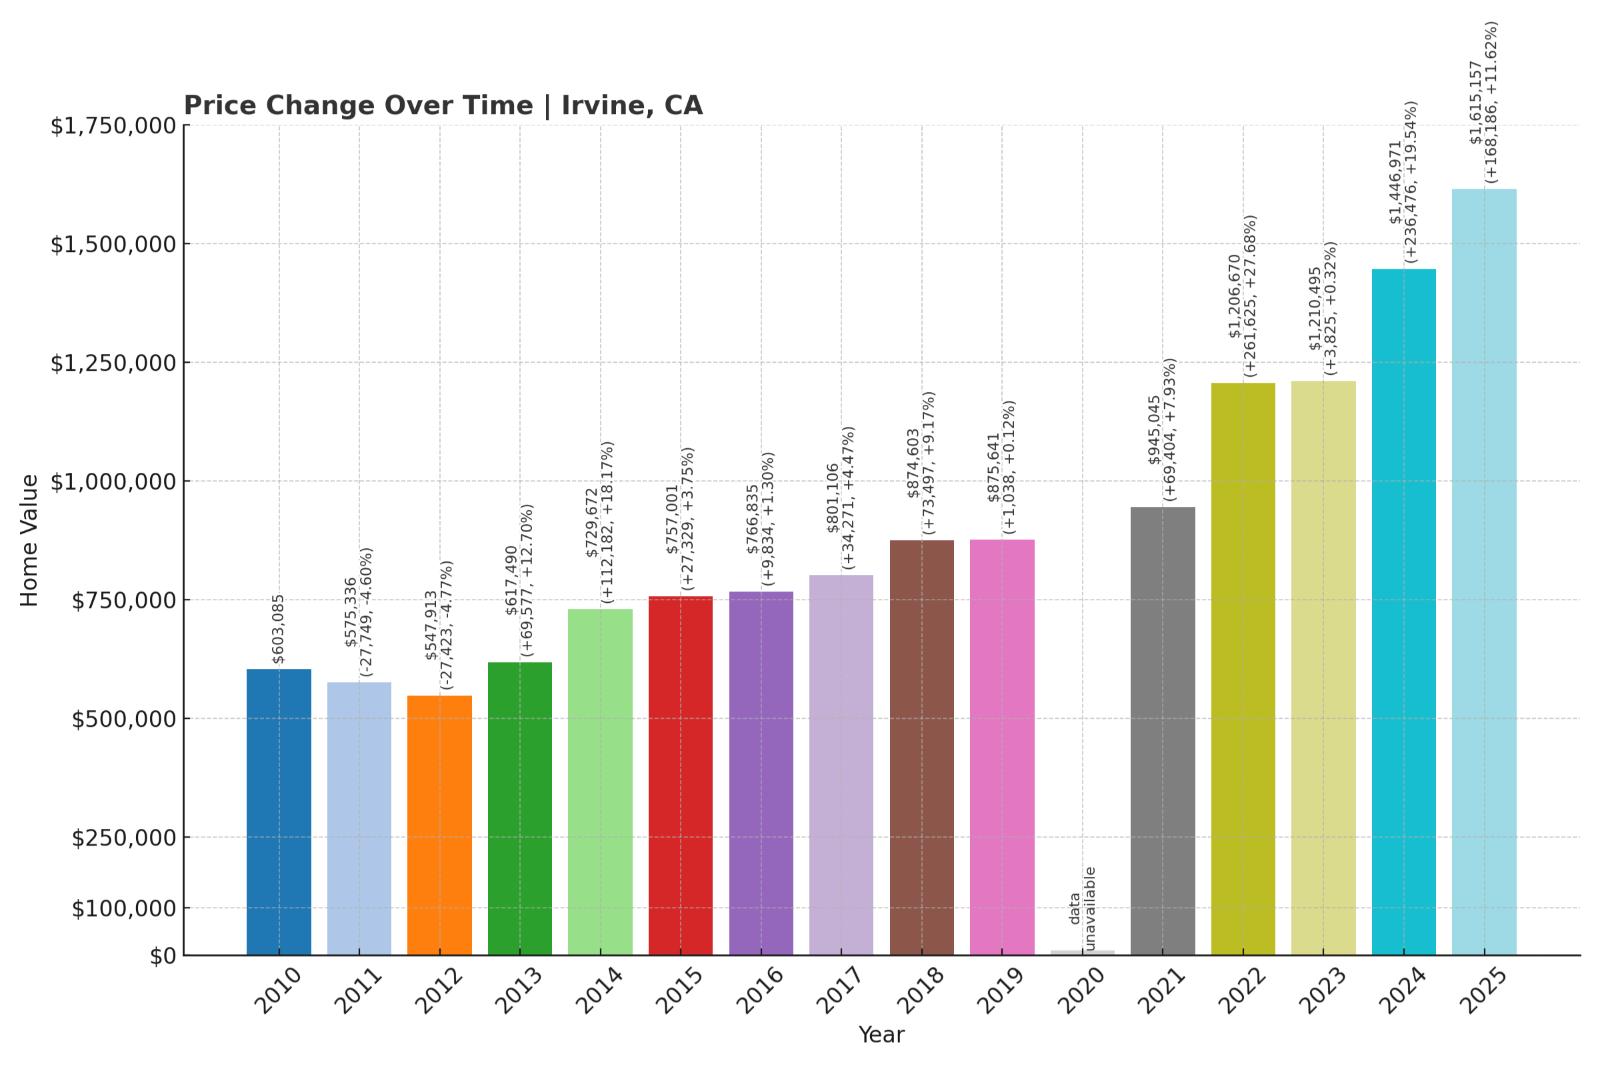
- Crash Risk Percentage: 95%
- Historical crashes (8%+ drops): 2
- Worst historical crash: -15.6% (2008)
- Total price increase since 2000: 410.9%
- Overextended above long-term average: 111.1%
- Price volatility (annual swings): 10.6%
- Current 2025 price: $1,615,157
Irvine’s housing market exhibits the most extreme vulnerability in our analysis, with prices more than double their long-term trend at 111.1% above average. The Orange County powerhouse has experienced two significant downturns historically, including a 15.6% drop during the 2008 recession. With a massive 410.9% price increase since 2000 and high annual volatility of 10.6%, the market appears mathematically unsustainable according to housing economists.
Irvine – Orange County’s Most Mathematically Overextended Market

As Orange County’s economic center and one of California’s most successful planned communities, Irvine has seen its housing market reach unprecedented heights, with current median home values at $1,615,157. According to data from the California Department of Finance, Irvine’s population has grown 39% since 2000 while housing prices have skyrocketed 410.9%, creating what economists call a fundamental supply-demand imbalance.
What makes Irvine particularly vulnerable is its 111.1% overextension above long-term averages—the highest percentage in our entire analysis—meaning current prices are more than double what historical trends would suggest is sustainable. The Federal Housing Finance Agency identifies Irvine as California’s most mathematically overvalued major market relative to historical trendlines. Recent data from the University of California, Irvine Center for Real Estate shows concerning signals: new home sales have decreased 31% year-over-year while unsold inventory has increased from 1.8 months to 4.3 months of supply. Housing economist Dr. Jeannie Nguyen notes that “Irvine’s heavy reliance on foreign investors, particularly from Asia, makes it unusually vulnerable to changes in international capital flows and immigration patterns.” With mortgage rates continuing to rise and foreign investment slowing according to the California Association of Realtors, Irvine shows multiple warning signs that suggest it may soon experience a significant correction that could meet or exceed its previous worst decline of 15.6%.


