
🔥 Would you like to save this?
Dig into the latest Zillow Home Value Index data, and you’ll find 19 Indiana towns where buying a home is still a financially sane decision in 2025. As prices soar in other parts of the state, these communities remain rare pockets of affordability—ideal for first-time buyers, budget-conscious movers, or anyone tired of sky-high listings. Some towns have seen slow, steady growth; others are just beginning to recover from past dips. Either way, they offer real opportunity without the sticker shock.
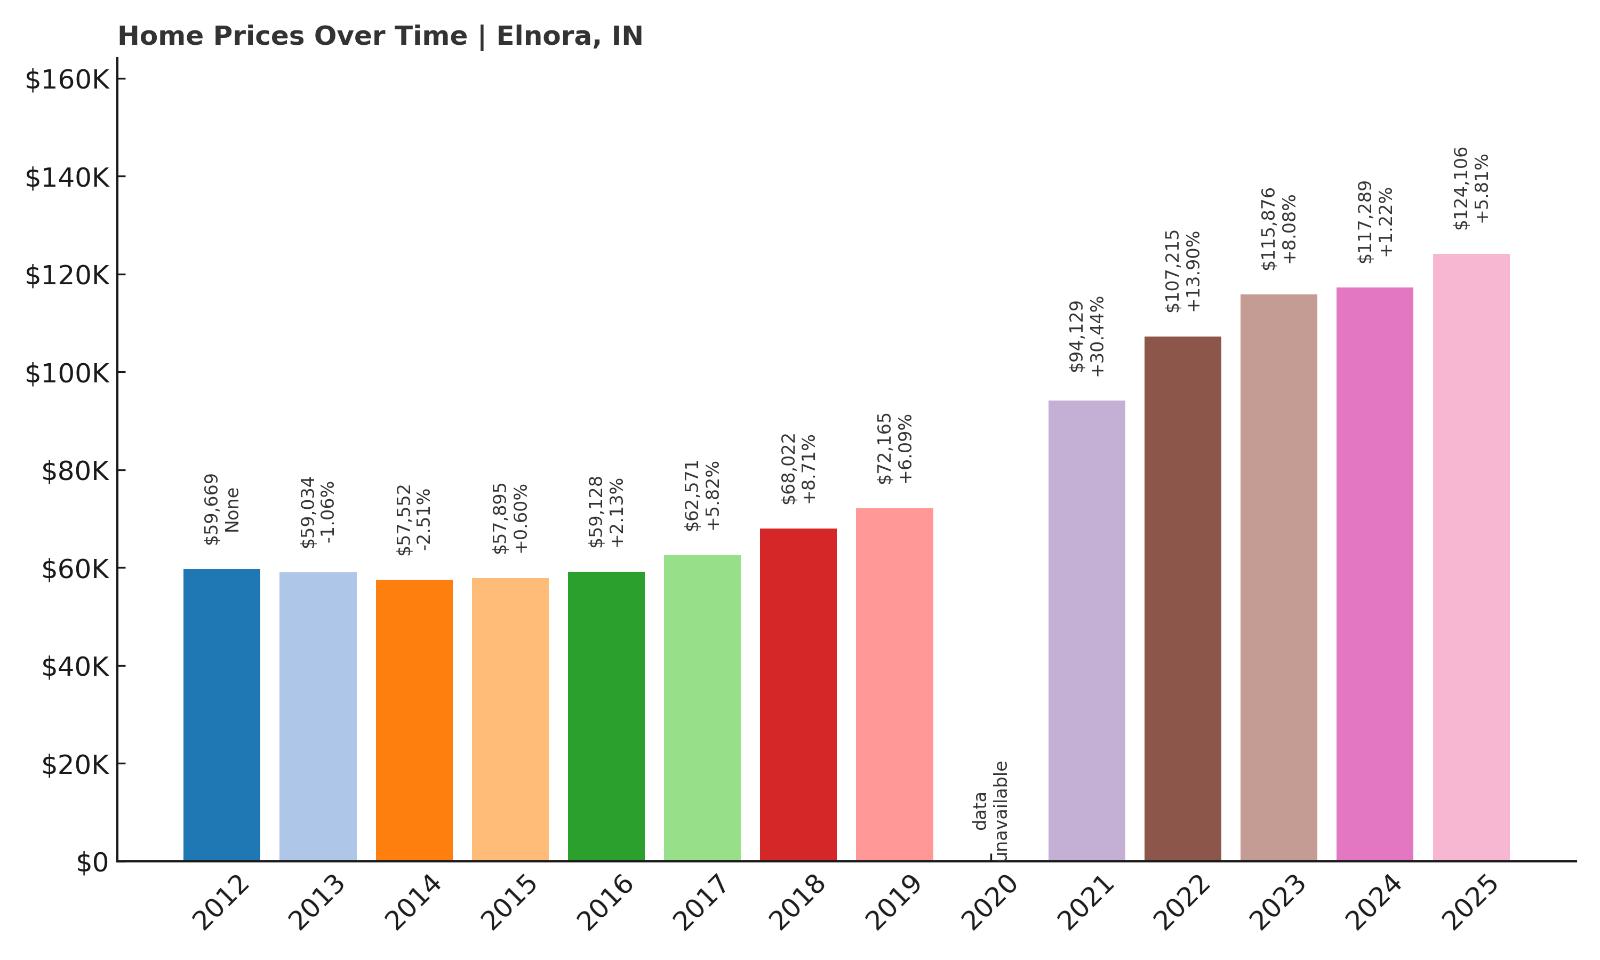
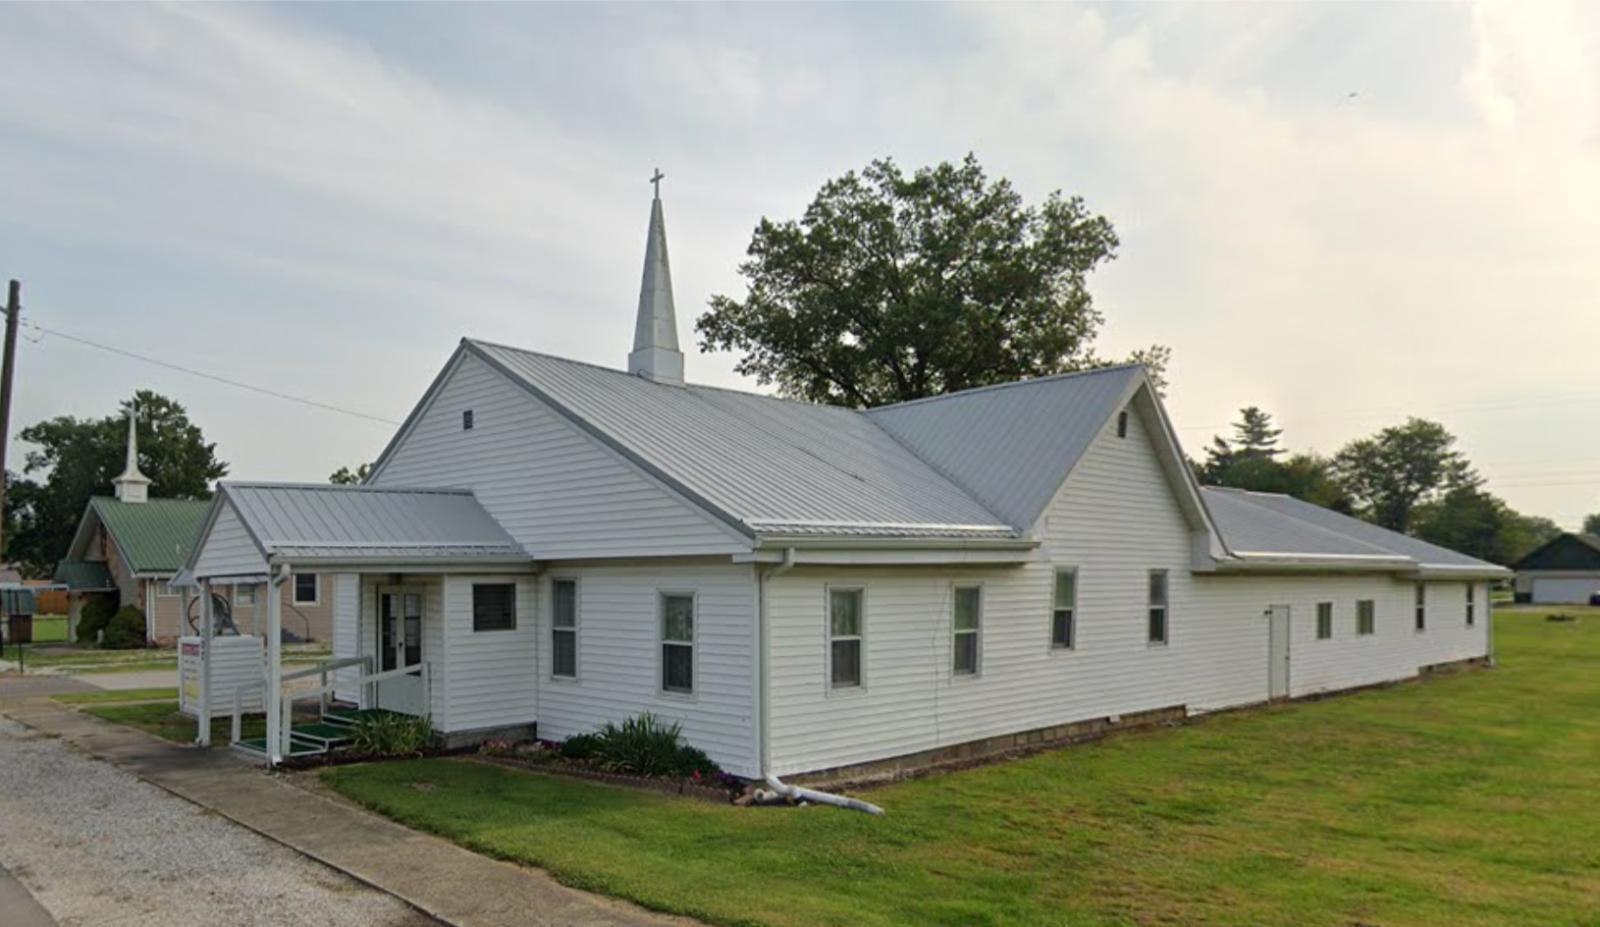
19. Elnora – 108% Home Price Increase Since 2012
- 2010: N/A
- 2011: N/A
- 2012: $59,669
- 2013: $59,034 ($-635, -1.06% from previous year)
- 2014: $57,552 ($-1,482, -2.51% from previous year)
- 2015: $57,895 (+$343, +0.60% from previous year)
- 2016: $59,128 (+$1,233, +2.13% from previous year)
- 2017: $62,571 (+$3,444, +5.82% from previous year)
- 2018: $68,022 (+$5,450, +8.71% from previous year)
- 2019: $72,165 (+$4,144, +6.09% from previous year)
- 2020: N/A
- 2021: $94,129 (+$21,964, +30.44% from previous year)
- 2022: $107,215 (+$13,086, +13.90% from previous year)
- 2023: $115,876 (+$8,661, +8.08% from previous year)
- 2024: $117,289 (+$1,412, +1.22% from previous year)
- 2025: $124,106 (+$6,818, +5.81% from previous year)
Elnora has seen more than a 100% increase in home values since 2012, though it still remains one of the most affordable markets in the state. The biggest jump came in 2021, when values surged over 30% in a single year. Even after that leap, prices have continued rising at a steady pace, pushing the April 2025 median to just over $124,000.
In order to come up with the very specific design ideas, we create most designs with the assistance of state-of-the-art AI interior design software. Also, assume links that take you off the site are affiliate links such as links to Amazon. this means we may earn a commission if you buy something.
Elnora – Steady Climb in a Small Rural Community
Located in Daviess County in southwestern Indiana, Elnora is a small town with a strong agricultural presence and a quiet lifestyle. The town’s affordability makes it appealing to retirees and working families alike. Its housing stock consists mostly of modest single-family homes, with few new builds, which may help explain the gradual but consistent price growth. The local school system and proximity to State Road 57 also keep Elnora connected to regional hubs like Washington and Bloomfield.
Despite being rural, the area has benefited from broader economic growth in southern Indiana. It’s close to the Crane Naval Surface Warfare Center and the I-69 corridor, which has improved accessibility. Real estate remains budget-friendly, but price trends suggest that might not be the case for long. Elnora is quietly gaining value while keeping a small-town charm that’s increasingly hard to find.
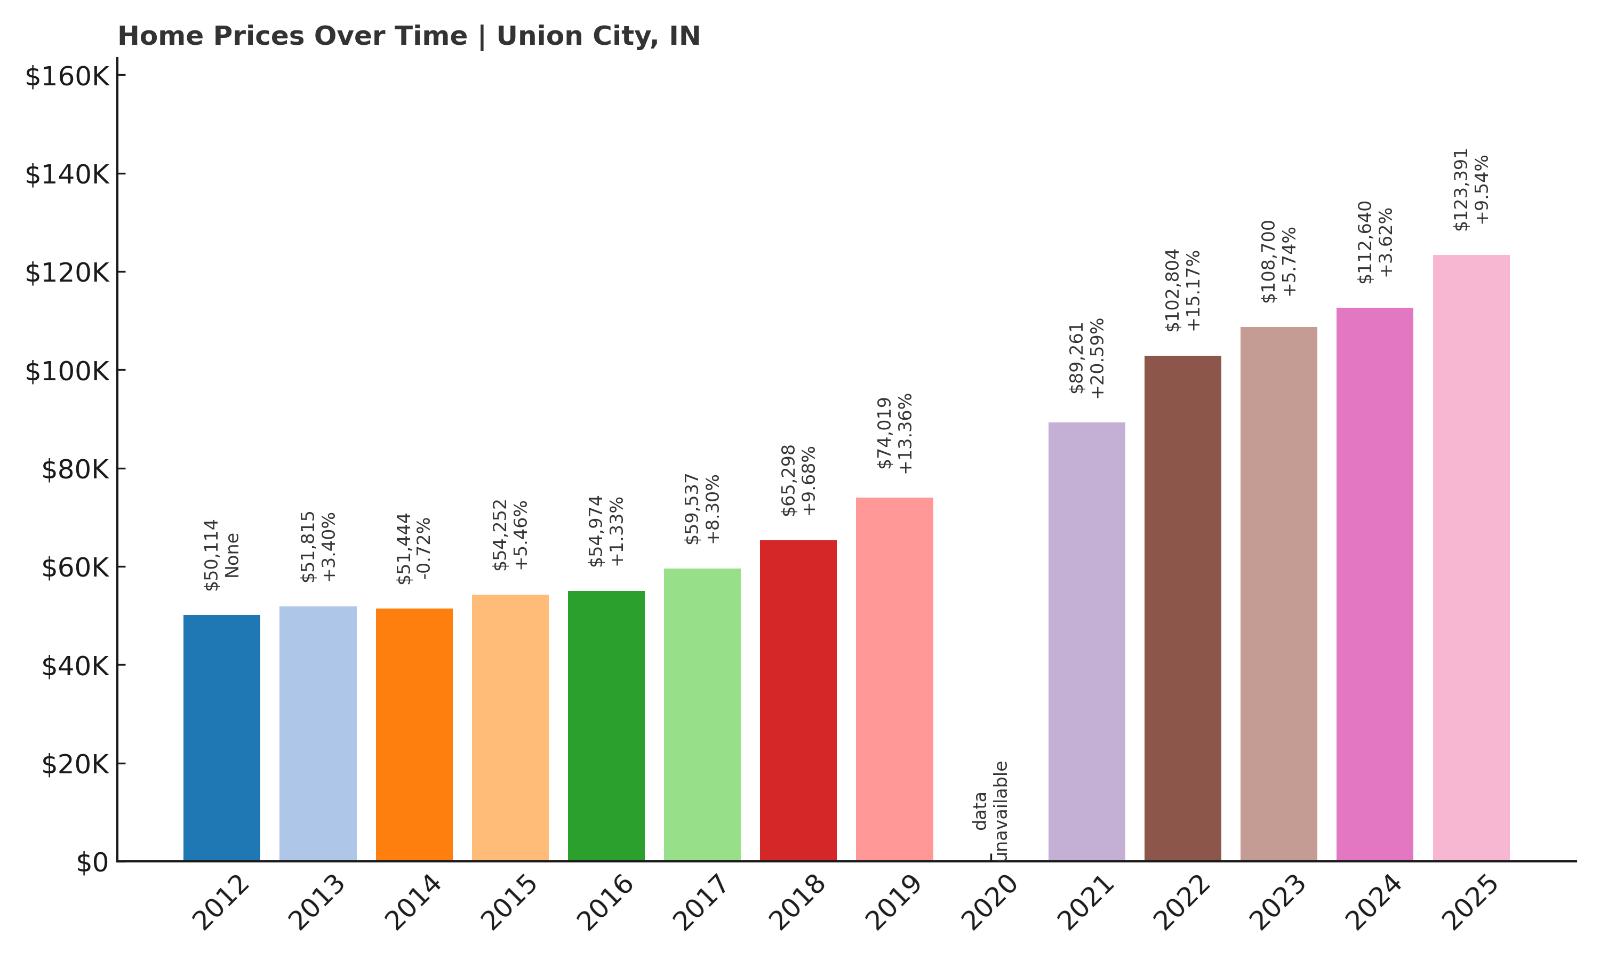
18. Union City – 146% Home Price Increase Since 2012
- 2010: N/A
- 2011: N/A
- 2012: $50,114
- 2013: $51,815 (+$1,702, +3.40% from previous year)
- 2014: $51,444 ($-372, -0.72% from previous year)
- 2015: $54,252 (+$2,808, +5.46% from previous year)
- 2016: $54,974 (+$722, +1.33% from previous year)
- 2017: $59,537 (+$4,563, +8.30% from previous year)
- 2018: $65,298 (+$5,761, +9.68% from previous year)
- 2019: $74,019 (+$8,721, +13.36% from previous year)
- 2020: N/A
- 2021: $89,261 (+$15,242, +20.59% from previous year)
- 2022: $102,804 (+$13,543, +15.17% from previous year)
- 2023: $108,700 (+$5,896, +5.74% from previous year)
- 2024: $112,640 (+$3,940, +3.62% from previous year)
- 2025: $123,391 (+$10,751, +9.54% from previous year)
Union City has seen a strong and consistent upward trend in home values, with an impressive 146% increase since 2012. Prices rose sharply in the late 2010s and again in the post-pandemic surge of 2021. Despite these gains, Union City homes remain accessible, with April 2025 prices hovering around $123,000 — still far below the national average.
Union City – Affordable Living Near the Ohio Line
Sitting right on the Indiana–Ohio border in Randolph County, Union City offers residents the perks of a quiet Midwestern lifestyle with access to two states’ worth of amenities. The area has a rich railroading history and a renewed focus on downtown revitalization in recent years. Local industry, including small-scale manufacturing, still plays a role in the local economy.
The town’s relatively low home prices are attractive to buyers priced out of larger cities like Dayton or Muncie. Union City Community High School and a variety of community events keep the town connected and engaged. With modest home values and steady growth, Union City continues to offer great value for buyers looking in east-central Indiana.
17. Edwardsport – 108% Home Price Increase Since 2012

- 2010: N/A
- 2011: N/A
- 2012: $58,835
- 2013: $56,473 ($-2,362, -4.01% from previous year)
- 2014: $59,858 (+$3,385, +5.99% from previous year)
- 2015: $64,329 (+$4,472, +7.47% from previous year)
- 2016: $65,149 (+$819, +1.27% from previous year)
- 2017: $63,677 ($-1,472, -2.26% from previous year)
- 2018: $61,596 ($-2,081, -3.27% from previous year)
- 2019: $69,609 (+$8,014, +13.01% from previous year)
- 2020: N/A
- 2021: $84,199 (+$14,590, +20.96% from previous year)
- 2022: $95,636 (+$11,437, +13.58% from previous year)
- 2023: $99,454 (+$3,818, +3.99% from previous year)
- 2024: $113,590 (+$14,135, +14.21% from previous year)
- 2025: $122,505 (+$8,915, +7.85% from previous year)
Edwardsport has shown impressive long-term appreciation, doubling in value since 2012. The past five years in particular saw strong gains, with median prices climbing to over $122,000 in 2025. Though it experienced a few brief dips earlier in the decade, the overall trend has been positive.
Edwardsport – A Quiet Spot in Knox County
Edwardsport is a small town located in Knox County, not far from Vincennes. It’s known for the nearby Duke Energy Edwardsport plant, one of the largest of its kind in the U.S., which plays a key role in the local economy. While the town itself is small, it benefits from its proximity to the White River and nearby state roads.
The area’s housing growth is likely tied to the steady demand from utility and industrial workers, along with retirees seeking low costs and quiet surroundings. With homes still priced well below six figures for many years, it’s no surprise buyers have taken notice in recent times. Affordable pricing, even after recent increases, continues to define the market.
16. Redkey – 172% Home Price Increase Since 2012

- 2010: N/A
- 2011: N/A
- 2012: $44,825
- 2013: $39,187 ($-5,638, -12.58% from previous year)
- 2014: $41,205 (+$2,018, +5.15% from previous year)
- 2015: $49,847 (+$8,642, +20.97% from previous year)
- 2016: $54,792 (+$4,945, +9.92% from previous year)
- 2017: $62,418 (+$7,625, +13.92% from previous year)
- 2018: $65,810 (+$3,392, +5.44% from previous year)
- 2019: $68,546 (+$2,736, +4.16% from previous year)
- 2020: N/A
- 2021: $83,561 (+$15,015, +21.91% from previous year)
- 2022: $94,842 (+$11,281, +13.50% from previous year)
- 2023: $101,693 (+$6,852, +7.22% from previous year)
- 2024: $111,668 (+$9,974, +9.81% from previous year)
- 2025: $122,006 (+$10,339, +9.26% from previous year)
Redkey’s housing market has seen a dramatic increase of over 170% since 2012. While prices dipped sharply in 2013, they rebounded fast and have continued a strong upward trend ever since. The 2025 median sits just above $122,000, making Redkey both affordable and fast-appreciating — a combination that attracts long-term buyers and investors alike.
Redkey – Historic Town With Quiet Growth
Situated in Jay County in eastern Indiana, Redkey is a town with a long industrial past and a quiet present. Once a glass manufacturing hub, the town has since slowed, but its affordable real estate is breathing new life into the area. Redkey’s downtown district has some turn-of-the-century architecture and local businesses that hint at its history.
The town’s population has remained modest, which keeps pressure off housing stock and helps maintain affordability. At the same time, its central location between Portland and Muncie means residents aren’t far from work or services. With consistent price appreciation and homes still well under the state average, Redkey offers strong value in Indiana’s rural northeast.
15. Dana – 133% Home Price Increase Since 2012
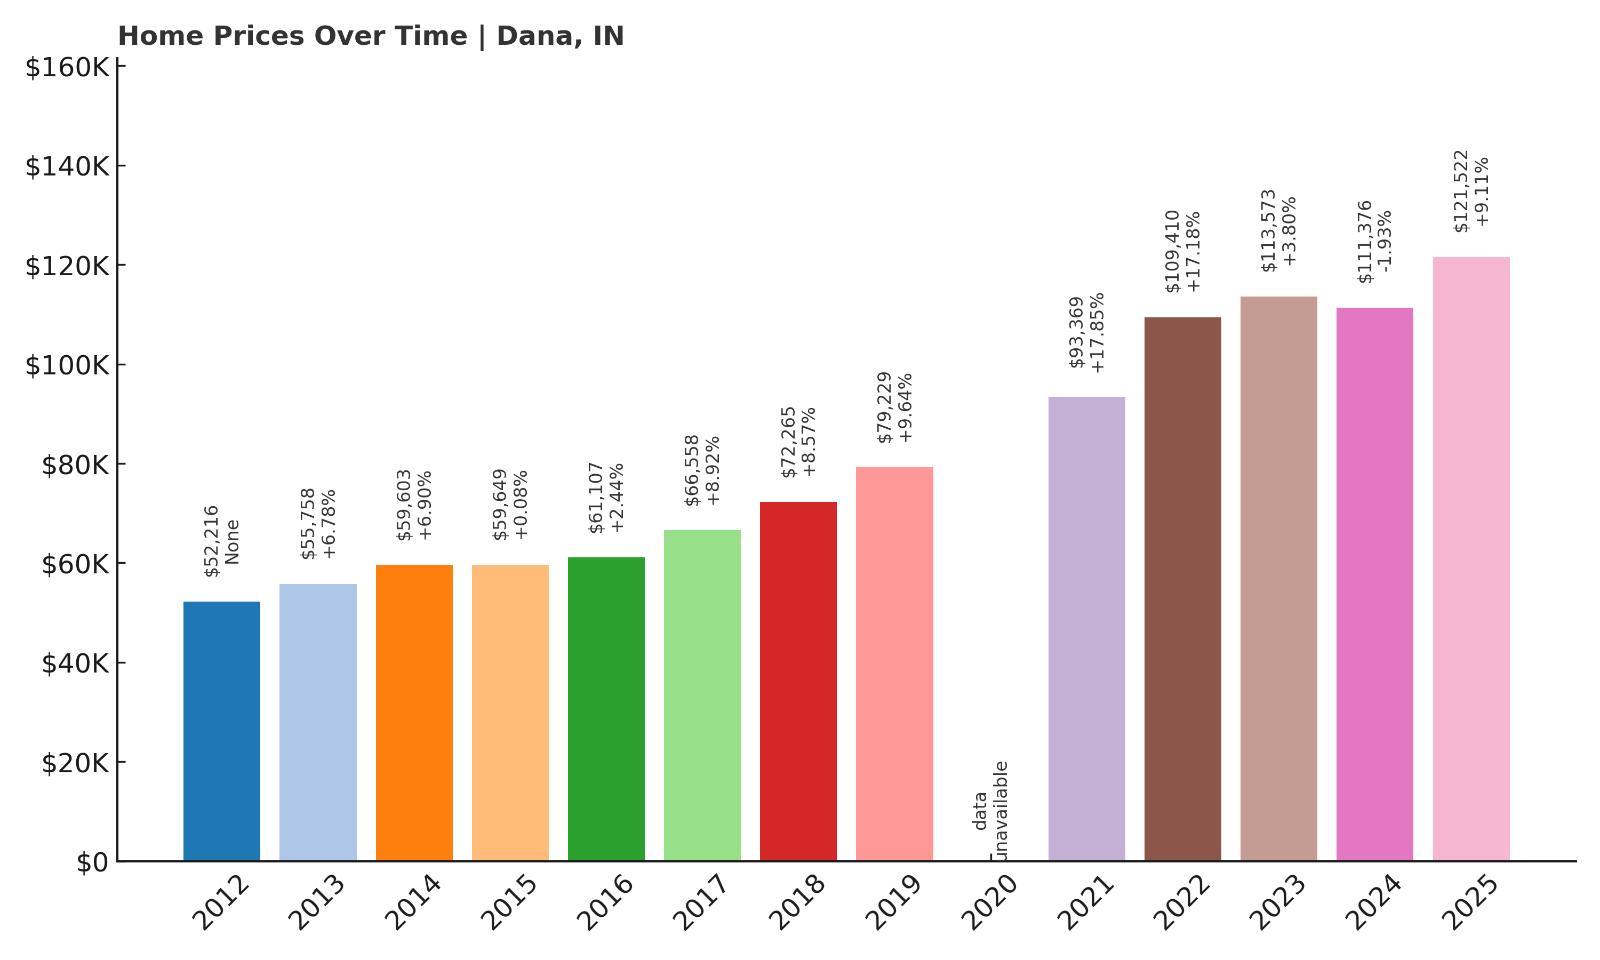
- 2010: N/A
- 2011: N/A
- 2012: $52,216
- 2013: $55,758 (+$3,542, +6.78% from previous year)
- 2014: $59,603 (+$3,845, +6.90% from previous year)
- 2015: $59,649 (+$46, +0.08% from previous year)
- 2016: $61,107 (+$1,457, +2.44% from previous year)
- 2017: $66,558 (+$5,452, +8.92% from previous year)
- 2018: $72,265 (+$5,707, +8.57% from previous year)
- 2019: $79,229 (+$6,964, +9.64% from previous year)
- 2020: N/A
- 2021: $93,369 (+$14,140, +17.85% from previous year)
- 2022: $109,410 (+$16,041, +17.18% from previous year)
- 2023: $113,573 (+$4,163, +3.80% from previous year)
- 2024: $111,376 ($-2,197, -1.93% from previous year)
- 2025: $121,522 (+$10,146, +9.11% from previous year)
Dana’s home values have more than doubled since 2012, with some of the most consistent year-on-year growth in the group. Although there was a small dip in 2024, the 2025 price quickly bounced back, reaching over $121,000. This trend suggests a healthy local market with solid buyer interest.
Dana – A Rural Community With Deep Roots
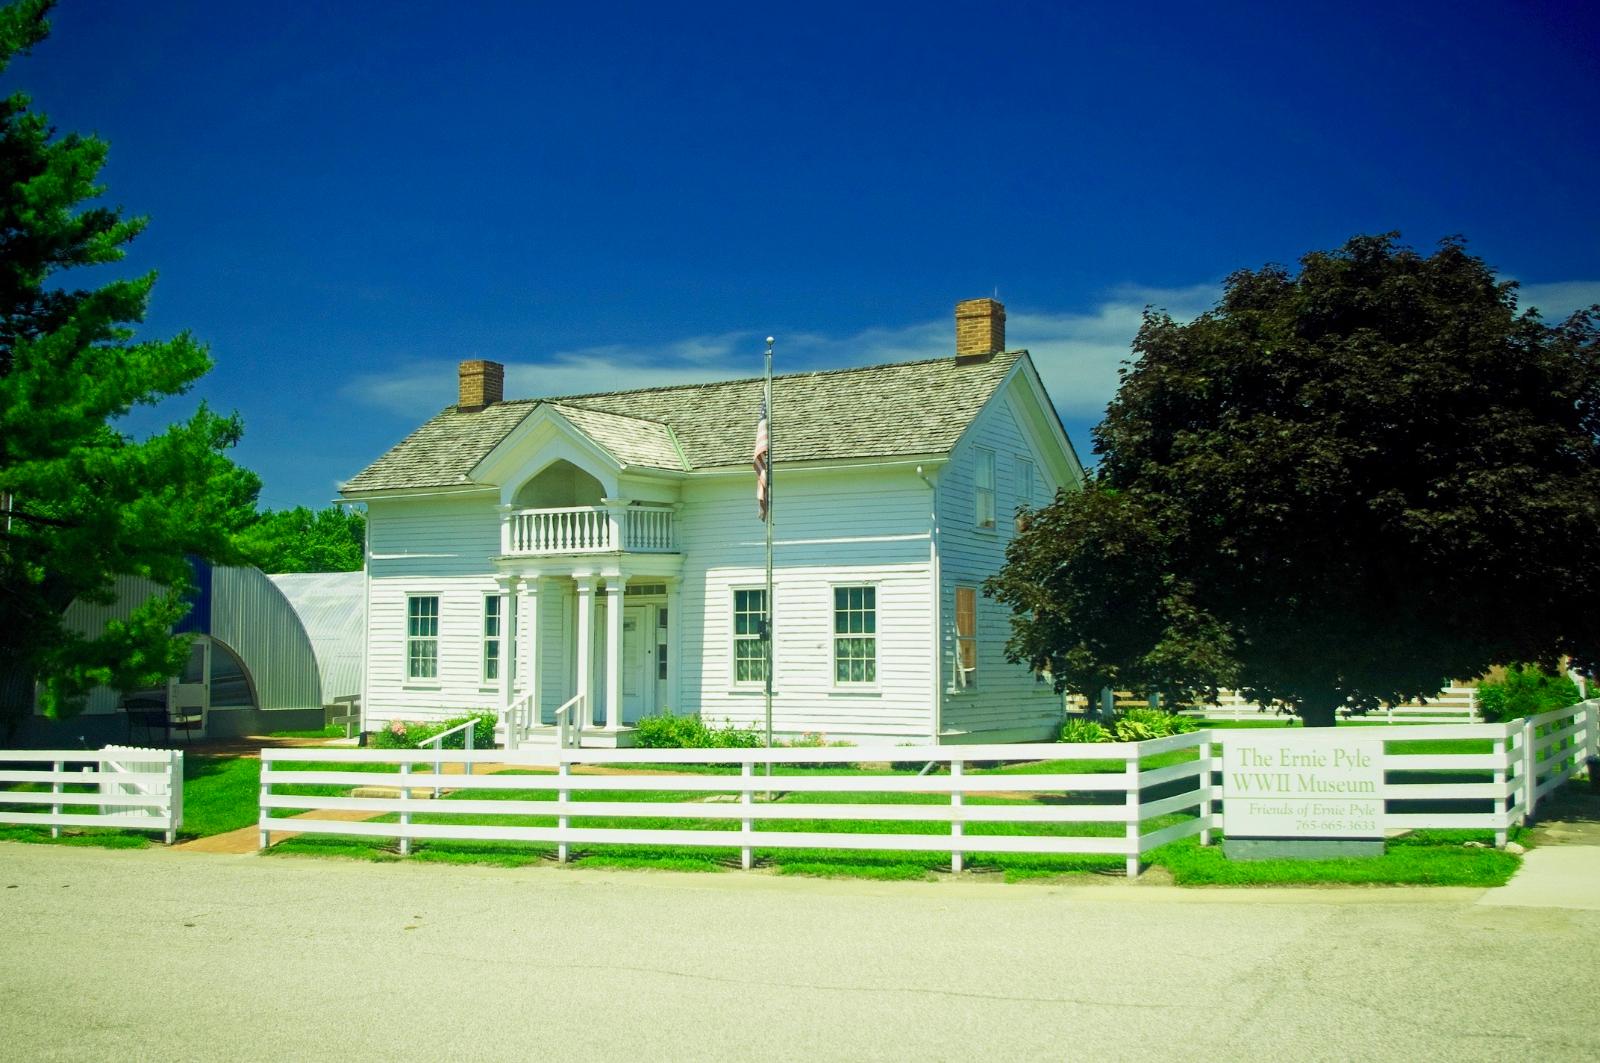
Dana is a small town in Vermillion County, known primarily as the birthplace of famed World War II correspondent Ernie Pyle. Today, it remains a quiet rural community surrounded by farmland and open skies. While Dana may lack large employers or city bustle, its affordability and small-town charm keep people interested.
The housing stock here consists mostly of older homes, and new development is limited. That’s helped keep property values affordable even as prices rise statewide. Residents appreciate the low cost of living and the strong sense of local identity. For homebuyers looking for peace and space without breaking the bank, Dana is worth considering.
14. Clinton – 125% Home Price Increase Since 2012
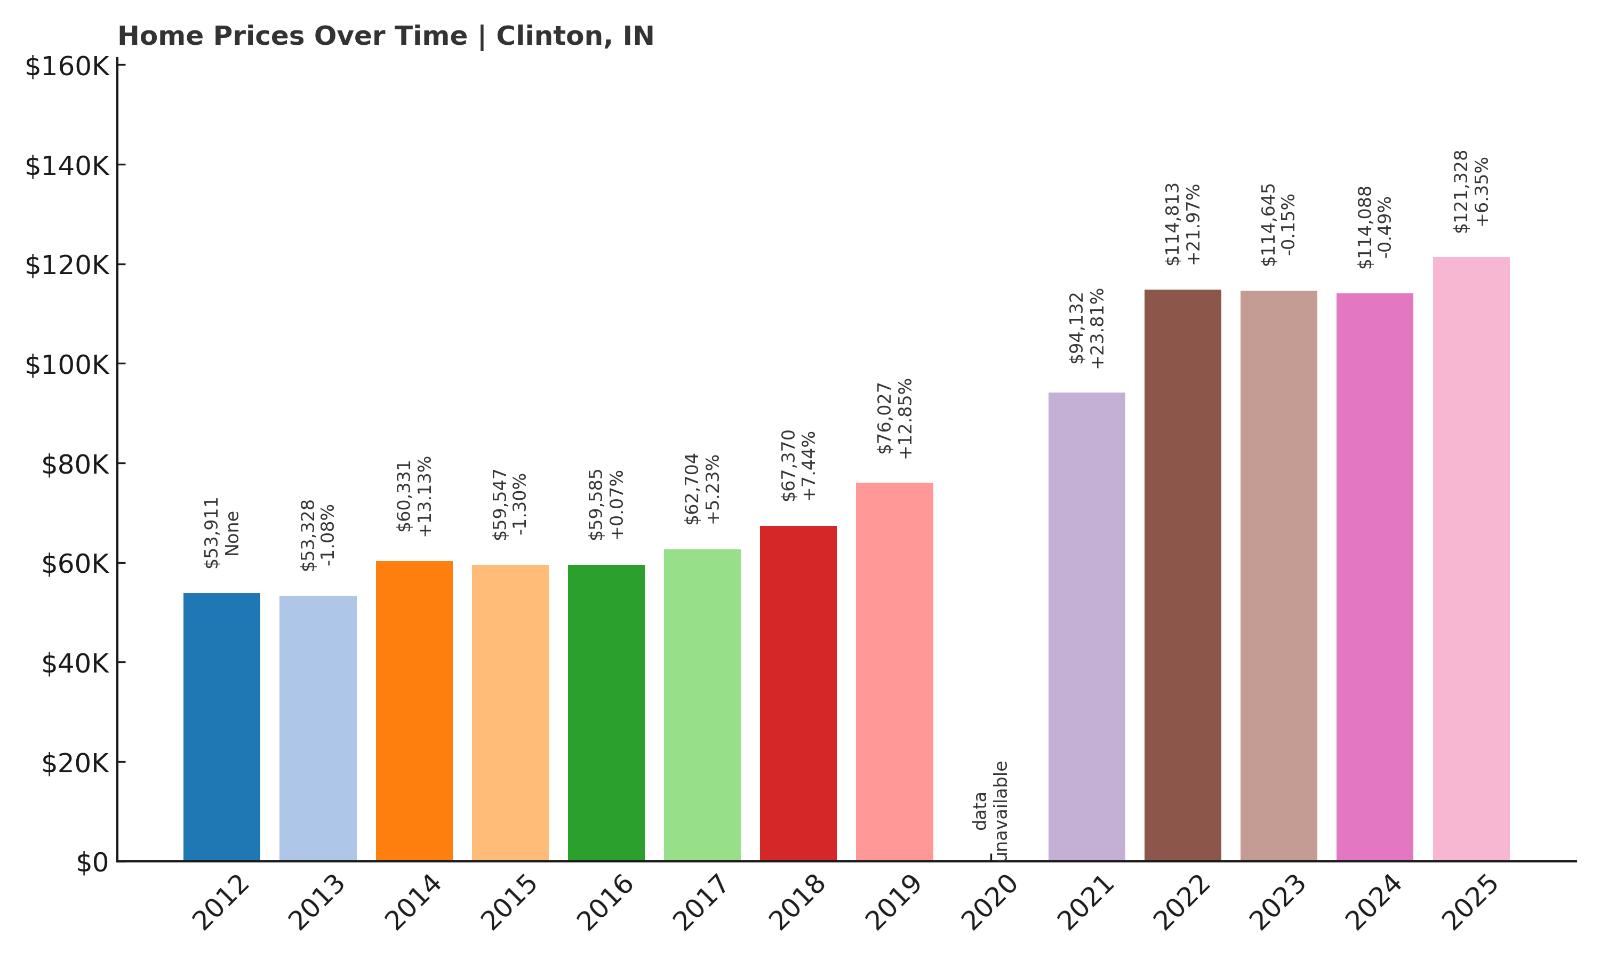
- 2010: N/A
- 2011: N/A
- 2012: $53,911
- 2013: $53,328 ($-584, -1.08% from previous year)
- 2014: $60,331 (+$7,003, +13.13% from previous year)
- 2015: $59,547 ($-784, -1.30% from previous year)
- 2016: $59,585 (+$39, +0.07% from previous year)
- 2017: $62,704 (+$3,119, +5.23% from previous year)
- 2018: $67,370 (+$4,666, +7.44% from previous year)
- 2019: $76,027 (+$8,657, +12.85% from previous year)
- 2020: N/A
- 2021: $94,132 (+$18,105, +23.81% from previous year)
- 2022: $114,813 (+$20,681, +21.97% from previous year)
- 2023: $114,645 ($-168, -0.15% from previous year)
- 2024: $114,088 ($-557, -0.49% from previous year)
- 2025: $121,328 (+$7,240, +6.35% from previous year)
Clinton has experienced a substantial increase in home prices over the past decade, rising more than 125% since 2012. The biggest gains occurred between 2020 and 2022, though growth has slowed somewhat in the last two years. Still, the town remains one of Indiana’s most affordable spots despite steady upward momentum.
Clinton – Strong Local Identity and Gradual Growth
Located in western Indiana along the Wabash River, Clinton is the largest town in Vermillion County. It has a proud Italian-American heritage and is well-known for its annual Little Italy Festival. These cultural roots help give the town a distinct feel compared to others in the area.
In terms of housing, Clinton features a broad mix of historic homes and modest mid-century builds. Its location near U.S. Route 41 and Terre Haute provides job access for commuters, while still offering lower prices and a slower pace. Recent years have brought revitalization efforts to the downtown and waterfront areas, helping push prices higher without overwhelming affordability.
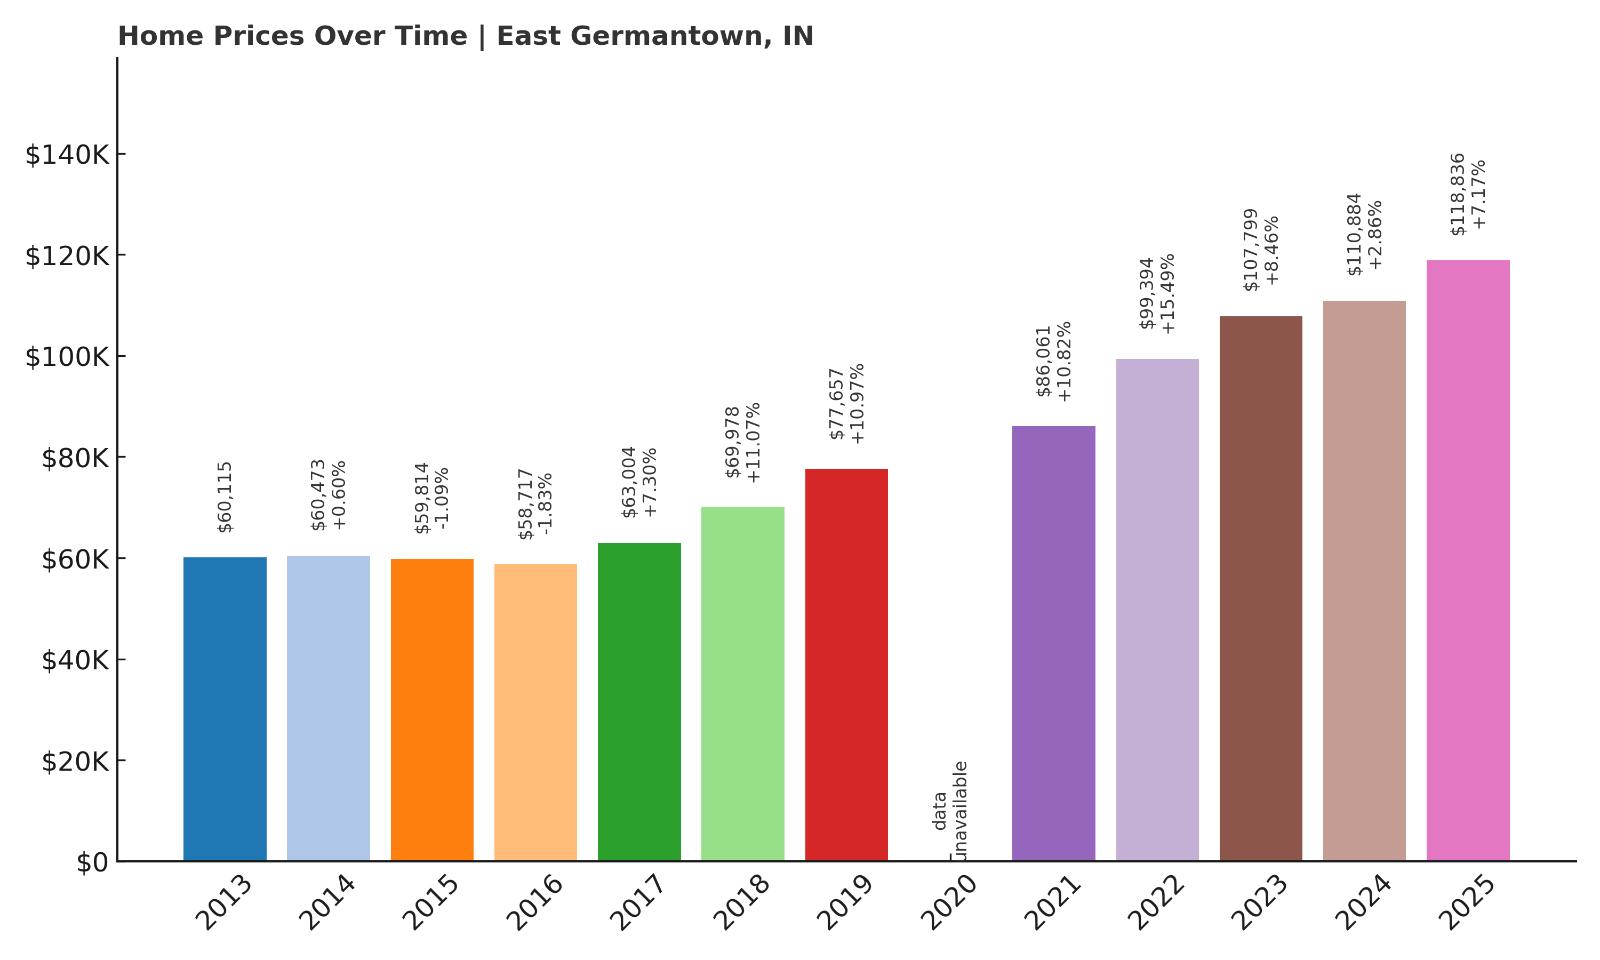
13. East Germantown – 98% Home Price Increase Since 2013
🔥 Would you like to save this?
- 2010: N/A
- 2011: N/A
- 2012: N/A
- 2013: $60,115
- 2014: $60,473 (+$358, +0.60% from previous year)
- 2015: $59,814 ($-659, -1.09% from previous year)
- 2016: $58,717 ($-1,097, -1.83% from previous year)
- 2017: $63,004 (+$4,287, +7.30% from previous year)
- 2018: $69,978 (+$6,973, +11.07% from previous year)
- 2019: $77,657 (+$7,679, +10.97% from previous year)
- 2020: N/A
- 2021: $86,061 (+$8,405, +10.82% from previous year)
- 2022: $99,394 (+$13,332, +15.49% from previous year)
- 2023: $107,799 (+$8,406, +8.46% from previous year)
- 2024: $110,884 (+$3,085, +2.86% from previous year)
- 2025: $118,836 (+$7,952, +7.17% from previous year)
East Germantown’s home values have nearly doubled since 2013, rising from just over $60,000 to almost $119,000 by 2025. While it saw minor dips mid-decade, the last five years have delivered consistent growth. That steady appreciation shows a market that is gaining momentum without volatility.
East Germantown – Modest Prices With Big Momentum
East Germantown, in Wayne County, is a small town with a population under 500. Though small, it benefits from its location near U.S. Route 40, connecting it to larger towns like Richmond. Residents enjoy quiet streets, minimal traffic, and strong community ties.
The town has no large employers or urban sprawl, which keeps home prices low. But its proximity to regional employment centers and steady demand from families and retirees has helped nudge values upward over the years. East Germantown offers an affordable option with a rural feel that many buyers are actively seeking out in today’s market.
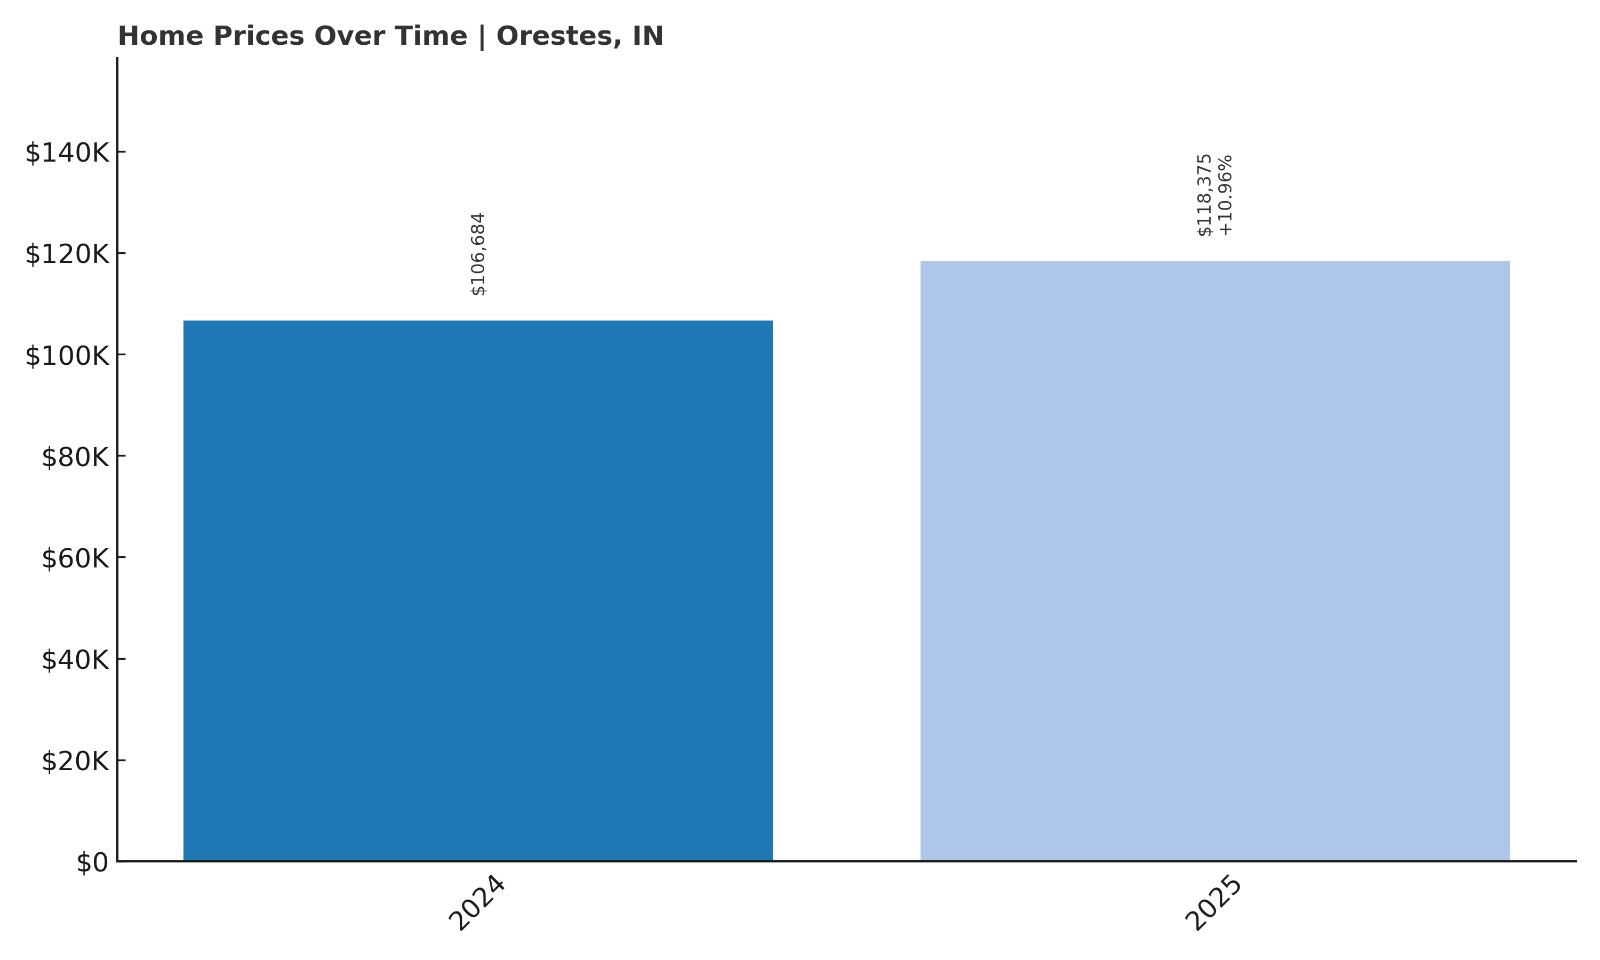
12. Orestes – 11% Home Price Increase Since 2024
- 2010: N/A
- 2011: N/A
- 2012: N/A
- 2013: N/A
- 2014: N/A
- 2015: N/A
- 2016: N/A
- 2017: N/A
- 2018: N/A
- 2019: N/A
- 2020: N/A
- 2021: N/A
- 2022: N/A
- 2023: N/A
- 2024: $106,684
- 2025: $118,375 (+$11,690, +10.96% from previous year)
Orestes only appears in the Zillow index starting in 2024, but it’s already seen nearly an 11% price increase in just one year. That’s a sharp rise in a short time — and it could signal early-stage growth or renewed market attention on this tiny Indiana town.
Orestes – A Tiny Town Starting to Climb
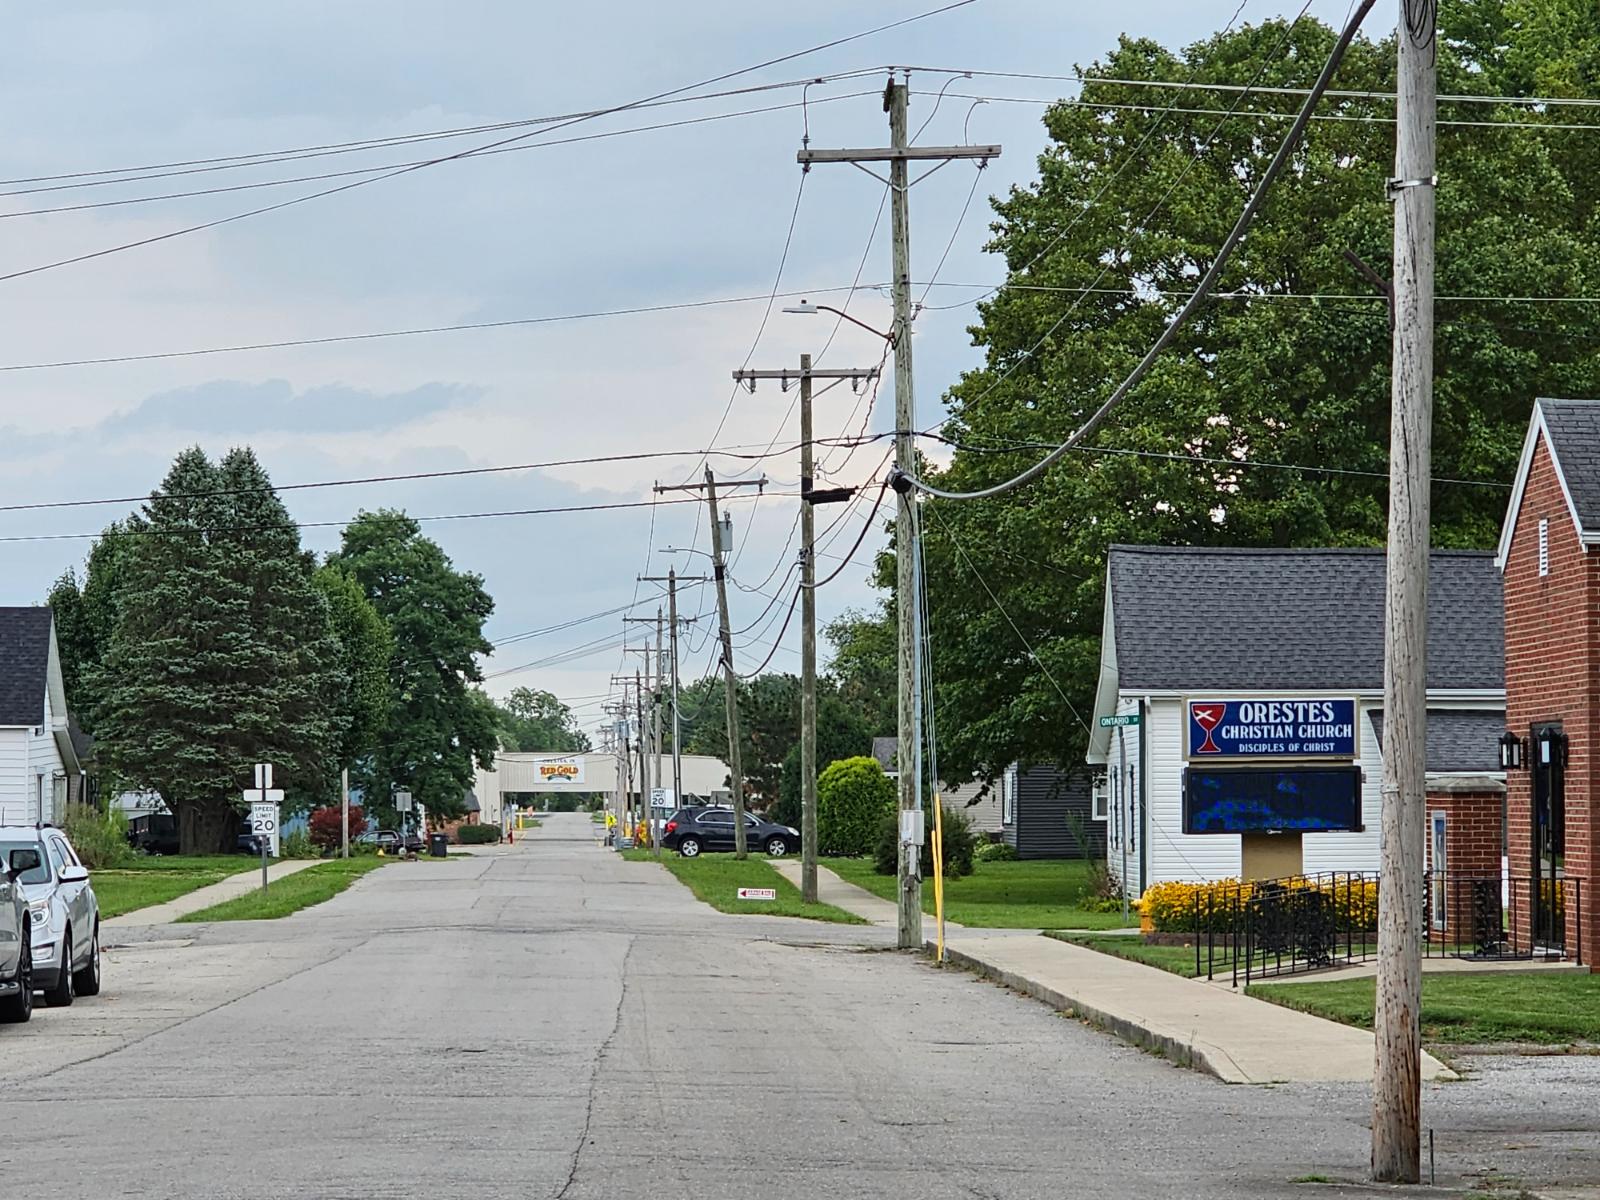
Located in Madison County, Orestes is a very small town that rarely makes headlines, but its inclusion in the home value index marks a new chapter. With a population around 400, the town is just a few miles from Alexandria and within commuting distance of Anderson and Muncie.
Orestes is known for its quiet streets, older homes, and small-town feel. Until recently, home sales were so infrequent that pricing trends weren’t tracked. The new data suggests buyer interest is picking up — perhaps from those looking to escape higher costs in nearby cities while still staying close to work or schools. Time will tell whether this trend continues, but early signs point upward.
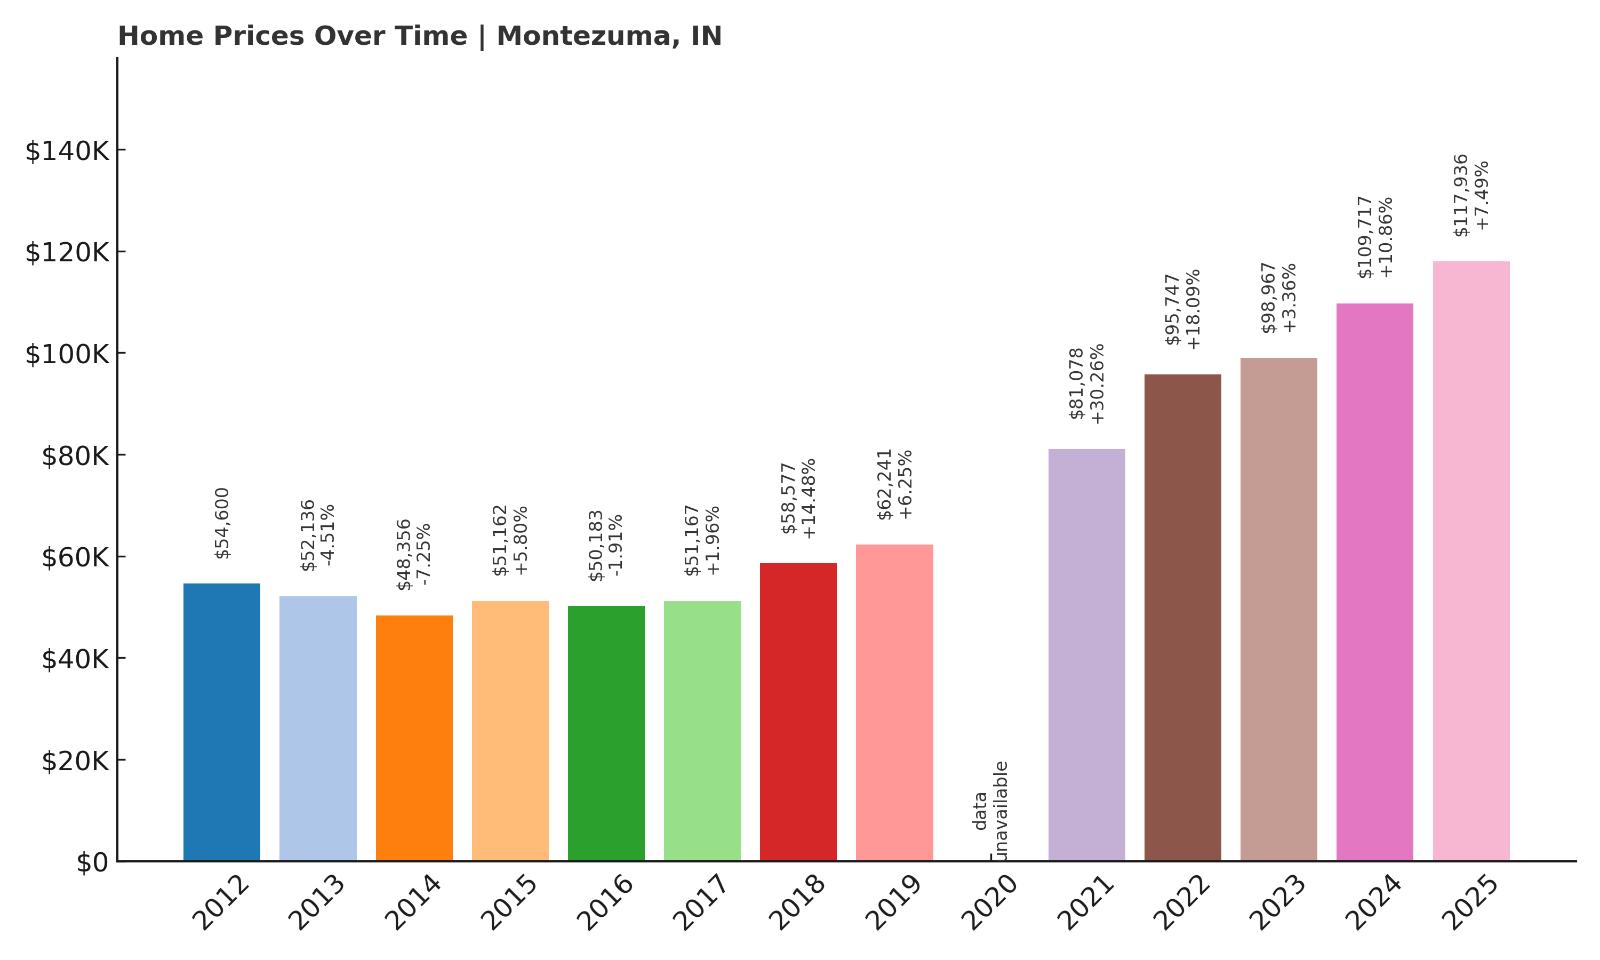
11. Montezuma – 116% Home Price Increase Since 2012
- 2010: N/A
- 2011: N/A
- 2012: $54,600
- 2013: $52,136 ($-2,464, -4.51% from previous year)
- 2014: $48,356 ($-3,780, -7.25% from previous year)
- 2015: $51,162 (+$2,805, +5.80% from previous year)
- 2016: $50,183 ($-979, -1.91% from previous year)
- 2017: $51,167 (+$985, +1.96% from previous year)
- 2018: $58,577 (+$7,410, +14.48% from previous year)
- 2019: $62,241 (+$3,664, +6.25% from previous year)
- 2020: N/A
- 2021: $81,078 (+$18,837, +30.26% from previous year)
- 2022: $95,747 (+$14,669, +18.09% from previous year)
- 2023: $98,967 (+$3,220, +3.36% from previous year)
- 2024: $109,717 (+$10,750, +10.86% from previous year)
- 2025: $117,936 (+$8,219, +7.49% from previous year)
Montezuma’s price chart shows clear momentum, with values more than doubling since 2012. The biggest surge came in 2021, but the trend has continued with consistent yearly gains. Prices reached just under $118,000 in 2025 — still relatively low compared to state averages, but no longer a secret.
Montezuma – Western Indiana’s Quiet Riser

Montezuma sits in Parke County near the Illinois border and is known for its connection to Indiana’s famous Covered Bridge Festival. It has strong rural character, but also access to U.S. 36 and nearby Rockville. This makes it a reasonable spot for those commuting to Terre Haute or even Champaign.
Housing stock in Montezuma includes modest homes and fixer-uppers, which once traded for well under $60K. But recent demand, coupled with low inventory, has sent prices higher. Montezuma’s affordability and charm are drawing more attention — and the price trends clearly reflect that interest.
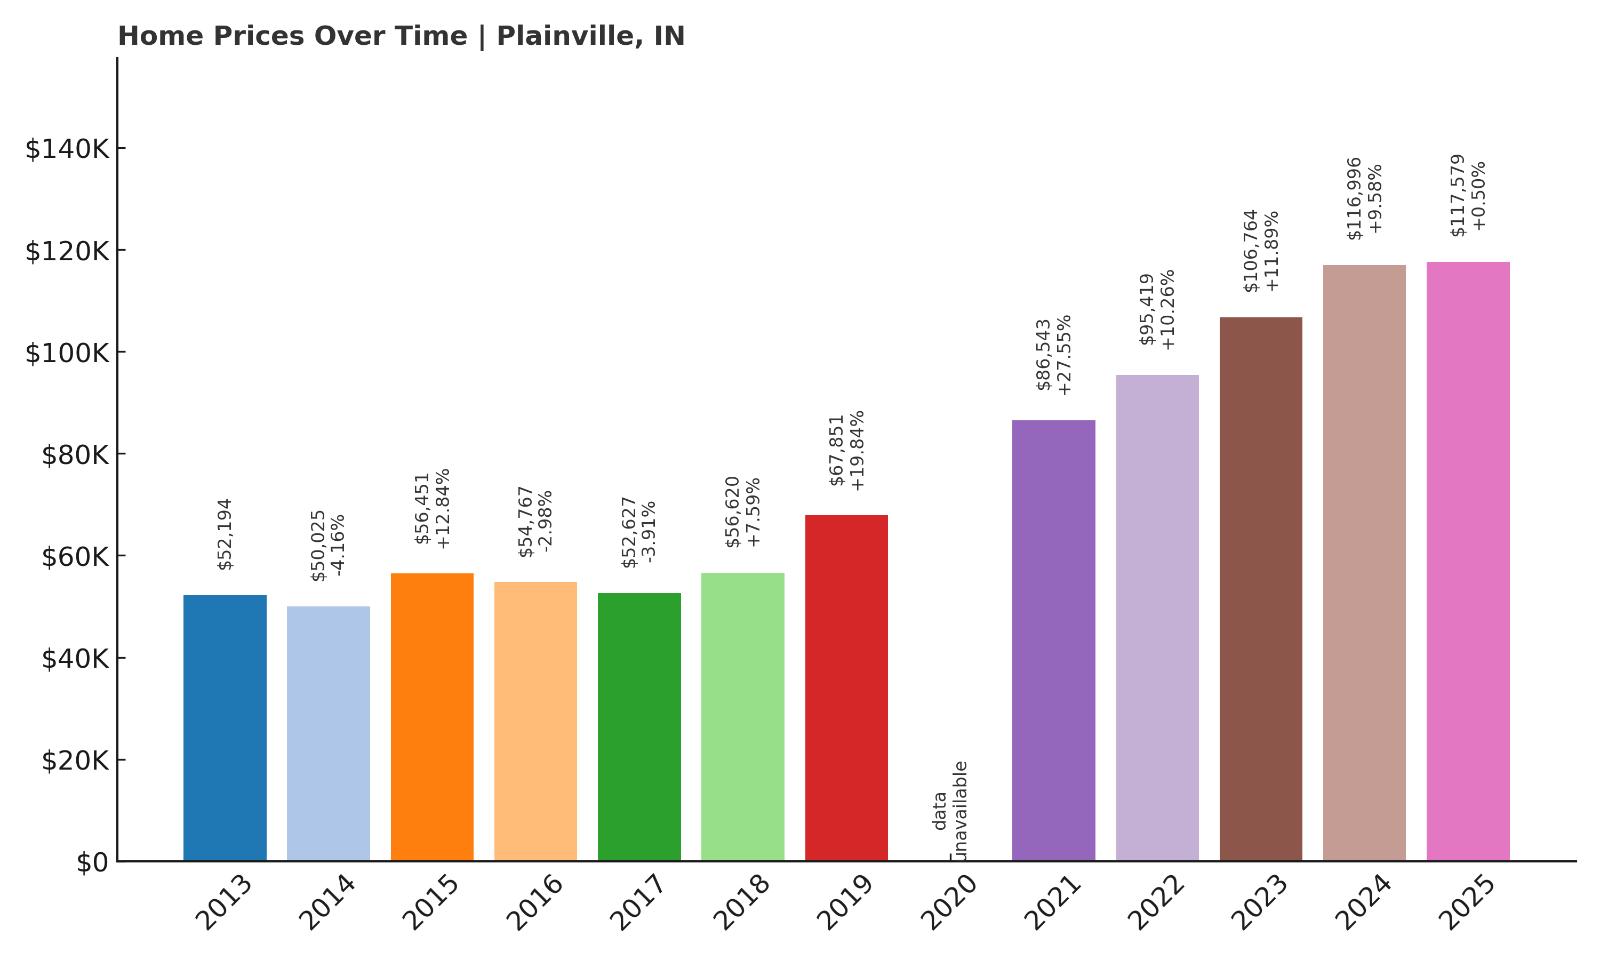
10. Plainville – 125% Home Price Increase Since 2013
- 2010: N/A
- 2011: N/A
- 2012: N/A
- 2013: $52,194
- 2014: $50,025 ($-2,169, -4.16% from previous year)
- 2015: $56,451 (+$6,426, +12.84% from previous year)
- 2016: $54,767 ($-1,683, -2.98% from previous year)
- 2017: $52,627 ($-2,140, -3.91% from previous year)
- 2018: $56,620 (+$3,993, +7.59% from previous year)
- 2019: $67,851 (+$11,231, +19.84% from previous year)
- 2020: N/A
- 2021: $86,543 (+$18,692, +27.55% from previous year)
- 2022: $95,419 (+$8,875, +10.26% from previous year)
- 2023: $106,764 (+$11,345, +11.89% from previous year)
- 2024: $116,996 (+$10,232, +9.58% from previous year)
- 2025: $117,579 (+$583, +0.50% from previous year)
Plainville’s home prices have jumped more than 125% since 2013. There were a few minor drops early on, but the last five years have shown strong, consistent growth. Median prices now hover just under $118,000 — still below average, but rising fast.
Plainville – Underrated and On the Rise
Located in Daviess County, Plainville is a small but growing town with deep agricultural roots. Its access to U.S. Route 50 gives it a convenient link to nearby towns like Washington and Loogootee. Despite being off the beaten path, it’s drawing attention for its affordability and growth potential.
Homebuyers are starting to view Plainville as a good place to buy early before prices climb further. Most of the housing here is older and modest, but values are trending up thanks to wider demand and low local supply. For buyers looking beyond Indiana’s larger towns, Plainville presents a strong case.
9. Laketon – 158% Home Price Increase Since 2013

- 2010: N/A
- 2011: N/A
- 2012: N/A
- 2013: $45,126
- 2014: $52,706 (+$7,580, +16.80% from previous year)
- 2015: $55,991 (+$3,286, +6.23% from previous year)
- 2016: $60,369 (+$4,378, +7.82% from previous year)
- 2017: $63,311 (+$2,942, +4.87% from previous year)
- 2018: $68,175 (+$4,864, +7.68% from previous year)
- 2019: $74,435 (+$6,260, +9.18% from previous year)
- 2020: N/A
- 2021: $90,050 (+$15,615, +20.98% from previous year)
- 2022: $96,666 (+$6,615, +7.35% from previous year)
- 2023: $101,091 (+$4,426, +4.58% from previous year)
- 2024: $109,748 (+$8,656, +8.56% from previous year)
- 2025: $116,433 (+$6,685, +6.09% from previous year)
Laketon has quietly posted one of the strongest appreciation rates among Indiana’s most affordable towns. Since 2013, home values have surged by over 150%, climbing from around $45,000 to more than $116,000 by 2025. The most significant jump came in 2021, when values shot up nearly 21% in just one year — a surge that reflects increased demand and a tightening housing supply in this unassuming northern town.
Laketon – Rapid Growth in a Lakeside Hamlet
Nestled in Wabash County in north-central Indiana, Laketon is a small, unincorporated community known for its proximity to several lakes, including Lake Gage and Long Lake. Its rural, woodsy setting has made it a quiet refuge for retirees, seasonal homeowners, and those looking to get away from city prices. Though the population is small and the pace is slow, Laketon’s natural surroundings and affordable homes are turning heads in 2025.
The area saw limited housing turnover for years, but that has changed recently as remote work and second-home demand have accelerated. Buyers from nearby Warsaw, Fort Wayne, and even as far as Chicago are looking for weekend homes or affordable primary residences with land. That demand, paired with a finite number of listings, is what’s driving the steep price increases seen in the data. While Laketon remains relatively undiscovered, the growth trajectory suggests it may not stay that way much longer.
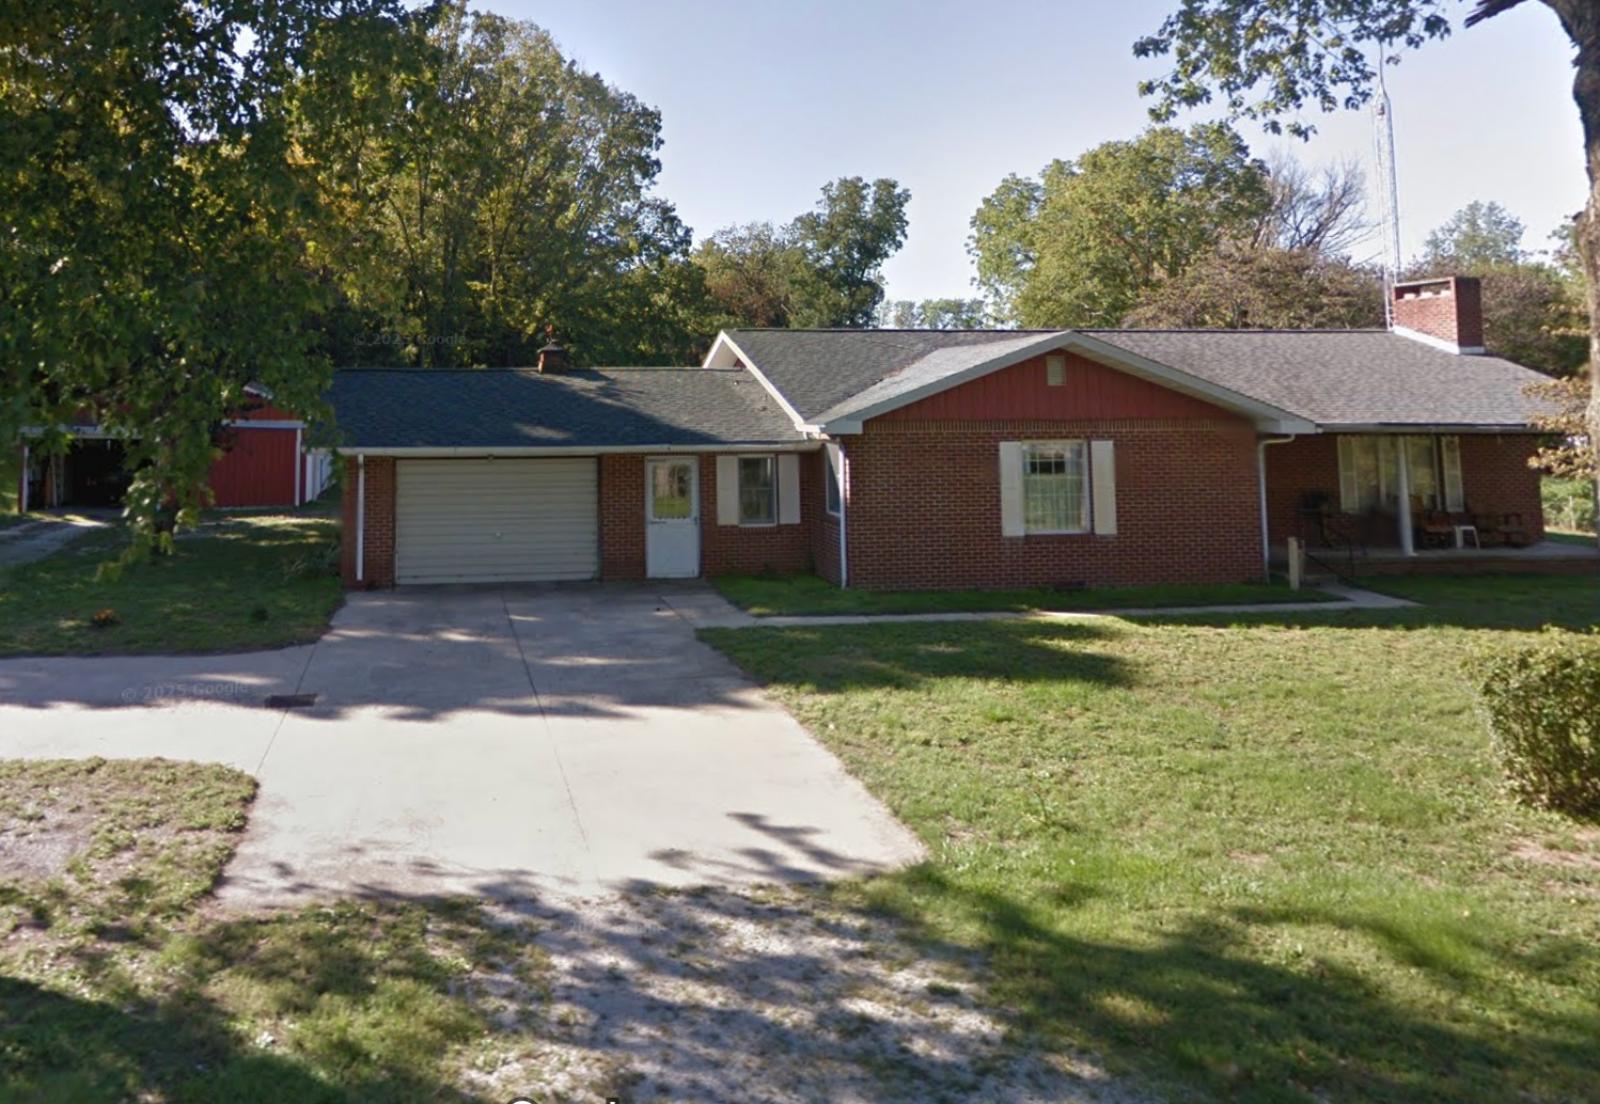
8. Fulton – 158% Home Price Increase Since 2012
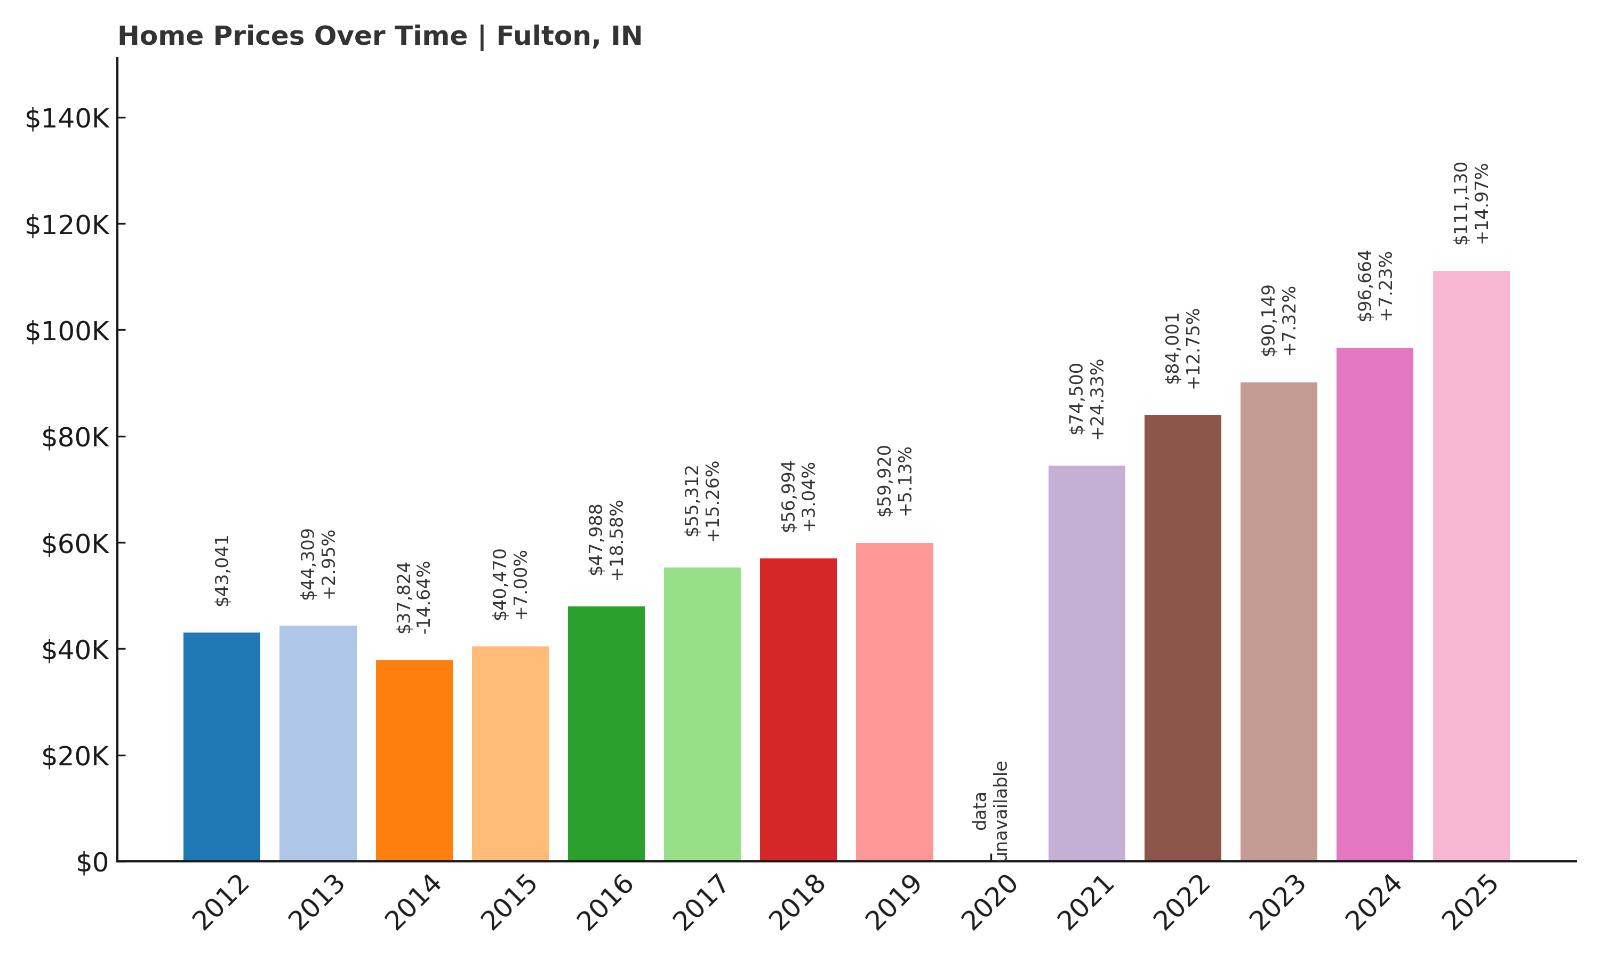
- 2010: N/A
- 2011: N/A
- 2012: $43,041
- 2013: $44,309 (+$1,269, +2.95% from previous year)
- 2014: $37,824 ($-6,485, -14.64% from previous year)
- 2015: $40,470 (+$2,646, +7.00% from previous year)
- 2016: $47,988 (+$7,518, +18.58% from previous year)
- 2017: $55,312 (+$7,324, +15.26% from previous year)
- 2018: $56,994 (+$1,682, +3.04% from previous year)
- 2019: $59,920 (+$2,926, +5.13% from previous year)
- 2020: N/A
- 2021: $74,500 (+$14,580, +24.33% from previous year)
- 2022: $84,001 (+$9,501, +12.75% from previous year)
- 2023: $90,149 (+$6,148, +7.32% from previous year)
- 2024: $96,664 (+$6,515, +7.23% from previous year)
- 2025: $111,130 (+$14,466, +14.97% from previous year)
Fulton’s housing market has grown dramatically since 2012, with home values soaring over 150%. The town saw its sharpest appreciation after 2020, with double-digit increases in several consecutive years. Despite an early dip in 2014, prices have recovered strongly and now sit just over $111,000 as of April 2025. This kind of sustained growth is rare in such a small town and suggests shifting demand patterns in rural Indiana.
Fulton – Quietly Booming in Cass County
Located in northern Indiana’s Cass County, Fulton is a tiny town with a population under 300. It lies just south of Rochester and near U.S. Route 31, providing access to larger employment hubs without sacrificing rural tranquility. The town has historically been centered around farming and small-scale manufacturing, but it’s now attracting attention from buyers seeking affordability and space. Many of the homes are older, single-family properties on large lots, which appeals to people relocating from higher-priced regions.
The recent spike in home values likely stems from growing interest in low-cost markets and the increased feasibility of remote work. With limited housing stock, even a small surge in demand has a significant impact on pricing. Fulton offers a combination of affordability, steady appreciation, and a slower pace of life that’s becoming increasingly attractive. For first-time buyers or those seeking long-term investment opportunities, it’s a market worth watching closely.
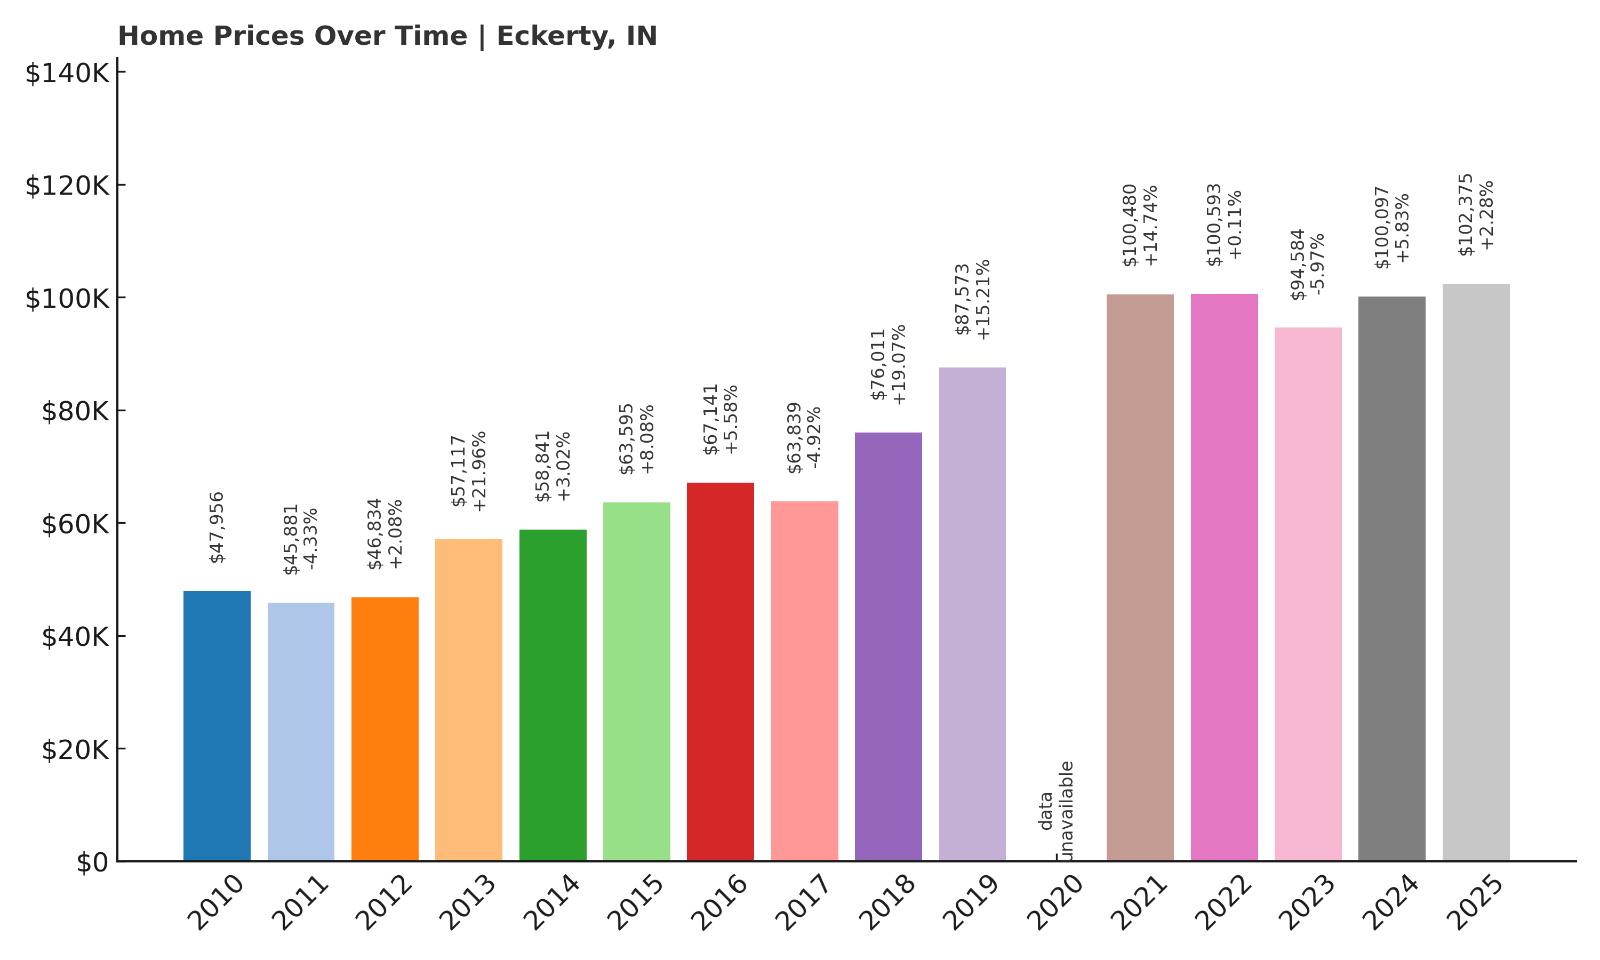
7. Eckerty – 114% Home Price Increase Since 2010
🔥 Would you like to save this?
- 2010: $47,956
- 2011: $45,881 ($-2,075, -4.33% from previous year)
- 2012: $46,834 (+$952, +2.08% from previous year)
- 2013: $57,117 (+$10,284, +21.96% from previous year)
- 2014: $58,841 (+$1,724, +3.02% from previous year)
- 2015: $63,595 (+$4,754, +8.08% from previous year)
- 2016: $67,141 (+$3,546, +5.58% from previous year)
- 2017: $63,839 ($-3,302, -4.92% from previous year)
- 2018: $76,011 (+$12,172, +19.07% from previous year)
- 2019: $87,573 (+$11,562, +15.21% from previous year)
- 2020: N/A
- 2021: $100,480 (+$12,907, +14.74% from previous year)
- 2022: $100,593 (+$113, +0.11% from previous year)
- 2023: $94,584 ($-6,008, -5.97% from previous year)
- 2024: $100,097 (+$5,513, +5.83% from previous year)
- 2025: $102,375 (+$2,278, +2.28% from previous year)
Over the last 15 years, Eckerty’s home prices have more than doubled, with values rising from under $48,000 in 2010 to over $102,000 by 2025. The biggest spikes occurred between 2013 and 2021, with occasional dips in between. Though growth has leveled off recently, the town’s prices remain well below statewide averages, reinforcing its reputation as an affordable option with room to grow.
Eckerty – Secluded and Scenic in Southern Indiana
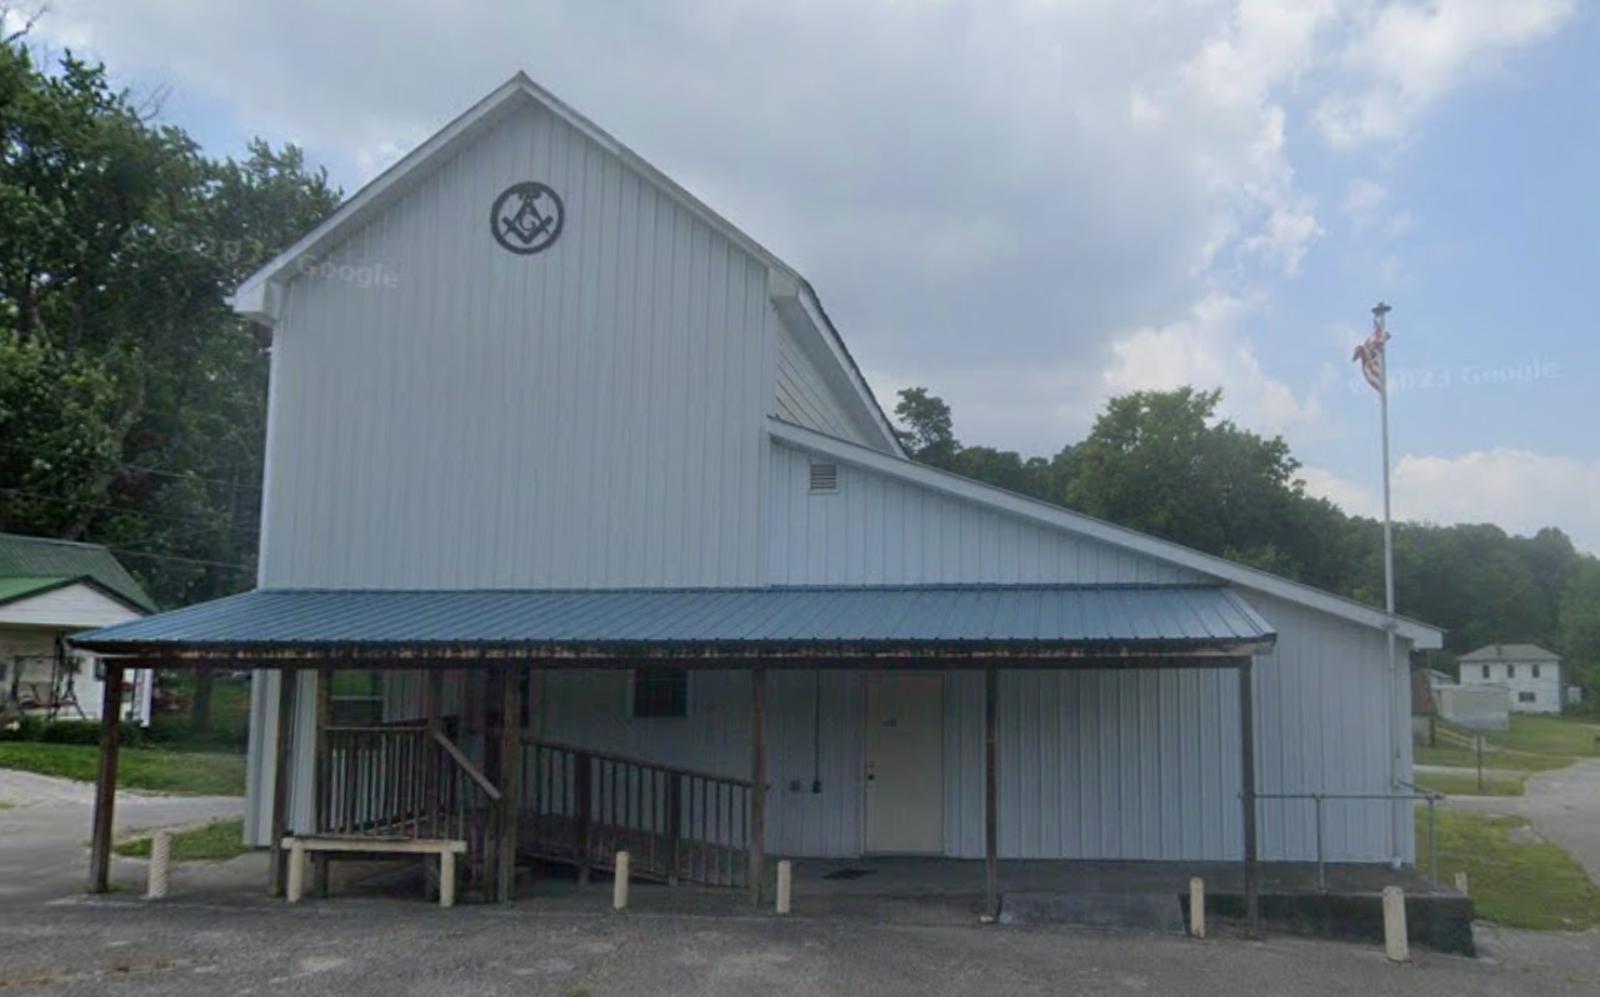
Situated in Crawford County, Eckerty lies near the Hoosier National Forest and is surrounded by natural beauty. Its secluded, rural location makes it popular with outdoor enthusiasts and retirees looking for peace and quiet. The town is near Patoka Lake, one of the largest reservoirs in Indiana, which adds appeal for weekenders and second-home buyers as well. These recreational draws may have helped bolster local home demand over the past decade.
Eckerty has no urban sprawl or large-scale development, and that helps preserve its affordability. Its homes are typically modest, with large yards and easy access to scenic drives and hiking areas. In recent years, growing interest in rural real estate has pushed prices upward, even though listings remain limited. As demand spreads to outer counties, Eckerty continues to be a hidden opportunity for those willing to trade convenience for natural surroundings and low costs.
6. Griffin – 104% Home Price Increase Since 2013
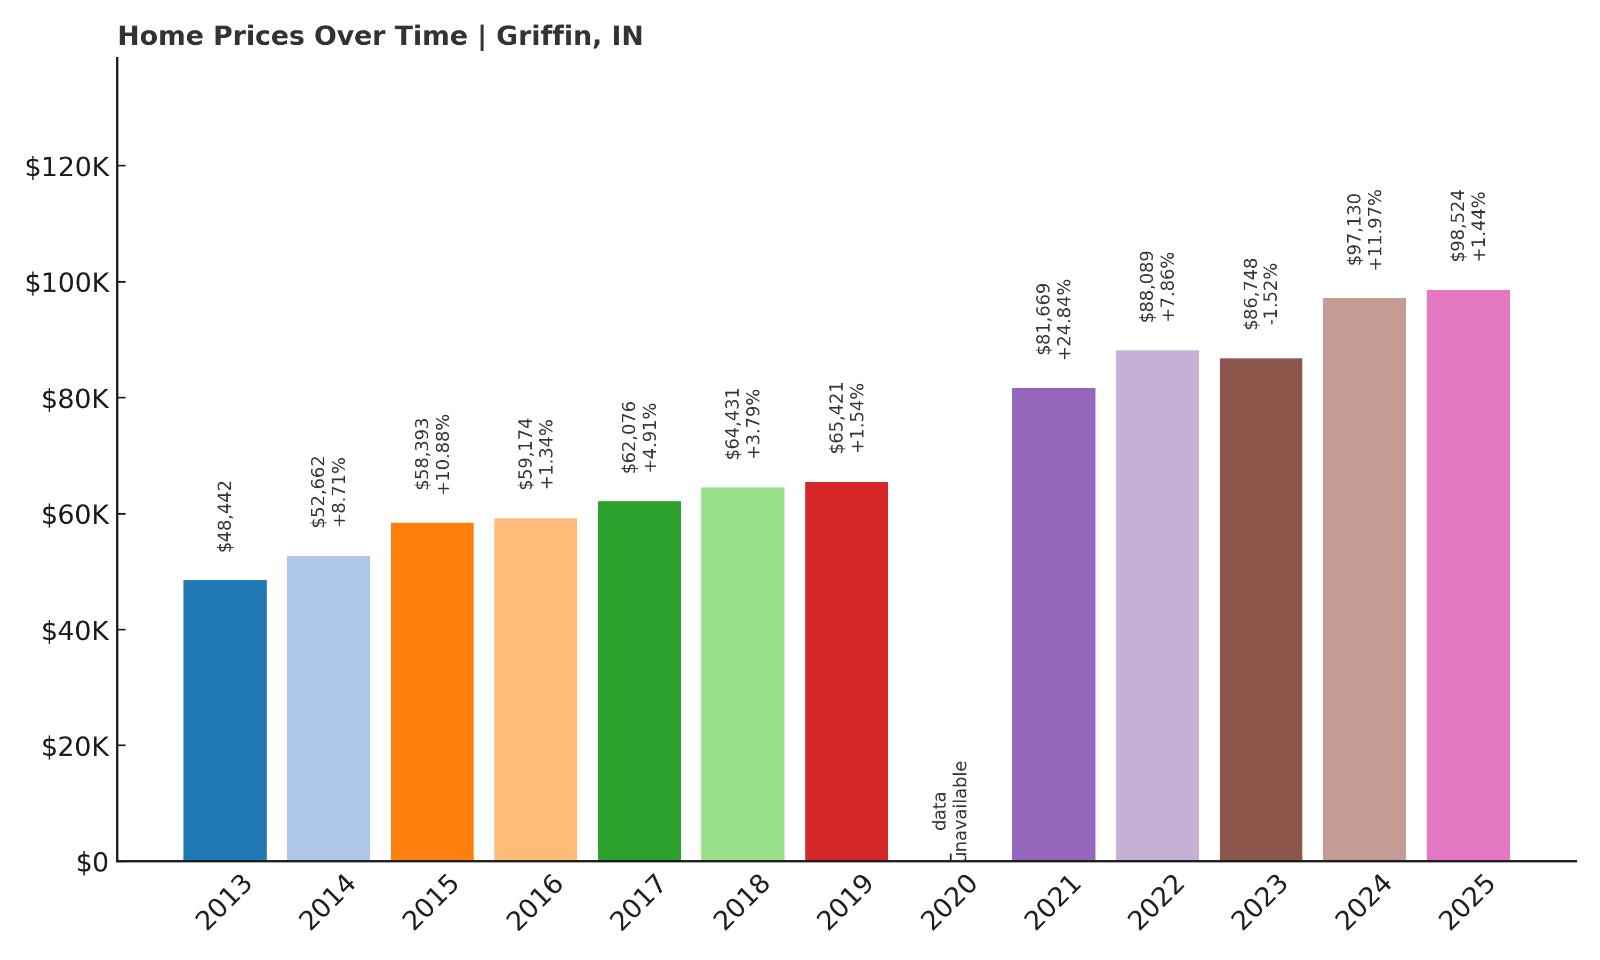
- 2010: N/A
- 2011: N/A
- 2012: N/A
- 2013: $48,442
- 2014: $52,662 (+$4,220, +8.71% from previous year)
- 2015: $58,393 (+$5,730, +10.88% from previous year)
- 2016: $59,174 (+$781, +1.34% from previous year)
- 2017: $62,076 (+$2,903, +4.91% from previous year)
- 2018: $64,431 (+$2,354, +3.79% from previous year)
- 2019: $65,421 (+$990, +1.54% from previous year)
- 2020: N/A
- 2021: $81,669 (+$16,248, +24.84% from previous year)
- 2022: $88,089 (+$6,421, +7.86% from previous year)
- 2023: $86,748 ($-1,341, -1.52% from previous year)
- 2024: $97,130 (+$10,382, +11.97% from previous year)
- 2025: $98,524 (+$1,394, +1.44% from previous year)
Griffin’s home values have more than doubled since 2013, with particularly sharp growth occurring after 2020. Though prices dipped slightly in 2023, they quickly rebounded the following year. The 2025 median sits just below $100,000, which still makes Griffin one of the most affordable towns in Indiana despite notable appreciation over the past decade.
Griffin – Affordable Living Near the Illinois Line
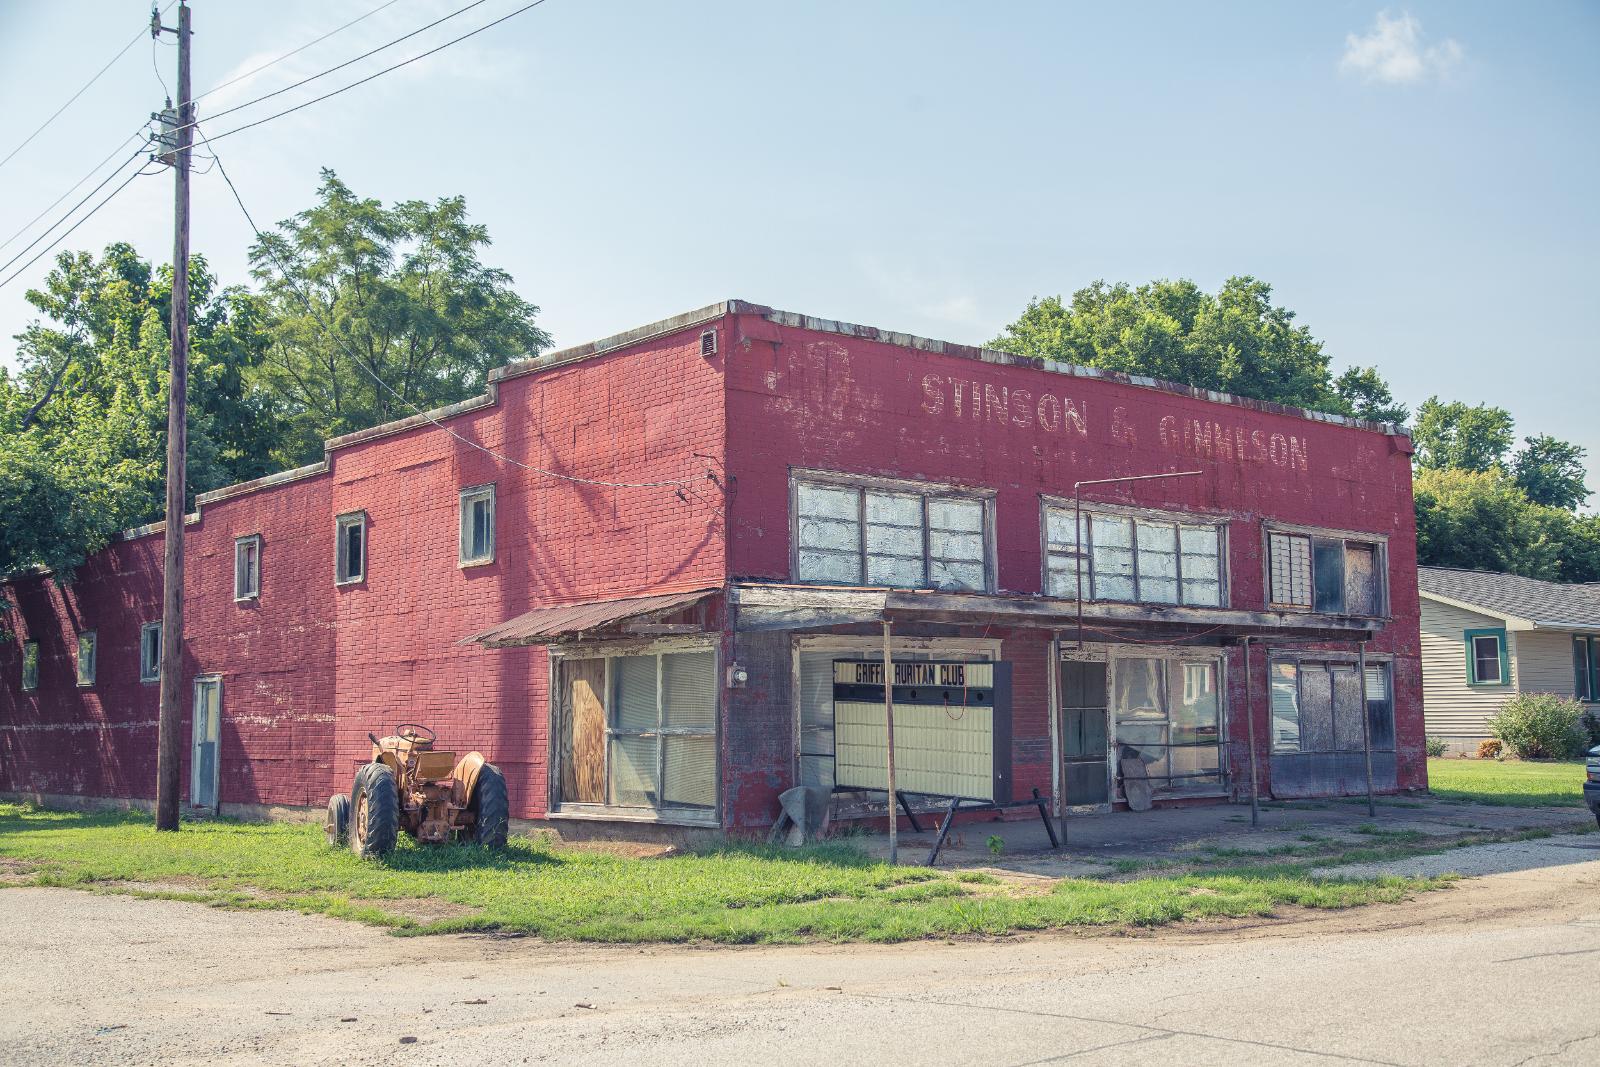
Griffin is a small town in Posey County in far southwestern Indiana, located near the Wabash River and close to the Illinois border. Its rural charm, combined with proximity to Evansville — a major economic hub — gives it an advantage for commuters looking to save on housing. The town’s size is tiny, and that scarcity keeps inventory low, making any increase in demand strongly affect prices.
Griffin’s housing stock is limited and generally older, which appeals to buyers looking for budget-friendly homes with renovation potential. The town has access to good road infrastructure via nearby Interstate 64, linking it quickly to regional job centers. As housing affordability continues to erode in urban areas, small towns like Griffin are increasingly viewed as viable alternatives. This demand shift helps explain the long-term upward pressure on home values.
5. Leavenworth – 94% Home Price Increase Since 2010
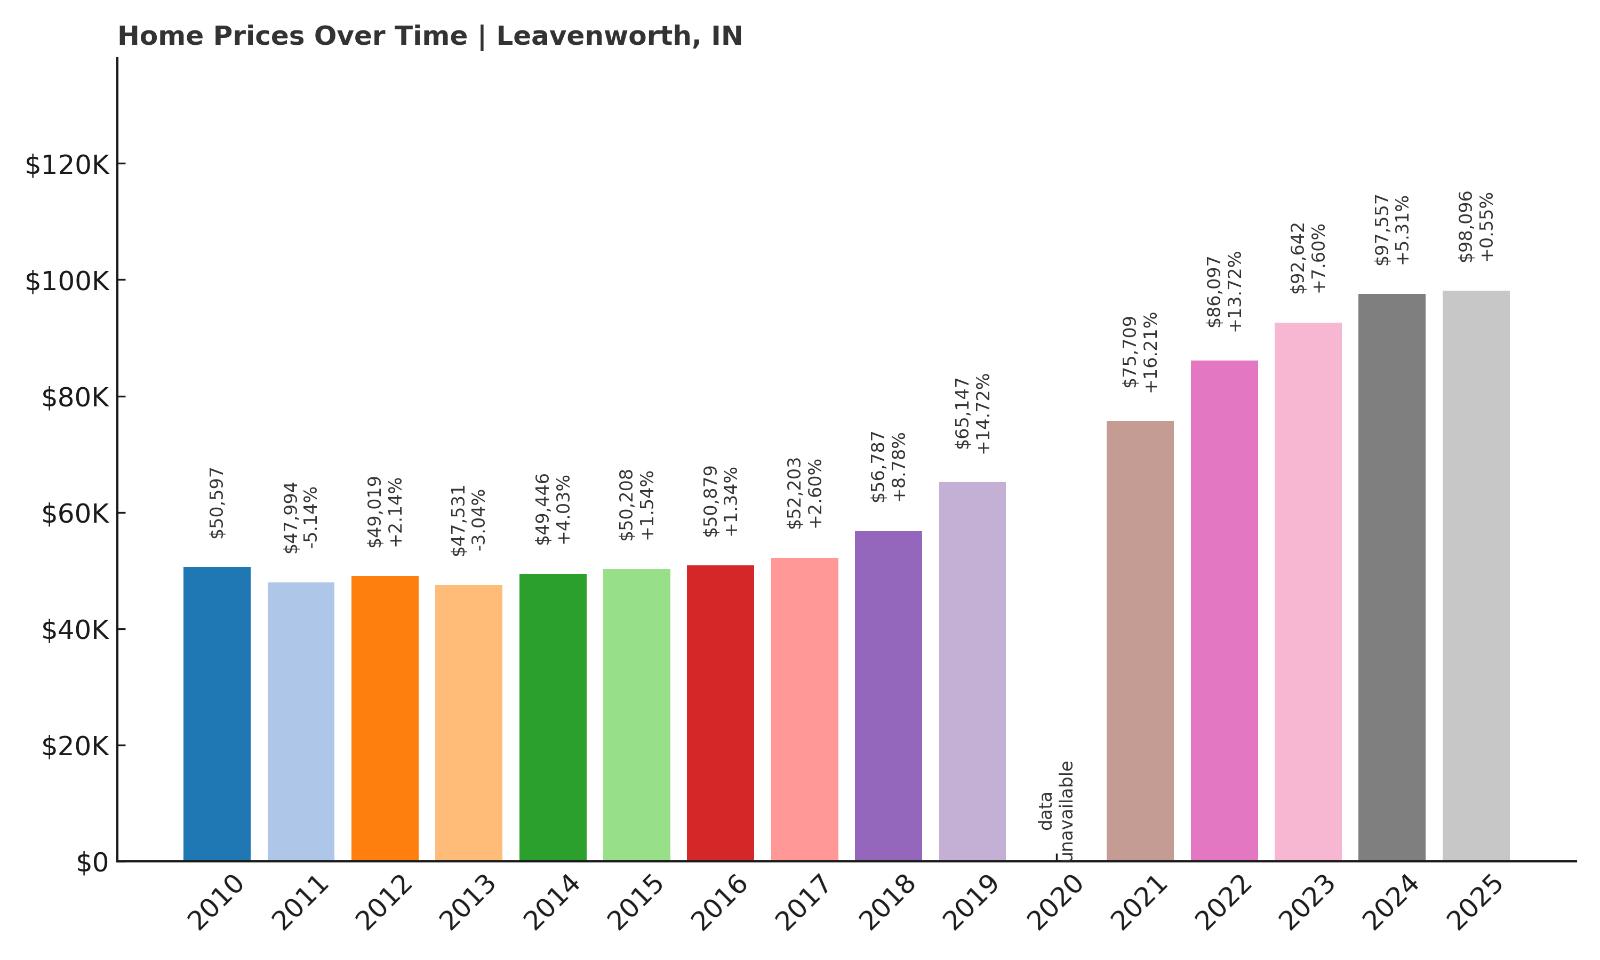
- 2010: $50,597
- 2011: $47,994 ($-2,603, -5.14% from previous year)
- 2012: $49,019 (+$1,025, +2.14% from previous year)
- 2013: $47,531 ($-1,488, -3.04% from previous year)
- 2014: $49,446 (+$1,915, +4.03% from previous year)
- 2015: $50,208 (+$761, +1.54% from previous year)
- 2016: $50,879 (+$671, +1.34% from previous year)
- 2017: $52,203 (+$1,324, +2.60% from previous year)
- 2018: $56,787 (+$4,584, +8.78% from previous year)
- 2019: $65,147 (+$8,360, +14.72% from previous year)
- 2020: N/A
- 2021: $75,709 (+$10,562, +16.21% from previous year)
- 2022: $86,097 (+$10,388, +13.72% from previous year)
- 2023: $92,642 (+$6,544, +7.60% from previous year)
- 2024: $97,557 (+$4,915, +5.31% from previous year)
- 2025: $98,096 (+$539, +0.55% from previous year)
Leavenworth’s home prices have climbed steadily since 2010, growing by nearly 94%. The most significant jumps occurred between 2018 and 2022, when the town saw consistent double-digit increases. In 2025, the average home costs just under $100,000 — still highly affordable by any standard, but nearly twice what it was 15 years ago.
Leavenworth – Scenic Bluffside Town on the Ohio River

Perched high above the Ohio River in Crawford County, Leavenworth offers sweeping views and a unique riverside setting. Its natural beauty draws tourists and weekenders, especially those visiting Hoosier National Forest and nearby Marengo Cave. The town’s elevated blufftop position historically protected it from flooding — a key advantage in a region known for riverfront towns.
Real estate here is modest but well-situated, often featuring river views or wooded backdrops. Leavenworth has long been known for its affordability and remoteness, but improved regional access and renewed tourism interest are slowly reshaping its market. As one of Indiana’s rare small towns with topographical appeal, it stands out as both livable and scenic. Even as prices rise, Leavenworth remains an excellent value for the setting it provides.
4. Bicknell – 91% Home Price Increase Since 2012
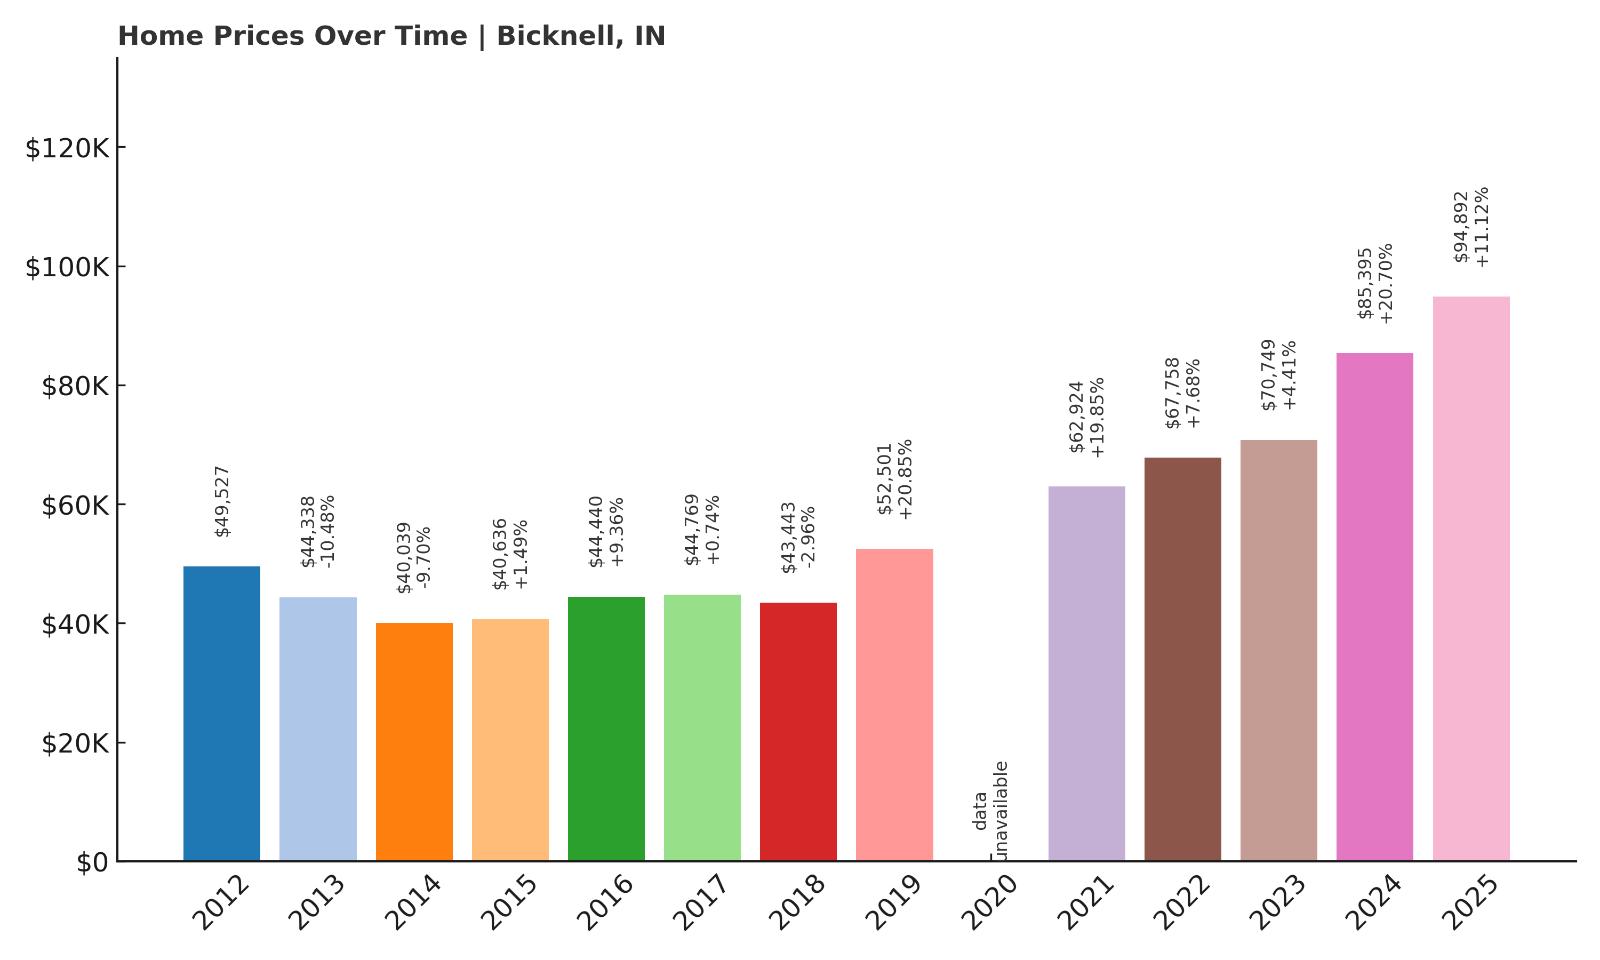
- 2010: N/A
- 2011: N/A
- 2012: $49,527
- 2013: $44,338 ($-5,189, -10.48% from previous year)
- 2014: $40,039 ($-4,299, -9.70% from previous year)
- 2015: $40,636 (+$596, +1.49% from previous year)
- 2016: $44,440 (+$3,805, +9.36% from previous year)
- 2017: $44,769 (+$328, +0.74% from previous year)
- 2018: $43,443 ($-1,326, -2.96% from previous year)
- 2019: $52,501 (+$9,058, +20.85% from previous year)
- 2020: N/A
- 2021: $62,924 (+$10,422, +19.85% from previous year)
- 2022: $67,758 (+$4,835, +7.68% from previous year)
- 2023: $70,749 (+$2,991, +4.41% from previous year)
- 2024: $85,395 (+$14,646, +20.70% from previous year)
- 2025: $94,892 (+$9,497, +11.12% from previous year)
Bicknell’s housing market has seen a major turnaround in the last decade. Although prices fell sharply in the early 2010s, they began recovering in 2015 and have since gained serious ground. From $49,527 in 2012 to $94,892 in 2025, the increase represents a 91% rise. The biggest leap came between 2023 and 2024, with a striking 20% spike — a sign of renewed attention on this overlooked town.
Bicknell – Reviving Value in a Historic Railroad Town
Located in Knox County in southwestern Indiana, Bicknell has a long industrial history tied to coal mining and railroads. While the town faced population loss and economic stagnation in past decades, recent years have brought a quiet rebound. Its affordability and proximity to Vincennes — a regional employment center — make it attractive to low- and middle-income buyers priced out of larger areas.
Bicknell’s housing stock includes many early-20th-century homes with solid structures but dated interiors, creating opportunities for renovation and value-add investments. The town benefits from local parks, essential services, and access to U.S. Highway 41. With home prices still under $100,000 and growing steadily, Bicknell presents a compelling option for budget-conscious buyers and investors alike.
3. Losantville – 95% Home Price Increase Since 2016
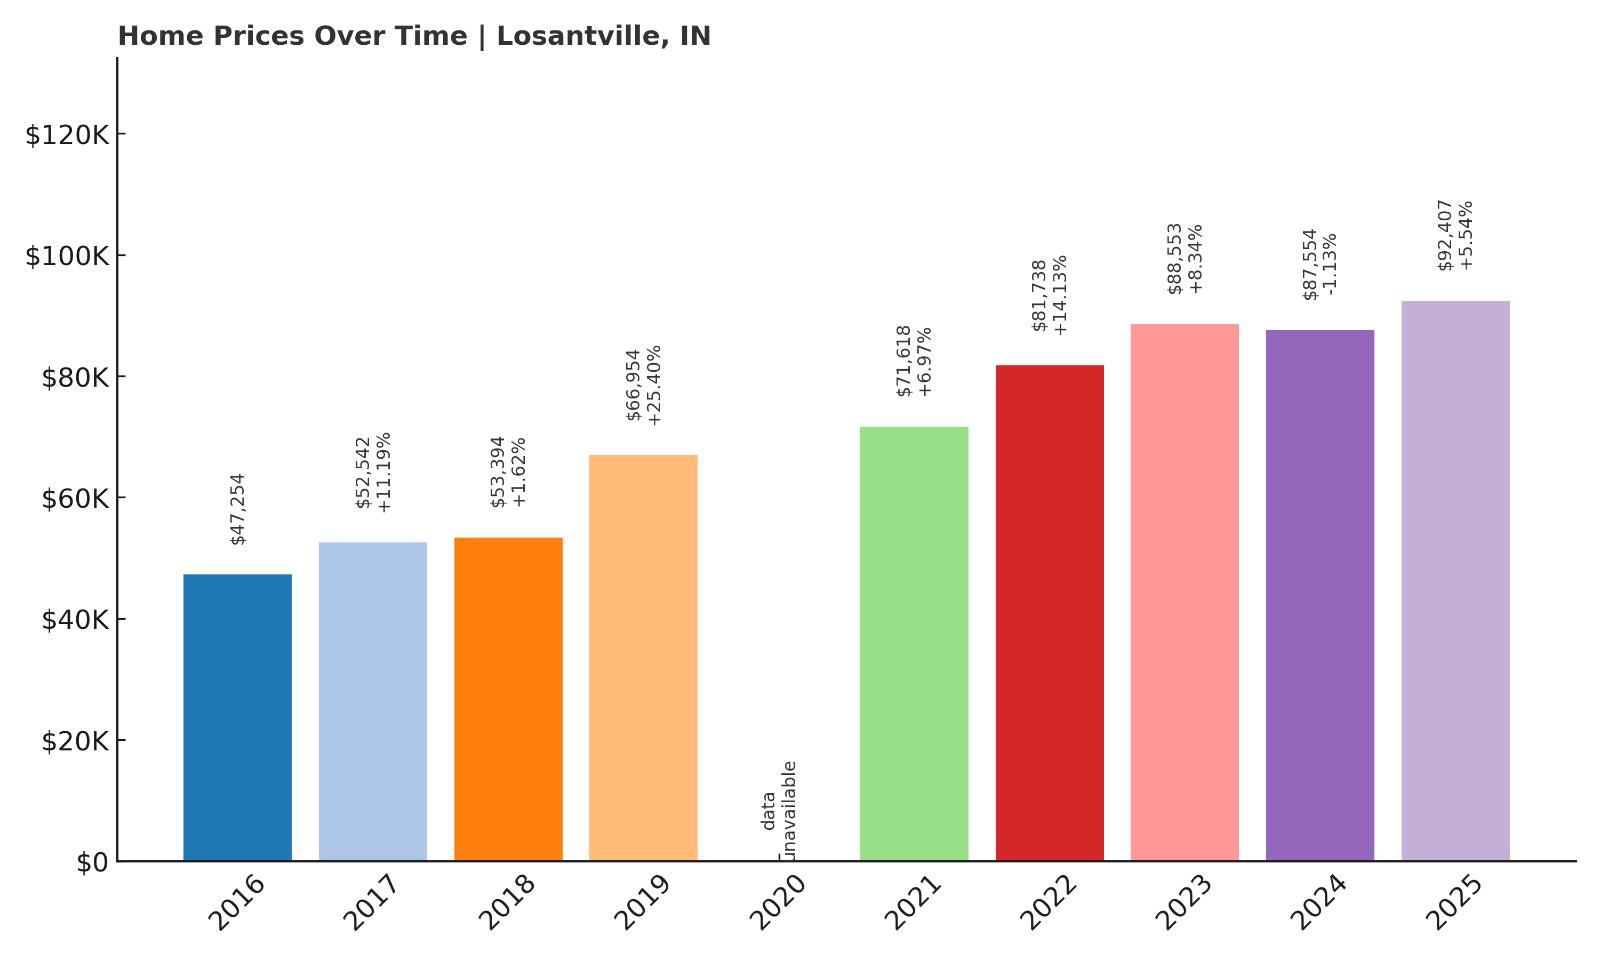
- 2010: N/A
- 2011: N/A
- 2012: N/A
- 2013: N/A
- 2014: N/A
- 2015: N/A
- 2016: $47,254
- 2017: $52,542 (+$5,287, +11.19% from previous year)
- 2018: $53,394 (+$853, +1.62% from previous year)
- 2019: $66,954 (+$13,560, +25.40% from previous year)
- 2020: N/A
- 2021: $71,618 (+$4,664, +6.97% from previous year)
- 2022: $81,738 (+$10,119, +14.13% from previous year)
- 2023: $88,553 (+$6,815, +8.34% from previous year)
- 2024: $87,554 ($-999, -1.13% from previous year)
- 2025: $92,407 (+$4,852, +5.54% from previous year)
Since entering the index in 2016, Losantville’s home prices have nearly doubled. The most dramatic gain occurred between 2018 and 2019, when prices soared by over 25% in one year. Despite a slight drop in 2024, values are back on track in 2025 at over $92,000. This steady growth illustrates an emerging market with potential for buyers looking early.
Losantville – Small Scale, Strong Momentum
🔥 Would you like to save this?
Losantville is located in Randolph County, tucked between Muncie and New Castle in east-central Indiana. It’s one of the smallest towns on the list, with fewer than 300 residents, but its location on U.S. Route 35 makes it easily accessible. While the town has no major commercial centers, it serves as a quiet residential alternative to nearby cities, with extremely low home prices that have been attracting buyers looking for space and savings.
The housing in Losantville is mostly single-story homes built mid-century or earlier. With high-speed internet increasingly available and more people working remotely, small towns like this are becoming more viable as primary residences. The data reflects this trend — even with limited housing inventory, prices are moving steadily upward, showing renewed interest and possible early-stage gentrification.
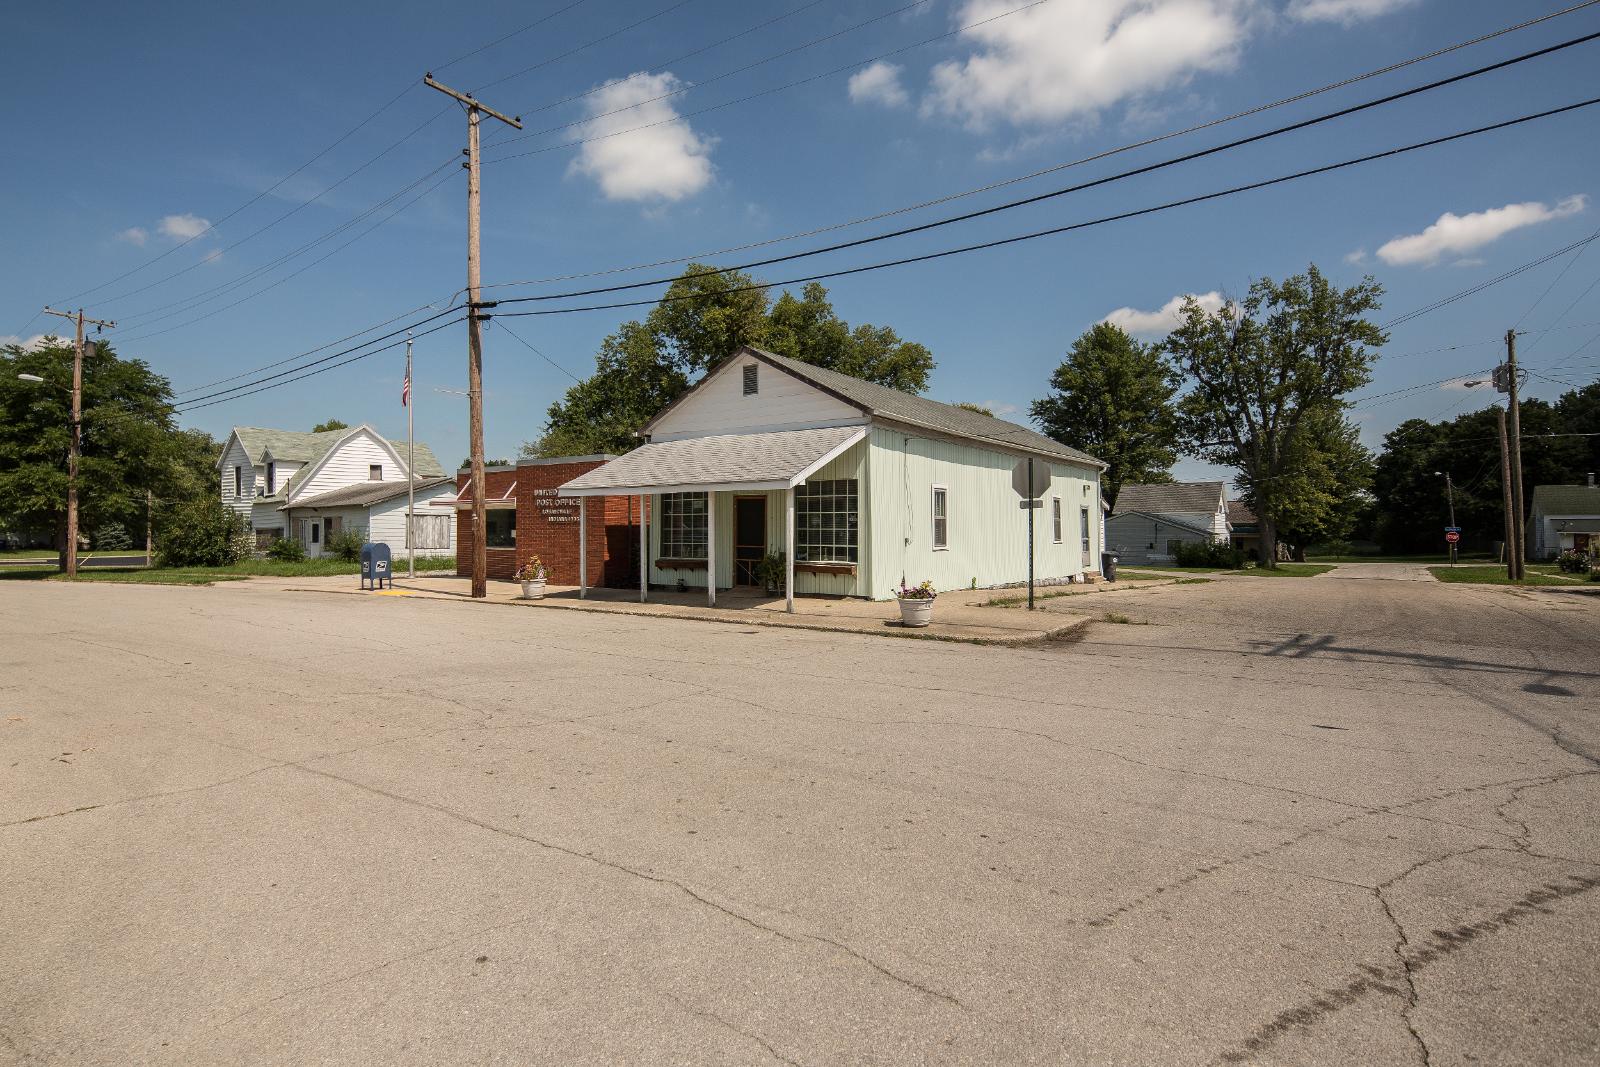
2. Gary – 127% Home Price Increase Since 2010
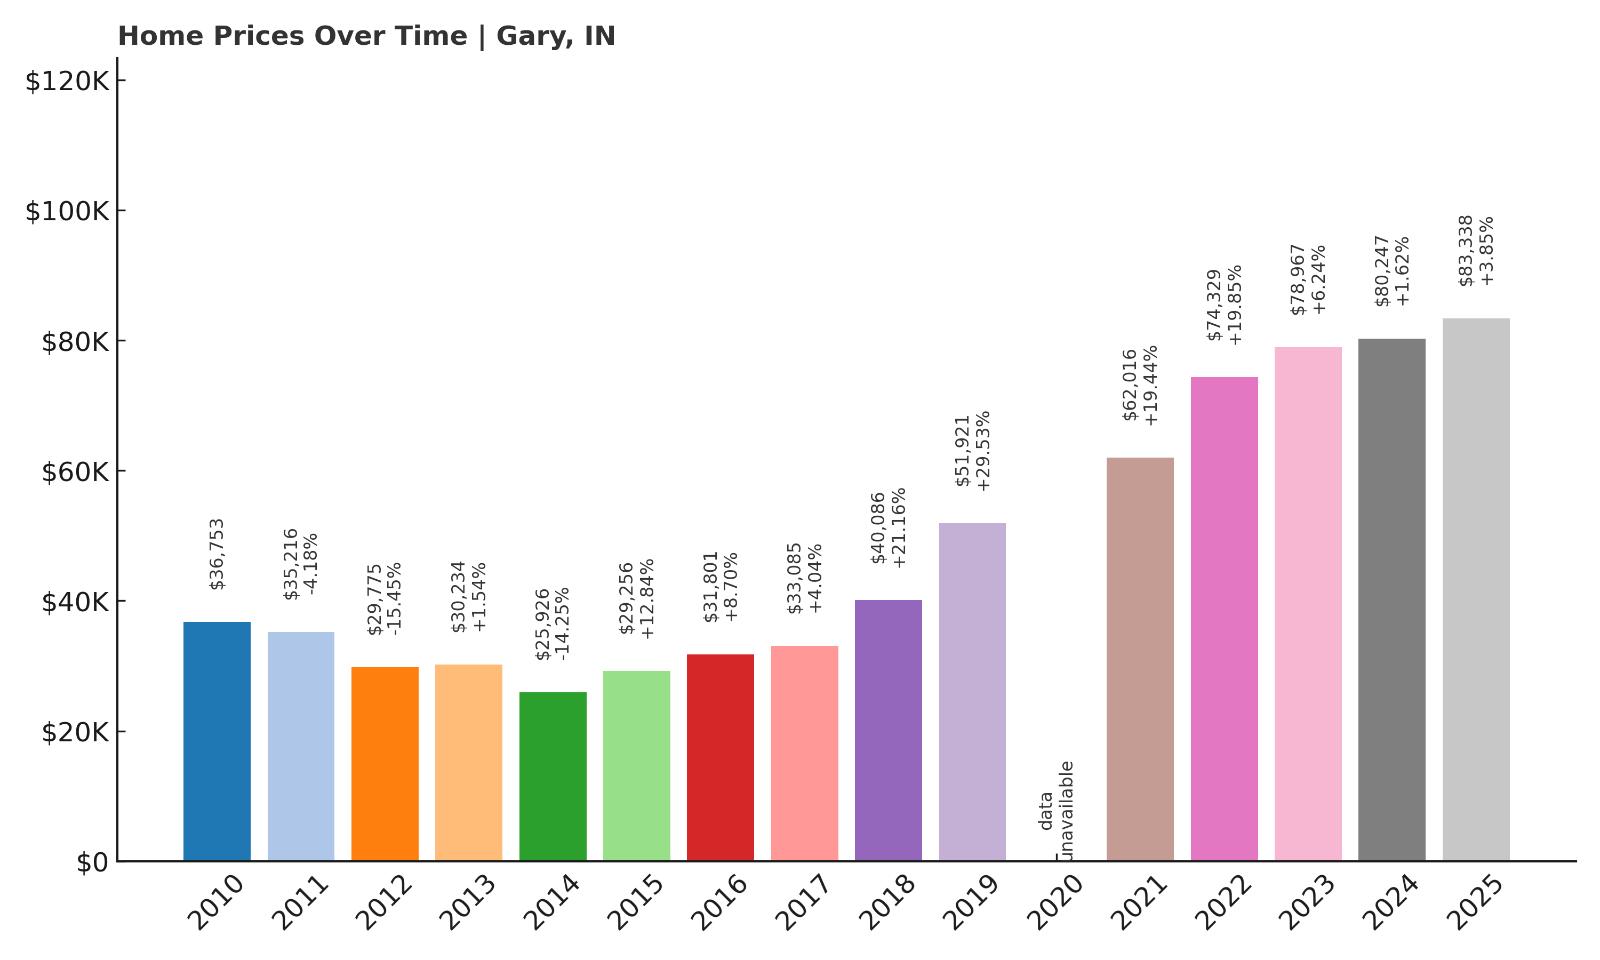
- 2010: $36,753
- 2011: $35,216 ($-1,536, -4.18% from previous year)
- 2012: $29,775 ($-5,441, -15.45% from previous year)
- 2013: $30,234 (+$459, +1.54% from previous year)
- 2014: $25,926 ($-4,308, -14.25% from previous year)
- 2015: $29,256 (+$3,330, +12.84% from previous year)
- 2016: $31,801 (+$2,545, +8.70% from previous year)
- 2017: $33,085 (+$1,284, +4.04% from previous year)
- 2018: $40,086 (+$7,001, +21.16% from previous year)
- 2019: $51,921 (+$11,836, +29.53% from previous year)
- 2020: N/A
- 2021: $62,016 (+$10,095, +19.44% from previous year)
- 2022: $74,329 (+$12,312, +19.85% from previous year)
- 2023: $78,967 (+$4,639, +6.24% from previous year)
- 2024: $80,247 (+$1,280, +1.62% from previous year)
- 2025: $83,338 (+$3,091, +3.85% from previous year)
Gary has seen major price swings over the past 15 years, with steep early declines followed by a prolonged and dramatic recovery. From a low of $25,926 in 2014, home prices have rebounded to over $83,000 — a gain of 127% since 2010. Though values remain far below the national average, the upward trend reflects changing perceptions and real demand in this post-industrial city.
Gary – Comeback Story of Northwest Indiana
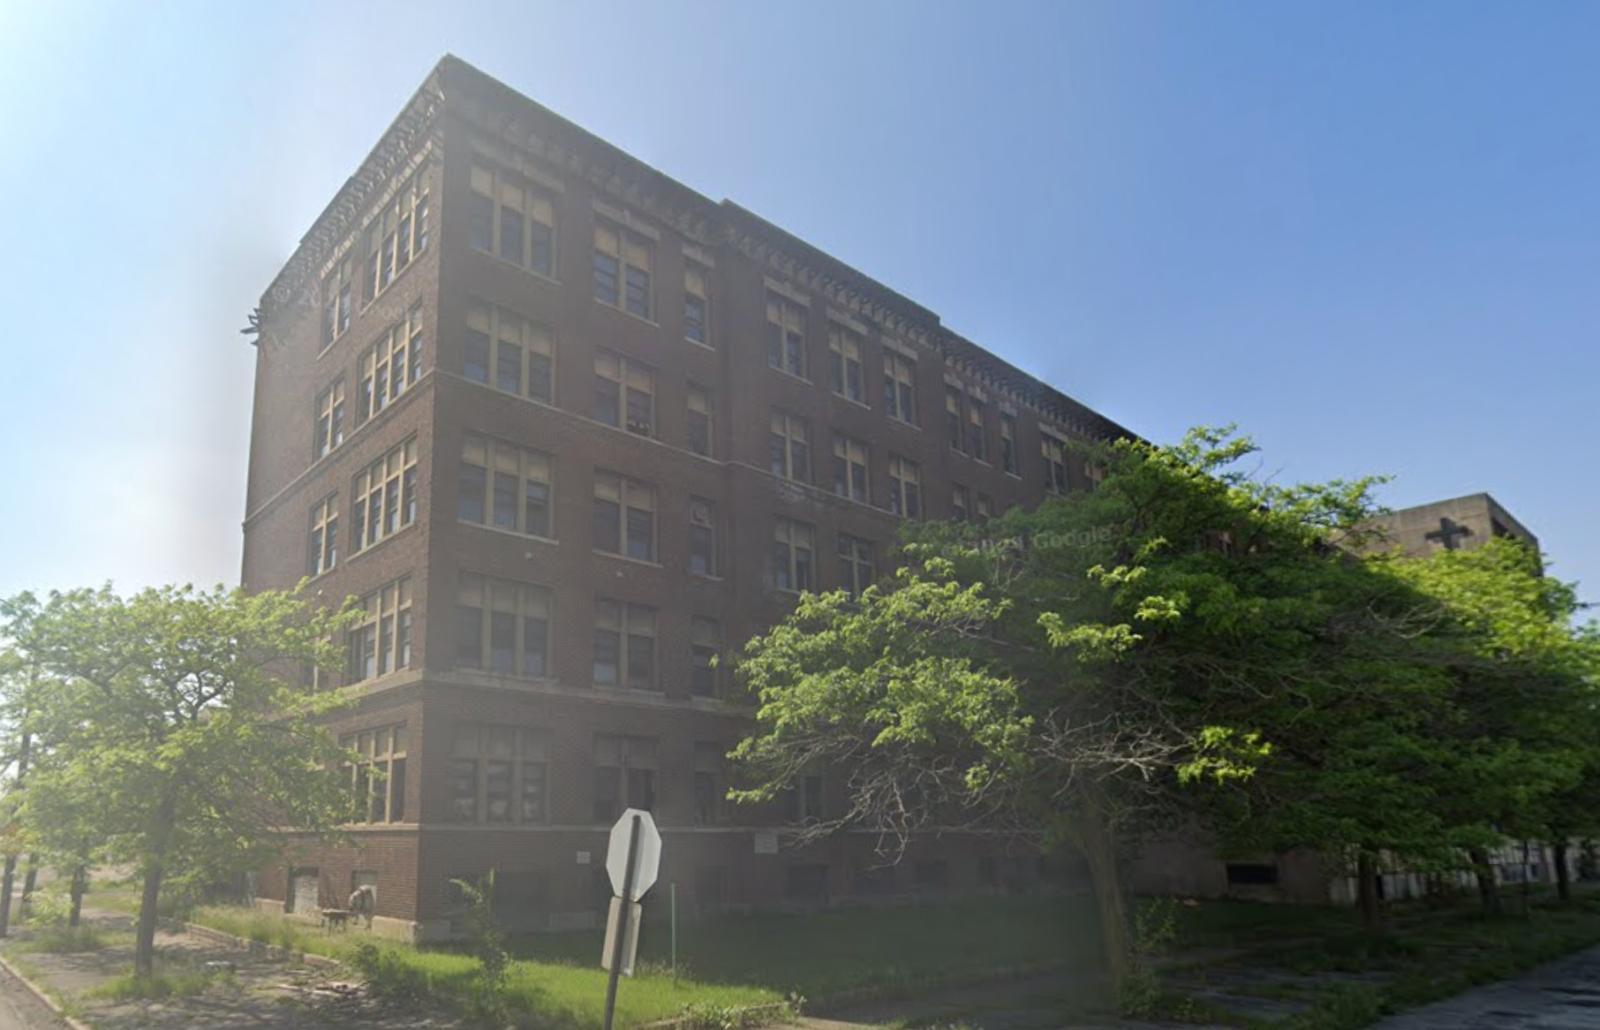
As the largest city on this list, Gary is often viewed through the lens of its decline from steel industry dominance. But that narrative is evolving. The city, located on the southern shore of Lake Michigan and less than an hour from downtown Chicago, is experiencing a slow but real resurgence. Investors have been snapping up properties, and local redevelopment efforts are showing signs of traction.
Gary’s appeal lies in its incredibly low entry prices combined with proximity to a major metro area. Many buyers are priced out of the Chicago suburbs and are now looking to Gary for opportunity. Several neighborhoods have seen consistent improvements in infrastructure, safety, and local services. While challenges remain, the data tells a story of rebounding value — and for early movers, it may be one of the best bets for long-term appreciation in Indiana.
1. Hymera – 53% Home Price Increase Since 2012
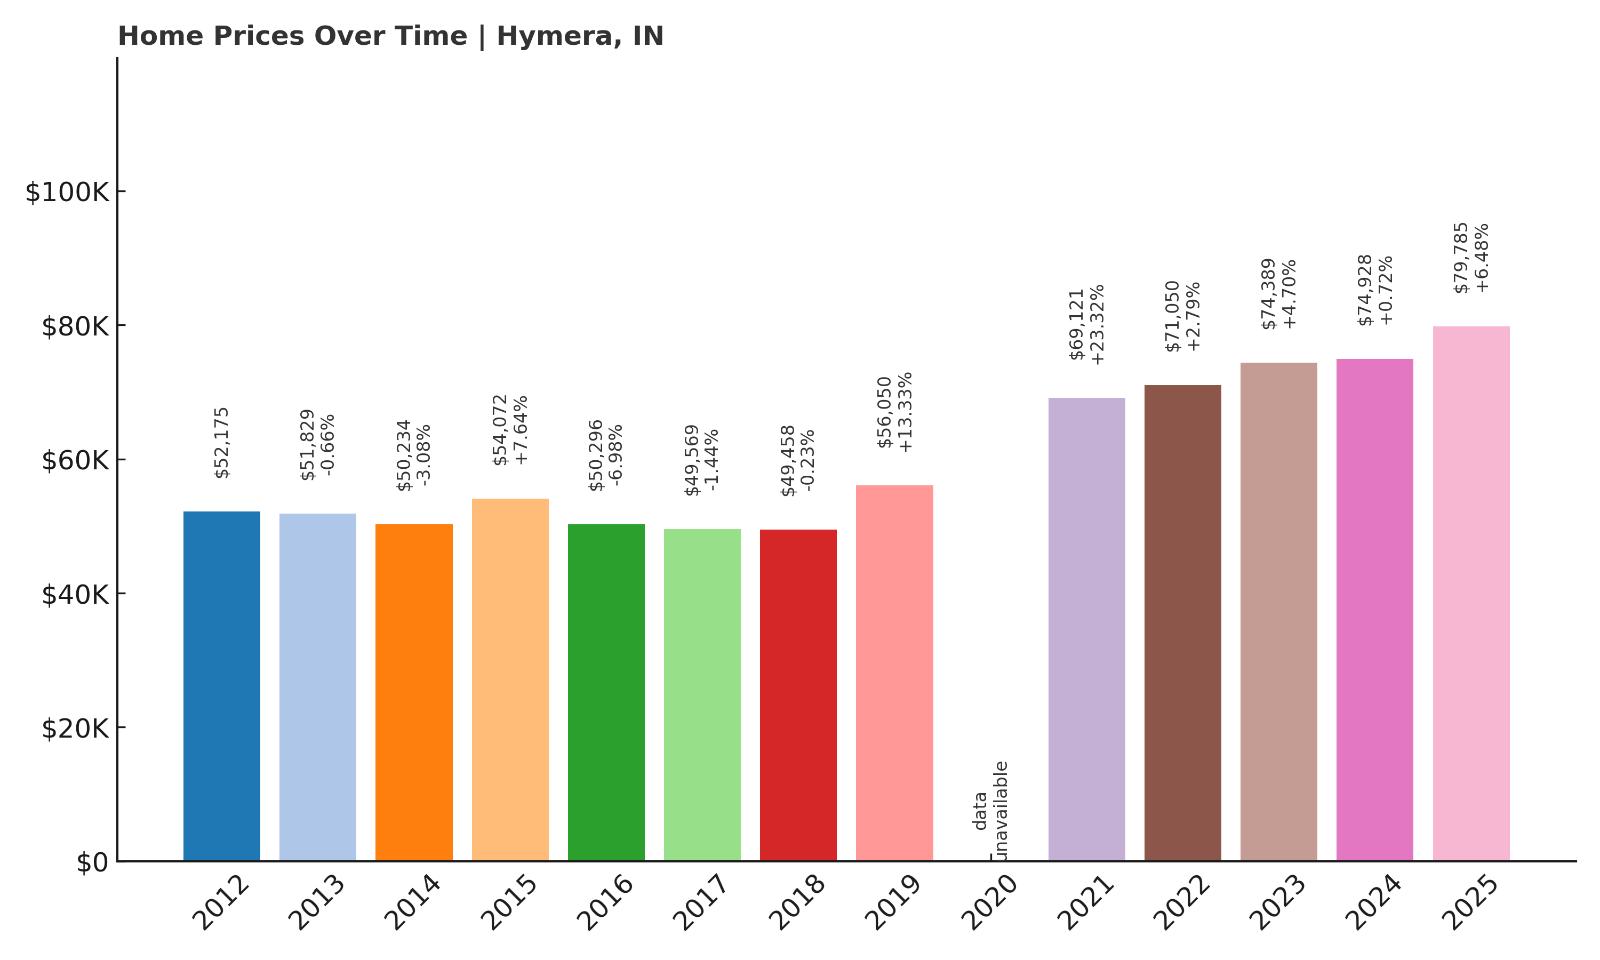
- 2010: N/A
- 2011: N/A
- 2012: $52,175
- 2013: $51,829 ($-346, -0.66% from previous year)
- 2014: $50,234 ($-1,596, -3.08% from previous year)
- 2015: $54,072 (+$3,838, +7.64% from previous year)
- 2016: $50,296 ($-3,776, -6.98% from previous year)
- 2017: $49,569 ($-726, -1.44% from previous year)
- 2018: $49,458 ($-112, -0.23% from previous year)
- 2019: $56,050 (+$6,593, +13.33% from previous year)
- 2020: N/A
- 2021: $69,121 (+$13,070, +23.32% from previous year)
- 2022: $71,050 (+$1,929, +2.79% from previous year)
- 2023: $74,389 (+$3,339, +4.70% from previous year)
- 2024: $74,928 (+$539, +0.72% from previous year)
- 2025: $79,785 (+$4,857, +6.48% from previous year)
Hymera stands as Indiana’s most affordable housing market in 2025, with home prices just under $80,000. While the town has experienced only a modest 53% increase since 2012, the market has remained stable with a few short-lived fluctuations. Most of its appreciation has come in the last five years, suggesting the early signs of gradual upward pressure.
Hymera – Stable Prices in a Historic Mining Town
Located in Sullivan County in southwestern Indiana, Hymera is a former coal-mining town that has retained much of its original character. The town is small, with a population of fewer than 800 residents, and offers a peaceful rural lifestyle. Its location off Indiana State Road 48 provides access to Terre Haute and Bloomington, making it feasible for commuting while maintaining its quiet, remote feel.
Homes in Hymera are mostly modest single-family properties, many of which were built in the mid-1900s. The area’s economy has shifted over the years from mining to service jobs and light manufacturing, which helps maintain a steady, if slow, housing market. Despite its low prices, Hymera offers strong public services, good access to nature, and a close-knit community atmosphere. For buyers seeking maximum affordability and small-town simplicity, Hymera is unmatched in 2025.


