🔥 Would you like to save this?
According to the Zillow Home Value Index, Kansas offers some of the most affordable housing options in the country. The data reveals a fascinating trend: even the least expensive towns have seen substantial value increases over the five-year period from 2020 to 2025, with some towns experiencing growth exceeding 70%. This remarkable appreciation suggests that investing in these affordable markets could yield significant returns.
While analyzing the data, it’s striking to note that the price gap between the most and least expensive towns on this list is relatively narrow – only about $26,000 separates the top from the bottom. This indicates a fairly consistent baseline of affordability across these small Kansas communities, despite their varying growth rates.
In order to come up with the very specific design ideas, we create most designs with the assistance of state-of-the-art AI interior design software. Also, assume links that take you off the site are affiliate links such as links to Amazon. this means we may earn a commission if you buy something.
Perhaps most interestingly, many of these towns have seen their greatest price acceleration between 2020-2025, coinciding with the post-pandemic housing boom. Towns like Kiowa and Moline have experienced price jumps of over 68%, suggesting that even remote rural communities weren’t immune to the nationwide real estate surge.
22. Oswego Home Prices Chart

Here are the historical home prices and percentage change over time:
- 2025 value: $71,306
- 2020 value: $50,049
- 2015 value: N/A
- 2010 value: N/A
- % Change from 2020 to 2025: 42.47%
- % Change from 2015 to 2025: N/A
- % Change from 2010 to 2025: N/A
About Oswego

Nestled in southeastern Kansas, Oswego offers you an impressive investment opportunity with its remarkable 42% growth over just five years. This charming small town boasts the highest home values among the most affordable Kansas markets, suggesting a hidden gem status. Despite its smaller population, property values have climbed steadily, making it an attractive option for first-time homebuyers looking to build equity.
21. Kinsley Home Prices Chart

Historic home prices and percent change over time:
- 2025 value: $69,966
- 2020 value: $44,639
- 2015 value: N/A
- 2010 value: N/A
- % Change from 2020 to 2025: 56.74%
- % Change from 2015 to 2025: N/A
- % Change from 2010 to 2025: N/A
About Kinsley

You’ll find exceptional value in Kinsley, where home prices have surged by nearly 57% in just five years! Known as the “Midway Point between New York and San Francisco,” this unique geographical distinction gives the town a special place in American lore. The impressive growth rate signals a revitalizing market where your housing dollar stretches remarkably far compared to coastal regions.
20. Holyrood Home Prices Chart

Historical home prices and percentage changes:
- 2025 value: $69,585
- 2020 value: $42,281
- 2015 value: N/A
- 2010 value: N/A
- % Change from 2020 to 2025: 64.58%
- % Change from 2015 to 2025: N/A
- % Change from 2010 to 2025: N/A
About Holyrood

Imagine securing a home for under $70,000 that’s increased in value by nearly 65% in just five years! Holyrood delivers exactly that opportunity. This small agricultural community offers you the quintessential Kansas small-town experience with surprisingly robust property appreciation. The dramatic price growth suggests a market that’s being discovered by savvy investors and homebuyers looking for affordable entry points.
19. Bushton Home Prices Chart

Here are the historical home prices and percentage change over time:
- 2025 value: $69,296
- 2020 value: $65,160
- 2015 value: N/A
- 2010 value: N/A
- % Change from 2020 to 2025: 6.35%
- % Change from 2015 to 2025: N/A
- % Change from 2010 to 2025: N/A
About Bushton

Looking for market stability? Bushton stands out as the anomaly on our list with a modest 6.35% five-year appreciation rate. While other towns experienced dramatic surges, your investment here would have provided steadier, more predictable growth. This central Kansas community presents a unique case study of a more mature market among otherwise rapidly appreciating small towns.
18. Ashland Home Prices Chart

Historical home prices and percent changes:
- 2025 value: $69,068
- 2020 value: $44,436
- 2015 value: N/A
- 2010 value: N/A
- % Change from 2020 to 2025: 55.43%
- % Change from 2015 to 2025: N/A
- % Change from 2010 to 2025: N/A
About Ashland

Your dollars stretch remarkably far in Ashland, where home values have rocketed up by over 55% since 2020. Located in Clark County near the Oklahoma border, this rural gem offers genuine small-town living with surprising investment potential. The substantial five-year growth rate suggests an increasingly discovered market that still maintains exceptional affordability.
17. Buffalo Home Prices Chart

Here are the historical home prices and percentage changes over time:
- 2025 value: $67,666
- 2020 value: $50,840
- 2015 value: $48,286
- 2010 value: N/A
- % Change from 2020 to 2025: 33.10%
- % Change from 2015 to 2025: 40.14%
- % Change from 2010 to 2025: N/A
About Buffalo

Buffalo presents a fascinating case of accelerated growth, with prices advancing faster in the last five years than in the previous five. You’ll appreciate how this southeastern Kansas community offers both affordability and consistent appreciation, with over 40% growth since 2015. This town stands out for having more comprehensive historical data, showing a pattern of steady, reliable value increases.
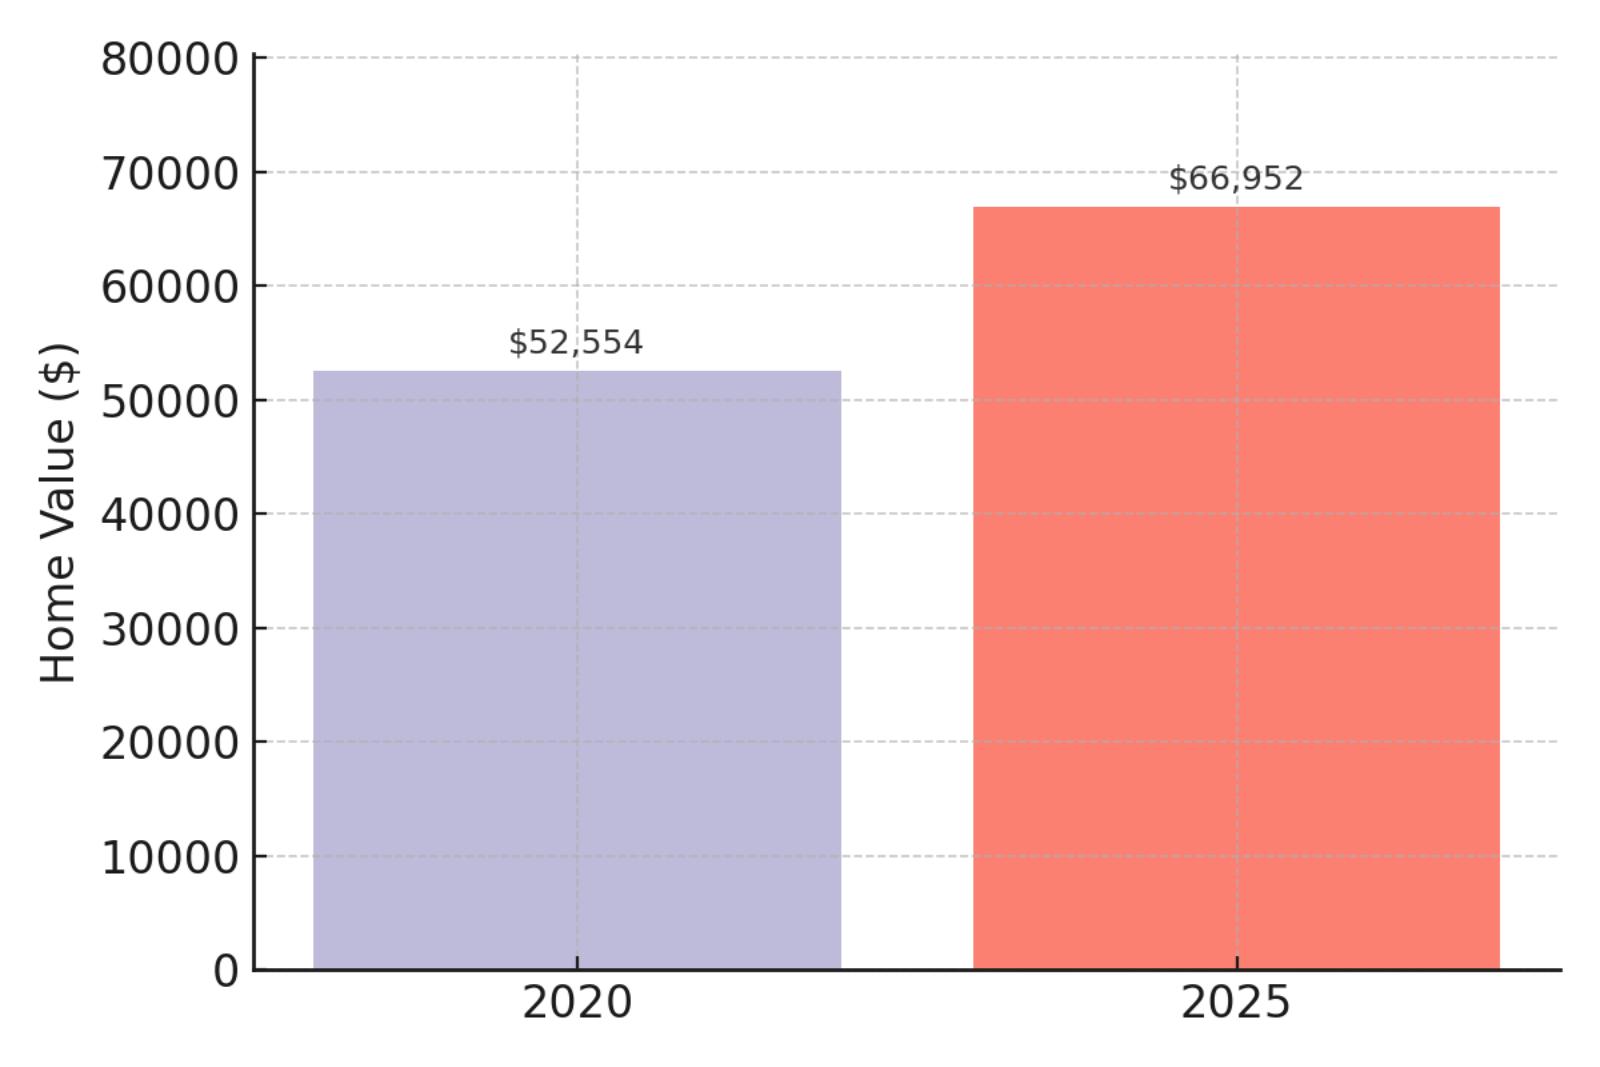
16. Macksville Home Prices Chart
🔥 Would you like to save this?
Historical home prices and percentage change:
- 2025 value: $66,952
- 2020 value: $52,554
- 2015 value: N/A
- 2010 value: N/A
- % Change from 2020 to 2025: 27.40%
- % Change from 2015 to 2025: N/A
- % Change from 2010 to 2025: N/A
About Macksville

In Macksville, your real estate dollar combines affordability with solid growth potential. This small agricultural community has seen home values increase by over 27% in five years, offering moderate but reliable appreciation. Situated in the heart of Kansas farming country, Macksville provides a quintessential rural lifestyle with property values that continue to strengthen steadily.
15. Howard Home Prices Chart

Home price history and percentage changes:
- 2025 value: $65,547
- 2020 value: $49,962
- 2015 value: N/A
- 2010 value: N/A
- % Change from 2020 to 2025: 31.19%
- % Change from 2015 to 2025: N/A
- % Change from 2010 to 2025: N/A
About Howard

Discover Howard, where your homebuying dollar has grown by more than 31% in just five years. This peaceful southeastern Kansas town delivers authentic small-town charm combined with surprising real estate appreciation. With average home values still under $66,000, Howard represents one of those rare markets where genuine affordability meets solid investment potential.
14. Bazine Home Prices Chart

Here are the historical home prices and percentage change over time:
- 2025 value: $64,949
- 2020 value: $55,318
- 2015 value: N/A
- 2010 value: N/A
- % Change from 2020 to 2025: 17.41%
- % Change from 2015 to 2025: N/A
- % Change from 2010 to 2025: N/A
About Bazine

Your search for moderate, steady growth might lead you to Bazine, a western Kansas community where home values have appreciated at a modest but reliable 17.41% over five years. This makes it one of the more stable markets on our list, avoiding the dramatic swings seen elsewhere. The slower appreciation rate could signal opportunities for buyers looking to enter a market with potential upside.
13. Moran Home Prices Chart

Historical home prices and percentage changes:
- 2025 value: $62,864
- 2020 value: $43,467
- 2015 value: $39,127
- 2010 value: N/A
- % Change from 2020 to 2025: 44.63%
- % Change from 2015 to 2025: 60.67%
- % Change from 2010 to 2025: N/A
About Moran

Witness the remarkable transformation in Moran, where home values have soared over 60% in a decade! Few markets offer this combination of extreme affordability and strong appreciation. This eastern Kansas gem shows consistent growth across both measurement periods, suggesting a market with sustainable momentum rather than a flash-in-the-pan surge.
12. Moline Home Prices Chart

Home price history and percent changes:
- 2025 value: $61,458
- 2020 value: $36,533
- 2015 value: N/A
- 2010 value: N/A
- % Change from 2020 to 2025: 68.23%
- % Change from 2015 to 2025: N/A
- % Change from 2010 to 2025: N/A
About Moline

Prepare to be amazed by Moline’s extraordinary growth story—a stunning 68% increase in just five years! This southeastern Kansas town represents one of the strongest performing markets on our list. Located in Elk County, Moline offers you the perfect combination of rock-bottom prices and explosive appreciation potential, making it an investor’s dream in the heartland.
11. Kiowa Home Prices Chart
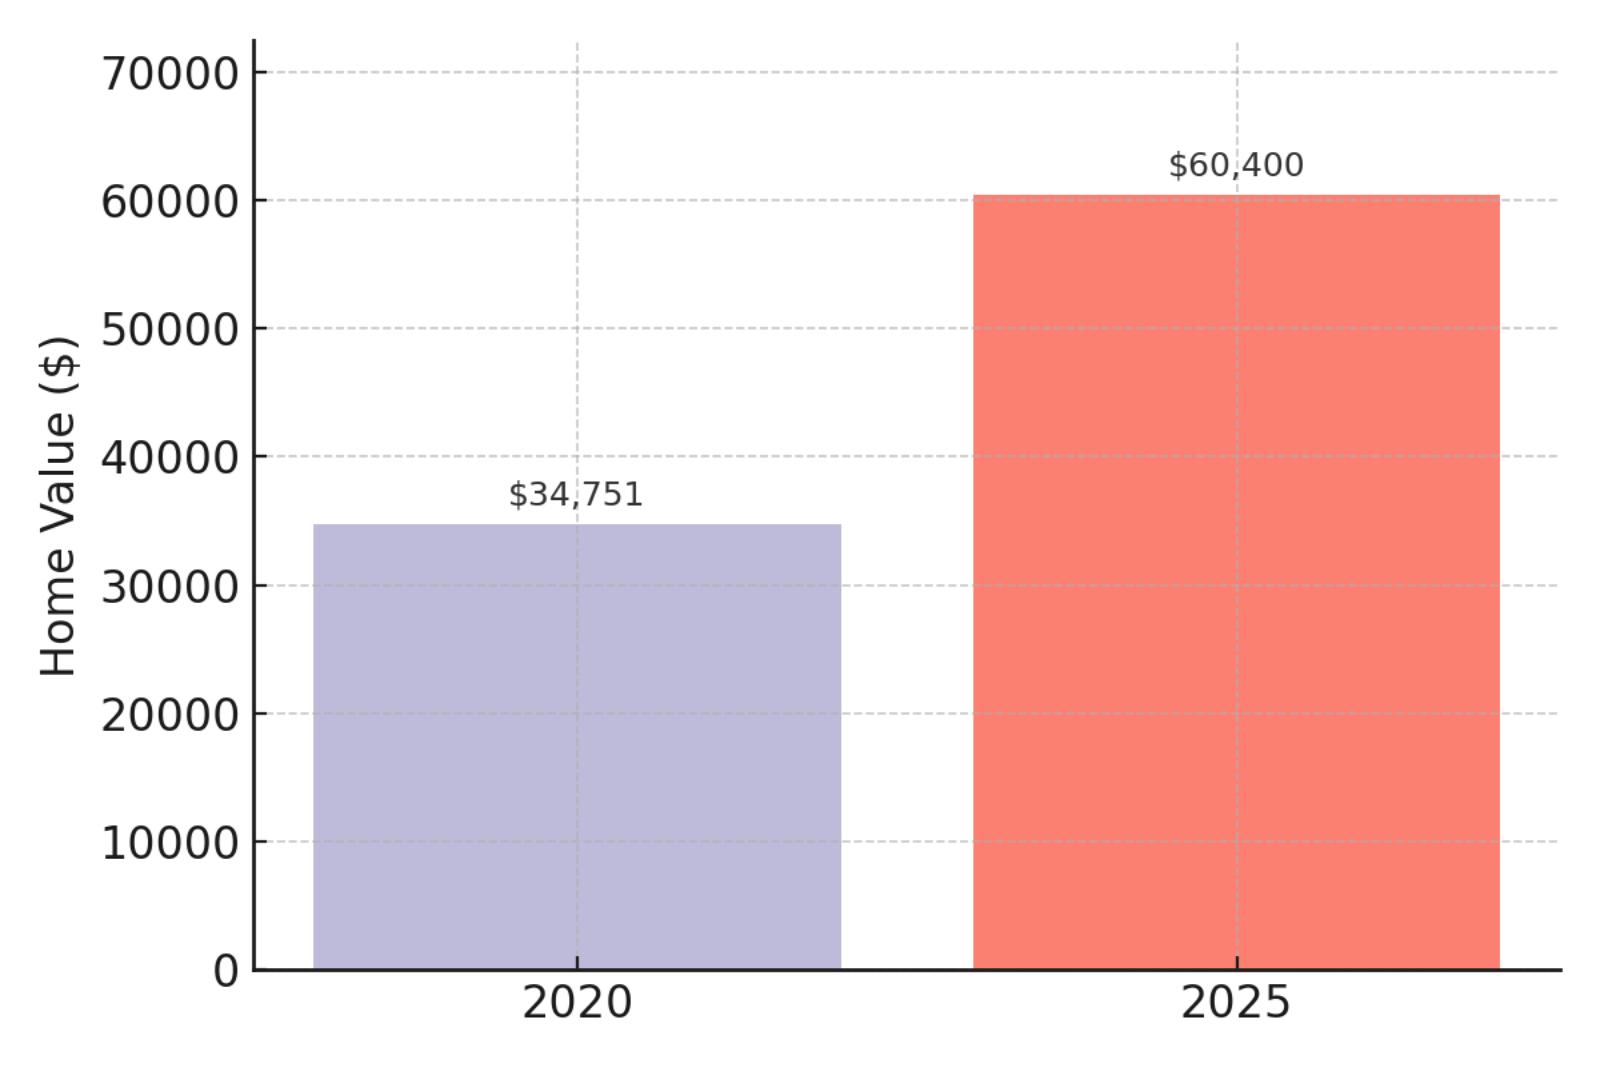
Here are the historical home prices and percentage change over time:
- 2025 value: $60,400
- 2020 value: $34,751
- 2015 value: N/A
- 2010 value: N/A
- % Change from 2020 to 2025: 73.81%
- % Change from 2015 to 2025: N/A
- % Change from 2010 to 2025: N/A
About Kiowa
Feel the market momentum in Kiowa, champion of our list with an extraordinary 73.81% five-year appreciation rate! This southern Kansas border town has transformed from ultra-affordable to merely very affordable, delivering tremendous returns for homeowners. Despite this remarkable growth, average home values remain accessible at just over $60,000—a price point that’s virtually extinct in most American housing markets.
10. Stafford Home Prices Chart

🔥 Would you like to save this?
Historical home prices and percentage changes:
- 2025 value: $60,036
- 2020 value: $43,768
- 2015 value: N/A
- 2010 value: N/A
- % Change from 2020 to 2025: 37.17%
- % Change from 2015 to 2025: N/A
- % Change from 2010 to 2025: N/A
About Stafford

You’ll find Stafford’s housing market offers that perfect middle ground of strong growth without the volatility of some neighboring towns. With a healthy 37% appreciation over five years, this central Kansas community demonstrates sustainable momentum. The $60,000 average home value represents exceptional affordability combined with solid investment performance.
9. Chetopa Home Prices Chart

Here are the historical home prices and percentage change over time:
- 2025 value: $59,594
- 2020 value: $47,347
- 2015 value: N/A
- 2010 value: N/A
- % Change from 2020 to 2025: 25.87%
- % Change from 2015 to 2025: N/A
- % Change from 2010 to 2025: N/A
About Chetopa

Sitting right on the Oklahoma border, Chetopa offers you a modest but respectable 25.87% five-year return on your housing investment. This southeastern Kansas town combines affordability with moderate growth, making it ideal for buyers seeking stability over speculation. With average values below $60,000, Chetopa reminds us that homeownership remains attainable in select markets.
8. Florence Home Prices Chart

Historical home prices and percent changes:
- 2025 value: $57,806
- 2020 value: $43,287
- 2015 value: $41,817
- 2010 value: N/A
- % Change from 2020 to 2025: 33.54%
- % Change from 2015 to 2025: 38.23%
- % Change from 2010 to 2025: N/A
About Florence

Take note of Florence’s unique growth pattern, where the market remained relatively flat from 2015-2020 before accelerating dramatically in recent years. Your investment here would have seen most of its 38% ten-year appreciation concentrated in the last five years. This central Kansas town demonstrates how rural markets can suddenly catch fire after periods of stability.
7. Bison Home Prices Chart
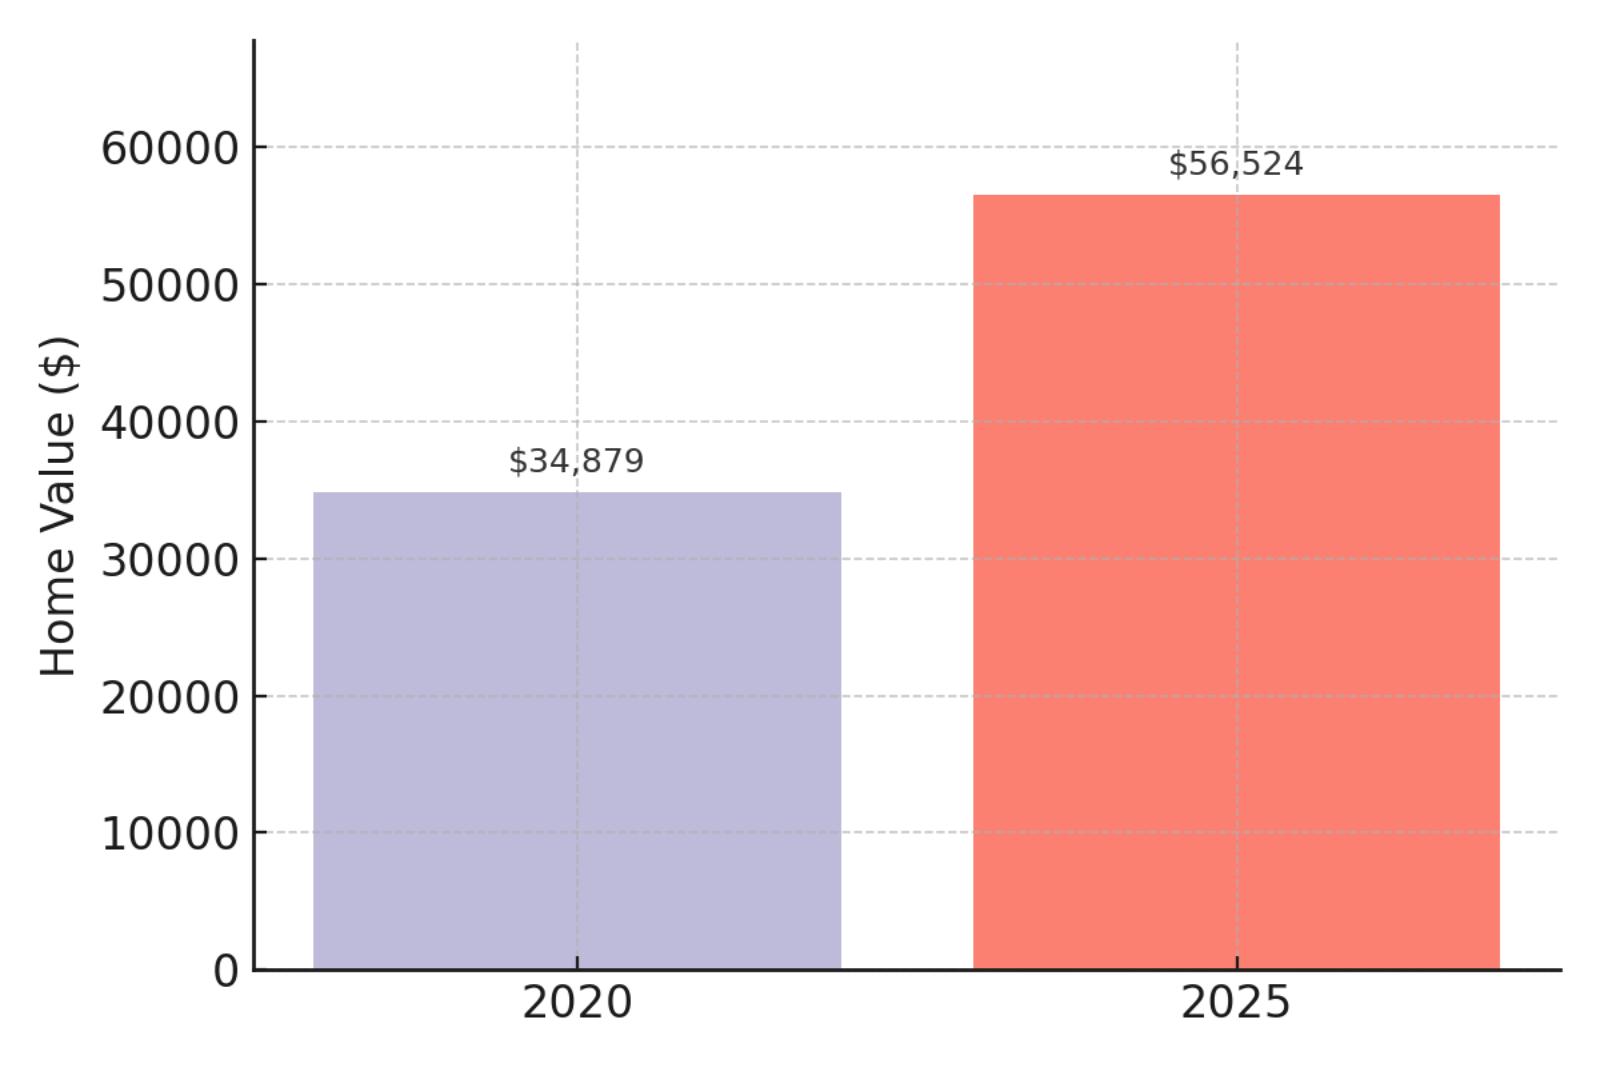
Home price history and percentage changes:
- 2025 value: $56,524
- 2020 value: $34,879
- 2015 value: N/A
- 2010 value: N/A
- % Change from 2020 to 2025: 62.06%
- % Change from 2015 to 2025: N/A
- % Change from 2010 to 2025: N/A
About Bison

Marvel at Bison’s explosive growth rate—homes here have surged in value by an eye-popping 62% since 2020! This tiny central Kansas community exemplifies how even the most rural markets have participated in the recent housing boom. Starting from an extremely low base in 2020, Bison has emerged as one of the state’s fastest-appreciating small towns while still maintaining extraordinary affordability.
6. Coffeyville Home Prices Chart
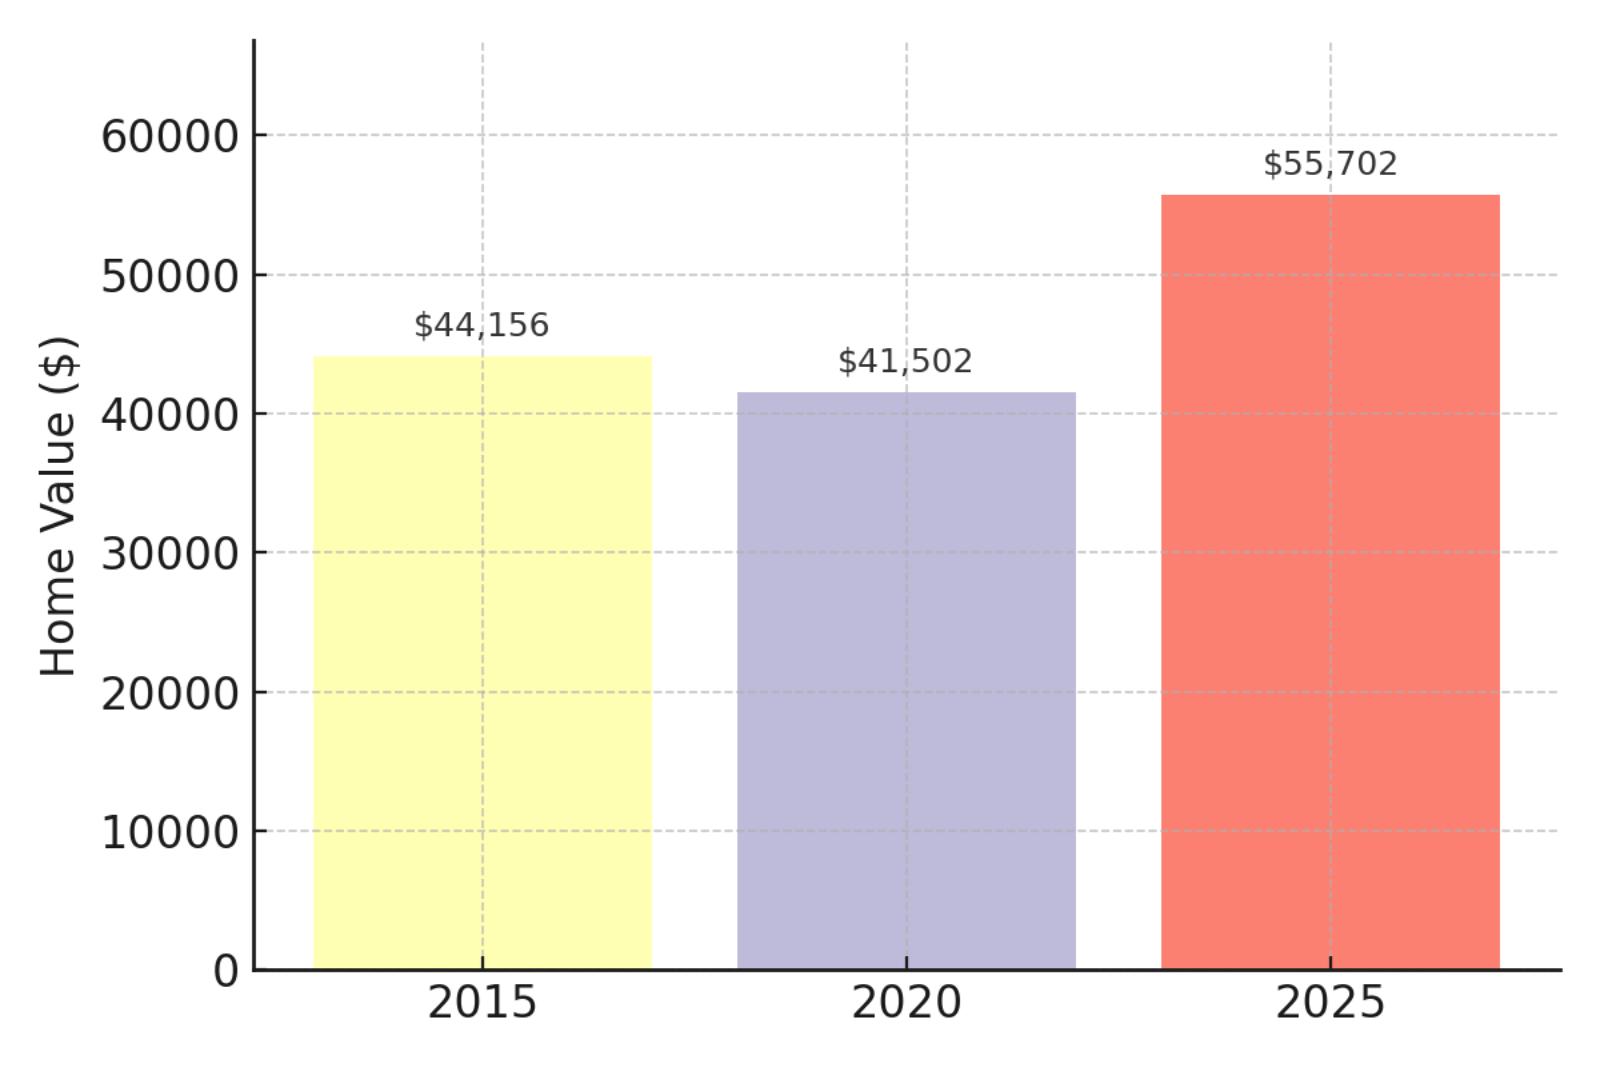
Historical home prices and percentage changes:
- 2025 value: $55,702
- 2020 value: $41,502
- 2015 value: $44,156
- 2010 value: N/A
- % Change from 2020 to 2025: 34.22%
- % Change from 2015 to 2025: 26.15%
- % Change from 2010 to 2025: N/A
About Coffeyville

🔥 Would you like to save this?
Coffeyville’s housing market tells an intriguing recovery story—prices actually declined between 2015 and 2020 before surging 34% over the last five years. This southeastern Kansas town near the Oklahoma border demonstrates housing market resilience. Your investment dollar not only buys significant property here but participates in a market that has overcome previous challenges to deliver solid recent returns.
5. Otis Home Prices Chart
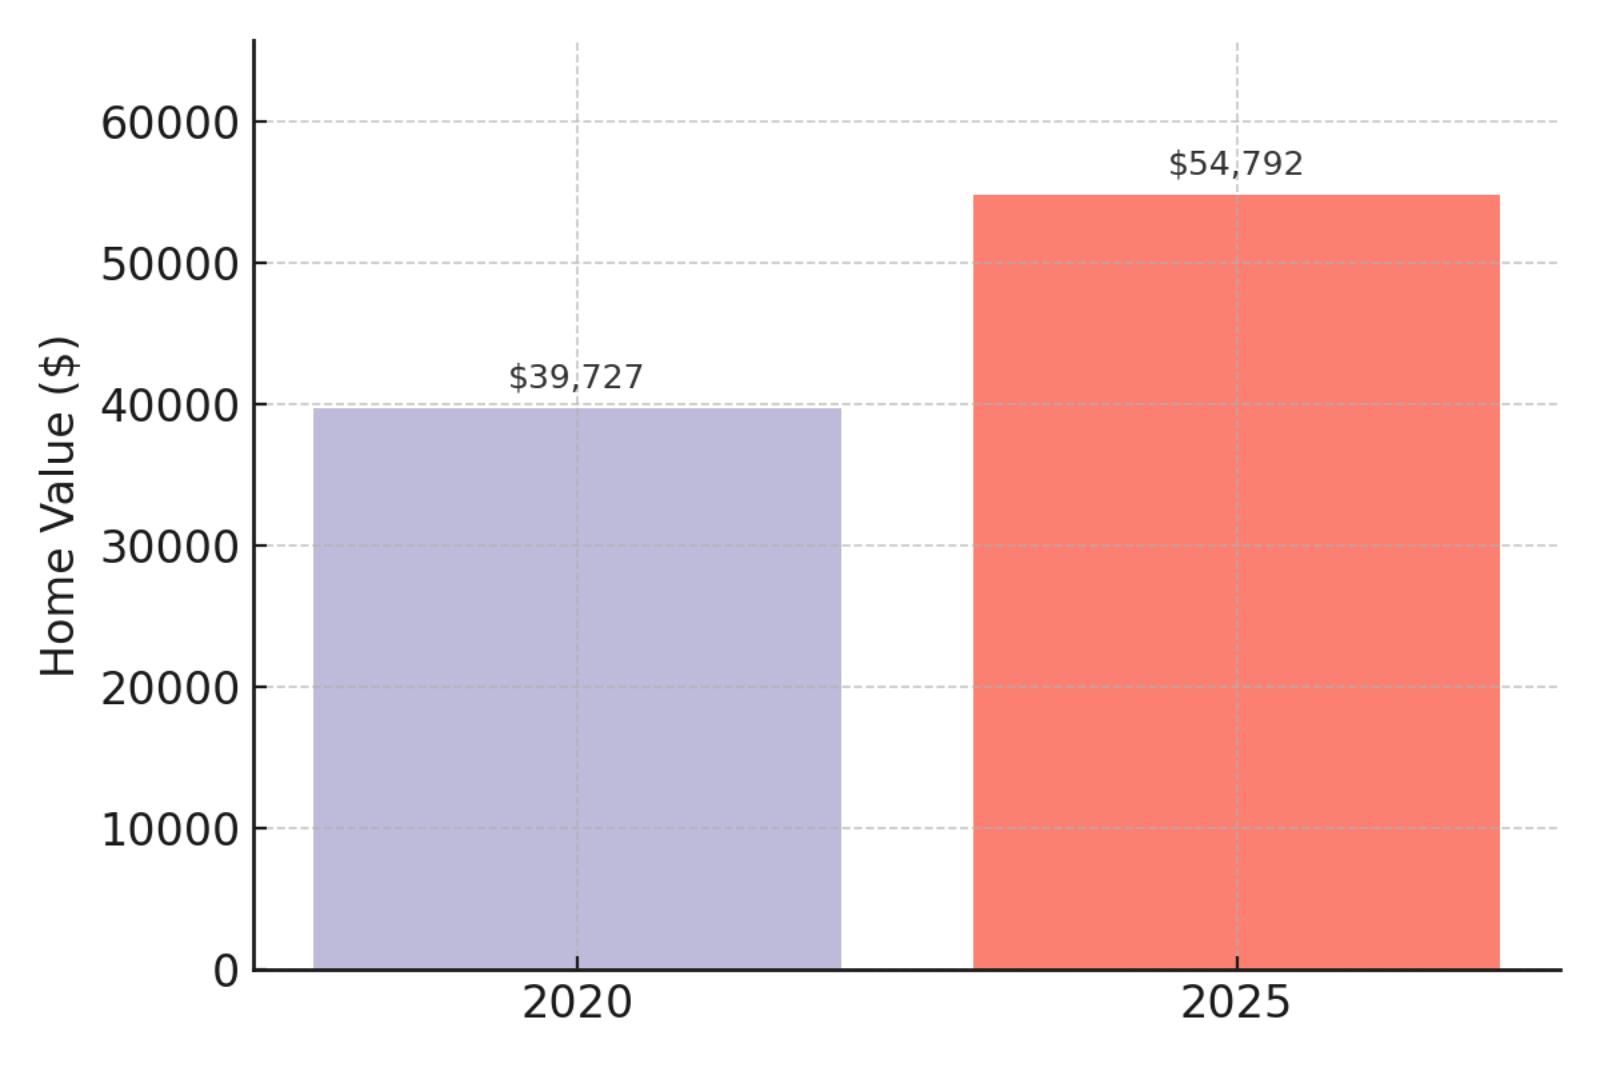
Here are the historical home prices and percentage change over time:
- 2025 value: $54,792
- 2020 value: $39,727
- 2015 value: N/A
- 2010 value: N/A
- % Change from 2020 to 2025: 37.92%
- % Change from 2015 to 2025: N/A
- % Change from 2010 to 2025: N/A
About Otis

Consider the exceptional value proposition in Otis, where home prices have climbed nearly 38% in just five years. This western Kansas small town epitomizes heartland affordability while still delivering strong investment performance. With average values below $55,000, you’re looking at entry points that simply don’t exist in most housing markets nationwide.
4. Natoma Home Prices Chart

Historical home prices and percent changes:
- 2025 value: $53,790
- 2020 value: $47,078
- 2015 value: N/A
- 2010 value: N/A
- % Change from 2020 to 2025: 14.26%
- % Change from 2015 to 2025: N/A
- % Change from 2010 to 2025: N/A
About Natoma
For stability-focused buyers, Natoma presents a compelling option with its moderate 14.26% five-year growth rate. Unlike some neighboring communities with volatile price swings, this north-central Kansas town has appreciated at a more sustainable pace. The modest growth trajectory may indicate a market that’s less susceptible to boom-bust cycles while still building equity for homeowners.
3. Chase Home Prices Chart

Home price history and percentage changes:
- 2025 value: $52,338
- 2020 value: $50,537
- 2015 value: N/A
- 2010 value: N/A
- % Change from 2020 to 2025: 3.56%
- % Change from 2015 to 2025: N/A
- % Change from 2010 to 2025: N/A
About Chase

Chase stands alone as the most stable market on our list, with a modest 3.56% five-year appreciation rate. While neighboring towns experienced dramatic price surges, this central Kansas community maintained remarkably consistent values. For buyers prioritizing price stability over speculative growth, Chase offers a rare haven of predictability in today’s volatile housing landscape.
2. Sedan Home Prices Chart

Here are the historical home prices and percentage change over time:
- 2025 value: $45,286
- 2020 value: $28,912
- 2015 value: N/A
- 2010 value: N/A
- % Change from 2020 to 2025: 56.63%
- % Change from 2015 to 2025: N/A
- % Change from 2010 to 2025: N/A
About Sedan

Discover the remarkable value revolution happening in Sedan, where home prices have skyrocketed nearly 57% while still remaining below $46,000! This southeastern Kansas town ranks as the second most affordable on our list while delivering one of the strongest growth rates. The dramatic price increase from an extremely low starting point exemplifies how even the most accessible markets have participated in the housing boom.
1. Turon Home Prices Chart

Historical home prices and percentage changes:
- 2025 value: $45,265
- 2020 value: $32,982
- 2015 value: $27,280
- 2010 value: N/A
- % Change from 2020 to 2025: 37.24%
- % Change from 2015 to 2025: 65.92%
- % Change from 2010 to 2025: N/A
About Turon

Claiming the crown as Kansas’ most affordable town on our list, Turon offers extraordinary value with home prices just above $45,000. Yet don’t mistake affordability for stagnation—this market has delivered an impressive 66% appreciation over the past decade! Located in south-central Kansas, Turon exemplifies how persistent, long-term growth can create significant equity even in extremely low-priced markets.