The latest Zillow Home Value Index points to trouble in parts of Missouri’s housing market. After analyzing 15 years of price data, we’ve identified 18 towns showing strong signs of a possible correction. These markets are heavily overextended—some more than 80% above their long-term value trends—and match several warning patterns that have historically come before price drops. While statewide prices are still up 4.1% year-over-year, a growing number of towns are flashing red on risk indicators like volatility, inventory jumps, and unsustainable appreciation. If the market shifts, these places could feel it first—and hardest.
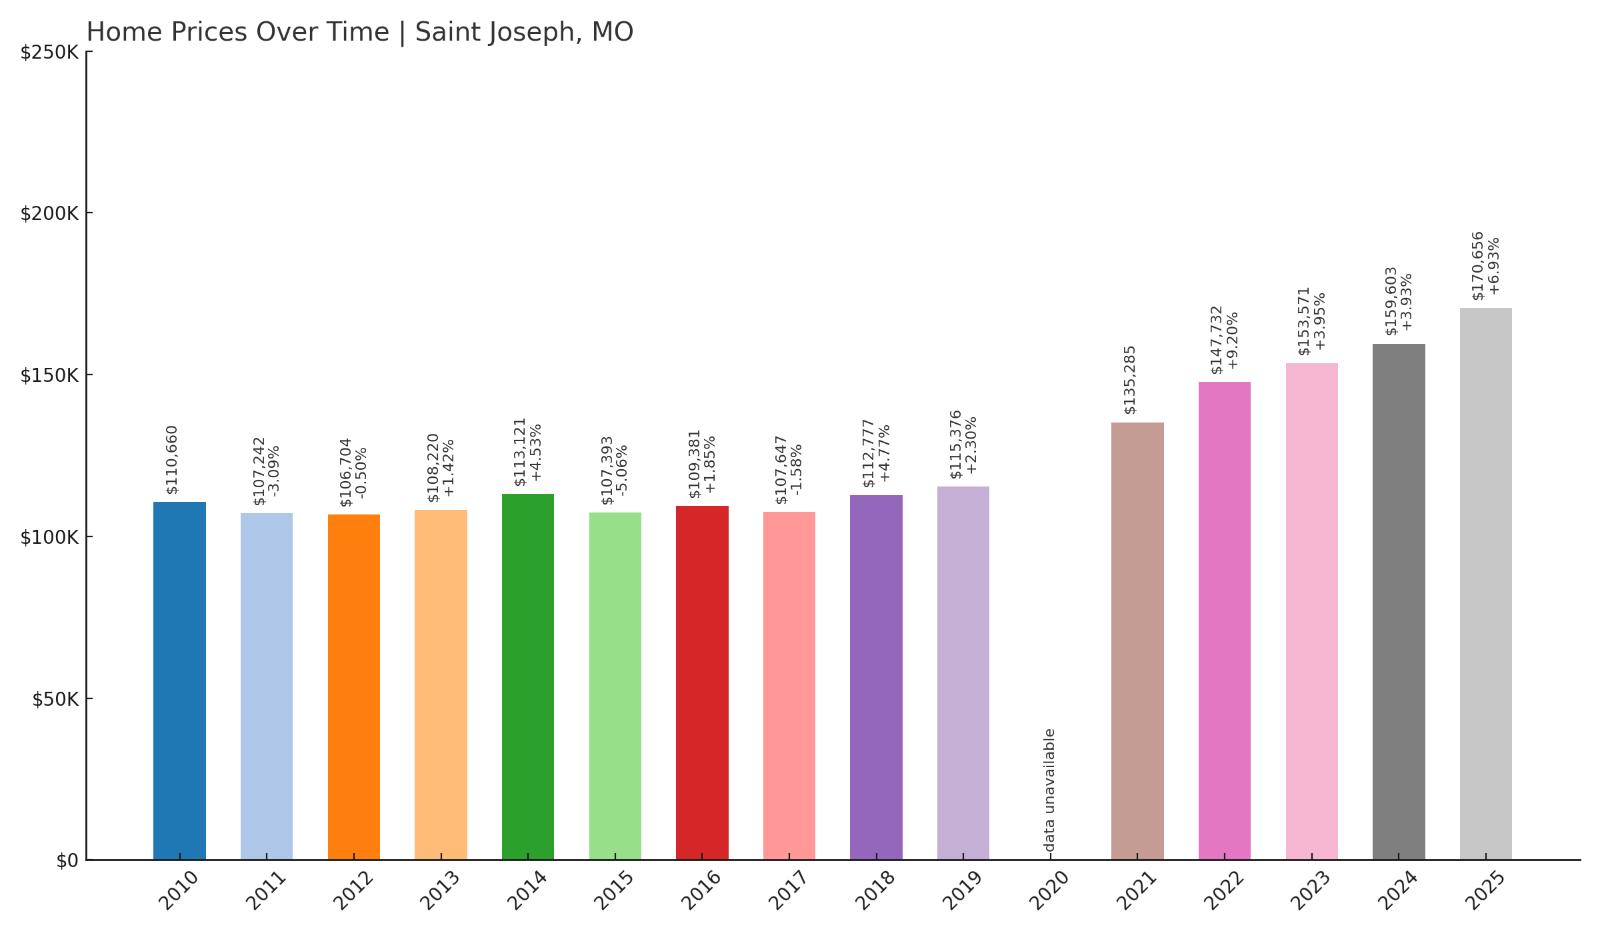
18. Saint Joseph – Crash Risk Percentage: 33%
Would you like to save this?
- Crash Risk Percentage: 33%
- Historical crashes (8%+ drops): 0
- Worst historical crash: -5.1% (2005)
- Total price increase since 2005: 48.0%
- Overextended above long-term average: 39.3%
- Price volatility (annual swings): 5.1%
- Current 2025 price: $170,656
Saint Joseph shows concerning overextension despite its relatively modest crash risk score of 33%. The city’s current median price of $170,656 represents a 48% increase since 2005, placing values 39.3% above historical averages. This northwestern Missouri community has experienced steady price inflation without the market corrections seen in other areas, creating vulnerability for future declines. The 5.1% annual price volatility indicates moderate market instability that could amplify during economic downturns.
Saint Joseph – Steady Growth Masking Overextension Risk
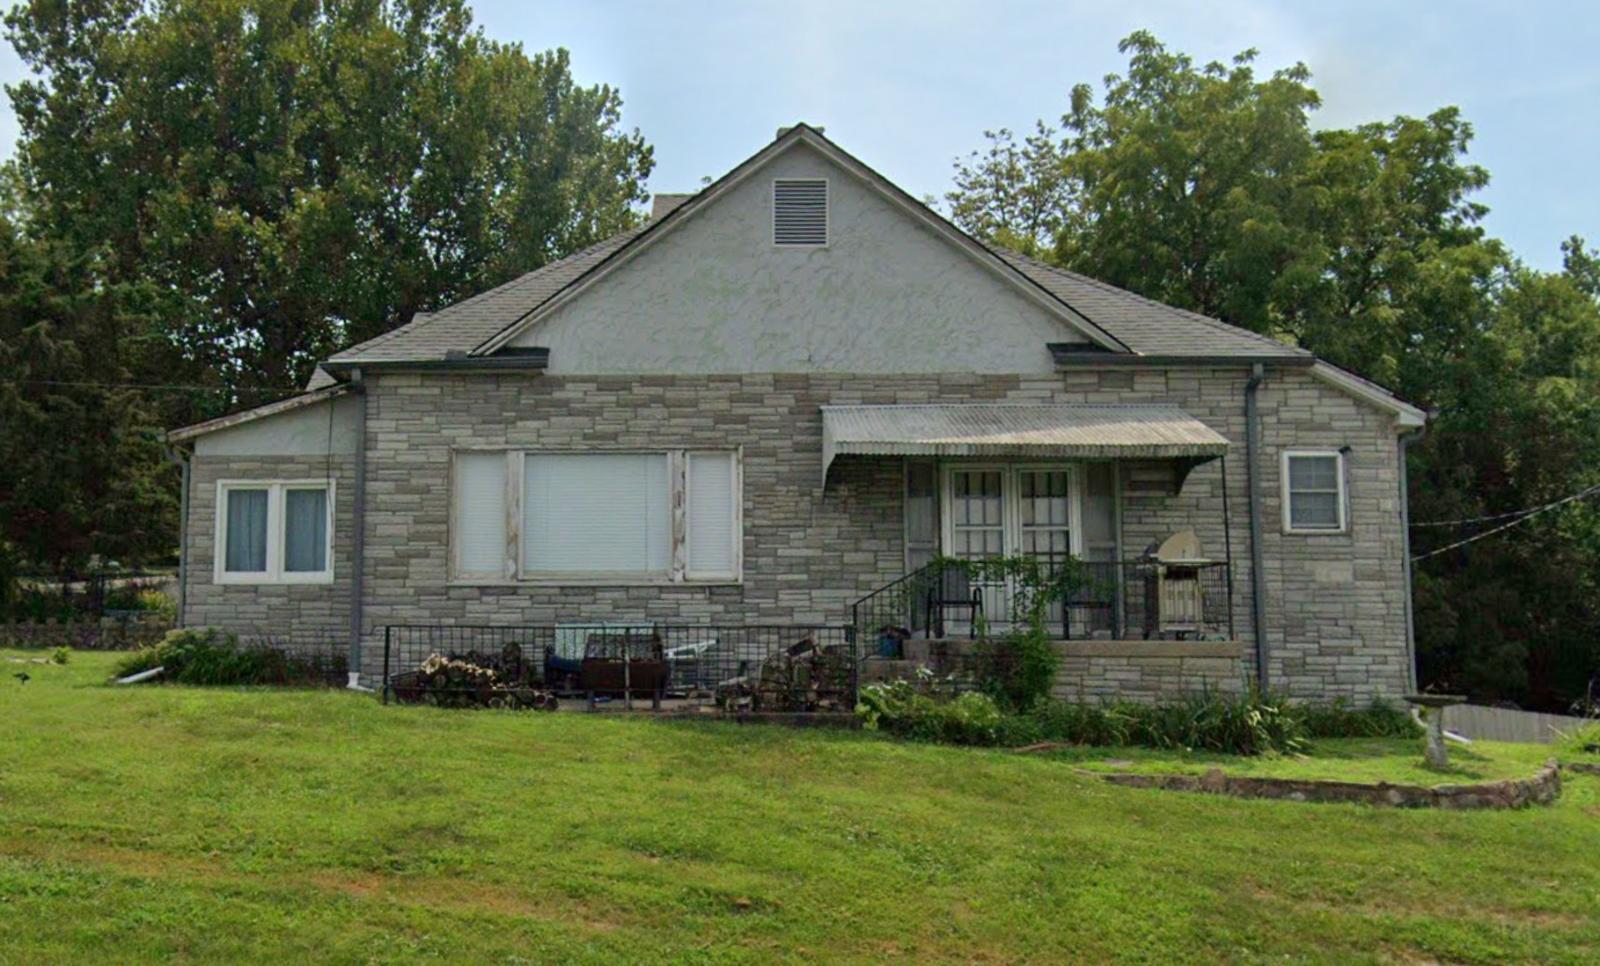
Located in Buchanan County along the Missouri River, Saint Joseph serves as a regional hub with a diverse economy spanning manufacturing, healthcare, and agriculture. The city’s strategic position as a historical gateway has supported consistent population growth, but current housing values show signs of disconnection from economic fundamentals. With median household incomes trailing national averages, the 48% price appreciation since 2005 appears unsustainable relative to local earning capacity.
The absence of historical crashes in Saint Joseph may actually increase current vulnerability, as markets without recent corrections often lack the natural price discovery mechanisms that prevent severe overextension. The city’s 39.3% overvaluation above long-term trends, combined with Missouri’s overall market showing signs of cooling, suggests Saint Joseph could experience its first significant price decline. Recent data showing homes taking longer to sell statewide indicates buyer resistance to current price levels may spread to previously stable markets like Saint Joseph.
17. Columbia – Crash Risk Percentage: 40%
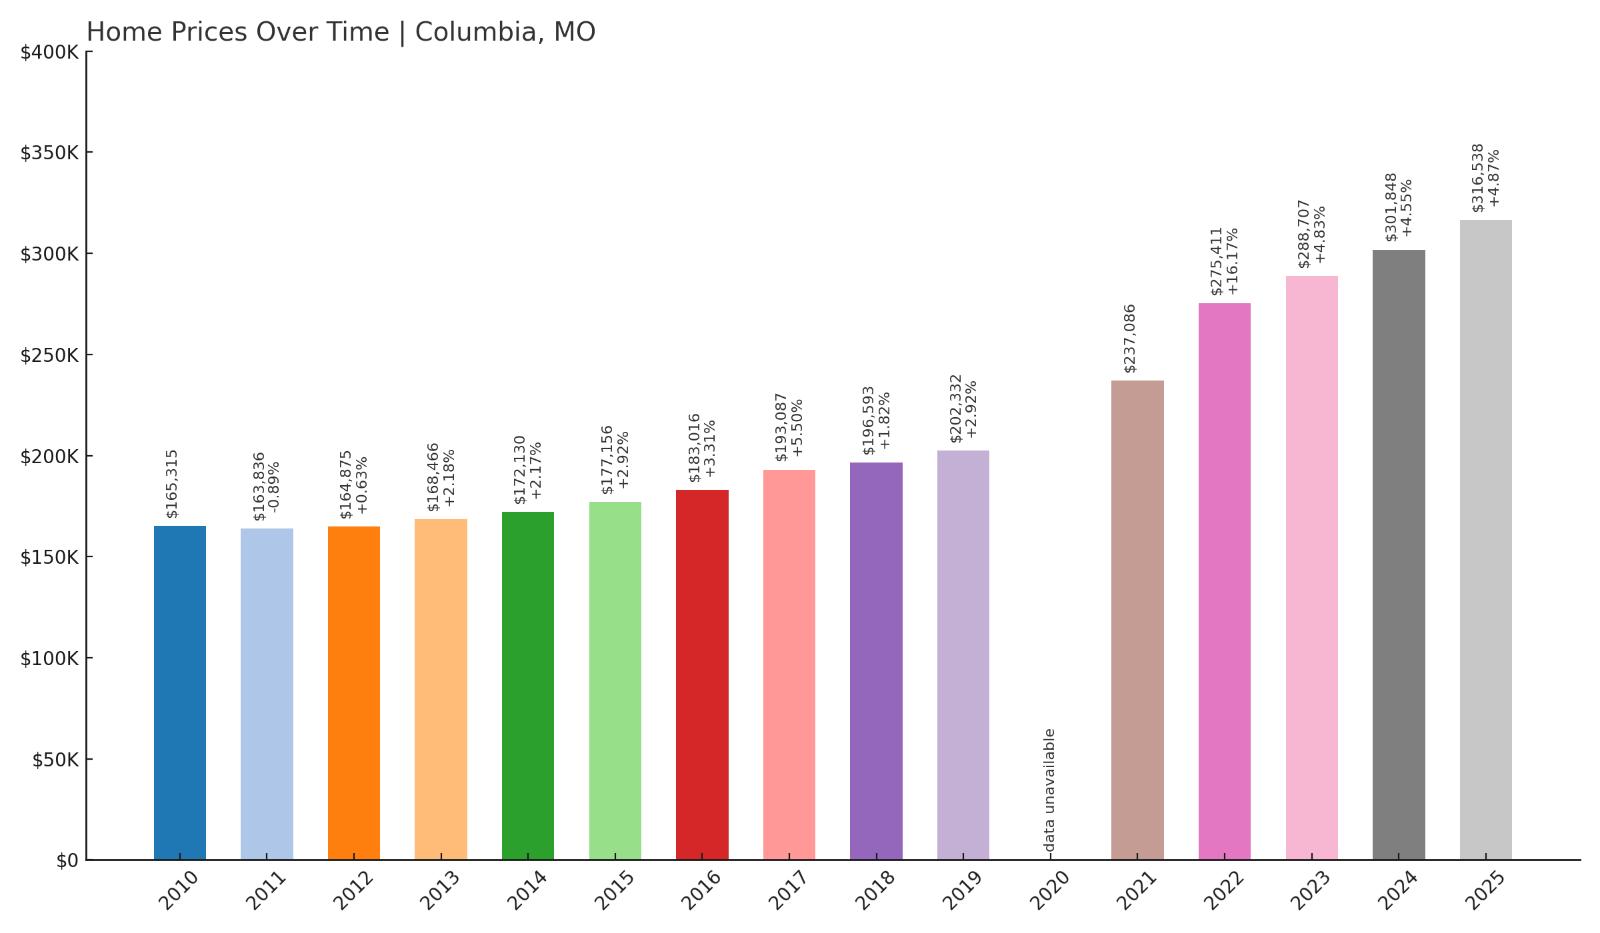
- Crash Risk Percentage: 40%
- Historical crashes (8%+ drops): 0
- Worst historical crash: -1.2% (2006)
- Total price increase since 2006: 92.5%
- Overextended above long-term average: 55.3%
- Price volatility (annual swings): 5.0%
- Current 2025 price: $316,538
Columbia’s university-driven economy has fueled dramatic price appreciation, with values nearly doubling since 2006 to reach $316,538. The 92.5% total increase significantly outpaces wage growth in the region, creating a 55.3% overextension above long-term averages. Despite never experiencing a major crash, the combination of rapid appreciation and high overvaluation places Columbia at substantial risk for correction, particularly as student enrollment trends shift and remote learning impacts traditional college towns.
Columbia – University Bubble Risk
Home to the University of Missouri, Columbia has benefited from consistent student and faculty housing demand that has driven prices well beyond regional norms. The current median price of $316,538 represents the highest valuation in the city’s history, supported primarily by the university ecosystem. However, this concentration of demand creates vulnerability as higher education faces enrollment pressures and budget constraints that could reduce housing demand.
The 55.3% overextension above historical averages is particularly concerning in a college town where employment options outside the university remain limited. Recent trends showing decreased home sales activity across Missouri suggest buyer resistance to elevated prices may impact Columbia’s previously insulated market. The city’s 5% annual price volatility, while moderate, combined with its extreme overvaluation, creates conditions where external economic shocks could trigger significant price declines as speculative demand evaporates.
16. Blue Springs – Crash Risk Percentage: 47%
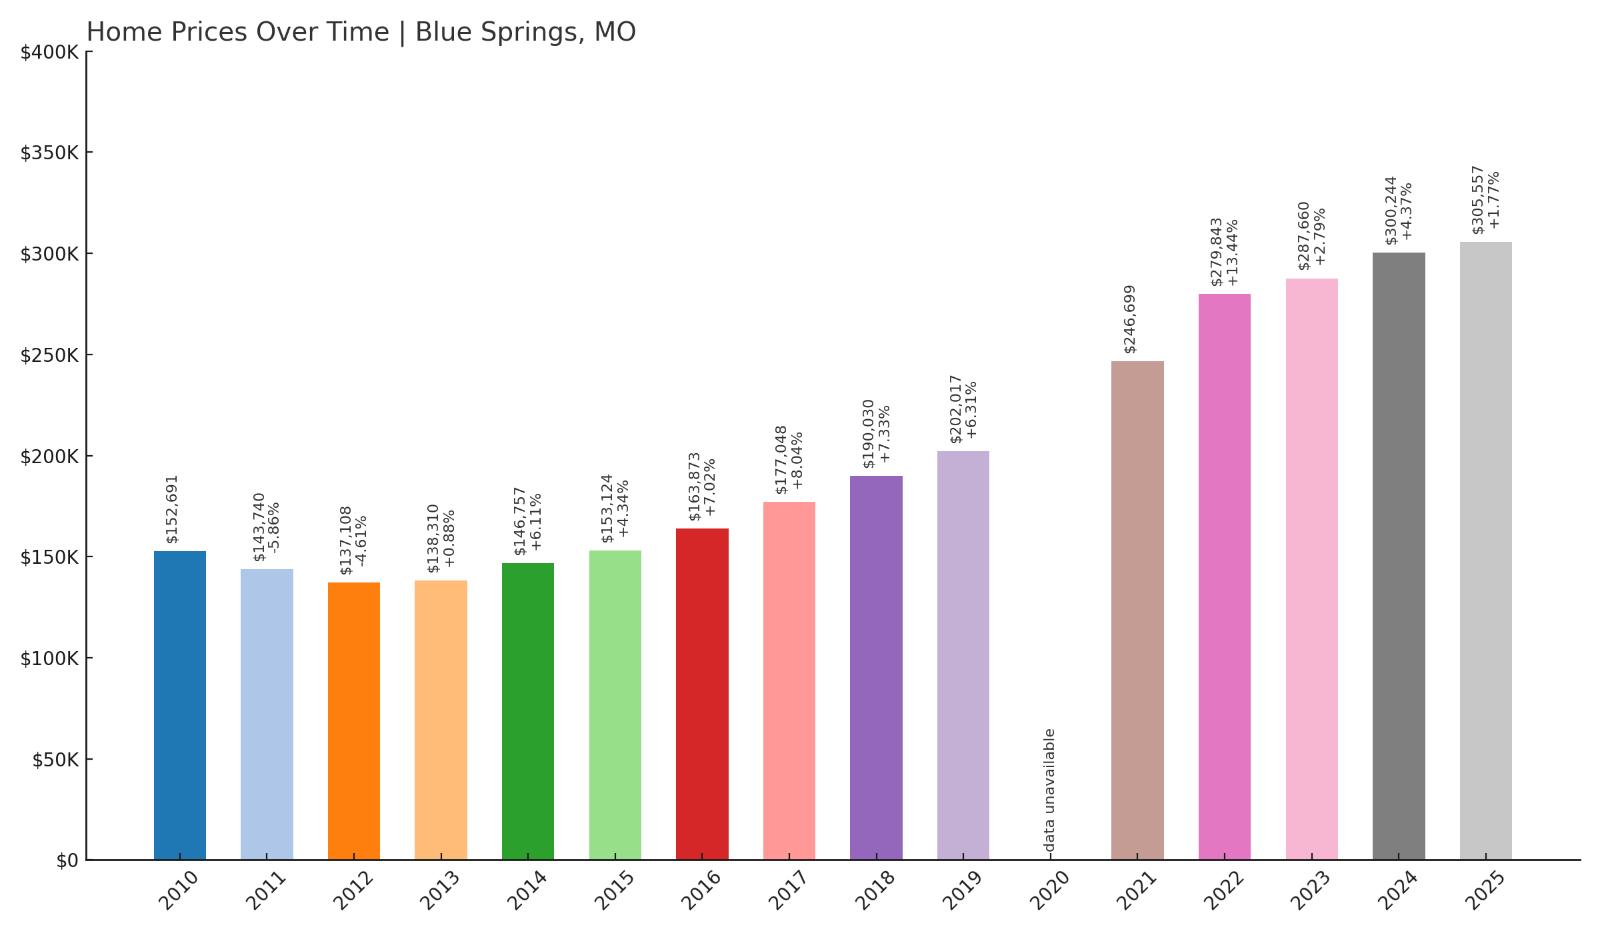
- Crash Risk Percentage: 47%
- Historical crashes (8%+ drops): 0
- Worst historical crash: -5.9% (2000)
- Total price increase since 2000: 151.4%
- Overextended above long-term average: 70.6%
- Price volatility (annual swings): 5.7%
- Current 2025 price: $305,557
Blue Springs exhibits severe overextension with prices 70.6% above long-term averages and a staggering 151.4% increase since 2000. This Kansas City suburb has experienced relentless appreciation without meaningful corrections, creating dangerous mathematical unsustainability. The current median price of $305,557 reflects speculative demand that appears detached from local economic fundamentals, while 5.7% annual volatility suggests underlying market instability that could accelerate during downturns.
Blue Springs – Suburban Speculation Concerns
Situated in Jackson County as part of the Kansas City metropolitan area, Blue Springs has transformed from a modest suburban community into a high-priced enclave where housing costs have more than doubled in 25 years. The city’s appeal to families seeking good schools and suburban amenities has driven speculative buying that pushed values far beyond sustainable levels. Current prices averaging over $305,000 create affordability barriers that exclude many traditional buyers from the market.
The 70.6% overextension represents one of Missouri’s most dangerous pricing bubbles, particularly concerning given Blue Springs’ lack of major employers or economic drivers beyond its residential appeal. As Kansas City area inventory increases and buyer competition decreases, Blue Springs faces heightened vulnerability to price corrections. The combination of extreme overvaluation and dependence on continued speculative demand creates conditions where even modest economic disruption could trigger substantial price declines, potentially exceeding the 5.9% worst historical decline seen in 2000.
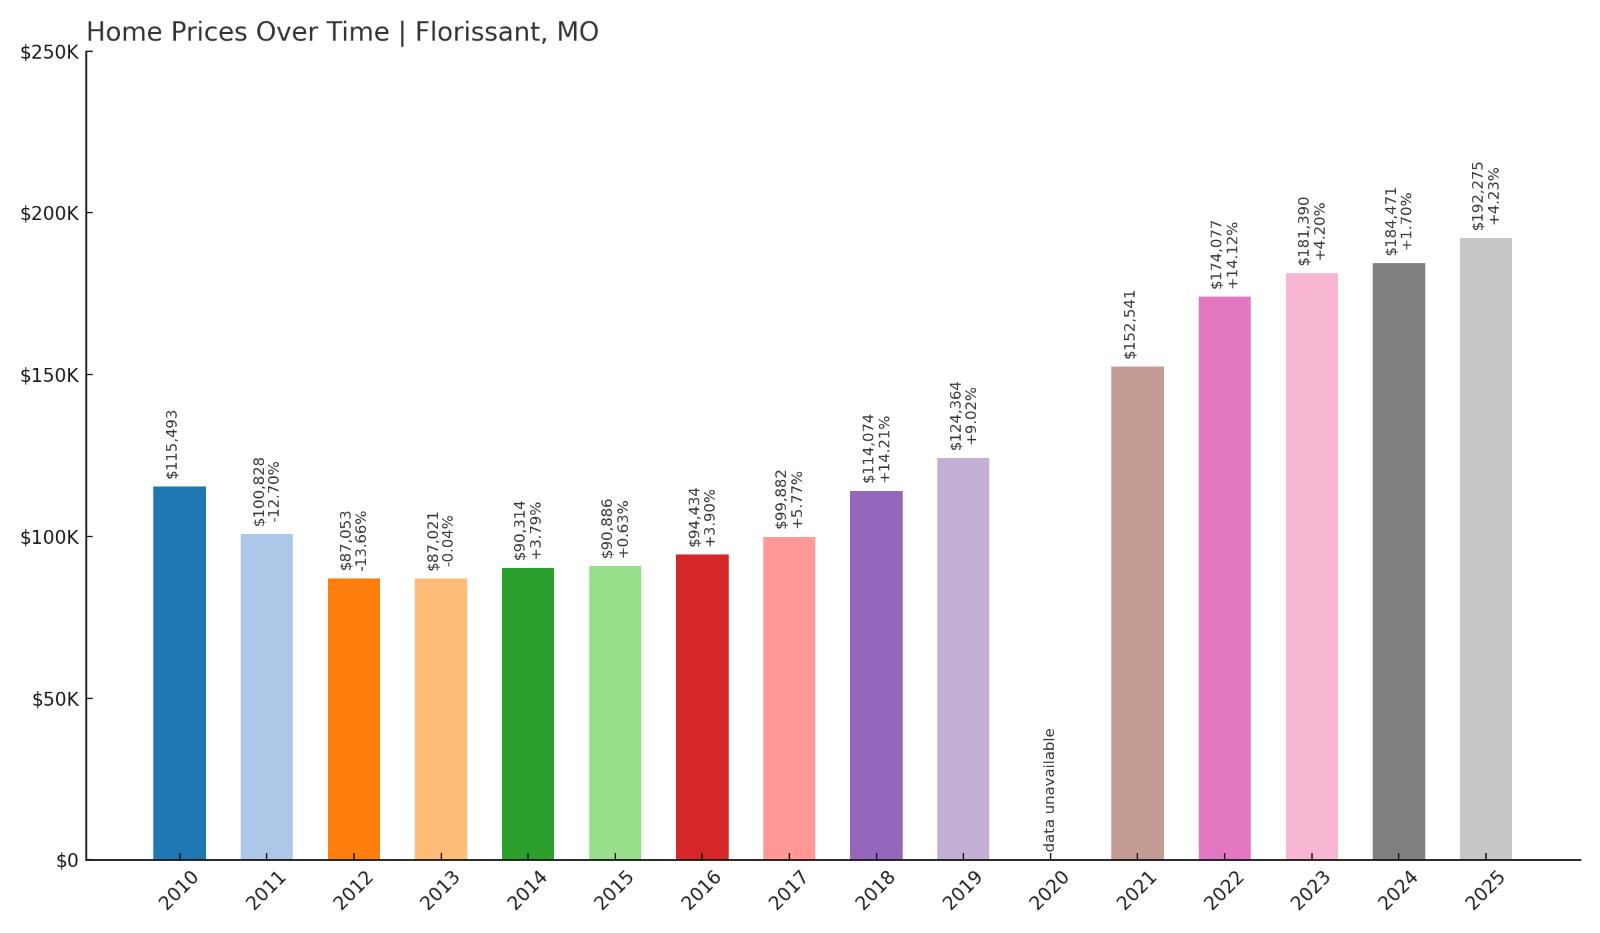
15. Florissant – Crash Risk Percentage: 50%
Would you like to save this?
- Crash Risk Percentage: 50%
- Historical crashes (8%+ drops): 2
- Worst historical crash: -13.7% (2000)
- Total price increase since 2000: 124.1%
- Overextended above long-term average: 58.2%
- Price volatility (annual swings): 8.1%
- Current 2025 price: $192,275
Florissant’s crash risk reaches 50% based on concerning historical patterns and current overextension. The community has experienced two previous crashes exceeding 8%, including a devastating 13.7% decline in 2000, establishing a pattern of volatility that continues today with 8.1% annual price swings. Despite this crash history, prices have surged 124.1% since 2000, creating a 58.2% overextension that suggests another significant correction may be imminent.
Florissant – Repeat Crash Vulnerability
Located in St. Louis County, Florissant has demonstrated repeated susceptibility to housing market downturns, making it a prime candidate for future crashes. The city’s history of significant price declines, combined with current overvaluation levels, creates a dangerous precedent where past crash patterns could repeat with even greater severity. The 13.7% decline in 2000 shows how quickly values can deteriorate when market sentiment shifts.
Current pricing at $192,275 represents a concerning disconnect from Florissant’s economic fundamentals, particularly given the broader St. Louis metropolitan area’s economic challenges. The 8.1% annual price volatility ranks among Missouri’s highest, indicating an unstable market prone to sharp corrections. With 58.2% overextension above long-term averages and a proven history of major crashes, Florissant faces substantial risk of experiencing another significant price decline that could exceed previous corrections as speculative excess unwinds.
14. Jefferson City – Crash Risk Percentage: 50%
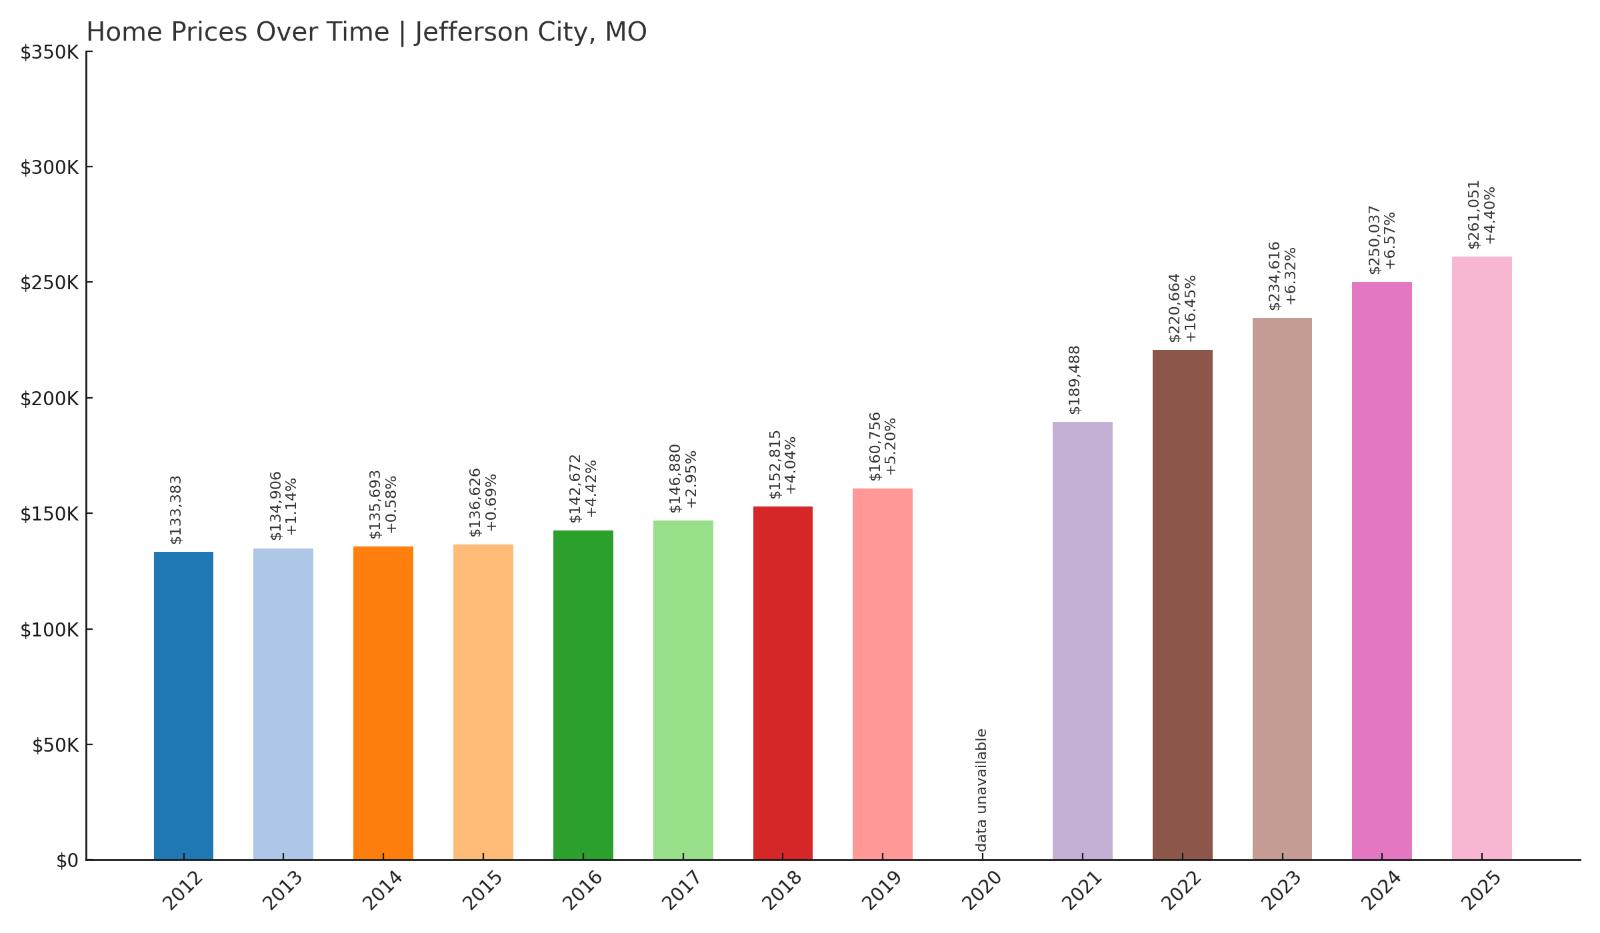
- Crash Risk Percentage: 50%
- Historical crashes (8%+ drops): 0
- Worst historical crash: 0.0% (2012)
- Total price increase since 2012: 95.7%
- Overextended above long-term average: 47.6%
- Price volatility (annual swings): 5.6%
- Current 2025 price: $261,051
Missouri’s capital city shows troubling signs despite its political stability, with prices nearly doubling since 2012 to reach $261,051. The 95.7% appreciation over just 13 years has created a 47.6% overextension above historical norms without any meaningful market corrections to provide natural price discovery. Jefferson City’s unusual stability may actually increase crash risk as markets without recent corrections often experience more severe adjustments when conditions finally shift.
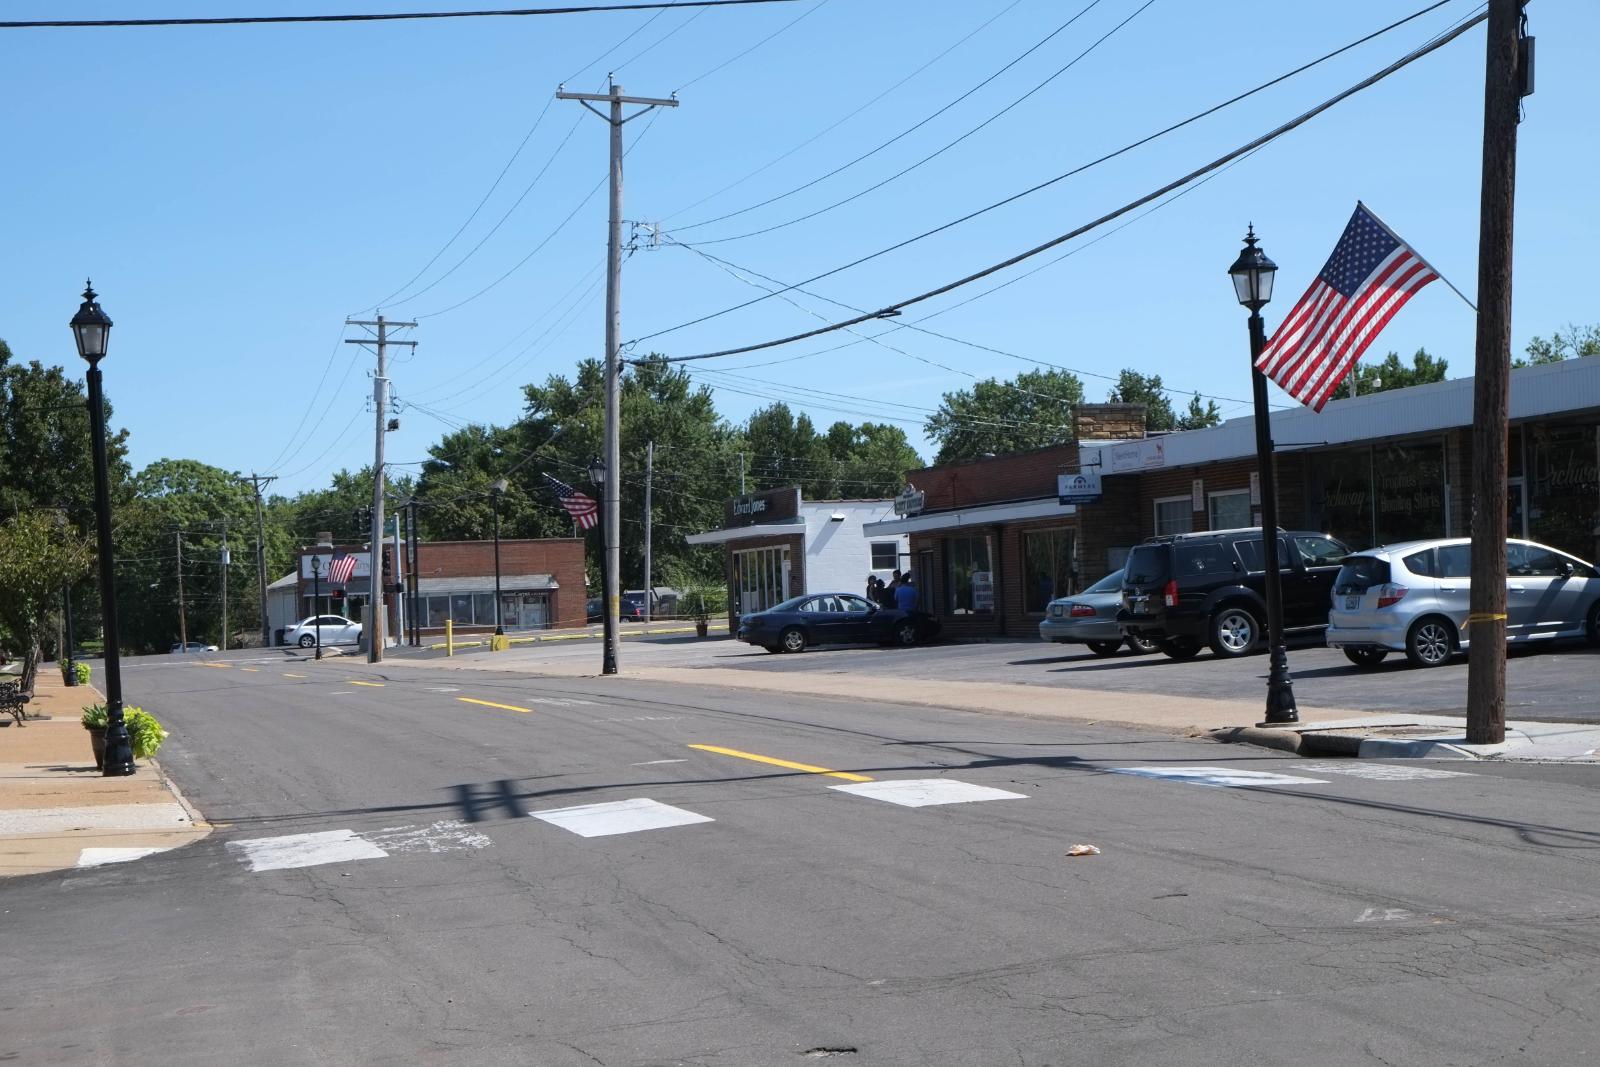
Jefferson City – Capital Complacency Risk
As Missouri’s seat of government, Jefferson City benefits from stable public sector employment that has historically insulated its housing market from broader economic volatility. However, this stability has bred complacency that allowed prices to reach unsustainable levels without natural market corrections. The current median price of $261,051 represents a near-doubling from 2012 levels that far exceeds wage growth in the public sector-dominated economy.
The absence of historical crashes creates a false sense of security that may mask underlying vulnerabilities in Jefferson City’s housing market. Government employment, while stable, typically offers limited wage growth that cannot support indefinite price appreciation. The 47.6% overextension above long-term averages, combined with 5.6% annual volatility, suggests the market has reached mathematical limits that could trigger sharp corrections. As state budget pressures mount and federal policies shift, Jefferson City’s government-dependent economy faces risks that could finally expose the unsustainability of current housing values.
13. Fenton – Crash Risk Percentage: 52%
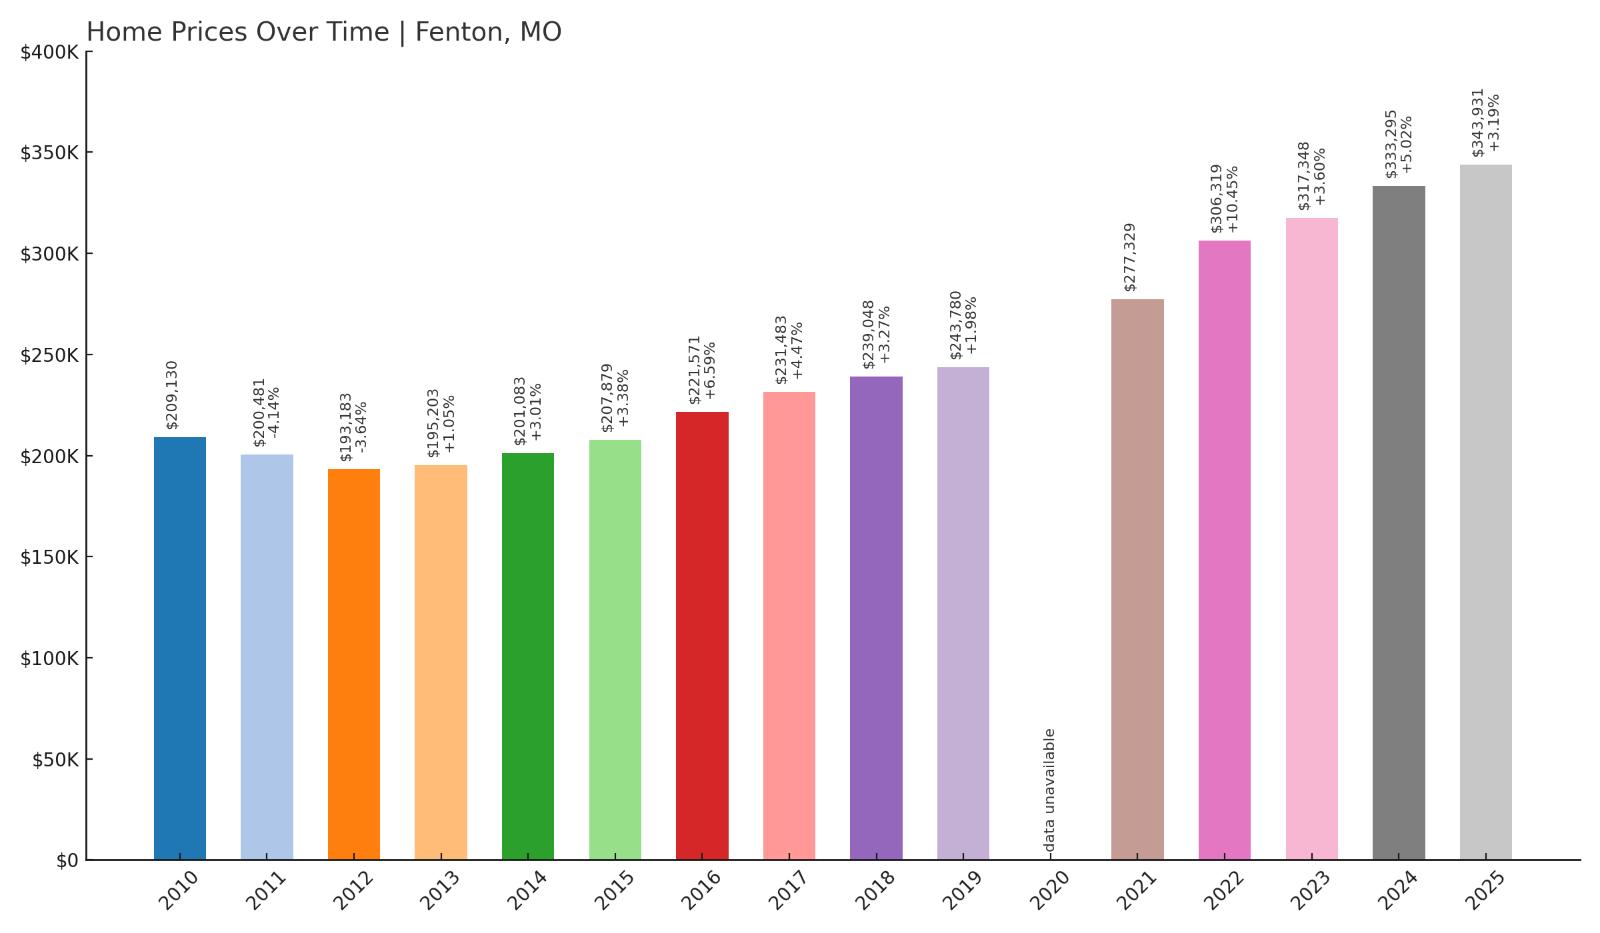
- Crash Risk Percentage: 52%
- Historical crashes (8%+ drops): 0
- Worst historical crash: -4.1% (2000)
- Total price increase since 2000: 116.0%
- Overextended above long-term average: 49.9%
- Price volatility (annual swings): 4.4%
- Current 2025 price: $343,931
Fenton’s luxury positioning as a desirable St. Louis suburb has driven prices to $343,931, representing a 116% increase since 2000 that created a 49.9% overextension above long-term averages. Despite never experiencing major crashes, the current valuation appears mathematically unsustainable relative to local income levels and regional economic conditions. The 4.4% annual volatility masks underlying instability that could accelerate rapidly during market stress.
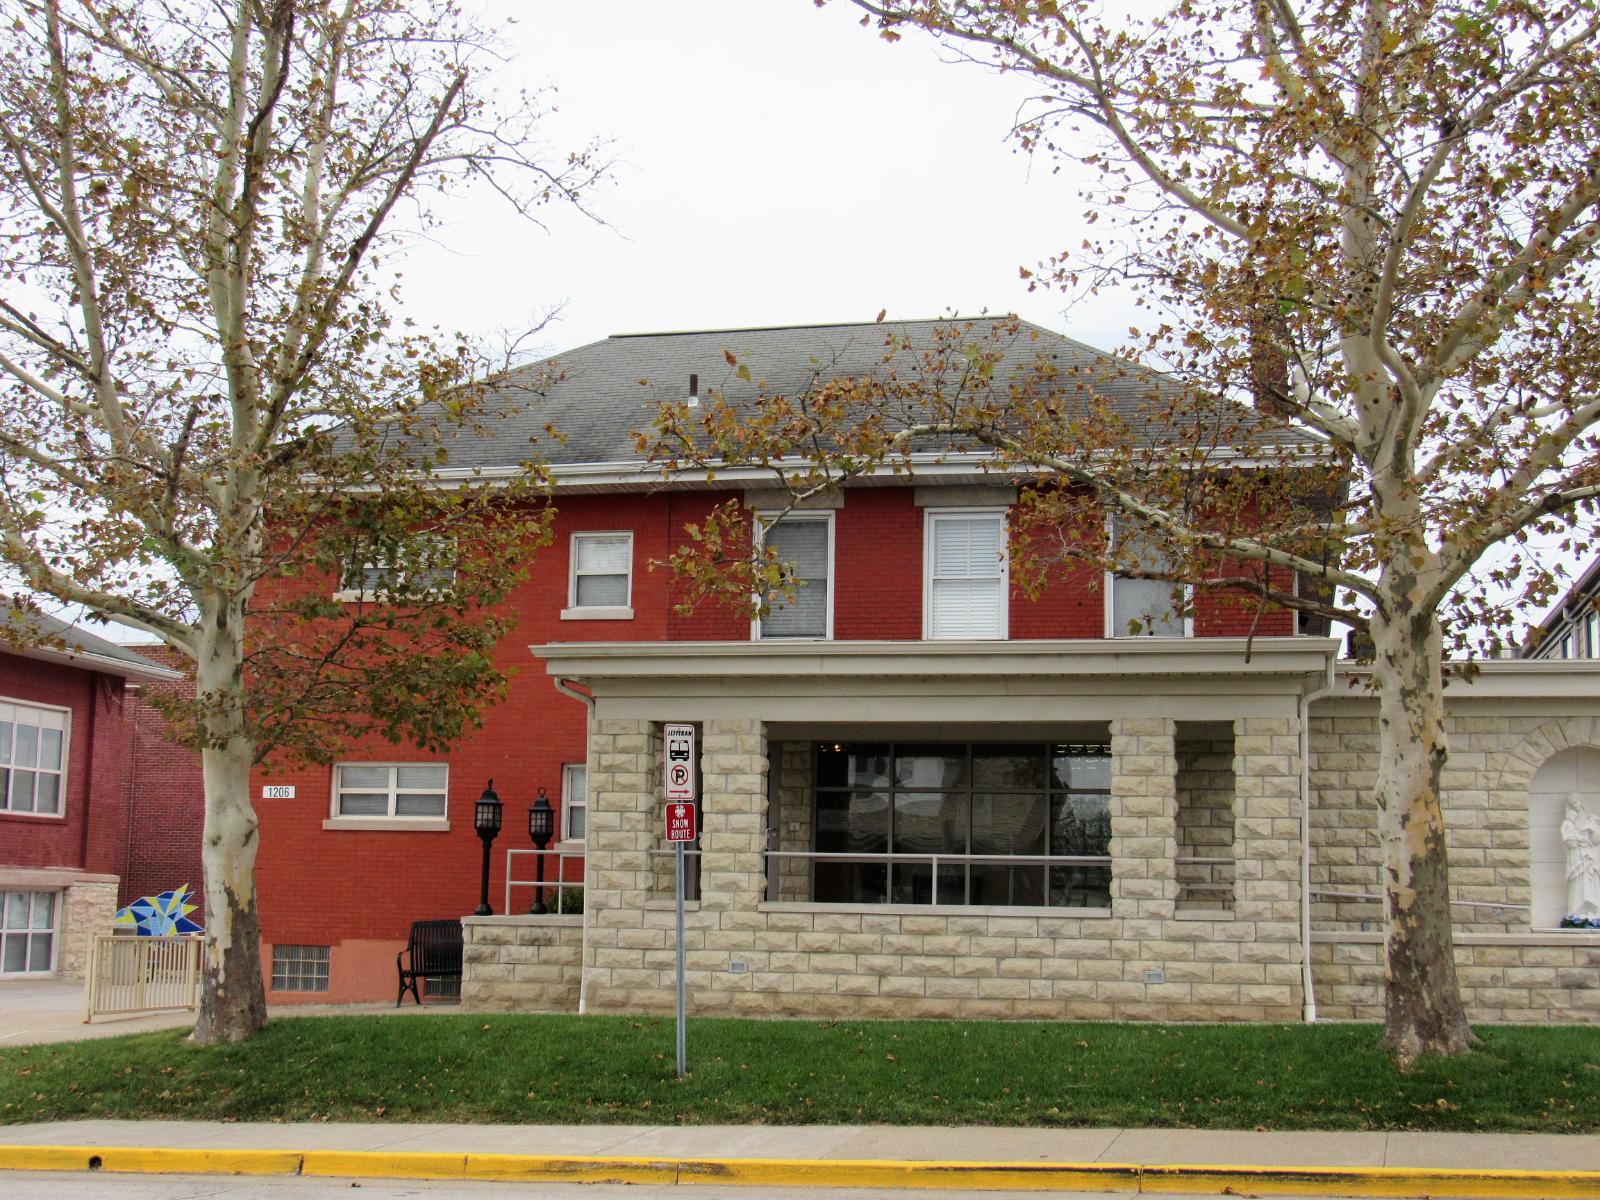
Fenton – Luxury Market Correction Risk
Positioned as an upscale community in St. Louis County, Fenton has attracted affluent buyers seeking premium housing options, driving median prices above $340,000. This luxury positioning has created vulnerability as high-end markets typically experience more severe corrections during economic downturns due to their dependence on discretionary buyer demand. The 116% price appreciation since 2000 reflects speculative premiums that may not withstand broader economic pressures.
Current pricing near $344,000 places Fenton among Missouri’s most expensive markets, creating affordability barriers that limit buyer pools to high-income households. The 49.9% overextension suggests prices have reached levels where mathematical correction becomes increasingly likely, particularly as luxury markets face reduced demand during economic uncertainty. Fenton’s relatively low 4.4% volatility may actually increase crash risk by masking building pressure that could result in sharp adjustments when market sentiment finally shifts toward more realistic valuations.
12. Wentzville – Crash Risk Percentage: 52%
- Crash Risk Percentage: 52%
- Historical crashes (8%+ drops): 0
- Worst historical crash: -6.6% (2001)
- Total price increase since 2001: 122.0%
- Overextended above long-term average: 58.9%
- Price volatility (annual swings): 5.6%
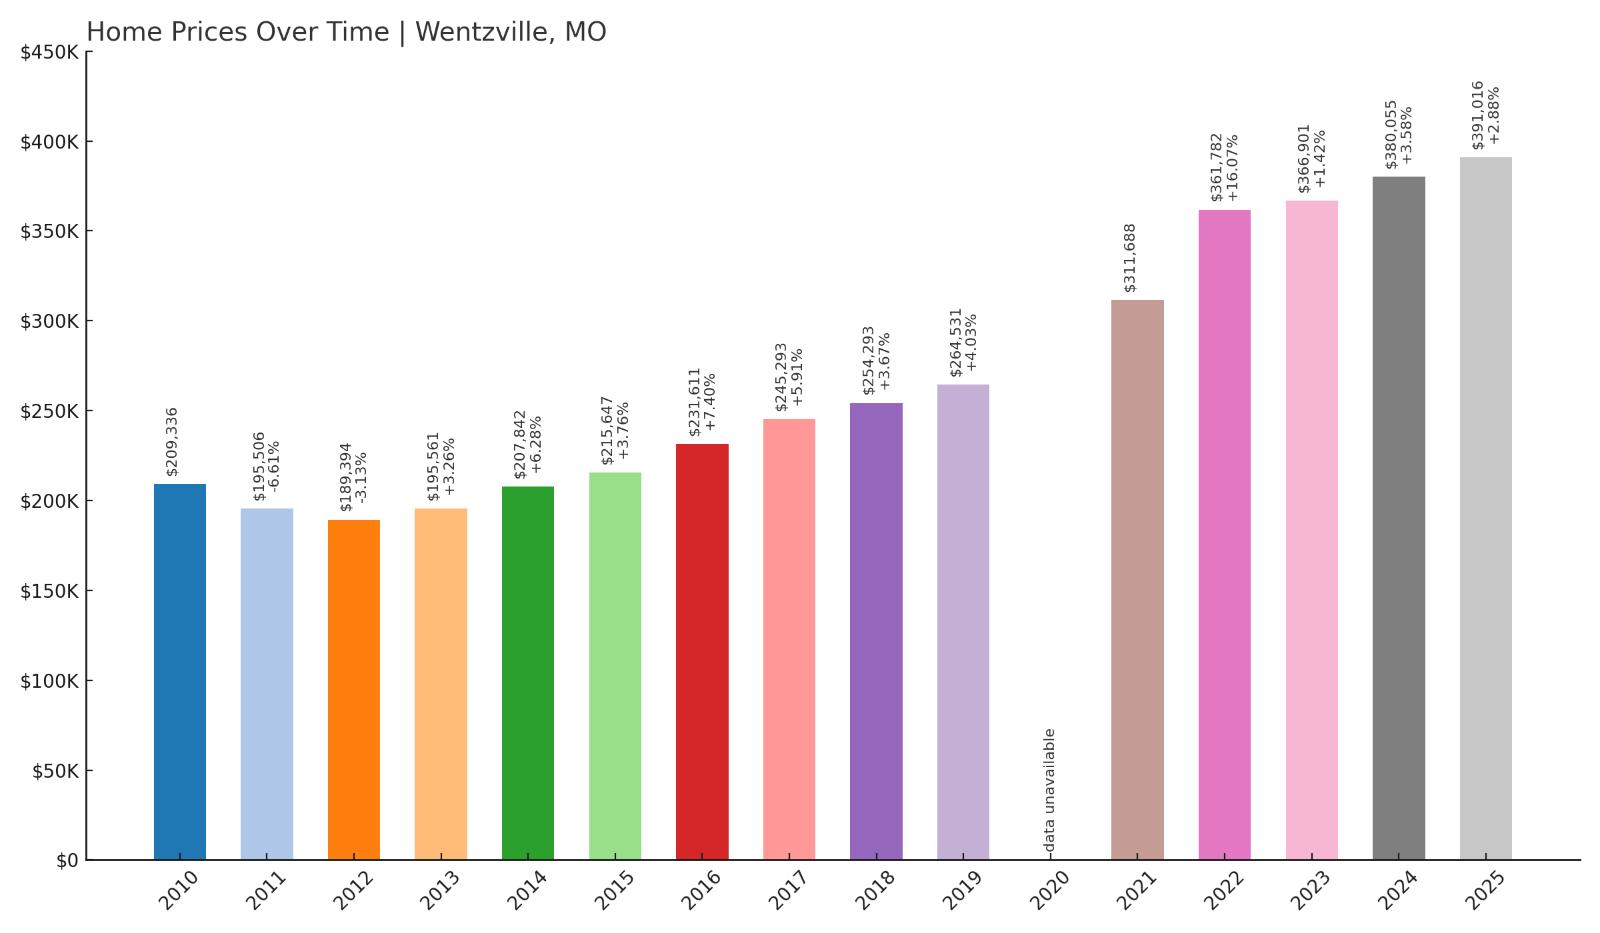
- Current 2025 price: $391,016
Wentzville’s explosive growth has pushed median prices above $391,000, representing a 122% surge since 2001 that created dangerous 58.9% overextension above historical averages. This St. Charles County community has become one of Missouri’s most expensive markets without experiencing meaningful corrections to establish sustainable price levels. The combination of extreme overvaluation and 5.6% annual volatility suggests significant vulnerability to sharp price adjustments.
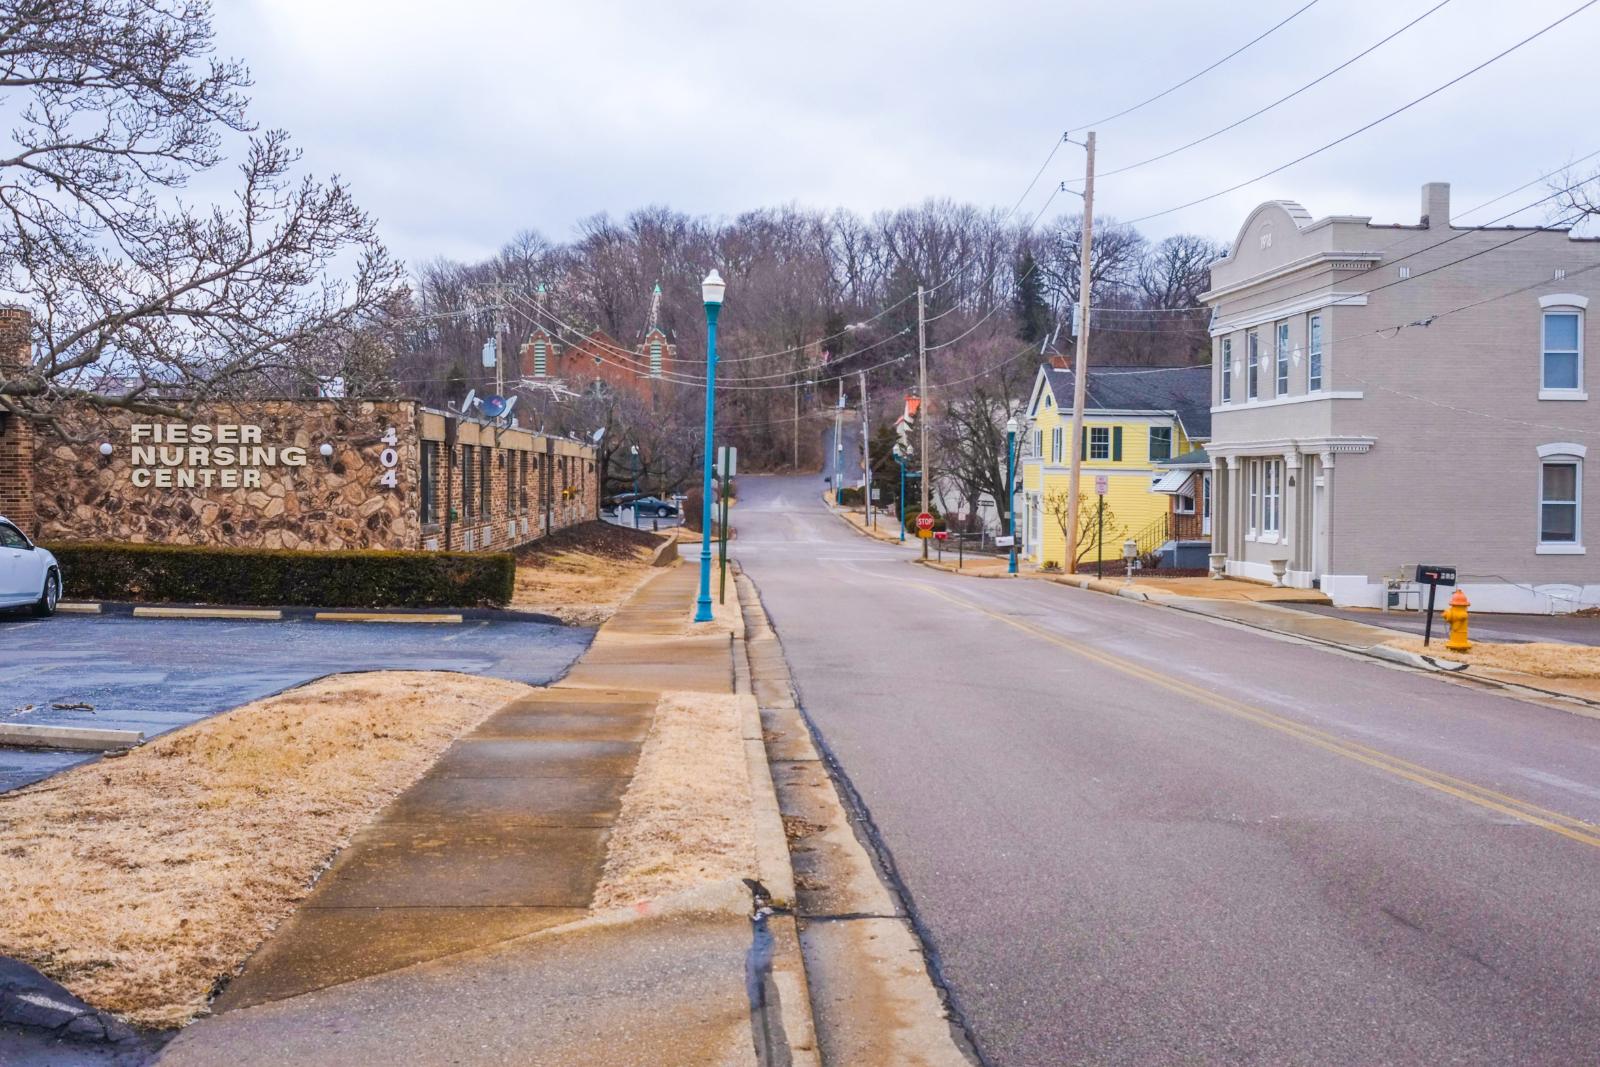
Wentzville – Boom Town Vulnerability
Located in fast-growing St. Charles County, Wentzville has transformed from a small agricultural community into a major suburban center, attracting families and businesses fleeing urban areas. This rapid transformation drove speculative demand that pushed housing values far beyond sustainable levels relative to local economic fundamentals. Current median prices approaching $400,000 create severe affordability constraints that could trigger demand collapse.
The 58.9% overextension represents one of Missouri’s most dangerous pricing bubbles, particularly concerning for a community that lacks major economic anchors beyond residential development. Wentzville’s growth story has attracted speculative investment that inflated values beyond what local incomes can support long-term. As regional inventory increases and buyer competition decreases, this boom town faces heightened risk of experiencing its first major correction that could exceed the modest 6.6% decline seen in 2001, potentially triggering a more severe unwinding of speculative excess.
11. Springfield – Crash Risk Percentage: 52%
- Crash Risk Percentage: 52%
- Historical crashes (8%+ drops): 0
- Worst historical crash: -5.9% (2008)
- Total price increase since 2008: 103.2%
- Overextended above long-term average: 63.4%
- Price volatility (annual swings): 7.5%
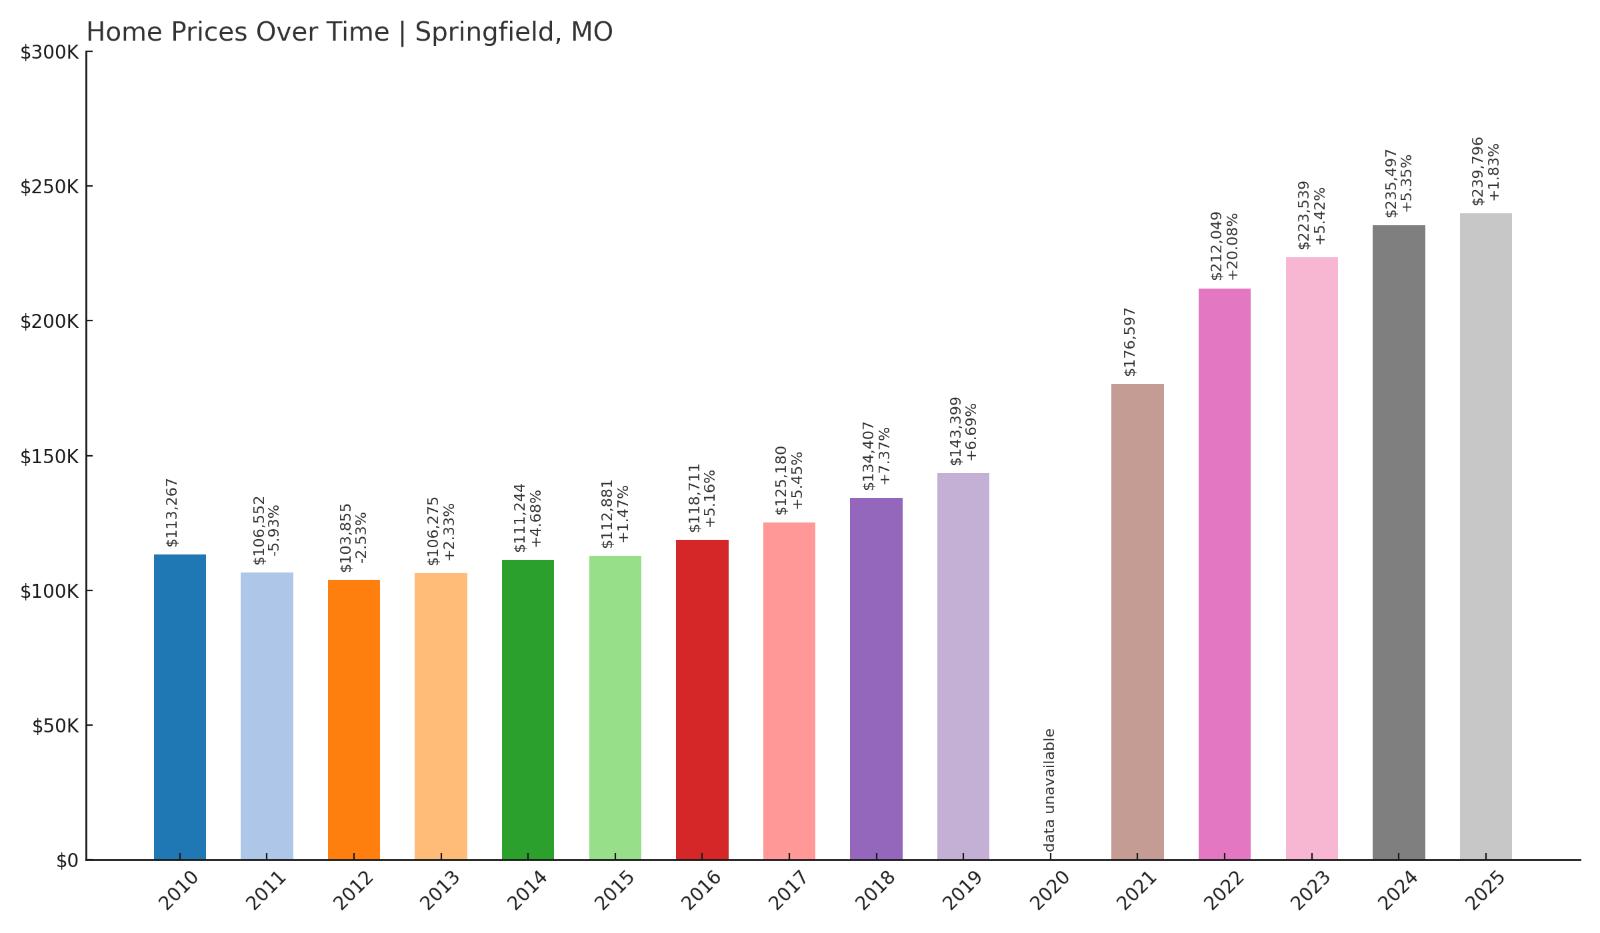
- Current 2025 price: $239,796
Springfield’s regional economic center status has driven prices to $239,796, representing a 103.2% increase since 2008 that created a concerning 63.4% overextension above long-term averages. Despite weathering the 2008 financial crisis with only a 5.9% decline, current overvaluation levels suggest the market has since overcorrected dramatically. The elevated 7.5% annual price volatility indicates underlying instability that could accelerate during future economic stress.
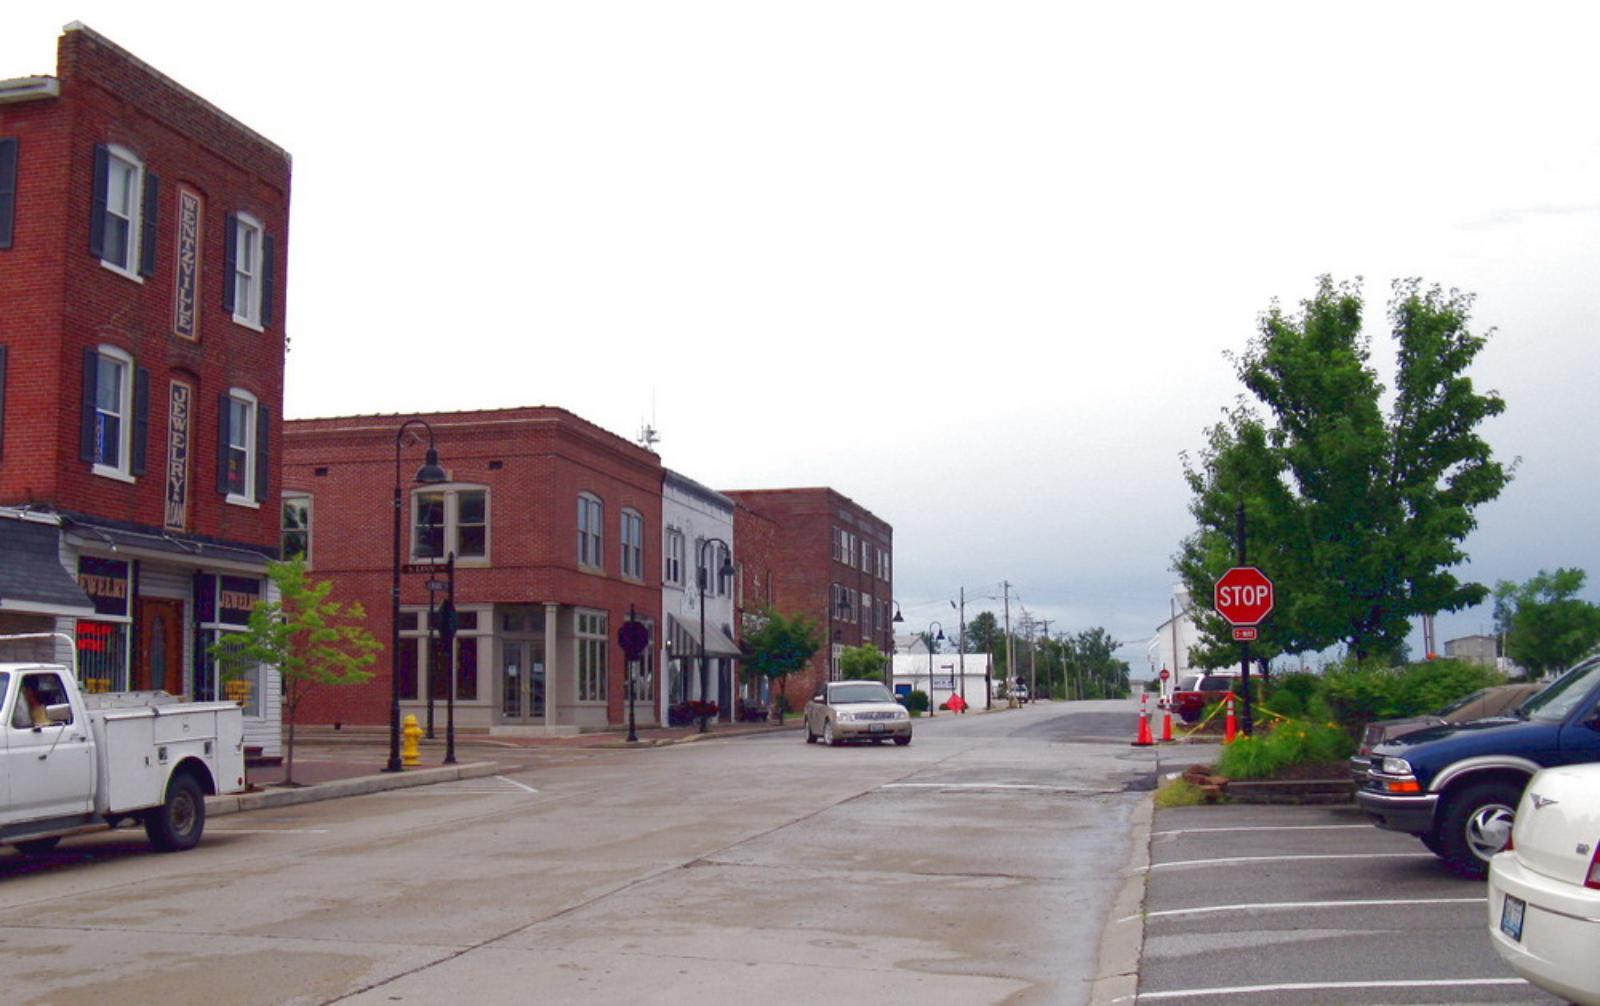
Springfield – Regional Hub Overextension

As southwestern Missouri’s largest city and economic center, Springfield serves healthcare, education, and manufacturing sectors that provide employment stability supporting housing demand. However, the dramatic price appreciation since 2008 has created disconnection between housing costs and local wage levels, with median prices more than doubling while incomes grew modestly. The current 63.4% overextension suggests mathematical limits have been reached.
Springfield’s 7.5% annual price volatility ranks among Missouri’s highest, indicating a market prone to sharp swings that could amplify during corrections. The city’s diverse economy, while providing some stability, cannot support indefinite price appreciation at current rates. Recent data showing cooling demand across Missouri suggests Springfield’s previously insulated market may finally face buyer resistance that triggers the correction needed to restore sustainable valuations relative to local economic fundamentals.
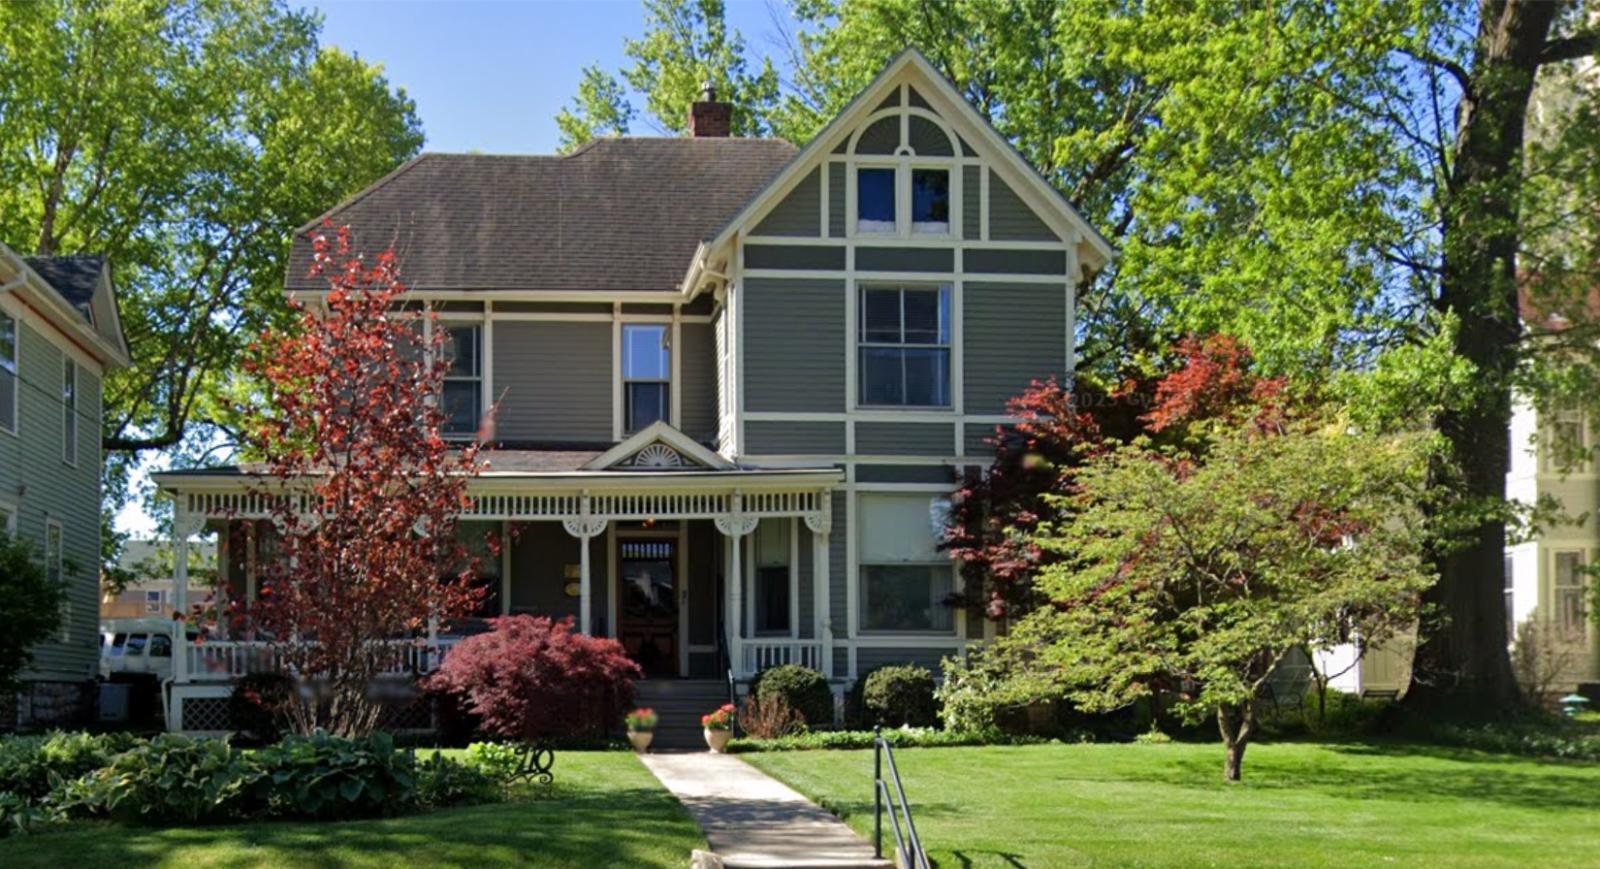
10. Saint Charles – Crash Risk Percentage: 52%
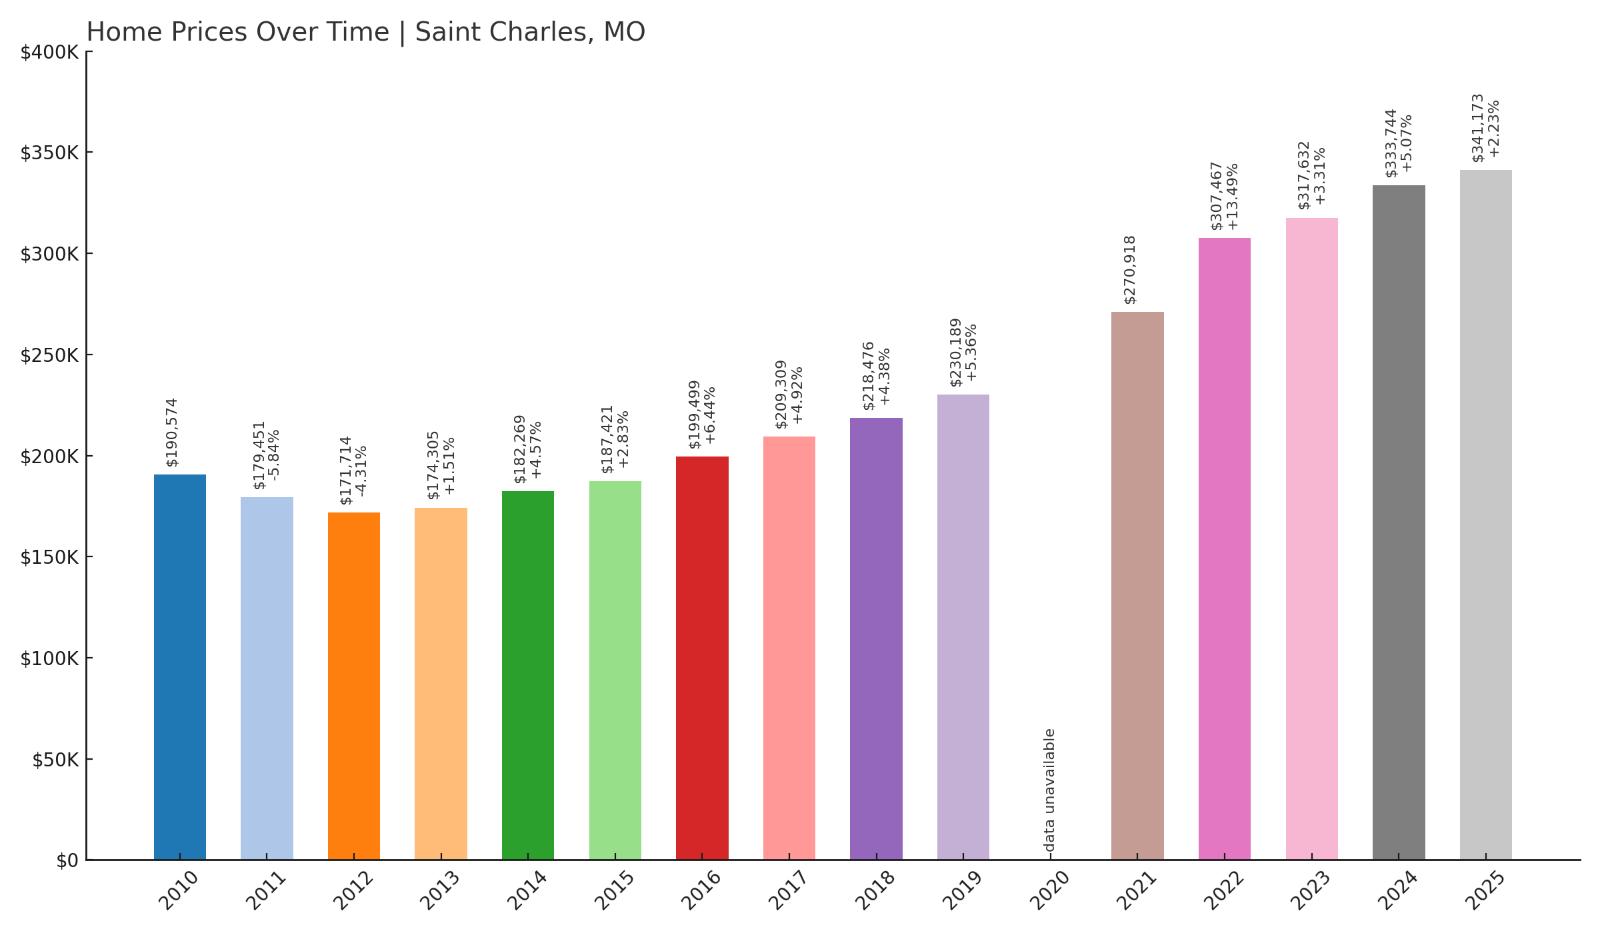
- Crash Risk Percentage: 52%
- Historical crashes (8%+ drops): 0
- Worst historical crash: -5.8% (2001)
- Total price increase since 2001: 123.4%
- Overextended above long-term average: 57.6%
- Price volatility (annual swings): 5.3%
- Current 2025 price: $341,173
Saint Charles exemplifies dangerous suburban overextension with median prices reaching $341,173, representing a 123.4% surge since 2001 that created 57.6% overvaluation above historical norms. This historic Missouri River community has evolved into an expensive St. Louis suburb where current pricing appears mathematically unsustainable relative to regional economic conditions. The 5.3% annual volatility masks building pressure that could explode during market corrections.
Saint Charles – Historic City, Modern Bubble
Founded as one of Missouri’s first European settlements, Saint Charles has leveraged its historical charm and strategic location to attract affluent suburban development. However, this transformation has driven housing costs to levels that disconnect from local economic realities, with median prices exceeding $340,000 in a region where household incomes remain modest. The 123.4% appreciation since 2001 reflects speculative demand rather than sustainable economic growth.
The city’s 57.6% overextension above long-term averages indicates prices have reached critical levels where correction becomes increasingly inevitable. Saint Charles faces particular vulnerability as a suburban community dependent on commuter demand that could evaporate during economic downturns or demographic shifts. Current pricing creates affordability barriers that exclude traditional buyers, leaving the market dependent on speculative demand that historically proves unsustainable during economic stress.
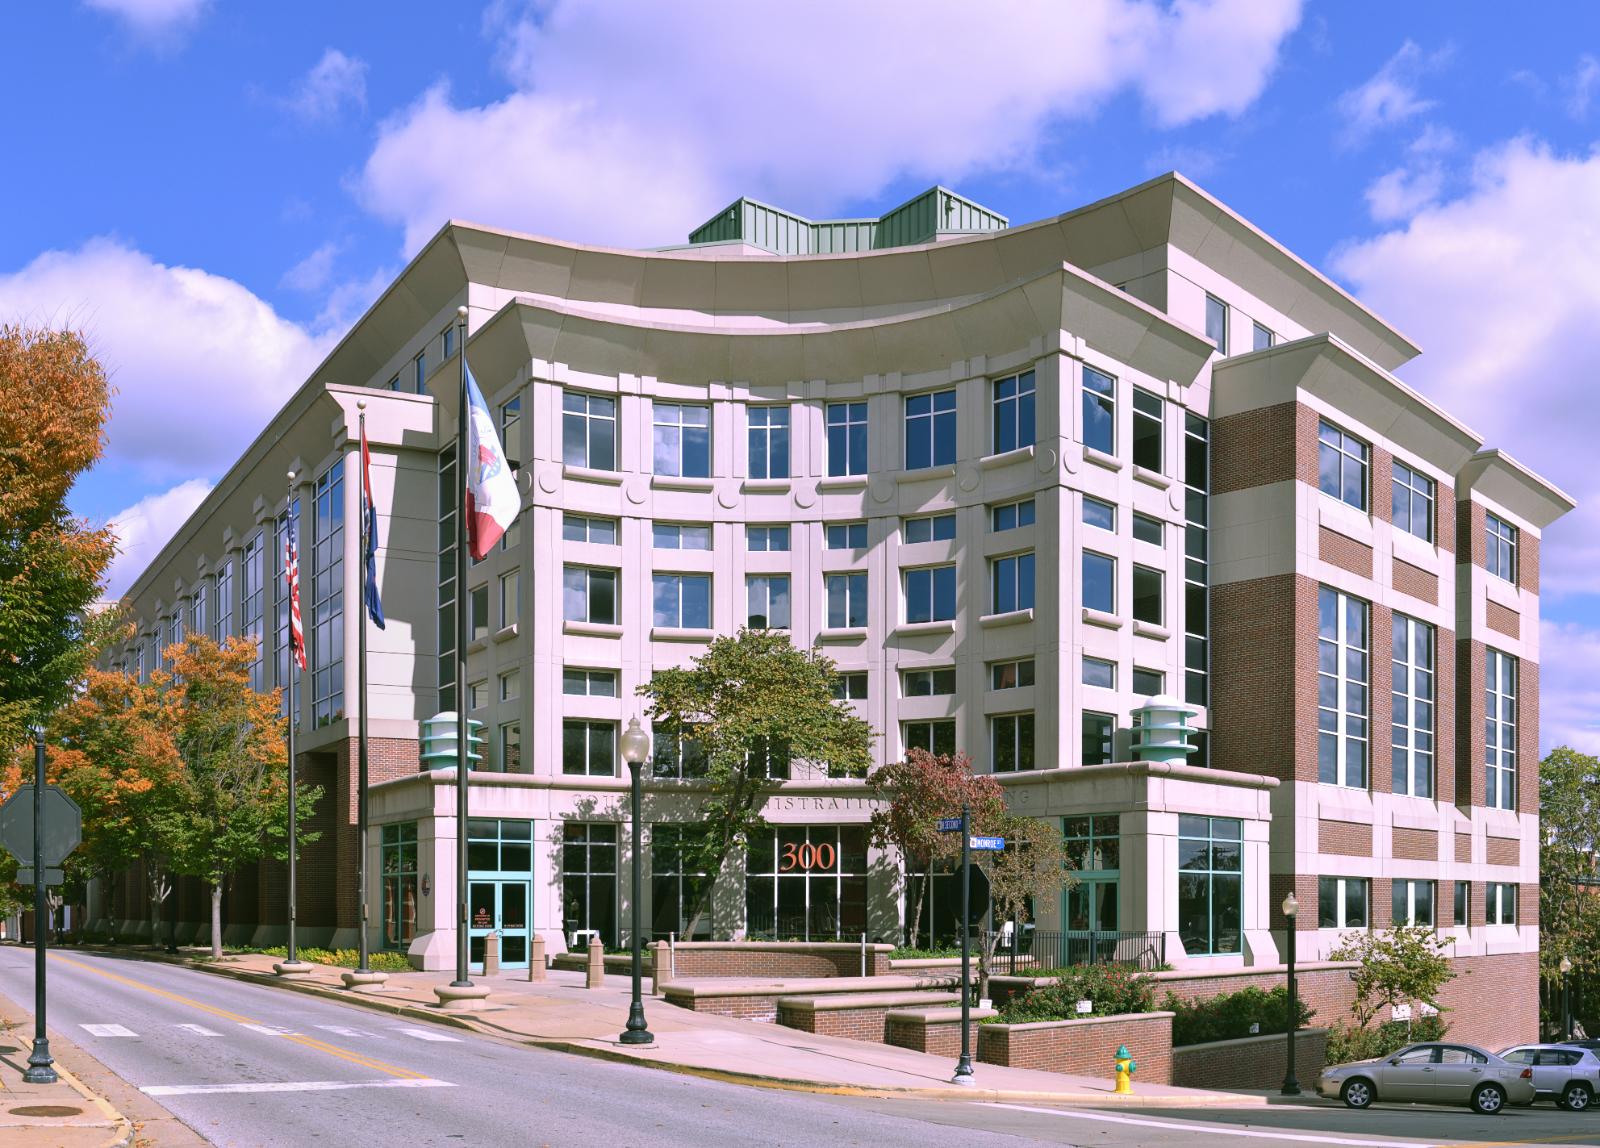
9. Joplin – Crash Risk Percentage: 55%
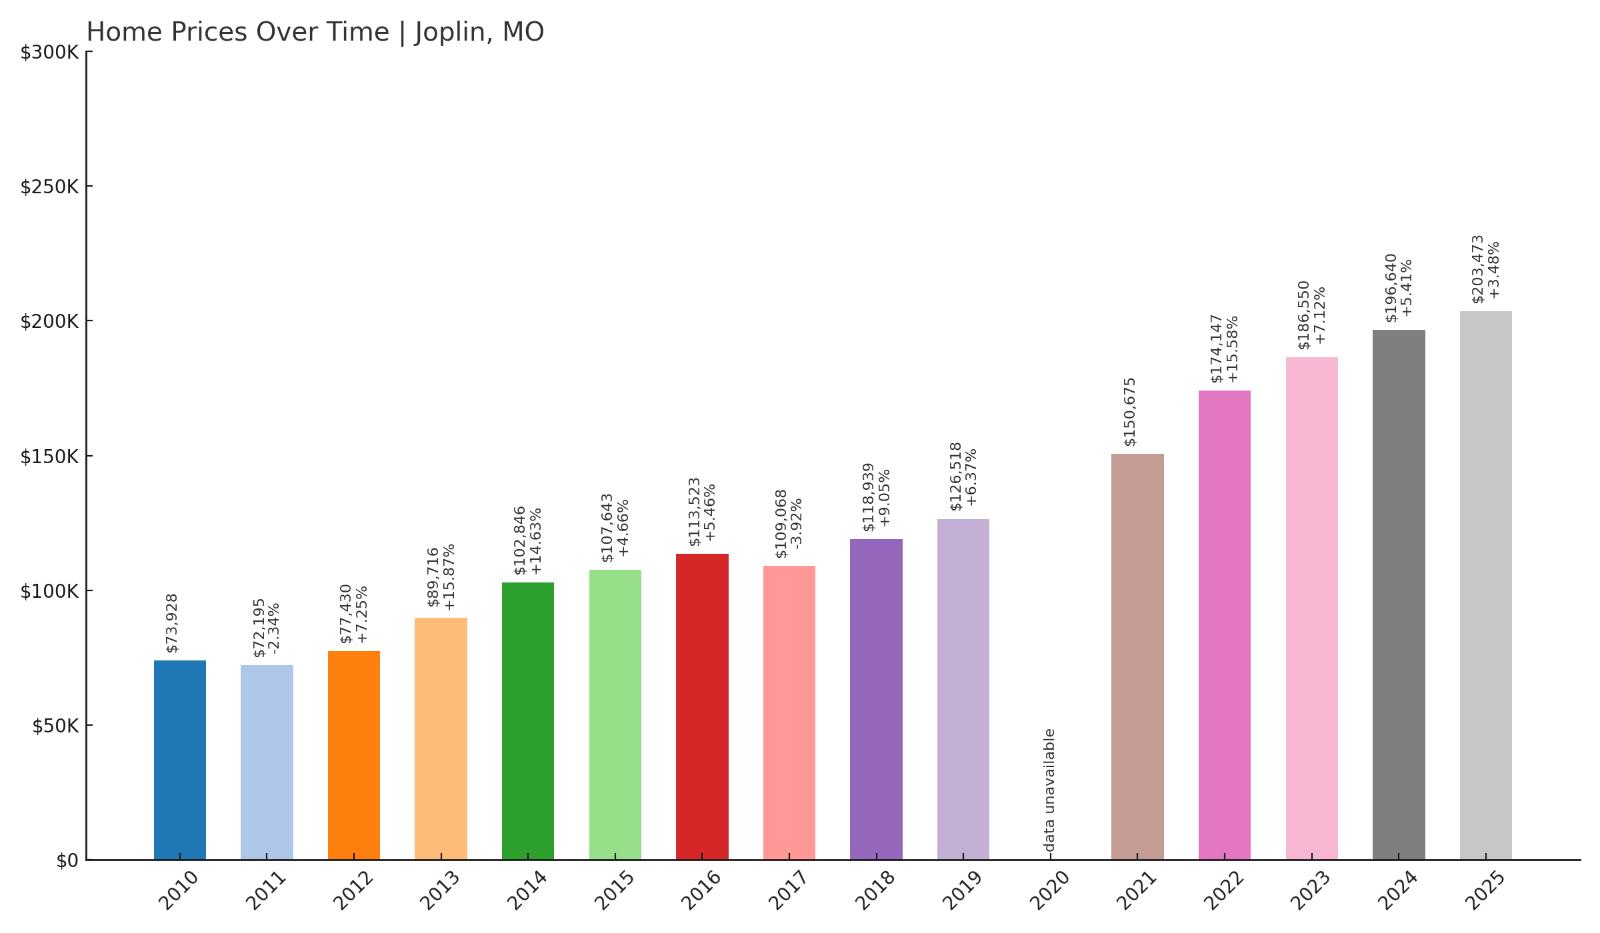
- Crash Risk Percentage: 55%
- Historical crashes (8%+ drops): 0
- Worst historical crash: -4.3% (2008)
- Total price increase since 2008: 156.3%
- Overextended above long-term average: 68.0%
- Price volatility (annual swings): 7.3%
- Current 2025 price: $203,473
Joplin’s remarkable recovery from devastating tornado damage in 2011 has driven extraordinary price appreciation of 156.3% since 2008, creating severe 68.0% overextension above historical averages despite current median prices of $203,473. This rebuilding boom fueled speculative demand that pushed valuations far beyond sustainable levels for a regional economy based primarily on mining and agriculture. The elevated 7.3% annual volatility indicates persistent market instability.
Joplin – Post-Disaster Speculation Bubble
Would you like to save this?
The catastrophic 2011 tornado that devastated Joplin triggered massive rebuilding efforts that attracted federal disaster funding, insurance proceeds, and speculative investment from across the region. This influx of capital created artificial demand that drove housing prices far above what the local economy can support long-term. Current median prices near $203,000 may seem reasonable compared to other Missouri markets, but represent dangerous overvaluation relative to local wage levels and economic fundamentals.
Joplin’s 68.0% overextension ranks among Missouri’s most severe, particularly concerning for a community whose economic base remains limited to traditional industries offering modest wage growth. The city’s 7.3% annual price volatility reflects ongoing market instability as speculative demand gradually fades and natural price discovery mechanisms reassert themselves. As disaster-related funding and attention diminish, Joplin faces heightened risk of significant price corrections that could exceed anything experienced before the tornado, potentially unwinding years of speculative appreciation.
8. Lees Summit – Crash Risk Percentage: 57%
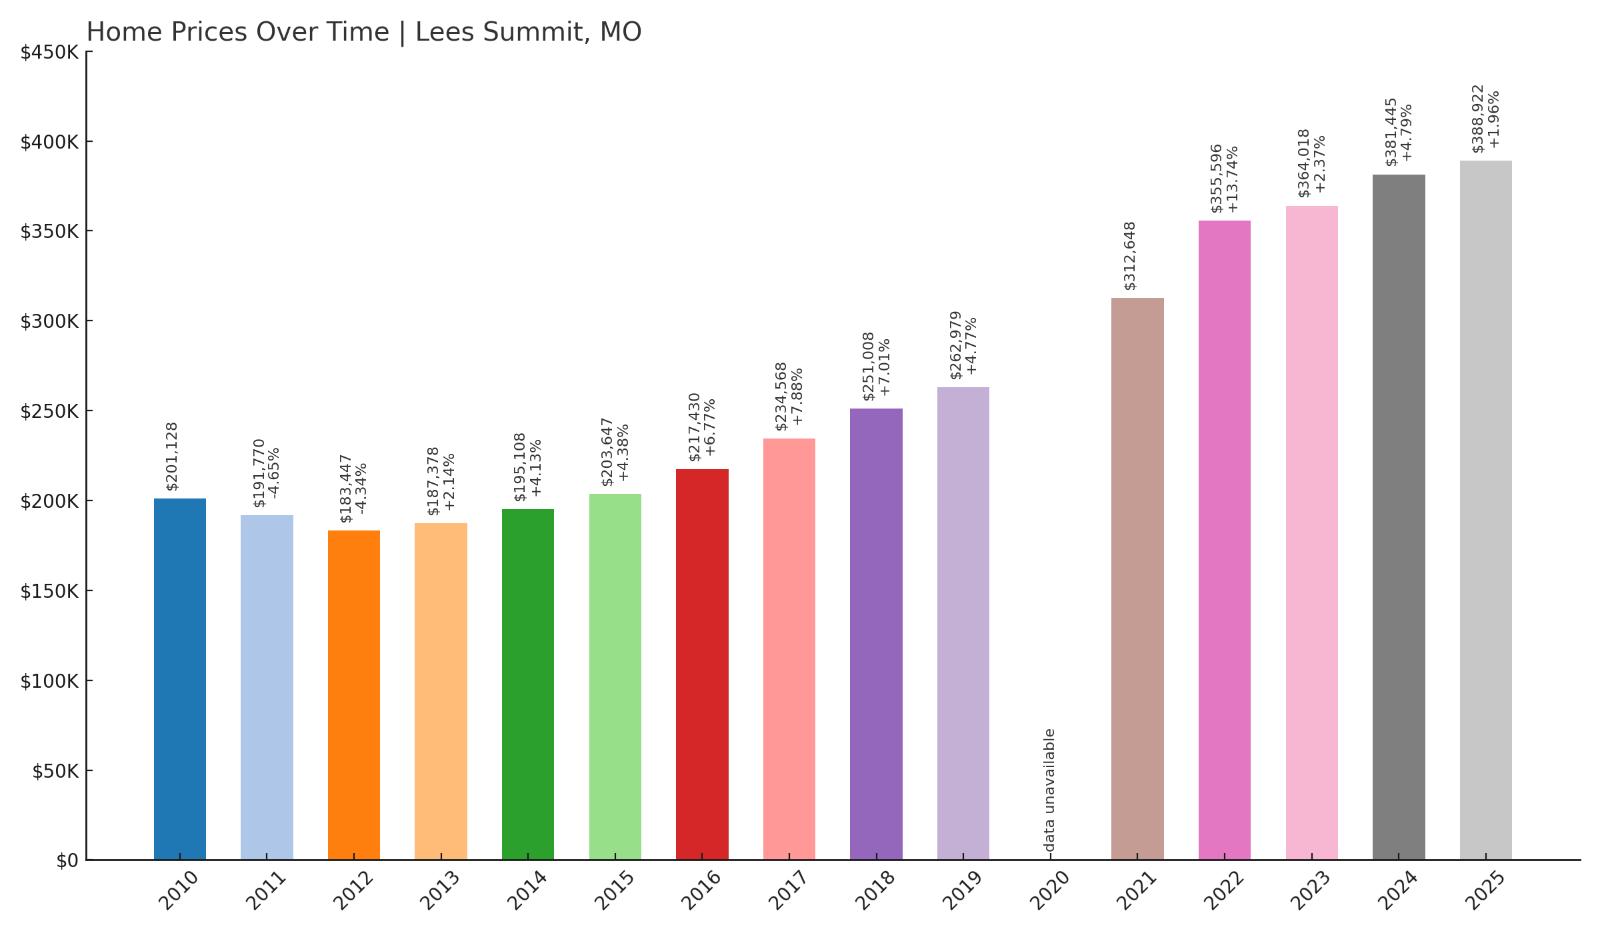
- Crash Risk Percentage: 57%
- Historical crashes (8%+ drops): 0
- Worst historical crash: -4.7% (2000)
- Total price increase since 2000: 142.2%
- Overextended above long-term average: 67.3%
- Price volatility (annual swings): 5.0%
- Current 2025 price: $388,922
Lees Summit represents extreme suburban overvaluation with median prices approaching $389,000, reflecting 142.2% appreciation since 2000 that created dangerous 67.3% overextension above historical averages. This upscale Kansas City suburb has attracted speculative demand that pushed values far beyond sustainable levels relative to regional economic fundamentals. Despite relatively moderate 5.0% annual volatility, the extreme overvaluation suggests substantial correction risk.
Lees Summit – Premium Suburb Bubble
Positioned as one of Kansas City’s most desirable suburban communities, Lees Summit has commanded premium pricing that attracted affluent buyers seeking excellent schools and suburban amenities. However, current median prices approaching $390,000 create severe affordability constraints that limit buyer pools and increase dependence on speculative demand. The 142.2% price appreciation since 2000 far exceeds regional income growth, indicating mathematical unsustainability.
The 67.3% overextension represents one of Missouri’s most dangerous pricing bubbles, particularly concerning for a community that lacks independent economic drivers beyond its residential appeal. Lees Summit’s premium positioning makes it vulnerable to sharp corrections during economic downturns as discretionary buyers withdraw from high-priced markets. The community’s relatively stable 5.0% volatility may actually increase crash risk by masking building pressure that could result in severe adjustments when market sentiment shifts toward more realistic valuations based on local economic fundamentals.
7. Saint Peters – Crash Risk Percentage: 57%
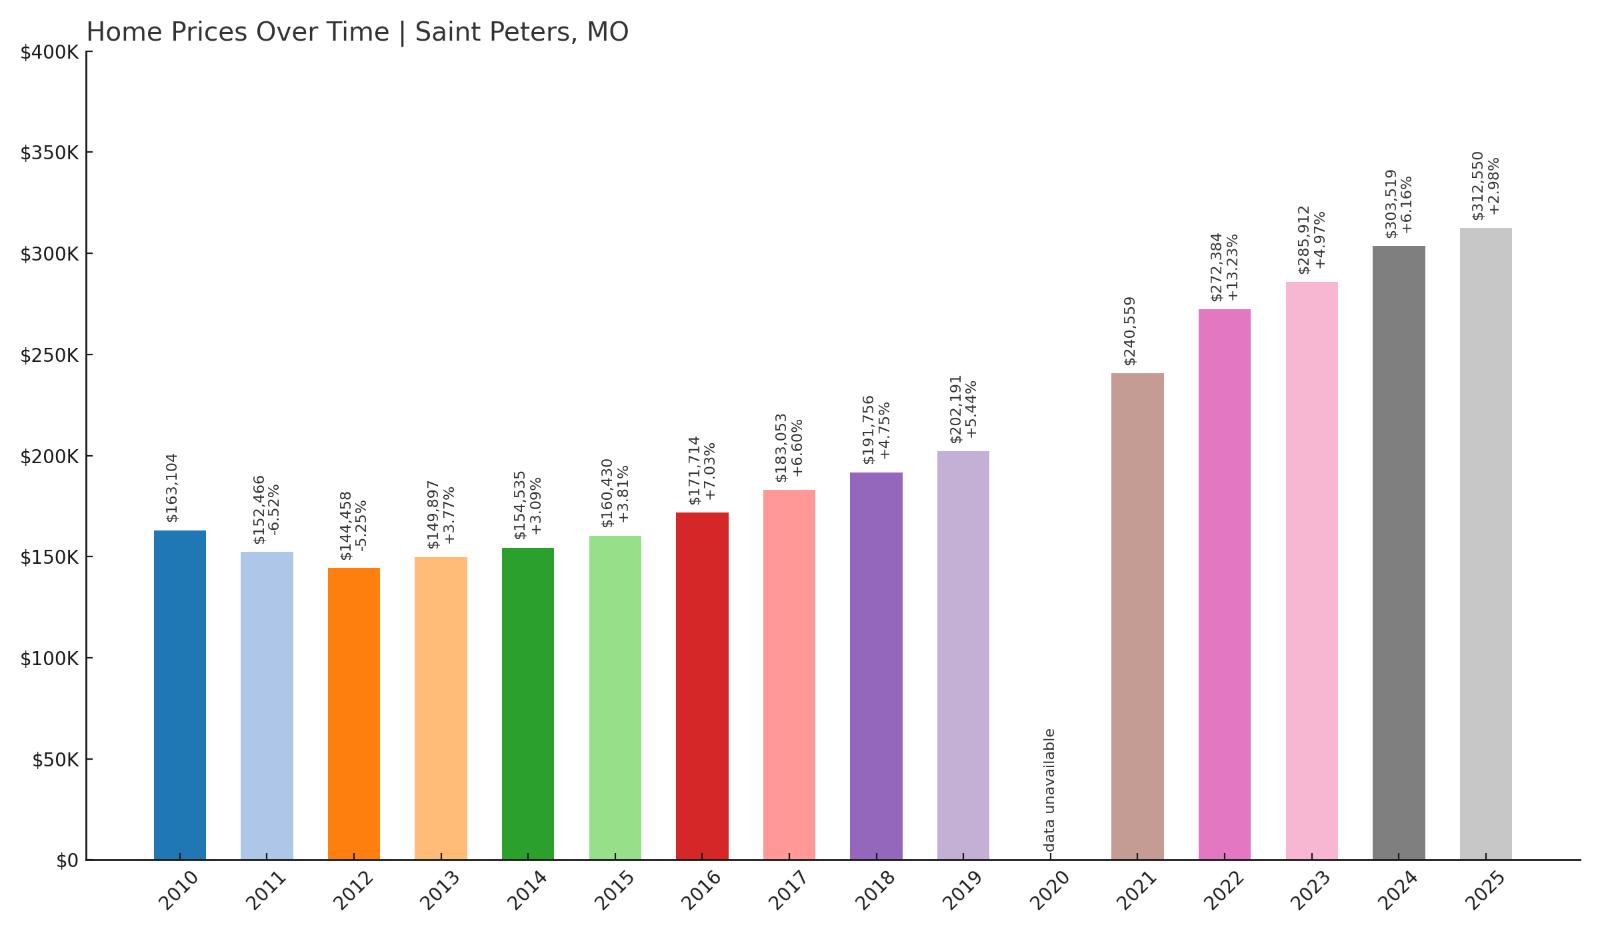
- Crash Risk Percentage: 57%
- Historical crashes (8%+ drops): 0
- Worst historical crash: -6.5% (2001)
- Total price increase since 2001: 140.5%
- Overextended above long-term average: 66.5%
- Price volatility (annual swings): 5.5%
- Current 2025 price: $312,550
Saint Peters exhibits dangerous overextension with median prices at $312,550 representing 140.5% appreciation since 2001 that created 66.5% overvaluation above historical averages. This St. Charles County suburb has experienced relentless price inflation without meaningful corrections, building speculative excess that appears mathematically unsustainable. The 5.5% annual volatility indicates underlying market instability that could accelerate during economic stress.
Saint Peters – Suburban Speculation Peak

Located in rapidly growing St. Charles County, Saint Peters has transformed from agricultural land into a major suburban center attracting families seeking newer homes and modern amenities. This development boom attracted speculative investment that drove prices far beyond what local economic fundamentals can support. Current pricing above $312,000 creates affordability barriers that exclude many traditional buyers from the market.
The 66.5% overextension indicates Saint Peters has reached critical valuation levels where correction becomes increasingly inevitable. The community’s dependence on continued suburban growth and speculative demand creates vulnerability as regional inventory increases and buyer competition decreases. Saint Peters faces particular risk as a newer suburban area without established economic anchors beyond residential development, making it susceptible to sharp corrections when speculative demand evaporates during broader economic uncertainty.
6. Ballwin – Crash Risk Percentage: 62%
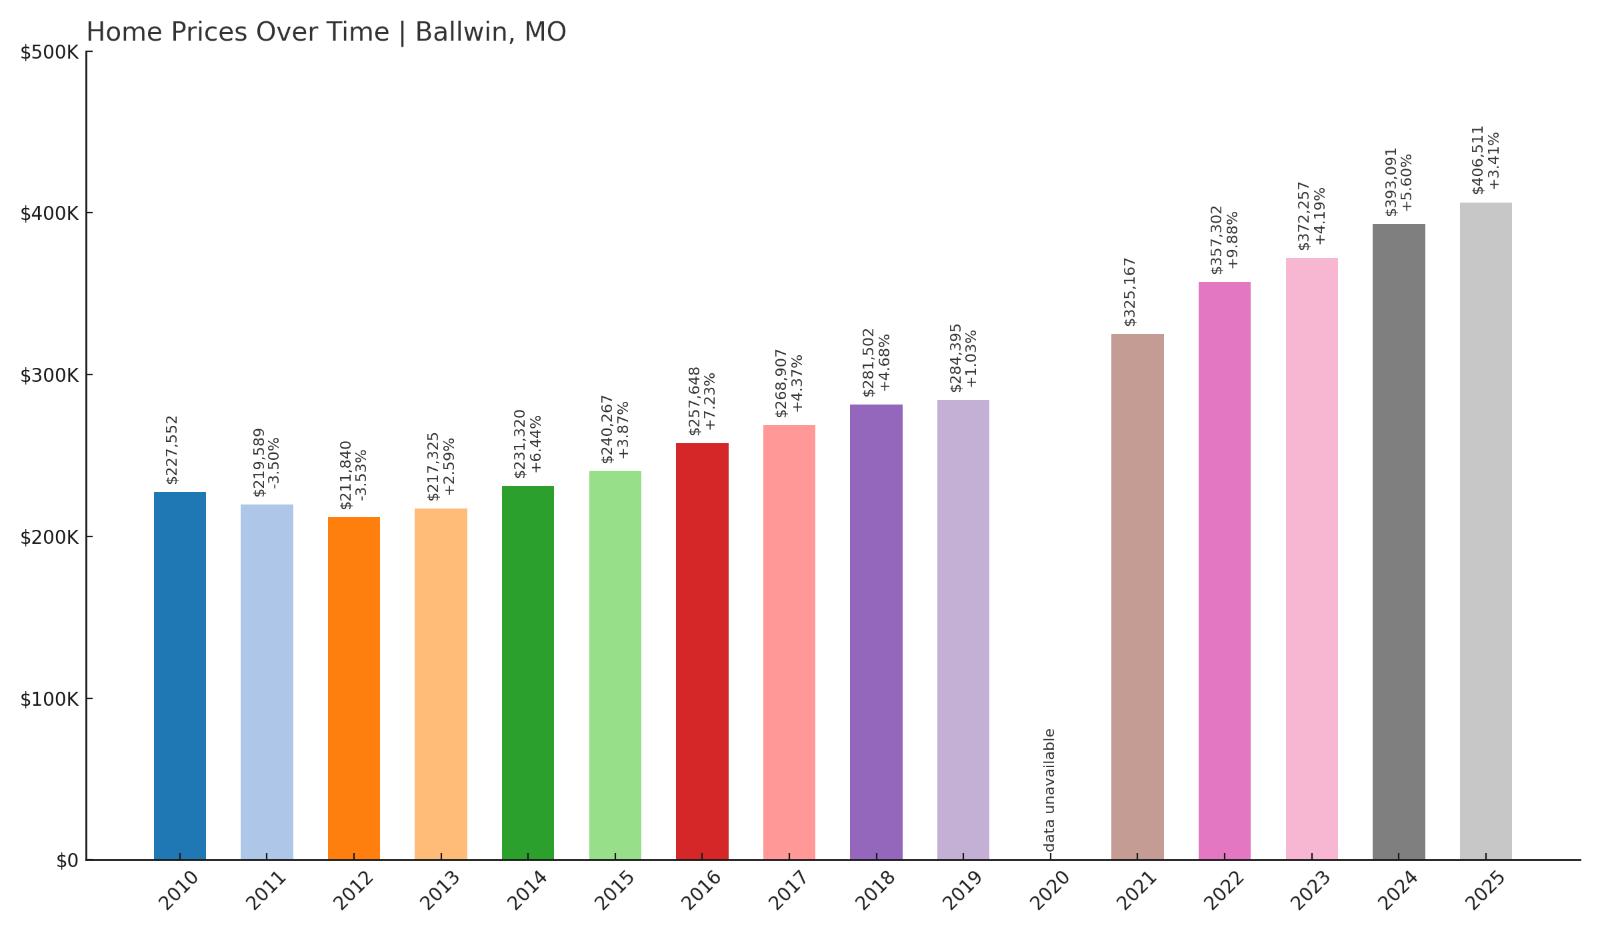
- Crash Risk Percentage: 62%
- Historical crashes (8%+ drops): 0
- Worst historical crash: -3.5% (2000)
- Total price increase since 2000: 141.3%
- Overextended above long-term average: 57.2%
- Price volatility (annual swings): 4.5%
- Current 2025 price: $406,511
Ballwin ranks among Missouri’s most expensive markets with median prices exceeding $406,000, reflecting 141.3% appreciation since 2000 that created 57.2% overextension above historical norms. This affluent St. Louis County suburb has attracted luxury demand that pushed values to unsustainable levels relative to regional economic conditions. Despite low 4.5% annual volatility suggesting stability, the extreme overvaluation indicates substantial correction risk.
Ballwin – Luxury Market Vulnerability
Established as one of St. Louis County’s premier suburban communities, Ballwin has maintained its reputation for excellent schools, low crime, and high property values that attract affluent buyers. However, current median prices above $406,000 represent extreme pricing for the region, creating severe affordability constraints that limit buyer pools to high-income households. The 141.3% appreciation since 2000 far exceeds regional income growth patterns.
Ballwin’s luxury market positioning makes it particularly vulnerable to corrections during economic downturns as discretionary buyers typically withdraw from high-priced markets first. The 57.2% overextension, while not the highest in Missouri, becomes more concerning at Ballwin’s price levels where small percentage declines translate to large dollar losses. The community’s low 4.5% volatility may create false confidence that masks building pressure for significant price adjustments to restore mathematical sustainability relative to local economic fundamentals.
5. O Fallon – Crash Risk Percentage: 62%
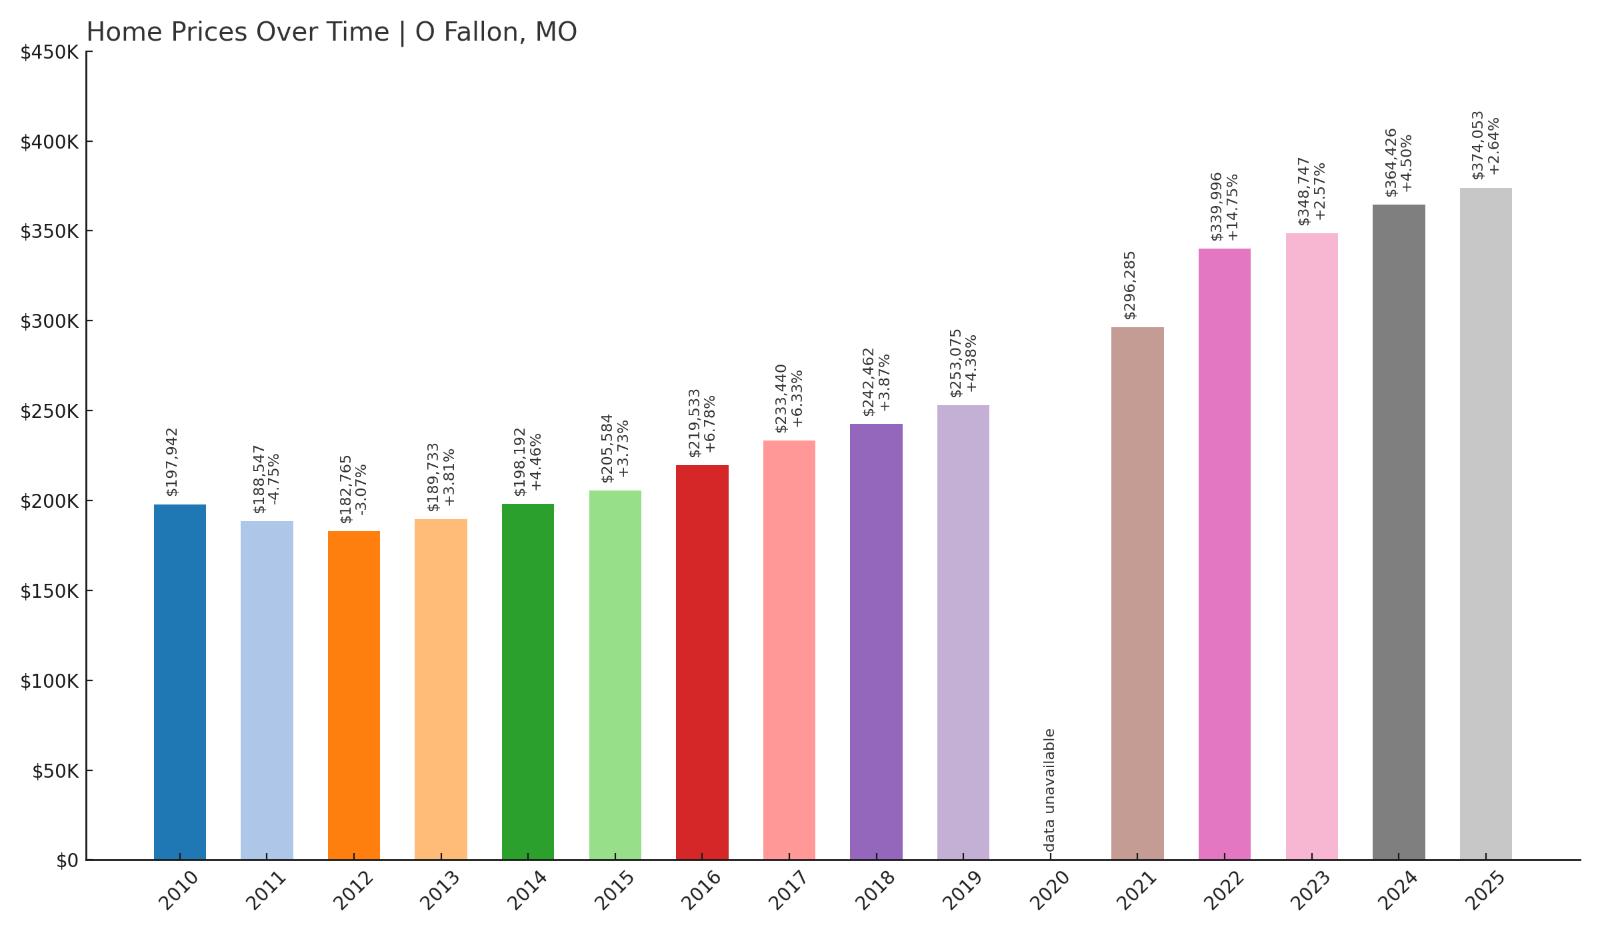
- Crash Risk Percentage: 62%
- Historical crashes (8%+ drops): 0
- Worst historical crash: -5.4% (2001)
- Total price increase since 2001: 132.6%
- Overextended above long-term average: 60.7%
- Price volatility (annual swings): 5.2%
- Current 2025 price: $374,053
O’Fallon’s rapid suburban expansion has driven median prices to $374,053, representing 132.6% appreciation since 2001 that created 60.7% overextension above historical averages. This St. Charles County community exemplifies dangerous suburban speculation where current valuations appear mathematically unsustainable relative to local economic fundamentals. The 5.2% annual volatility masks underlying instability that could explode during market corrections.
O’Fallon – Development Boom Risks

Positioned as a family-friendly community in booming St. Charles County, O’Fallon has experienced explosive residential growth that attracted speculative investment from across the region. This development boom pushed housing values far beyond what local employment and income levels can support long-term. Current median prices near $374,000 create severe affordability barriers that could trigger demand collapse as speculative buyers withdraw.
The 60.7% overextension indicates O’Fallon has reached critical valuation levels where significant correction becomes increasingly likely. The community’s dependence on continued suburban development and speculative demand creates vulnerability as regional market conditions shift toward buyer advantage. O’Fallon faces particular risk as a newer suburban area built primarily during the recent housing boom, lacking established economic anchors that could provide stability during market stress, potentially making it susceptible to sharp corrections exceeding its modest historical declines.
4. Saint Louis – Crash Risk Percentage: 62%
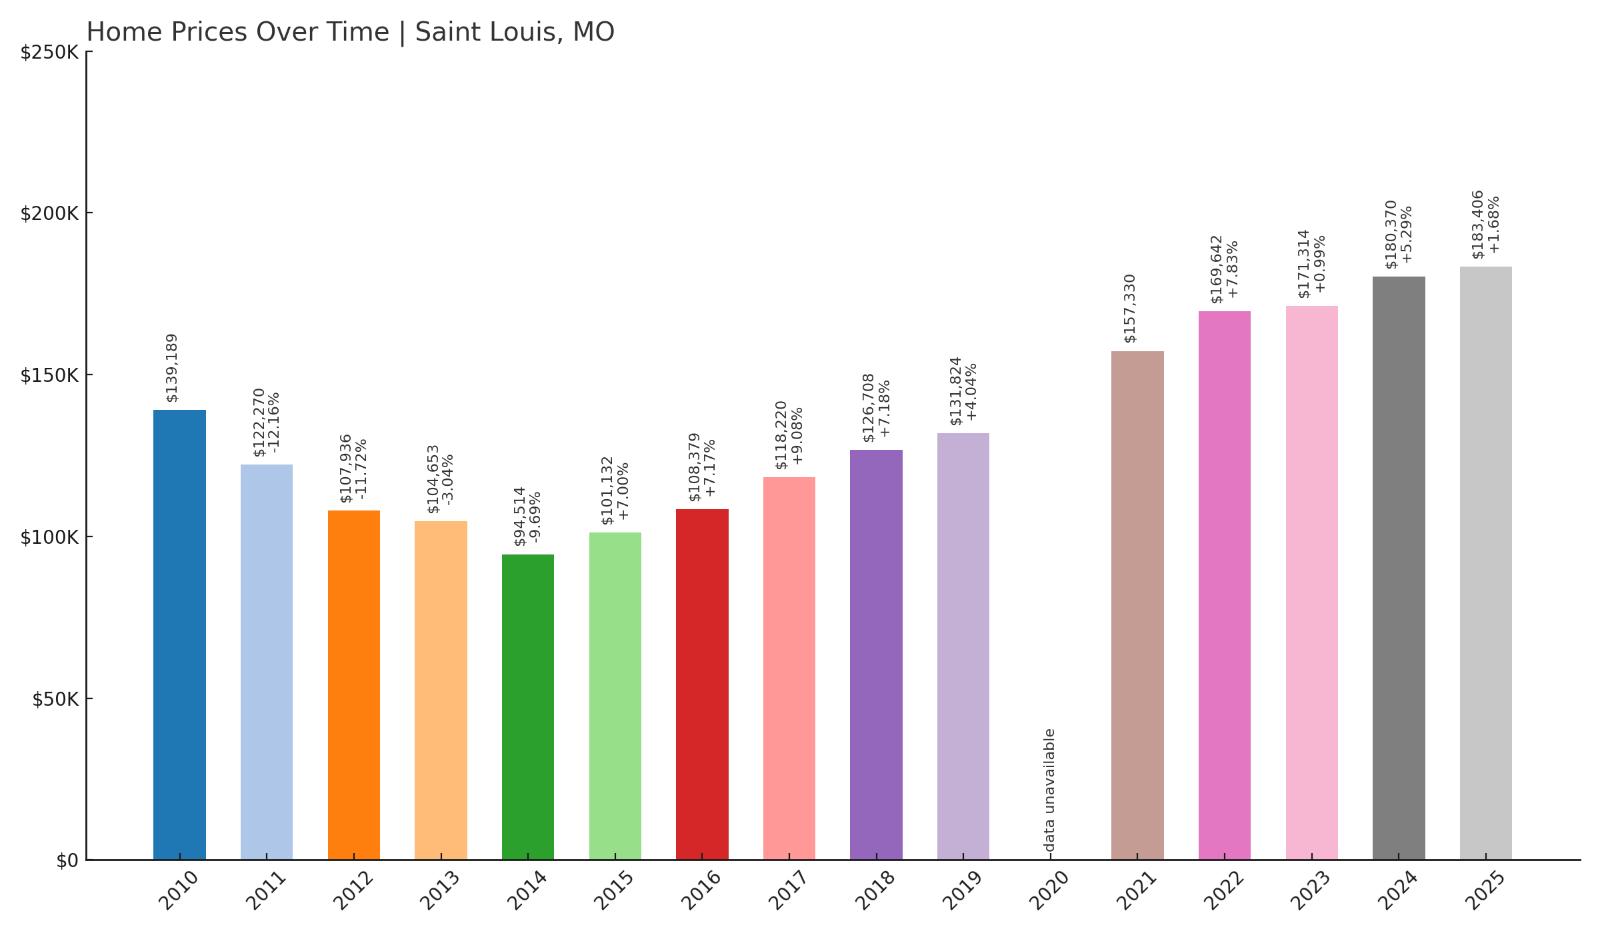
- Crash Risk Percentage: 62%
- Historical crashes (8%+ drops): 3
- Worst historical crash: -12.2% (2000)
- Total price increase since 2000: 116.8%
- Overextended above long-term average: 41.1%
- Price volatility (annual swings): 7.7%
- Current 2025 price: $183,406
Saint Louis presents unique crash risk despite moderate current pricing at $183,406, with a troubling history of three major crashes including a devastating 12.2% decline in 2000. The city’s 116.8% price recovery since 2000 created 41.1% overextension above historical averages, while elevated 7.7% annual volatility indicates persistent market instability. This combination of crash history and current overvaluation suggests Saint Louis remains vulnerable to repeat significant corrections.
Saint Louis – Repeat Crash Pattern
As Missouri’s largest city and historical economic center, Saint Louis has experienced repeated housing market crashes that established concerning patterns of volatility and instability. The city’s three historical crashes exceeding 8% declines, including the severe 12.2% drop in 2000, demonstrate how quickly values can deteriorate during economic stress. Current median prices near $183,000, while appearing affordable compared to suburban markets, represent dangerous overvaluation relative to the city’s declining population and limited economic growth.
Saint Louis faces structural challenges including population loss, urban decay, and limited economic diversification that contributed to previous crashes and continue to threaten current valuations. The 41.1% overextension above long-term averages, combined with 7.7% annual volatility ranking among Missouri’s highest, indicates an unstable market prone to sharp corrections. Recent data showing decreased home sales activity suggests buyer resistance may be building toward another significant correction that could exceed previous declines as the city’s fundamental economic challenges intensify.
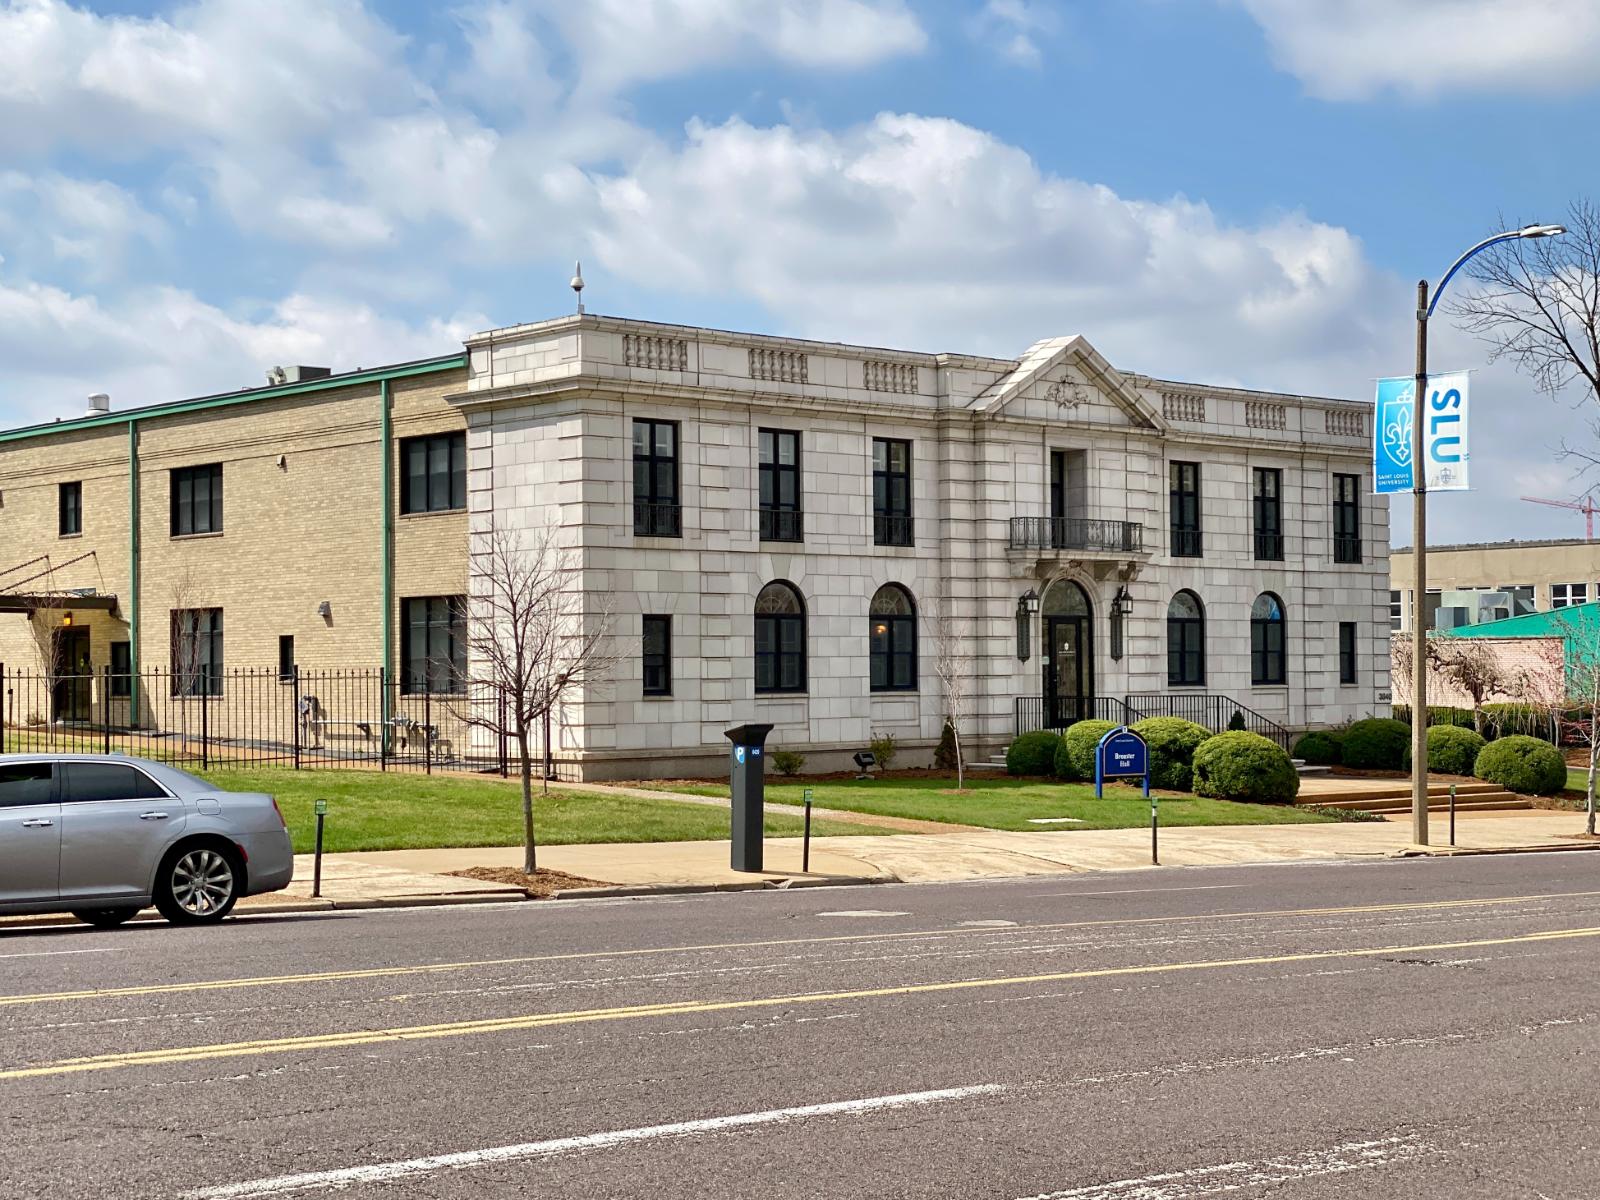
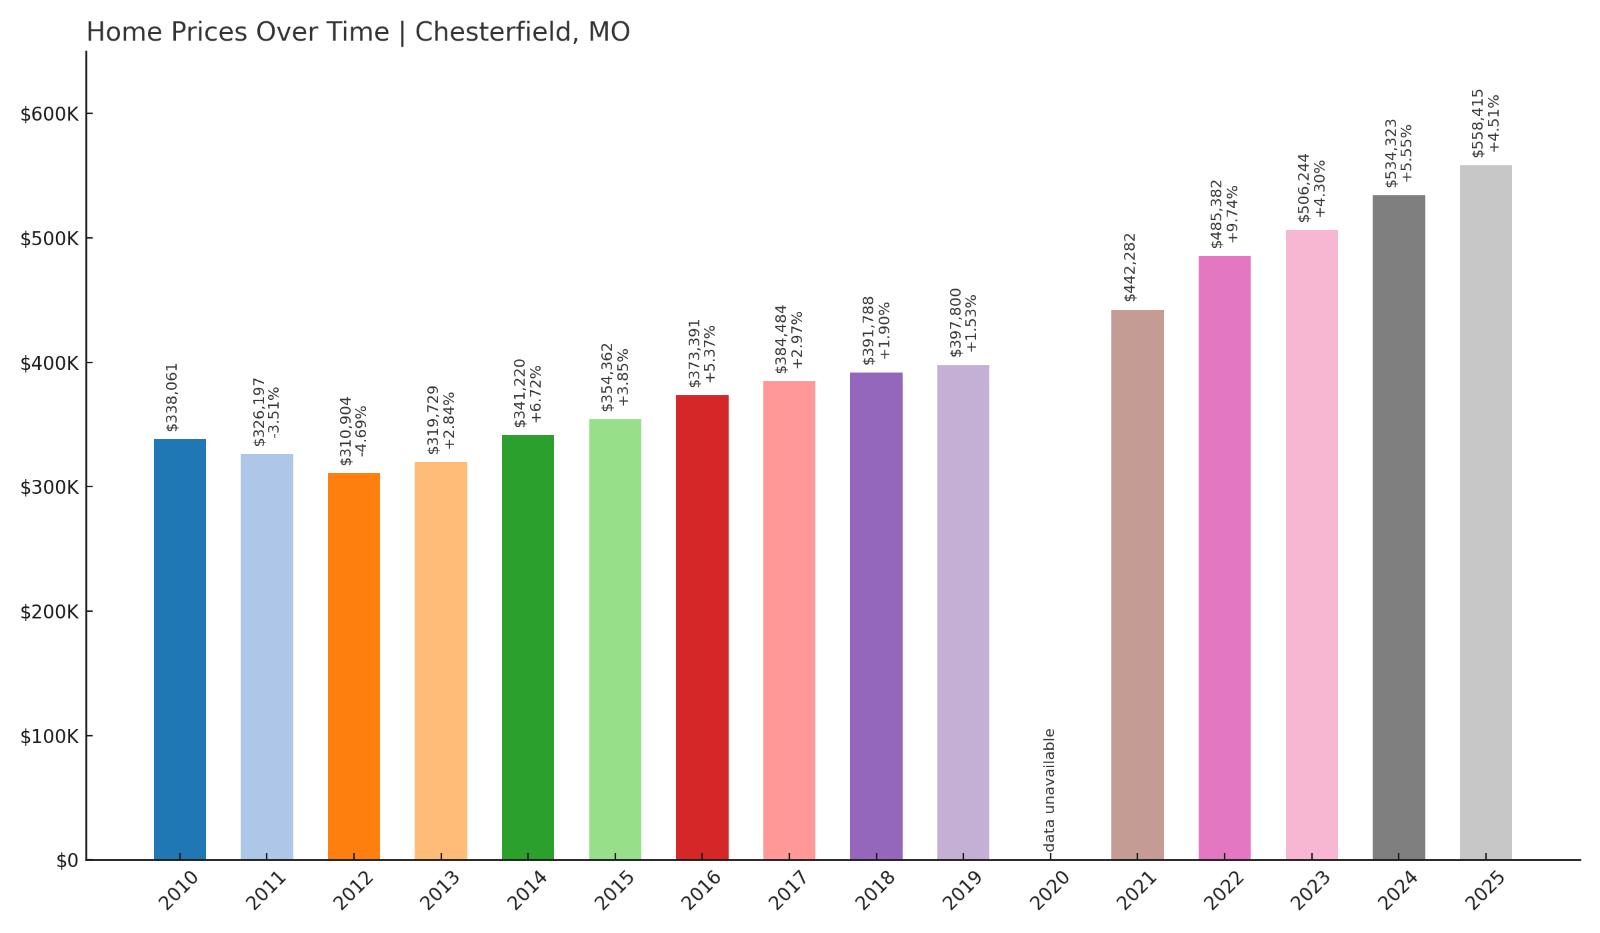
3. Chesterfield – Crash Risk Percentage: 65%
- Crash Risk Percentage: 65%
- Historical crashes (8%+ drops): 0
- Worst historical crash: -4.7% (2000)
- Total price increase since 2000: 122.3%
- Overextended above long-term average: 50.9%
- Price volatility (annual swings): 4.0%
- Current 2025 price: $558,415
Chesterfield represents Missouri’s most expensive housing market with median prices reaching $558,415, reflecting 122.3% appreciation since 2000 that created 50.9% overextension above historical averages. This ultra-luxury St. Louis County community has attracted speculative demand that pushed values to levels appearing mathematically unsustainable relative to regional economic conditions. Despite low 4.0% annual volatility suggesting stability, the extreme pricing creates severe vulnerability to sharp corrections.
Chesterfield – Ultra-Luxury Bubble Risk
Positioned as St. Louis County’s premier luxury community, Chesterfield has commanded the region’s highest housing prices through its reputation for upscale shopping, corporate headquarters, and affluent demographics. However, current median prices approaching $560,000 represent extreme pricing for Missouri, creating severe affordability constraints that limit buyer pools to the highest income brackets. The 122.3% appreciation since 2000 far exceeds regional economic growth patterns.
Chesterfield’s ultra-luxury positioning makes it exceptionally vulnerable to corrections during economic downturns as high-end markets typically experience the most severe declines when discretionary buyers withdraw. The 50.9% overextension becomes particularly dangerous at Chesterfield’s price levels where modest percentage corrections translate to massive dollar losses. The community’s historically low 4.0% volatility may create false confidence while masking building pressure for dramatic price adjustments needed to restore mathematical sustainability relative to regional economic fundamentals and buyer capacity.
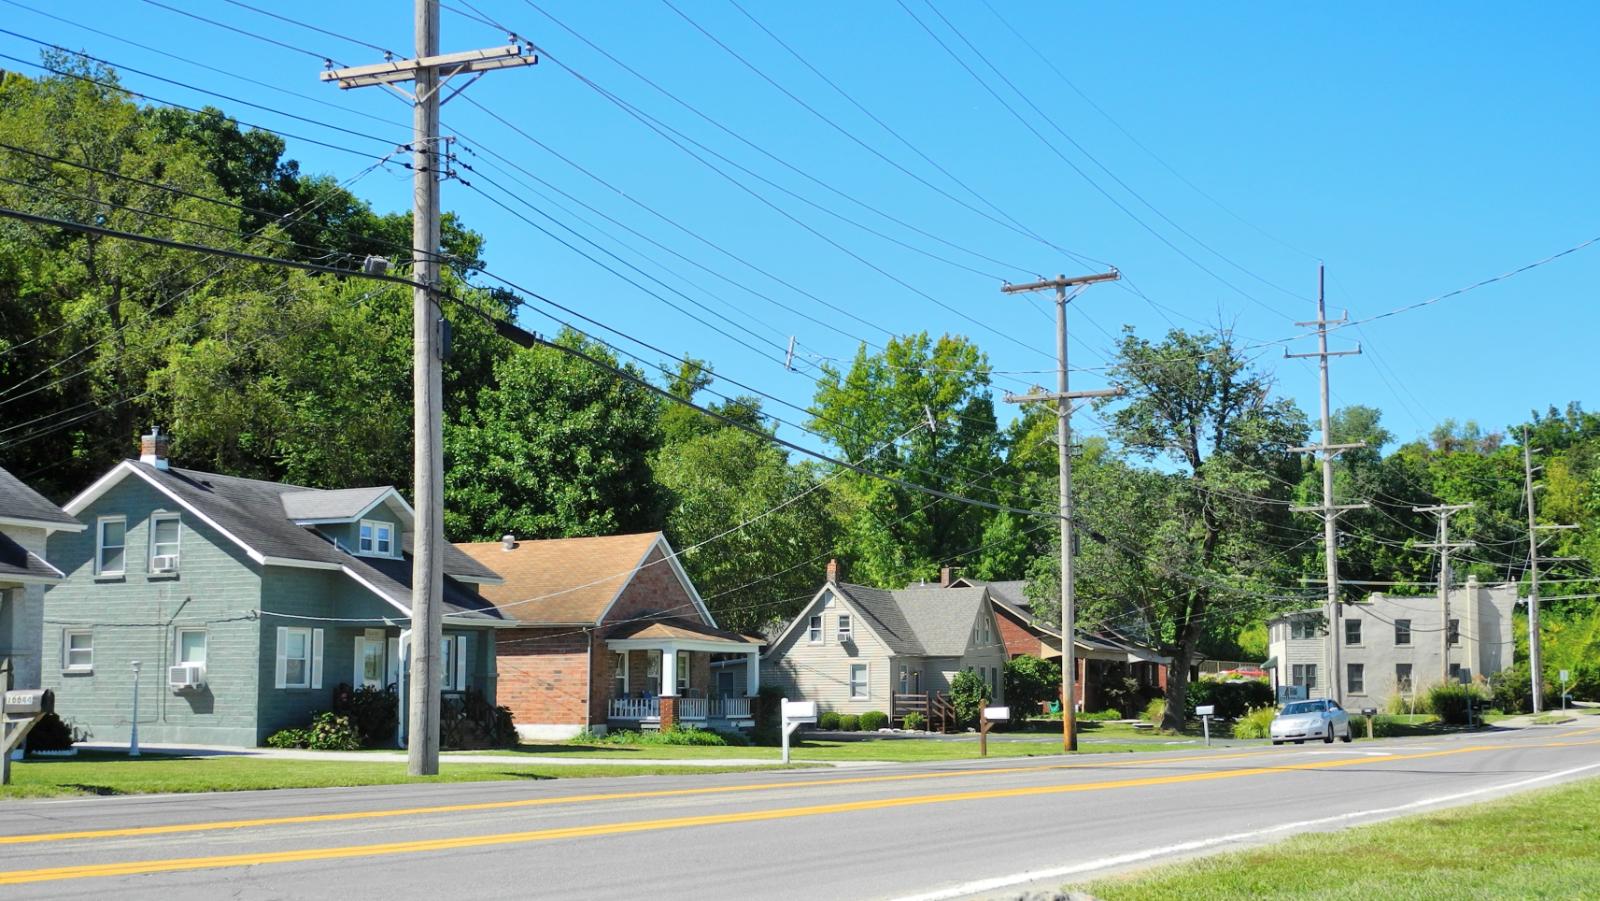
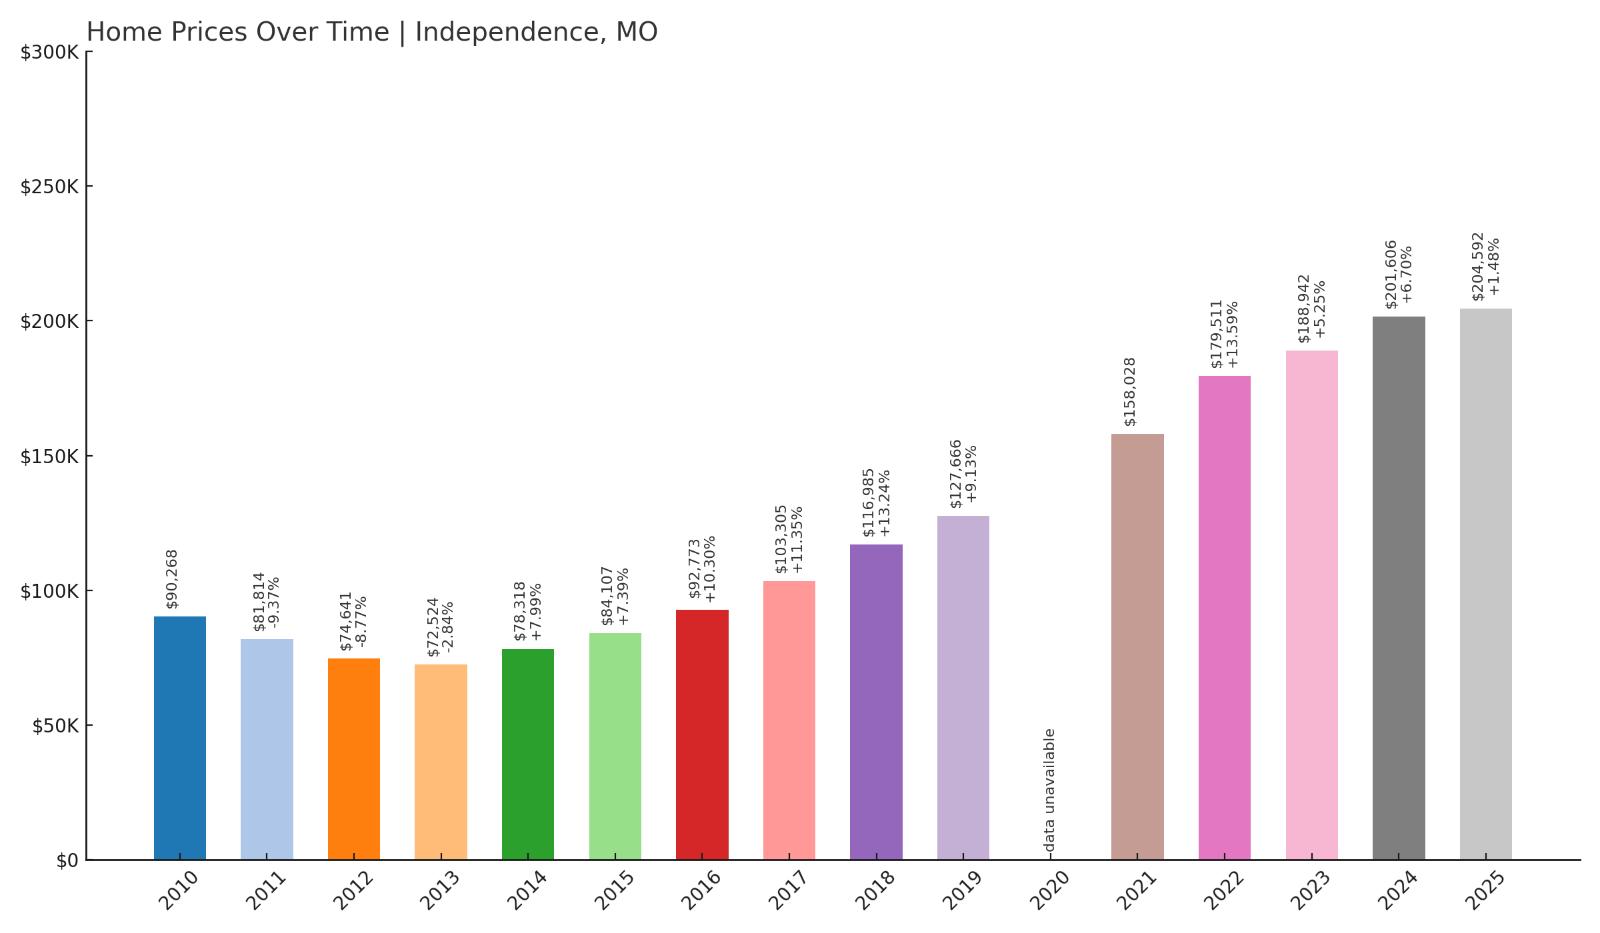
2. Independence – Crash Risk Percentage: 72%
- Crash Risk Percentage: 72%
- Historical crashes (8%+ drops): 2
- Worst historical crash: -9.4% (2000)
- Total price increase since 2000: 182.6%
- Overextended above long-term average: 86.2%
- Price volatility (annual swings): 7.5%
- Current 2025 price: $204,592
Independence exhibits extreme crash risk with a dangerous combination of historical volatility and severe current overextension. The city has experienced two major crashes including a 9.4% decline in 2000, yet prices have surged 182.6% since then, creating catastrophic 86.2% overextension above historical averages. Current median pricing at $204,592 reflects speculative excess that appears completely detached from local economic realities, while 7.5% annual volatility indicates persistent market instability.
Independence – Historical Crash Magnet
Located in Jackson County as part of the Kansas City metropolitan area, Independence has demonstrated repeated susceptibility to housing market crashes while simultaneously experiencing dramatic speculative bubbles. The city’s history of significant price declines, combined with current extreme overvaluation levels, creates a perfect storm for potential crash conditions. The 182.6% price surge since 2000 represents one of Missouri’s most dangerous speculative bubbles.
Independence’s 86.2% overextension above long-term averages ranks as Missouri’s second-highest, indicating mathematical unsustainability that virtually guarantees significant correction. The combination of crash history, extreme overvaluation, and high volatility creates conditions where future corrections could exceed previous declines dramatically. Current pricing appears completely disconnected from Independence’s economic fundamentals, suggesting speculative demand has driven values far beyond any reasonable relationship to local employment, income levels, or demographic trends that could support sustained demand at current price levels.
1. Kansas City – Crash Risk Percentage: 72%
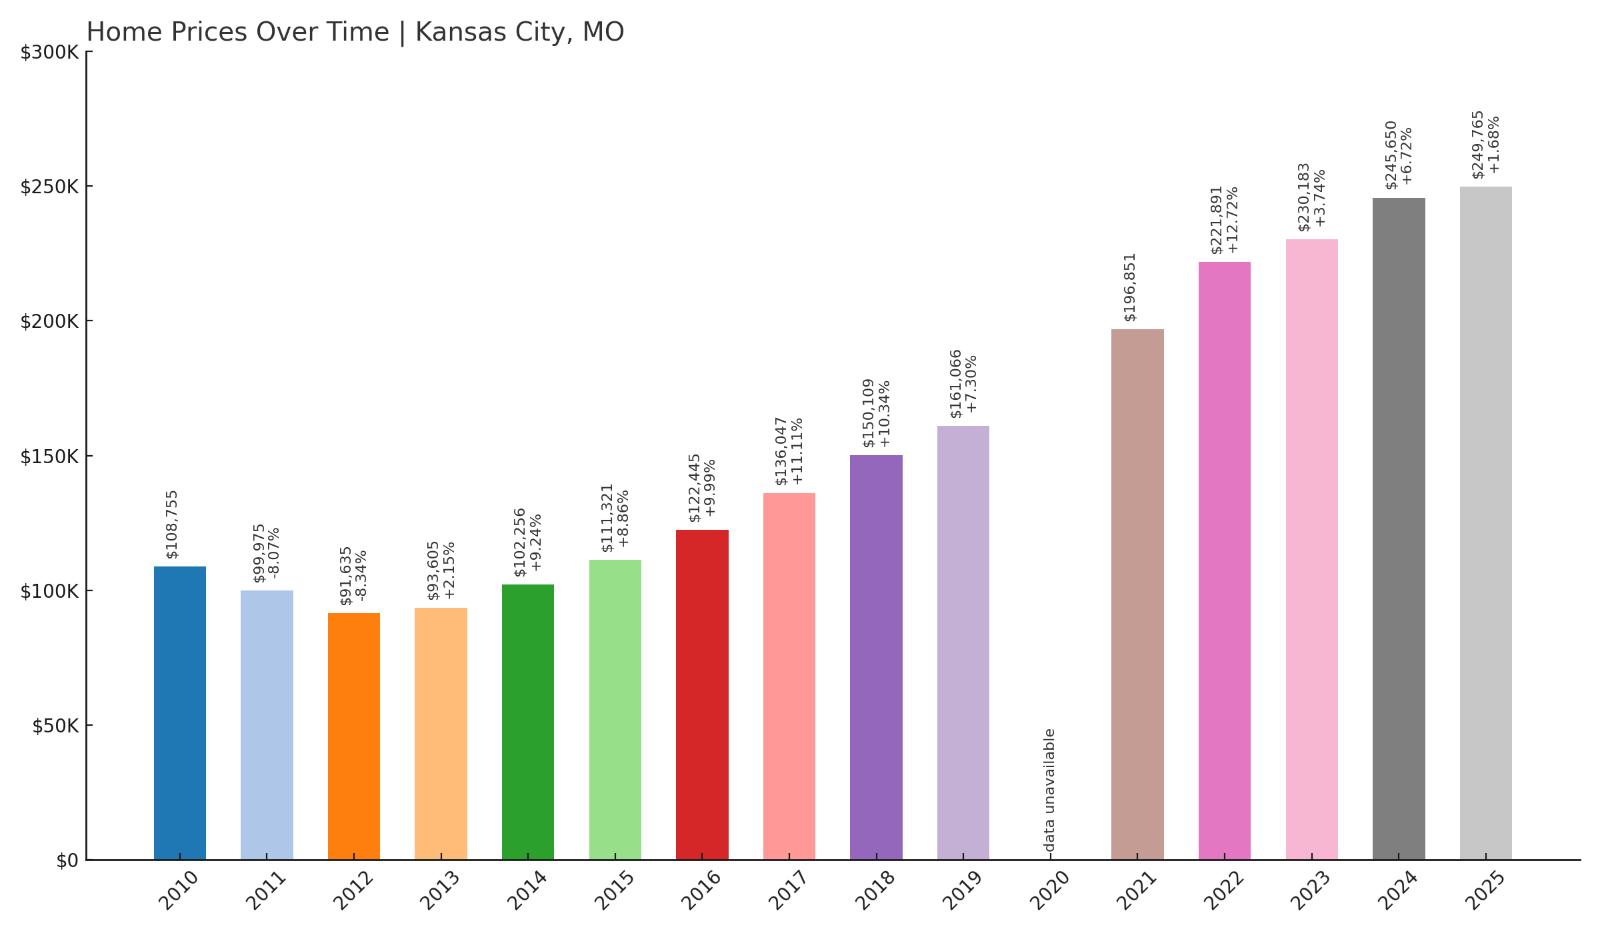
- Crash Risk Percentage: 72%
- Historical crashes (8%+ drops): 2
- Worst historical crash: -8.3% (2000)
- Total price increase since 2000: 186.0%
- Overextended above long-term average: 83.0%
- Price volatility (annual swings): 7.0%
- Current 2025 price: $249,765
Kansas City tops Missouri’s crash risk rankings with a catastrophic 72% probability driven by extreme overextension and troubling historical patterns. The city has experienced two major crashes yet prices have exploded 186.0% since 2000, creating dangerous 83.0% overextension above historical averages. Current median pricing at $249,765 reflects massive speculative excess that appears completely unsustainable relative to local economic fundamentals, while 7.0% annual volatility indicates ongoing market instability.
Kansas City – Perfect Storm Conditions
As Missouri’s largest metropolitan area and economic hub, Kansas City has attracted massive speculative investment that drove housing values far beyond sustainable levels despite the city’s diversified economy including healthcare, financial services, and logistics. The 186.0% price appreciation since 2000 represents Missouri’s most extreme speculative bubble, completely disconnected from regional income growth and economic development patterns. Current median prices approaching $250,000 create severe affordability barriers for local workers.
Kansas City’s 83.0% overextension above long-term averages creates mathematical conditions virtually guaranteeing significant correction, particularly given the city’s history of major crashes including an 8.3% decline in 2000. The combination of extreme overvaluation, crash history, and elevated 7.0% volatility creates perfect storm conditions where future corrections could exceed anything previously experienced. Recent regional data showing increased inventory and decreased buyer competition suggests Kansas City’s speculative bubble may finally be reaching exhaustion, setting the stage for potentially severe price adjustments that could ripple throughout Missouri’s interconnected housing markets.