🔥 Would you like to save this?
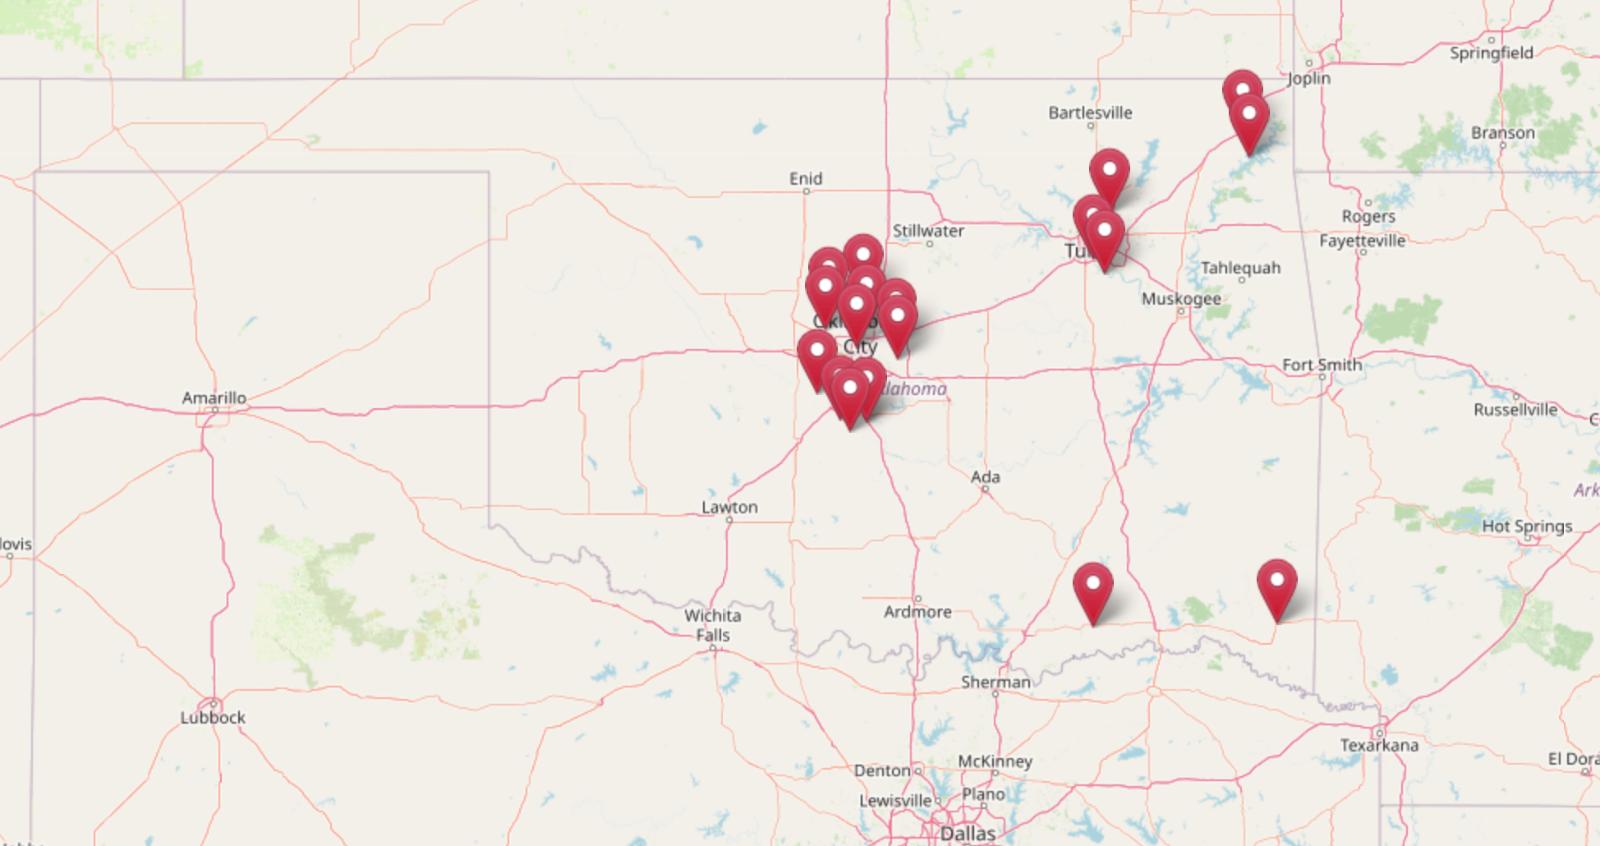
Using the latest figures from the Zillow Home Value Index, we’ve identified the 18 most expensive towns across Oklahoma as of May 2025. These places top the state in terms of home values, and many have seen extraordinary growth over the last 10 to 15 years—some doubling or even tripling in price. This list ranks them based on current prices, but also gives you the full picture: how much they’ve appreciated over time, when they surged, and what might be driving demand in each community.
Some towns are well-known suburbs near Oklahoma City and Tulsa, prized for their school systems, amenities, and location. Others are smaller, scenic towns near lakes or recreational areas that have attracted second-home buyers and investors in recent years. And a few have quietly become hot markets, rising steadily without much fanfare. For each town, we’ve included a full year-by-year price history from 2010 to 2025 and detailed commentary explaining the trends. Whether you’re a homebuyer, investor, or just curious about Oklahoma’s shifting housing market, this roundup offers insight into where values are highest—and why.
In order to come up with the very specific design ideas, we create most designs with the assistance of state-of-the-art AI interior design software. Also, assume links that take you off the site are affiliate links such as links to Amazon. this means we may earn a commission if you buy something.
18. Cole – 114% Home Price Increase Since 2011
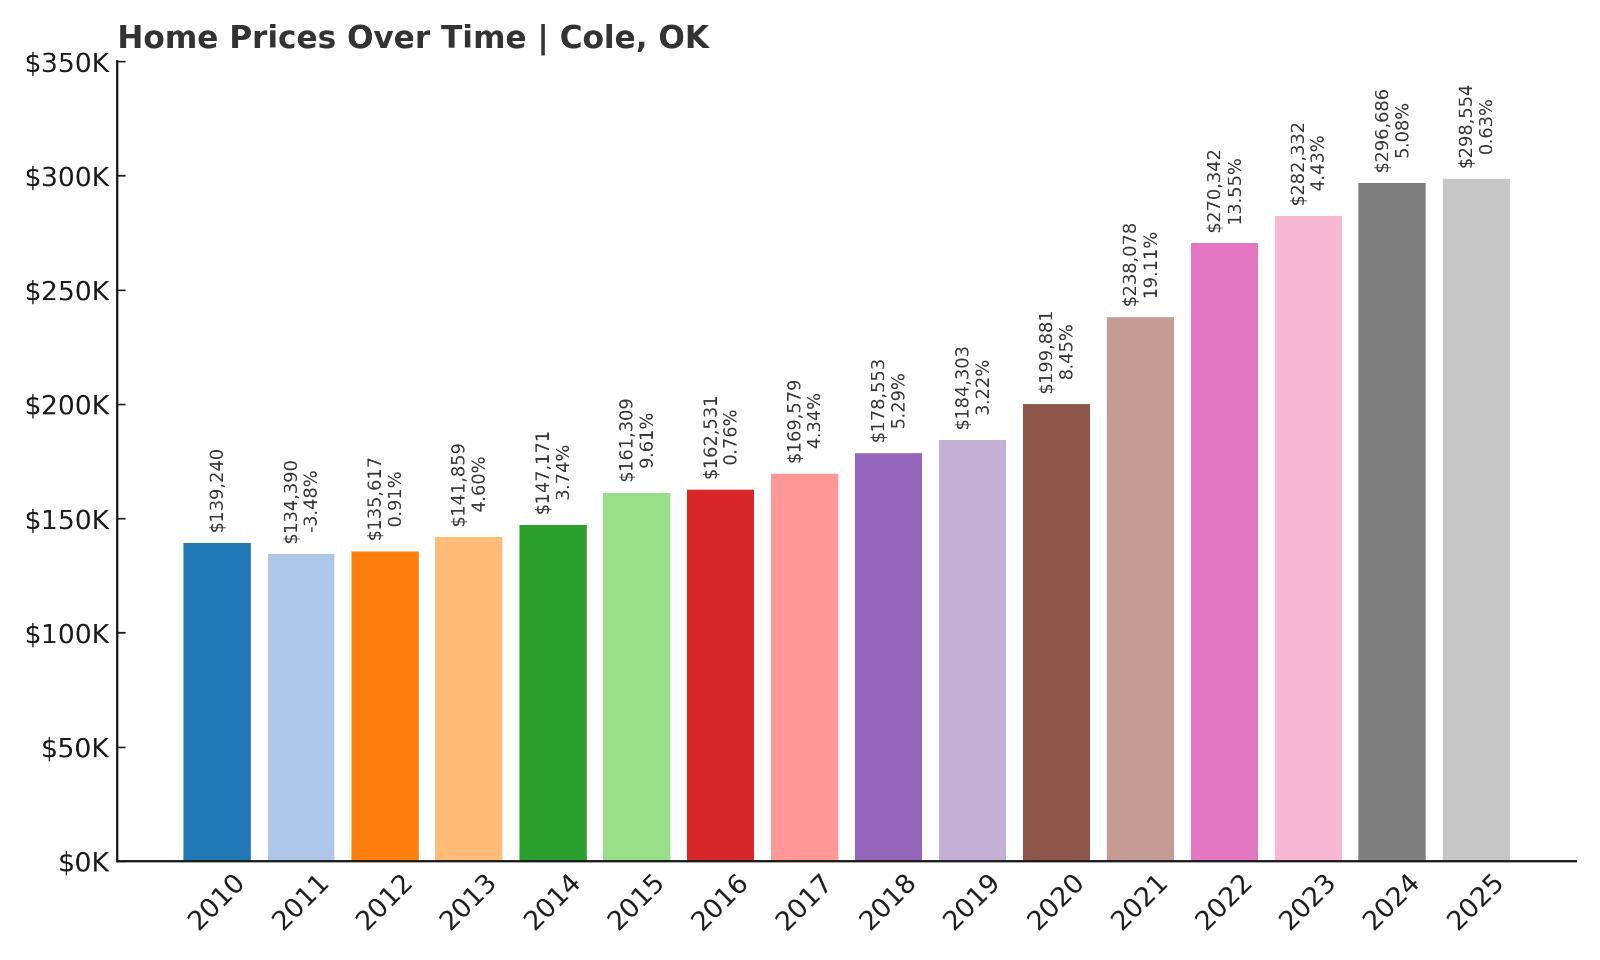
- 2010: $139,240
- 2011: $134,390 (-$4,850, -3.48% from previous year)
- 2012: $135,617 (+$1,227, +0.91% from previous year)
- 2013: $141,859 (+$6,242, +4.60% from previous year)
- 2014: $147,171 (+$5,312, +3.74% from previous year)
- 2015: $161,309 (+$14,138, +9.61% from previous year)
- 2016: $162,531 (+$1,222, +0.76% from previous year)
- 2017: $169,579 (+$7,049, +4.34% from previous year)
- 2018: $178,553 (+$8,974, +5.29% from previous year)
- 2019: $184,303 (+$5,749, +3.22% from previous year)
- 2020: $199,881 (+$15,579, +8.45% from previous year)
- 2021: $238,078 (+$38,197, +19.11% from previous year)
- 2022: $270,342 (+$32,264, +13.55% from previous year)
- 2023: $282,332 (+$11,989, +4.43% from previous year)
- 2024: $296,686 (+$14,354, +5.08% from previous year)
- 2025: $298,554 (+$1,868, +0.63% from previous year)
Home prices in Cole have surged by more than 114% since 2011, climbing from $134K to nearly $299K in 2025. After a slight dip in 2011, the town experienced steady annual increases, with particularly sharp jumps between 2020 and 2022. The largest single-year increase came in 2021, with a 19.1% leap, signaling a strong period of demand. Though the pace has since cooled, values have continued inching upward. Cole’s trajectory reflects a steady growth curve that has held strong despite broader economic shifts.
Cole – Strong Growth With Steady Demand
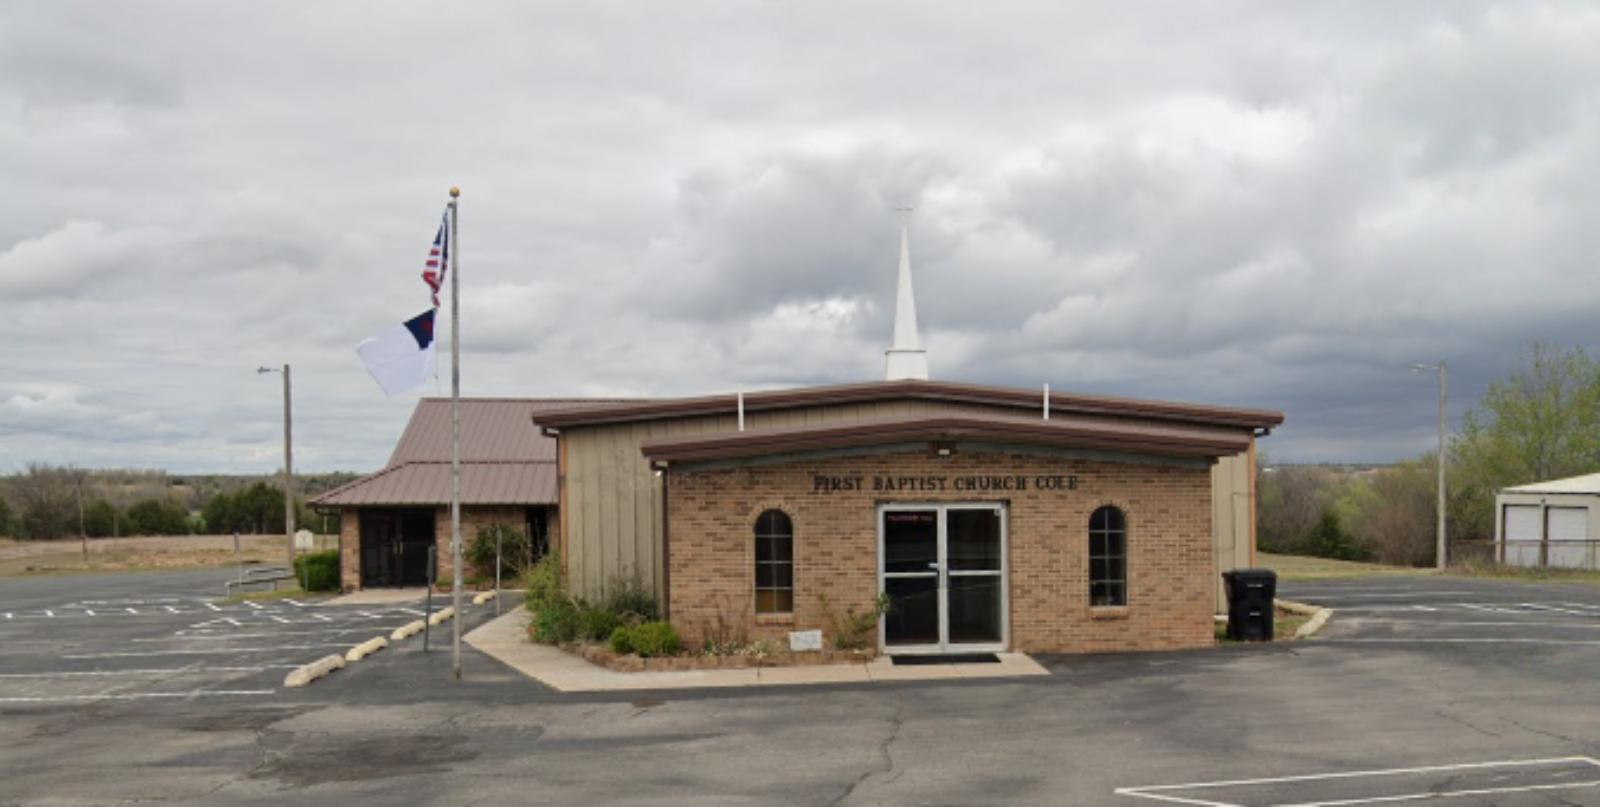
Located just south of the Oklahoma City metro area, Cole offers a quieter pace of life while still being within commuting distance of urban job centers. This combination has made it attractive to families and professionals looking for more space and affordability outside the city. Much of the town’s appeal lies in its rural charm, low population density, and proximity to nature. While it’s not a hub of development, the availability of land and open space has attracted steady homebuilding interest over the years.
The impressive price gains between 2020 and 2022 suggest that Cole became a popular relocation spot during the early post-pandemic housing surge. Buyers likely sought larger lots and detached homes, pushing prices up rapidly. Though the pace has slowed in recent years, values remain elevated and are still climbing, albeit at a more modest rate. With a current median home value nearing $300K, Cole now rivals suburban markets in more developed regions of the state—making it one of Oklahoma’s pricier rural towns.
17. Choctaw – 83% Home Price Increase Since 2012
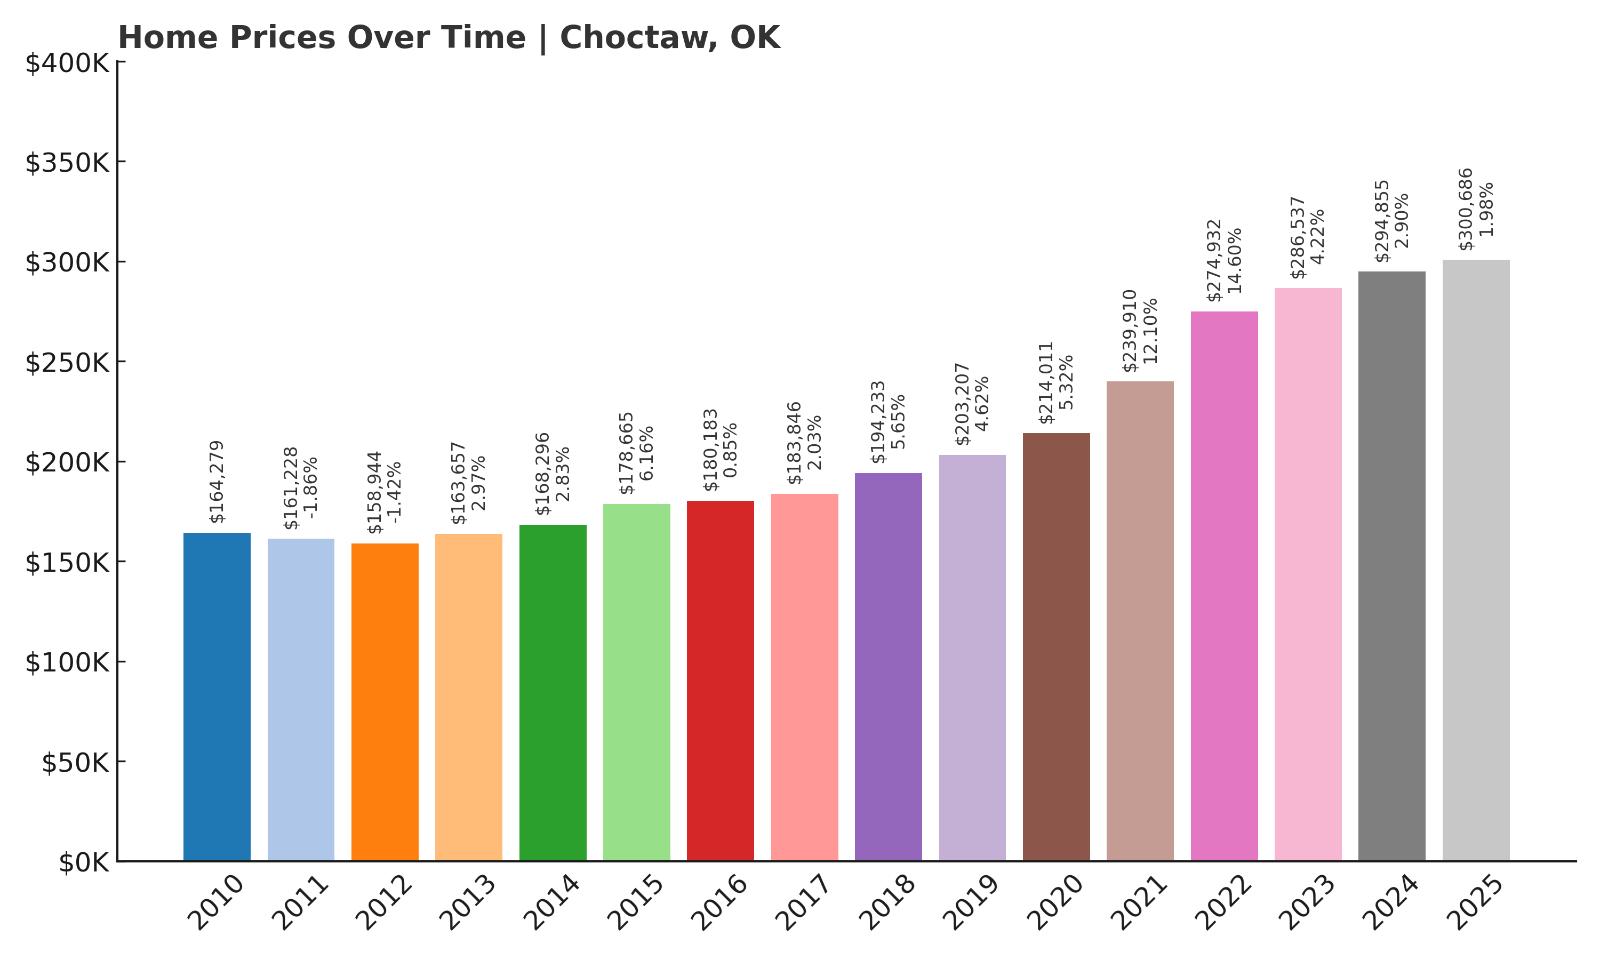
- 2010: $164,279
- 2011: $161,228 (-$3,051, -1.86% from previous year)
- 2012: $158,944 (-$2,284, -1.42% from previous year)
- 2013: $163,657 (+$4,714, +2.97% from previous year)
- 2014: $168,296 (+$4,639, +2.83% from previous year)
- 2015: $178,665 (+$10,369, +6.16% from previous year)
- 2016: $180,183 (+$1,517, +0.85% from previous year)
- 2017: $183,846 (+$3,664, +2.03% from previous year)
- 2018: $194,233 (+$10,386, +5.65% from previous year)
- 2019: $203,207 (+$8,974, +4.62% from previous year)
- 2020: $214,011 (+$10,804, +5.32% from previous year)
- 2021: $239,910 (+$25,899, +12.10% from previous year)
- 2022: $274,932 (+$35,022, +14.60% from previous year)
- 2023: $286,537 (+$11,605, +4.22% from previous year)
- 2024: $294,855 (+$8,319, +2.90% from previous year)
- 2025: $300,686 (+$5,831, +1.98% from previous year)
Choctaw’s home values have grown by roughly 83% since 2012, rising from $158K to just over $300K in 2025. Most of this growth occurred in the last decade, with an especially strong surge between 2020 and 2022. While earlier years saw more gradual increases, recent momentum shows buyers placing a premium on the town. The appreciation has remained positive every year since 2012, signaling consistent demand and resilience even through broader market fluctuations.
Choctaw – Steady Climb Fueled by Metro Proximity
Choctaw sits just east of Oklahoma City and has steadily evolved into a high-demand suburb thanks to its strong schools, family-oriented neighborhoods, and easy highway access. It’s one of the oldest chartered towns in the state, offering a rich history along with a tight-knit community vibe. As urban sprawl continues to stretch eastward, Choctaw benefits from being close enough to downtown while still offering quieter surroundings and larger home lots.
The impressive appreciation from 2020 to 2022 reflects increased migration into suburban spaces, especially during and after the pandemic. With new construction blending alongside older homes, Choctaw offers a range of housing types, which helped it attract a diverse range of buyers. Its continued price increases through 2025 suggest that demand remains strong, though future gains may be more modest. Still, with home values topping $300K, Choctaw now ranks among the pricier towns in Oklahoma’s eastern metro region.
16. Bennington – 252% Home Price Increase Since 2010
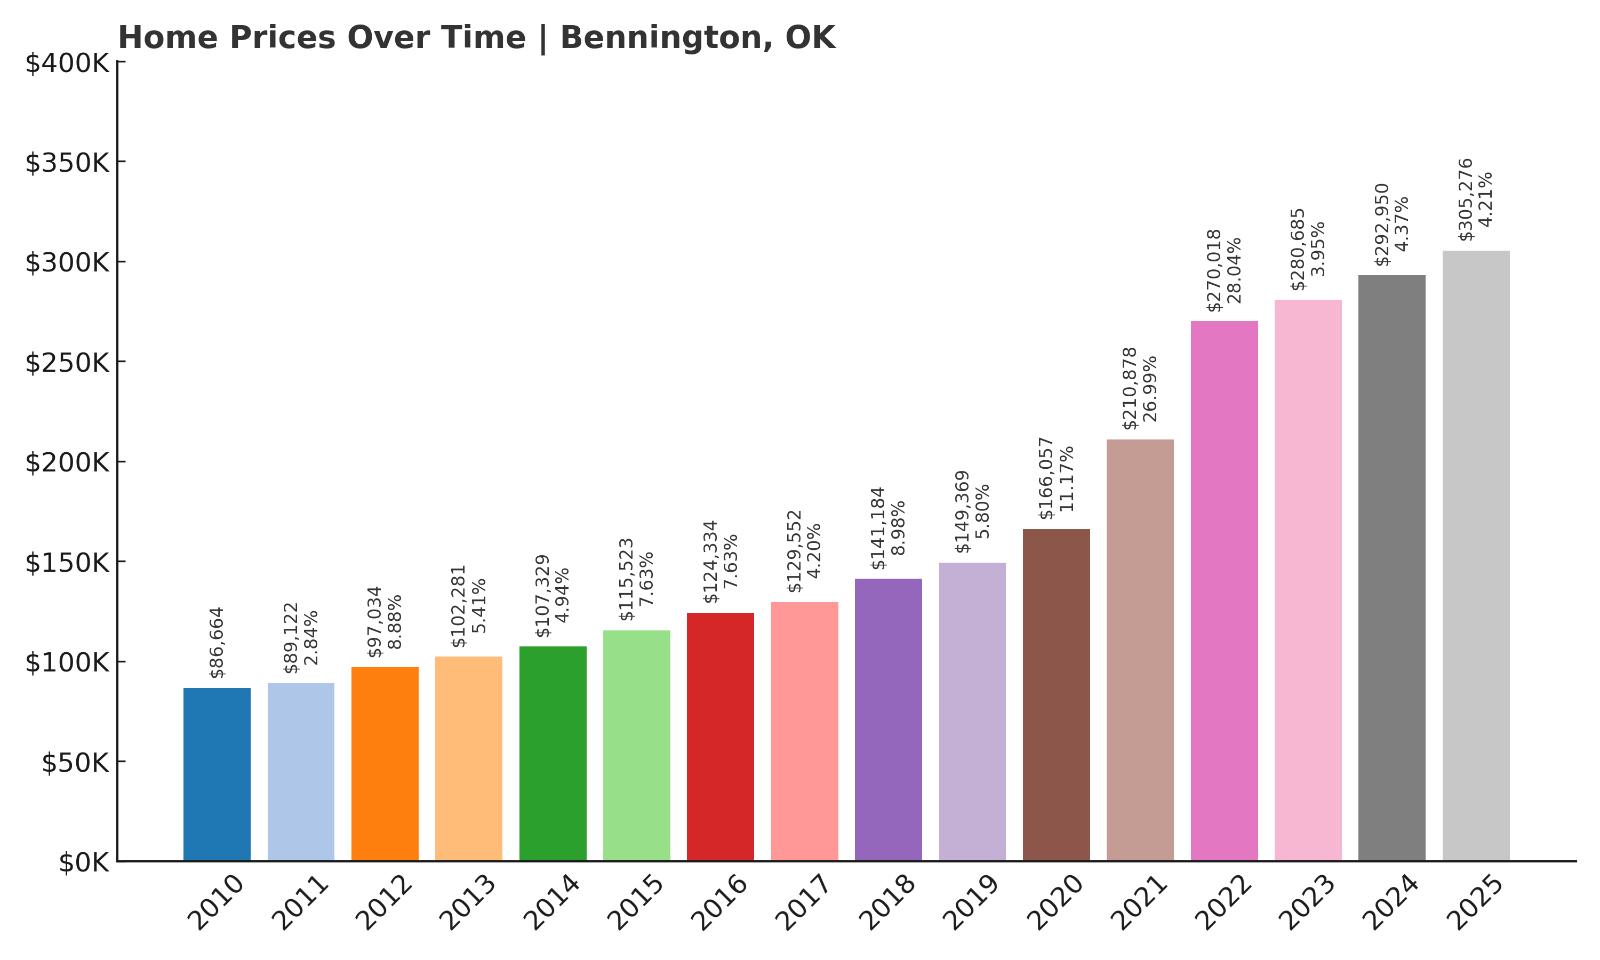
- 2010: $86,664
- 2011: $89,122 (+$2,457, +2.84% from previous year)
- 2012: $97,034 (+$7,913, +8.88% from previous year)
- 2013: $102,281 (+$5,247, +5.41% from previous year)
- 2014: $107,329 (+$5,048, +4.94% from previous year)
- 2015: $115,523 (+$8,194, +7.63% from previous year)
- 2016: $124,334 (+$8,810, +7.63% from previous year)
- 2017: $129,552 (+$5,218, +4.20% from previous year)
- 2018: $141,184 (+$11,633, +8.98% from previous year)
- 2019: $149,369 (+$8,185, +5.80% from previous year)
- 2020: $166,057 (+$16,688, +11.17% from previous year)
- 2021: $210,878 (+$44,821, +26.99% from previous year)
- 2022: $270,018 (+$59,140, +28.04% from previous year)
- 2023: $280,685 (+$10,666, +3.95% from previous year)
- 2024: $292,950 (+$12,266, +4.37% from previous year)
- 2025: $305,276 (+$12,326, +4.21% from previous year)
Bennington has seen explosive growth, with home prices tripling since 2010—from just $86K to more than $305K in 2025. The most significant gains came after 2020, including a 27% jump in 2021 and another 28% in 2022. That rapid acceleration outpaced many urban markets, highlighting how small towns have gained new appeal in recent years. While growth has slowed since 2023, prices continue to rise steadily year over year.
Bennington – Big Gains in a Small Town
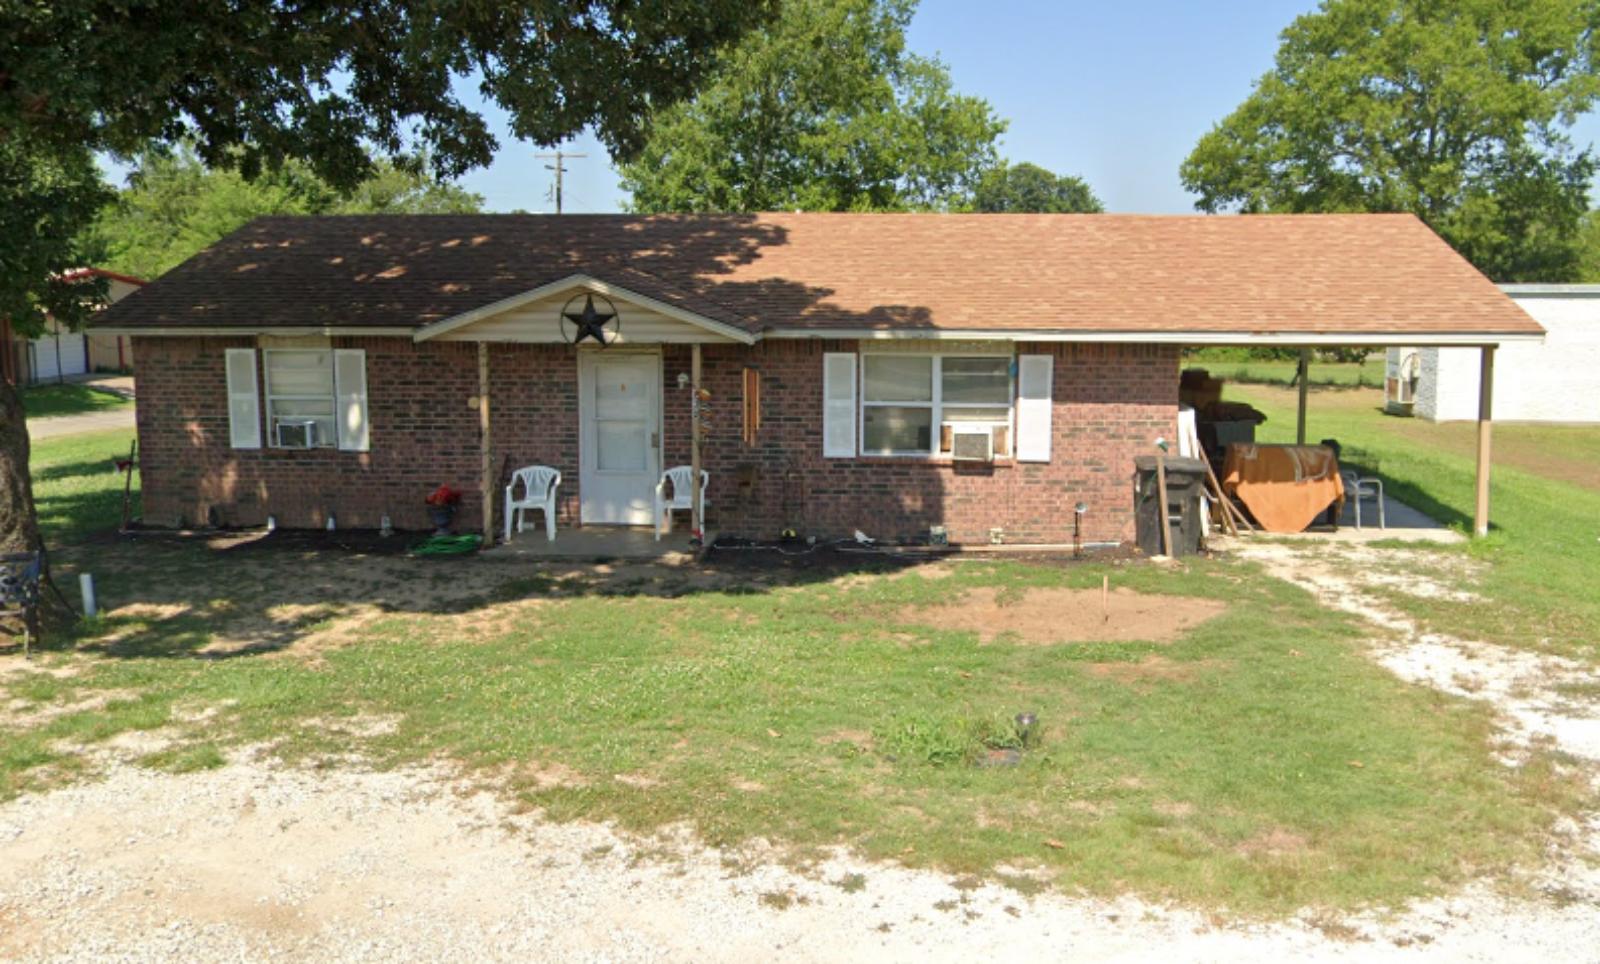
Bennington is a small southeastern Oklahoma town that’s flown under the radar until recently. Located in Bryan County, it offers a low-cost lifestyle in a rural setting but has caught the attention of homebuyers looking for affordable space and investment potential. Its proximity to Durant and easy access to Texas markets has likely helped fuel demand in recent years. The area is known for its open land, quiet pace of life, and increasing attractiveness for buyers priced out of larger metros.
The surge in prices from 2020 onward suggests a pandemic-era interest in rural and exurban homes, especially those that offered room to grow. In Bennington, the jump in values was so sharp it outpaced even some of the state’s most developed suburbs. Though appreciation has cooled, current values above $300K show just how much the market has shifted. Bennington is now among Oklahoma’s more expensive rural towns—a surprising transformation for a town once known for its affordability.
15. Owasso – 66.7% Home Price Increase Since 2012
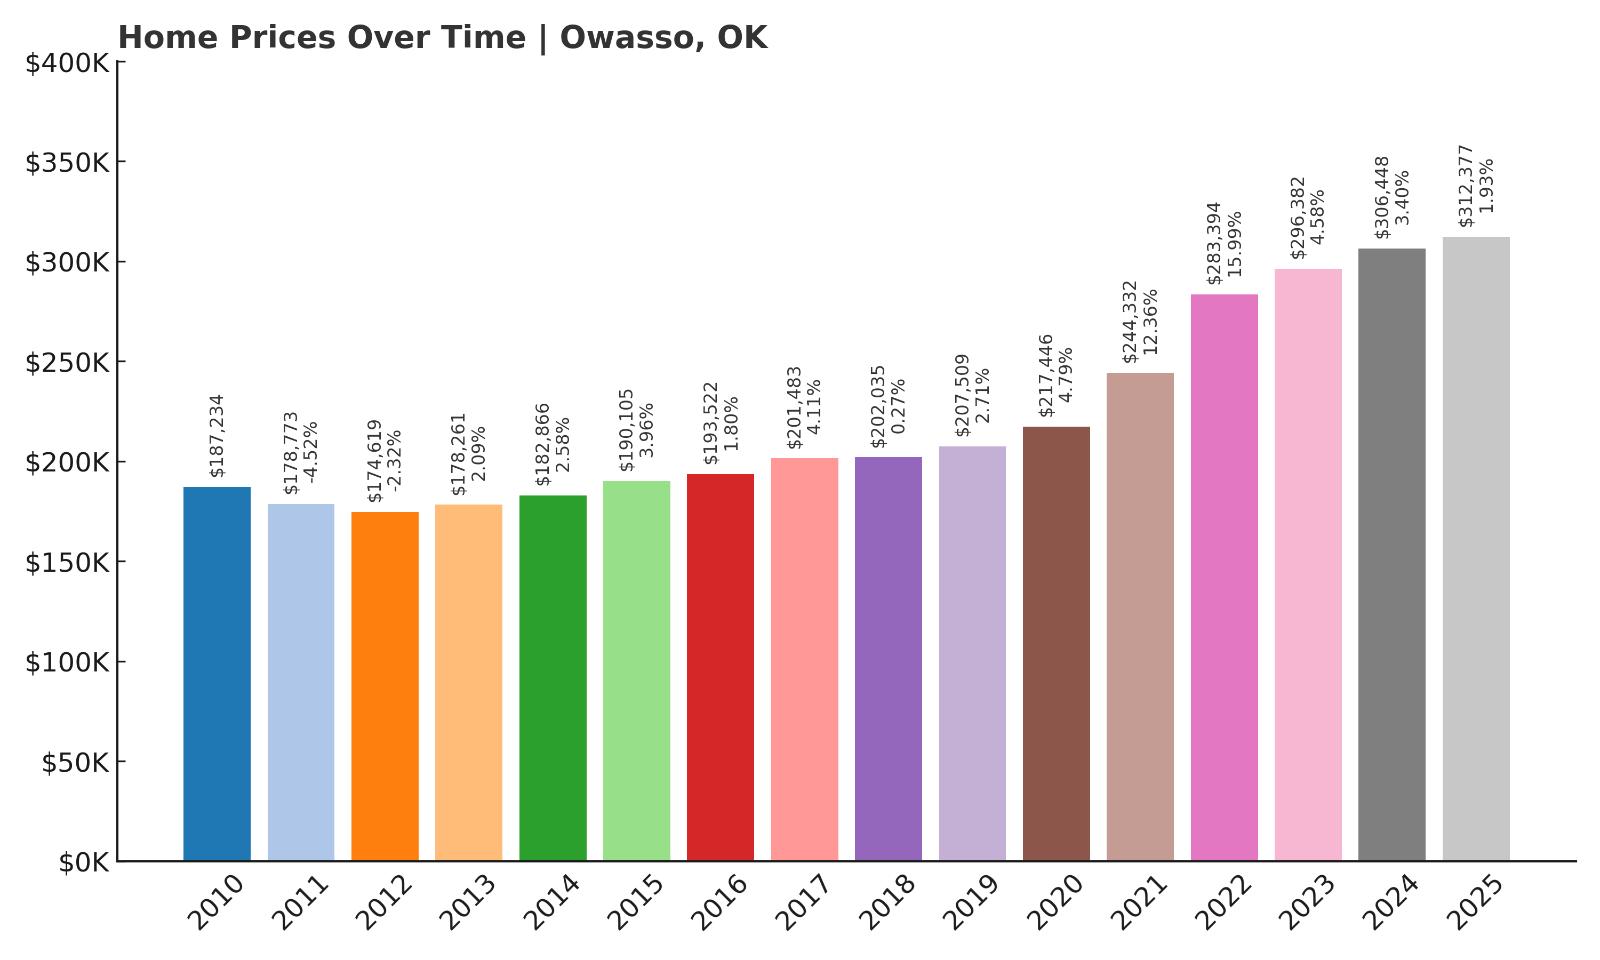
- 2010: $187,234
- 2011: $178,773 (-$8,462, -4.52% from previous year)
- 2012: $174,619 (-$4,154, -2.32% from previous year)
- 2013: $178,261 (+$3,642, +2.09% from previous year)
- 2014: $182,866 (+$4,606, +2.58% from previous year)
- 2015: $190,105 (+$7,239, +3.96% from previous year)
- 2016: $193,522 (+$3,417, +1.80% from previous year)
- 2017: $201,483 (+$7,962, +4.11% from previous year)
- 2018: $202,035 (+$551, +0.27% from previous year)
- 2019: $207,509 (+$5,474, +2.71% from previous year)
- 2020: $217,446 (+$9,937, +4.79% from previous year)
- 2021: $244,332 (+$26,886, +12.36% from previous year)
- 2022: $283,394 (+$39,062, +15.99% from previous year)
- 2023: $296,382 (+$12,988, +4.58% from previous year)
- 2024: $306,448 (+$10,066, +3.40% from previous year)
- 2025: $312,377 (+$5,929, +1.93% from previous year)
Since 2012, Owasso’s median home value has increased by over 66%, rising from $174K to more than $312K in 2025. Though the town experienced a slight decline in the early 2010s, growth picked up gradually and saw a sharp uptick starting in 2020. The most notable spike came in 2022, when home values jumped nearly 16% in a single year. Even though growth has slowed slightly since then, the continued year-over-year increases highlight a resilient housing market with sustained buyer interest.
Owasso – Family-Friendly Growth and Suburban Stability
Owasso, located just northeast of Tulsa, has grown into one of Oklahoma’s most desirable suburban cities. With a strong school system, modern infrastructure, and a range of shopping and dining options, the town appeals to both families and professionals. Its convenient location near major highways makes commuting into Tulsa simple, while still offering a quieter and more spacious lifestyle. This balance of access and amenities has made Owasso a consistent performer in Oklahoma’s real estate market, even during periods of economic uncertainty. The city has also benefited from investments in public amenities like parks, libraries, and recreational facilities that continue to raise its livability profile year after year.
What sets Owasso apart is the combination of established neighborhoods and newer residential developments, giving buyers choices across price points and architectural styles. As demand surged during the pandemic, Owasso was well-positioned to absorb growth thanks to available land and ongoing construction. The result was a sharp jump in prices, particularly between 2020 and 2022. Though newer listings in 2024 and 2025 have moderated in pricing, the continued appreciation—reaching over $312K—underscores the town’s long-term appeal. As one of the fastest-growing suburbs in the Tulsa area, Owasso’s trajectory shows no signs of reversing anytime soon.
14. Blanchard – 107% Home Price Increase Since 2011
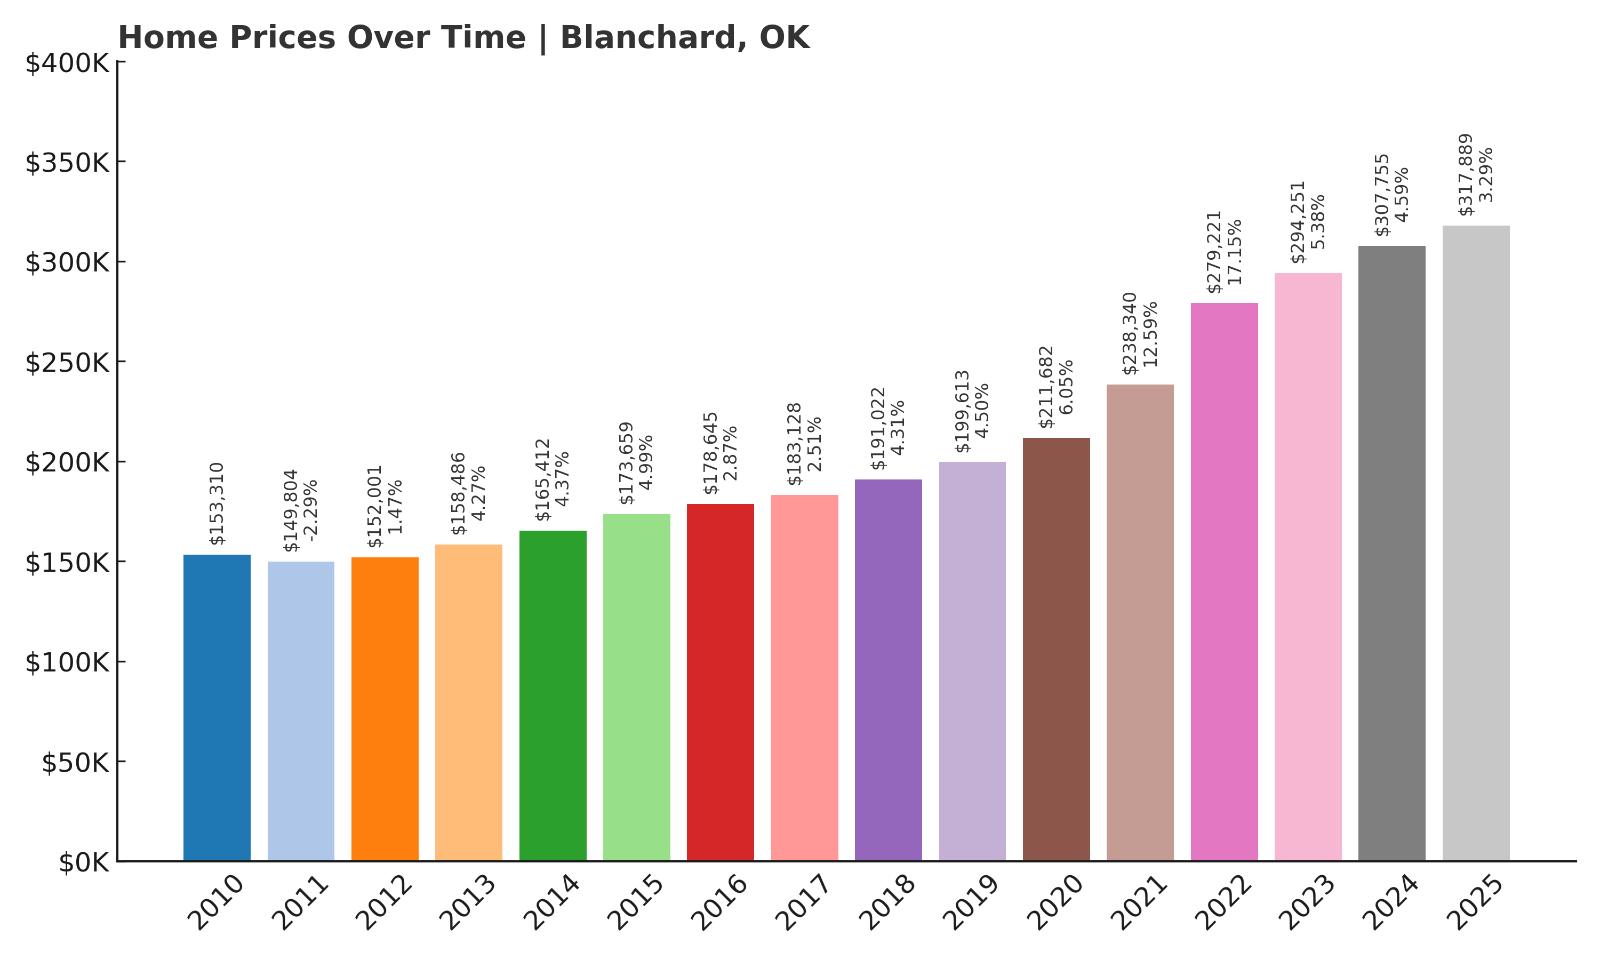
- 2010: $153,310
- 2011: $149,804 (-$3,507, -2.29% from previous year)
- 2012: $152,001 (+$2,197, +1.47% from previous year)
- 2013: $158,486 (+$6,485, +4.27% from previous year)
- 2014: $165,412 (+$6,926, +4.37% from previous year)
- 2015: $173,659 (+$8,247, +4.99% from previous year)
- 2016: $178,645 (+$4,985, +2.87% from previous year)
- 2017: $183,128 (+$4,483, +2.51% from previous year)
- 2018: $191,022 (+$7,894, +4.31% from previous year)
- 2019: $199,613 (+$8,591, +4.50% from previous year)
- 2020: $211,682 (+$12,069, +6.05% from previous year)
- 2021: $238,340 (+$26,658, +12.59% from previous year)
- 2022: $279,221 (+$40,881, +17.15% from previous year)
- 2023: $294,251 (+$15,029, +5.38% from previous year)
- 2024: $307,755 (+$13,505, +4.59% from previous year)
- 2025: $317,889 (+$10,134, +3.29% from previous year)
Blanchard’s home prices have more than doubled since 2011, increasing from around $150K to nearly $318K in 2025. Though price growth was modest in the early 2010s, it picked up significantly after 2020. The town saw double-digit increases in both 2021 and 2022, indicating a major shift in market activity. Even as growth began to moderate in 2023 and beyond, Blanchard has continued to see consistent upward momentum, placing it firmly among Oklahoma’s higher-priced communities.
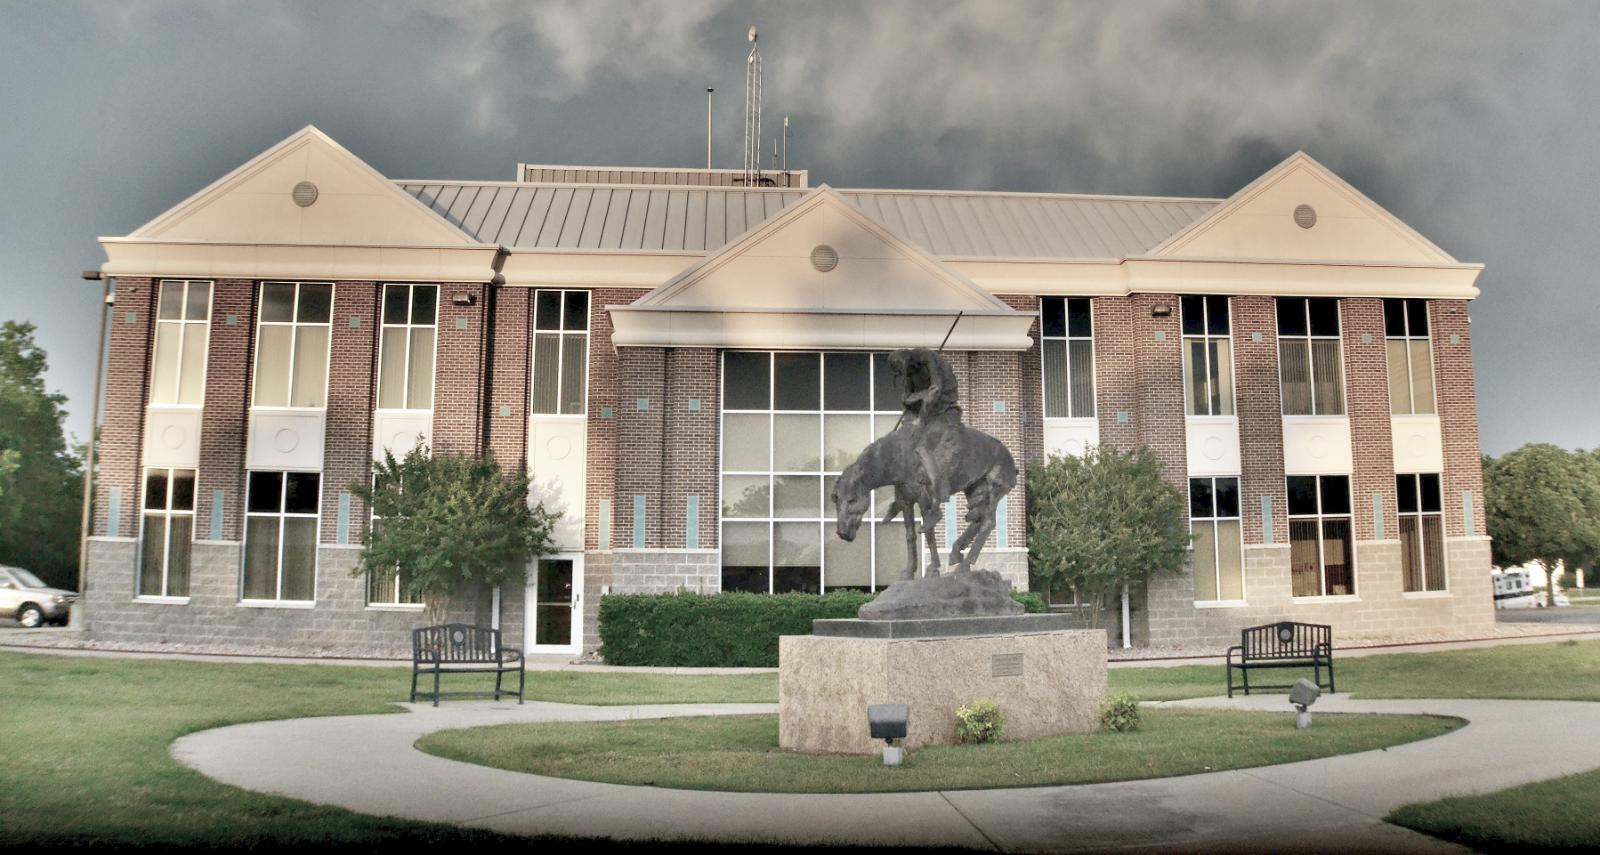
Blanchard – Quiet Appeal with Surging Demand
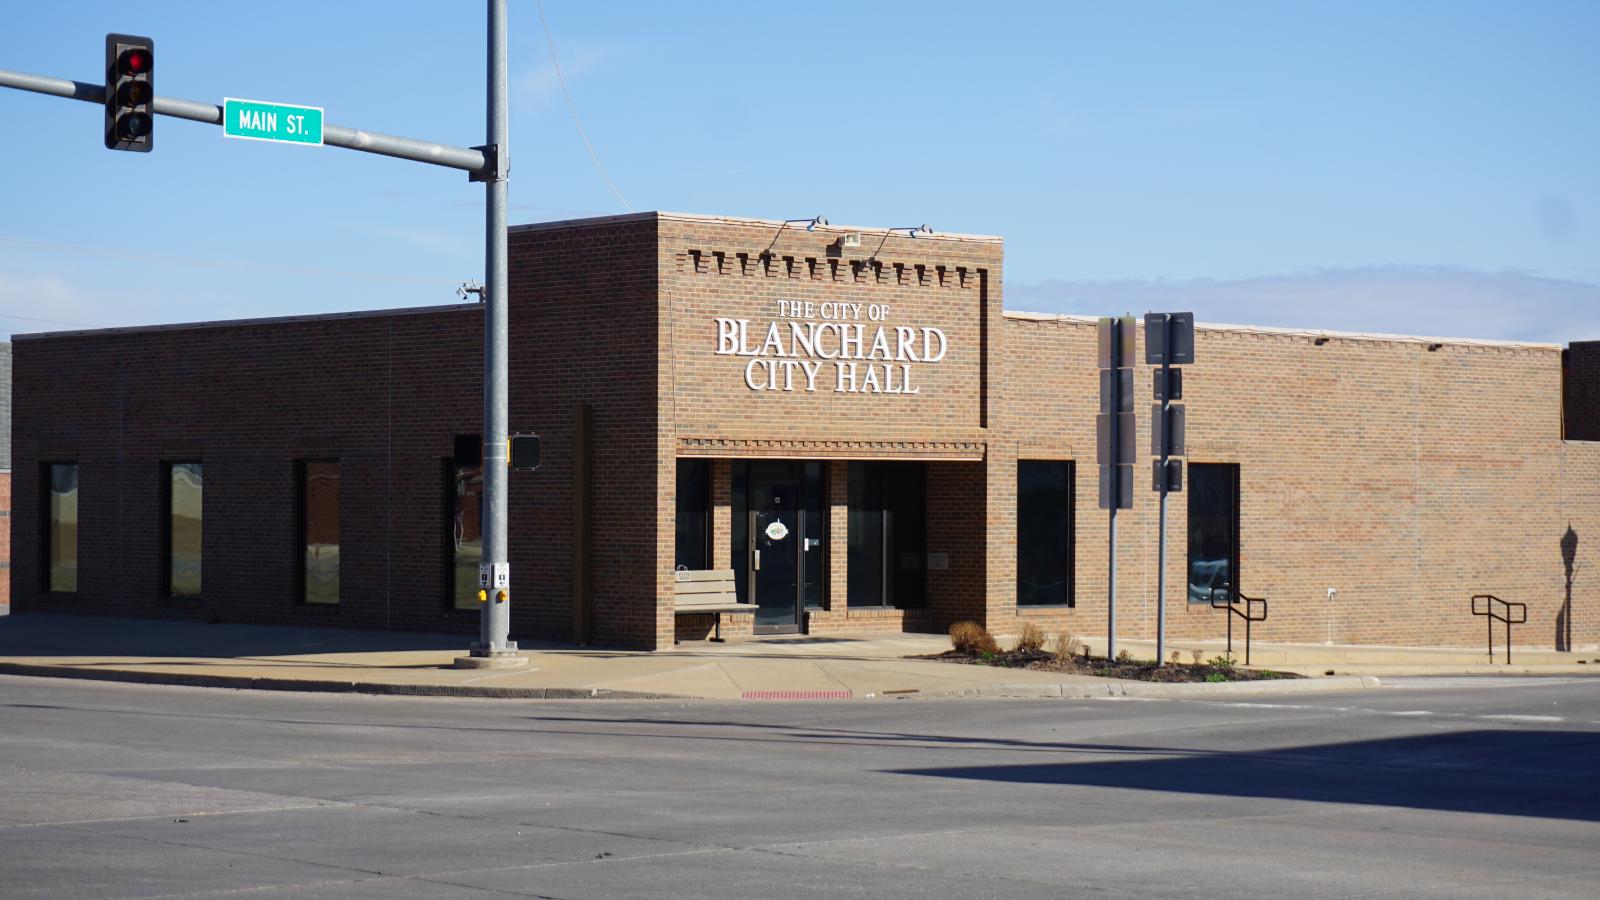
Situated southwest of Oklahoma City, Blanchard has transformed from a sleepy rural community into a competitive housing market. It offers the benefits of small-town life—less congestion, larger yards, and tight-knit neighborhoods—without sacrificing access to urban conveniences. The town has made significant infrastructure improvements in recent years, including school expansions, road upgrades, and community development initiatives. These improvements have enhanced quality of life and positioned Blanchard as a desirable alternative to more crowded suburban areas. The town also benefits from its location along major commuter routes, making it an appealing option for those working in Oklahoma City but seeking a quieter place to call home.
The real estate surge in Blanchard coincided with broader post-pandemic shifts in buyer preferences. As remote work grew more common, buyers looked beyond traditional suburban boundaries, and towns like Blanchard stood out for offering more space and affordability. The town’s nearly 17% price jump in 2022 marked a watershed moment, signaling newfound demand. Even as appreciation slows, Blanchard continues to post solid gains year after year. With current values over $317K, the town now competes price-wise with many of Oklahoma’s wealthier suburbs—yet still maintains its rural charm. Looking ahead, its balanced mix of growth, location, and livability make it a continued standout in the state housing market.
13. Tuttle – 101.5% Home Price Increase Since 2012
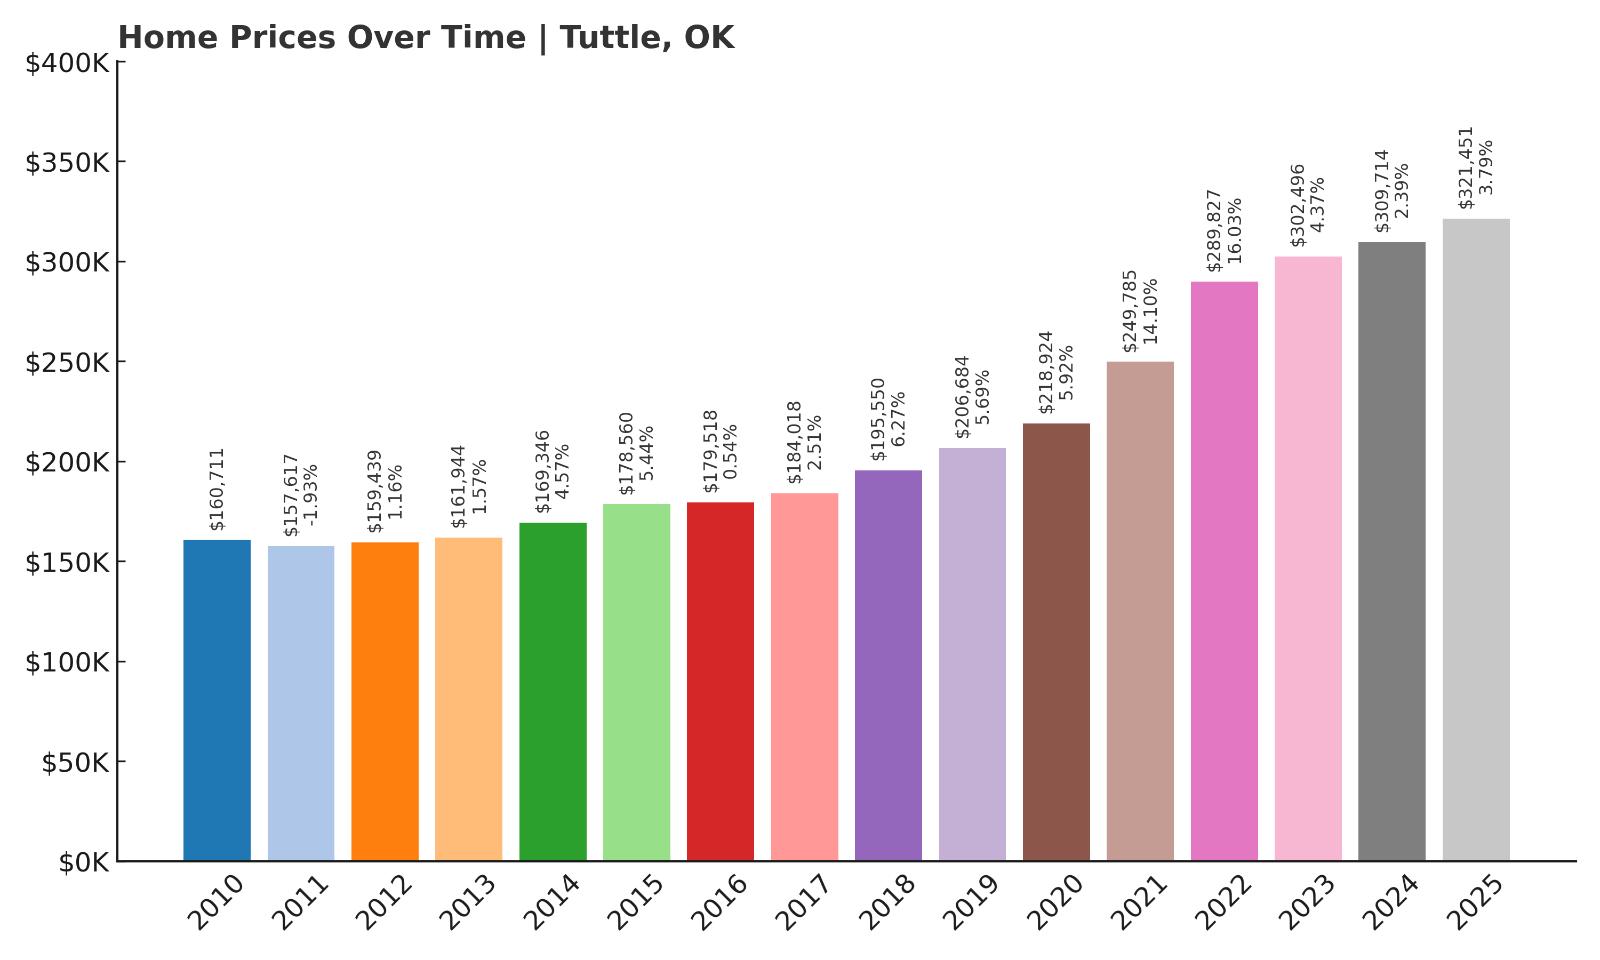
- 2010: $160,711
- 2011: $157,617 (-$3,094, -1.93% from previous year)
- 2012: $159,439 (+$1,822, +1.16% from previous year)
- 2013: $161,944 (+$2,505, +1.57% from previous year)
- 2014: $169,346 (+$7,402, +4.57% from previous year)
- 2015: $178,560 (+$9,214, +5.44% from previous year)
- 2016: $179,518 (+$957, +0.54% from previous year)
- 2017: $184,018 (+$4,500, +2.51% from previous year)
- 2018: $195,550 (+$11,532, +6.27% from previous year)
- 2019: $206,684 (+$11,134, +5.69% from previous year)
- 2020: $218,924 (+$12,241, +5.92% from previous year)
- 2021: $249,785 (+$30,861, +14.10% from previous year)
- 2022: $289,827 (+$40,041, +16.03% from previous year)
- 2023: $302,496 (+$12,670, +4.37% from previous year)
- 2024: $309,714 (+$7,217, +2.39% from previous year)
- 2025: $321,451 (+$11,737, +3.79% from previous year)
Tuttle’s home prices have risen sharply since 2012, more than doubling in that time from $159K to over $321K in 2025. Much of the town’s growth has taken place in the last five years, especially between 2020 and 2022 when prices spiked by more than 30% combined. While earlier growth was moderate and consistent, recent years reflect accelerated demand. Though the rate of increase has eased slightly, the town continues to see healthy appreciation and has firmly entered Oklahoma’s list of top-tier housing markets.
Tuttle – Rapid Growth in the Last 5 Years
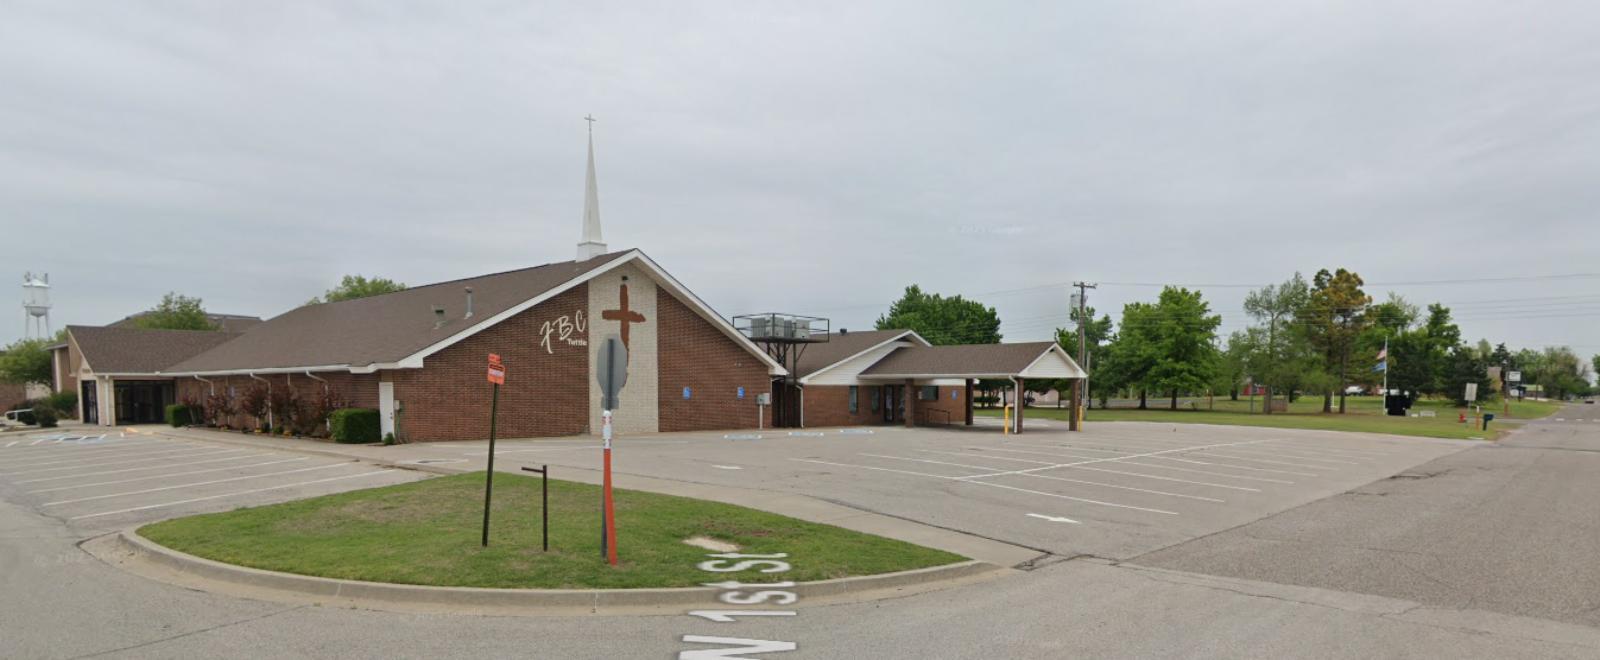
Tuttle, located southwest of the Oklahoma City metro area, has evolved from an agricultural outpost into a fast-growing residential town. Its strong school system, open land, and local services have made it an appealing option for families seeking suburban comfort with a rural feel. The town’s accessibility via State Highway 37 gives residents easy routes into OKC, while still enjoying the benefits of low congestion and a slower pace. Over the last decade, Tuttle has seen a wave of residential development, particularly from buyers seeking homes on larger lots. This suburban-rural balance is a key driver of demand, and it’s reflected in the steady rise in home prices across nearly every year since 2012.
The housing boom in Tuttle became especially pronounced after 2020, when remote work and changing lifestyle priorities led more people to seek out towns with more space. In 2021 and 2022 alone, values rose over 30%, placing the town firmly in the conversation with Oklahoma’s more established suburban markets. While prices are now climbing at a steadier pace, the value gains have held—pointing to durable demand. At over $321K, median prices in Tuttle now rival those in larger nearby cities, which signals growing interest from homebuyers looking for both space and long-term value. As infrastructure and local amenities continue to improve, Tuttle is likely to remain a sought-after destination in central Oklahoma’s real estate landscape.
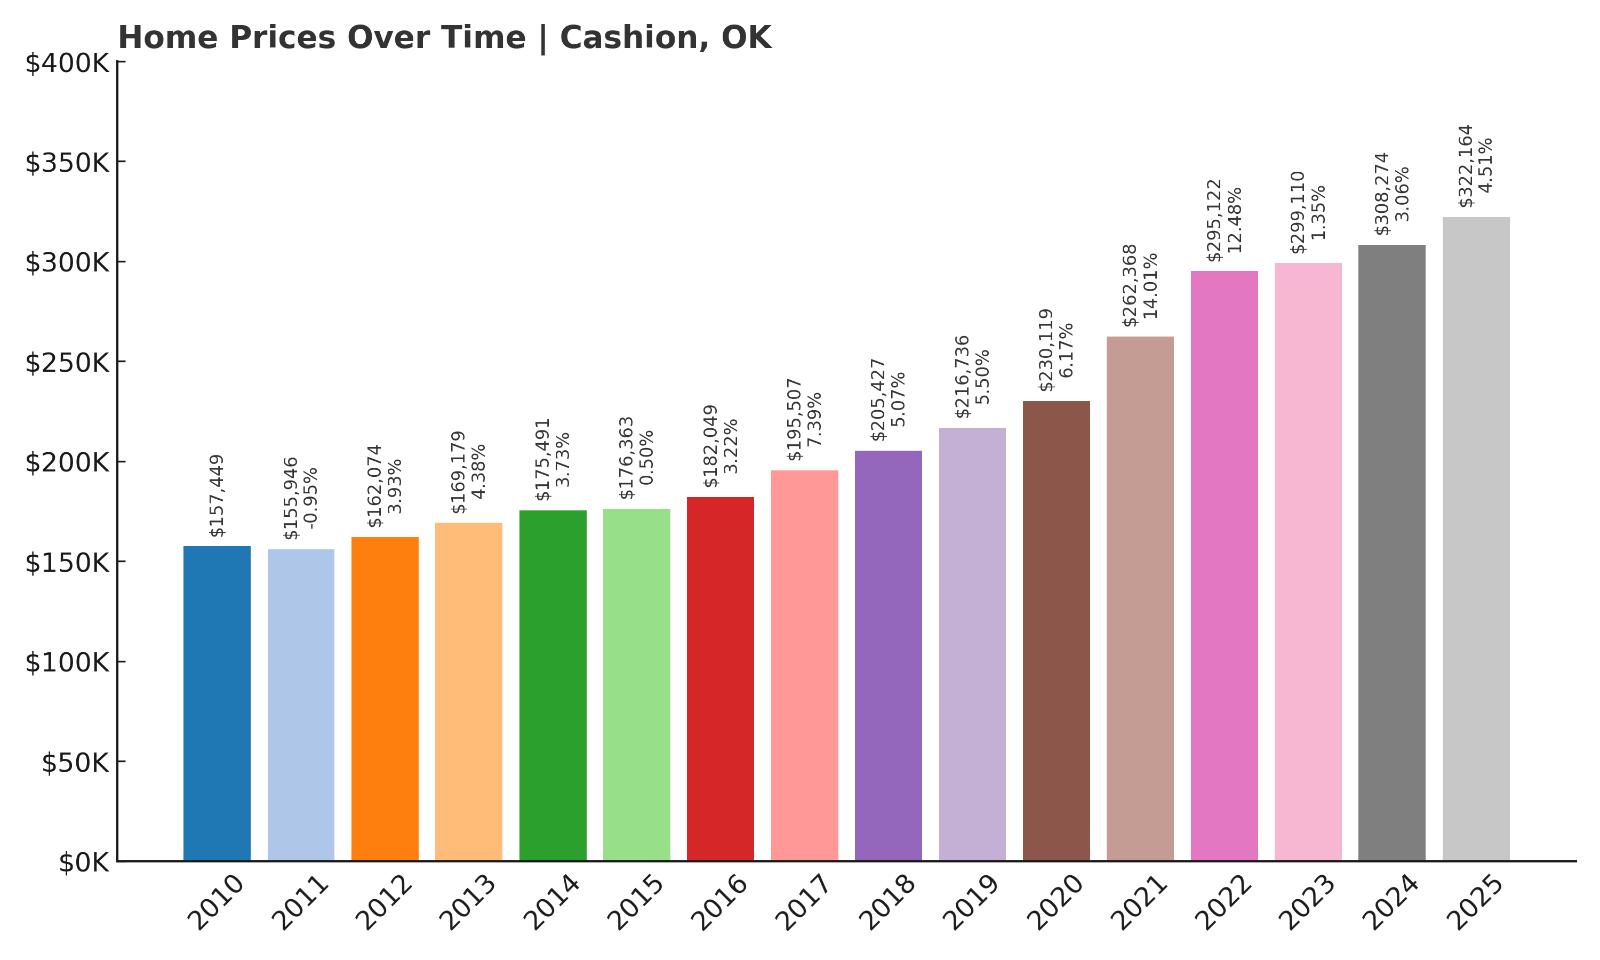
12. Cashion – 99.2% Home Price Increase Since 2012
🔥 Would you like to save this?
- 2010: $157,449
- 2011: $155,946 (-$1,504, -0.95% from previous year)
- 2012: $162,074 (+$6,128, +3.93% from previous year)
- 2013: $169,179 (+$7,105, +4.38% from previous year)
- 2014: $175,491 (+$6,312, +3.73% from previous year)
- 2015: $176,363 (+$872, +0.50% from previous year)
- 2016: $182,049 (+$5,686, +3.22% from previous year)
- 2017: $195,507 (+$13,458, +7.39% from previous year)
- 2018: $205,427 (+$9,920, +5.07% from previous year)
- 2019: $216,736 (+$11,308, +5.50% from previous year)
- 2020: $230,119 (+$13,383, +6.17% from previous year)
- 2021: $262,368 (+$32,249, +14.01% from previous year)
- 2022: $295,122 (+$32,754, +12.48% from previous year)
- 2023: $299,110 (+$3,987, +1.35% from previous year)
- 2024: $308,274 (+$9,164, +3.06% from previous year)
- 2025: $322,164 (+$13,890, +4.51% from previous year)
Cashion’s home prices have climbed nearly 100% since 2012, from just over $162K to more than $322K by 2025. For a small town, this level of appreciation is significant. The strongest gains occurred between 2020 and 2022, with back-to-back double-digit increases driven by surging demand. Even with a brief slowdown in 2023, price growth resumed in 2024 and 2025. The consistent increases show that Cashion remains a stable and attractive market despite broader economic fluctuations.
Cashion – Rural Roots with Big Appreciation
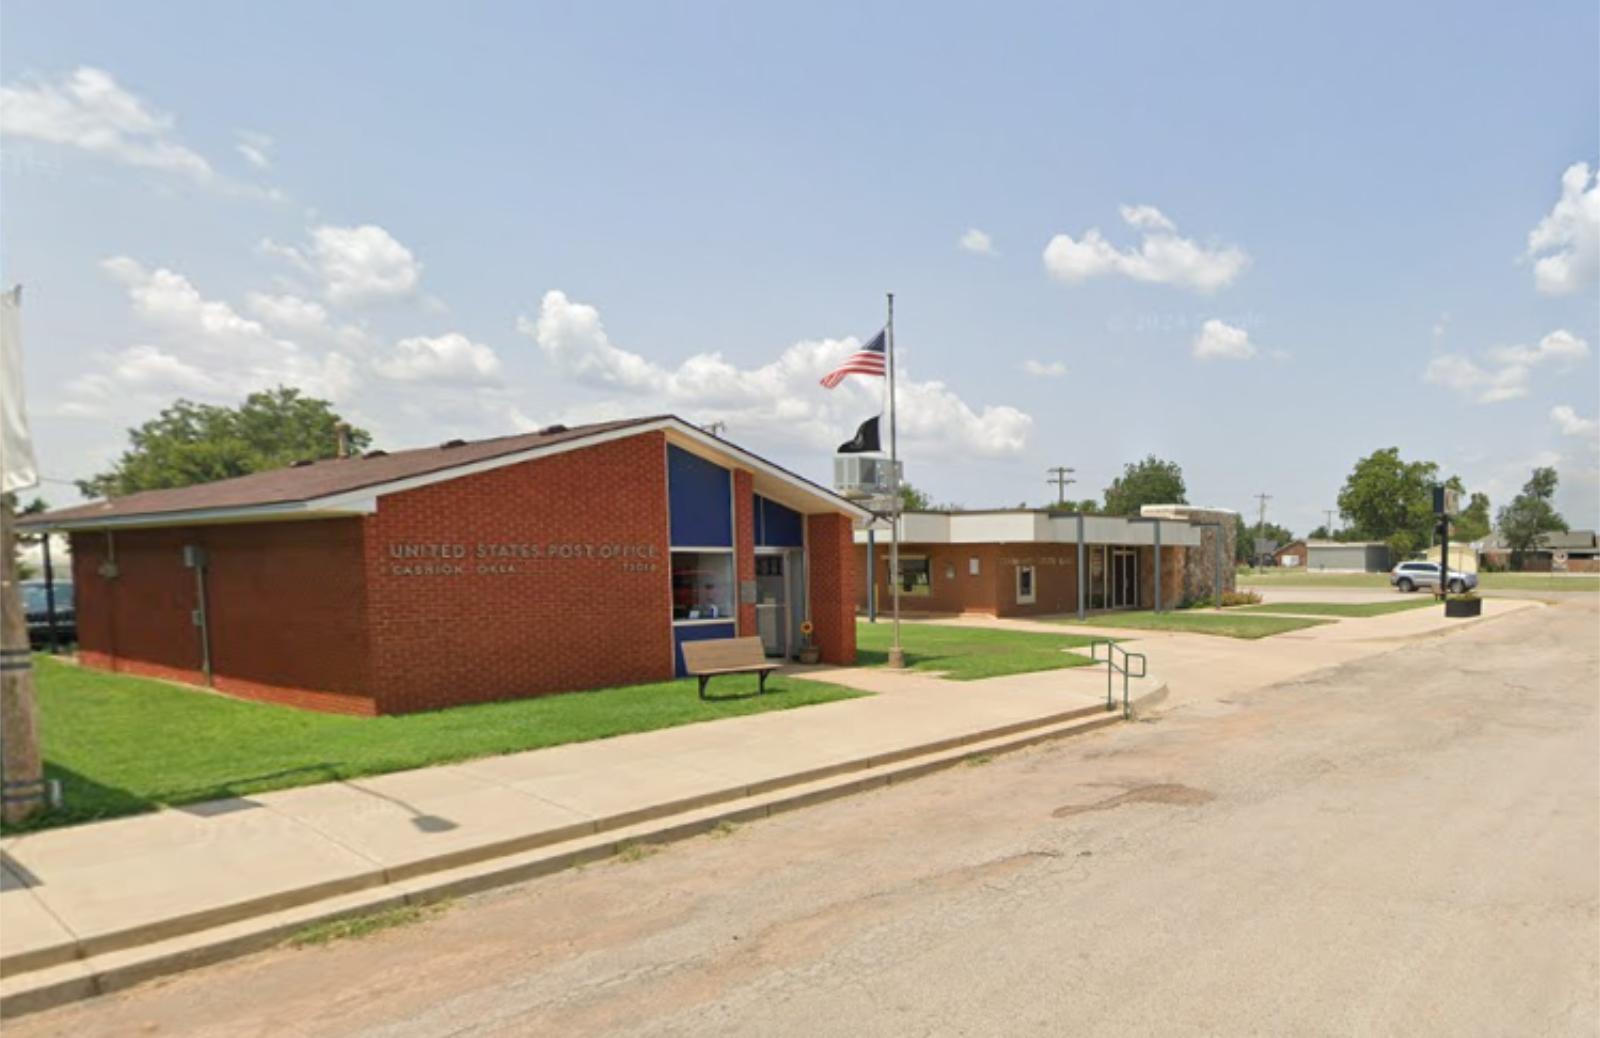
Cashion may be small, but it has proven itself to be one of the more resilient and high-performing markets in central Oklahoma. Located northwest of Oklahoma City, the town straddles Kingfisher and Logan counties and offers a classic small-town feel with easy access to metro amenities. Known for its strong sense of community, solid public schools, and proximity to farming and ranching communities, Cashion has long attracted residents seeking affordability without sacrificing quality of life. Over the past decade, it has also caught the eye of families and professionals seeking lower-cost housing options just outside the OKC commute zone.
Recent price increases have been especially strong, with values rising over 25% in just two years between 2020 and 2022. That momentum reflects broader statewide trends but is particularly notable for a rural town of Cashion’s size. Limited housing supply, coupled with increasing demand for homes in quiet, spacious environments, helped drive the surge. With prices now exceeding $322K, Cashion is no longer just a budget-friendly rural option—it’s among the pricier markets in its region. Its continued upward trajectory suggests that buyers still see long-term value here, even after the initial boom has cooled.
11. Bixby – 66.5% Home Price Increase Since 2012
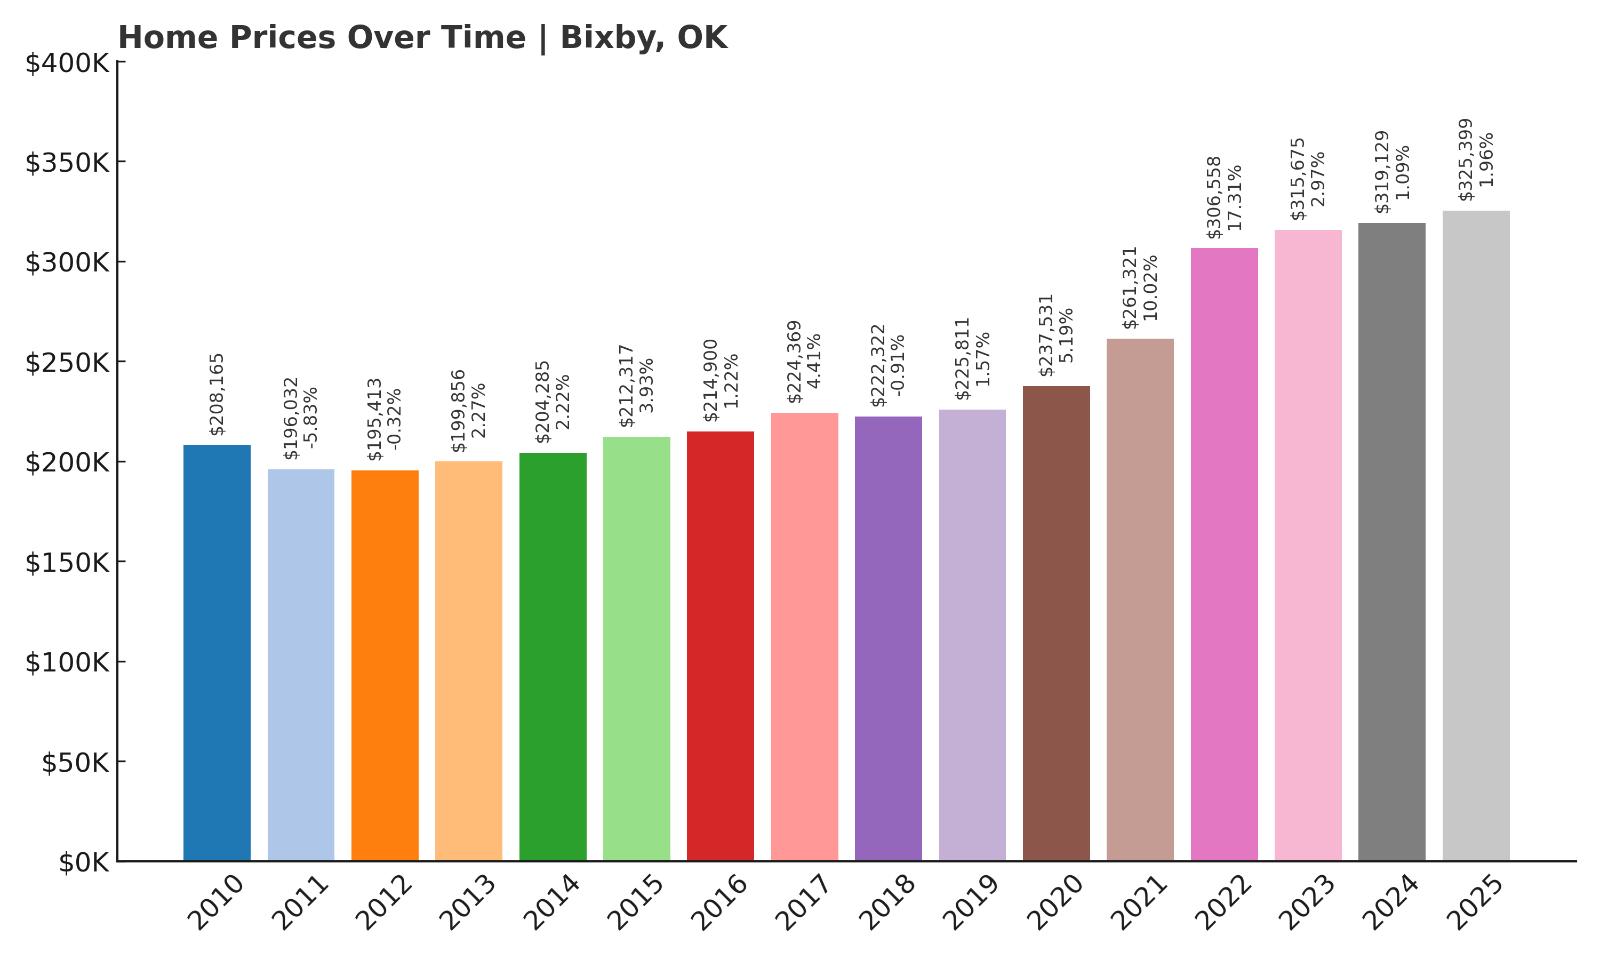
- 2010: $208,165
- 2011: $196,032 (-$12,132, -5.83% from previous year)
- 2012: $195,413 (-$620, -0.32% from previous year)
- 2013: $199,856 (+$4,444, +2.27% from previous year)
- 2014: $204,285 (+$4,429, +2.22% from previous year)
- 2015: $212,317 (+$8,032, +3.93% from previous year)
- 2016: $214,900 (+$2,583, +1.22% from previous year)
- 2017: $224,369 (+$9,468, +4.41% from previous year)
- 2018: $222,322 (-$2,047, -0.91% from previous year)
- 2019: $225,811 (+$3,489, +1.57% from previous year)
- 2020: $237,531 (+$11,720, +5.19% from previous year)
- 2021: $261,321 (+$23,790, +10.02% from previous year)
- 2022: $306,558 (+$45,238, +17.31% from previous year)
- 2023: $315,675 (+$9,117, +2.97% from previous year)
- 2024: $319,129 (+$3,454, +1.09% from previous year)
- 2025: $325,399 (+$6,270, +1.96% from previous year)
Home prices in Bixby have grown by 66.5% since 2012, moving from just under $196K to $325K in 2025. The town experienced its sharpest surge between 2020 and 2022, with back-to-back annual increases of over 10% and 17%, respectively. Even though gains have moderated in the last few years, prices continue to trend upward. Bixby’s long-term appreciation reflects its growing role as a high-demand suburb in the Tulsa metro area.
Bixby – Tulsa Suburb With Rising Appeal
Bixby, located south of Tulsa along the Arkansas River, is known for its top-rated schools, well-planned neighborhoods, and strong sense of community. It has been one of the fastest-growing suburbs in Oklahoma over the last two decades. Thanks to large residential developments, proximity to major employers, and an abundance of recreational amenities, Bixby appeals to both young families and professionals. The area features a mix of new subdivisions, established neighborhoods, and luxury housing—each contributing to sustained buyer interest. With ongoing infrastructure investment, including improvements in transportation and retail corridors, Bixby continues to solidify its place among Oklahoma’s premier suburban markets.
The post-2020 housing boom brought a surge in buyers seeking space and quality schools, and Bixby was ready. It saw one of the largest single-year jumps in the state in 2022, with home prices rising over 17%. That surge pushed median values past $300K and into the upper tier of Oklahoma’s market. Even though more recent years have seen lower gains, demand remains strong and prices are still rising. The current median value of $325K positions Bixby among the state’s most desirable—and most expensive—metro-area towns. If infrastructure keeps pace with growth, Bixby is likely to remain a top contender in Oklahoma real estate.
10. Piedmont – 93.3% Home Price Increase Since 2012
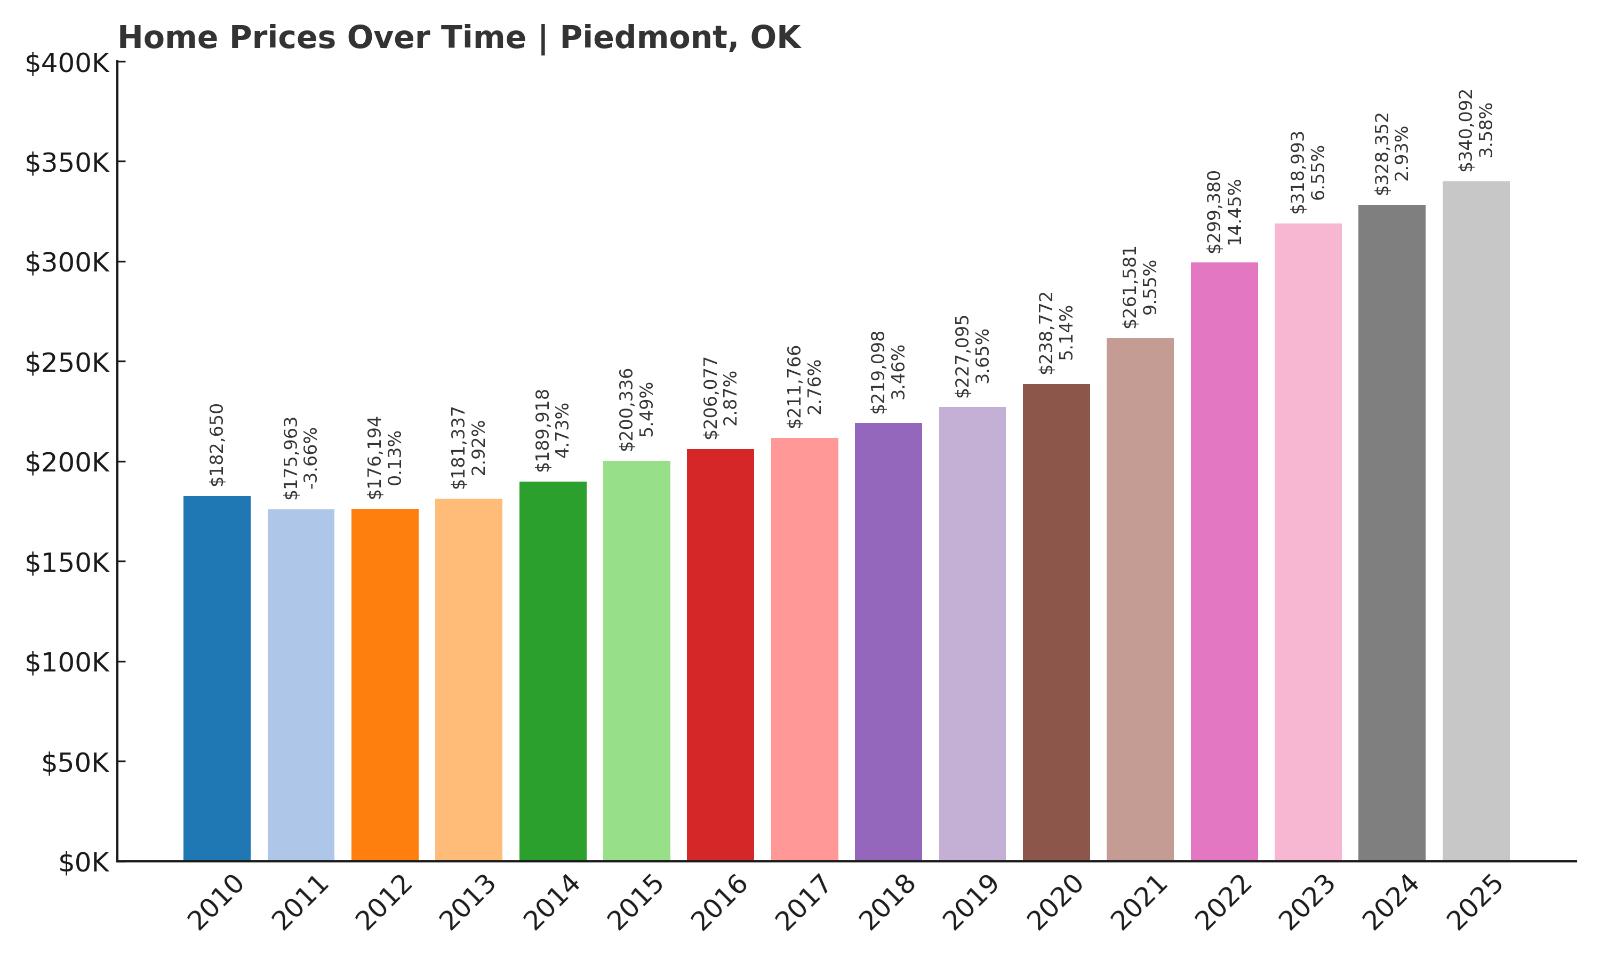
- 2010: $182,650
- 2011: $175,963 (-$6,686, -3.66% from previous year)
- 2012: $176,194 (+$230, +0.13% from previous year)
- 2013: $181,337 (+$5,143, +2.92% from previous year)
- 2014: $189,918 (+$8,581, +4.73% from previous year)
- 2015: $200,336 (+$10,419, +5.49% from previous year)
- 2016: $206,077 (+$5,740, +2.87% from previous year)
- 2017: $211,766 (+$5,689, +2.76% from previous year)
- 2018: $219,098 (+$7,332, +3.46% from previous year)
- 2019: $227,095 (+$7,997, +3.65% from previous year)
- 2020: $238,772 (+$11,677, +5.14% from previous year)
- 2021: $261,581 (+$22,809, +9.55% from previous year)
- 2022: $299,380 (+$37,799, +14.45% from previous year)
- 2023: $318,993 (+$19,613, +6.55% from previous year)
- 2024: $328,352 (+$9,359, +2.93% from previous year)
- 2025: $340,092 (+$11,740, +3.58% from previous year)
Piedmont has seen an impressive 93.3% rise in home prices since 2012, growing from $176K to over $340K in 2025. The most significant growth occurred between 2020 and 2022, when prices jumped by more than $60K in just two years. While the pace has moderated somewhat in recent years, the town continues to experience strong year-over-year appreciation. The sustained growth reflects both heightened demand and Piedmont’s rising reputation as a top suburban choice near Oklahoma City.
Piedmont – Upscale Suburb with Expanding Appeal
Piedmont, located northwest of Oklahoma City, has long attracted families looking for a suburban lifestyle with excellent schools and newer housing options. Its rapid development in recent years has brought modern subdivisions, well-rated public schools, and expanded commercial amenities—all of which contribute to rising home values. The town blends a clean suburban layout with access to rural landscapes, giving it a broad appeal for those who want both space and community infrastructure. As new housing developments continue to rise, Piedmont has emerged as a go-to destination for those relocating from more congested areas of the metro region.
Growth in Piedmont has been particularly strong since the COVID-19 pandemic, as buyers prioritized more space, lower population density, and homes in well-planned communities. The combination of high demand and relatively low inventory drove sharp increases in home values, especially during 2021 and 2022. Even now, with the pace of appreciation slowing, the town continues to post healthy annual gains. With median prices surpassing $340K in 2025, Piedmont is now one of the most expensive towns in central Oklahoma. Its balance of family-friendly living, expanding infrastructure, and accessible location will likely keep demand high in the years to come.
9. Broken Bow – 149% Home Price Increase Since 2010
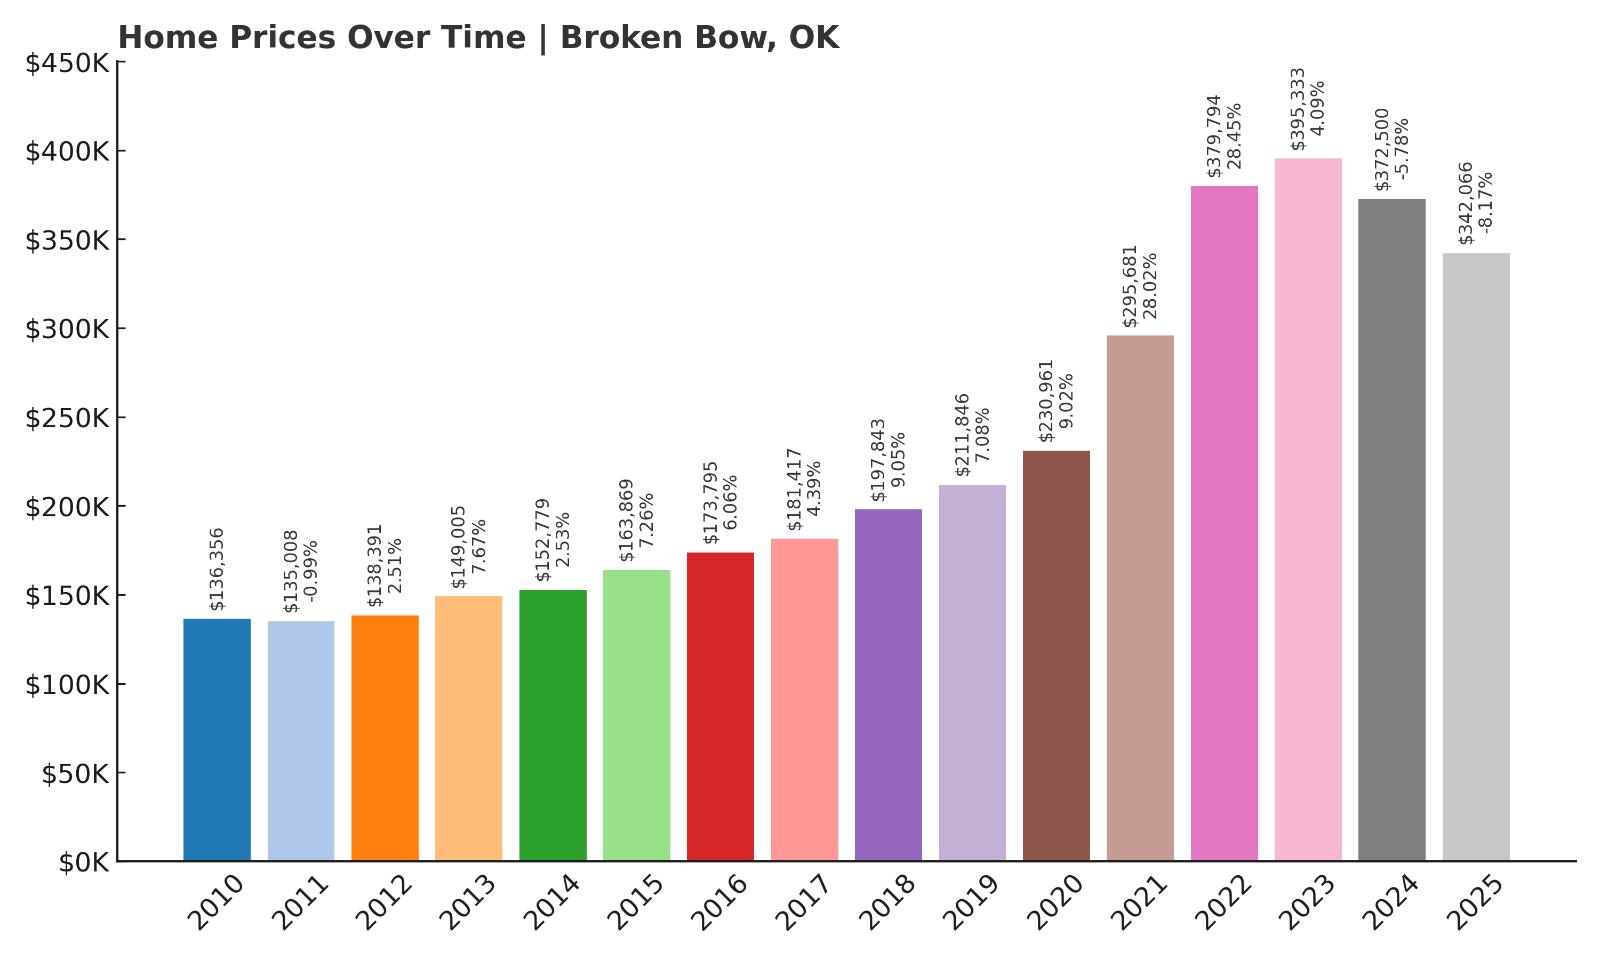
- 2010: $136,356
- 2011: $135,008 (-$1,348, -0.99% from previous year)
- 2012: $138,391 (+$3,383, +2.51% from previous year)
- 2013: $149,005 (+$10,614, +7.67% from previous year)
- 2014: $152,779 (+$3,774, +2.53% from previous year)
- 2015: $163,869 (+$11,090, +7.26% from previous year)
- 2016: $173,795 (+$9,926, +6.06% from previous year)
- 2017: $181,417 (+$7,622, +4.39% from previous year)
- 2018: $197,843 (+$16,426, +9.05% from previous year)
- 2019: $211,846 (+$14,003, +7.08% from previous year)
- 2020: $230,961 (+$19,115, +9.02% from previous year)
- 2021: $295,681 (+$64,720, +28.02% from previous year)
- 2022: $379,794 (+$84,113, +28.45% from previous year)
- 2023: $395,333 (+$15,539, +4.09% from previous year)
- 2024: $372,500 (-$22,833, -5.78% from previous year)
- 2025: $342,066 (-$30,434, -8.17% from previous year)
Broken Bow has experienced a remarkable 149% increase in home prices since 2010, peaking at nearly $396K in 2023 before cooling to $342K in 2025. The town’s real estate market took off after 2020, with back-to-back jumps of over 28% in 2021 and 2022. However, after this explosive growth, prices have declined for two consecutive years. Despite the recent dip, Broken Bow remains one of Oklahoma’s most expensive housing markets due to its earlier gains and sustained interest in the area.
Broken Bow – From Vacation Town to Real Estate Hotspot
Located in southeastern Oklahoma, Broken Bow has become a regional tourism magnet thanks to nearby Broken Bow Lake, Beavers Bend State Park, and the surrounding Ouachita Mountains. What was once a quiet timber town has transformed into a bustling vacation and cabin rental destination. That shift has fueled tremendous growth in the local real estate market, as investors and second-home buyers poured in to capitalize on tourism demand. The post-2020 boom saw buyers flocking to scenic, remote areas, and Broken Bow fit the bill perfectly. As a result, values shot up by over 60% in just two years—one of the steepest rises in the state.
While recent years have brought a price correction, that decline comes after a sustained period of hypergrowth. The town’s 2025 median price of $342K is still more than double its 2010 figure, illustrating how much value has been baked into the market. Many of the homes here are luxury cabins or custom-built vacation rentals, which push averages well above traditional rural towns. With continued interest in short-term rentals and outdoor tourism, Broken Bow remains a unique and volatile but high-value market in Oklahoma real estate. Its long-term future will depend on balancing tourism growth with housing supply and local affordability.
8. Jenks – 78% Home Price Increase Since 2012
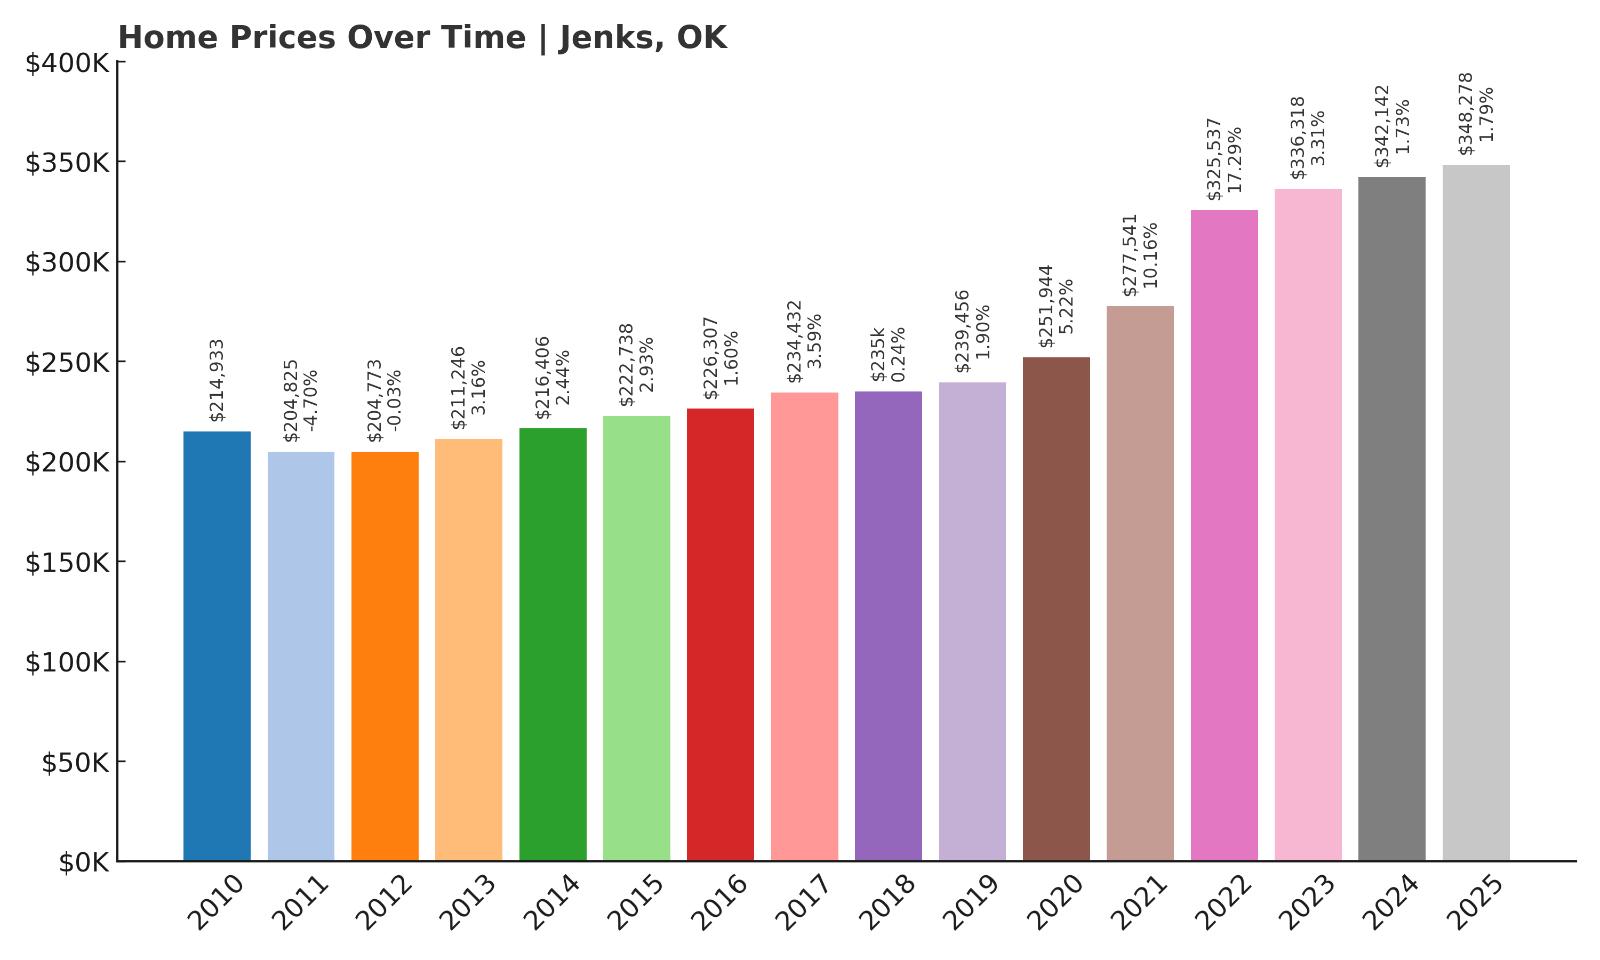
- 2010: $214,933
- 2011: $204,825 (-$10,108, -4.70% from previous year)
- 2012: $204,773 (-$52, -0.03% from previous year)
- 2013: $211,246 (+$6,473, +3.16% from previous year)
- 2014: $216,406 (+$5,160, +2.44% from previous year)
- 2015: $222,738 (+$6,332, +2.93% from previous year)
- 2016: $226,307 (+$3,569, +1.60% from previous year)
- 2017: $234,432 (+$8,125, +3.59% from previous year)
- 2018: $235,000 (+$567, +0.24% from previous year)
- 2019: $239,456 (+$4,456, +1.90% from previous year)
- 2020: $251,944 (+$12,488, +5.22% from previous year)
- 2021: $277,541 (+$25,597, +10.16% from previous year)
- 2022: $325,537 (+$47,995, +17.29% from previous year)
- 2023: $336,318 (+$10,782, +3.31% from previous year)
- 2024: $342,142 (+$5,824, +1.73% from previous year)
- 2025: $348,278 (+$6,136, +1.79% from previous year)
Jenks has seen steady and reliable price growth since 2012, with values climbing 78% to reach nearly $350K in 2025. While early gains were modest, momentum picked up sharply after 2020. The biggest jump came in 2022 with a 17.3% increase in just one year. Although appreciation has slowed in the years since, Jenks remains one of the most stable and high-demand towns in the Tulsa area, consistently drawing in new buyers.
Jenks – Premium Tulsa Suburb with Strong Foundations
Jenks is widely recognized as one of the best places to live in Oklahoma, and the real estate numbers support that reputation. Located along the Arkansas River just south of Tulsa, the town boasts excellent public schools, a charming and walkable downtown, and well-maintained public spaces. It has a strong sense of identity, anchored by a blend of residential, commercial, and recreational development that appeals to families and professionals alike. The area is also home to the Oklahoma Aquarium and several high-end subdivisions that have expanded its appeal among affluent homebuyers. As Tulsa’s metro area grows, Jenks continues to be one of the primary beneficiaries of suburban expansion.
Jenks’ home price trajectory reflects long-term investment in community infrastructure and consistent demand. While it didn’t experience the kind of extreme boom seen in towns like Broken Bow or Tuttle, its growth has been stable and durable. The sharp increase in 2022 was part of a broader regional surge, but even after that spike, the market remained steady. With a current median value of $348K, Jenks stands as a premium market in northeastern Oklahoma. For those looking to buy into a reliable and well-developed community, it remains one of the state’s top choices.
7. Edmond – 67.4% Home Price Increase Since 2012
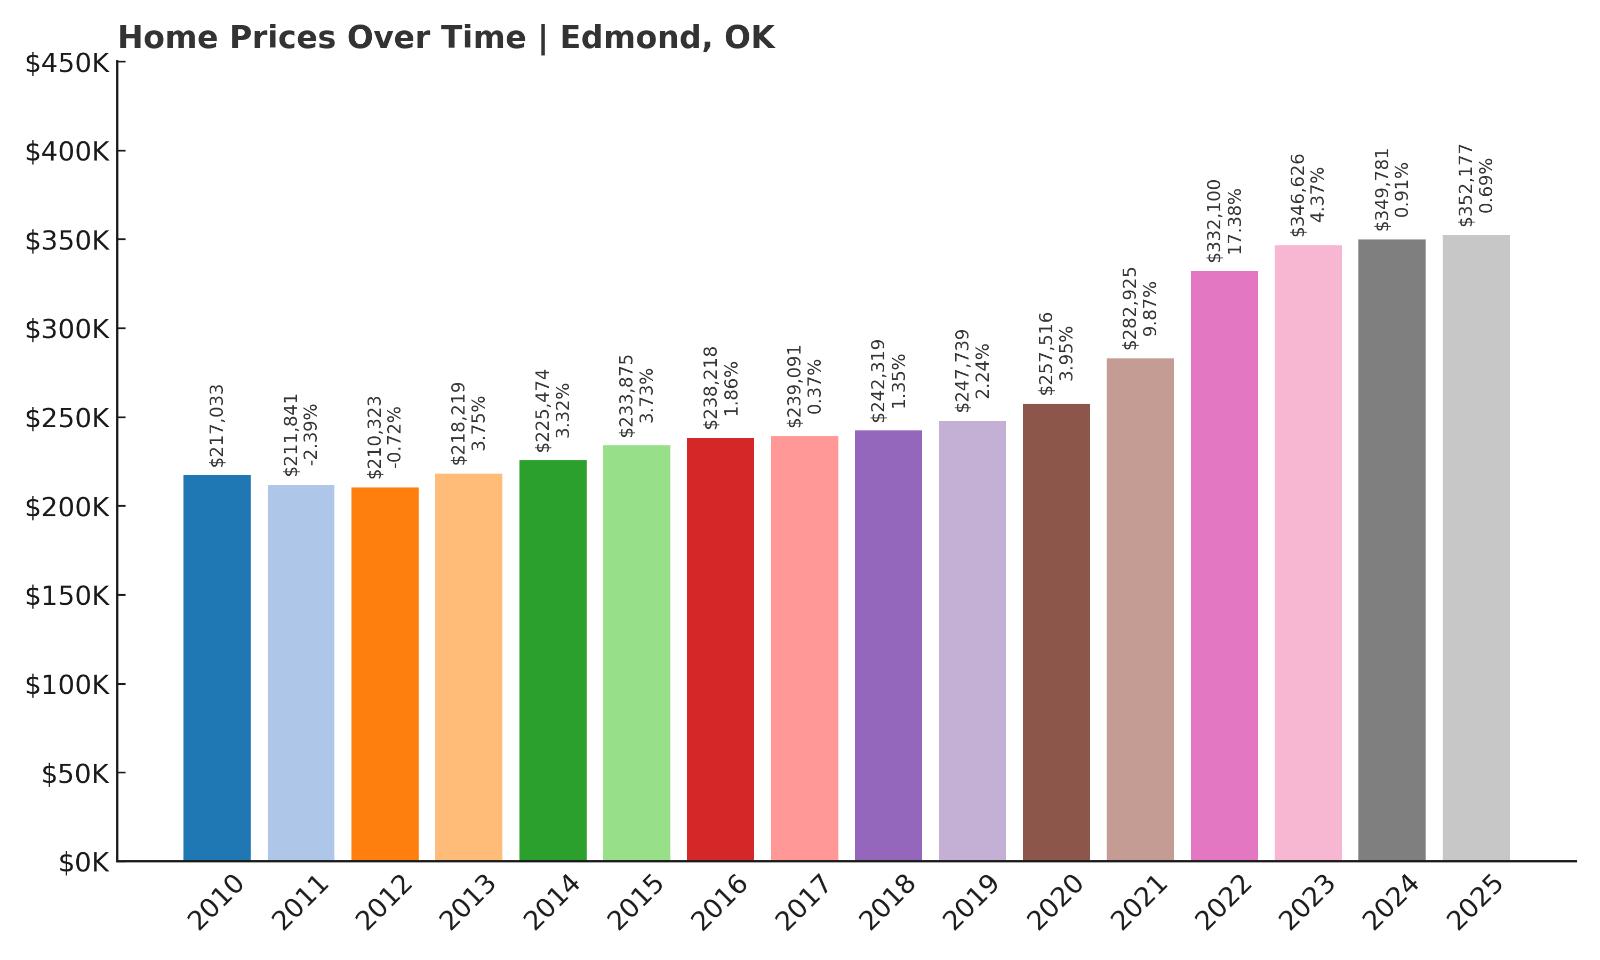
- 2010: $217,033
- 2011: $211,841 (-$5,191, -2.39% from previous year)
- 2012: $210,323 (-$1,518, -0.72% from previous year)
- 2013: $218,219 (+$7,896, +3.75% from previous year)
- 2014: $225,474 (+$7,255, +3.32% from previous year)
- 2015: $233,875 (+$8,401, +3.73% from previous year)
- 2016: $238,218 (+$4,343, +1.86% from previous year)
- 2017: $239,091 (+$872, +0.37% from previous year)
- 2018: $242,319 (+$3,229, +1.35% from previous year)
- 2019: $247,739 (+$5,420, +2.24% from previous year)
- 2020: $257,516 (+$9,777, +3.95% from previous year)
- 2021: $282,925 (+$25,408, +9.87% from previous year)
- 2022: $332,100 (+$49,175, +17.38% from previous year)
- 2023: $346,626 (+$14,526, +4.37% from previous year)
- 2024: $349,781 (+$3,155, +0.91% from previous year)
- 2025: $352,177 (+$2,396, +0.69% from previous year)
Edmond has posted a strong 67.4% increase in home values since 2012, moving from just over $210K to more than $352K in 2025. The biggest jump came in 2022 with a 17.4% increase in a single year, driven by heightened demand and limited inventory. While the pace has slowed since, the market has remained solid, with steady year-over-year gains. Even modest appreciation in 2024 and 2025 continues to push Edmond further into the ranks of Oklahoma’s most expensive places to live.
Edmond – Oklahoma City’s Premier Suburb
Edmond is often considered the gold standard for suburban living in Oklahoma. Just north of Oklahoma City, it offers top-ranked schools, vibrant neighborhoods, expansive parks, and a well-developed commercial scene. The city is home to the University of Central Oklahoma and a number of prestigious private schools, making it a magnet for families prioritizing education. With a balance of historic homes and newer master-planned communities, Edmond caters to a broad demographic while maintaining consistently high home values. The town also has a well-earned reputation for safety, well-maintained infrastructure, and civic pride, all of which feed into sustained real estate interest.
The housing market in Edmond has long been one of the state’s most stable. While many towns experienced volatility, Edmond’s growth has been more measured, rising gradually until a sharp spike in 2022. That surge was driven by pandemic-era demand and buyer migration from more expensive cities. Despite that peak, the market hasn’t cooled dramatically—prices are still rising, albeit more slowly. The current median home price of $352K reflects Edmond’s status as a mature, in-demand suburb. With continued population growth and limited developable land remaining, home values in Edmond are likely to stay strong for the foreseeable future.
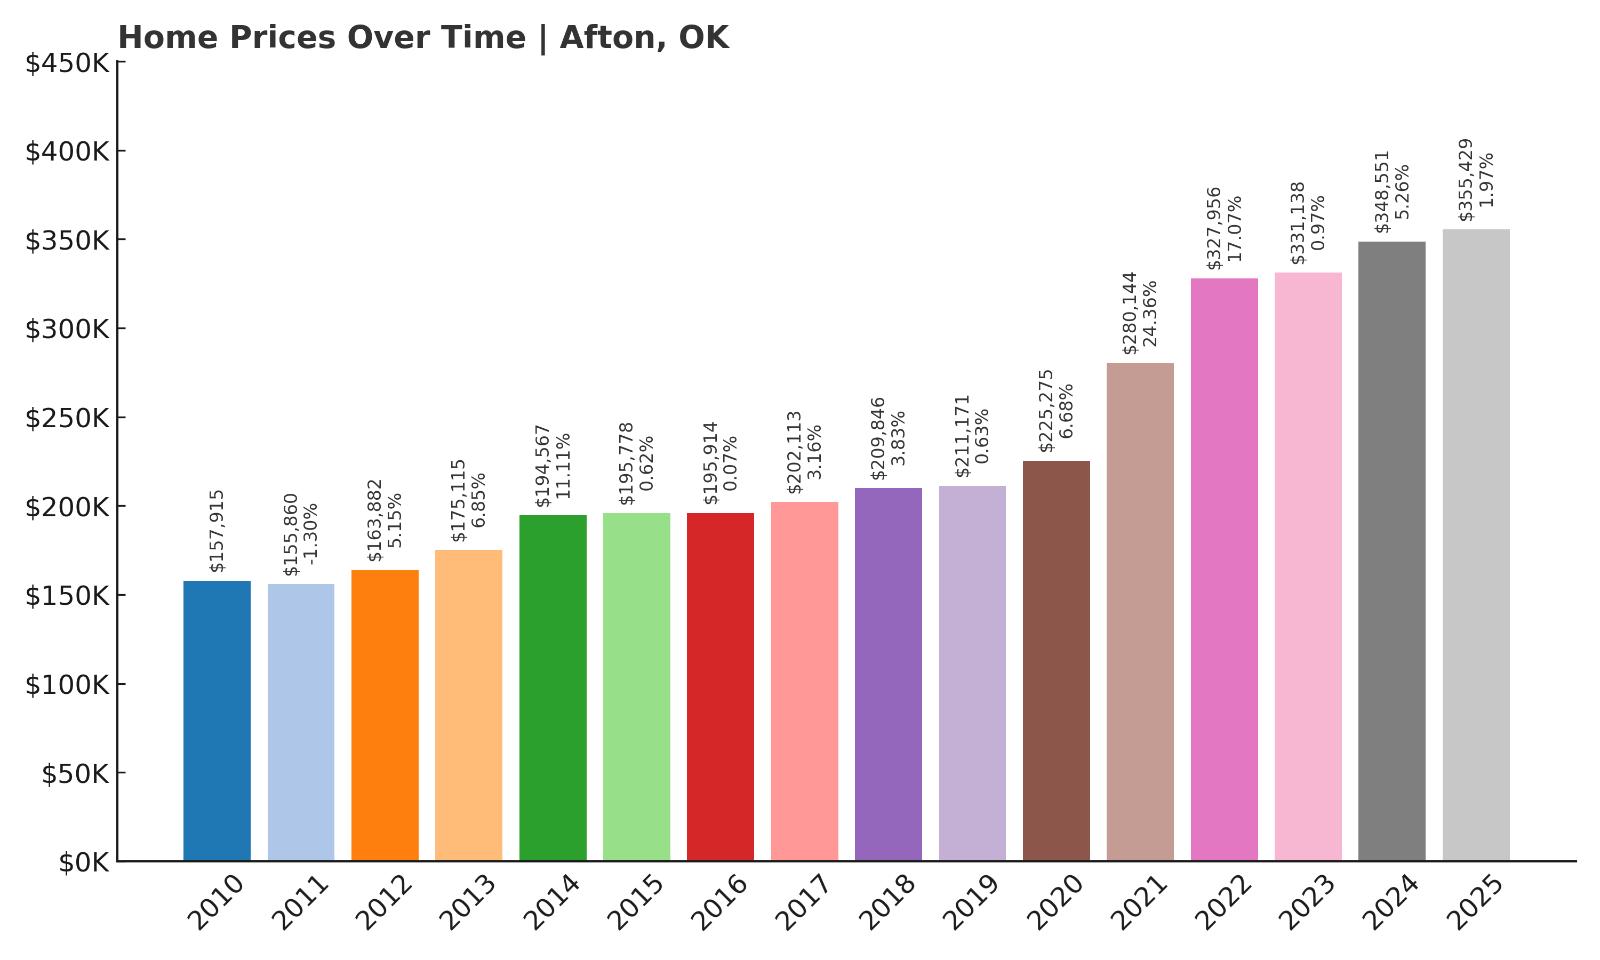
6. Afton – 125% Home Price Increase Since 2012
🔥 Would you like to save this?
- 2010: $157,915
- 2011: $155,860 (-$2,055, -1.30% from previous year)
- 2012: $163,882 (+$8,022, +5.15% from previous year)
- 2013: $175,115 (+$11,233, +6.85% from previous year)
- 2014: $194,567 (+$19,451, +11.11% from previous year)
- 2015: $195,778 (+$1,211, +0.62% from previous year)
- 2016: $195,914 (+$136, +0.07% from previous year)
- 2017: $202,113 (+$6,199, +3.16% from previous year)
- 2018: $209,846 (+$7,733, +3.83% from previous year)
- 2019: $211,171 (+$1,325, +0.63% from previous year)
- 2020: $225,275 (+$14,104, +6.68% from previous year)
- 2021: $280,144 (+$54,869, +24.36% from previous year)
- 2022: $327,956 (+$47,812, +17.07% from previous year)
- 2023: $331,138 (+$3,182, +0.97% from previous year)
- 2024: $348,551 (+$17,413, +5.26% from previous year)
- 2025: $355,429 (+$6,877, +1.97% from previous year)
Afton’s home prices have climbed a staggering 125% since 2012, jumping from $163K to over $355K in 2025. The town’s housing market accelerated dramatically between 2020 and 2022, with prices soaring by more than $100K in just two years. Although the growth has slowed in more recent years, values remain high, and appreciation has continued—albeit at a gentler pace. Afton’s place on this list is well-earned thanks to its combination of long-term gains and sustained interest from buyers.
Afton – Scenic Lakeside Living with Booming Prices
Afton is located in northeastern Oklahoma near Grand Lake O’ the Cherokees, one of the largest and most popular lakes in the state. Known for its stunning views, water-based recreation, and proximity to vacation homes and retirement communities, Afton has long been a favorite for second-home buyers. The town’s appeal grew even stronger during the pandemic, when buyers sought out less crowded, scenic places with lifestyle benefits. As a result, Afton’s housing market transformed almost overnight, going from a quiet lakeside town to a hot spot with soaring home values and surging demand for lakefront and luxury properties.
Much of Afton’s real estate is driven by its access to leisure activities and its reputation as a weekend getaway for people from Tulsa, Oklahoma City, and even parts of northwest Arkansas. The rapid appreciation between 2020 and 2022 was largely fueled by out-of-state buyers and retirees looking for vacation homes or long-term investments. Though appreciation slowed to under 2% in 2025, the momentum hasn’t fully subsided. With home values now over $355K and development continuing in surrounding lake areas, Afton has firmly positioned itself as a high-value community in northeastern Oklahoma. Future gains may depend on maintaining the balance between residential growth and the preservation of its natural appeal.
5. Jones – 132% Home Price Increase Since 2012
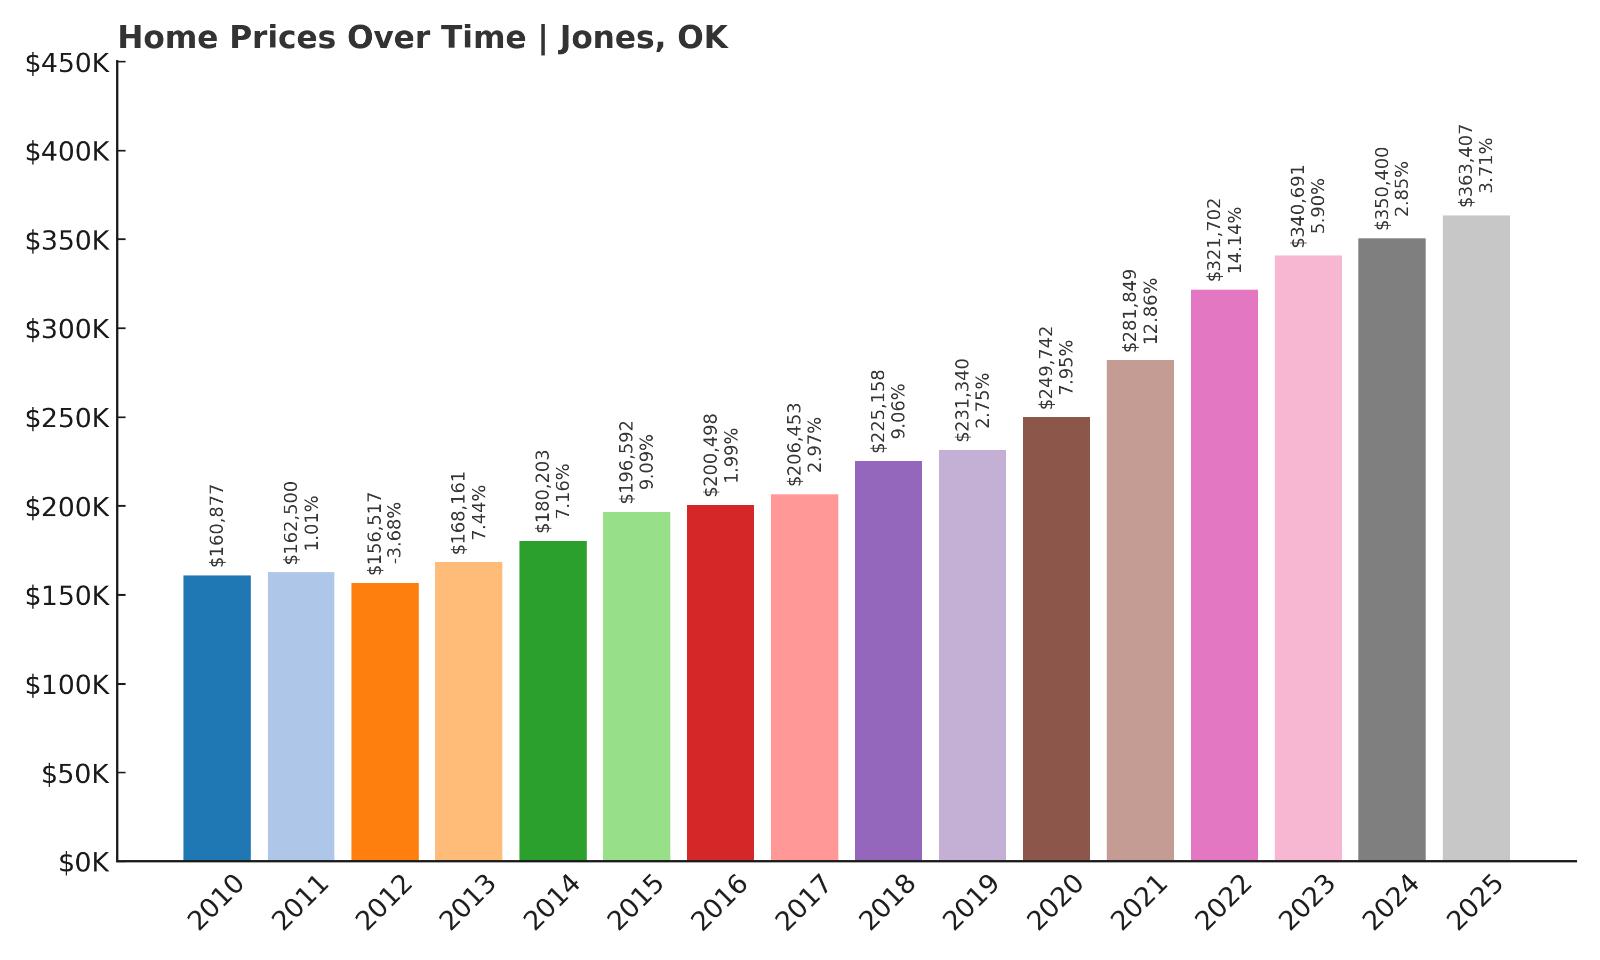
- 2010: $160,877
- 2011: $162,500 (+$1,623, +1.01% from previous year)
- 2012: $156,517 (-$5,983, -3.68% from previous year)
- 2013: $168,161 (+$11,644, +7.44% from previous year)
- 2014: $180,203 (+$12,042, +7.16% from previous year)
- 2015: $196,592 (+$16,389, +9.09% from previous year)
- 2016: $200,498 (+$3,906, +1.99% from previous year)
- 2017: $206,453 (+$5,955, +2.97% from previous year)
- 2018: $225,158 (+$18,706, +9.06% from previous year)
- 2019: $231,340 (+$6,182, +2.75% from previous year)
- 2020: $249,742 (+$18,402, +7.95% from previous year)
- 2021: $281,849 (+$32,107, +12.86% from previous year)
- 2022: $321,702 (+$39,853, +14.14% from previous year)
- 2023: $340,691 (+$18,988, +5.90% from previous year)
- 2024: $350,400 (+$9,710, +2.85% from previous year)
- 2025: $363,407 (+$13,007, +3.71% from previous year)
Jones has more than doubled in value since 2012, with home prices climbing from $156K to over $363K in 2025—a total increase of 132%. Its growth has been both steady and dramatic, with large year-over-year gains across the last decade. The town hit a major inflection point between 2020 and 2022, where back-to-back double-digit increases pushed it into the upper tiers of Oklahoma’s housing market. Even now, prices are still rising and show little sign of slowing.
Jones – Quiet Country Living Near the City
Jones is nestled in the eastern part of Oklahoma County, just outside the bustle of Oklahoma City, and has emerged as a high-demand market for those craving rural charm with city access. Once a small farming town, Jones now attracts buyers drawn to its peaceful surroundings, acreage homes, and wide-open space. Its school district, community feel, and low-density neighborhoods have made it a magnet for buyers looking to escape more congested suburbs while remaining within commuting range of OKC’s job centers. This appeal has fueled sustained appreciation and made Jones a standout performer in the region’s real estate scene.
The massive price jumps between 2020 and 2022—nearly $72,000 in combined appreciation—reflect how rapidly the town’s market shifted. That growth came from both end-users and land investors, eager to take advantage of Jones’s proximity to new infrastructure and expanding metro sprawl. Even after those large gains, the town has continued to post strong growth, reaching a median of $363K in 2025. As Oklahoma City’s reach extends further outward and demand for semi-rural living persists, Jones is likely to remain one of the most attractive and fastest-growing areas in the state.
4. Cedar Valley – 81% Home Price Increase Since 2012
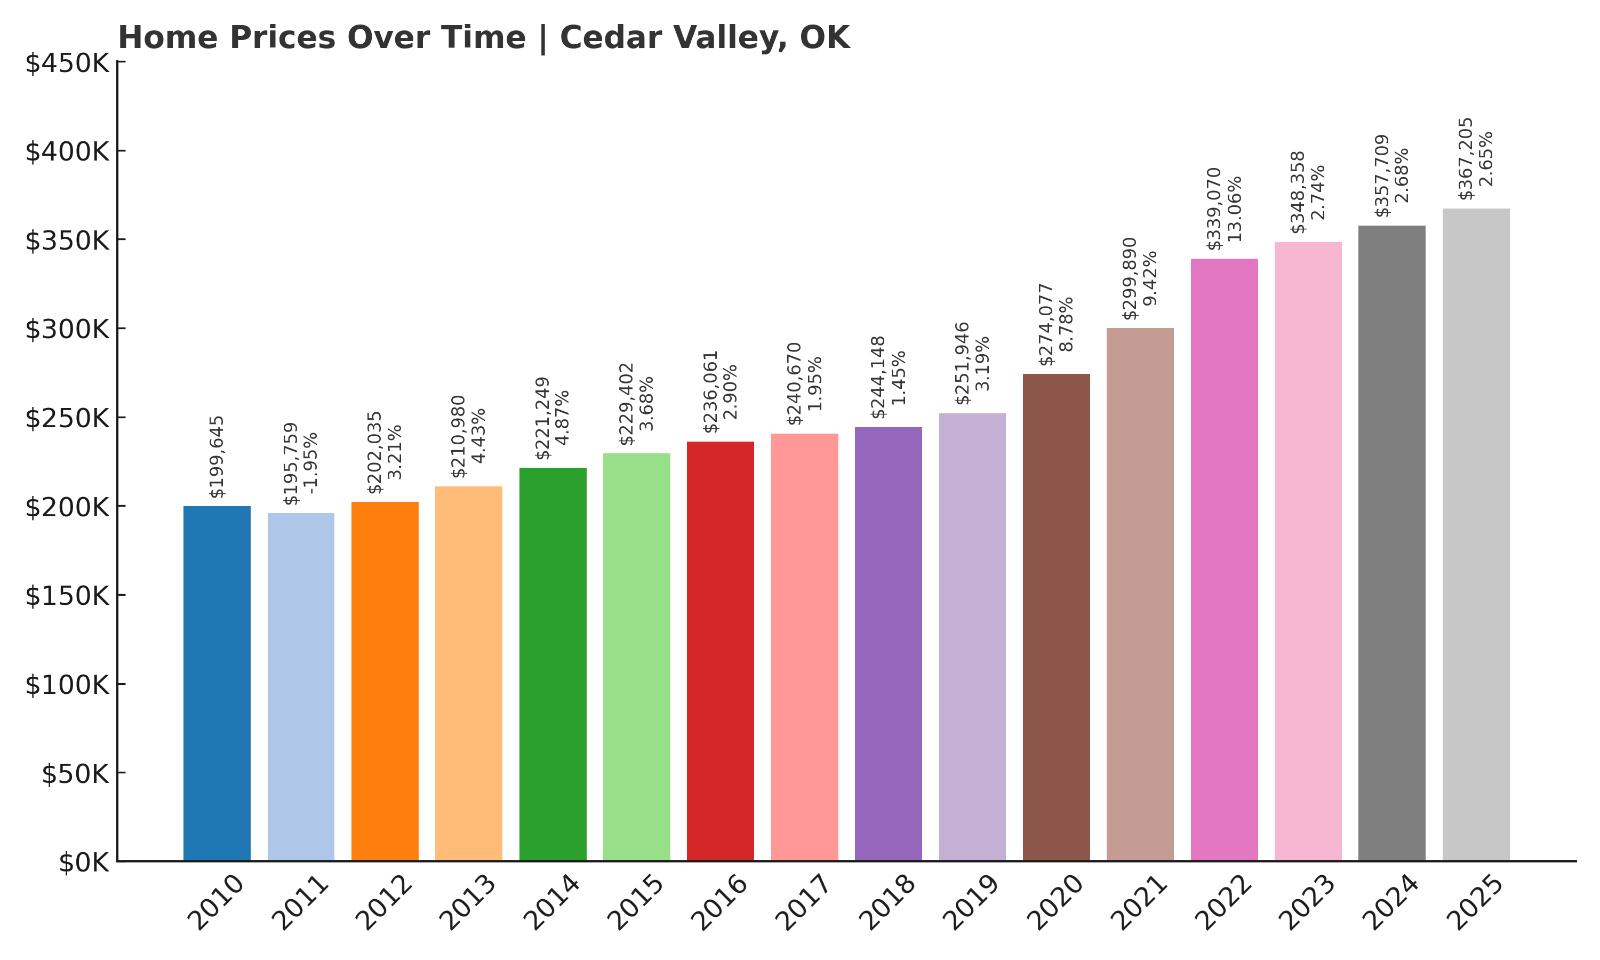
- 2010: $199,645
- 2011: $195,759 (-$3,886, -1.95% from previous year)
- 2012: $202,035 (+$6,275, +3.21% from previous year)
- 2013: $210,980 (+$8,945, +4.43% from previous year)
- 2014: $221,249 (+$10,269, +4.87% from previous year)
- 2015: $229,402 (+$8,153, +3.68% from previous year)
- 2016: $236,061 (+$6,659, +2.90% from previous year)
- 2017: $240,670 (+$4,609, +1.95% from previous year)
- 2018: $244,148 (+$3,479, +1.45% from previous year)
- 2019: $251,946 (+$7,798, +3.19% from previous year)
- 2020: $274,077 (+$22,131, +8.78% from previous year)
- 2021: $299,890 (+$25,812, +9.42% from previous year)
- 2022: $339,070 (+$39,180, +13.06% from previous year)
- 2023: $348,358 (+$9,288, +2.74% from previous year)
- 2024: $357,709 (+$9,351, +2.68% from previous year)
- 2025: $367,205 (+$9,496, +2.65% from previous year)
Cedar Valley’s home prices have climbed 81% since 2012, going from just over $202K to $367K in 2025. While growth was modest for most of the 2010s, appreciation ramped up after 2020 and has remained strong ever since. Annual gains have hovered around 2–3% in recent years, which points to stable demand even as other markets have cooled. Cedar Valley has carved out a place among the state’s most valuable towns, thanks to its consistency and appeal.
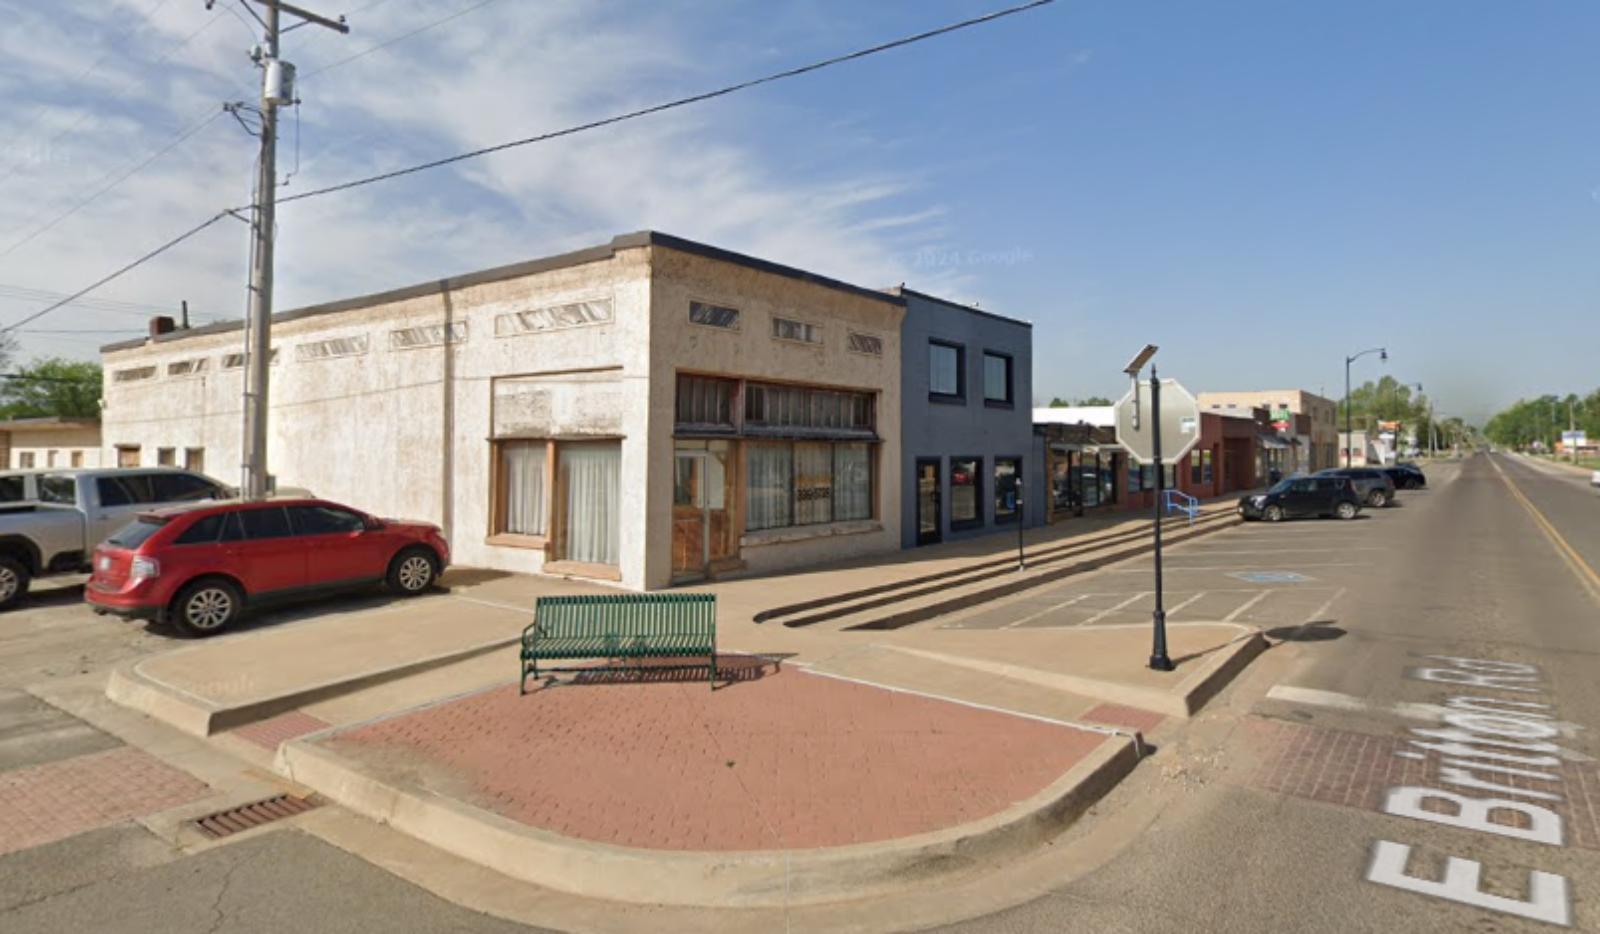
Cedar Valley – Golf Community with Consistent Growth
Located in Logan County north of Oklahoma City, Cedar Valley is a small, peaceful community built around a popular golf course that shares its name. It offers quiet, semi-rural living within reach of Edmond and other growing suburbs. Much of the real estate in Cedar Valley is centered around golf course homes, which attract retirees, second-home buyers, and families looking for a scenic setting. The low crime rate, quiet streets, and open spaces make it especially popular among those seeking tranquility and a slower pace of life without being isolated from city resources.
The town’s home values began to accelerate after 2020, mirroring a statewide trend toward remote-friendly, low-density neighborhoods. Still, unlike other boomtowns, Cedar Valley has remained relatively balanced, with steady 2–3% annual gains since 2023. Its limited inventory, consistent demand, and unique community layout contribute to that durability. With a 2025 median home value over $367K, Cedar Valley now ranks among the priciest areas in Oklahoma, especially for its size. As long as buyers continue to seek amenity-driven neighborhoods in peaceful settings, this hidden golf-side enclave is likely to maintain its strong position in the state’s housing market.
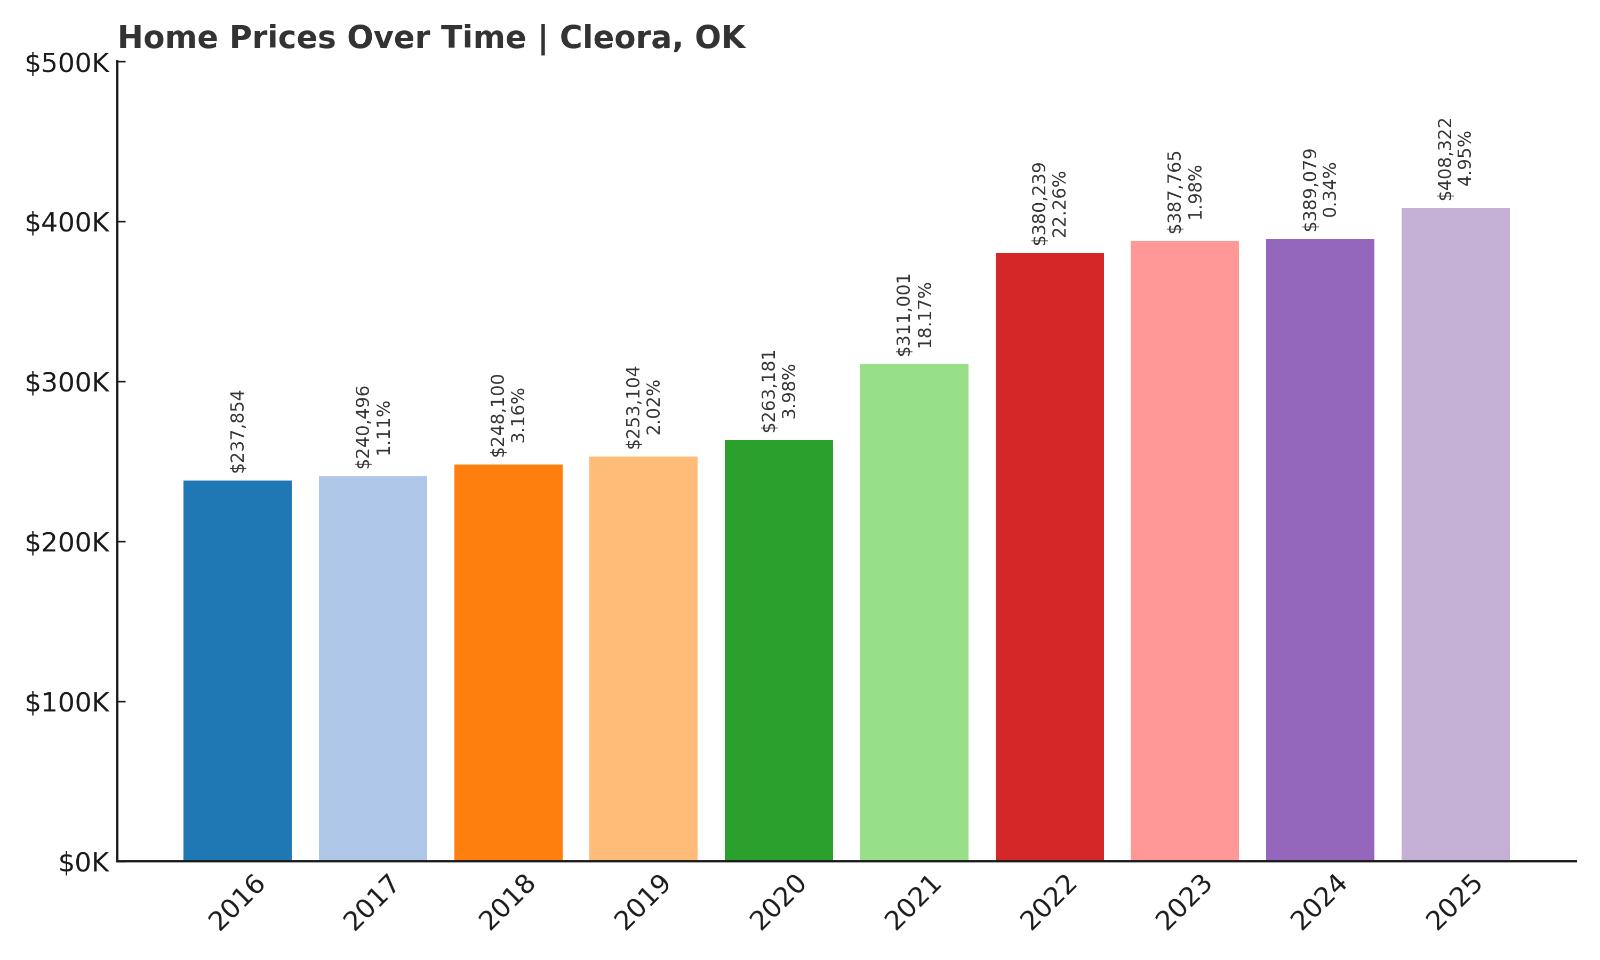
3. Cleora – 71.6% Home Price Increase Since 2016
- 2010: N/A
- 2011: N/A
- 2012: N/A
- 2013: N/A
- 2014: N/A
- 2015: N/A
- 2016: $237,854
- 2017: $240,496 (+$2,643, +1.11% from previous year)
- 2018: $248,100 (+$7,604, +3.16% from previous year)
- 2019: $253,104 (+$5,004, +2.02% from previous year)
- 2020: $263,181 (+$10,078, +3.98% from previous year)
- 2021: $311,001 (+$47,820, +18.17% from previous year)
- 2022: $380,239 (+$69,238, +22.26% from previous year)
- 2023: $387,765 (+$7,526, +1.98% from previous year)
- 2024: $389,079 (+$1,315, +0.34% from previous year)
- 2025: $408,322 (+$19,243, +4.95% from previous year)
Cleora has seen home prices rise 71.6% since 2016, increasing from $237K to over $408K in 2025. Though it’s one of the smaller towns on the list, Cleora’s market exploded between 2020 and 2022 with nearly 50% growth in just two years. After a brief leveling-off, values began climbing again in 2025. Its lakeside location and limited inventory have helped support consistently high prices, making it one of the most expensive housing markets in the state.
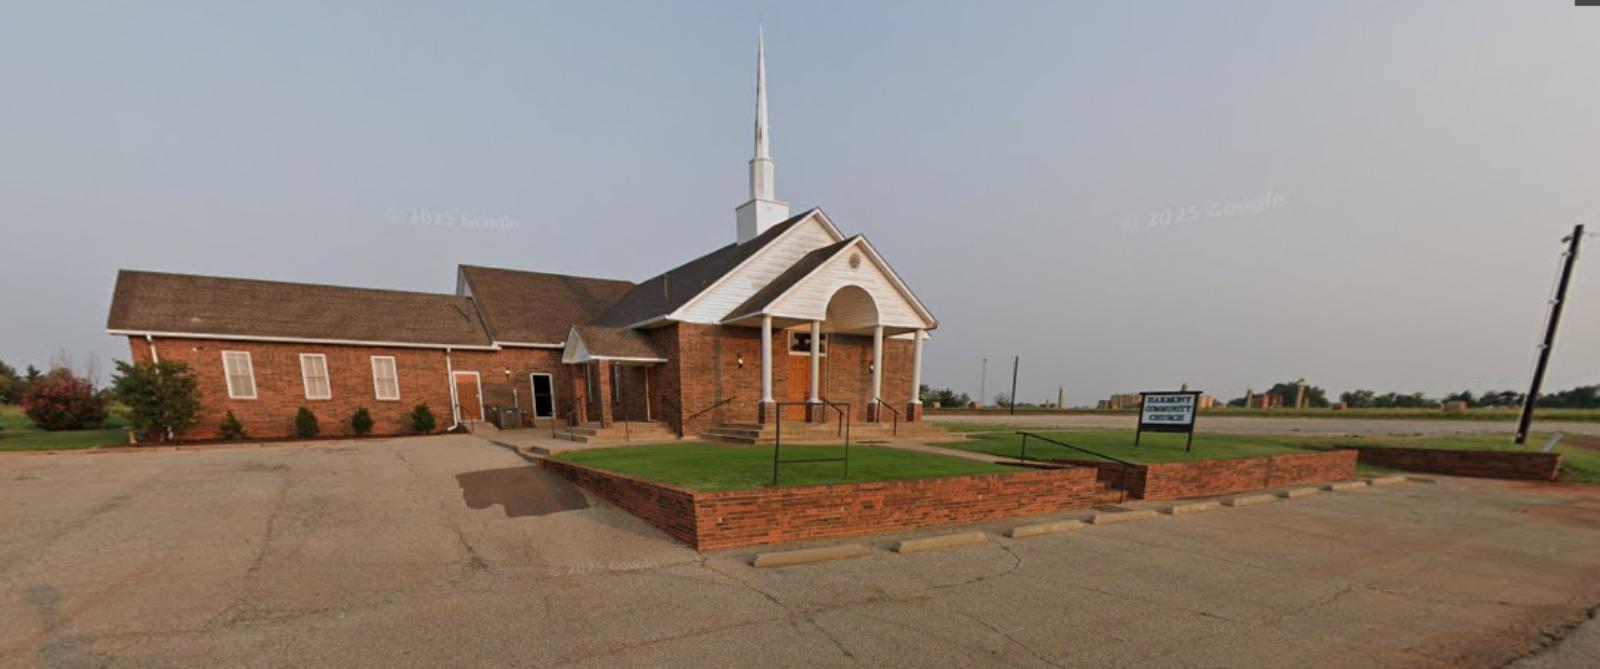
Cleora – Grand Lake Living With Premium Prices
Cleora sits on the shores of Grand Lake in Delaware County and is known for its upscale waterfront homes, fishing resorts, and panoramic lake views. While technically unincorporated, Cleora functions as a quiet, sought-after residential community where many homes serve as second residences or vacation properties. Its appeal is centered around lifestyle—boating, golfing, and year-round access to natural beauty. The area has limited commercial development, but that’s part of the draw for buyers looking for privacy and peace. Because Cleora borders high-end parts of Grand Lake, it shares in the premium pricing typical of nearby lakefront enclaves.
The town’s price growth reflects rising demand for luxury rural living during the post-pandemic housing shift. The huge jumps in 2021 and 2022 were largely driven by out-of-state and affluent in-state buyers seeking second homes. Though appreciation slowed afterward, Cleora didn’t experience a correction like some other towns. Its 2025 median of $408K is among the highest in Oklahoma, especially for a town with limited year-round population. As long as Grand Lake remains a recreation hub, Cleora is likely to retain its elevated status among the state’s most valuable housing markets.
2. Goldsby – 114% Home Price Increase Since 2012
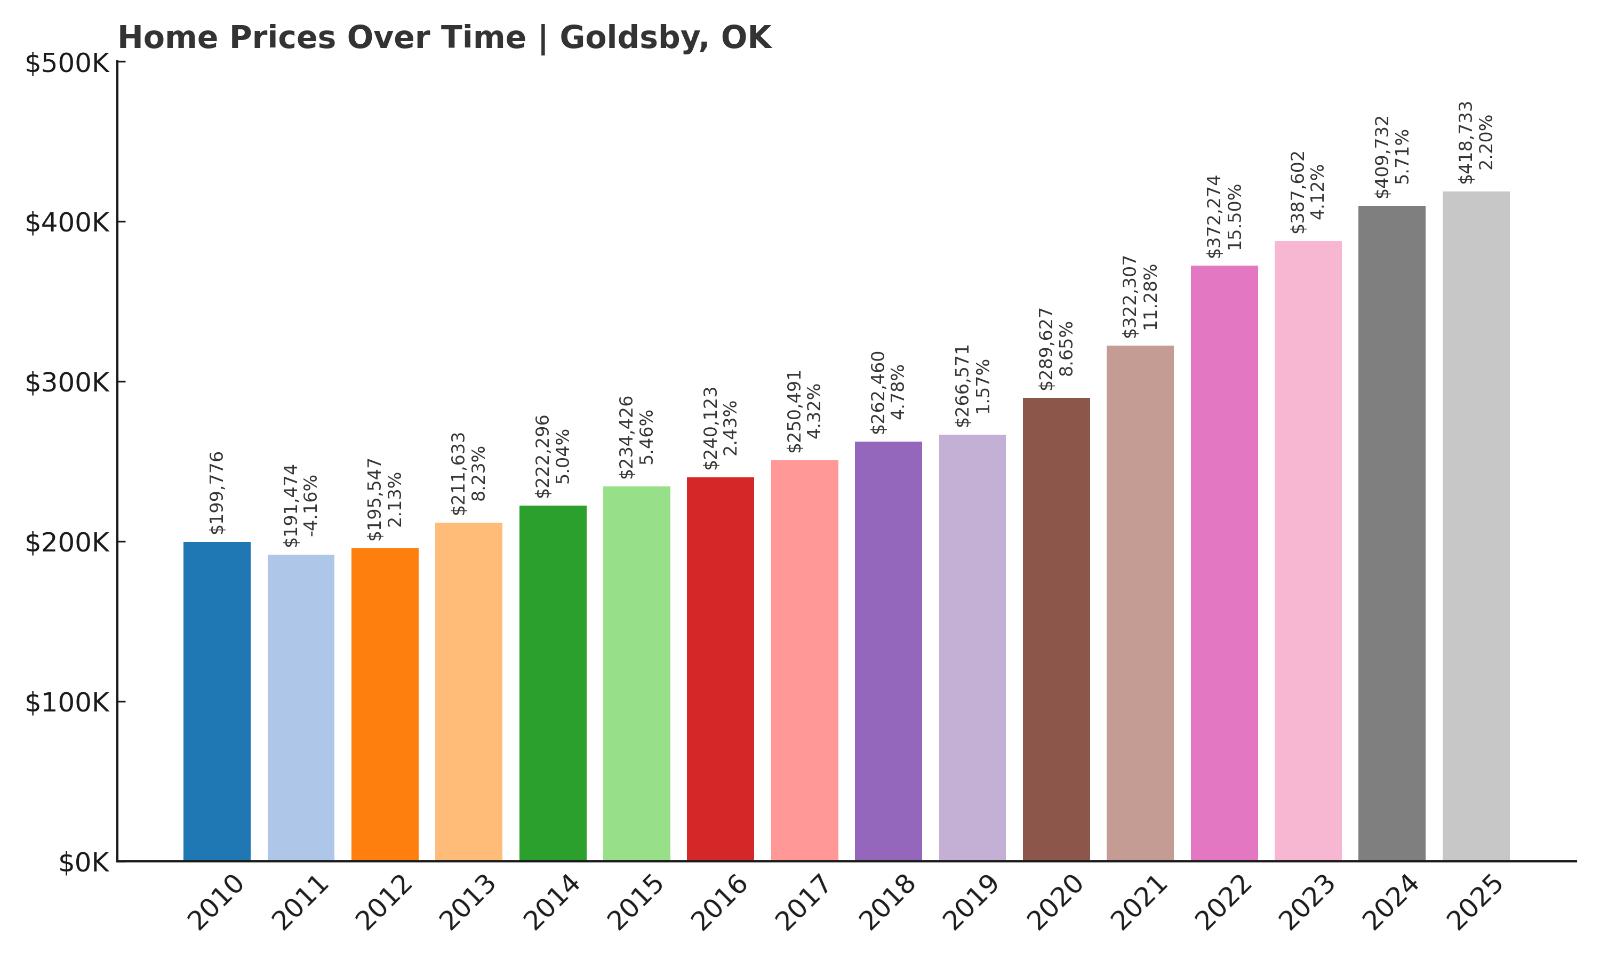
- 2010: $199,776
- 2011: $191,474 (-$8,302, -4.16% from previous year)
- 2012: $195,547 (+$4,073, +2.13% from previous year)
- 2013: $211,633 (+$16,086, +8.23% from previous year)
- 2014: $222,296 (+$10,663, +5.04% from previous year)
- 2015: $234,426 (+$12,130, +5.46% from previous year)
- 2016: $240,123 (+$5,697, +2.43% from previous year)
- 2017: $250,491 (+$10,368, +4.32% from previous year)
- 2018: $262,460 (+$11,970, +4.78% from previous year)
- 2019: $266,571 (+$4,110, +1.57% from previous year)
- 2020: $289,627 (+$23,056, +8.65% from previous year)
- 2021: $322,307 (+$32,680, +11.28% from previous year)
- 2022: $372,274 (+$49,967, +15.50% from previous year)
- 2023: $387,602 (+$15,329, +4.12% from previous year)
- 2024: $409,732 (+$22,130, +5.71% from previous year)
- 2025: $418,733 (+$9,001, +2.20% from previous year)
Home prices in Goldsby have soared 114% since 2012, climbing from just under $196K to more than $418K in 2025. This long-term appreciation places it firmly near the top of Oklahoma’s most expensive housing markets. With double-digit gains in 2021 and 2022 and continued growth through 2025, Goldsby has emerged as one of the state’s most sought-after locations for upscale, low-density living.
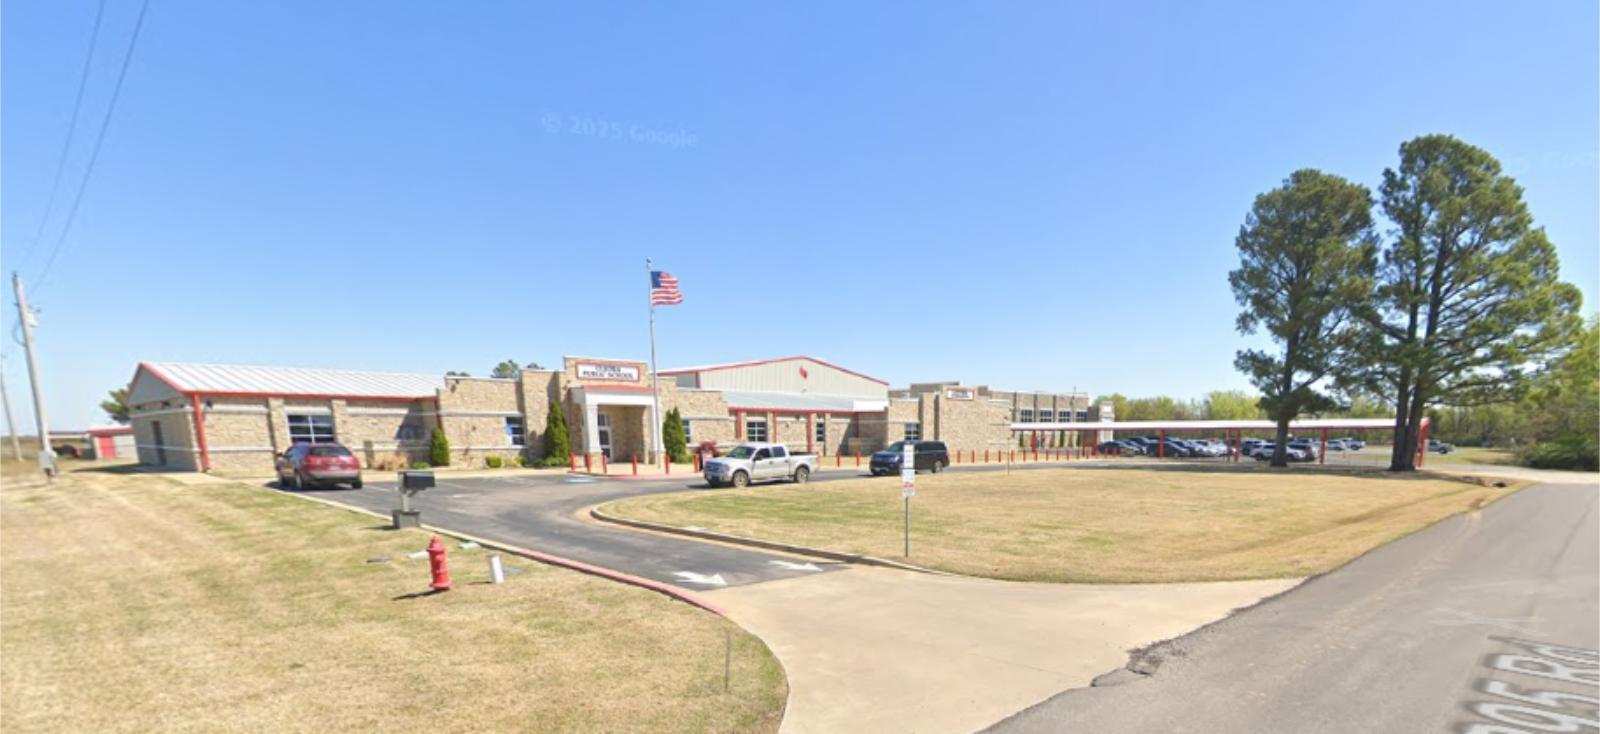
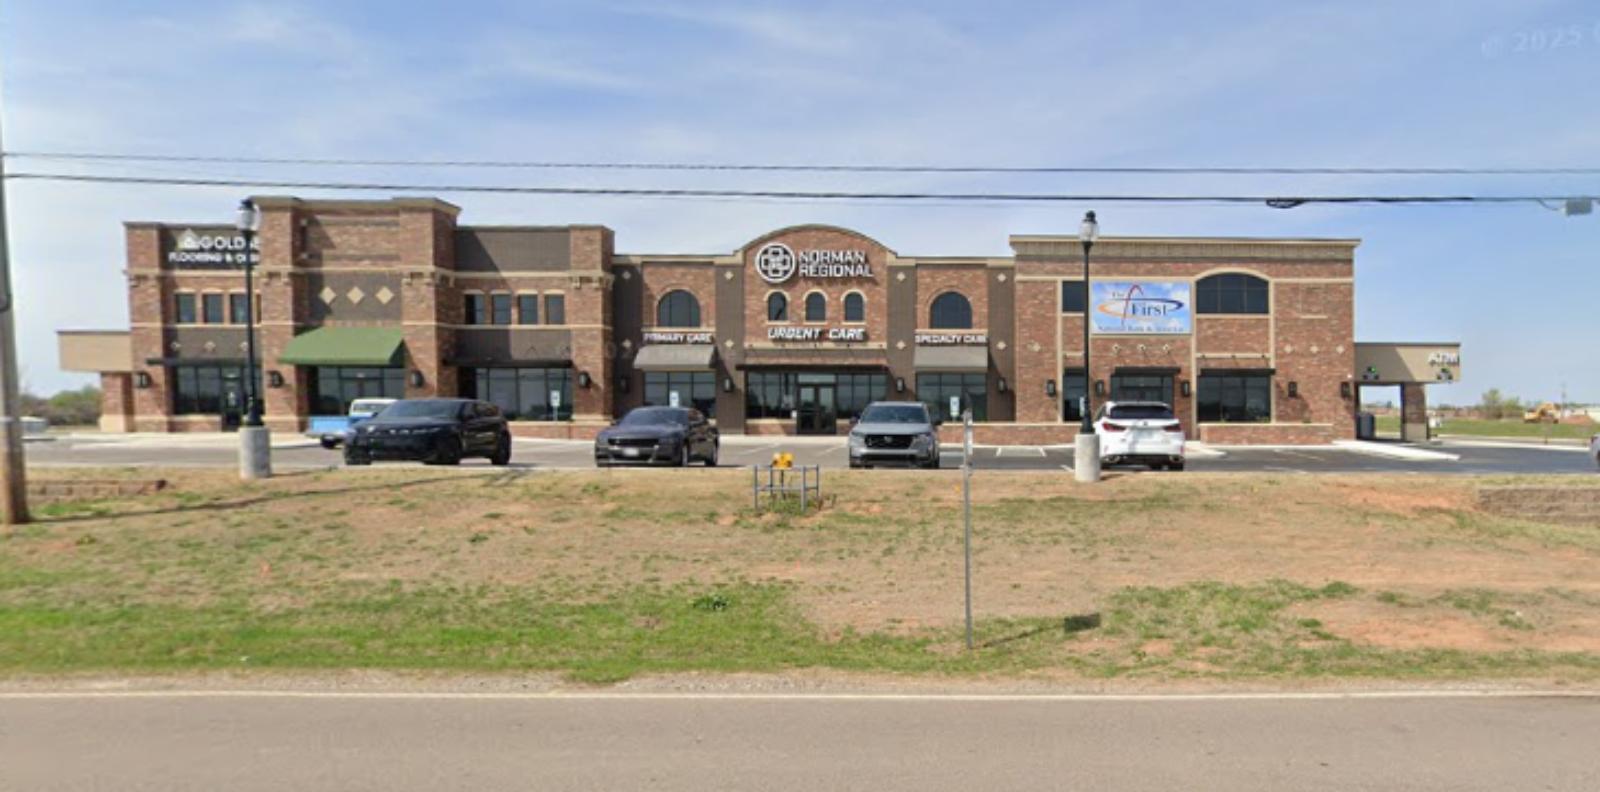
Goldsby – Rural Luxury With Quick Access to Norman
🔥 Would you like to save this?
Goldsby sits just south of Norman along Interstate 35, offering residents both wide-open space and fast freeway access to Oklahoma City. Though technically rural, the town has become known for its large homes, acreage lots, and custom builds that appeal to buyers looking for privacy without being far from city services. It’s home to Riverwind Casino and several high-end subdivisions, and benefits from being in the Newcastle and Norman public school zones. Goldsby is also appealing to those relocating from within the metro who want to upgrade to larger homes or escape denser suburban environments.
The town’s housing market began heating up in the 2010s, but really took off after 2020 as buyer preferences shifted toward land, space, and high-end finishes. Home prices jumped by nearly $50K in 2022 alone, marking a turning point where Goldsby cemented its identity as an elite Oklahoma housing market. Even in more recent years, values have continued to rise steadily. With a 2025 median price nearing $420K, Goldsby now rivals lakefront towns and urban luxury enclaves in price. Its strategic location, scenic landscapes, and emphasis on quality housing have all helped it reach—and maintain—top-tier status in the state.
1. Nichols Hills – 88% Home Price Increase Since 2012
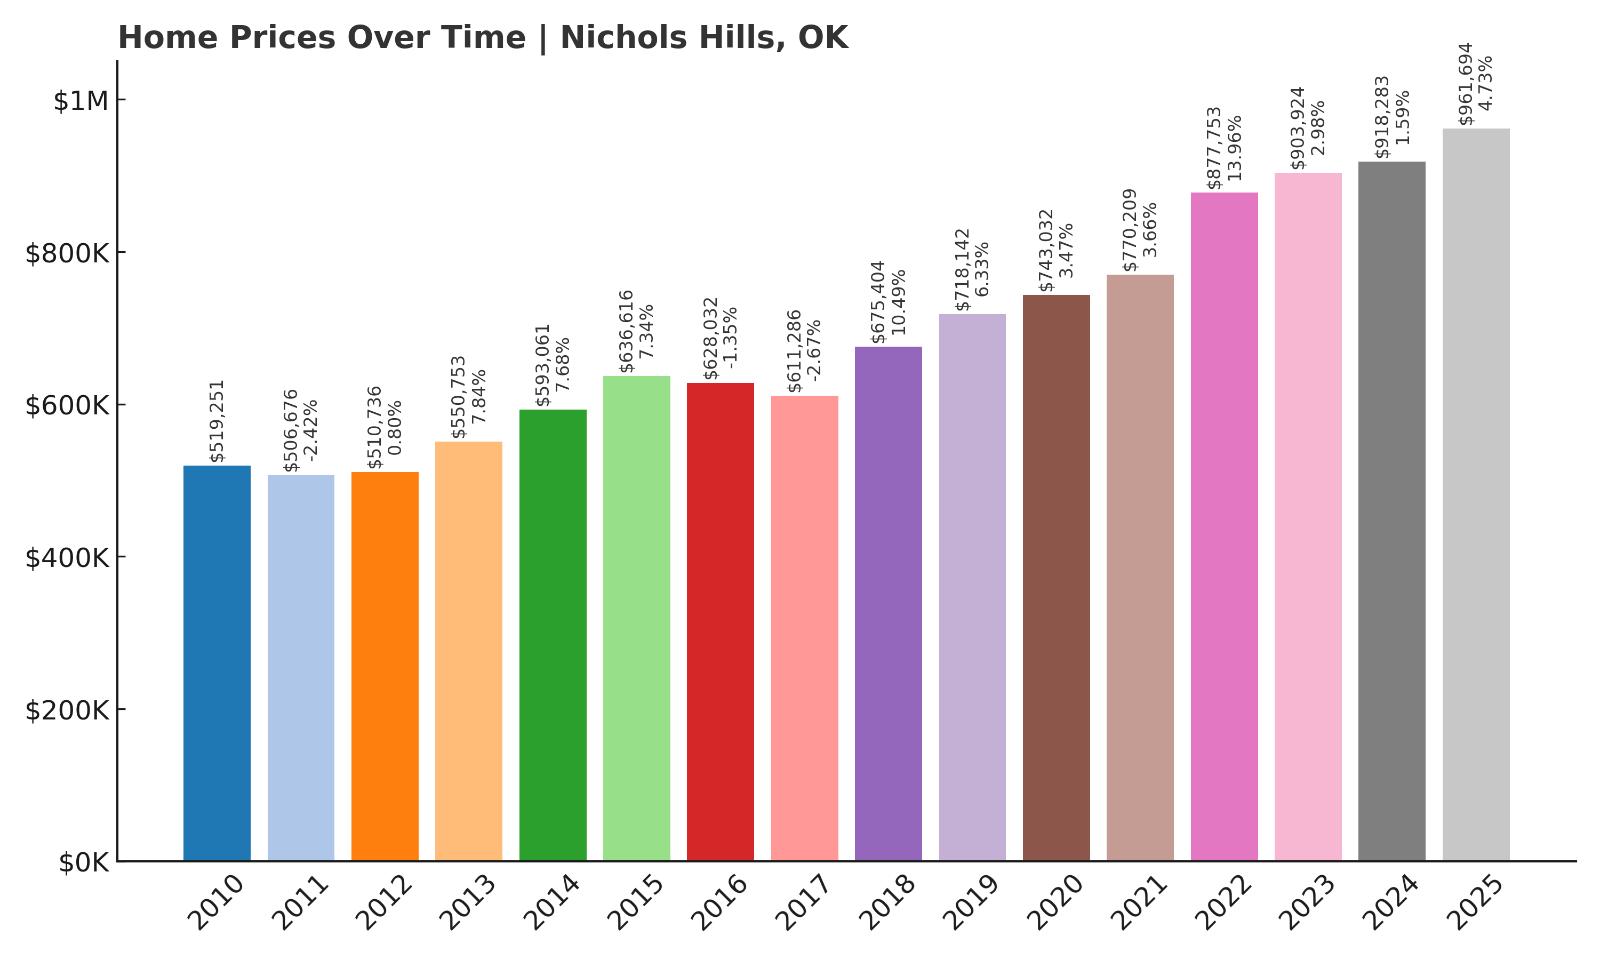
- 2010: $519,251
- 2011: $506,676 (-$12,575, -2.42% from previous year)
- 2012: $510,736 (+$4,060, +0.80% from previous year)
- 2013: $550,753 (+$40,016, +7.84% from previous year)
- 2014: $593,061 (+$42,308, +7.68% from previous year)
- 2015: $636,616 (+$43,555, +7.34% from previous year)
- 2016: $628,032 (-$8,584, -1.35% from previous year)
- 2017: $611,286 (-$16,746, -2.67% from previous year)
- 2018: $675,404 (+$64,117, +10.49% from previous year)
- 2019: $718,142 (+$42,739, +6.33% from previous year)
- 2020: $743,032 (+$24,890, +3.47% from previous year)
- 2021: $770,209 (+$27,177, +3.66% from previous year)
- 2022: $877,753 (+$107,544, +13.96% from previous year)
- 2023: $903,924 (+$26,171, +2.98% from previous year)
- 2024: $918,283 (+$14,359, +1.59% from previous year)
- 2025: $961,694 (+$43,412, +4.73% from previous year)
Nichols Hills has seen an 88% increase in home values since 2012, rising from $510K to nearly $962K in 2025. While its percentage gain isn’t the highest on this list, its absolute price point is unmatched. Nichols Hills has long been the gold standard for luxury real estate in Oklahoma, and the latest figures only reaffirm its position. A $961K median makes it the undisputed #1 most expensive housing market in the state.
Nichols Hills – Oklahoma’s Ultimate Luxury Market
Nichols Hills is synonymous with wealth, exclusivity, and prestige in Oklahoma. Located in central Oklahoma City, it is surrounded by upscale neighborhoods, golf courses, and country clubs. Its tree-lined streets are home to some of the most architecturally distinctive and expensive homes in the region. The area boasts walkable neighborhoods, high-end shopping and dining at Classen Curve, and quick access to downtown and the Paseo Arts District. Residents include prominent business leaders, politicians, and entertainers, and the community prides itself on strict zoning, manicured landscapes, and a strong sense of identity.
Price growth here has been steady and long-term. The jump in 2022 was particularly notable, with prices rising by more than $100K in just one year. Despite national housing volatility, Nichols Hills has shown remarkable price resilience—values continued rising in 2023, 2024, and 2025, pushing the market to new highs. With homes often exceeding $1 million, the town now sits in a class of its own. For buyers seeking the absolute best Oklahoma real estate has to offer, Nichols Hills remains the pinnacle—delivering a rare blend of urban convenience, timeless architecture, and sustained long-term value.


