
🔥 Would you like to save this?
I’ve been digging into data from the Zillow Home Value Index, analyzing California’s 25 most expensive towns as of March 2025. This comprehensive dataset reveals not just current valuations but striking financial patterns spanning 15 years of real estate evolution.
What stands out most dramatically is the acceleration of wealth concentration in these premier locations. While California’s broader real estate market has seen substantial growth, these elite communities have experienced appreciation rates that outpace standard investment vehicles by significant margins. The median 15-year growth across these top-tier communities exceeds 149%, representing financial momentum that few other asset classes could match.
In order to come up with the very specific design ideas, we create most designs with the assistance of state-of-the-art AI interior design software. Also, assume links that take you off the site are affiliate links such as links to Amazon. this means we may earn a commission if you buy something.
You’ll notice geographic clustering around specific economic engines—Silicon Valley dominates the highest price points, followed by coastal enclaves and exclusive Southern California communities. The data tells a story of sustained wealth migration to areas offering distinctive combinations of prestige, natural beauty, and proximity to centers of innovation.
25. Laguna Beach

- 2025 Home Value: $2,979,050
- 2020 Home Value: $1,933,540
- 2015 Home Value: $1,696,222
- 2010 Home Value: $1,285,368
- 2020 to 2025 % Change: 54.07%
- 2015 to 2025 % Change: 75.63%
- 2010 to 2025 % Change: 131.77%
You’re looking at a compelling financial trajectory in Laguna Beach, where property values have more than doubled since 2010, delivering a 131.77% return over fifteen years. The coastal premium continues driving accelerated growth, with a substantial 54.07% jump just since 2020. Nestled along Orange County’s picturesque coastline, this artistic community combines Mediterranean-style architecture with pristine beaches. The consistent price appreciation reflects both limited inventory and the area’s enduring appeal as a luxury lifestyle destination with international recognition.
24. Manhattan Beach

- 2025 Home Value: $3,061,556
- 2020 Home Value: $2,348,059
- 2015 Home Value: $1,737,079
- 2010 Home Value: $1,197,935
- 2020 to 2025 % Change: 30.39%
- 2015 to 2025 % Change: 76.25%
- 2010 to 2025 % Change: 155.57%
You’re witnessing exceptional wealth creation in Manhattan Beach, where investing $1.2 million in 2010 would yield over $3 million today—a remarkable 155.57% appreciation. Though recent growth has moderated to 30.39% since 2020, this remains well above inflation and traditional investment vehicles. This premium South Bay community sits just southwest of Los Angeles, offering pristine beaches and an upscale small-town atmosphere. Its proximity to both tech employers and entertainment industry hubs creates a persistent demand-supply imbalance that continues to drive prices upward despite already elevated valuations.
23. Cupertino

- 2025 Home Value: $3,190,373
- 2020 Home Value: $2,172,051
- 2015 Home Value: $1,689,393
- 2010 Home Value: $954,432
- 2020 to 2025 % Change: 46.88%
- 2015 to 2025 % Change: 88.85%
- 2010 to 2025 % Change: 234.27%
You’re observing tech-driven wealth creation at its finest in Cupertino, where property values have more than tripled since 2010, delivering an extraordinary 234.27% return on investment. The town’s recent 46.88% five-year growth rate signals continued strong momentum despite already elevated price points. Located in the heart of Silicon Valley and home to Apple’s headquarters, this community combines suburban tranquility with proximity to tech’s economic engine. The exceptional appreciation reflects both quality schools and the perpetual housing shortage created by the region’s high-income workforce competing for limited inventory.
22. Rolling Hills

- 2025 Home Value: $3,194,374
- 2020 Home Value: $2,363,554
- 2015 Home Value: $1,882,541
- 2010 Home Value: $1,371,654
- 2020 to 2025 % Change: 35.15%
- 2015 to 2025 % Change: 69.68%
- 2010 to 2025 % Change: 132.88%
You’re looking at substantial wealth preservation in Rolling Hills, where property has outperformed many investment vehicles with a 132.88% appreciation since 2010. The most recent five-year cycle shows a healthy 35.15% growth rate, indicating continued market confidence despite economic headwinds. Perched atop the Palos Verdes Peninsula, this gated equestrian community offers stunning ocean views and remarkable privacy. The premium valuations reflect both the area’s large lot sizes and restrictive zoning that effectively caps new development, creating a perpetual scarcity effect that underpins long-term price stability.
21. Diablo

- 2025 Home Value: $3,211,864
- 2020 Home Value: $2,411,743
- 2015 Home Value: $nan
- 2010 Home Value: $nan
- 2020 to 2025 % Change: 33.18%
- 2015 to 2025 % Change: nan%
- 2010 to 2025 % Change: nan%
You’re witnessing robust financial performance in Diablo, where property values have increased by 33.18% in just five years—significantly outpacing inflation and many alternative investments. While historical data before 2020 is unavailable, the consistent upward trajectory suggests strong underlying fundamentals driving demand. This exclusive enclave sits at the base of Mount Diablo in Contra Costa County, offering a secluded country club lifestyle. The limited housing inventory and prestigious address create a persistent scarcity premium that reinforces the area’s position among California’s most valuable real estate markets.
20. Stinson Beach

- 2025 Home Value: $3,243,790
- 2020 Home Value: $2,370,638
- 2015 Home Value: $1,614,340
- 2010 Home Value: $1,081,493
- 2020 to 2025 % Change: 36.83%
- 2015 to 2025 % Change: 100.94%
- 2010 to 2025 % Change: 199.94%
You’re observing exceptional capital appreciation in Stinson Beach, where property values have essentially tripled since 2010, delivering a 199.94% return that outperforms virtually all traditional investment vehicles. The doubling of prices since 2015 demonstrates both consistent demand and the accelerating premium placed on coastal properties. Located along Marin County’s dramatic coastline just north of San Francisco, this beach community offers both natural beauty and relative seclusion. The combination of limited developable land, strict building restrictions, and proximity to wealthy Bay Area communities creates persistent upward price pressure despite cyclical market fluctuations.
19. Malibu
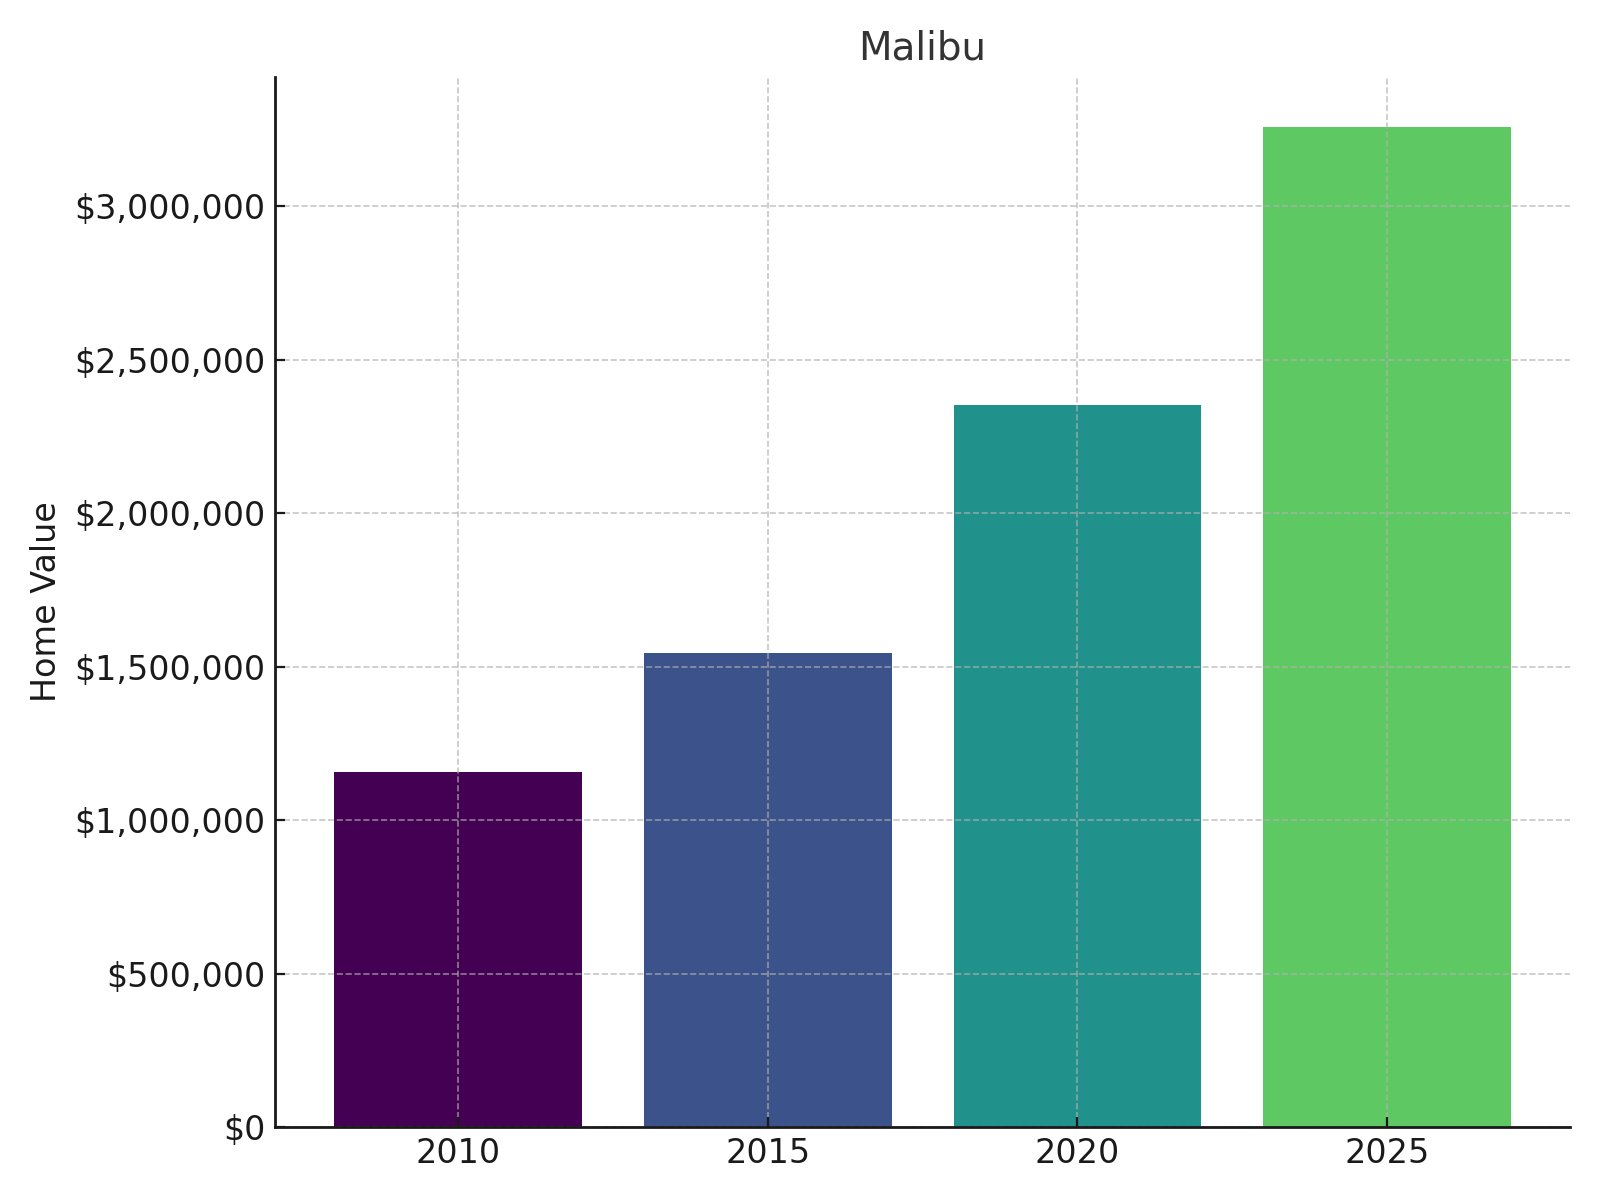
- 2025 Home Value: $3,258,546
- 2020 Home Value: $2,353,159
- 2015 Home Value: $1,545,679
- 2010 Home Value: $1,158,188
- 2020 to 2025 % Change: 38.48%
- 2015 to 2025 % Change: 110.82%
- 2010 to 2025 % Change: 181.35%
You’re looking at remarkable wealth creation in Malibu, where property values have nearly tripled over fifteen years, yielding a 181.35% return that few other investments could match. The acceleration continues with a robust 38.48% five-year growth rate since 2020, demonstrating resilient demand despite already premium valuations. Stretching along 21 miles of prime Pacific coastline northwest of Los Angeles, this iconic beach community blends celebrity cachet with natural beauty. The consistent appreciation reflects both the area’s global brand recognition and severe development constraints that create perpetual supply limitations in the face of international demand.
18. Stanford
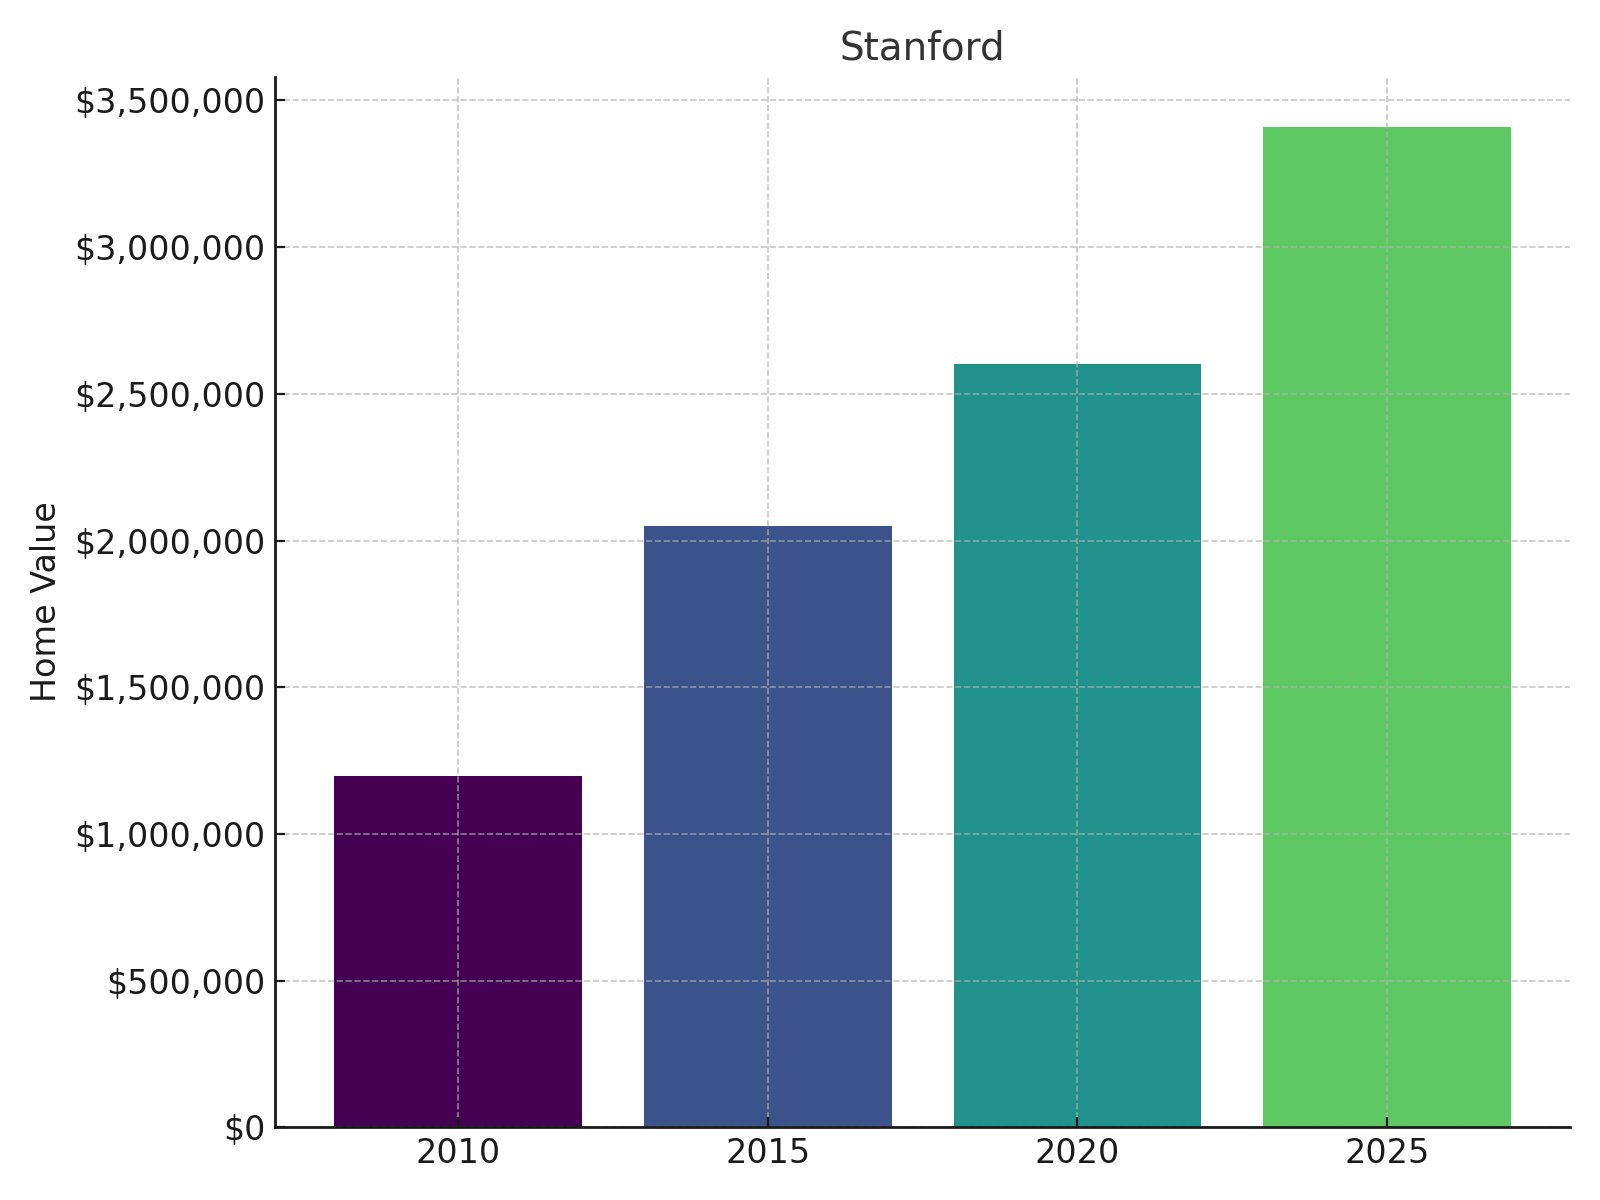
- 2025 Home Value: $3,410,457
- 2020 Home Value: $2,602,701
- 2015 Home Value: $2,050,138
- 2010 Home Value: $1,198,477
- 2020 to 2025 % Change: 31.04%
- 2015 to 2025 % Change: 66.35%
- 2010 to 2025 % Change: 184.57%
You’re observing powerful knowledge-economy wealth effects in Stanford, where property values have nearly tripled since 2010, yielding an impressive 184.57% return on investment. While the recent five-year growth of 31.04% shows some moderation, it still substantially outpaces inflation and most investment alternatives. Centered around Stanford University in the heart of Silicon Valley, this community combines academic prestige with proximity to venture capital and tech headquarters. The exceptional appreciation reflects both limited housing supply on university-controlled land and the area’s unique position at the intersection of education, research, and commercial innovation.
17. Newport Beach

- 2025 Home Value: $3,447,066
- 2020 Home Value: $2,037,903
- 2015 Home Value: $1,730,278
- 2010 Home Value: $1,323,989
- 2020 to 2025 % Change: 69.15%
- 2015 to 2025 % Change: 99.22%
- 2010 to 2025 % Change: 160.35%
You’re witnessing accelerating wealth accumulation in Newport Beach, where an extraordinary 69.15% five-year appreciation rate since 2020 demonstrates growing premium valuation for coastal luxury. The fifteen-year performance shows property values more than doubling with a 160.35% return that significantly outperforms traditional investment vehicles. This upscale coastal city in Orange County combines harbor-front properties with pristine beaches and an established luxury retail presence. The consistent appreciation reflects both limited development potential in an already built-out community and the area’s enduring appeal to high-net-worth individuals seeking California coastal prestige.
16. Del Mar

- 2025 Home Value: $3,544,020
- 2020 Home Value: $2,282,020
- 2015 Home Value: $1,935,231
- 2010 Home Value: $1,177,725
- 2020 to 2025 % Change: 55.30%
- 2015 to 2025 % Change: 83.13%
- 2010 to 2025 % Change: 200.92%
You’re looking at extraordinary capital appreciation in Del Mar, where property values have tripled since 2010, generating a remarkable 200.92% return that few investment vehicles could match. The recent five-year growth of 55.30% indicates continuing momentum rather than a plateau despite already premium valuations. This exclusive coastal village sits along two miles of pristine coastline in San Diego County, known for its historic racetrack and pedestrian-friendly downtown. The impressive price trajectory reflects both severe development constraints in a fully built-out community and persistent demand from affluent buyers seeking a rare combination of small-town atmosphere with world-class amenities.
15. Beverly Hills

- 2025 Home Value: $3,583,090
- 2020 Home Value: $3,398,921
- 2015 Home Value: $2,234,487
- 2010 Home Value: $1,559,154
- 2020 to 2025 % Change: 5.42%
- 2015 to 2025 % Change: 60.35%
- 2010 to 2025 % Change: 129.81%
You’re observing brand-driven value preservation in Beverly Hills, where long-term appreciation of 129.81% since 2010 demonstrates sustained demand despite more modest recent growth of just 5.42% over the past five years. This slower recent appreciation may signal a temporary plateau or market normalization after significant previous gains. Located in the heart of Los Angeles County, this globally recognized symbol of affluence combines historic estates with high-end retail corridors. The relative stability of values reflects both the area’s established luxury status and its role as a safe harbor for international wealth seeking recognizable prestige addresses.
14. Palo Alto
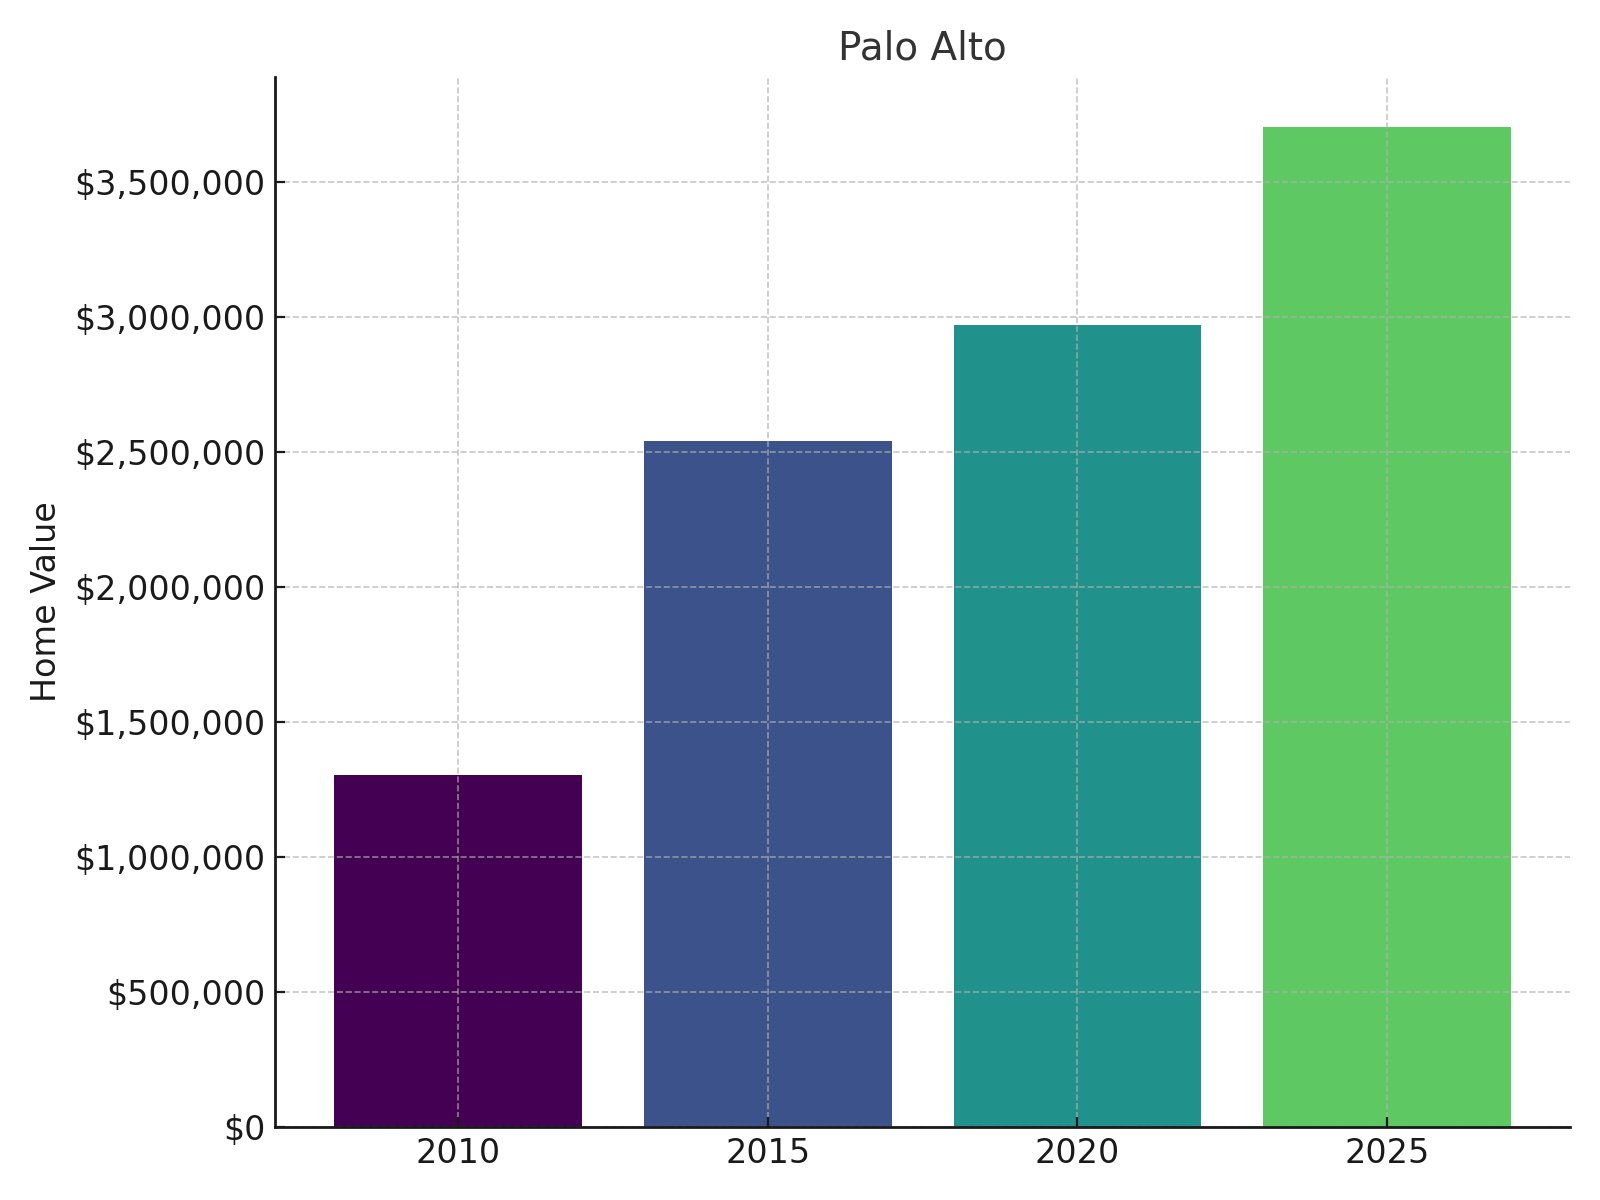
- 2025 Home Value: $3,704,698
- 2020 Home Value: $2,969,719
- 2015 Home Value: $2,540,416
- 2010 Home Value: $1,303,494
- 2020 to 2025 % Change: 24.75%
- 2015 to 2025 % Change: 45.83%
- 2010 to 2025 % Change: 184.21%
You’re witnessing tech-driven wealth creation in Palo Alto, where property values have nearly tripled since 2010, yielding an impressive 184.21% return despite moderating to 24.75% growth over the past five years. This strong but decelerating appreciation pattern suggests a maturing market finding a new equilibrium after extraordinary earlier gains. Located in the heart of Silicon Valley between Stanford University and tech headquarters, this community blends tree-lined residential neighborhoods with vibrant commercial districts. The consistent premium valuation reflects both exceptional public schools and the area’s status as a nerve center for venture capital and technology innovation.
13. Ross

🔥 Would you like to save this?
- 2025 Home Value: $3,713,236
- 2020 Home Value: $2,952,791
- 2015 Home Value: $2,569,256
- 2010 Home Value: $2,042,391
- 2020 to 2025 % Change: 25.75%
- 2015 to 2025 % Change: 44.53%
- 2010 to 2025 % Change: 81.81%
You’re looking at steady wealth preservation in Ross, where the 81.81% fifteen-year appreciation rate is below many peer communities but still substantially outperforms inflation and traditional investment vehicles. The consistent 25.75% five-year growth suggests sustainable appreciation rather than speculative momentum. Located in Marin County’s sought-after Ross Valley, this exclusive enclave combines estate-sized properties with exceptional privacy just minutes from San Francisco. The relatively moderate appreciation compared to other luxury communities reflects both already-premium starting values and the area’s established, multigenerational wealth profile that tends to yield more stable, less volatile price movements.
12. Woodside
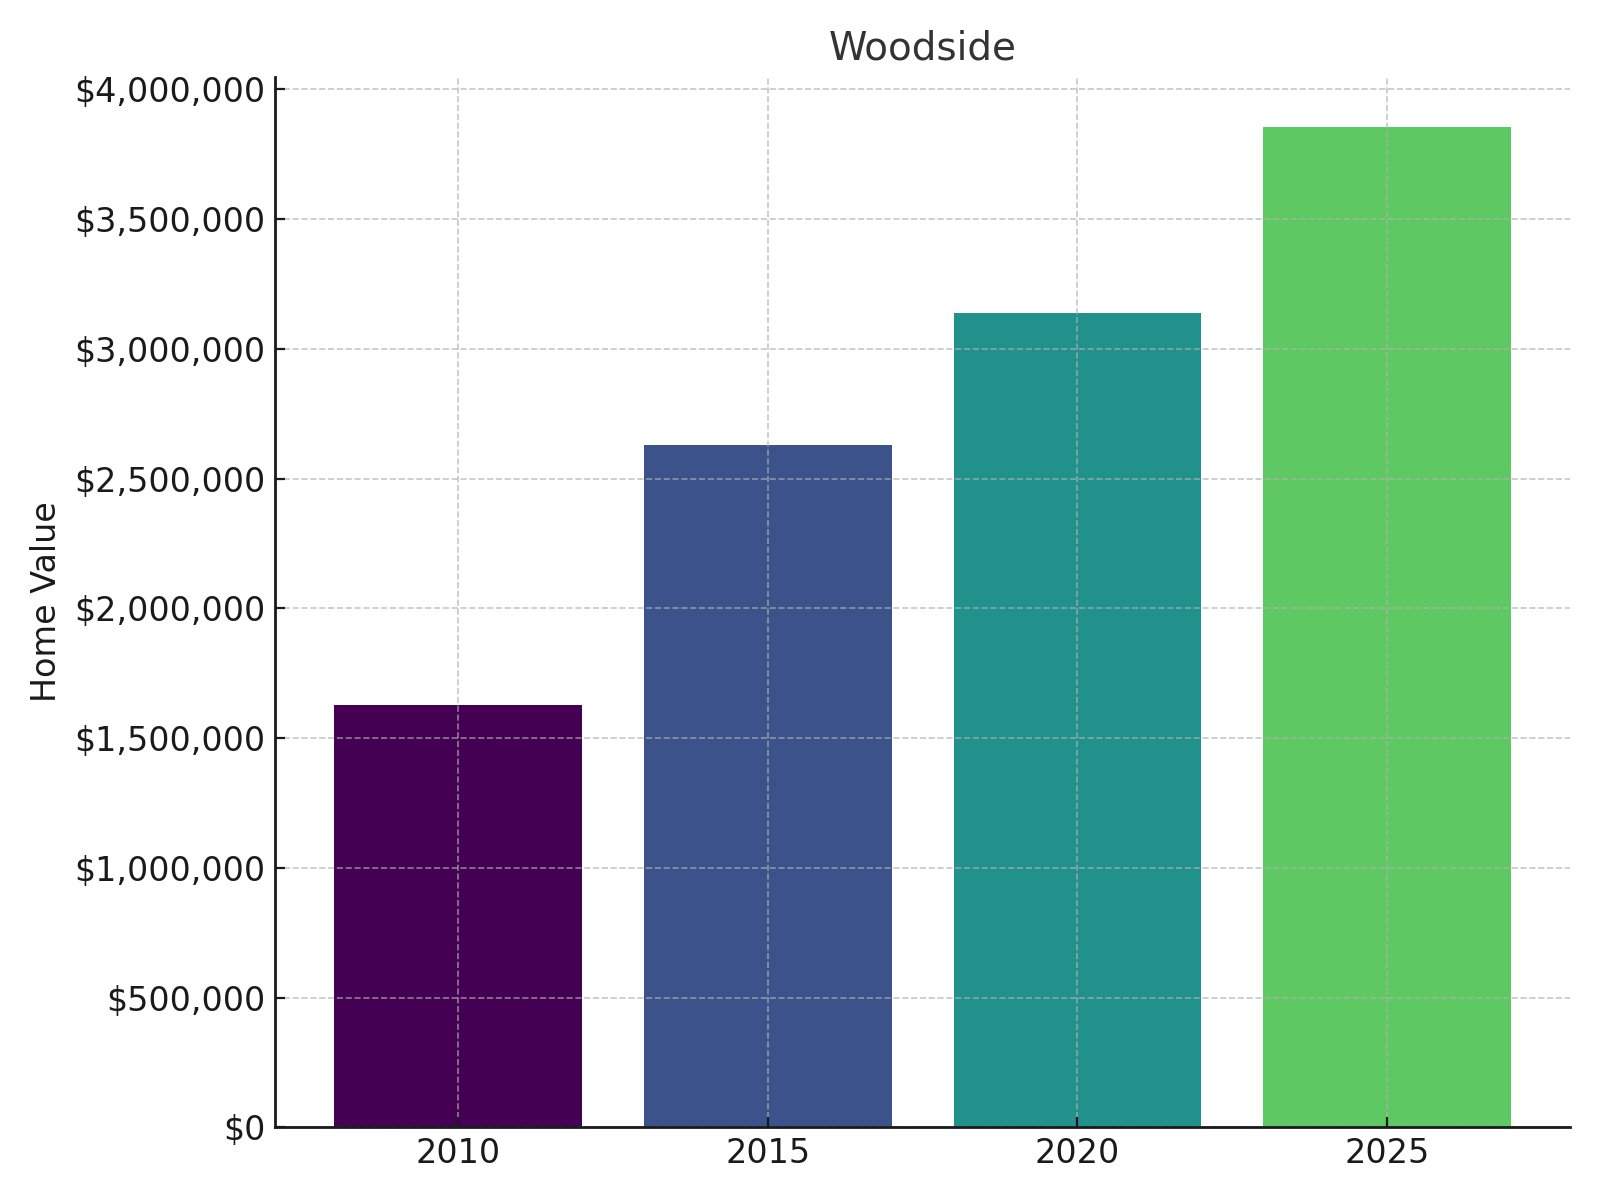
- 2025 Home Value: $3,855,985
- 2020 Home Value: $3,136,744
- 2015 Home Value: $2,628,728
- 2010 Home Value: $1,626,890
- 2020 to 2025 % Change: 22.93%
- 2015 to 2025 % Change: 46.69%
- 2010 to 2025 % Change: 137.02%
You’re observing significant wealth accumulation in Woodside, where property values have more than doubled since 2010, delivering a 137.02% return that outpaces most traditional investments. The more moderate recent five-year growth of 22.93% suggests a market finding equilibrium after earlier dramatic gains. Nestled in the western foothills of Silicon Valley, this equestrian community combines estate-sized properties with preserved open space and rural character. The continued price appreciation reflects both the area’s popularity among tech executives and venture capitalists and its strict zoning requirements that maintain minimum lot sizes and limit development density.
11. Portola Valley

- 2025 Home Value: $4,120,632
- 2020 Home Value: $3,311,139
- 2015 Home Value: $2,964,596
- 2010 Home Value: $2,017,686
- 2020 to 2025 % Change: 24.45%
- 2015 to 2025 % Change: 38.99%
- 2010 to 2025 % Change: 104.23%
You’re witnessing steady capital appreciation in Portola Valley, where property values have precisely doubled over fifteen years, generating a 104.23% return that significantly outperforms inflation and many alternative investments. The consistent but moderate 24.45% growth since 2020 suggests sustainable appreciation rather than speculative momentum. Located along the eastern slopes of the Santa Cruz Mountains in San Mateo County, this community combines rural character with proximity to Silicon Valley employment centers. The area’s commitment to environmental preservation, minimum one-acre zoning, and trail networks creates a persistent premium valuation despite cyclical market fluctuations.
10. Saratoga
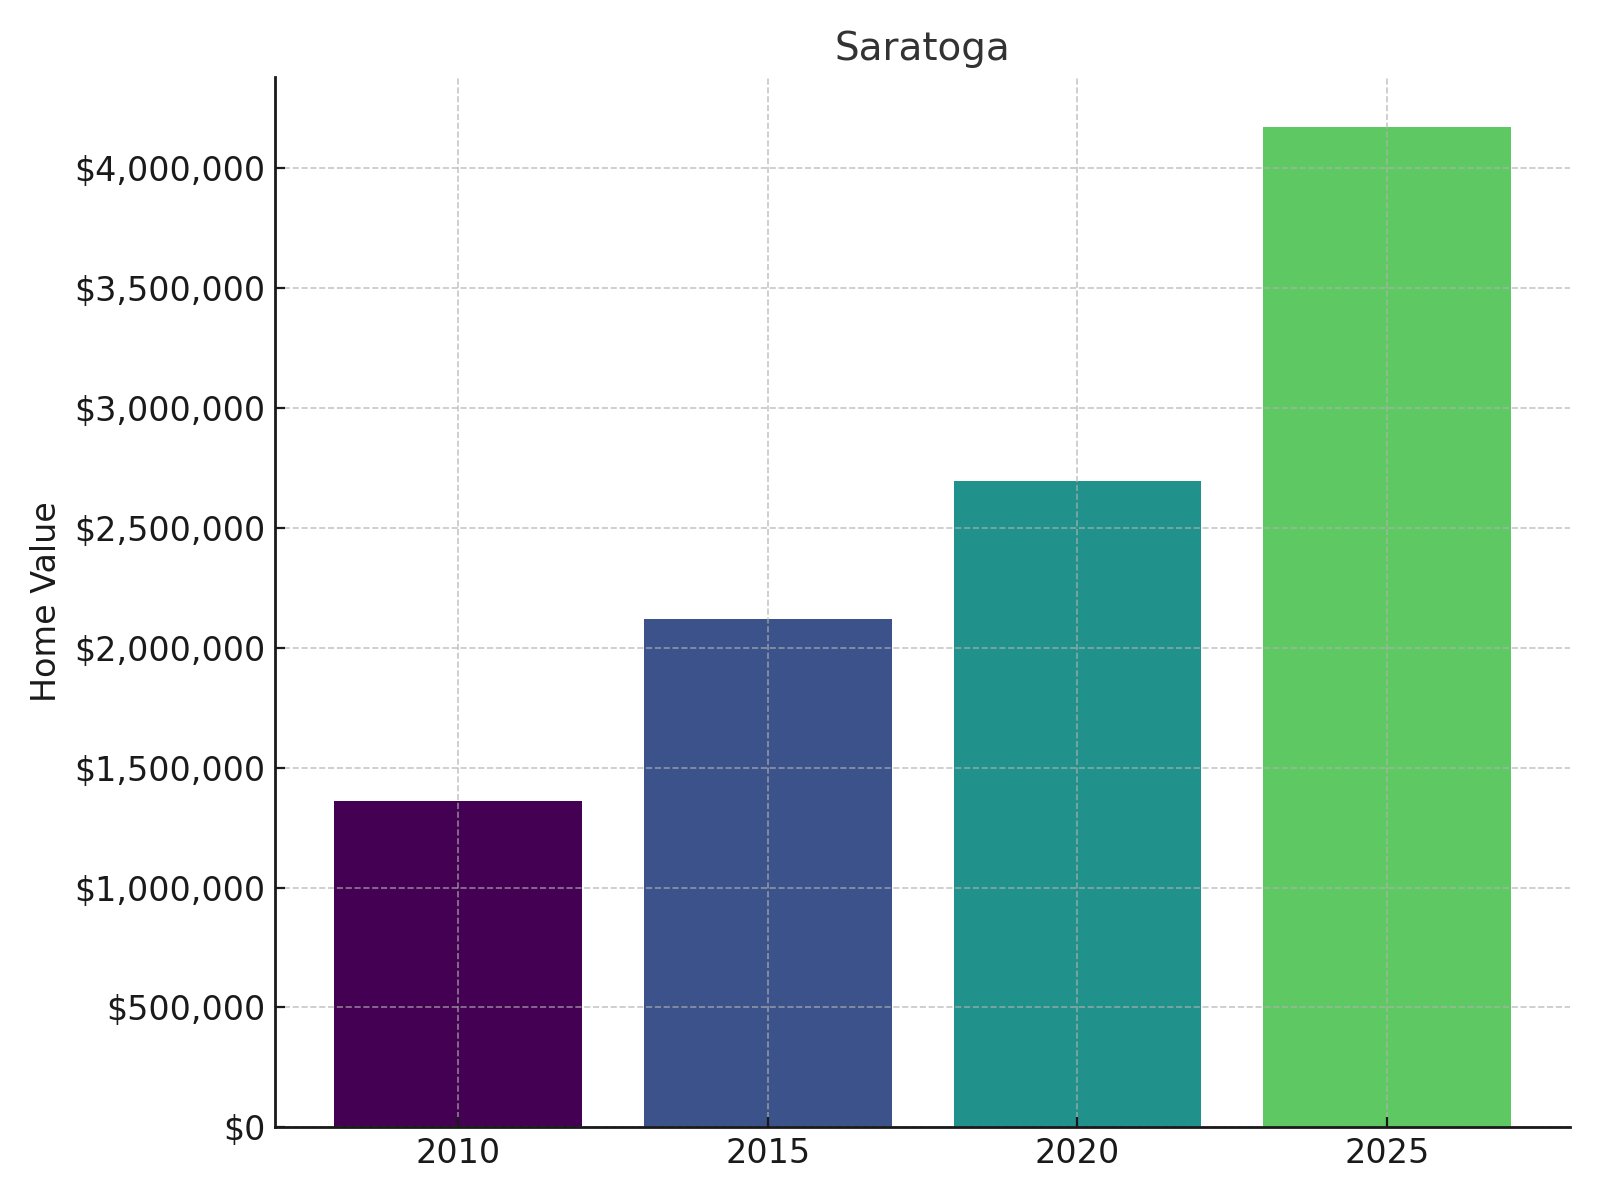
- 2025 Home Value: $4,173,535
- 2020 Home Value: $2,697,432
- 2015 Home Value: $2,119,788
- 2010 Home Value: $1,362,896
- 2020 to 2025 % Change: 54.72%
- 2015 to 2025 % Change: 96.88%
- 2010 to 2025 % Change: 206.23%
You’re observing extraordinary wealth creation in Saratoga, where property values have more than tripled since 2010, yielding a spectacular 206.23% fifteen-year return that few investment vehicles could match. The recent acceleration to 54.72% growth over just five years indicates intensifying demand rather than market saturation. Nestled in the western foothills of Silicon Valley, this affluent community combines award-winning schools with estate-sized properties and a walkable downtown village. The exceptional appreciation reflects both proximity to tech employment centers and the town’s carefully preserved semi-rural character that creates persistent housing scarcity in the face of strong demand.
9. Rancho Santa Fe

- 2025 Home Value: $4,296,467
- 2020 Home Value: $2,406,630
- 2015 Home Value: $2,277,190
- 2010 Home Value: $1,806,878
- 2020 to 2025 % Change: 78.53%
- 2015 to 2025 % Change: 88.67%
- 2010 to 2025 % Change: 137.78%
You’re witnessing dramatic recent acceleration in Rancho Santa Fe, where an extraordinary 78.53% five-year growth rate signals intensifying demand and a potential market rerating. The overall fifteen-year appreciation of 137.78% translates to consistently strong returns that have significantly outpaced inflation and most traditional investments. Located inland from Del Mar in San Diego County, this exclusive enclave features covenant-protected large estates with equestrian facilities and golf course frontage. The recent price surge likely reflects both pandemic-driven demand for larger properties and the community’s appeal to affluent remote workers seeking privacy, space, and year-round outdoor lifestyle.
8. Monte Sereno

- 2025 Home Value: $4,344,609
- 2020 Home Value: $2,970,957
- 2015 Home Value: $2,491,955
- 2010 Home Value: $1,568,445
- 2020 to 2025 % Change: 46.24%
- 2015 to 2025 % Change: 74.35%
- 2010 to 2025 % Change: 177.00%
You’re looking at robust wealth creation in Monte Sereno, where property values have nearly tripled since 2010, generating an impressive 177.00% return that few alternative investments could match. The recent five-year growth of 46.24% demonstrates continuing strong momentum despite already premium valuations. This tiny residential enclave borders Los Gatos in Santa Clara County, offering minimum half-acre lots within commuting distance to Silicon Valley headquarters. The exceptional price appreciation reflects both the community’s strict residential-only zoning (no commercial properties) and its proximity to both tech employment centers and preserved open space—a combination that creates persistent demand among high-income professionals.
7. Belvedere

- 2025 Home Value: $4,411,596
- 2020 Home Value: $3,620,913
- 2015 Home Value: $3,192,269
- 2010 Home Value: $2,251,950
- 2020 to 2025 % Change: 21.84%
- 2015 to 2025 % Change: 38.20%
- 2010 to 2025 % Change: 95.90%
You’re observing steady wealth preservation in Belvedere, where property values have nearly doubled since 2010, yielding a solid 95.90% return despite more modest 21.84% growth over the past five years. This pattern suggests a stable luxury market rather than speculative momentum, with prices growing above inflation but below many peer communities. Located on a tiny peninsula in Marin County with panoramic San Francisco Bay views, this exclusive island community offers unmatched waterfront settings minutes from the city. The relatively moderate appreciation reflects both already-premium starting values and the physical constraints of an essentially built-out community with no remaining development potential.
6. Los Altos

- 2025 Home Value: $4,561,271
- 2020 Home Value: $3,211,322
- 2015 Home Value: $2,518,812
- 2010 Home Value: $1,435,314
- 2020 to 2025 % Change: 42.04%
- 2015 to 2025 % Change: 81.09%
- 2010 to 2025 % Change: 217.79%
You’re witnessing exceptional wealth generation in Los Altos, where property values have more than tripled since 2010, delivering an extraordinary 217.79% return that outperforms virtually all traditional investment vehicles. The strong 42.04% five-year growth rate demonstrates continuing momentum despite already premium valuations. Located in the heart of Silicon Valley between Palo Alto and Cupertino, this community combines walkable downtown charm with tree-lined residential streets and top-rated schools. The remarkable price trajectory reflects both proximity to major tech employers and the town’s strict residential zoning that maintains its village character while creating persistent housing scarcity in an area of intense demand.
5. Hidden Hills

- 2025 Home Value: $5,042,983
- 2020 Home Value: $3,347,867
- 2015 Home Value: $2,202,122
- 2010 Home Value: $1,705,579
- 2020 to 2025 % Change: 50.63%
- 2015 to 2025 % Change: 129.01%
- 2010 to 2025 % Change: 195.68%
You’re looking at spectacular wealth accumulation in Hidden Hills, where property values have nearly tripled since 2010, yielding an exceptional 195.68% return that few investment alternatives could match. The recent five-year surge of 50.63% signals increasing premium valuation rather than market saturation despite already elevated prices. This gated community in the western San Fernando Valley of Los Angeles County offers estate-sized equestrian properties with complete privacy and security. The dramatic price appreciation reflects both the area’s popularity among celebrities and high-net-worth individuals and its strictly controlled development that maintains minimum lot sizes and rural character despite proximity to urban amenities.
4. Hillsborough
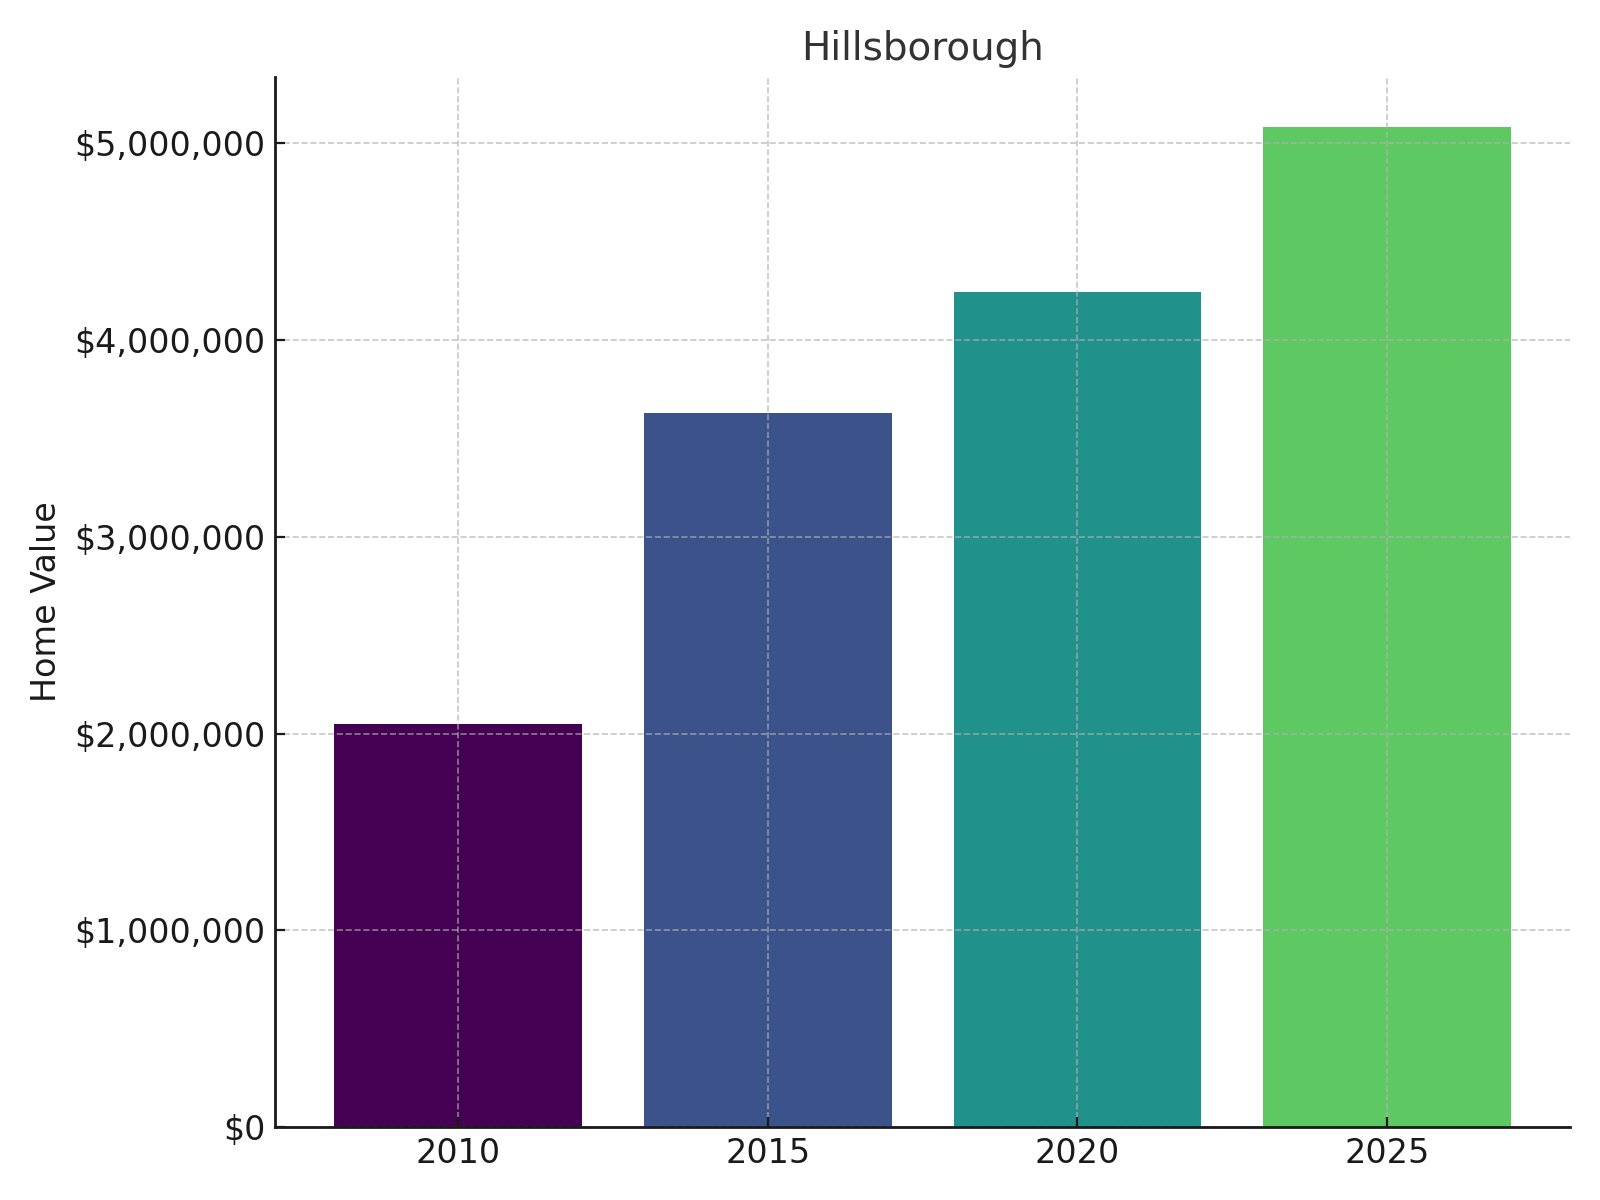
- 2025 Home Value: $5,082,261
- 2020 Home Value: $4,242,987
- 2015 Home Value: $3,629,968
- 2010 Home Value: $2,048,430
- 2020 to 2025 % Change: 19.78%
- 2015 to 2025 % Change: 40.01%
- 2010 to 2025 % Change: 148.11%
You’re observing substantial wealth preservation in Hillsborough, where property values have nearly two-and-a-half times since 2010, generating a robust 148.11% return despite more modest recent growth of 19.78% over the past five years. This pattern suggests market maturity rather than speculative momentum in an already premium community. Located on the San Francisco Peninsula between San Mateo and Burlingame, this exclusive enclave mandates minimum lot sizes of half an acre and prohibits commercial zoning entirely. The relatively moderate recent appreciation reflects both already-elevated starting values and the community’s established wealth profile that tends to yield more stable, less volatile price patterns than emerging luxury markets.
3. Montecito

- 2025 Home Value: $5,166,843
- 2020 Home Value: $2,900,042
- 2015 Home Value: $2,746,009
- 2010 Home Value: $2,075,329
- 2020 to 2025 % Change: 78.16%
- 2015 to 2025 % Change: 88.16%
- 2010 to 2025 % Change: 148.97%
You’re witnessing dramatic recent acceleration in Montecito, where an extraordinary 78.16% five-year growth rate signals a potential market rerating and intensifying premium valuation. The fifteen-year appreciation of 148.97% represents consistent outperformance relative to inflation and most traditional investments. Located just east of Santa Barbara along California’s Central Coast, this celebrity-favored enclave offers estate-sized properties with ocean and mountain views in a Mediterranean climate. The recent price surge likely reflects both pandemic-driven migration from urban centers and the community’s appeal to affluent remote workers seeking privacy, natural beauty, and year-round outdoor lifestyle in a community with established cultural amenities.
2. Los Altos Hills

- 2025 Home Value: $6,053,387
- 2020 Home Value: $4,495,921
- 2015 Home Value: $3,855,481
- 2010 Home Value: $2,519,036
- 2020 to 2025 % Change: 34.64%
- 2015 to 2025 % Change: 57.01%
- 2010 to 2025 % Change: 140.31%
You’re observing substantial wealth generation in Los Altos Hills, where property values have more than doubled since 2010, yielding a robust 140.31% return despite more moderate 34.64% growth over the past five years. This pattern suggests market maturation rather than speculative momentum at these ultra-premium price points. Perched in the foothills above Silicon Valley, this exclusive community maintains a rural character through strict one-acre minimum lot requirements and prohibitions on commercial development. The price appreciation reflects both proximity to tech wealth creation centers and the community’s commitment to preserving large lots, equestrian trails, and natural open spaces that create persistent scarcity value despite cyclical market fluctuations.
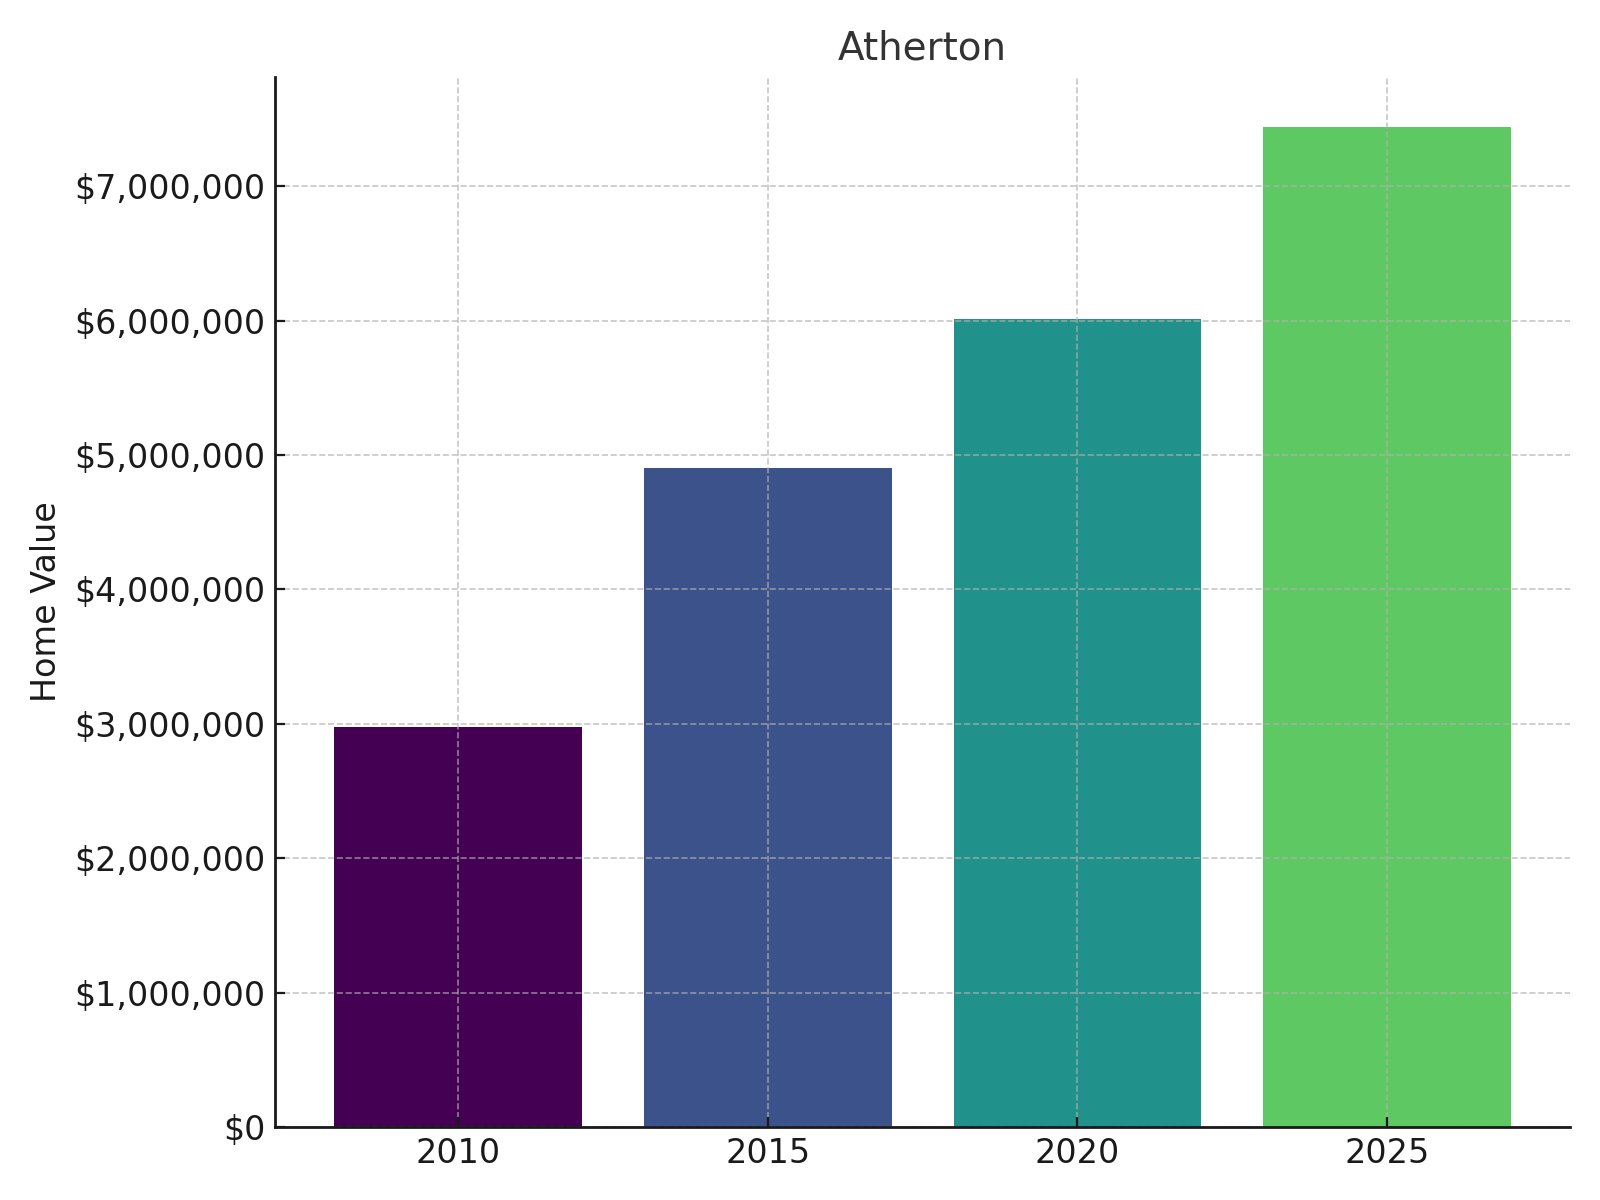
1. Atherton
🔥 Would you like to save this?
- 2025 Home Value: $7,442,216
- 2020 Home Value: $6,012,236
- 2015 Home Value: $4,900,034
- 2010 Home Value: $2,979,216
- 2020 to 2025 % Change: 23.78%
- 2015 to 2025 % Change: 51.88%
- 2010 to 2025 % Change: 149.80%
You’re looking at California’s financial pinnacle in Atherton, where average home values approach $7.5 million after nearly 150% appreciation since 2010—a remarkable financial trajectory despite more moderate 23.78% growth over the past five years. This pattern suggests price stabilization at ultra-premium levels rather than market weakness. Located in the heart of Silicon Valley between Menlo Park and Redwood City, this ultra-exclusive enclave mandates minimum lot sizes of one acre and maintains a strictly residential character. The extraordinary valuation reflects both proximity to tech wealth generation and venture capital centers and the community’s commitment to preserving estate-sized properties that create extreme scarcity value in one of the world’s most economically dynamic regions.


