Would you like to save this?
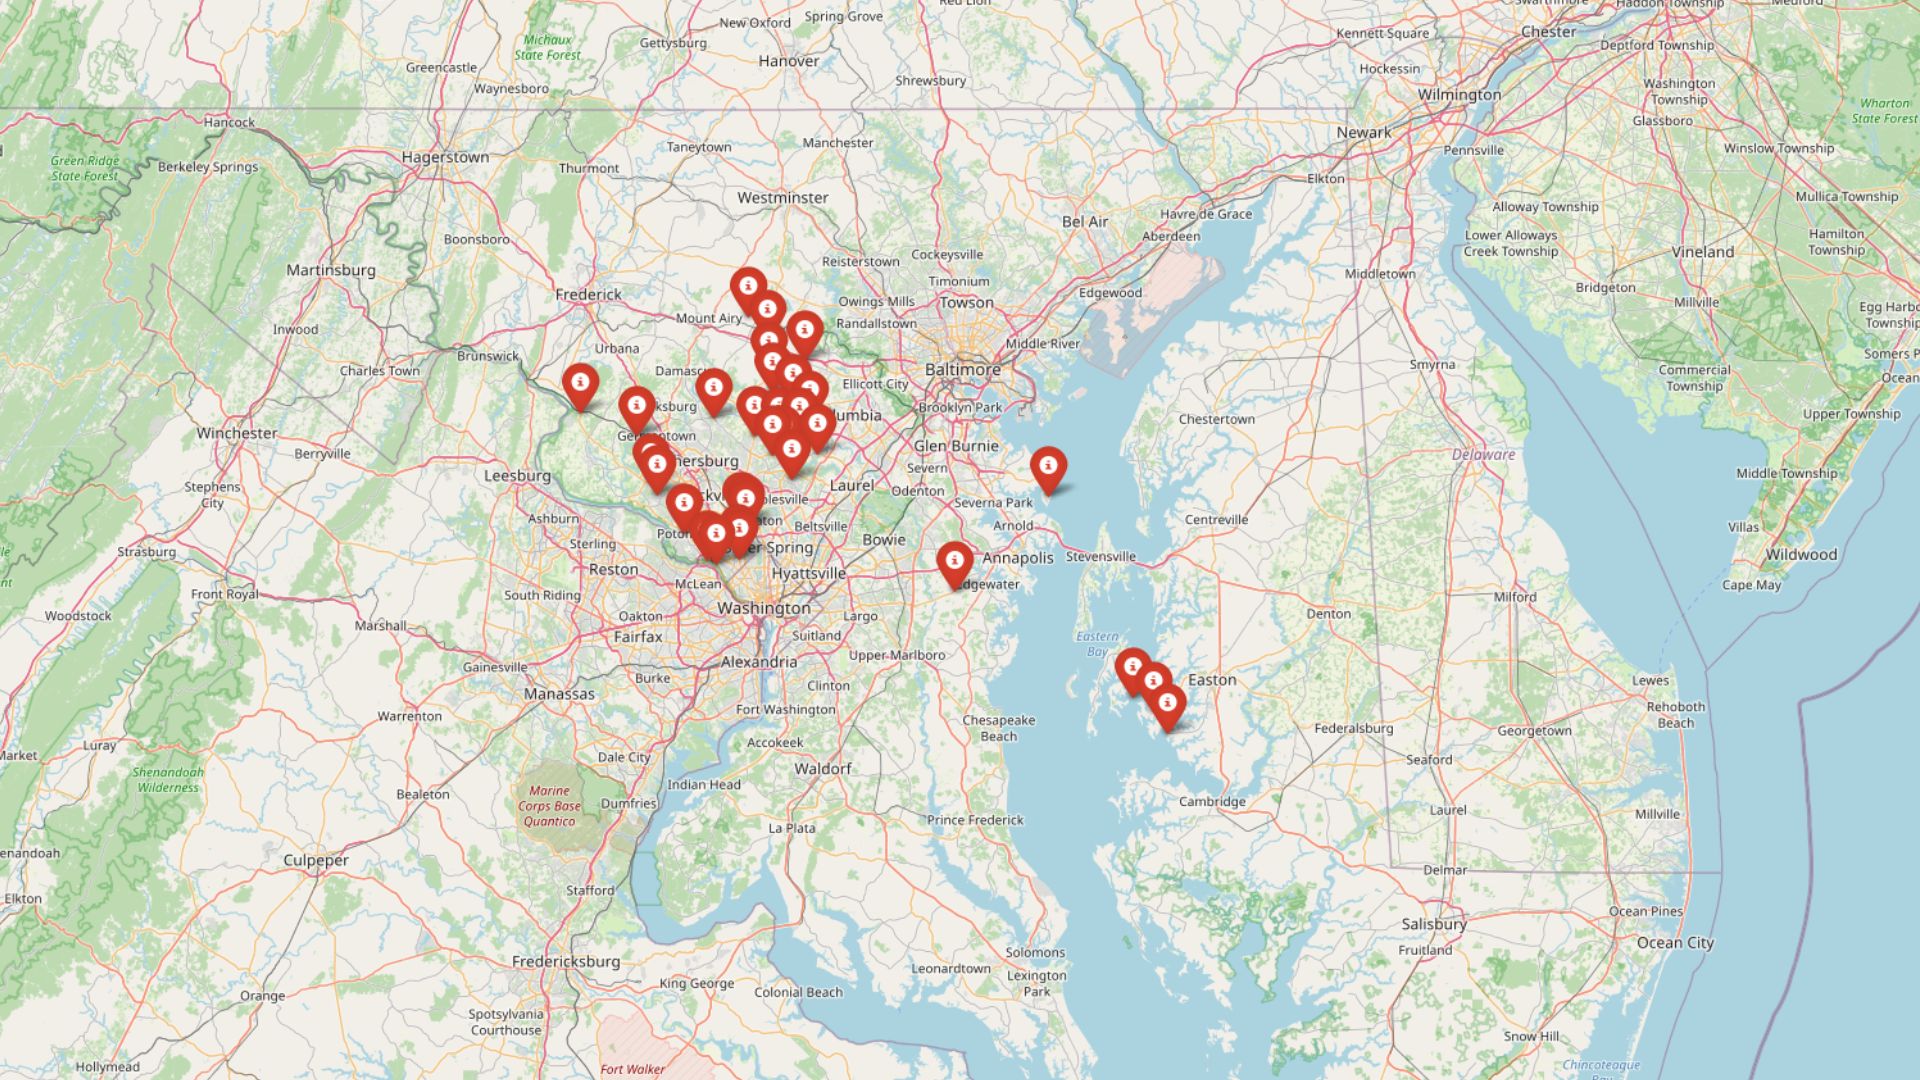
Affluent neighborhoods aren’t hard to find in Maryland—but affording one might be. The Zillow Home Value Index reveals how property prices across the state have soared, especially in small towns where luxury isn’t optional—it’s the price tag. From classic prestige enclaves to up-and-coming communities that’ve seen sharp price jumps in recent years, these 32 towns show where buyers now need deep pockets just to compete. Whether you’re dreaming of a waterfront escape or stuck window shopping, this list tracks exactly where Maryland’s home values are peaking.
32. Dickerson – 53% Home Price Increase Since 2010
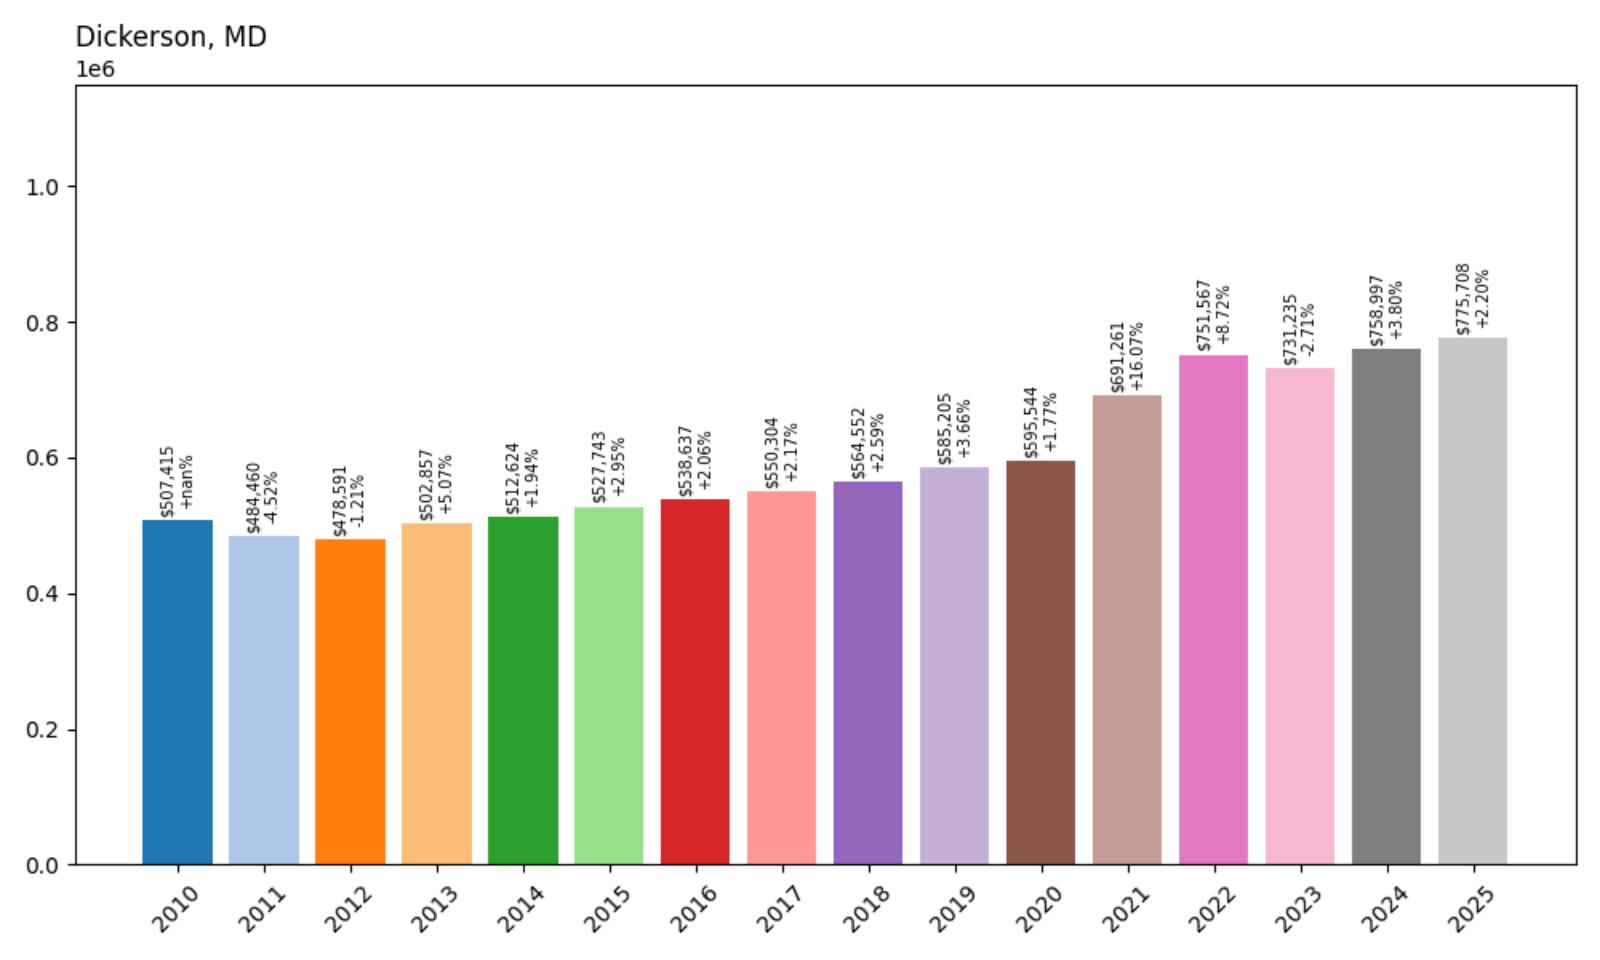
- 2010: $507,415
- 2011: $484,460
- 2012: $478,591
- 2013: $502,857
- 2014: $512,624
- 2015: $527,743
- 2016: $538,637
- 2017: $550,304
- 2018: $564,552
- 2019: $585,205
- 2020: $595,544
- 2021: $691,261
- 2022: $751,567
- 2023: $731,235
- 2024: $758,997
- 2025: $775,708
Home values in Dickerson have climbed from just over $507K in 2010 to $775K by mid-2025. The largest jumps came in 2021 and 2022, followed by smaller, steadier gains. Though not as pricey as some other Maryland towns, Dickerson’s market has shown a strong long-term upward trend.
Dickerson – Rural Tranquility With Rising Demand
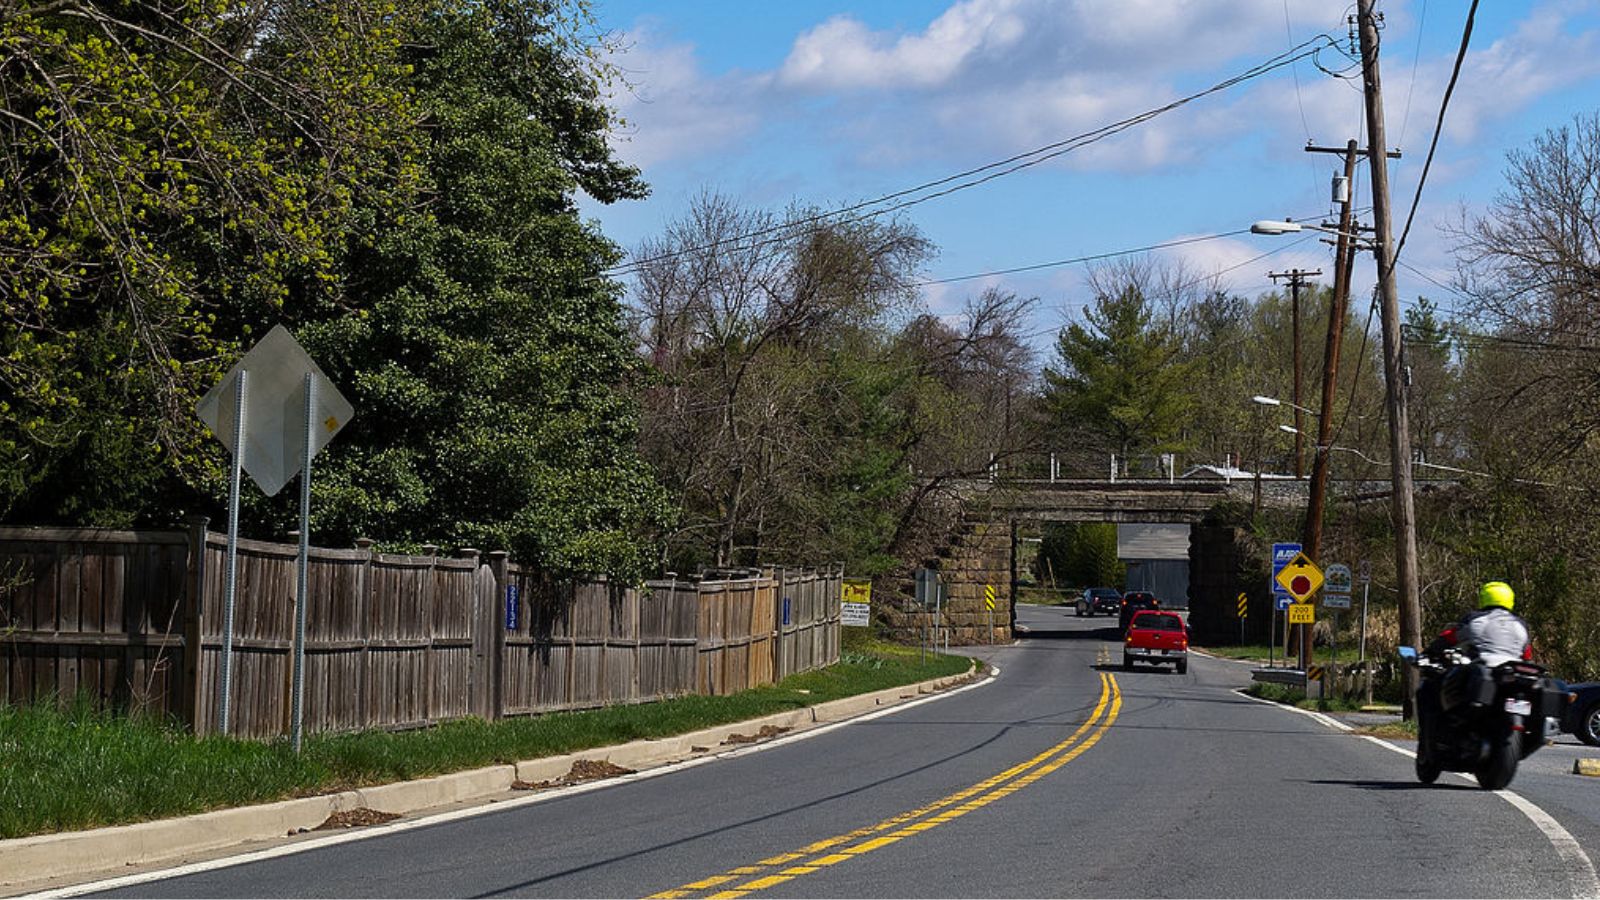
Bonnachoven, CC0, via Wikimedia Commons
Located in western Montgomery County near the Potomac River, Dickerson offers a more rural lifestyle than most towns on this list. It appeals to buyers looking for privacy, large lots, and proximity to the C&O Canal National Historical Park. With Washington, D.C. still within commuting distance, it’s no surprise demand has grown in recent years.
While the town’s home prices dipped slightly in 2023, they quickly rebounded in 2024 and 2025. That volatility may reflect the limited number of homes available rather than broad economic trends. Either way, Dickerson remains one of Maryland’s most expensive country-living options.
31. Spencerville – 32% Home Price Increase Since 2010
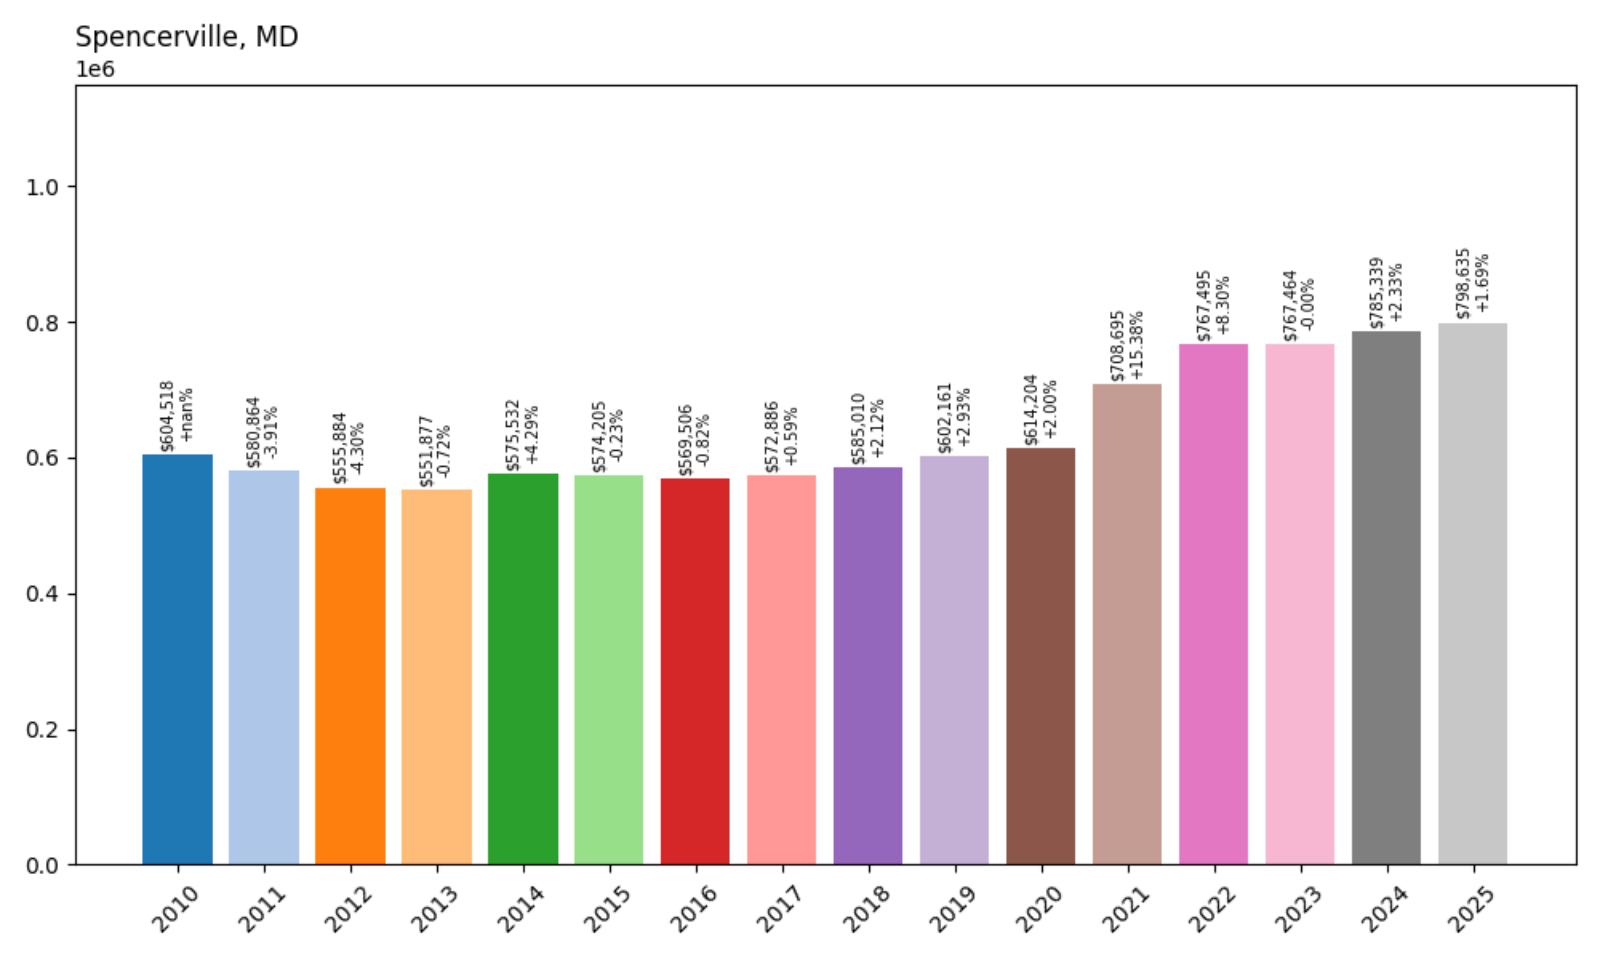
- 2010: $604,518
- 2011: $580,864
- 2012: $555,884
- 2013: $551,877
- 2014: $575,532
- 2015: $574,205
- 2016: $569,506
- 2017: $572,886
- 2018: $585,010
- 2019: $602,161
- 2020: $614,204
- 2021: $708,695
- 2022: $767,495
- 2023: $767,464
- 2024: $785,339
- 2025: $798,635
Spencerville’s home values have risen moderately but steadily since 2010, with a sharp rise during the 2021–2022 boom. While recent years have shown slower growth, prices remain well above pre-pandemic levels. As of 2025, the median price sits just under $800K.
Spencerville – Quiet Community, Steady Appreciation
Spencerville is a small residential pocket in Montgomery County, offering tree-lined streets and easy access to both Olney and Silver Spring. It’s favored by buyers who want suburban calm but still need access to urban centers. The area’s schools and green space have helped sustain demand.
Home values didn’t fluctuate much in 2023, holding steady before ticking up again in 2024 and 2025. That kind of consistent growth suggests stability rather than speculative spikes. It’s a town that tends to reward long-term owners.
30. Woodbine – 61% Home Price Increase Since 2010

- 2010: $503,439
- 2011: $486,912
- 2012: $486,932
- 2013: $506,655
- 2014: $529,352
- 2015: $533,896
- 2016: $545,169
- 2017: $558,487
- 2018: $574,148
- 2019: $588,865
- 2020: $595,623
- 2021: $686,673
- 2022: $754,484
- 2023: $759,949
- 2024: $803,086
- 2025: $812,089
Woodbine homes have gained over $300K in value since 2010, with major growth after 2020. The biggest price increases occurred between 2020 and 2022, reflecting broader market surges. Price growth has cooled slightly since, but remains positive.
Woodbine – Room to Grow in Carroll and Howard Counties
Would you like to save this?
Straddling the line between Carroll and Howard counties, Woodbine offers a mix of open farmland, new construction, and suburban-style development. It’s become popular with families looking for space and lower density than other parts of the region. The town has seen significant residential growth in the past decade.
While home values dropped during the early 2010s, they began rising again by 2013 and never looked back. With 2025 prices above $800K, Woodbine is now one of central Maryland’s most expensive areas outside the D.C. Beltway.
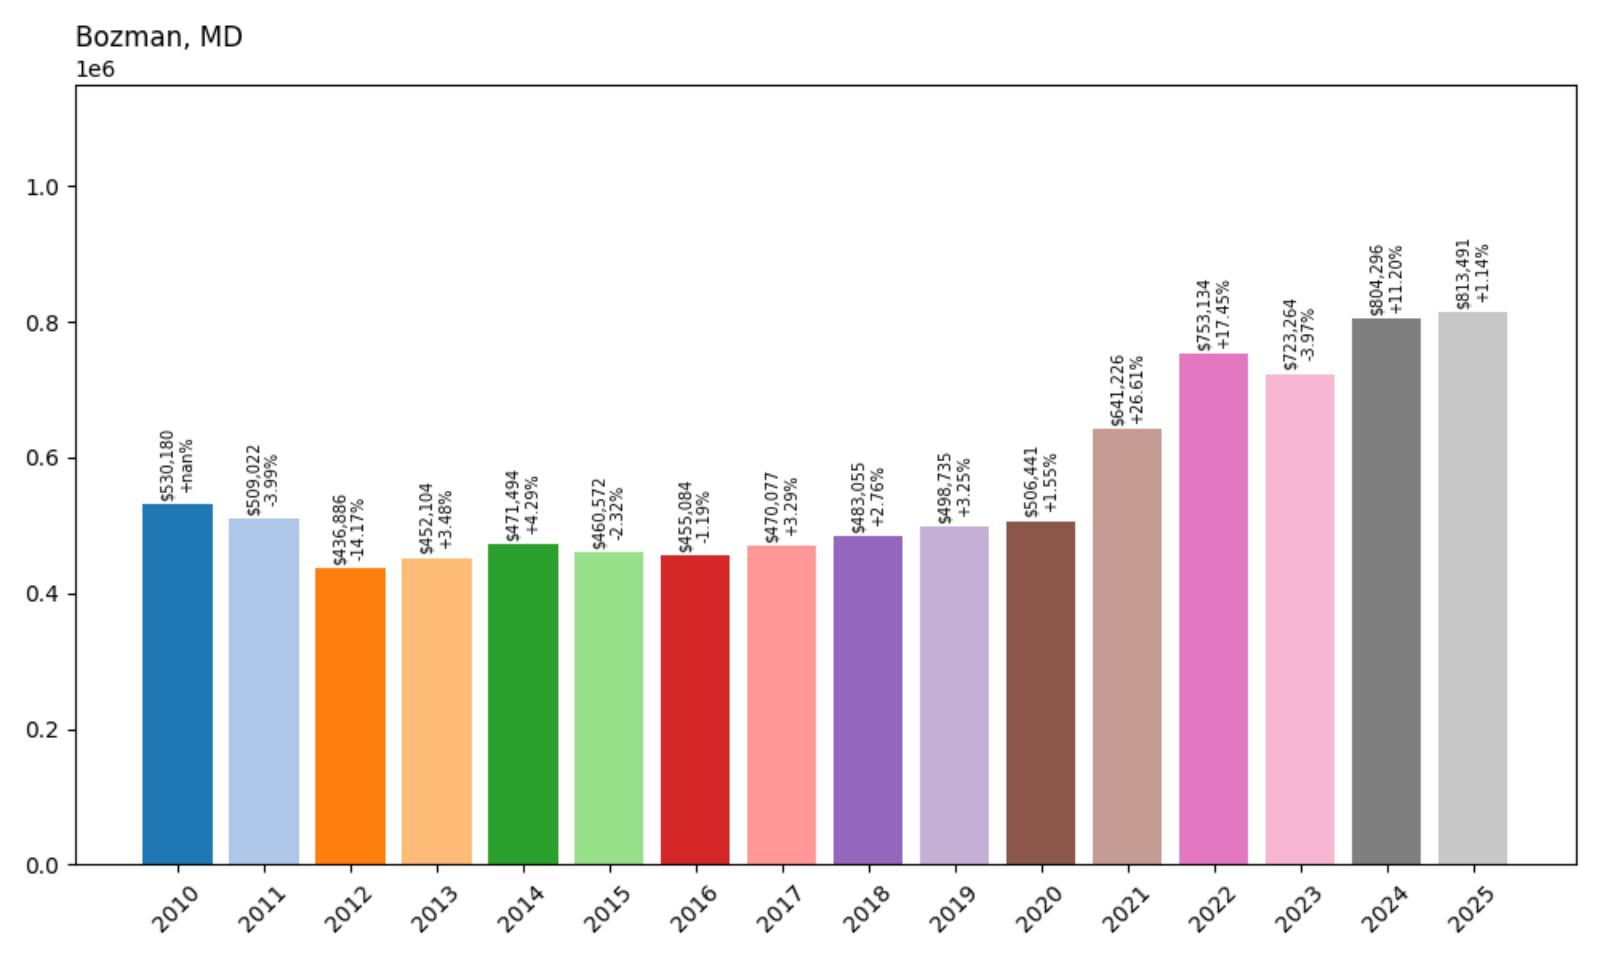
29. Bozman – 53% Home Price Increase Since 2010
- 2010: $530,180
- 2011: $509,022
- 2012: $436,886
- 2013: $452,104
- 2014: $471,494
- 2015: $460,572
- 2016: $455,084
- 2017: $470,077
- 2018: $483,055
- 2019: $498,735
- 2020: $506,441
- 2021: $641,226
- 2022: $753,134
- 2023: $723,264
- 2024: $804,296
- 2025: $813,491
Bozman’s housing market has nearly recovered from early 2010s losses, with current prices topping $813K. Most of the appreciation happened after 2020, during a period of intense market activity across the Eastern Shore. Price momentum has stayed strong into 2025.
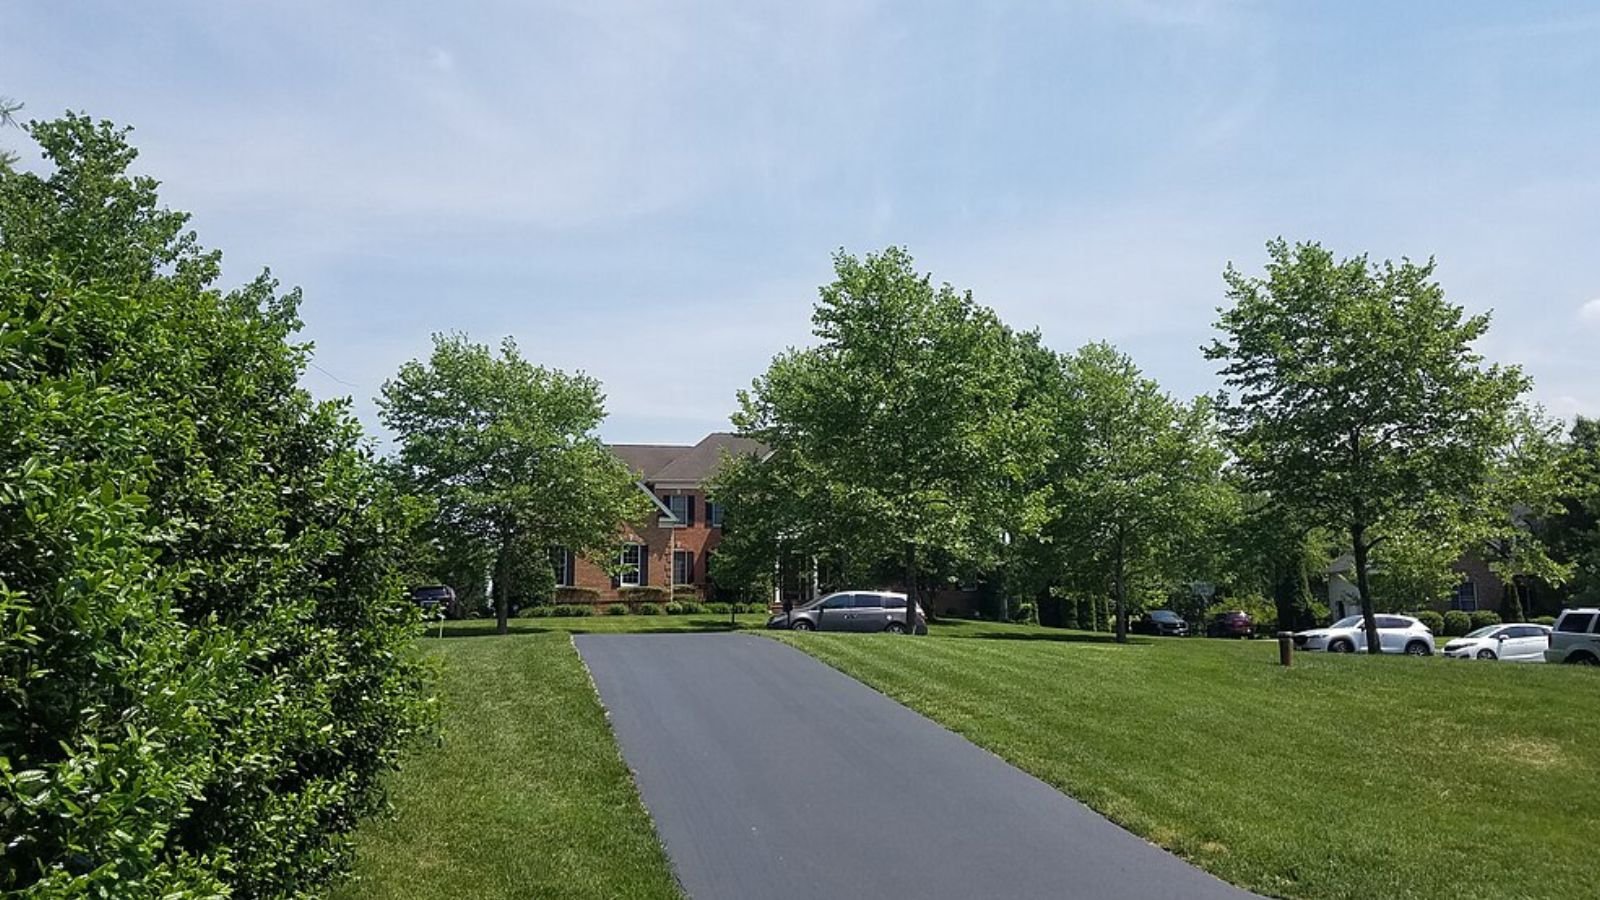
Bozman – Eastern Shore Elegance by the Water
Located in Talbot County near St. Michaels, Bozman is a peaceful waterfront village that’s long appealed to second-home buyers and retirees. Its setting along the Chesapeake Bay gives it unique appeal for those seeking access to boating and serene views. The small population keeps inventory low, which helps drive up values.
The town’s prices took a hit during the early 2010s but began rising steadily after 2016. A spike in interest during the pandemic real estate rush pushed values over $750K by 2022. Prices have since leveled off slightly but remain among the highest on the Shore.
28. Brookeville – 44% Home Price Increase Since 2010
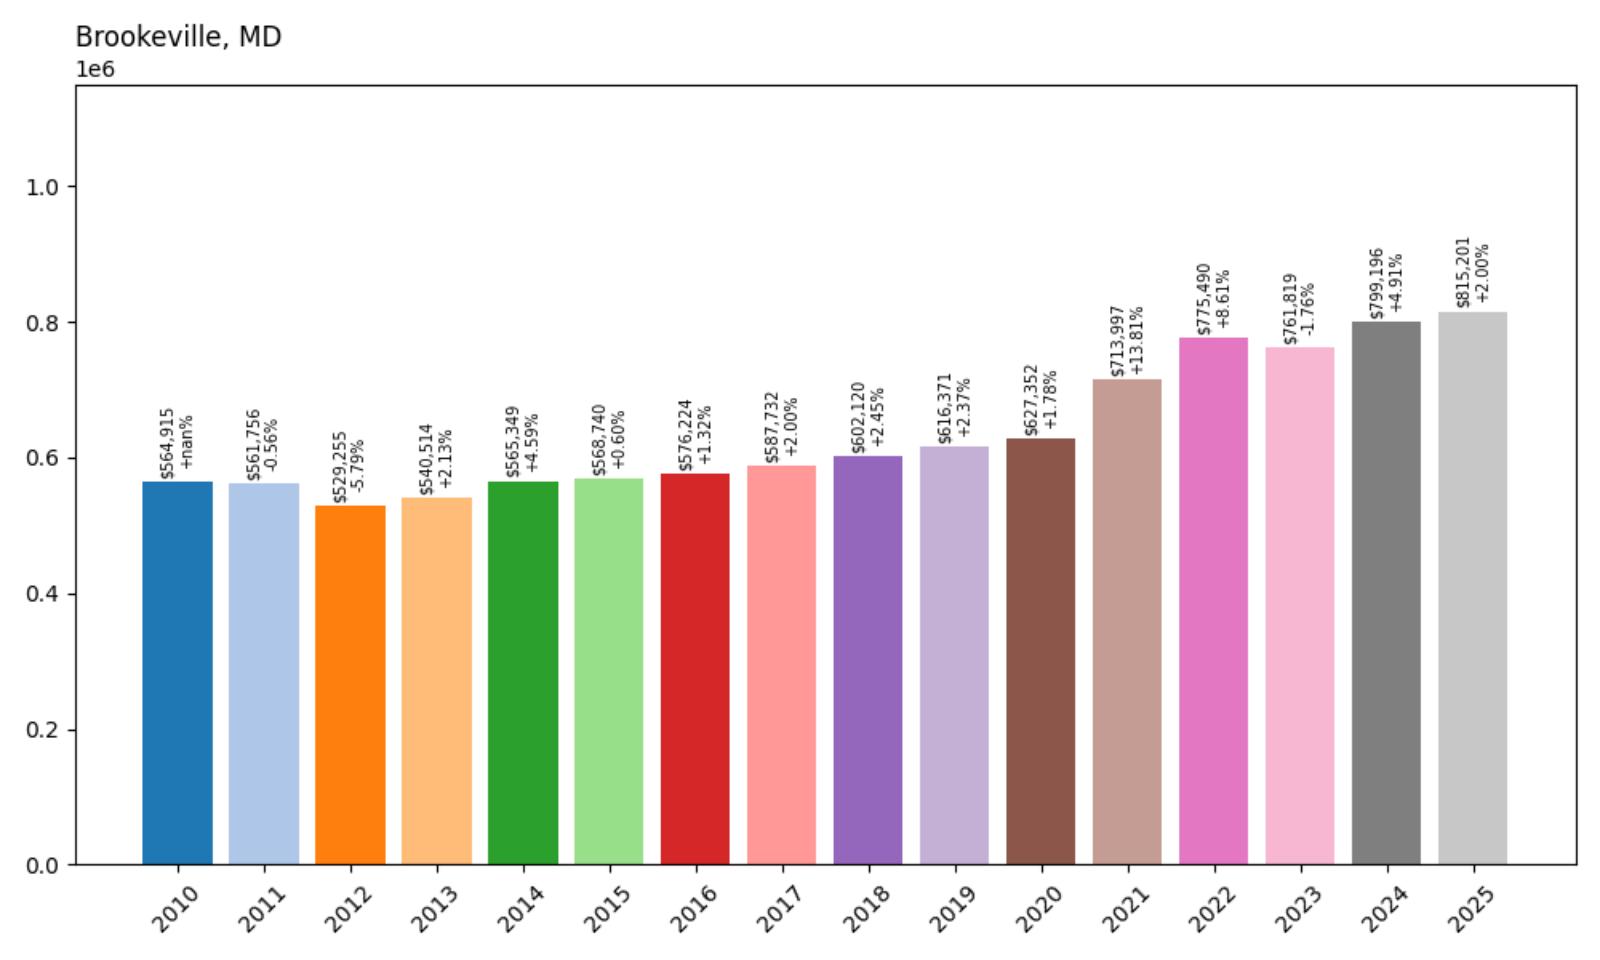
- 2010: $564,915
- 2011: $561,756
- 2012: $529,255
- 2013: $540,514
- 2014: $565,349
- 2015: $568,740
- 2016: $576,224
- 2017: $587,732
- 2018: $602,120
- 2019: $616,371
- 2020: $627,352
- 2021: $713,997
- 2022: $775,490
- 2023: $761,819
- 2024: $799,196
- 2025: $815,201
Brookeville has seen consistent growth, with a sharp bump during the 2021–2022 boom. Despite a minor dip in 2023, prices climbed back up through 2025. The town’s historic charm and quiet setting continue to attract higher-end buyers.
Brookeville – Historic Charm With Modern Appeal
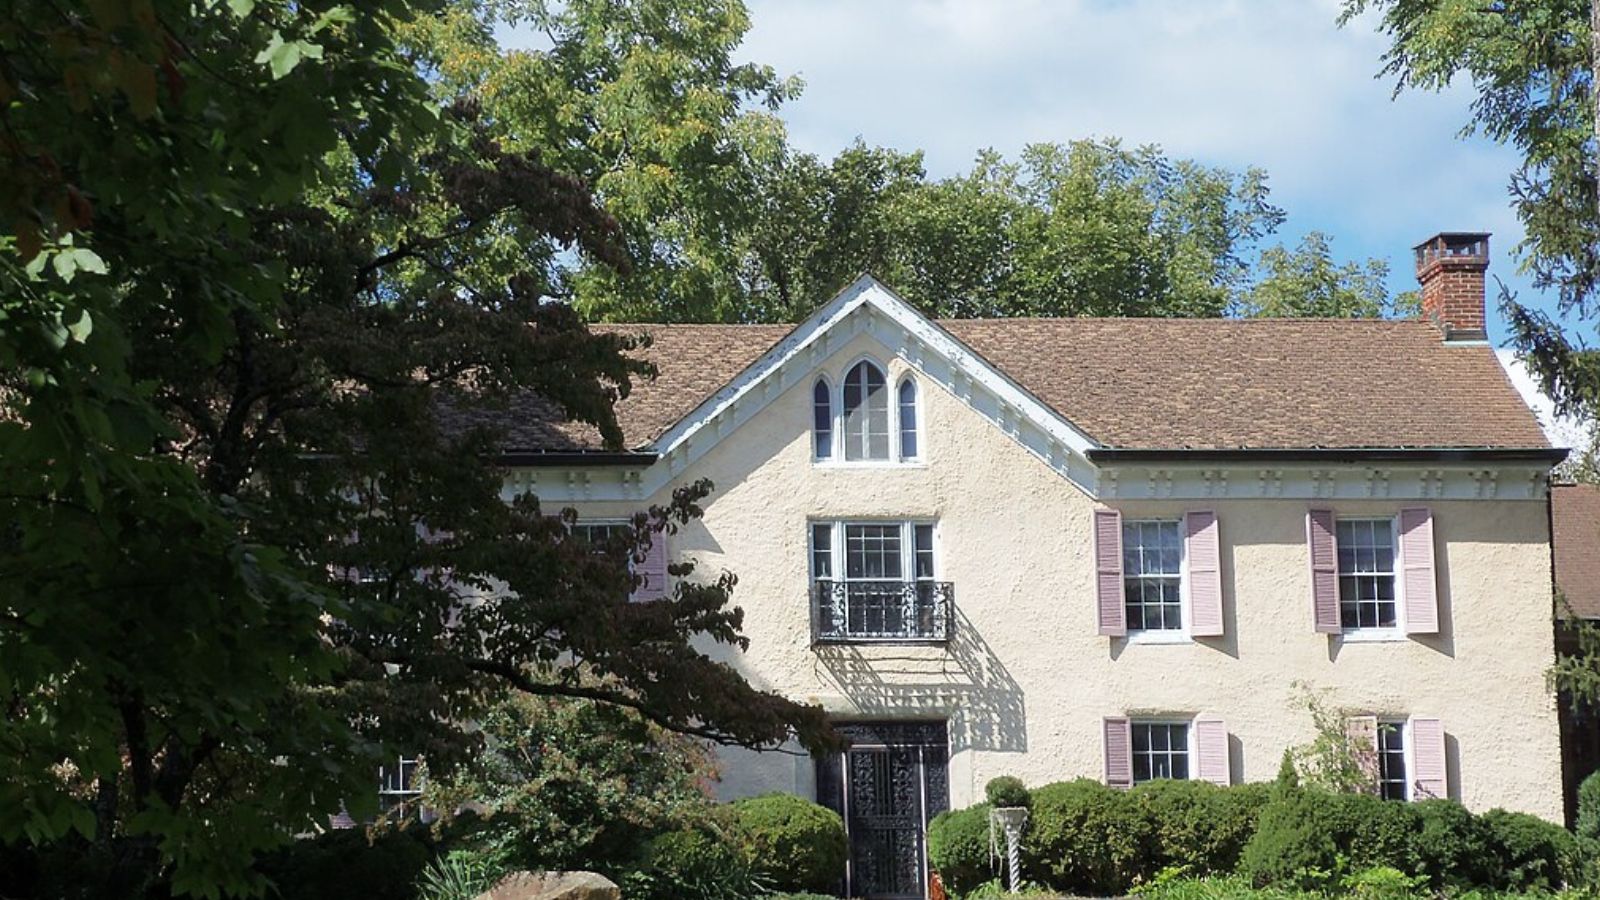
Brookeville is a tiny town in northern Montgomery County, known for its 19th-century architecture and National Register historic district. It’s a rare place where homes blend history with modern upgrades. Residents enjoy privacy and community pride in one of the state’s smallest municipalities.
Its real estate market tends to move more slowly due to limited inventory, but values have held strong. In 2025, the median home price is over $815K, driven by its unique character and steady demand from buyers seeking something different from typical suburbia.
27. Kensington – 51% Home Price Increase Since 2010

- 2010: $544,391
- 2011: $521,097
- 2012: $515,337
- 2013: $542,839
- 2014: $577,010
- 2015: $579,724
- 2016: $586,085
- 2017: $603,743
- 2018: $611,326
- 2019: $631,225
- 2020: $641,782
- 2021: $730,108
- 2022: $775,964
- 2023: $769,455
- 2024: $803,430
- 2025: $824,954
Kensington’s housing market has grown steadily over the past decade and a half, pushing values up by over $280K since 2010. The biggest gains came between 2020 and 2022, echoing strong buyer demand throughout Montgomery County. Price growth has continued into 2025, albeit more gradually.
Kensington – Small-Town Feel Near the City
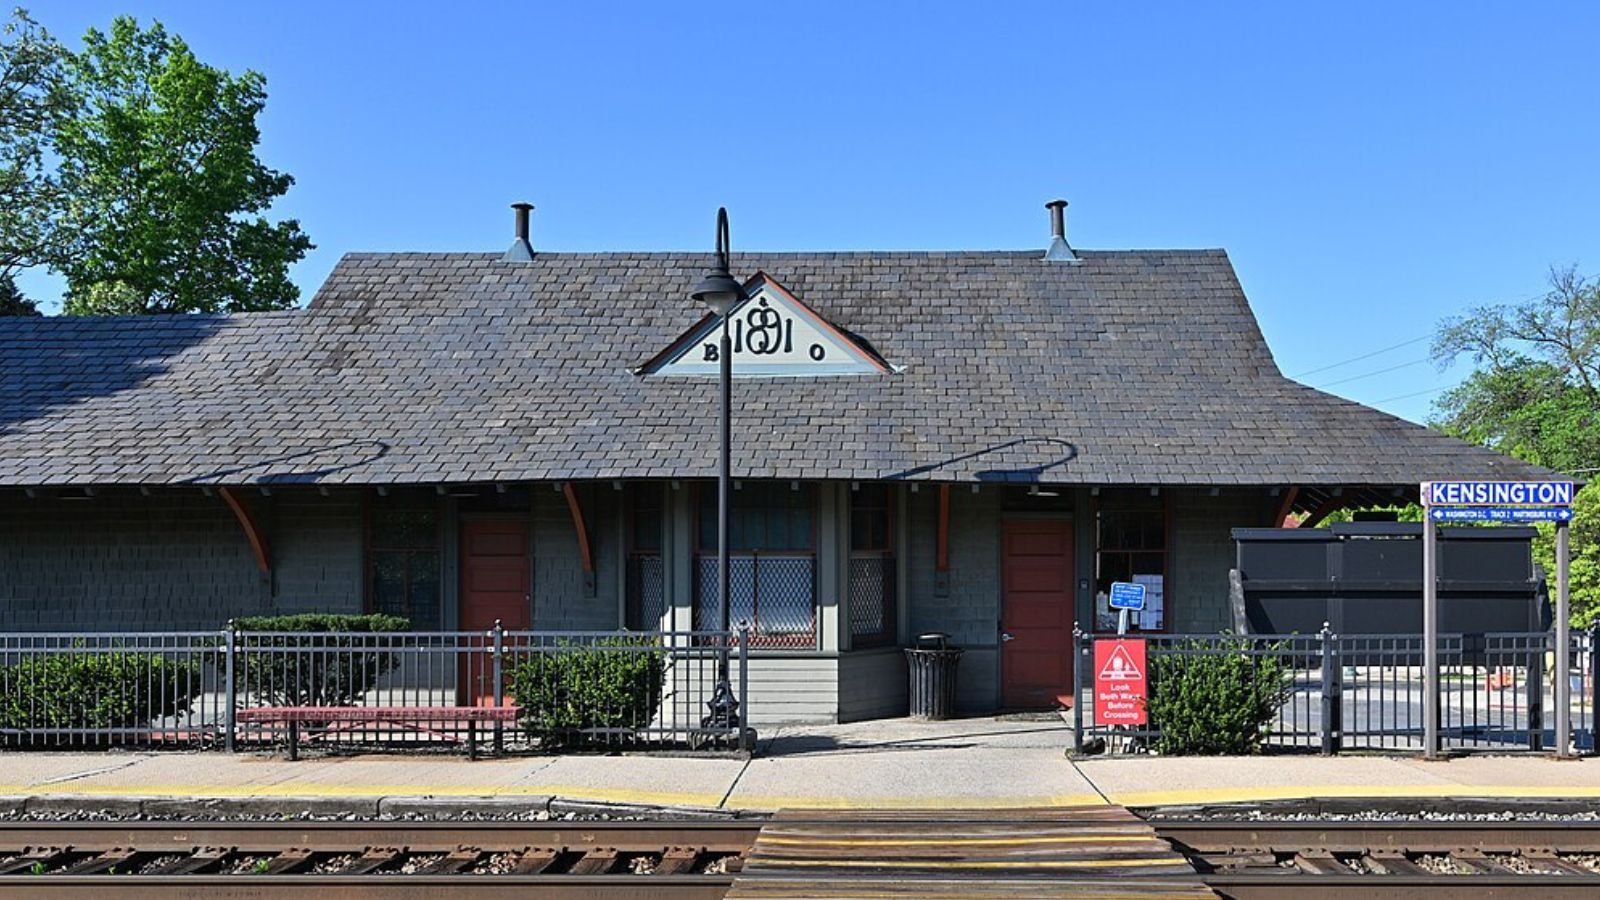
Kensington is a leafy, commuter-friendly town just north of Washington, D.C., offering a historic downtown and a strong sense of community. Its MARC station and easy Metro access make it popular with professionals who work in the city but want a quieter place to live. The Victorian charm and walkable layout continue to attract families and older homeowners alike.
Home values in Kensington surged during the pandemic years, and the town avoided the volatility seen elsewhere in the region. Even during the market cooling of 2023, prices held firm before rising again in 2024 and 2025. That stability has helped make Kensington one of the most dependable—and expensive—markets in suburban Maryland.
26. Ashton – 43% Home Price Increase Since 2010
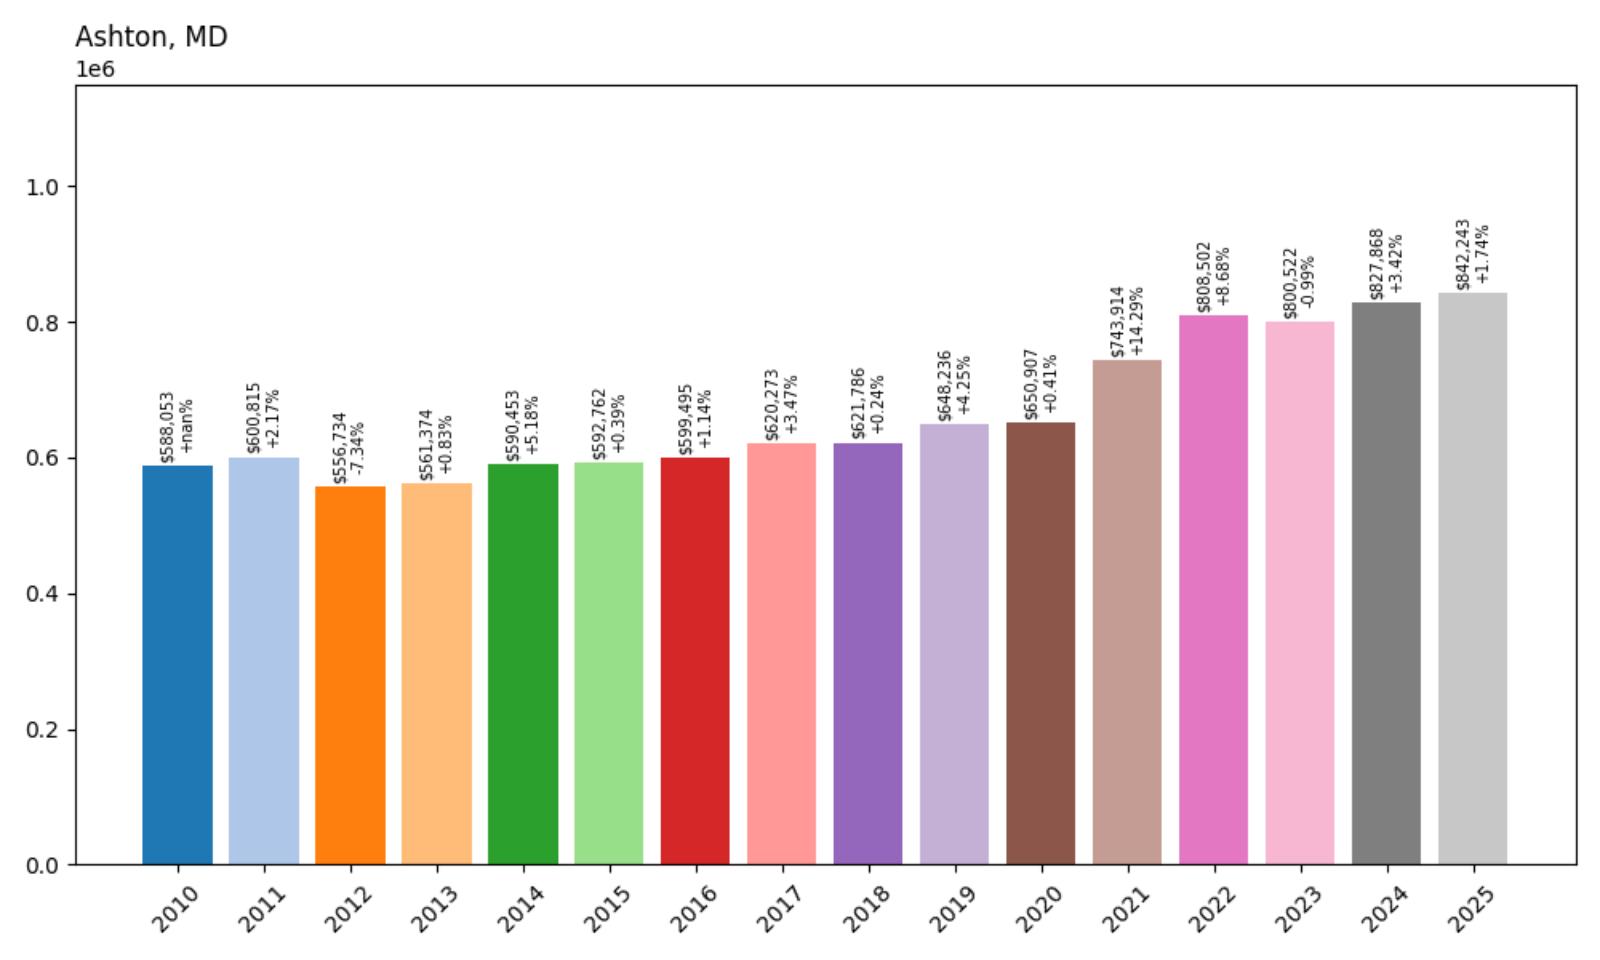
- 2010: $588,053
- 2011: $600,815
- 2012: $556,734
- 2013: $561,374
- 2014: $590,453
- 2015: $592,762
- 2016: $599,495
- 2017: $620,273
- 2018: $621,786
- 2019: $648,236
- 2020: $650,907
- 2021: $743,914
- 2022: $808,502
- 2023: $800,522
- 2024: $827,868
- 2025: $842,243
Ashton’s home prices have jumped over $250K since 2010, with significant momentum in the years following 2020. While there was a slight dip in 2023, the market has rebounded with renewed strength. As of 2025, median values exceed $840K, pushing Ashton into the upper tier of Maryland housing markets.
Ashton – Quiet Affluence in Montgomery County
Ashton sits at the intersection of New Hampshire Avenue and Route 108, offering a semi-rural lifestyle within reach of the D.C. suburbs. The town is prized for its large lots, wooded surroundings, and easy access to parks and equestrian facilities. It has long appealed to buyers who want a high-end home without the bustle of denser areas.
Price appreciation was particularly strong during the pandemic, as more families sought space and privacy. Even with the 2023 dip, the long-term trend remains sharply upward. The area’s exclusivity and limited inventory help keep it firmly planted on Maryland’s most expensive list.
25. Boyds – 55% Home Price Increase Since 2010
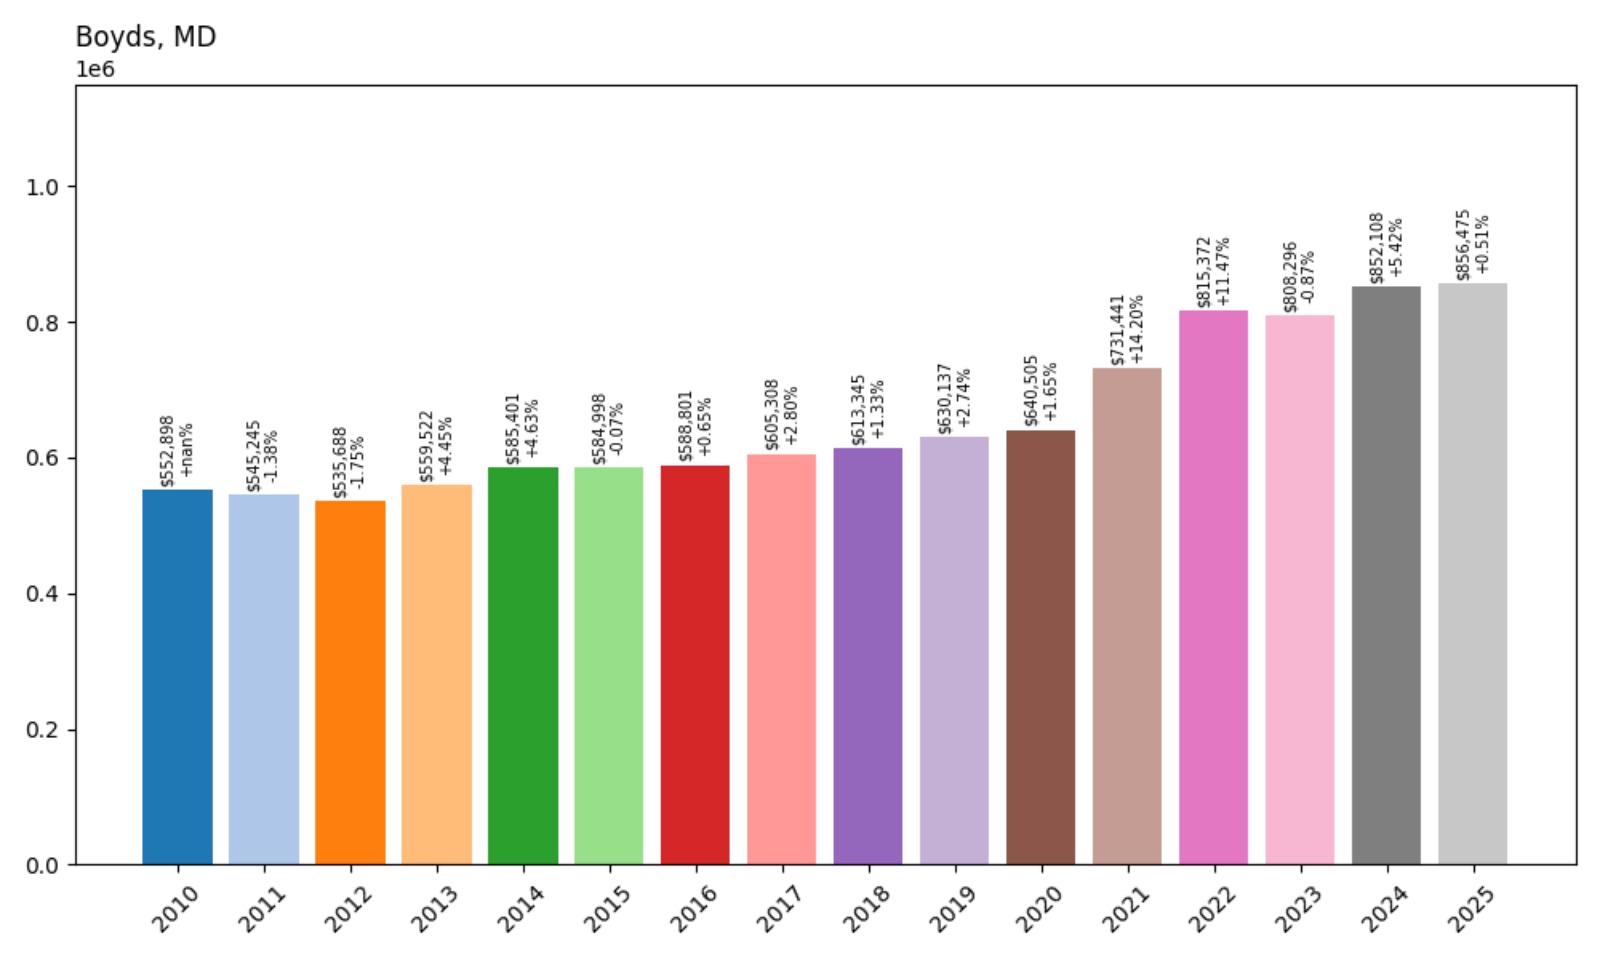
- 2010: $552,898
- 2011: $545,245
- 2012: $535,688
- 2013: $559,522
- 2014: $585,401
- 2015: $584,998
- 2016: $588,801
- 2017: $605,308
- 2018: $613,345
- 2019: $630,137
- 2020: $640,505
- 2021: $731,441
- 2022: $815,372
- 2023: $808,296
- 2024: $852,108
- 2025: $856,475
Home prices in Boyds have increased by more than $300K since 2010, driven in large part by demand during the 2020–2022 surge. Though prices dipped slightly in 2023, they quickly resumed an upward path. In 2025, Boyds homes are priced well into the mid-$800K range.
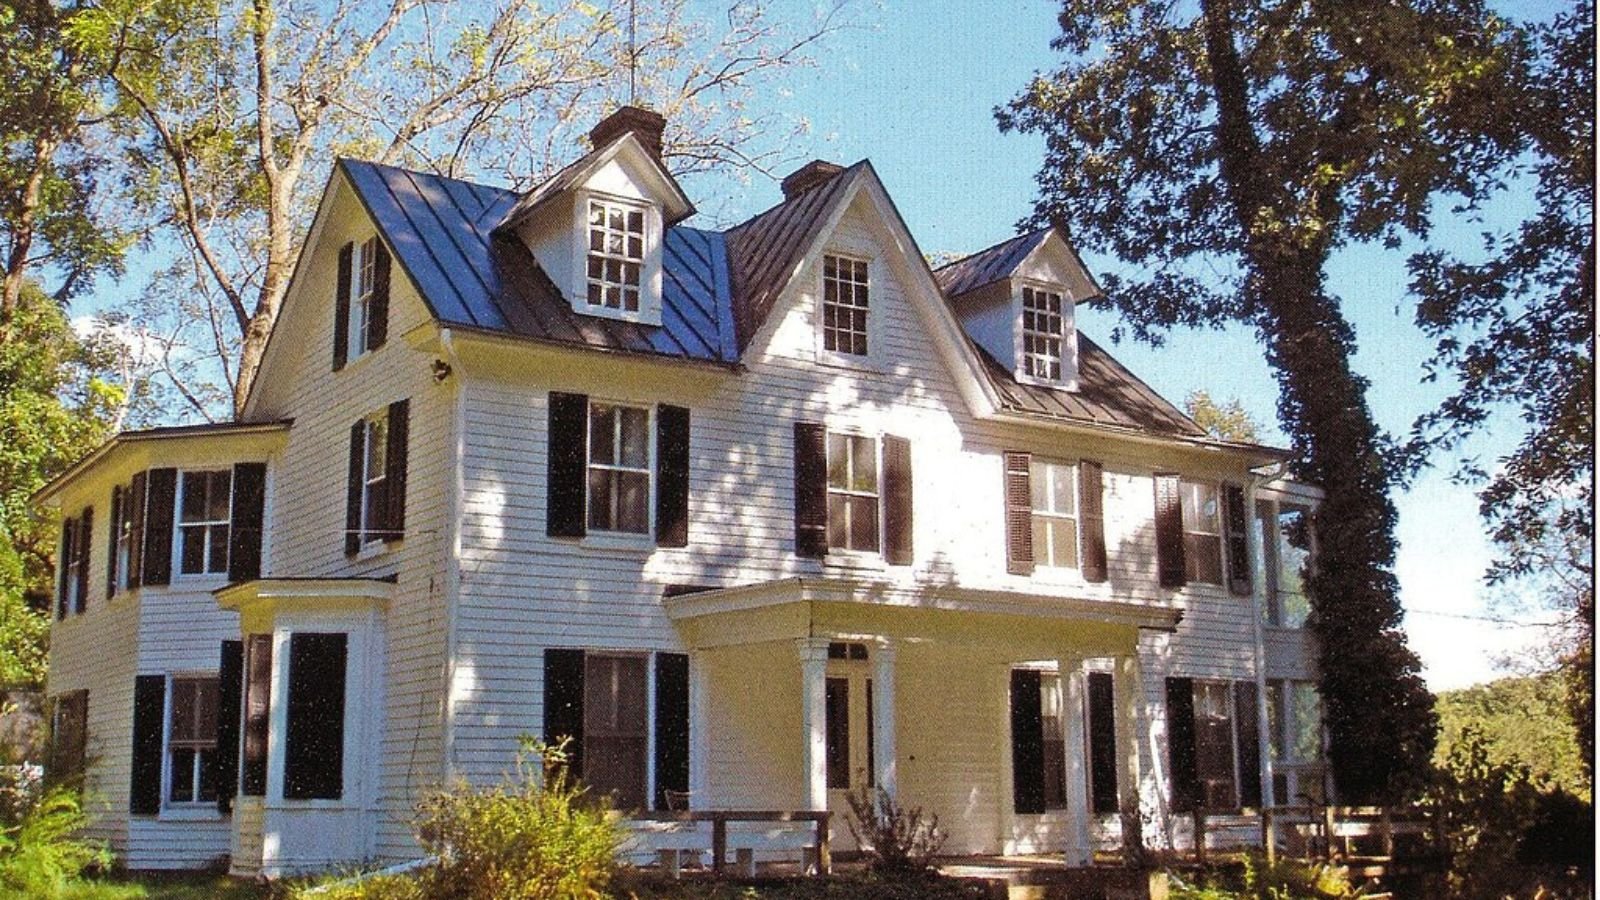
Boyds – Where Suburbia Meets Open Space

Boyds is located in western Montgomery County near Black Hill Regional Park and Little Seneca Lake. It offers a mix of new developments and open land, making it appealing for those who want space without being too far from Germantown or Gaithersburg. Its proximity to natural areas is a major draw for outdoor enthusiasts and families.
The town saw rapid price gains during the pandemic housing boom, with buyers competing for larger homes and quiet neighborhoods. Prices have continued to trend upward thanks to consistent demand and relatively low inventory. Boyds is now one of the county’s more expensive outer-suburb options.
24. Sandy Spring – 43% Home Price Increase Since 2010
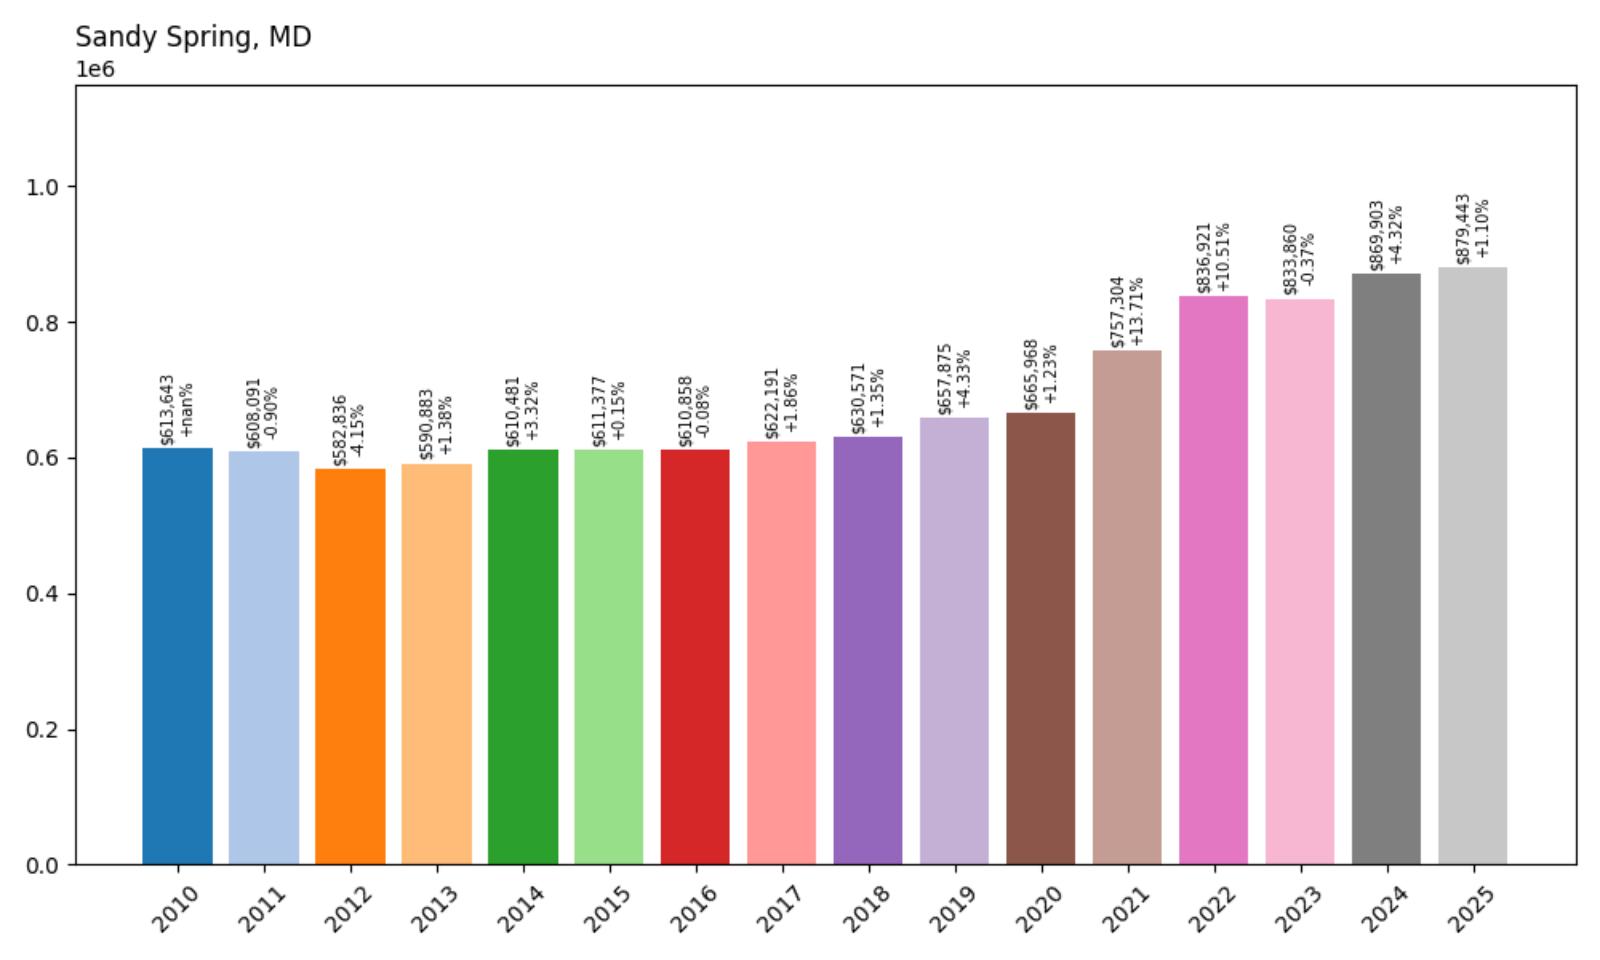
- 2010: $613,643
- 2011: $608,091
- 2012: $582,836
- 2013: $590,883
- 2014: $610,481
- 2015: $611,377
- 2016: $610,858
- 2017: $622,191
- 2018: $630,571
- 2019: $657,875
- 2020: $665,968
- 2021: $757,304
- 2022: $836,921
- 2023: $833,860
- 2024: $869,903
- 2025: $879,443
Sandy Spring’s home values have climbed steadily over the last 15 years, with a large leap between 2020 and 2022. The area has seen consistent interest from buyers looking for suburban homes in established neighborhoods. As of 2025, prices are just under $880K and still trending upward.
Sandy Spring – History, Heritage, and Modern Growth
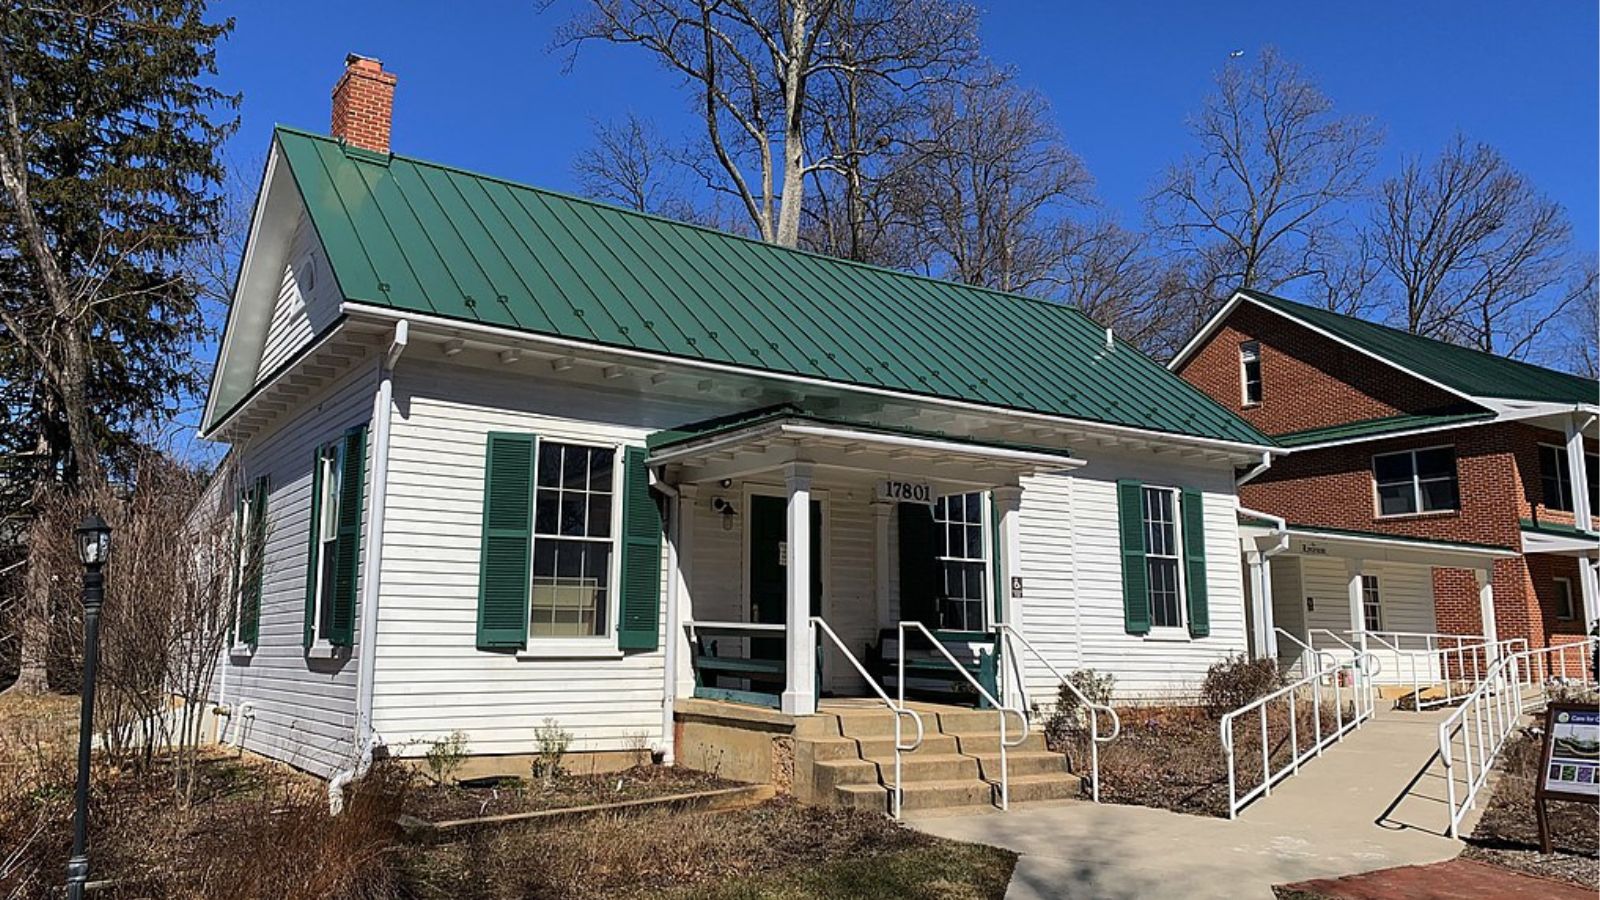
Thayer Young, CC BY-SA 4.0, via Wikimedia Commons
Sandy Spring is one of the oldest communities in Montgomery County, with deep Quaker roots and a long history of farming and activism. Today, it offers a blend of historic homes and newer development, along with easy access to Olney and Route 108. The town’s charm and sense of identity have helped it stand out in a crowded market.
The post-2020 period brought a wave of demand that pushed values significantly higher, especially for detached homes. Since then, price growth has continued, even through short-term market shifts. With limited inventory and stable demand, Sandy Spring remains one of the more exclusive corners of eastern Montgomery County.
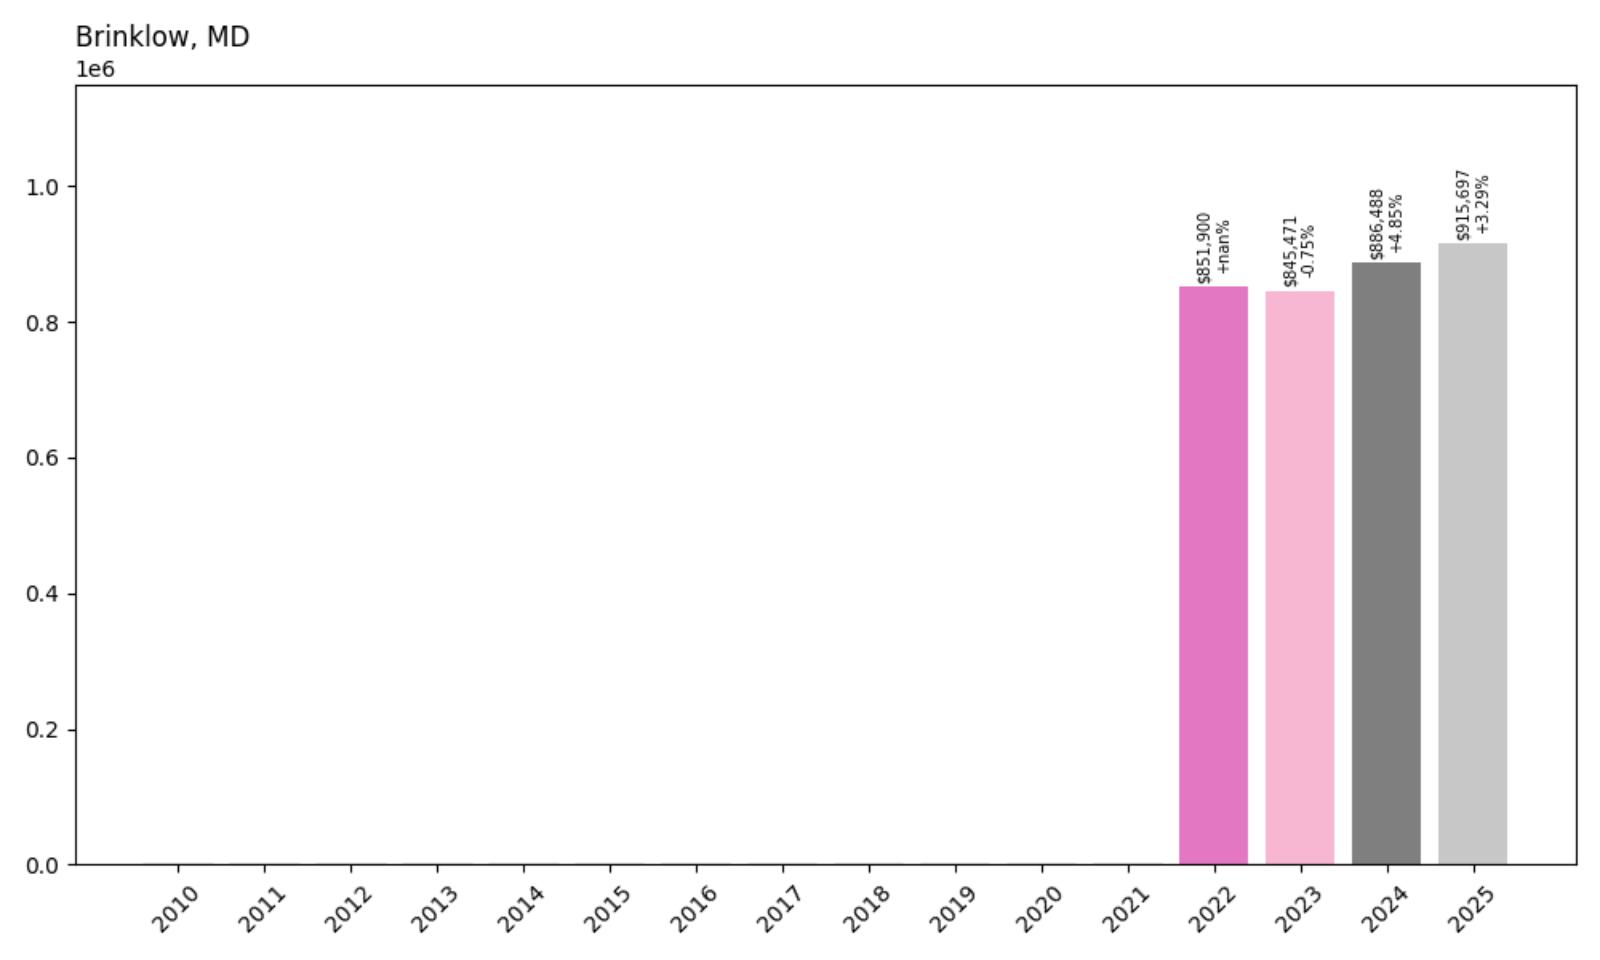
23. Brinklow – 7% Home Price Increase Since 2022
Would you like to save this?
- 2010: N/A
- 2011: N/A
- 2012: N/A
- 2013: N/A
- 2014: N/A
- 2015: N/A
- 2016: N/A
- 2017: N/A
- 2018: N/A
- 2019: N/A
- 2020: N/A
- 2021: N/A
- 2022: $851,900
- 2023: $845,471
- 2024: $886,488
- 2025: $915,697
Although Zillow only provides data since 2022 for Brinklow, the town has already seen a noticeable rise in value. After a small drop in 2023, prices climbed to over $915K by mid-2025. That puts Brinklow solidly among the most expensive communities in the state.
Brinklow – Small Size, High Prices
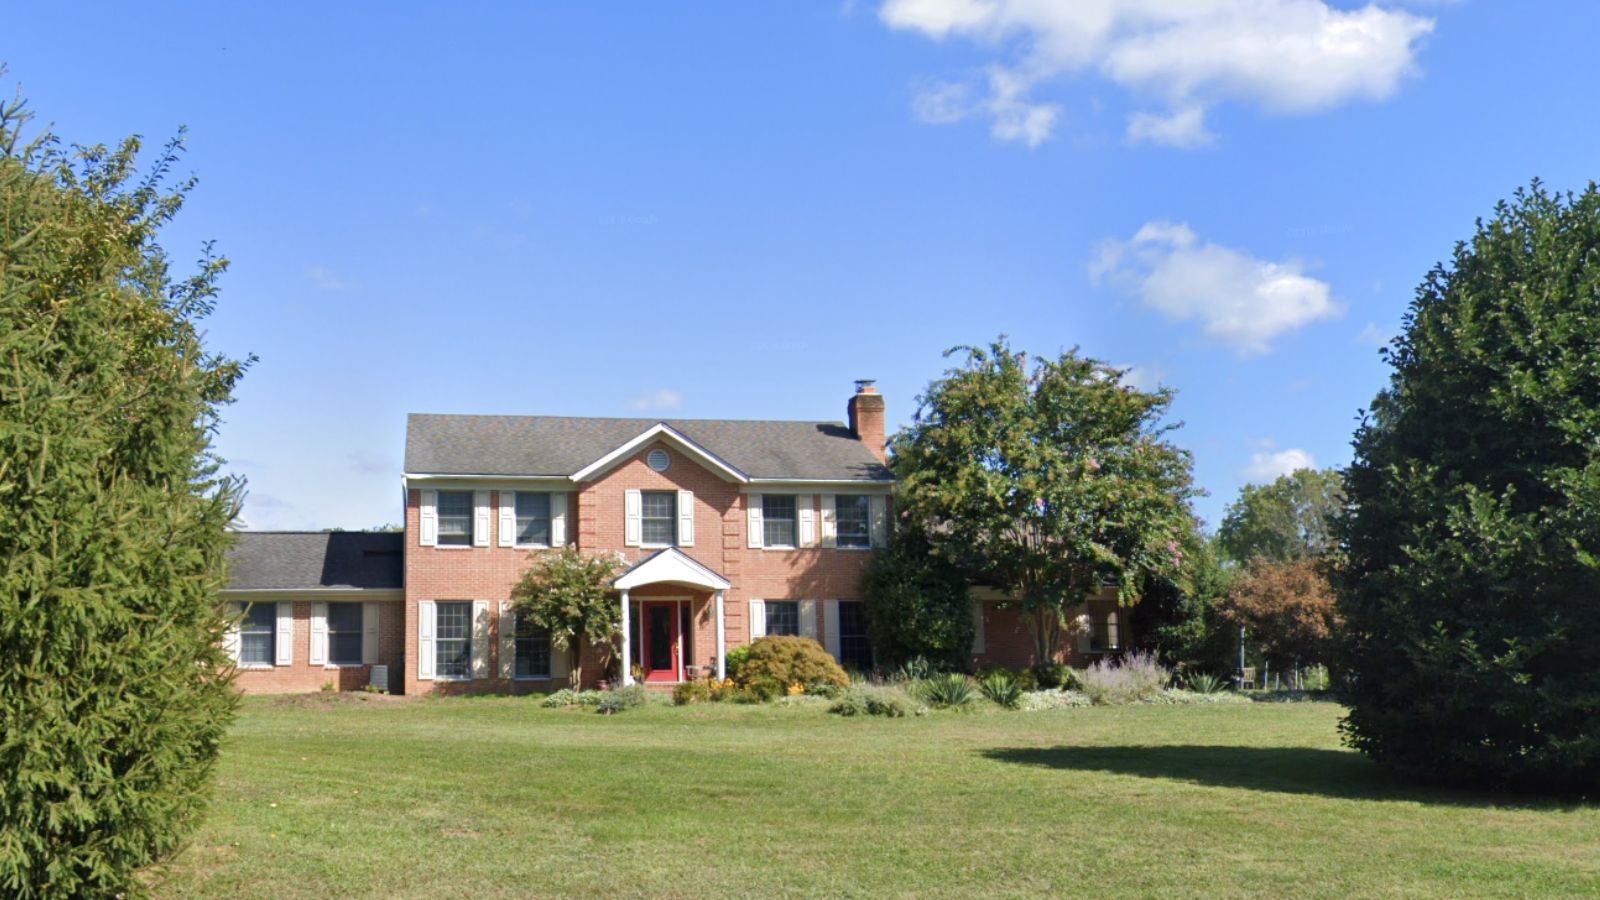
Brinklow is an unincorporated community along Route 650 between Olney and Ashton, known for its spacious lots and semi-rural feel. While it has few businesses or public services, its quiet environment and large custom homes attract buyers willing to pay a premium. Its location near both Route 108 and New Hampshire Avenue adds to its convenience.
Limited inventory keeps the local housing market tight, with homes rarely staying on the market for long. Recent years have brought renewed interest from buyers who want privacy without sacrificing access to major employment centers. While data is limited, all signs point to continued growth and strong buyer demand in Brinklow.
22. North Potomac – 45% Home Price Increase Since 2010
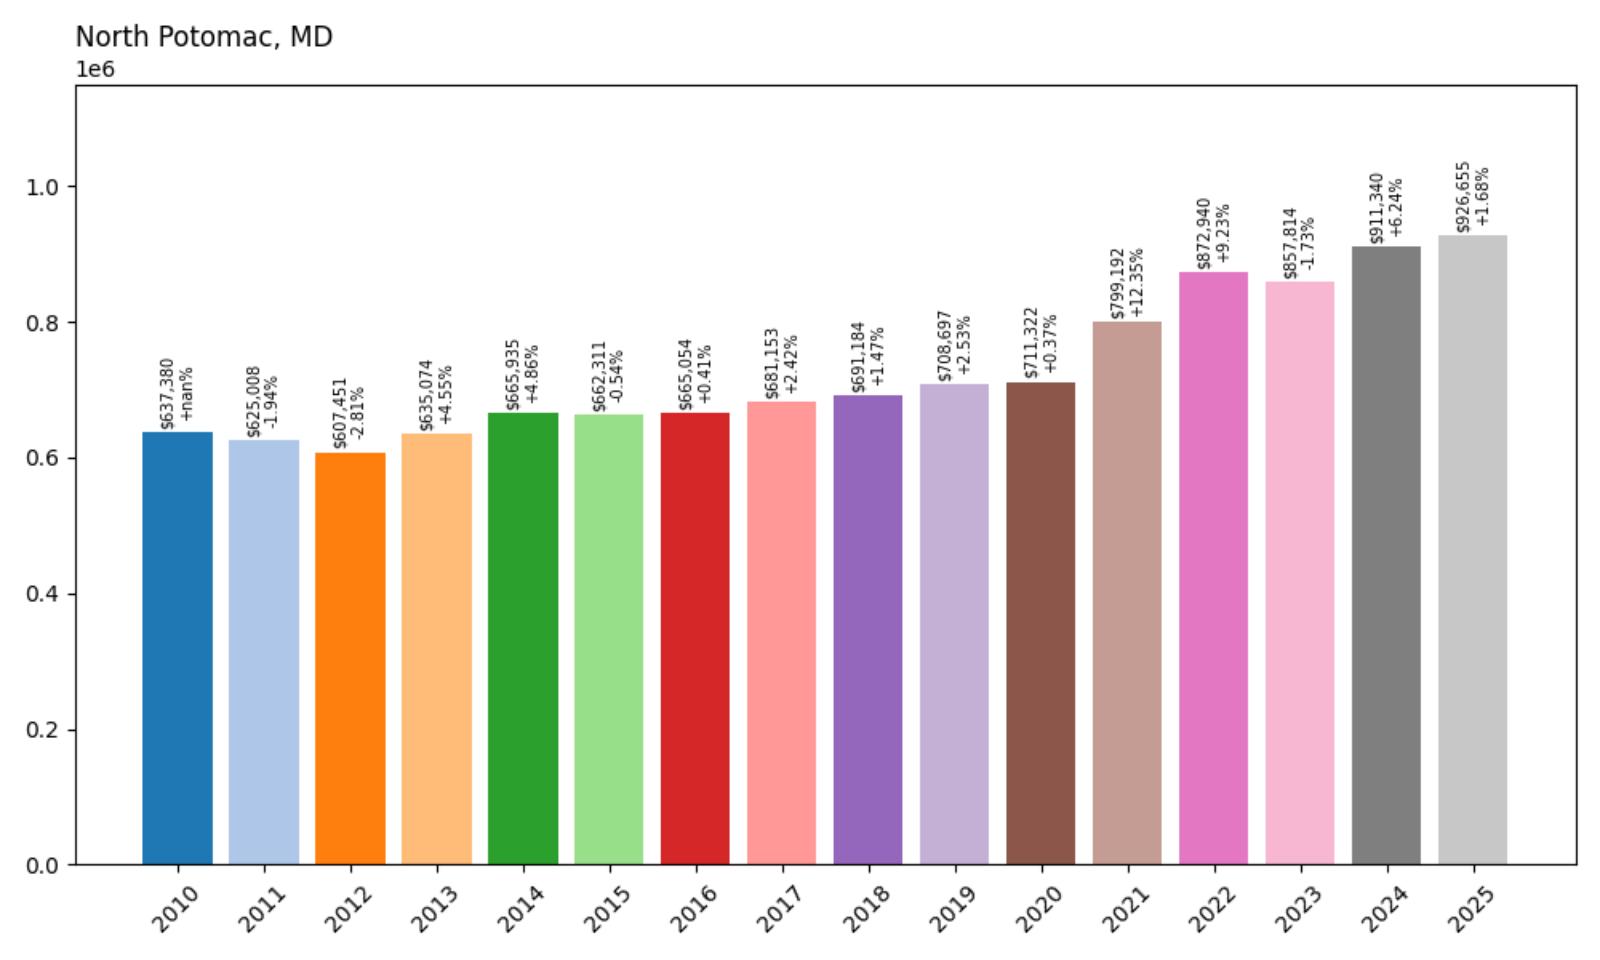
- 2010: $637,380
- 2011: $625,008
- 2012: $607,451
- 2013: $635,074
- 2014: $665,935
- 2015: $662,311
- 2016: $665,054
- 2017: $681,153
- 2018: $691,184
- 2019: $708,697
- 2020: $711,322
- 2021: $799,192
- 2022: $872,940
- 2023: $857,814
- 2024: $911,340
- 2025: $926,655
North Potomac’s home values have risen by nearly $290K since 2010, with the largest gains coming after 2020. Price growth accelerated sharply through 2022 before easing slightly in 2023. By mid-2025, values are approaching the $930K mark, placing the area firmly in the upper tier of Montgomery County real estate.
North Potomac – Desirable Schools and Established Neighborhoods
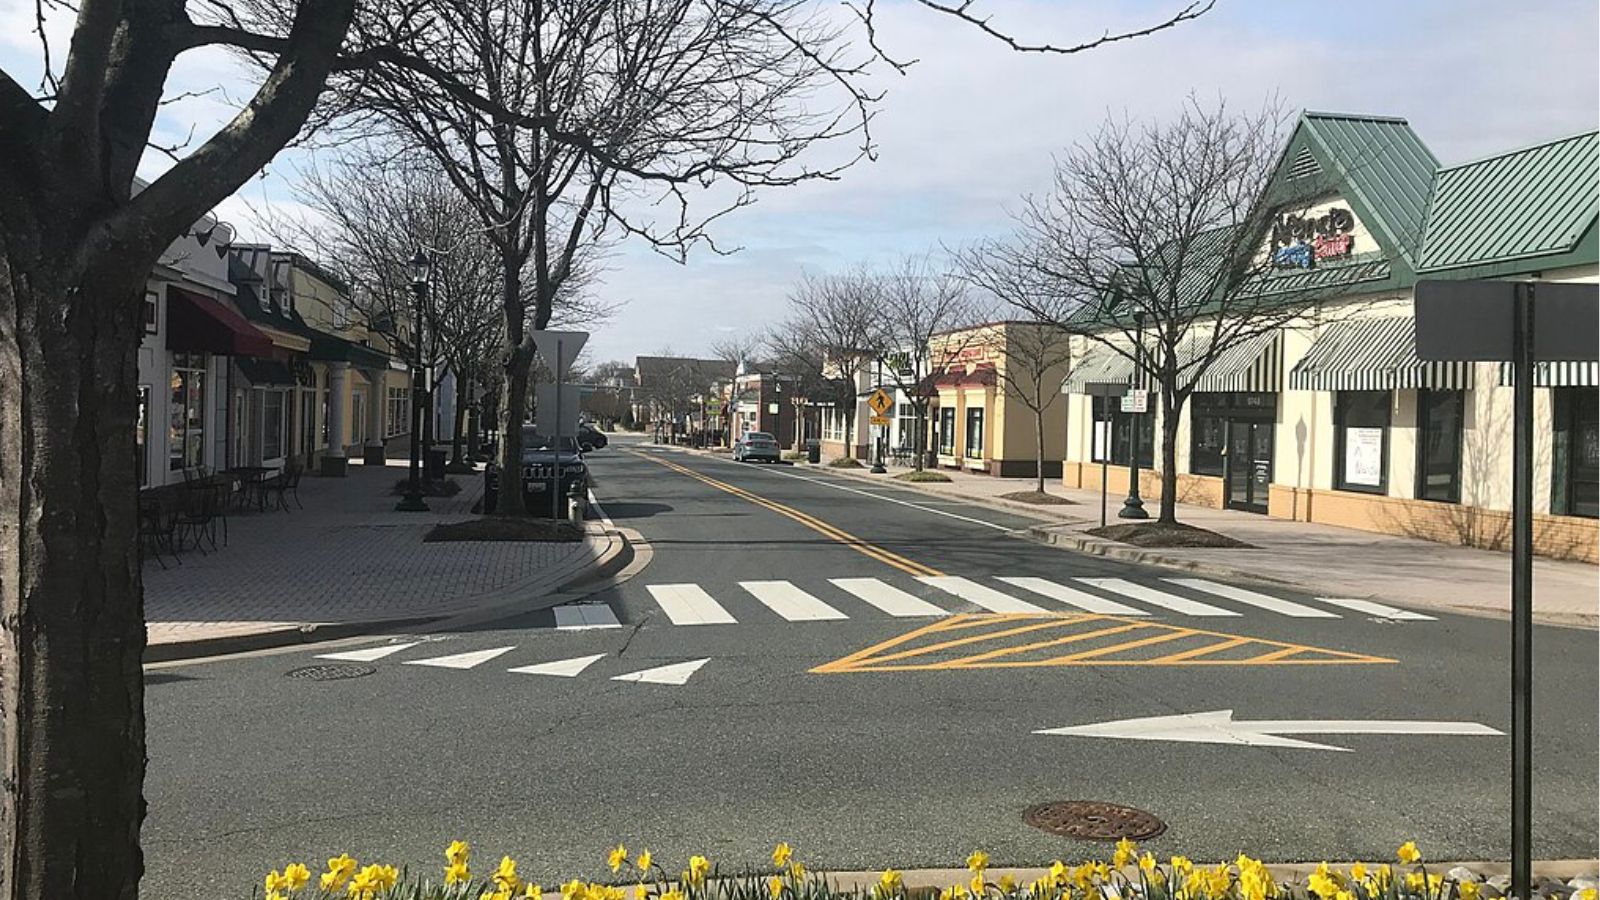
North Potomac is a suburban favorite for families, thanks to its proximity to top-rated Montgomery County schools and established housing stock. The area offers quiet cul-de-sacs, access to parks, and shopping options without the density of nearby Rockville or Gaithersburg. With strong community appeal, it consistently ranks among the county’s most in-demand areas.
Even after a minor dip in 2023, North Potomac’s home values quickly rebounded and reached new highs by 2025. The market’s strength reflects both continued buyer interest and limited turnover in its more sought-after neighborhoods. For buyers seeking a stable investment and strong amenities, North Potomac remains a go-to choice.
21. Oxford – 42% Home Price Increase Since 2010
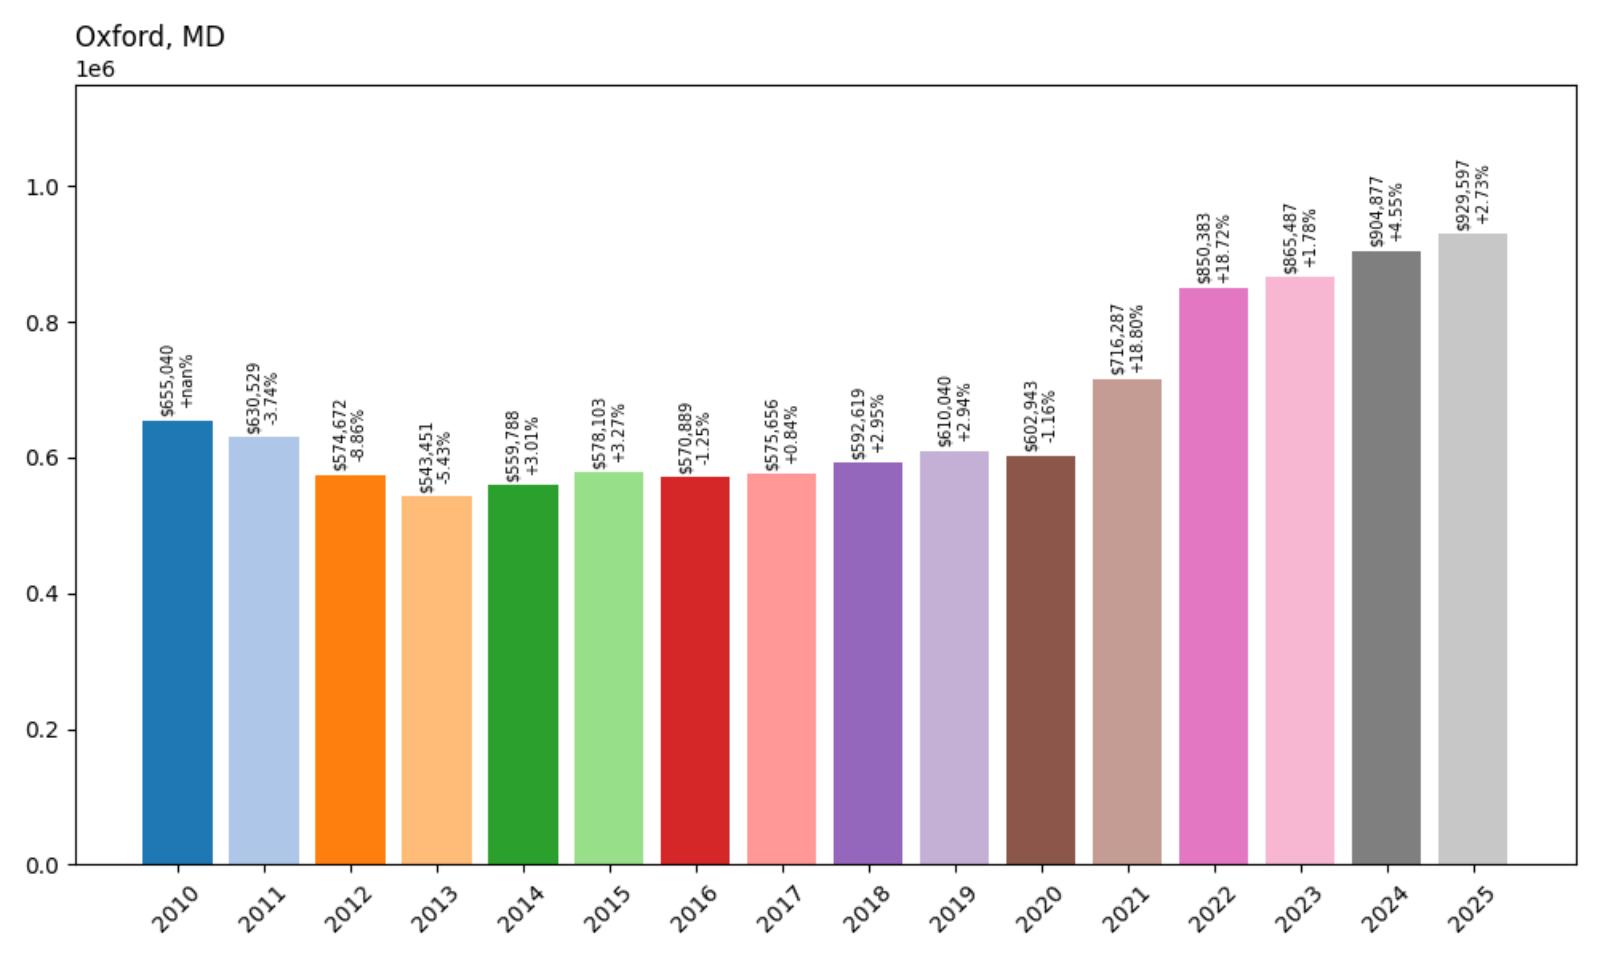
- 2010: $655,040
- 2011: $630,529
- 2012: $574,672
- 2013: $543,451
- 2014: $559,788
- 2015: $578,103
- 2016: $570,889
- 2017: $575,656
- 2018: $592,619
- 2019: $610,040
- 2020: $602,943
- 2021: $716,287
- 2022: $850,383
- 2023: $865,487
- 2024: $904,877
- 2025: $929,597
Oxford’s home prices dropped in the early 2010s before reversing course around 2016. From there, prices climbed steadily, with major gains between 2020 and 2022. In 2025, the average home is valued at nearly $930K, showing a 42% increase over the 15-year period.
Oxford – Waterfront Living on the Eastern Shore
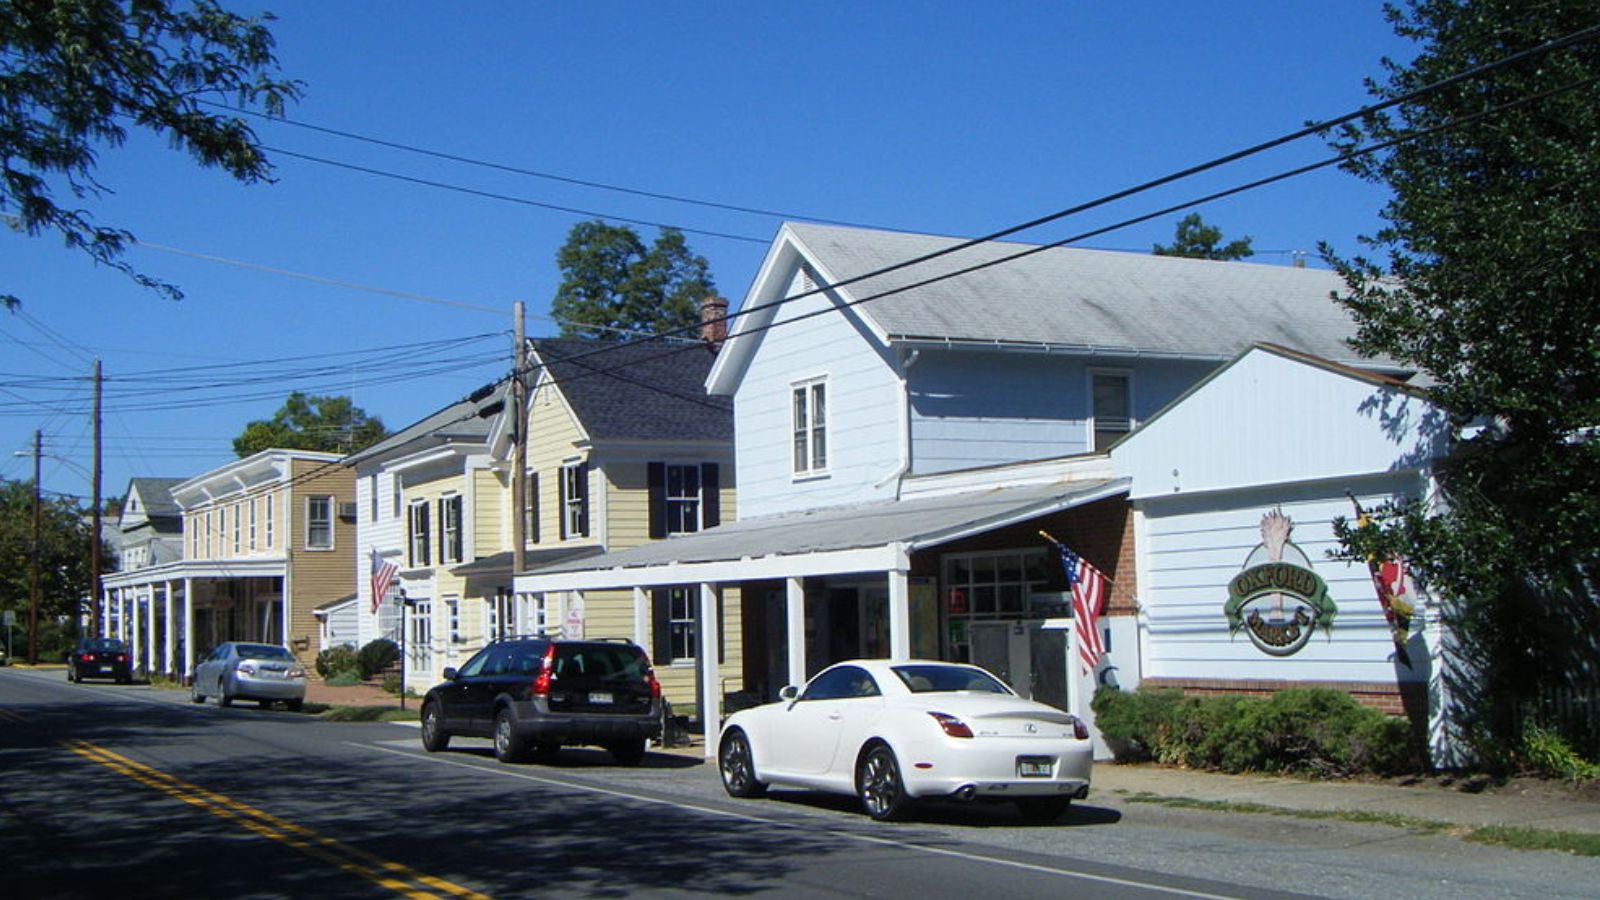
Located on Maryland’s Eastern Shore in Talbot County, Oxford is one of the state’s oldest and most picturesque small towns. With its marina, historic charm, and views of the Tred Avon River, it has long been a magnet for retirees and second-home buyers. The town’s peaceful setting and high-quality waterfront homes justify its high prices.
The sharp post-pandemic rise in values reflects renewed interest in remote work and rural living. Oxford’s inventory remains extremely limited, and competition for waterfront properties is intense. As one of the most expensive towns on the Shore, it’s increasingly seen as a luxury retreat.
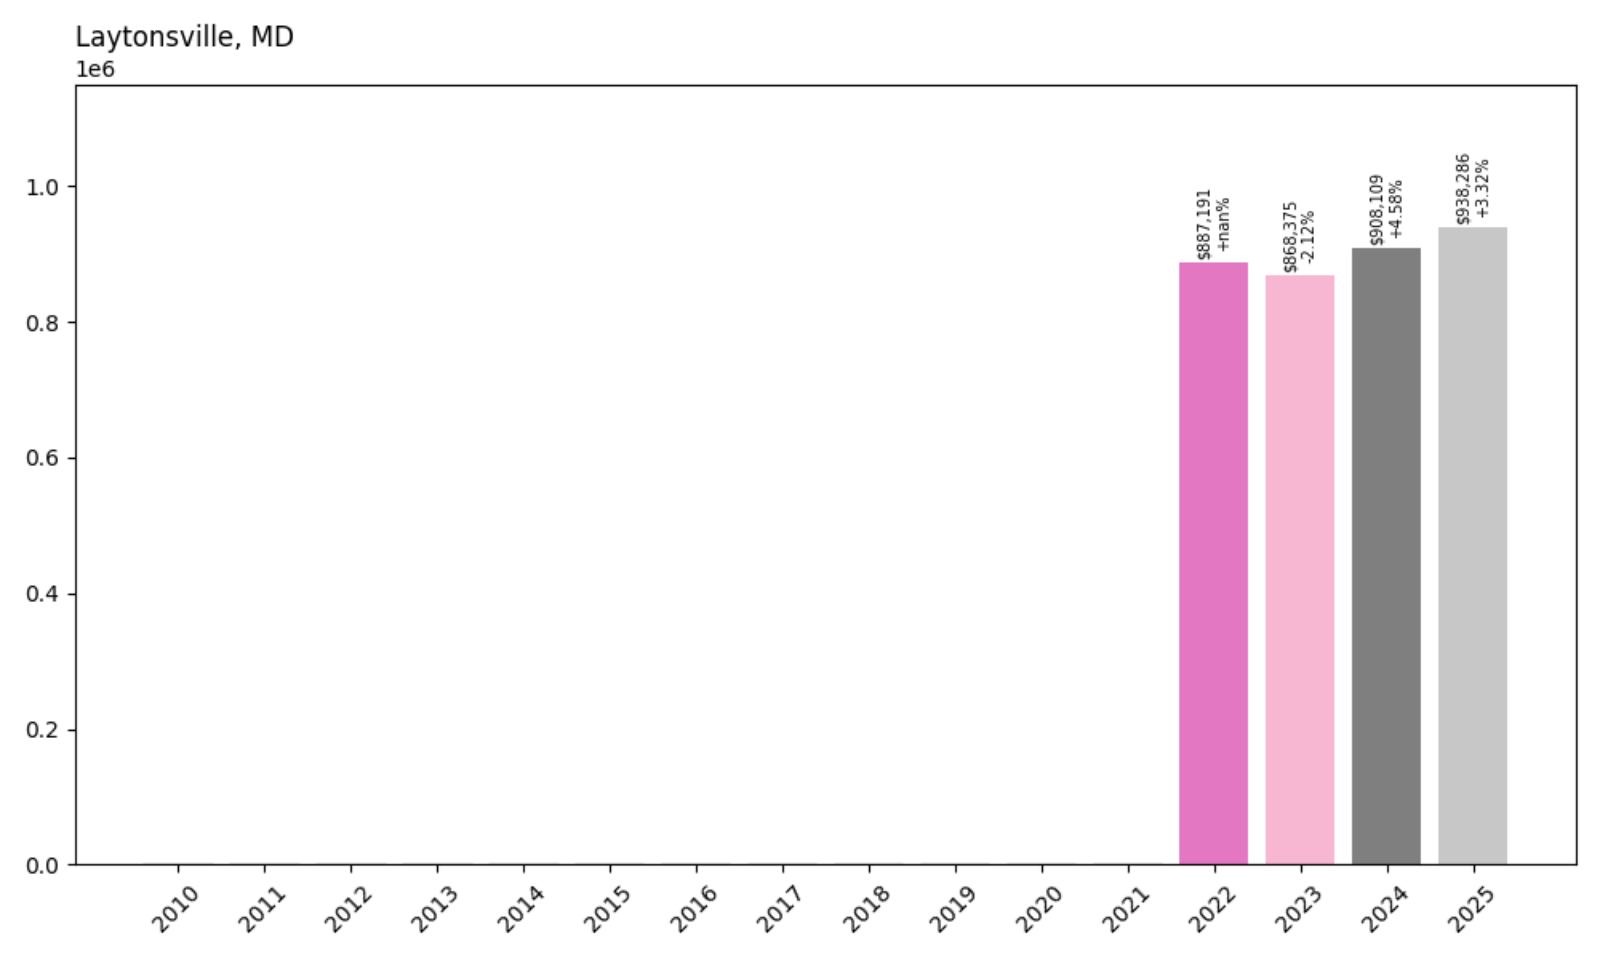
20. Laytonsville – 6% Home Price Increase Since 2022
- 2010: N/A
- 2011: N/A
- 2012: N/A
- 2013: N/A
- 2014: N/A
- 2015: N/A
- 2016: N/A
- 2017: N/A
- 2018: N/A
- 2019: N/A
- 2020: N/A
- 2021: N/A
- 2022: $887,191
- 2023: $868,375
- 2024: $908,109
- 2025: $938,286
Although data is only available from 2022 onward, Laytonsville has already posted a 6% increase in home prices. Values briefly dipped in 2023 before rebounding strongly through 2025. At nearly $940K, the town ranks among Montgomery County’s priciest locations.
Laytonsville – Country Estates and Custom Homes

Laytonsville offers a distinctly rural lifestyle within one of Maryland’s most developed counties. With custom homes on large lots, equestrian properties, and a quiet pace of life, it stands apart from typical suburban towns. The area’s exclusivity and limited development help maintain its high property values.
While home sales in Laytonsville are infrequent, properties tend to command strong prices due to location and lot size. Many buyers are drawn to its low density and the sense of seclusion it provides just a short drive from Gaithersburg and Rockville. That balance of access and privacy keeps Laytonsville in the upper echelon of the state’s real estate market.
19. Cooksville – 63% Home Price Increase Since 2010

- 2010: $583,256
- 2011: $597,520
- 2012: $572,452
- 2013: $596,745
- 2014: $624,575
- 2015: $631,475
- 2016: $641,825
- 2017: $650,344
- 2018: $671,594
- 2019: $682,233
- 2020: $681,135
- 2021: $779,945
- 2022: $868,610
- 2023: $870,810
- 2024: $932,425
- 2025: $950,467
Cooksville’s home prices have risen steadily for more than a decade, gaining over $360K since 2010. The biggest leaps occurred after 2020, when prices began increasing by tens of thousands of dollars each year. In 2025, the average home is valued at more than $950K, making Cooksville one of the most expensive spots in Howard County.
Cooksville – Western Howard County’s Premier Market

Cooksville sits in a rural section of western Howard County, surrounded by horse farms, open fields, and wooded neighborhoods. The area’s larger home sites and scenic beauty make it attractive to high-income buyers looking for privacy and prestige. While there are few commercial centers, residents value the peaceful atmosphere and quick access to I-70.
The town’s real estate market was steady until 2020, after which demand surged and values followed. Cooksville’s limited housing stock and high land values have helped maintain price momentum through 2025. For those seeking a blend of countryside living and top-tier home values, Cooksville has become a clear standout.
18. Davidsonville – 48% Home Price Increase Since 2010
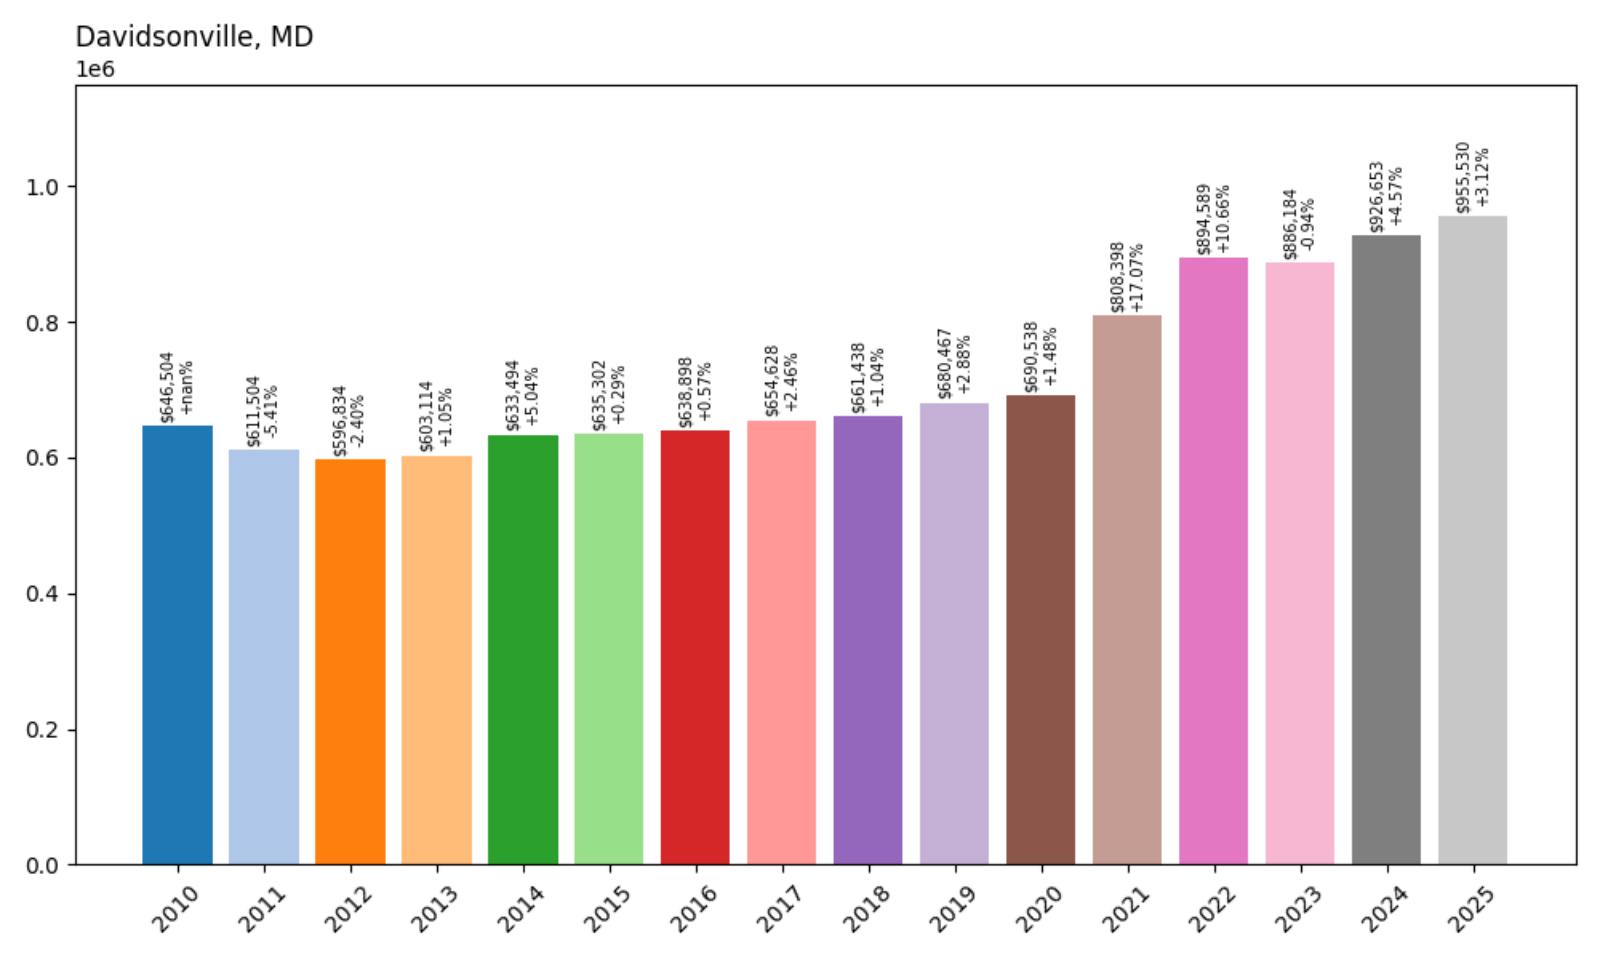
- 2010: $646,504
- 2011: $611,504
- 2012: $596,834
- 2013: $603,114
- 2014: $633,494
- 2015: $635,302
- 2016: $638,898
- 2017: $654,628
- 2018: $661,438
- 2019: $680,467
- 2020: $690,538
- 2021: $808,398
- 2022: $894,589
- 2023: $886,184
- 2024: $926,653
- 2025: $955,530
Davidsonville’s home prices have increased by more than $300K since 2010, with consistent growth over the last five years. The town saw particularly large gains between 2020 and 2022, aligning with broader buyer shifts toward suburban and semi-rural areas. As of 2025, median prices are nearing the $1 million mark.
Davidsonville – Affluent and Expansive in Anne Arundel County
Davidsonville is a quiet, unincorporated community in Anne Arundel County known for estate-style homes and rolling countryside. Despite its rural character, it’s only a short drive from Annapolis and the Washington, D.C. metro region. The area’s combination of privacy, prestige, and location has made it a prime spot for luxury buyers.
The 2020–2022 boom fueled major appreciation, but growth has continued steadily even as other markets cooled. Davidsonville’s appeal is bolstered by its zoning, which helps preserve large lots and limit overdevelopment. This has kept competition fierce for available properties and prices high.
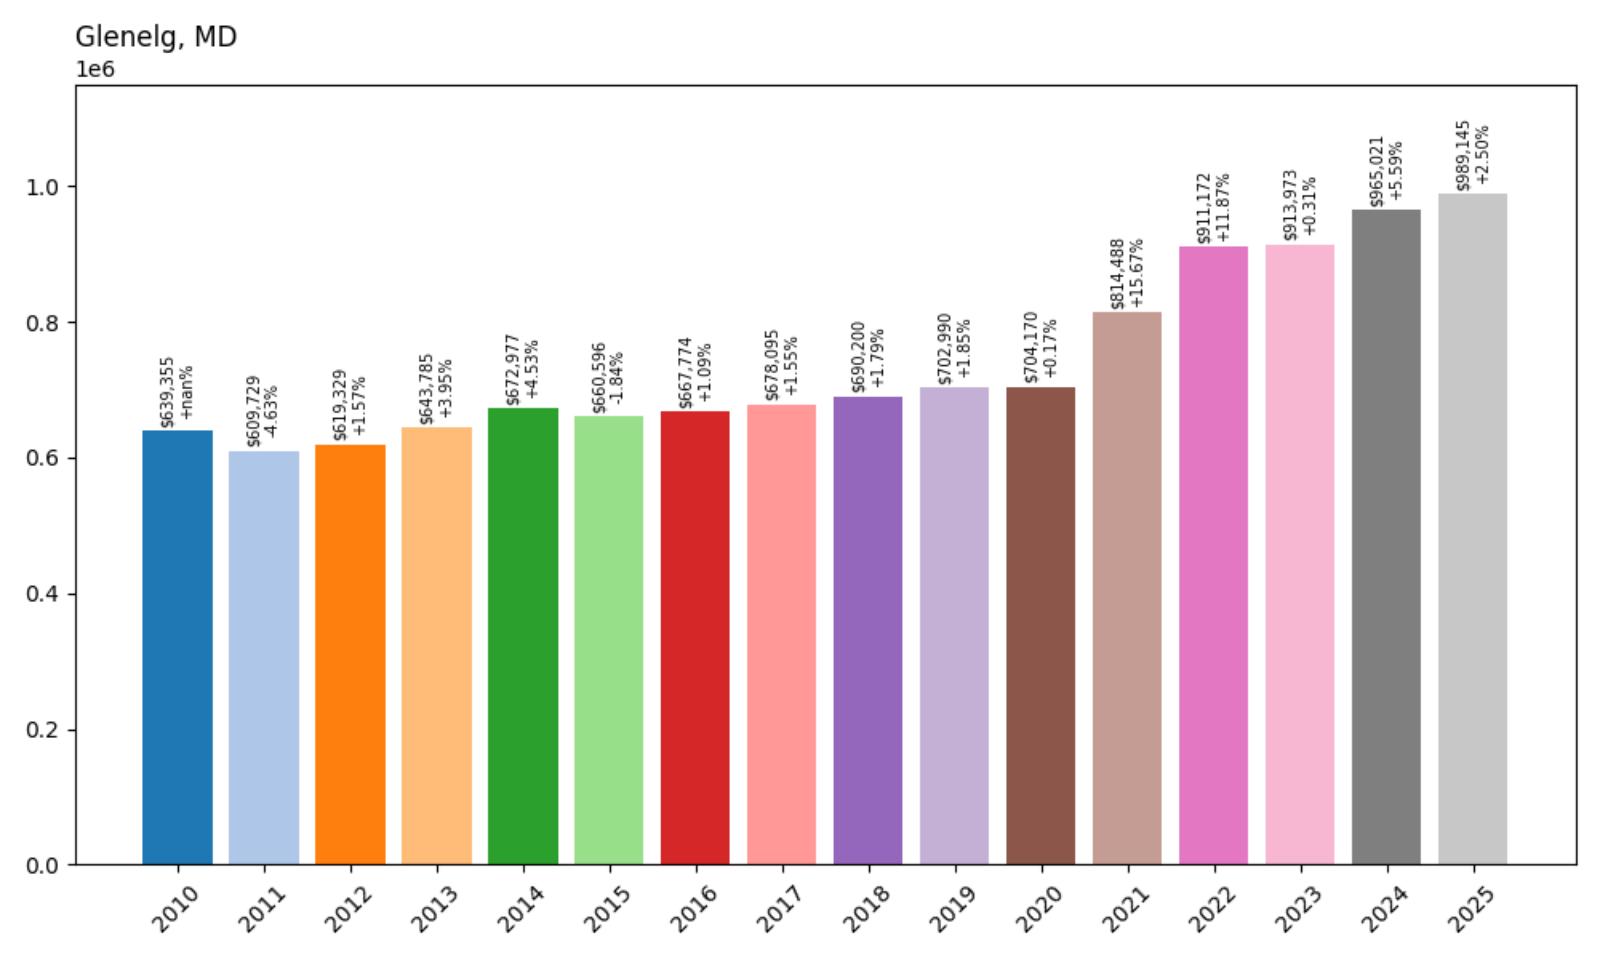
17. Glenelg – 55% Home Price Increase Since 2010
- 2010: $639,355
- 2011: $609,729
- 2012: $619,329
- 2013: $643,785
- 2014: $672,977
- 2015: $660,596
- 2016: $667,774
- 2017: $678,095
- 2018: $690,200
- 2019: $702,990
- 2020: $704,170
- 2021: $814,488
- 2022: $911,172
- 2023: $913,973
- 2024: $965,021
- 2025: $989,145
Glenelg’s home values have risen by over $340K since 2010, with the strongest acceleration occurring between 2020 and 2022. Prices held steady in 2023 and have continued to climb since then. As of 2025, Glenelg homes are approaching the $1 million mark, putting the town among the highest-priced communities in Howard County.
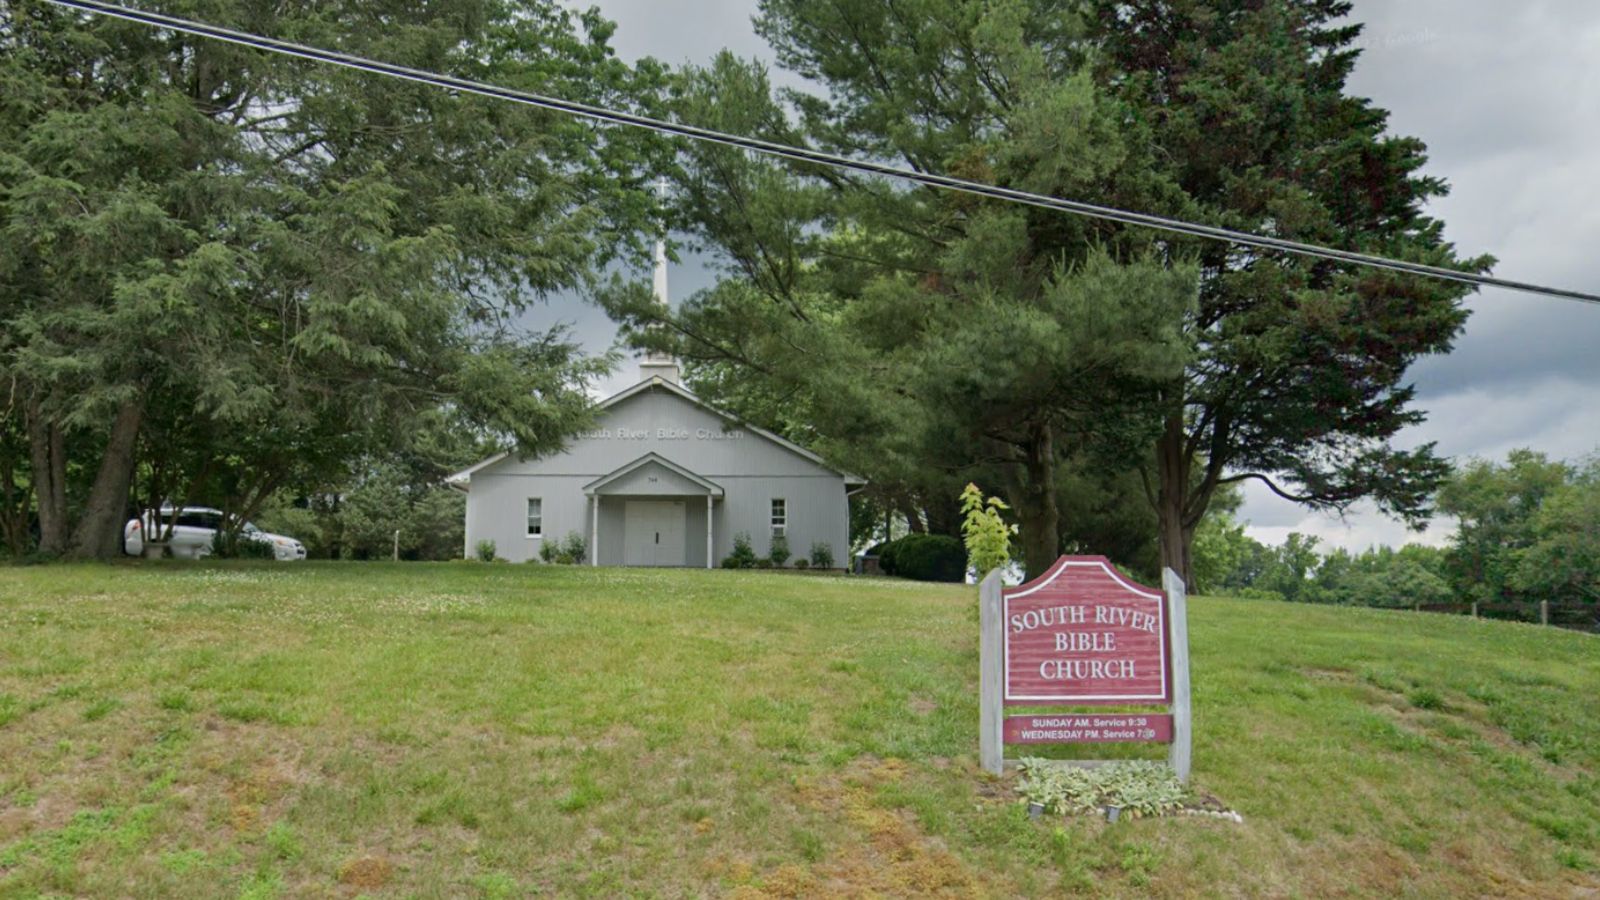
Glenelg – Prestige and Privacy in Western Howard
Glenelg is known for its luxury homes, large lots, and highly rated schools, making it a premier residential area in western Howard County. The town has a rural-suburban feel, with quiet roads and a strong sense of community. Glenelg High School consistently ranks among the top in the state, attracting families willing to pay a premium.
The limited supply of new homes helps preserve high values, as demand outpaces inventory. Many of the properties here are custom-built, with acreage, private drives, and high-end finishes. That exclusivity has translated into a housing market that continues to thrive even when others cool down.
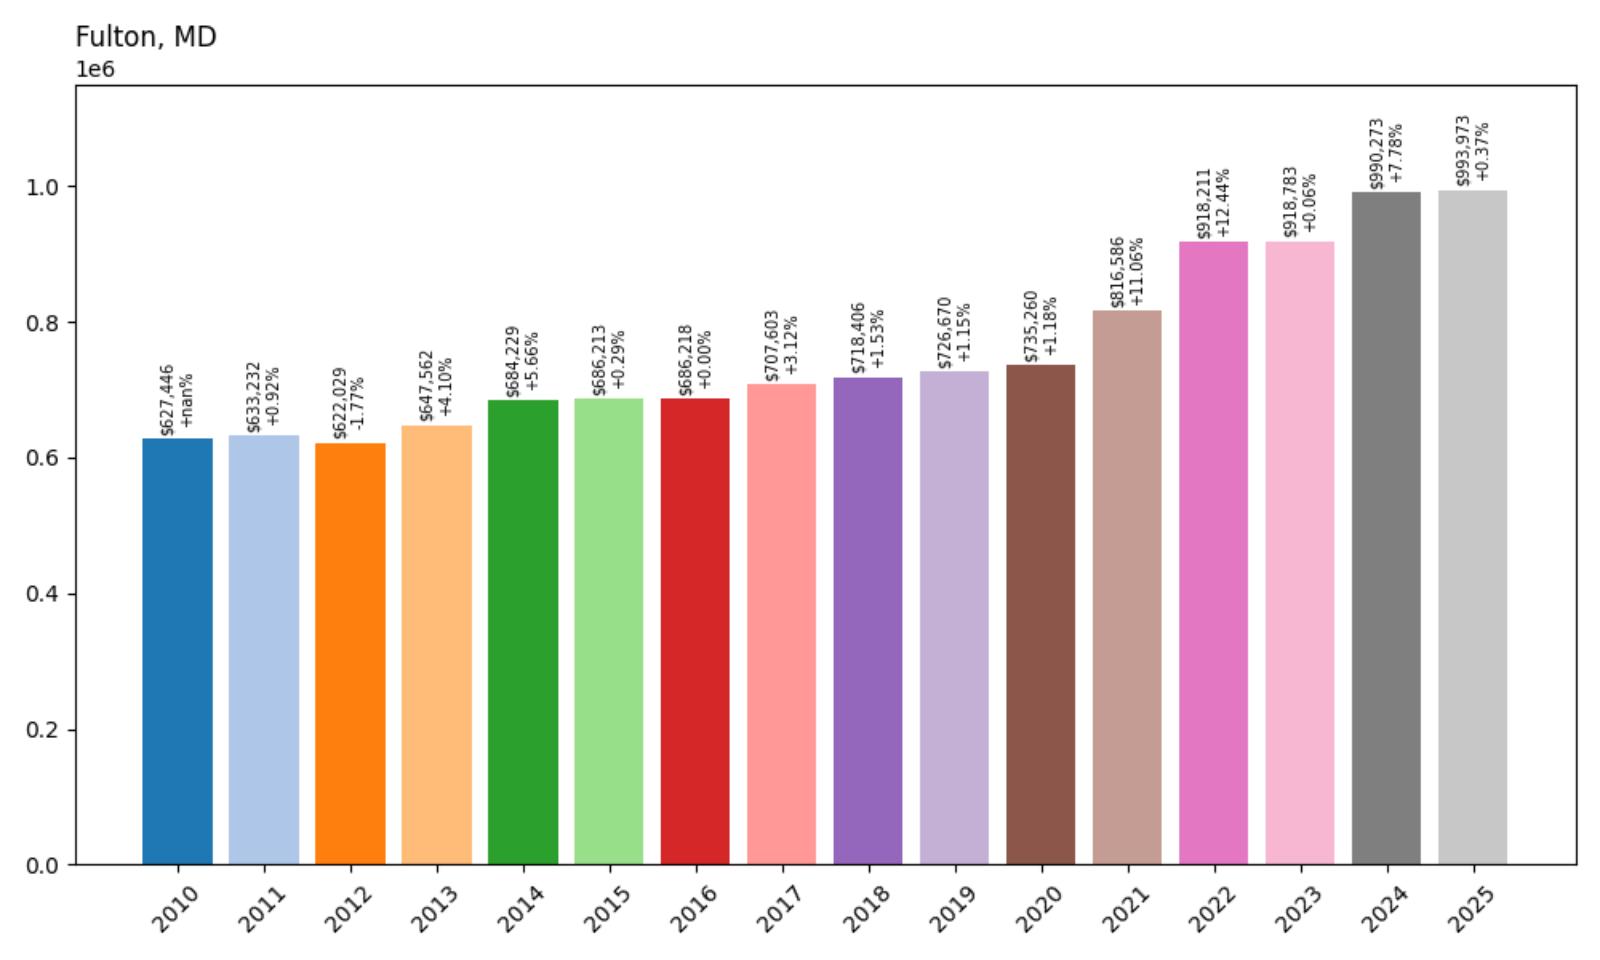
16. Fulton – 58% Home Price Increase Since 2010
- 2010: $627,446
- 2011: $633,232
- 2012: $622,029
- 2013: $647,562
- 2014: $684,229
- 2015: $686,213
- 2016: $686,218
- 2017: $707,603
- 2018: $718,406
- 2019: $726,670
- 2020: $735,260
- 2021: $816,586
- 2022: $918,211
- 2023: $918,783
- 2024: $990,273
- 2025: $993,973
Fulton has experienced steady price growth over the last 15 years, with home values rising more than $360K. After crossing the $900K mark in 2022, prices have continued rising through 2025. It now ranks among the priciest communities in central Maryland.
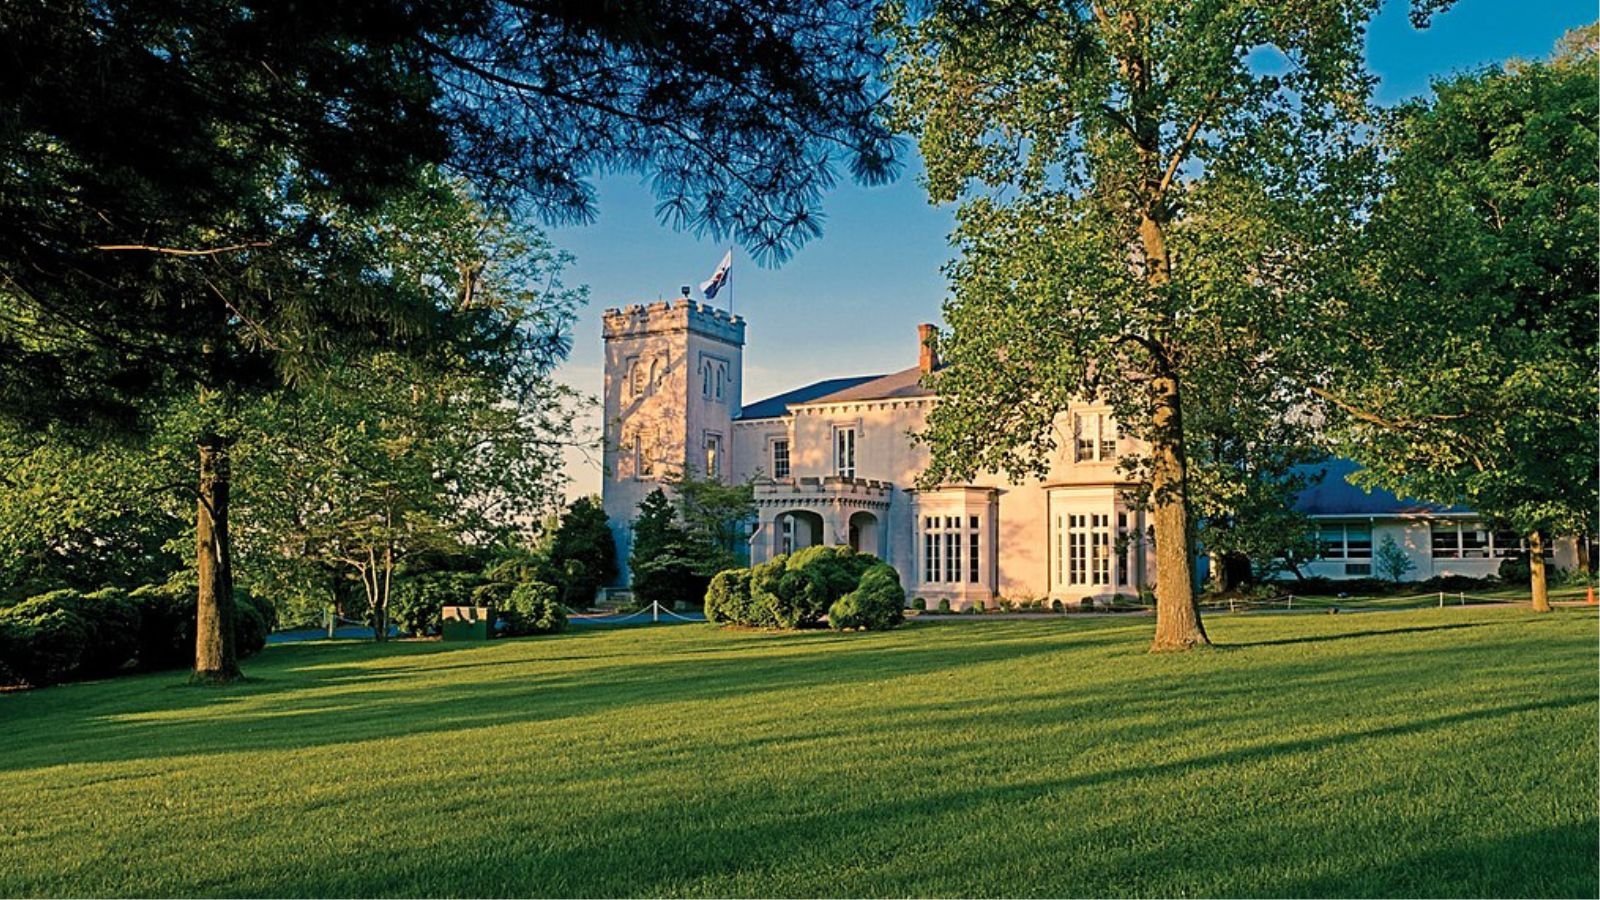
Fulton – Master-Planned Living with Top Amenities

Fulton blends suburban convenience with upscale living, thanks in large part to the Maple Lawn community—a popular master-planned development offering shops, restaurants, and town centers. This mixed-use neighborhood has transformed the local market, attracting professionals and families from nearby D.C. and Baltimore. The area also benefits from excellent schools and green space.
Home prices in Fulton began accelerating after 2013 and surged again after 2020. Its combination of modern development and location near key commuter routes makes it especially attractive to buyers seeking a higher-end lifestyle. The town’s continued growth and development have helped it sustain rising property values year after year.
15. Highland – 58% Home Price Increase Since 2010
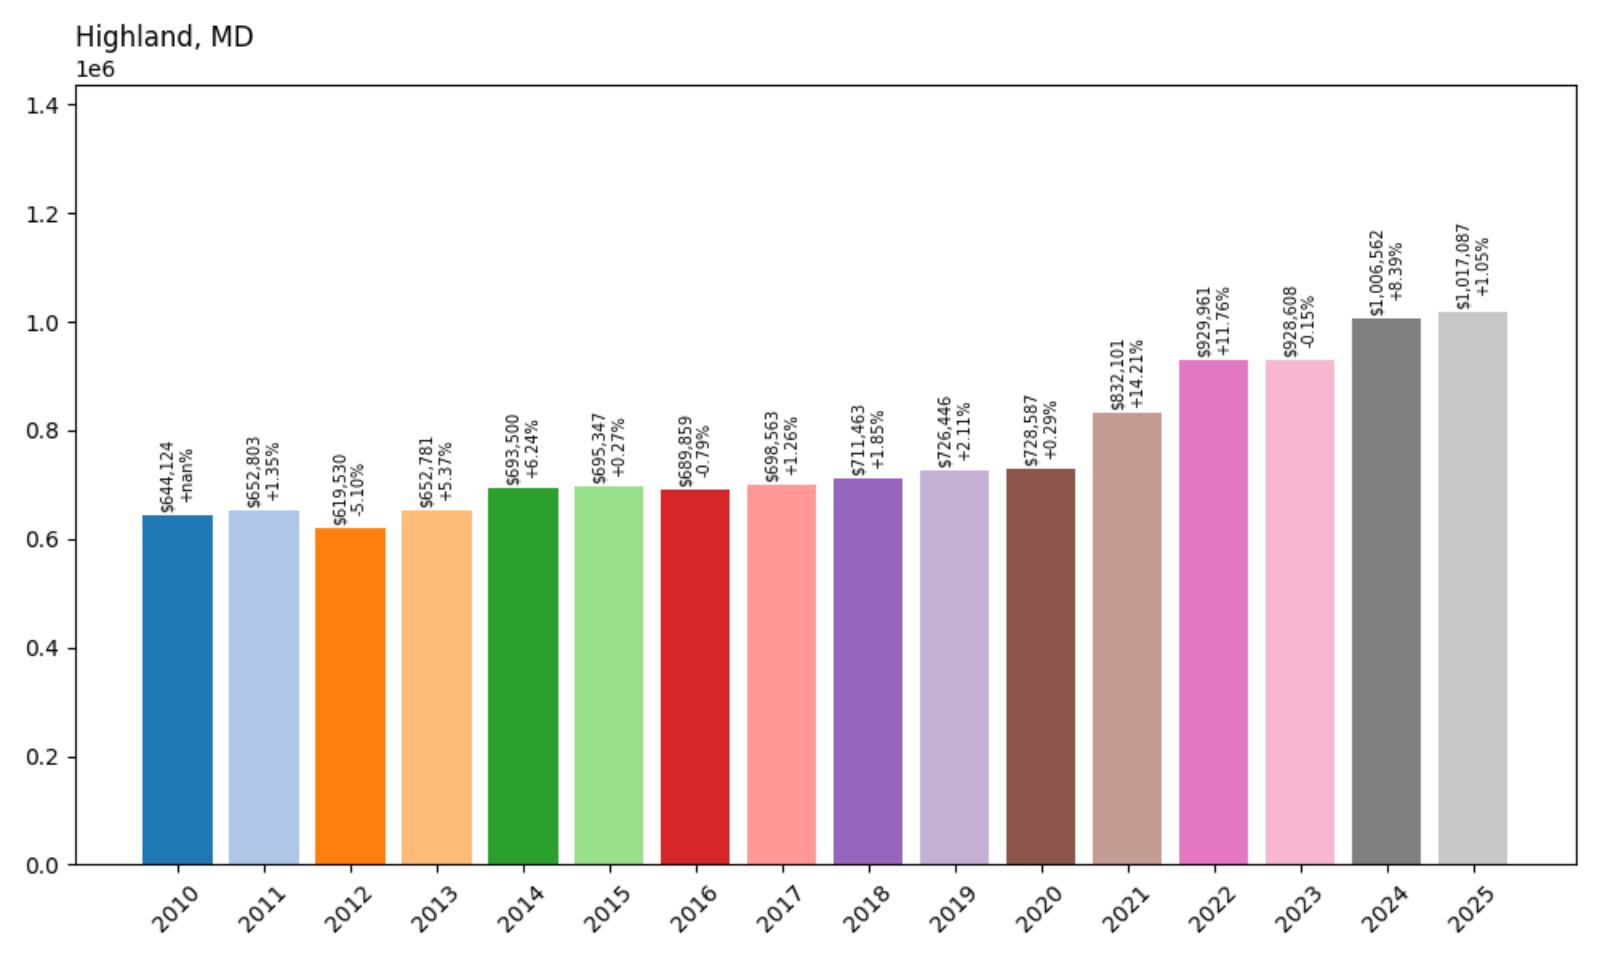
- 2010: $644,124
- 2011: $652,803
- 2012: $619,530
- 2013: $652,781
- 2014: $693,500
- 2015: $695,347
- 2016: $689,859
- 2017: $698,563
- 2018: $711,463
- 2019: $726,446
- 2020: $728,587
- 2021: $832,101
- 2022: $929,961
- 2023: $928,608
- 2024: $1,006,562
- 2025: $1,017,087
Home values in Highland have risen by roughly $373K since 2010, passing the $1 million threshold in 2024. The town saw strong gains during the 2020–2022 period and has remained on an upward trajectory. Highland now ranks among Maryland’s most exclusive and expensive communities.
Highland – Quiet Luxury in Southern Howard County
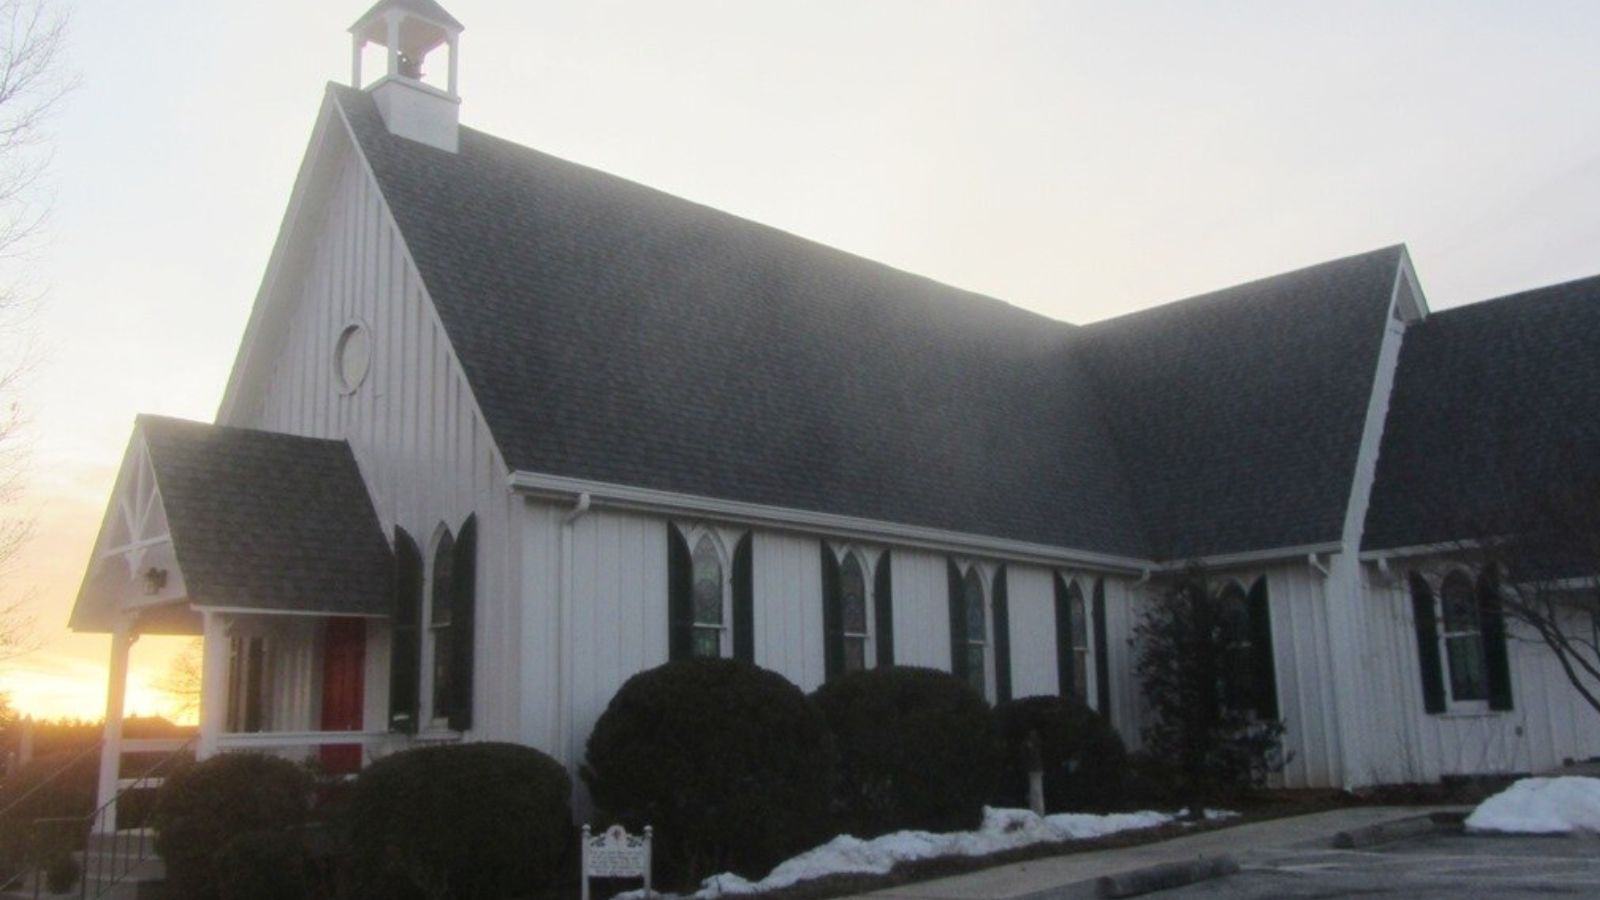
Highland offers a rural atmosphere with upscale appeal, featuring large custom homes on generous lots. Located in southern Howard County, it’s a preferred spot for buyers looking for privacy, luxury, and access to top public schools. The town has limited commercial development, which helps preserve its tranquil setting.
The rise in prices reflects growing demand for high-end homes in peaceful, low-density areas. Many of Highland’s properties feature manicured acreage, private driveways, and expansive interiors. As the area remains tightly zoned, high demand continues to drive prices upward in 2025.
14. Darnestown – 40% Home Price Increase Since 2010
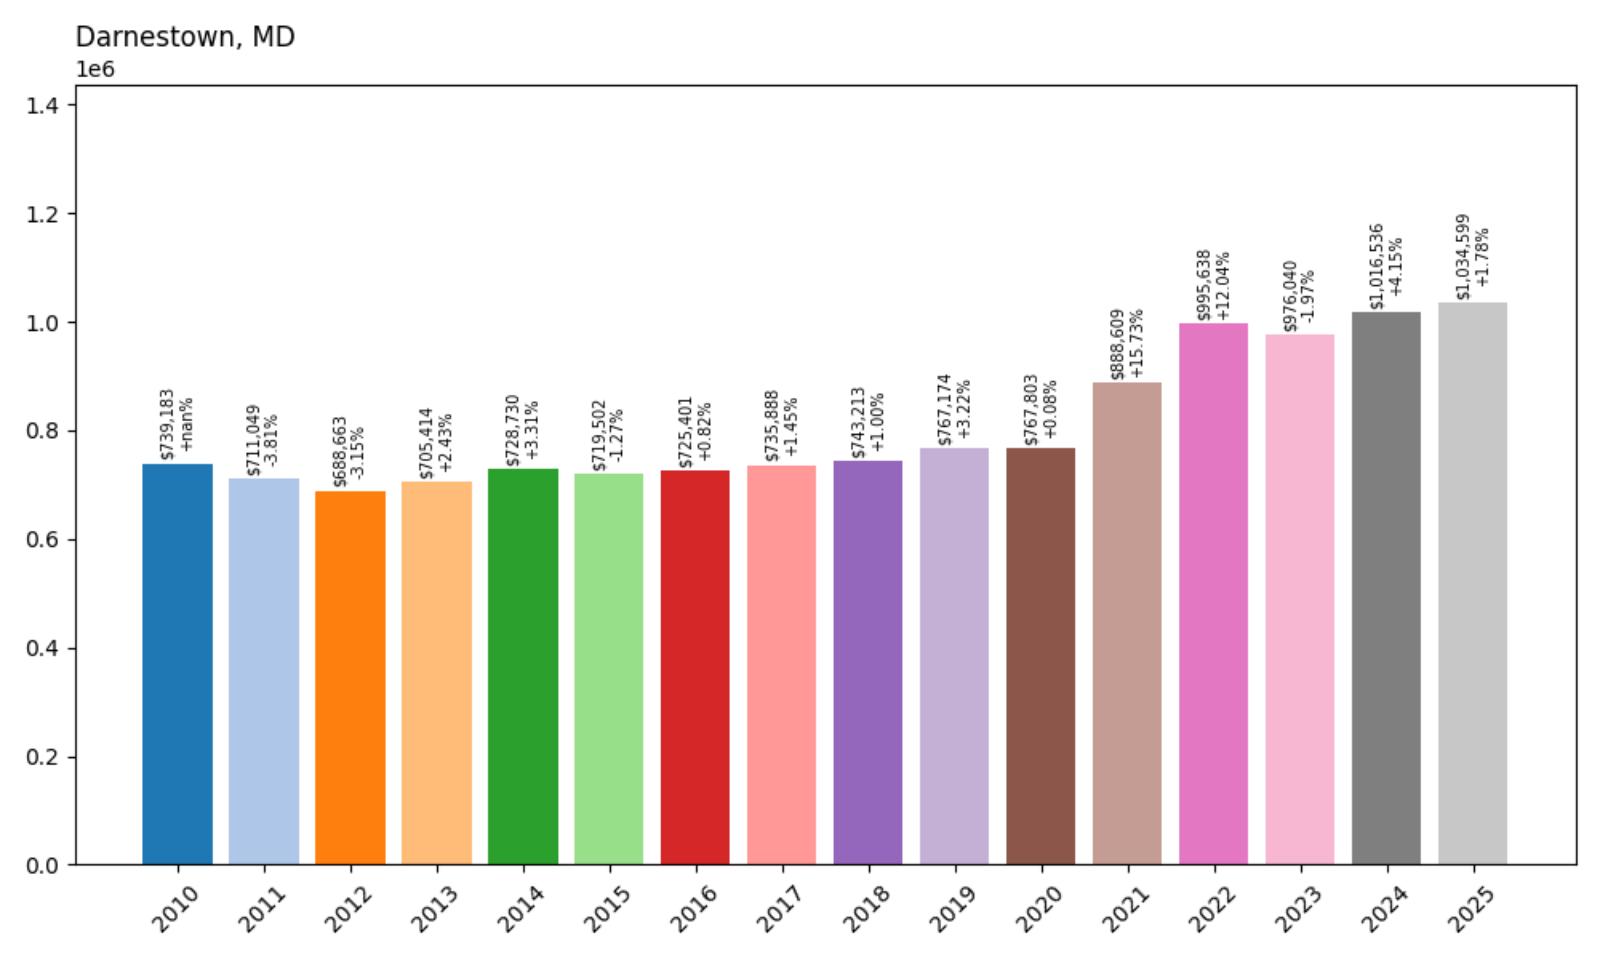
- 2010: $739,183
- 2011: $711,049
- 2012: $688,663
- 2013: $705,414
- 2014: $728,730
- 2015: $719,502
- 2016: $725,401
- 2017: $735,888
- 2018: $743,213
- 2019: $767,174
- 2020: $767,803
- 2021: $888,609
- 2022: $995,638
- 2023: $976,040
- 2024: $1,016,536
- 2025: $1,034,599
Darnestown has seen home values rise over $295K since 2010, with most of that growth occurring in the past five years. Prices passed the $1 million mark in 2024 and have continued to climb in 2025. The market here remains competitive despite minor dips in 2023.
Darnestown – Spacious Homes and Scenic Settings

Darnestown is located in Montgomery County near the Potomac River, offering a blend of upscale suburban homes and rural scenery. Residents enjoy generous property sizes, quiet roads, and access to parks and trails. The area is also within commuting range of both Bethesda and Washington, D.C., making it attractive to professionals with families.
After a brief period of market softness in 2023, values bounced back strongly in 2024 and 2025. Buyers are drawn to the town’s combination of size, location, and exclusivity. With limited new development, existing homes in Darnestown continue to command high prices.
13. West Friendship – 60% Home Price Increase Since 2010
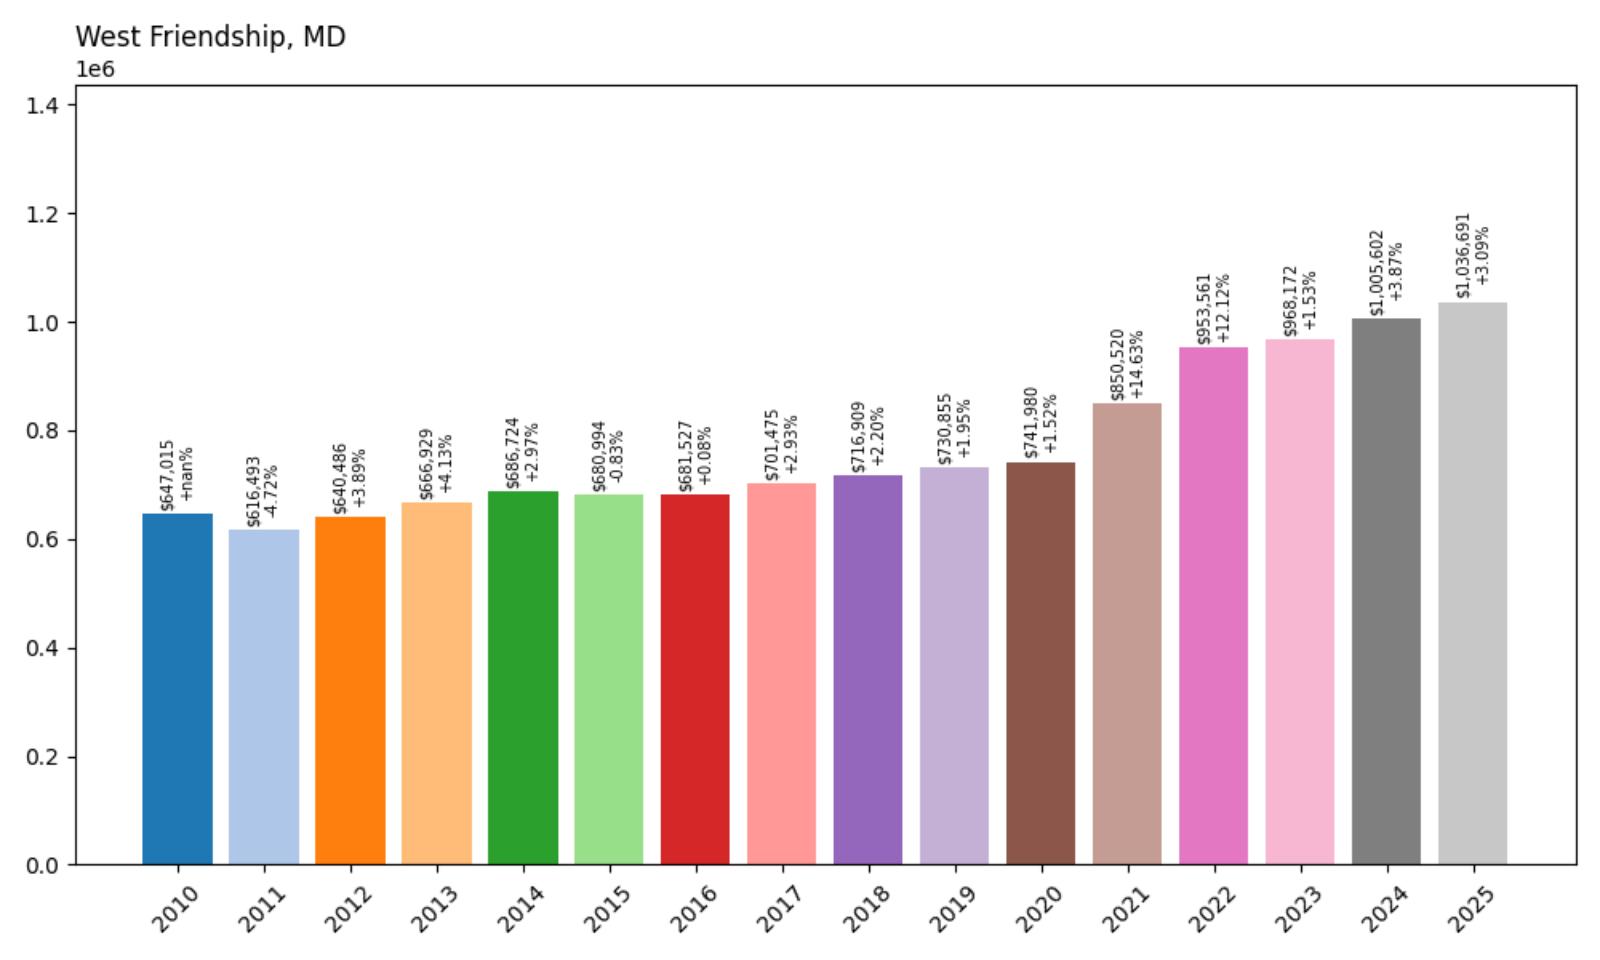
- 2010: $647,015
- 2011: $616,493
- 2012: $640,486
- 2013: $666,929
- 2014: $686,724
- 2015: $680,994
- 2016: $681,527
- 2017: $701,475
- 2018: $716,909
- 2019: $730,855
- 2020: $741,980
- 2021: $850,520
- 2022: $953,561
- 2023: $968,172
- 2024: $1,005,602
- 2025: $1,036,691
Home prices in West Friendship have grown over $389K since 2010, with especially rapid increases after 2020. Values passed $1 million in 2024 and have continued climbing in 2025. The town’s large lots and rural charm help fuel its strong housing demand.
West Friendship – Rural Living with Upscale Homes

Located in Howard County, West Friendship is a community known for expansive properties, horse farms, and a quiet lifestyle. It’s a popular destination for high-income buyers seeking space and privacy without leaving central Maryland. The area’s location near I-70 also makes it accessible to commuters headed to Baltimore or Frederick.
The combination of limited housing stock and high demand has made West Friendship one of the most expensive places in the state. Its real estate market was once overlooked but has become increasingly competitive in recent years. Today, homes regularly list above $1 million, especially those with land and custom upgrades.
12. Clarksville – 70% Home Price Increase Since 2010
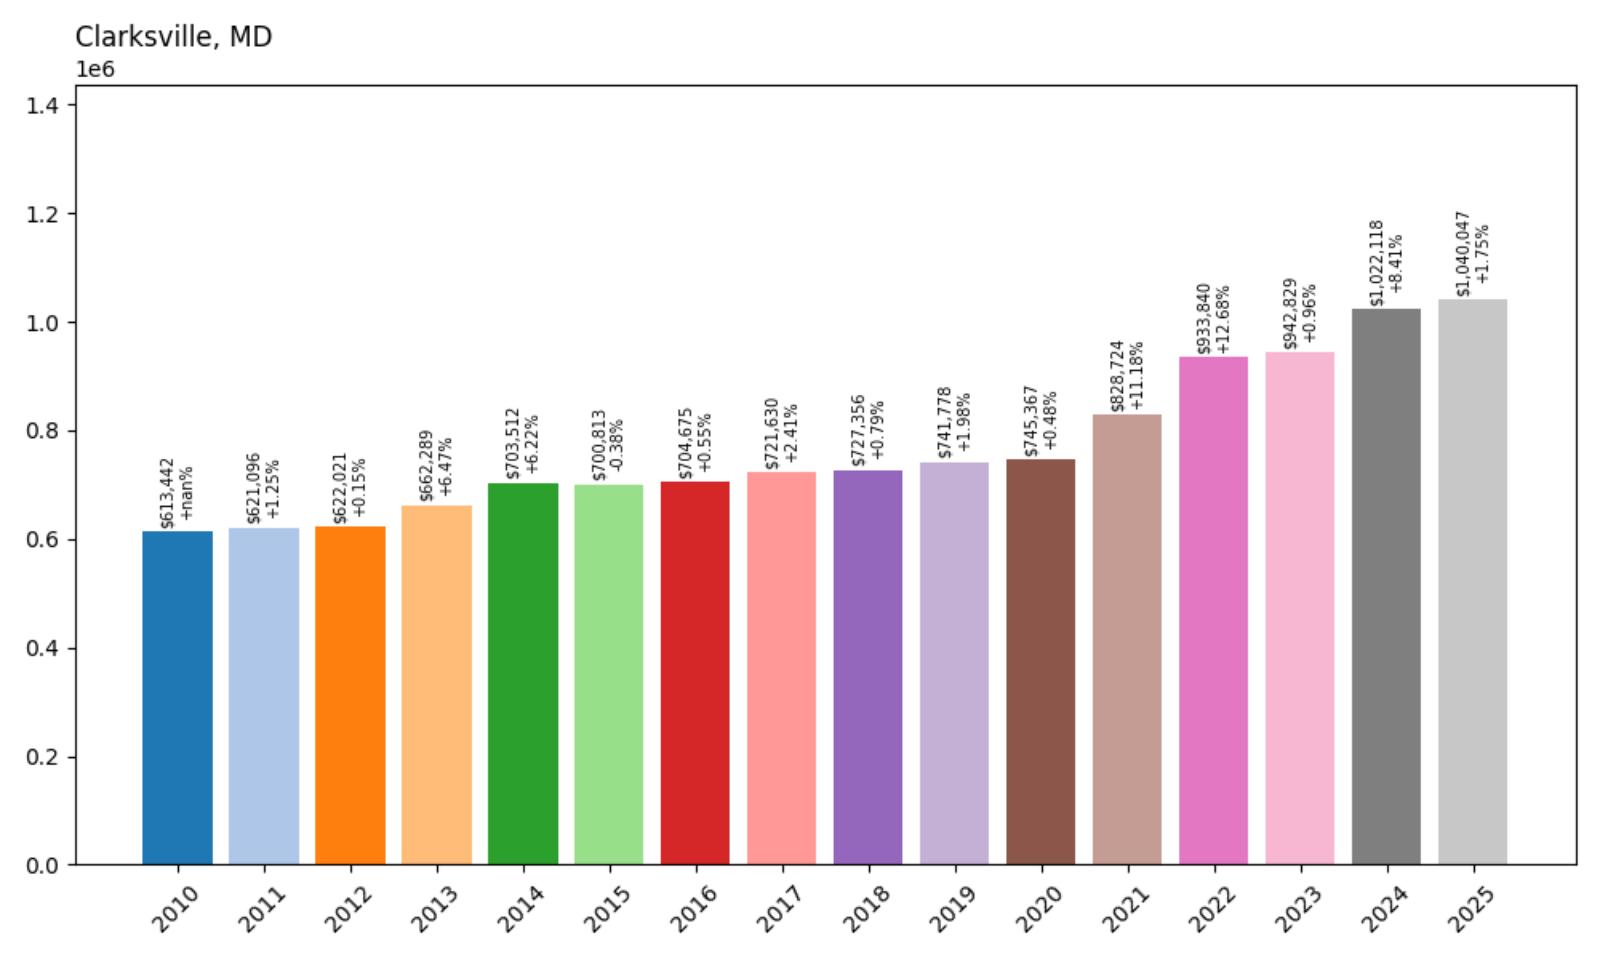
- 2010: $613,442
- 2011: $621,096
- 2012: $622,021
- 2013: $662,289
- 2014: $703,512
- 2015: $700,813
- 2016: $704,675
- 2017: $721,630
- 2018: $727,356
- 2019: $741,778
- 2020: $745,367
- 2021: $828,724
- 2022: $933,840
- 2023: $942,829
- 2024: $1,022,118
- 2025: $1,040,047
Clarksville’s home prices have risen dramatically—by more than $426K—since 2010, reflecting both sustained demand and high-income buyer activity. After reaching $1 million in 2024, prices have continued to grow through 2025. The community remains one of the most consistently expensive places to live in Howard County.
Clarksville – Elite Suburban Living in the Heart of Howard County

Clarksville is known for its upscale homes, large lots, and proximity to top-rated schools, including those within the River Hill district. It has long attracted affluent families seeking privacy and educational excellence within easy commuting distance of both Baltimore and Washington, D.C. The area offers a mix of stately single-family homes, country estates, and newer luxury builds.
The real estate market in Clarksville barely flinched during national slowdowns, with values rising steadily every year since 2013. The biggest spikes occurred from 2021 to 2024, driven by extremely tight inventory and surging demand. Clarksville’s high quality of life and limited housing supply help explain its rapid climb to the top of Maryland’s price charts.
11. Glenwood – 55% Home Price Increase Since 2010
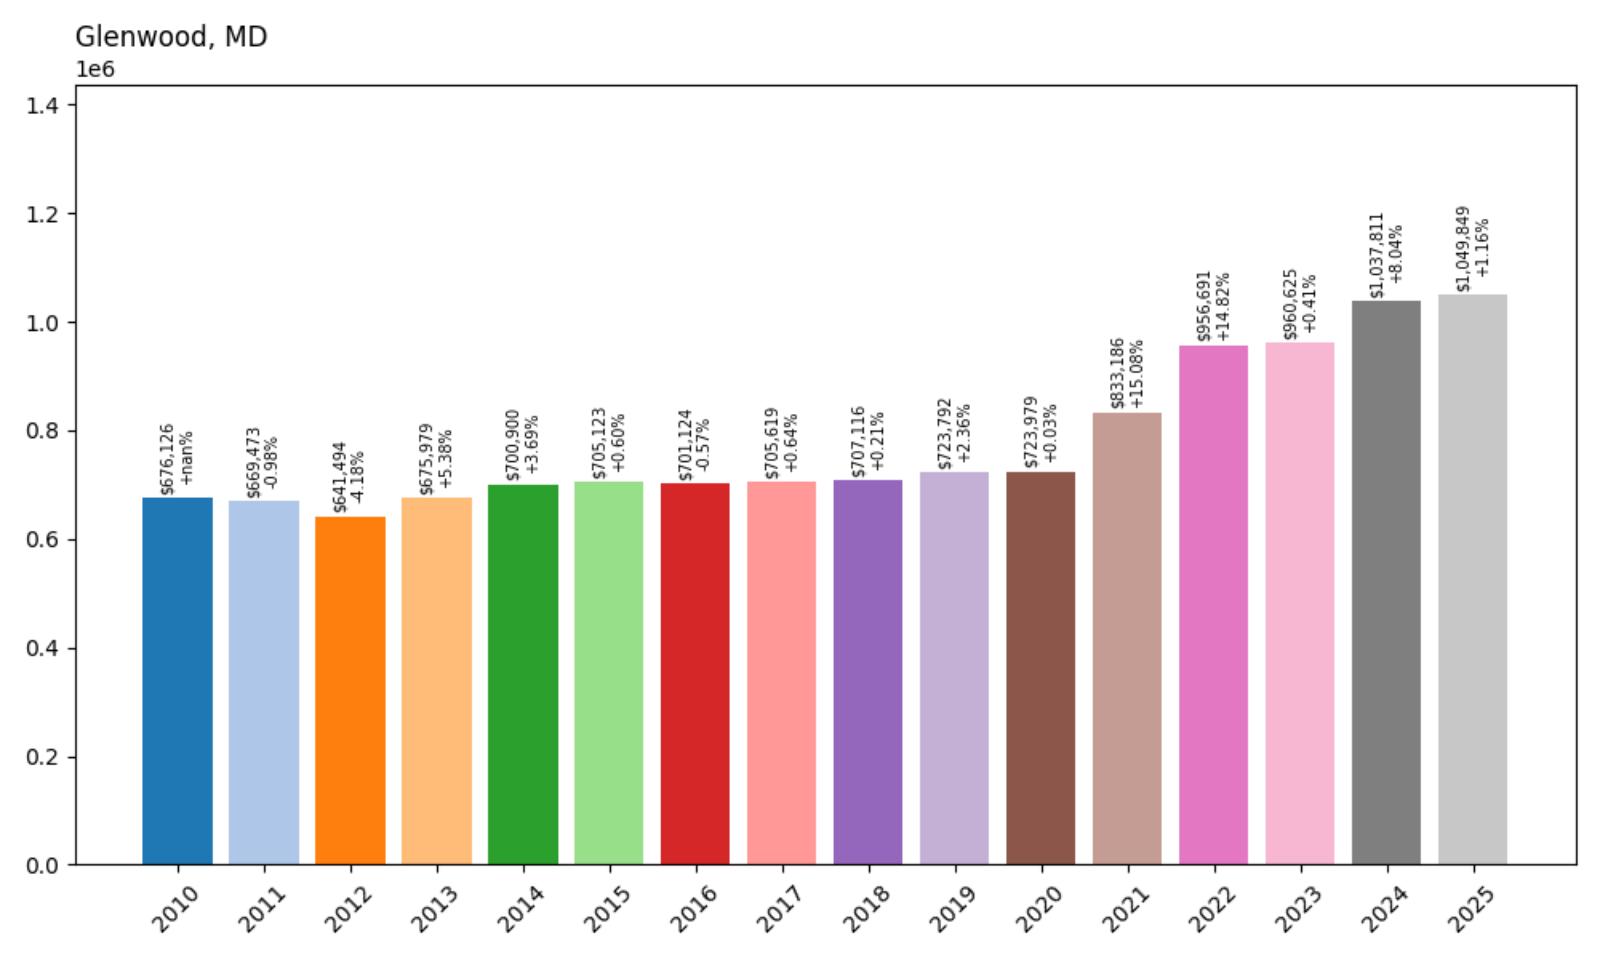
- 2010: $676,126
- 2011: $669,473
- 2012: $641,494
- 2013: $675,979
- 2014: $700,900
- 2015: $705,123
- 2016: $701,124
- 2017: $705,619
- 2018: $707,116
- 2019: $723,792
- 2020: $723,979
- 2021: $833,186
- 2022: $956,691
- 2023: $960,625
- 2024: $1,037,811
- 2025: $1,049,849
Glenwood’s home values have increased by over $370K since 2010, and now sit comfortably above the $1 million threshold. Price growth has been especially robust since 2020, with gains continuing into 2025. Glenwood’s steady rise places it near the top of the Howard County market.
Glenwood – A Quiet, High-End Alternative to the Suburbs

Glenwood offers a refined, low-density alternative to Maryland’s more congested suburbs. Nestled in western Howard County, the town is home to expansive lots, luxury estates, and a peaceful atmosphere that appeals to discerning buyers. Despite its rural setting, Glenwood offers convenient access to major highways and shopping in nearby Ellicott City or Columbia.
The community’s real estate market surged during the pandemic and has held strong as demand for larger homes continues. Many properties feature custom architecture, high-end amenities, and significant acreage, driving competition and premium pricing. Glenwood continues to benefit from its appeal to buyers looking for space, privacy, and exclusivity within a top-performing county.
10. Dayton – 57% Home Price Increase Since 2010

- 2010: $691,612
- 2011: $686,807
- 2012: $664,877
- 2013: $686,891
- 2014: $721,394
- 2015: $705,249
- 2016: $712,056
- 2017: $718,075
- 2018: $725,617
- 2019: $739,067
- 2020: $740,112
- 2021: $850,984
- 2022: $961,549
- 2023: $976,588
- 2024: $1,068,401
- 2025: $1,086,189
Dayton’s property values have climbed by nearly $395K since 2010, reflecting strong and consistent market performance. Price increases accelerated after 2020 and continued through 2025, breaking the $1 million mark last year. Today, Dayton ranks among Maryland’s ten most expensive towns.
Dayton – Equestrian Elegance and Expansive Homes

Located in rural Howard County, Dayton is known for its horse farms, country lanes, and luxury homes on multi-acre lots. This peaceful community is ideal for buyers seeking space, prestige, and scenic surroundings. It also offers top-tier schools and proximity to employment centers, which help sustain buyer interest year after year.
Dayton’s market is bolstered by limited development and a strong sense of community. Many of the homes here are custom-built with premium features, catering to high-net-worth buyers. As inventory remains tight and demand high, Dayton continues to see price appreciation even in slower statewide markets.
9. Garrett Park – 64% Home Price Increase Since 2010
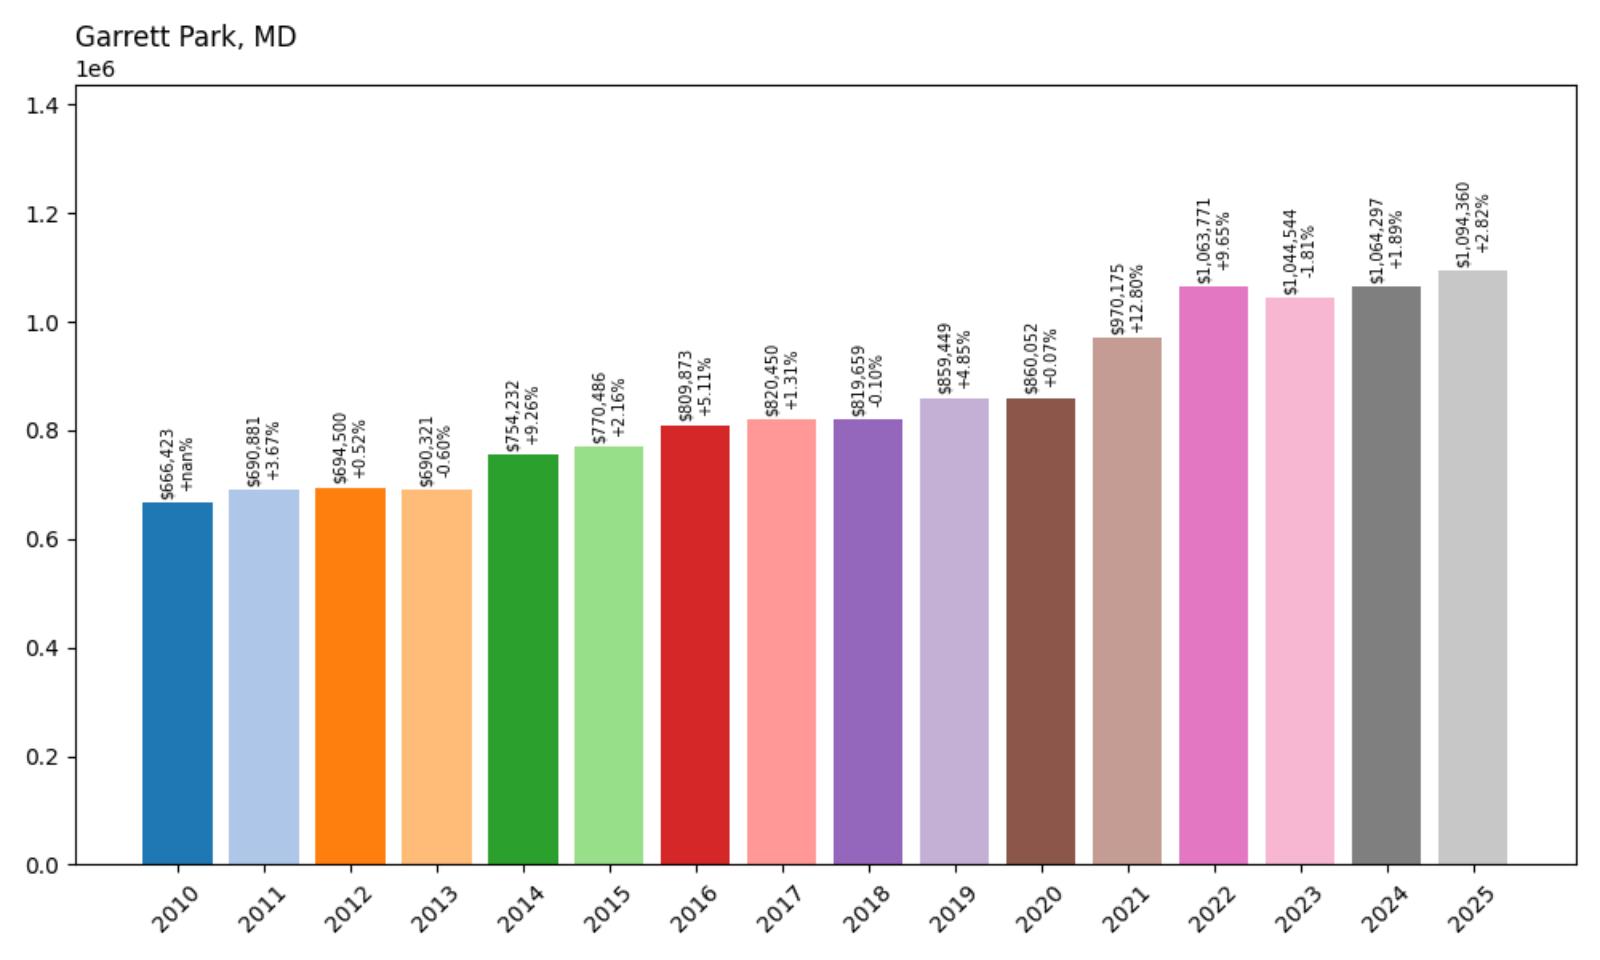
- 2010: $666,423
- 2011: $690,881
- 2012: $694,500
- 2013: $690,321
- 2014: $754,232
- 2015: $770,486
- 2016: $809,873
- 2017: $820,450
- 2018: $819,659
- 2019: $859,449
- 2020: $860,052
- 2021: $970,175
- 2022: $1,063,771
- 2023: $1,044,544
- 2024: $1,064,297
- 2025: $1,094,360
Garrett Park’s median home price has risen more than $425K since 2010, with prices remaining above $1 million since 2022. This historic Montgomery County town has experienced consistent growth, with only modest fluctuations. In 2025, it holds a firm spot in Maryland’s top ten most expensive towns.
Garrett Park – Historic Homes in a Protected Setting

Garrett Park is one of the few towns in the country designated as an entire historic district, with tree-lined streets and a quiet, walkable layout. Located just outside of Bethesda, it offers quick access to D.C. while retaining a small-town, almost village-like charm. Its distinctive Victorian architecture and town ordinances protecting the built environment contribute to enduring property values.
Buyers here value the community’s identity, proximity to public transportation, and access to Rock Creek Park and other green space. Limited inventory and high demand have driven prices above $1 million despite occasional annual dips. Garrett Park remains one of Montgomery County’s most sought-after—and tightly held—addresses.
8. Royal Oak – 68% Home Price Increase Since 2010
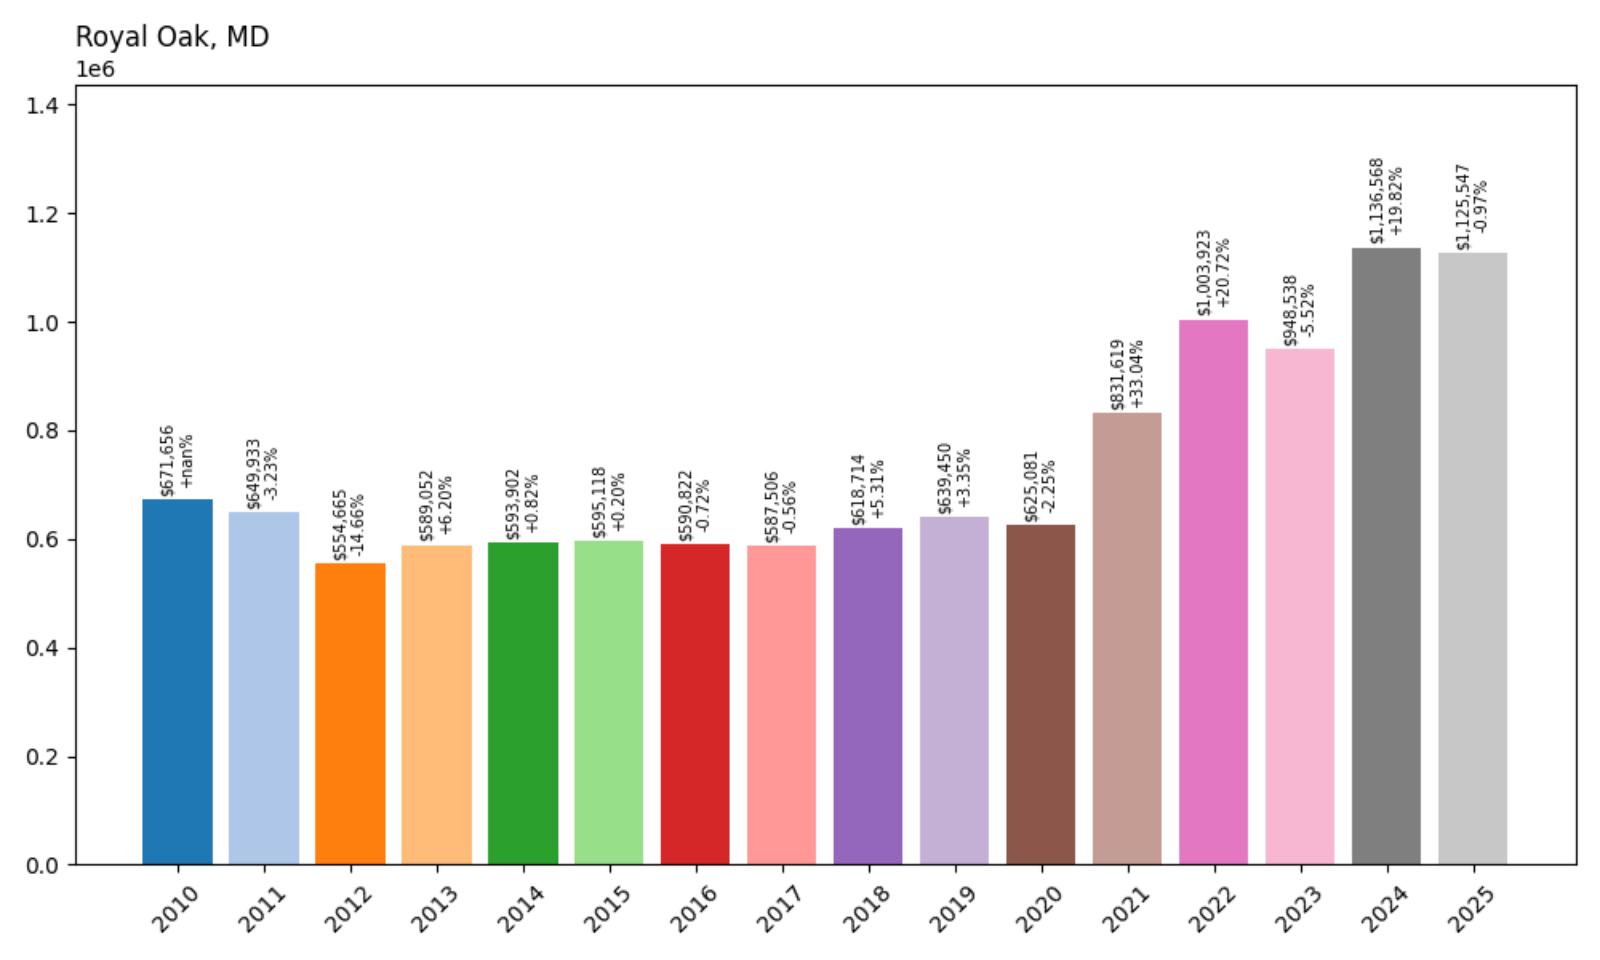
- 2010: $671,656
- 2011: $649,933
- 2012: $554,665
- 2013: $589,052
- 2014: $593,902
- 2015: $595,118
- 2016: $590,822
- 2017: $587,506
- 2018: $618,714
- 2019: $639,450
- 2020: $625,081
- 2021: $831,619
- 2022: $1,003,923
- 2023: $948,538
- 2024: $1,136,568
- 2025: $1,125,547
Royal Oak’s home prices have increased by more than $450K since 2010, with a dramatic surge in the past five years. The town crossed the million-dollar mark in 2022 and has hovered above it since. In 2025, the average home value sits at approximately $1.13 million.
Royal Oak – Waterfront Prestige on the Eastern Shore
Situated just across the Tred Avon River from Oxford, Royal Oak is a quiet Talbot County enclave known for luxury waterfront living. The town draws retirees, vacationers, and wealthy buyers looking for Eastern Shore serenity paired with upscale real estate. Its marinas and bay views offer a lifestyle that feels far removed from the urban grind.
Prices fell slightly in 2023 but rebounded with a massive leap in 2024. The area’s scarcity of buildable land, plus demand for scenic homes, continues to drive high valuations. Royal Oak now ranks as one of the most expensive and exclusive waterfront markets in the state.
7. Bethesda – 50% Home Price Increase Since 2010
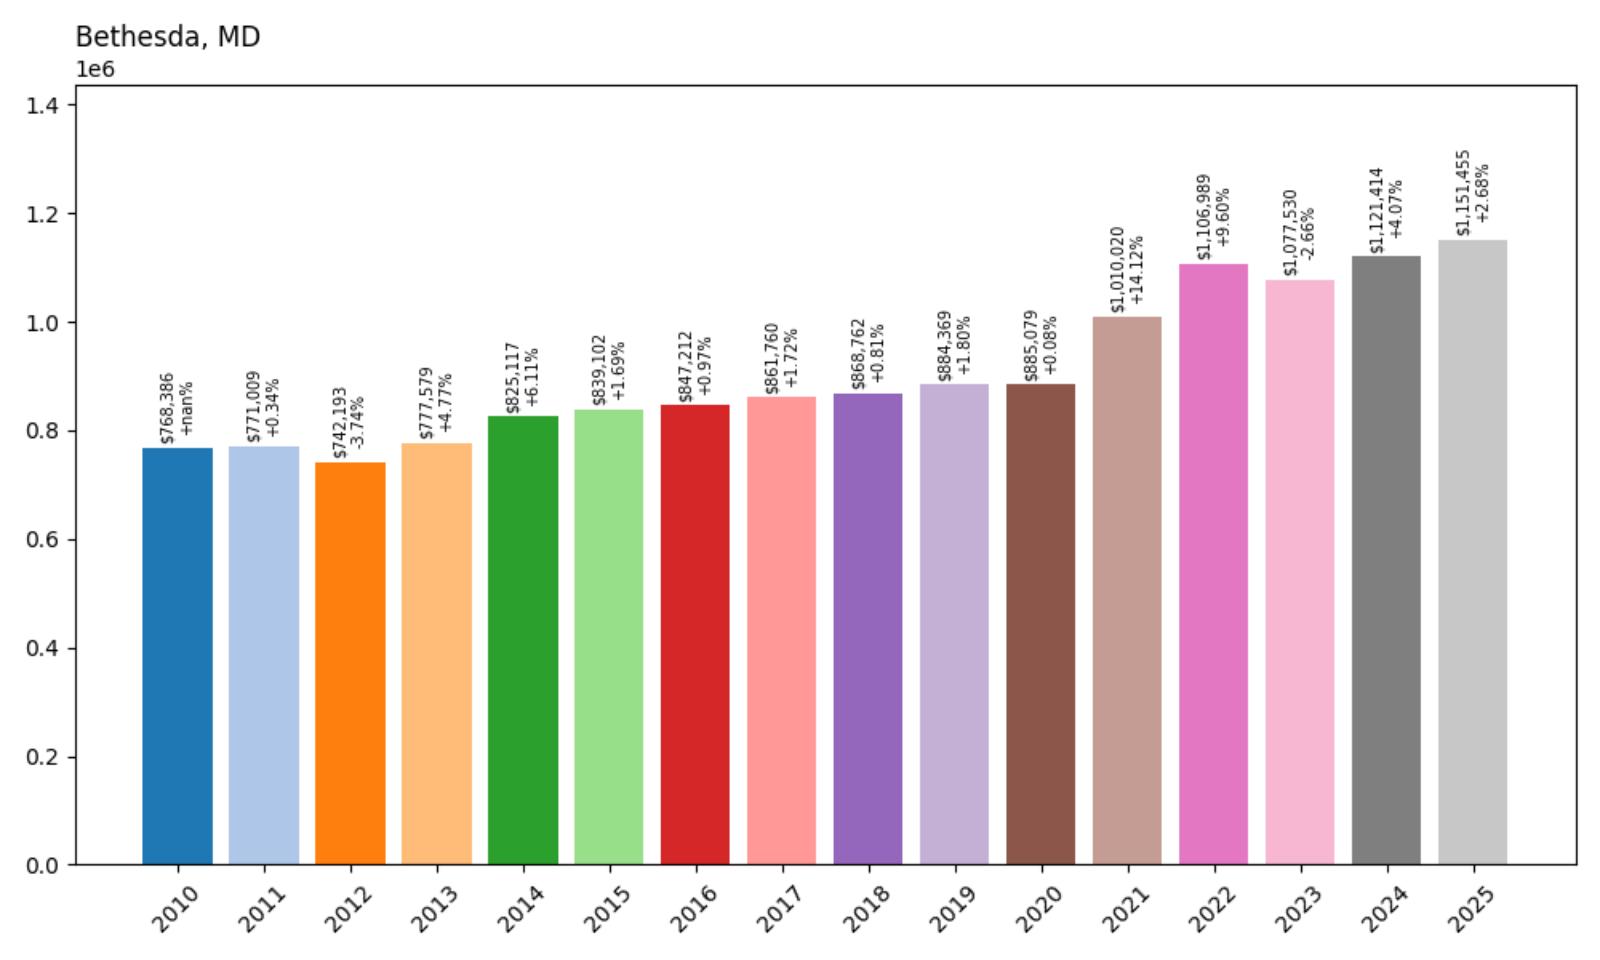
- 2010: $768,386
- 2011: $771,009
- 2012: $742,193
- 2013: $777,579
- 2014: $825,117
- 2015: $839,102
- 2016: $847,212
- 2017: $861,760
- 2018: $868,762
- 2019: $884,369
- 2020: $885,079
- 2021: $1,010,020
- 2022: $1,106,989
- 2023: $1,077,530
- 2024: $1,121,414
- 2025: $1,151,455
Bethesda’s home values have increased by more than $380K since 2010, passing the $1 million mark in 2021 and continuing to rise since. The local market saw a slight dip in 2023 but quickly recovered in 2024 and 2025. Now averaging over $1.15 million, Bethesda remains one of the state’s most desirable places to buy a home.
Bethesda – Urban Amenities With Suburban Prestige

Bethesda combines walkable neighborhoods, elite public schools, and a high concentration of shops, restaurants, and cultural venues. It’s one of the most affluent and educated communities in the country, drawing government leaders, healthcare professionals, and tech executives alike. With quick access to downtown D.C., it remains a top choice for commuters.
Real estate in Bethesda ranges from luxury condos to multi-million-dollar single-family homes, all supported by strong demand and high incomes. Market resilience has been a hallmark here, with prices climbing steadily despite national slowdowns. Bethesda’s blend of convenience, status, and livability keeps it near the top of Maryland’s price hierarchy.
6. Chevy Chase – 61% Home Price Increase Since 2010
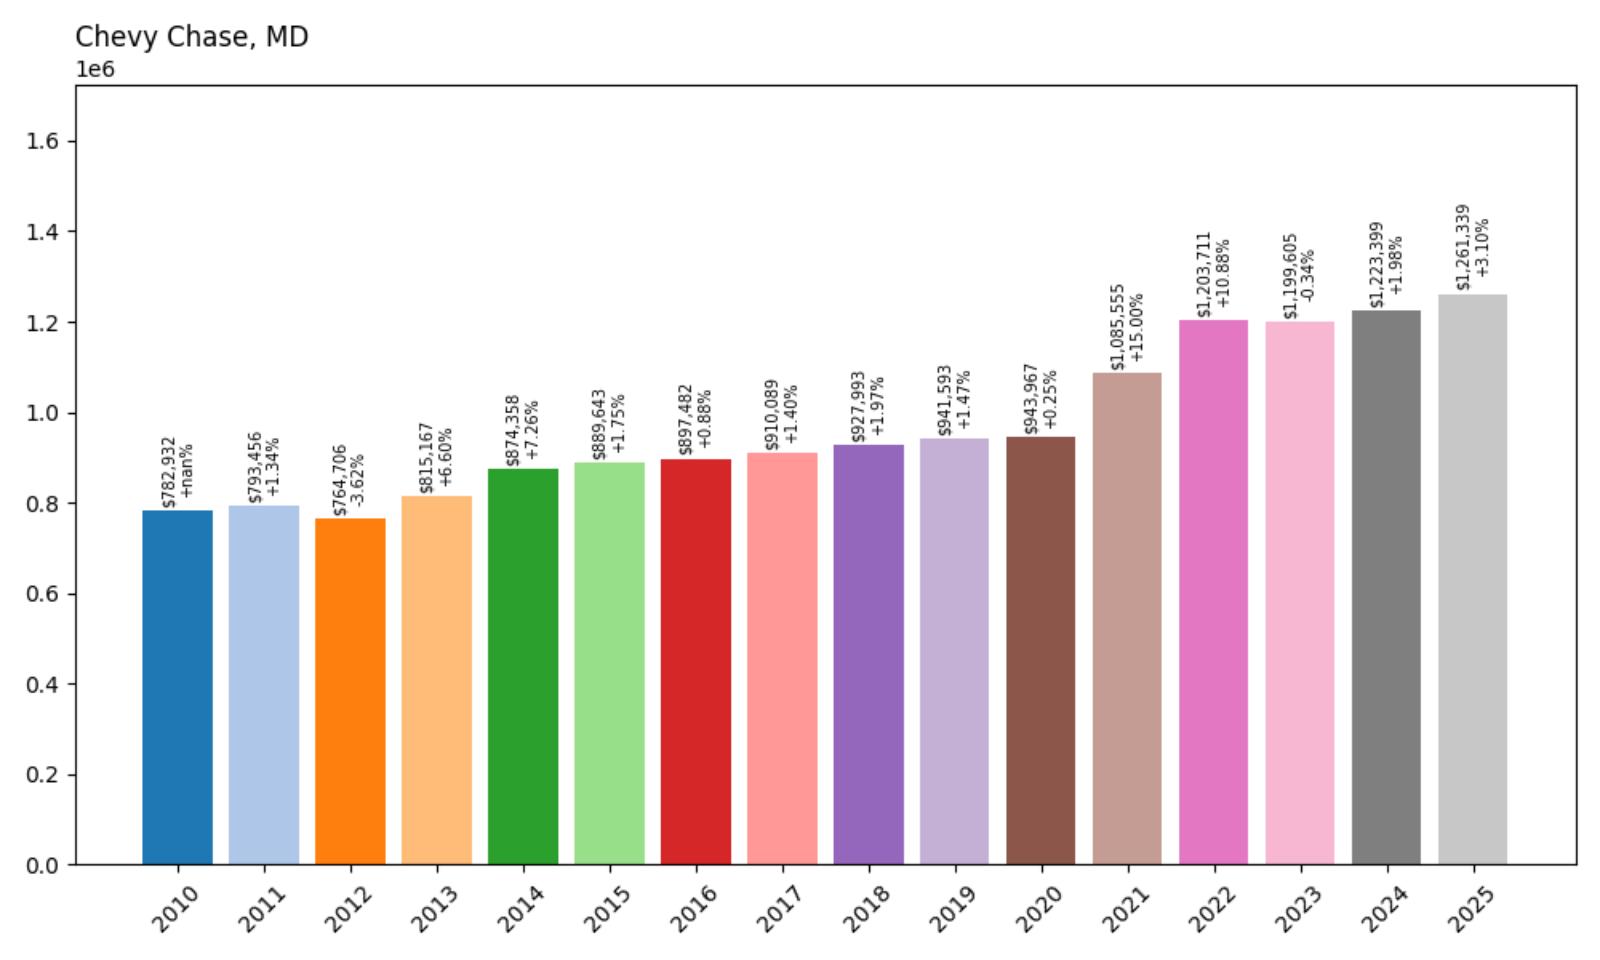
- 2010: $782,932
- 2011: $793,456
- 2012: $764,706
- 2013: $815,167
- 2014: $874,358
- 2015: $889,643
- 2016: $897,482
- 2017: $910,089
- 2018: $927,993
- 2019: $941,593
- 2020: $943,967
- 2021: $1,085,555
- 2022: $1,203,711
- 2023: $1,199,605
- 2024: $1,223,399
- 2025: $1,261,339
Chevy Chase home prices have increased more than $478K since 2010, with particularly strong gains after 2020. Median values rose above $1.2 million in 2022 and now sit just over $1.26 million in 2025. The area remains one of the most prestigious—and expensive—addresses in the state.
Chevy Chase – Historic Affluence on the D.C. Border

Chevy Chase straddles the Maryland-D.C. line and is known for its tree-lined streets, early 20th-century architecture, and close proximity to the nation’s capital. The community has long attracted government officials, diplomats, and professionals drawn to its charm, walkability, and exclusivity. It’s a neighborhood where demand rarely wanes, regardless of broader market trends.
The real estate market here is fueled by scarcity and high demand, particularly in the historic sections closest to downtown D.C. Homes rarely stay on the market long, and bidding wars are common for well-maintained properties. With home values climbing past $1.25 million in 2025, Chevy Chase continues to set the standard for luxury suburban living in Maryland.
5. Cabin John – 57% Home Price Increase Since 2010
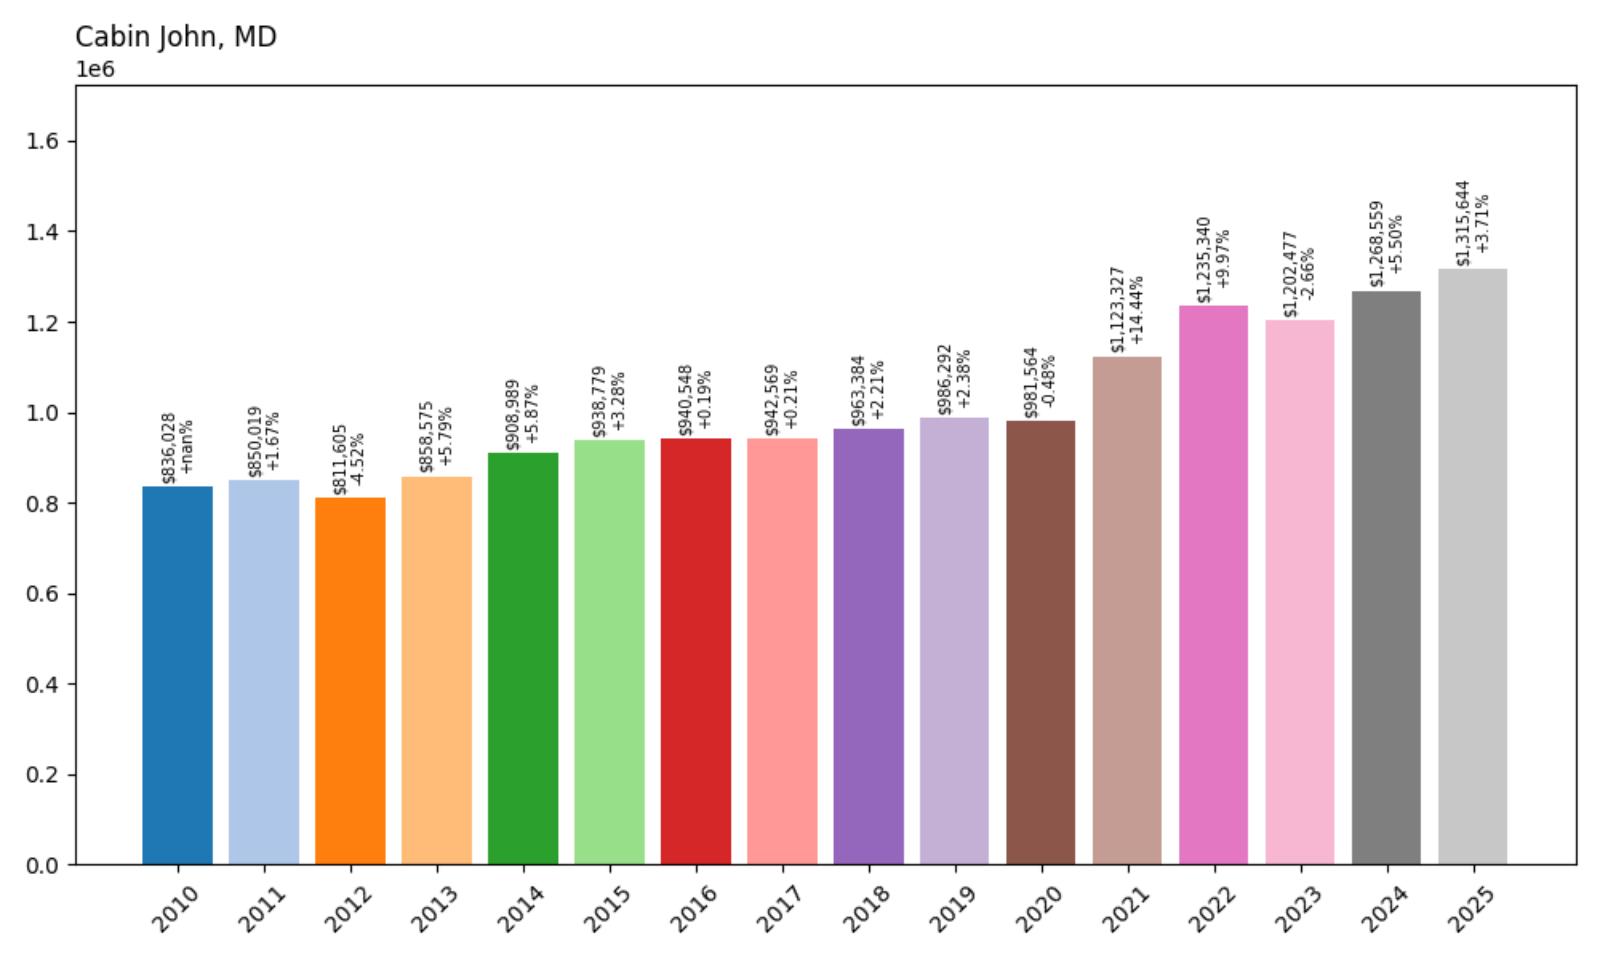
- 2010: $836,028
- 2011: $850,019
- 2012: $811,605
- 2013: $858,575
- 2014: $908,989
- 2015: $938,779
- 2016: $940,548
- 2017: $942,569
- 2018: $963,384
- 2019: $986,292
- 2020: $981,564
- 2021: $1,123,327
- 2022: $1,235,340
- 2023: $1,202,477
- 2024: $1,268,559
- 2025: $1,315,644
Cabin John has seen an increase of nearly $480K in home values since 2010, reaching an average price of over $1.31 million in 2025. The area posted consistent growth over the past decade, with strong jumps during the 2021–2022 market surge. Recent gains continue to push the town higher on Maryland’s list of most expensive communities.
Cabin John – Waterfront Charm and Elite Real Estate

Cabin John sits just west of Bethesda along the Potomac River, offering a secluded, wooded feel just minutes from the Beltway. With a mix of historic homes and sleek modern architecture, it appeals to buyers who want luxury and location in equal measure. The nearby C&O Canal and Cabin John Park provide outdoor appeal, while D.C. remains within easy reach.
Prices in Cabin John have soared due to tight inventory and sustained demand from high-income professionals. It’s a neighborhood where homes are often custom-built and rarely come on the market. With values steadily rising and limited space for new construction, Cabin John is firmly established as one of Maryland’s elite housing markets.
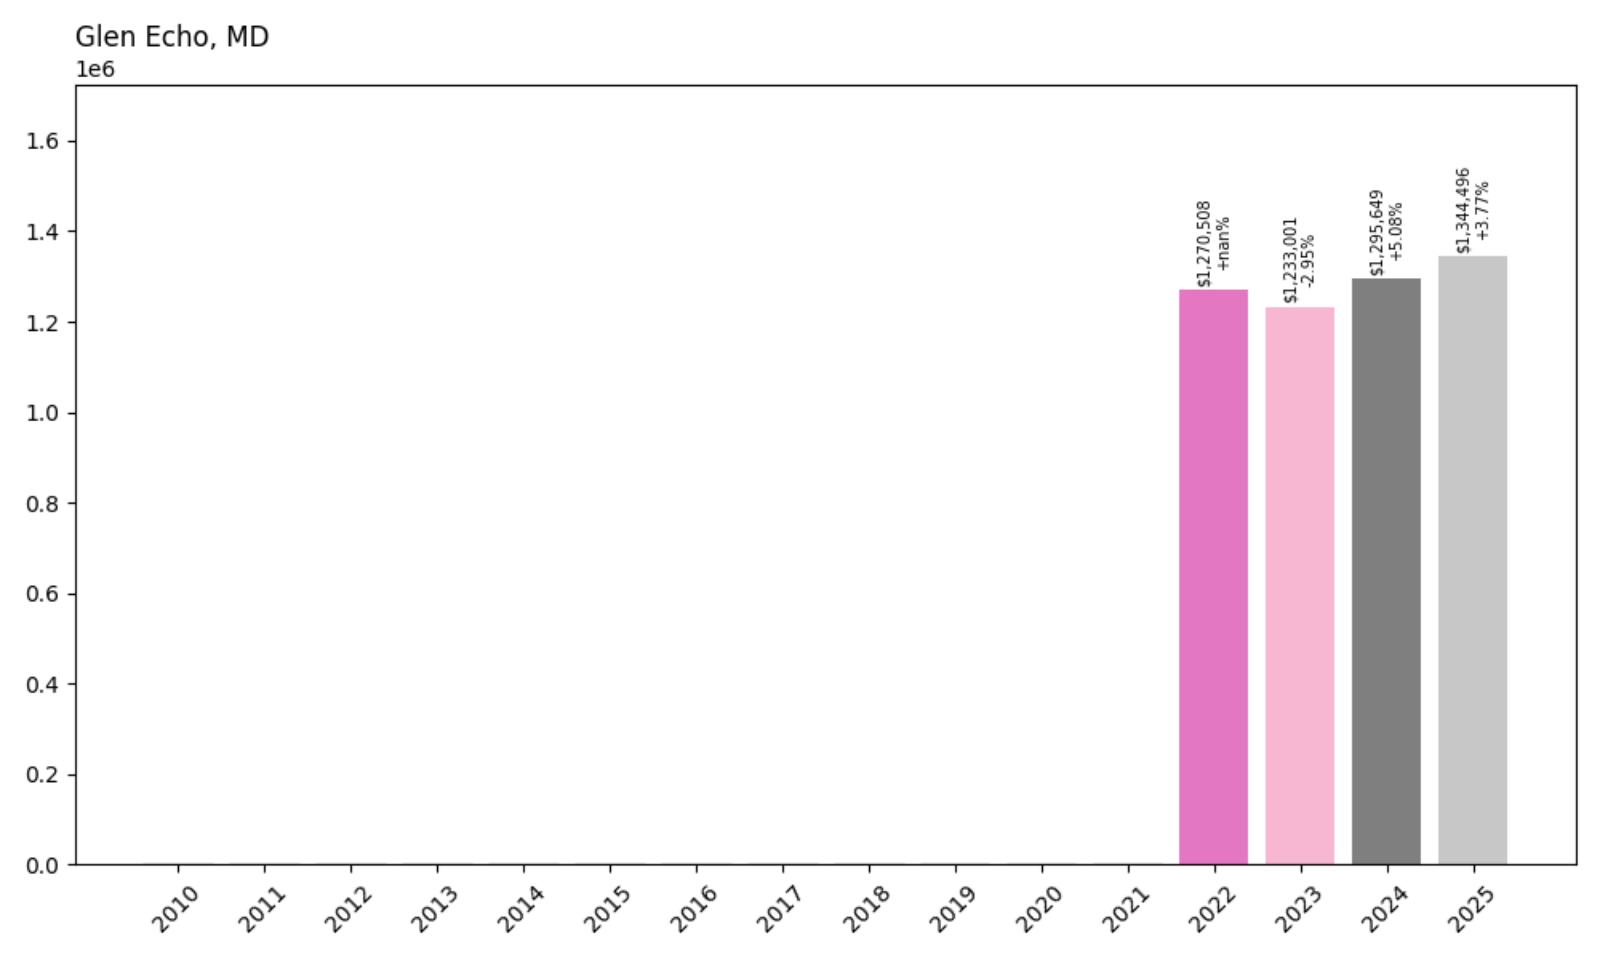
4. Glen Echo – 6% Home Price Increase Since 2022
- 2010: N/A
- 2011: N/A
- 2012: N/A
- 2013: N/A
- 2014: N/A
- 2015: N/A
- 2016: N/A
- 2017: N/A
- 2018: N/A
- 2019: N/A
- 2020: N/A
- 2021: N/A
- 2022: $1,270,508
- 2023: $1,233,001
- 2024: $1,295,649
- 2025: $1,344,496
Though Zillow only reports data since 2022, Glen Echo has already seen home prices rise by 6% in that short time. After a small dip in 2023, values climbed again through 2024 and 2025. The average home now exceeds $1.34 million, placing Glen Echo in the top five most expensive towns in Maryland.
Glen Echo – A Tiny Town With Million-Dollar Homes

Glen Echo is a compact, historic community in Montgomery County best known for its arts-focused Glen Echo Park and trolley-era charm. Its proximity to the Potomac River and the D.C. line gives it unique appeal among affluent buyers. With only a few dozen residential streets, demand far exceeds supply.
The housing stock is limited, but that’s part of the town’s appeal—each home is distinctive, and few change hands each year. The town’s quiet, walkable nature and historic character make it attractive to buyers looking for a refined and peaceful place to live. As prices continue to rise, Glen Echo solidifies its status as one of the most exclusive addresses in the state.
3. Potomac – 47% Home Price Increase Since 2010
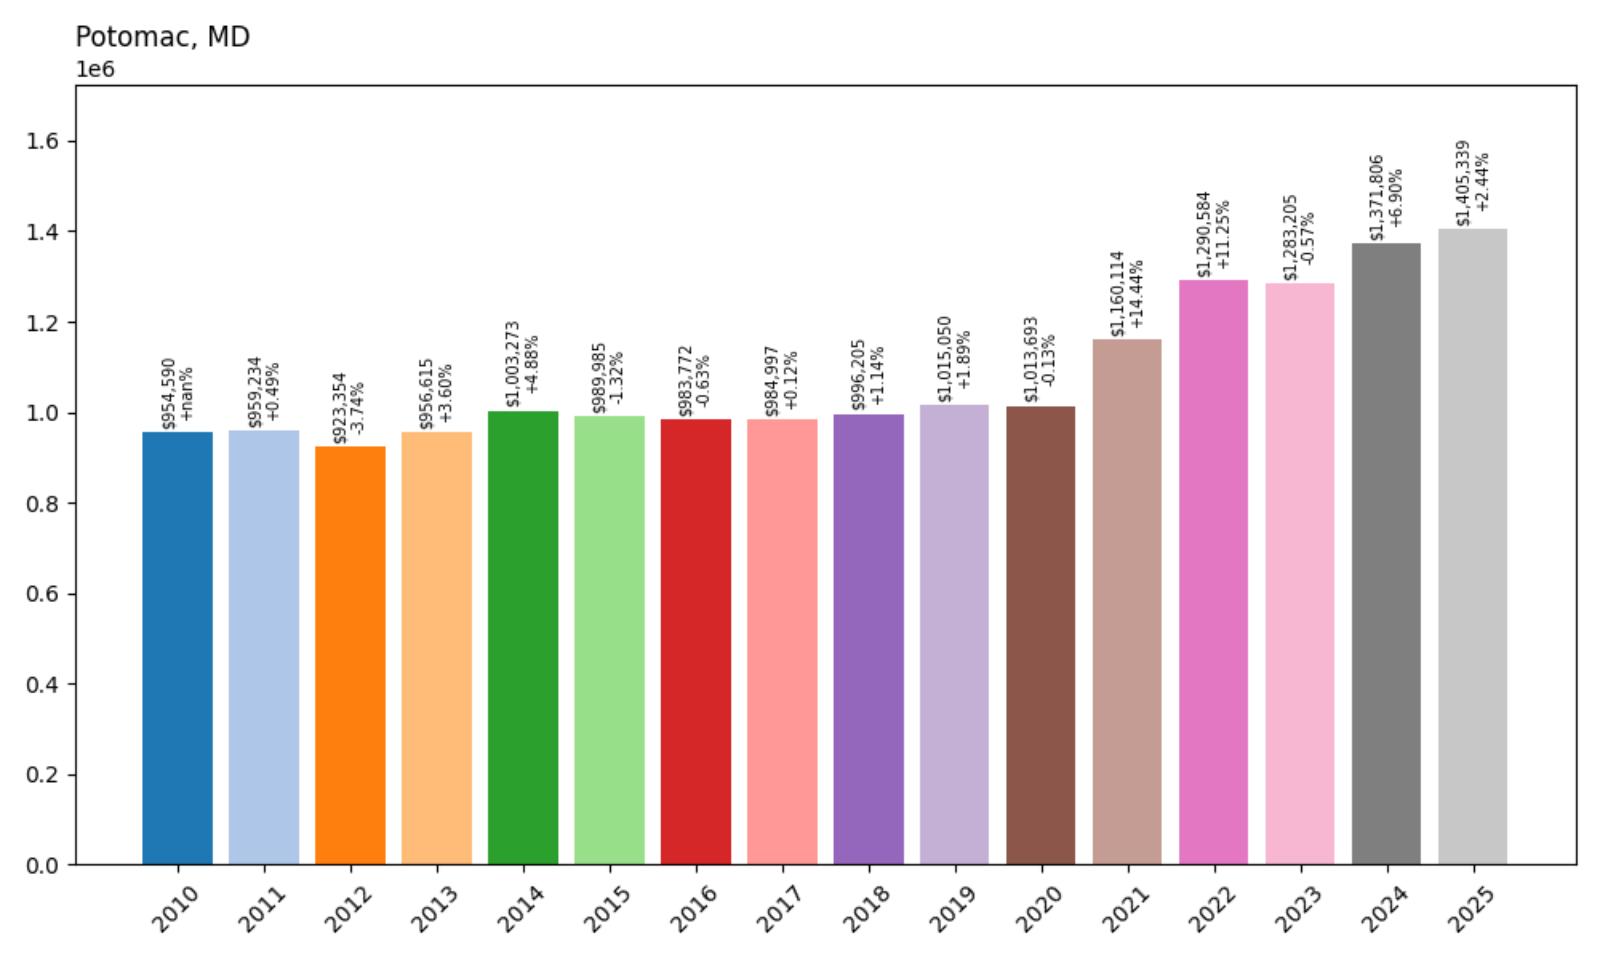
- 2010: $954,590
- 2011: $959,234
- 2012: $923,354
- 2013: $956,615
- 2014: $1,003,273
- 2015: $989,985
- 2016: $983,772
- 2017: $984,997
- 2018: $996,205
- 2019: $1,015,050
- 2020: $1,013,693
- 2021: $1,160,114
- 2022: $1,290,584
- 2023: $1,283,205
- 2024: $1,371,806
- 2025: $1,405,339
Potomac has added more than $450K to its median home value since 2010, with gains accelerating after 2020. Prices climbed steadily through 2025, with the average home now topping $1.4 million. It remains one of the most recognized luxury markets in the entire D.C. metro area.
Potomac – Classic Luxury and Timeless Appeal
Potomac is synonymous with luxury in Maryland, known for its sprawling estates, private schools, and celebrity residents. The town is just 15 miles from Washington, D.C., and offers both privacy and proximity to urban amenities. With beautifully landscaped properties and top-ranked public and private schools, it’s a destination for high-end buyers.
While growth was modest in the early 2010s, Potomac’s market surged after the pandemic as demand for large, single-family homes spiked. Price appreciation has remained steady even as other markets cooled. In 2025, Potomac continues to attract buyers looking for established prestige and top-tier living.
2. Chevy Chase View – 63% Home Price Increase Since 2010
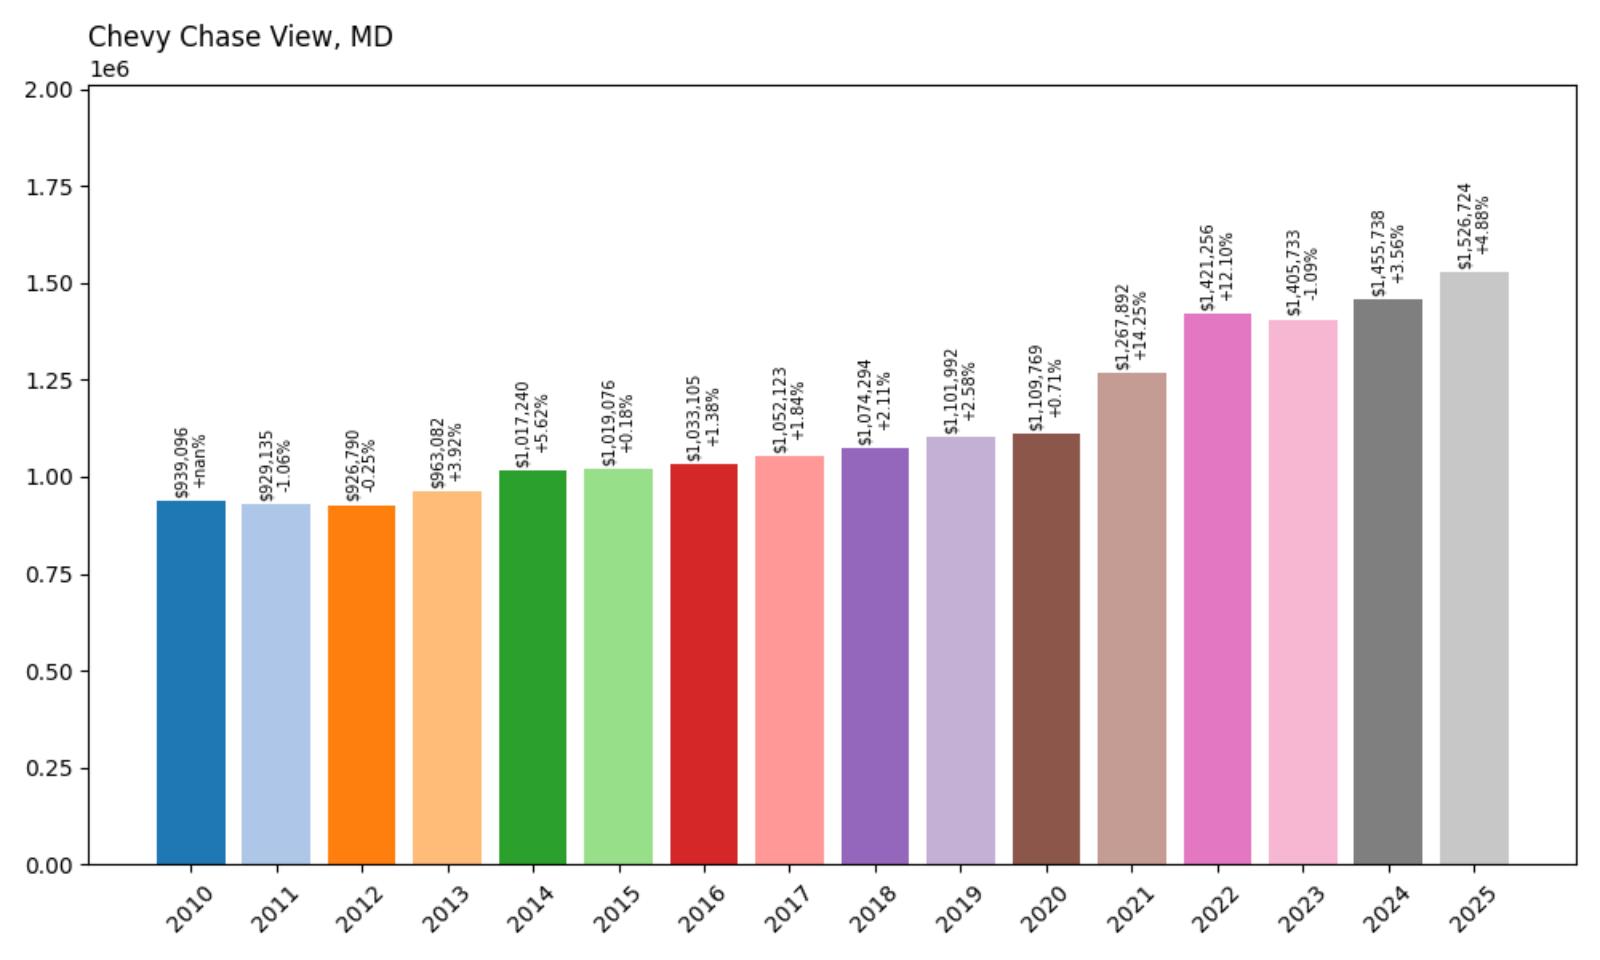
- 2010: $939,096
- 2011: $929,135
- 2012: $926,790
- 2013: $963,082
- 2014: $1,017,240
- 2015: $1,019,076
- 2016: $1,033,105
- 2017: $1,052,123
- 2018: $1,074,294
- 2019: $1,101,992
- 2020: $1,109,769
- 2021: $1,267,892
- 2022: $1,421,256
- 2023: $1,405,733
- 2024: $1,455,738
- 2025: $1,526,724
Chevy Chase View has seen home prices increase by nearly $588K since 2010, reflecting steady and long-term growth. The area’s prices accelerated sharply from 2020 onward, with values breaking the $1.5 million mark in 2025. As one of Montgomery County’s most exclusive enclaves, it ranks second in the state for overall home price.
Chevy Chase View – Quiet, Grand, and Exceptionally Pricey

Chevy Chase View is a tiny, incorporated town nestled just north of the Beltway, known for its stately colonial homes, mature trees, and broad, peaceful streets. Unlike its more commercialized neighbors, this community maintains a residential-only atmosphere, free of traffic or retail sprawl. It’s a highly sought-after spot for buyers looking for timeless architecture and strong neighborhood identity.
With limited housing stock and consistent demand, values in Chevy Chase View have climbed steadily even during cooler market conditions. The town’s zoning and preservation efforts help ensure that property here remains rare—and expensive. As of 2025, it stands just behind one ultra-exclusive destination in Maryland’s luxury housing ranks.
1. Gibson Island – 79% Home Price Increase Since 2010
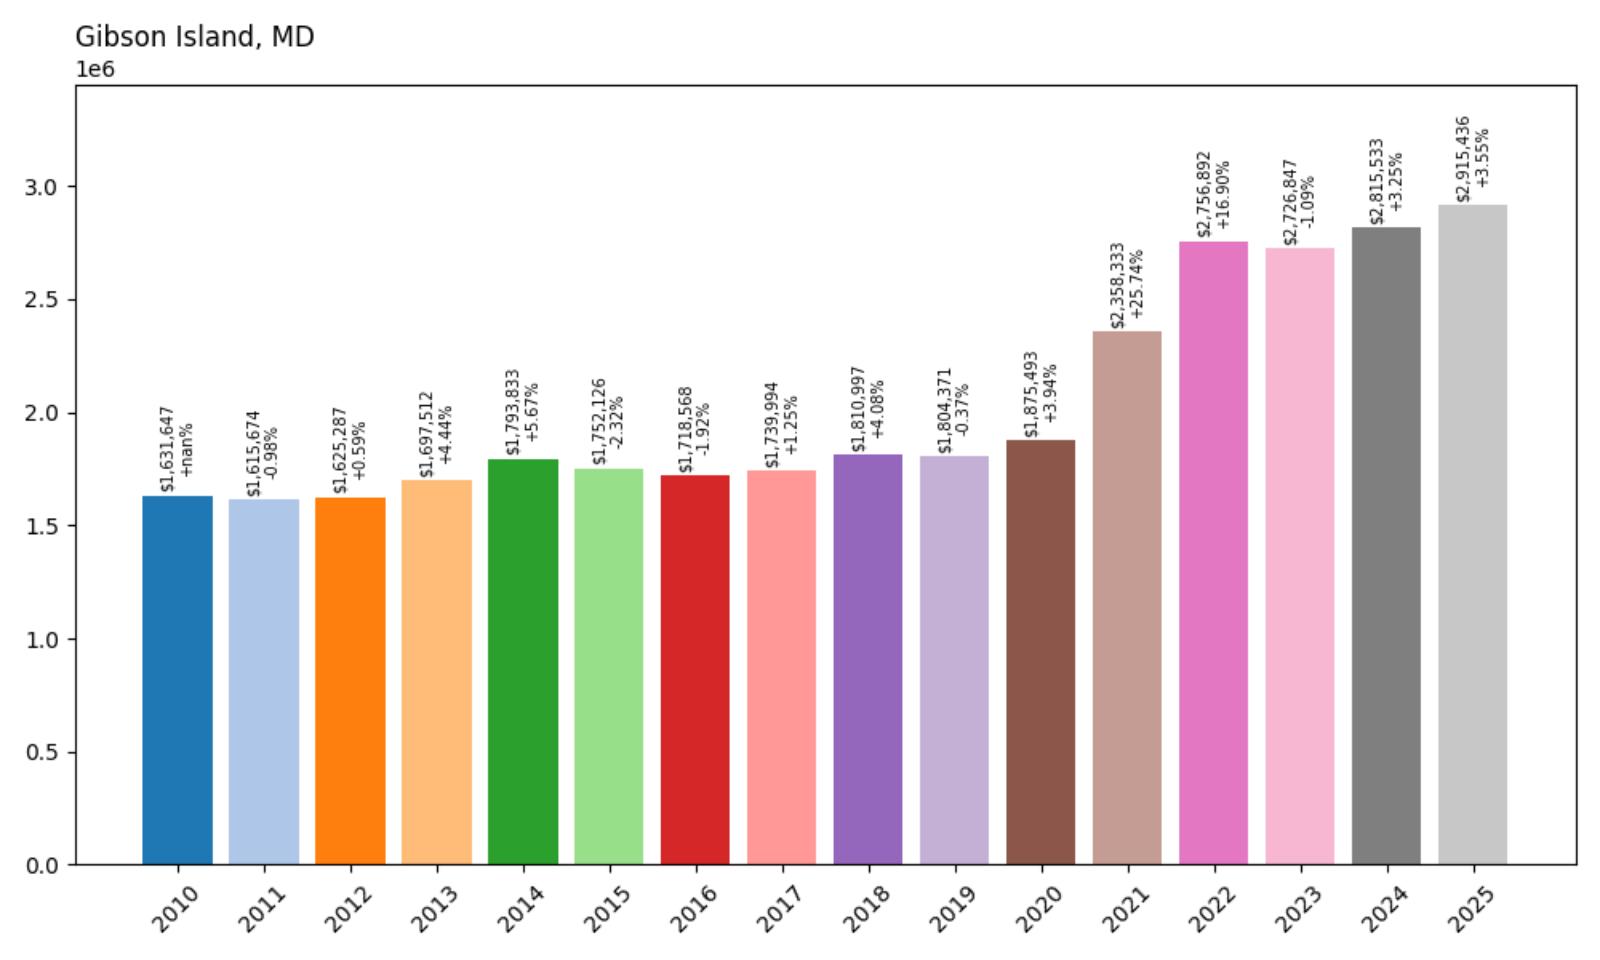
- 2010: $1,631,647
- 2011: $1,615,674
- 2012: $1,625,287
- 2013: $1,697,512
- 2014: $1,793,833
- 2015: $1,752,126
- 2016: $1,718,568
- 2017: $1,739,994
- 2018: $1,810,997
- 2019: $1,804,371
- 2020: $1,875,493
- 2021: $2,358,333
- 2022: $2,756,892
- 2023: $2,726,847
- 2024: $2,815,533
- 2025: $2,915,436
Gibson Island tops the list with a staggering $1.28 million increase in home values since 2010, reaching nearly $2.92 million in 2025. The town’s exclusivity, scarcity of listings, and prime waterfront location have made it one of the most elite housing markets on the East Coast. Prices surged particularly after 2020 and show no signs of slowing down.
Gibson Island – Maryland’s Most Exclusive Island Enclave

Gibson Island is a gated, private island community in Anne Arundel County accessible only to residents and their guests. Surrounded by the Chesapeake Bay and Magothy River, it offers luxury homes with panoramic water views, a private yacht club, golf course, and no commercial development. Its isolation and prestige make it a haven for wealthy buyers seeking complete privacy.
The real estate market here is like nowhere else in Maryland—inventory is scarce, turnover is low, and prices are sky-high. Even during downturns, home values remain resilient thanks to the island’s unique appeal. With prices closing in on $3 million, Gibson Island stands unchallenged as the most expensive place to own a home in the state.