
🔥 Would you like to save this?
According to the Zillow Home Value Index, Tennessee offers some remarkable affordable housing opportunities across its vibrant cities. You’ll find that over the past 15 years, these neighborhoods have experienced dramatic transformations that tell a compelling story about Tennessee’s evolving real estate landscape. The average home value in these 25 most affordable neighborhoods has skyrocketed from just $32,767 in 2010 to $122,494 in 2025, representing a phenomenal growth trajectory.
What might surprise you is the dominance of Chattanooga in this affordable housing landscape, with 14 of the 25 neighborhoods located in this scenic riverside city. Meanwhile, Memphis follows with 7 neighborhoods, Nashville contributes 3 condominium communities, and Knoxville rounds out the list with a single entry. This geographic distribution demonstrates how affordability hubs have shifted across the state’s major urban centers.
In order to come up with the very specific design ideas, we create most designs with the assistance of state-of-the-art AI interior design software. Also, assume links that take you off the site are affiliate links such as links to Amazon. this means we may earn a commission if you buy something.
You’ll notice extraordinary growth patterns when examining these neighborhoods closely, with some areas seeing property values more than triple over the past decade. Beaumont in Knoxville stands out with a remarkable 301% growth rate from 2015 to 2025, while East Lake in Chattanooga follows close behind at 264%. These dramatic increases reflect Tennessee’s growing appeal as both longtime residents and newcomers seek quality housing at accessible price points.
25. Glass Farms (Chattanooga)
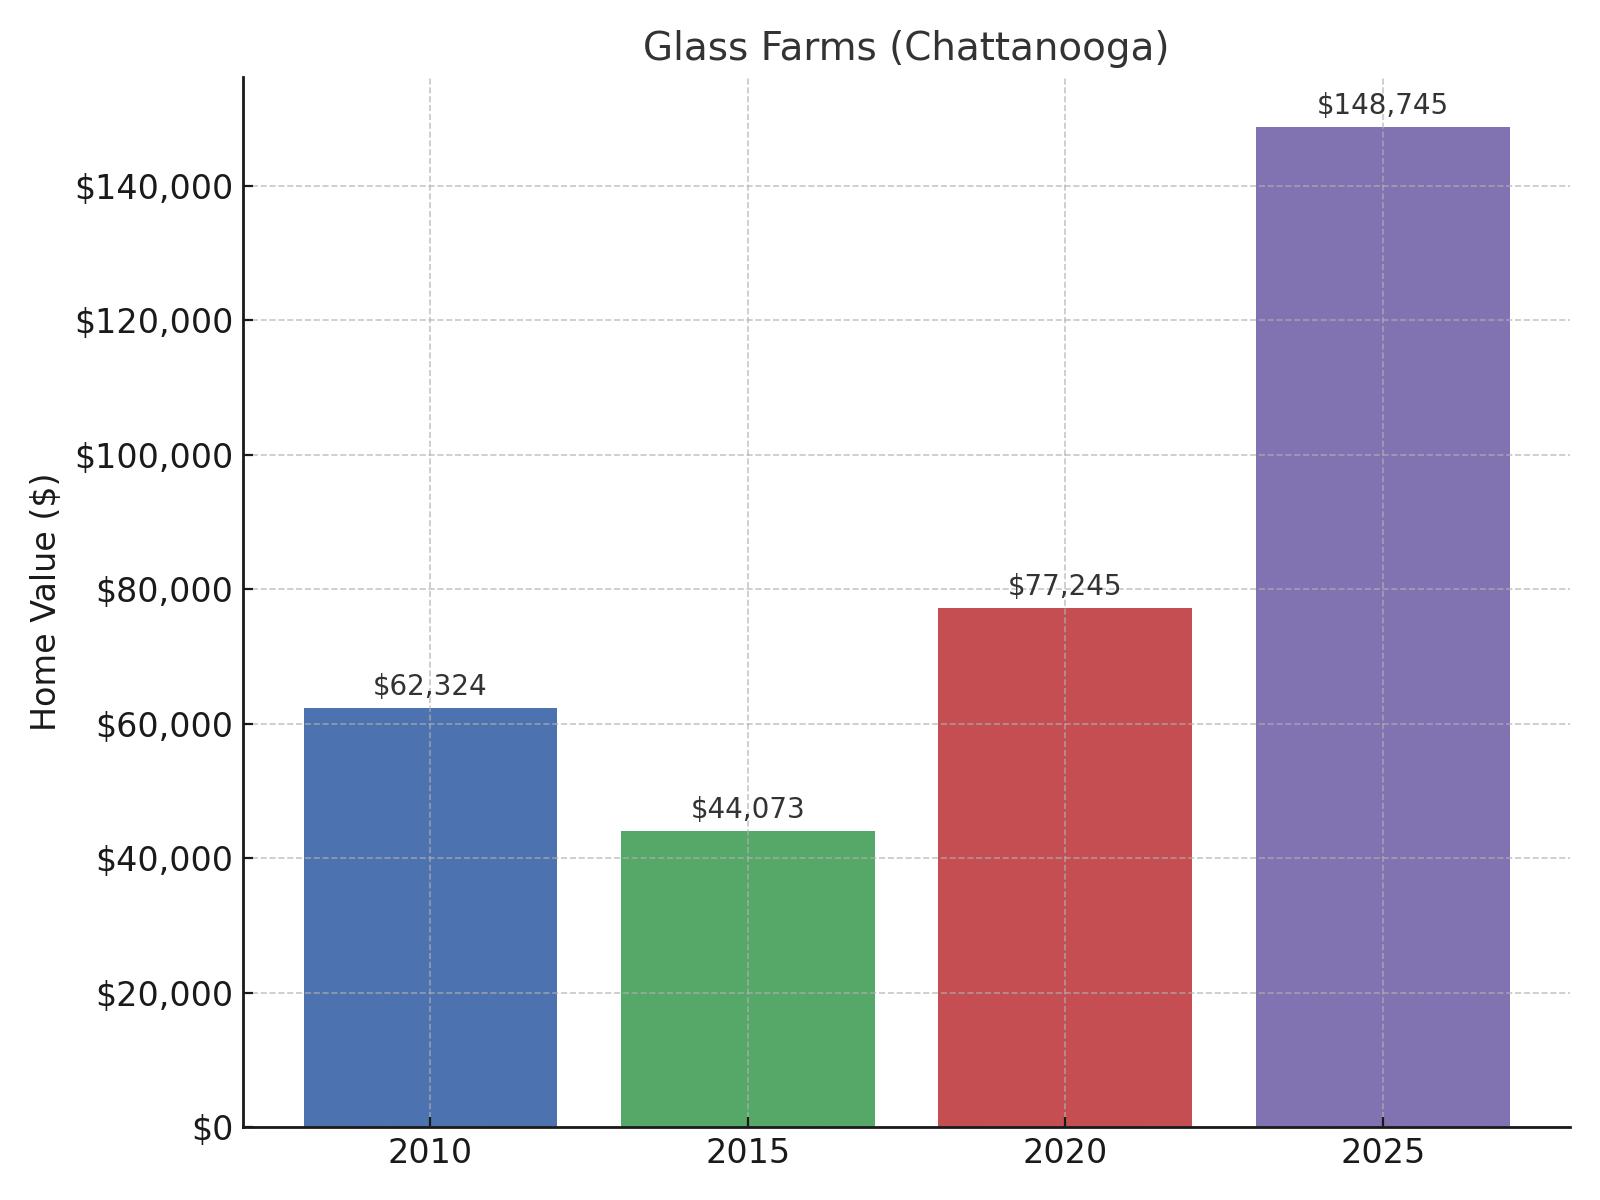
- 2025 Value: $148,745
- 2020 Value: $77,245
- 2015 Value: $44,073
- 2010 Value: $62,324
- Change 2020-2025: 92.56%
- Change 2015-2025: 237.50%
- Change 2010-2025: 138.67%
Nestled in the eastern part of Chattanooga in Hamilton County, Glass Farms has undergone a remarkable transformation. You can see that property values have more than doubled from $62,324 in 2010 to $148,745 in 2025, with the most dramatic growth occurring between 2015 and 2025 when values soared by 237.50%. This historic neighborhood, once known for its industrial heritage, has become increasingly attractive to young professionals and families seeking affordable housing near downtown Chattanooga, contributing to its impressive 92.56% value increase in just the last five years.
24. Raleigh (Memphis)

- 2025 Value: $145,688
- 2020 Value: $97,556
- 2015 Value: $65,237
- 2010 Value: $58,885
- Change 2020-2025: 49.34%
- Change 2015-2025: 123.32%
- Change 2010-2025: 147.41%
Located in the northern section of Memphis in Shelby County, Raleigh offers exceptional value for homebuyers. You’ll find that property values have shown consistent growth, climbing from $58,885 in 2010 to $145,688 in 2025, representing a 147.41% increase over 15 years. The neighborhood has experienced steady development, with nearly half its growth occurring in the last five years as Memphis continues to invest in its northern communities.
23. Beaumont (Knoxville)
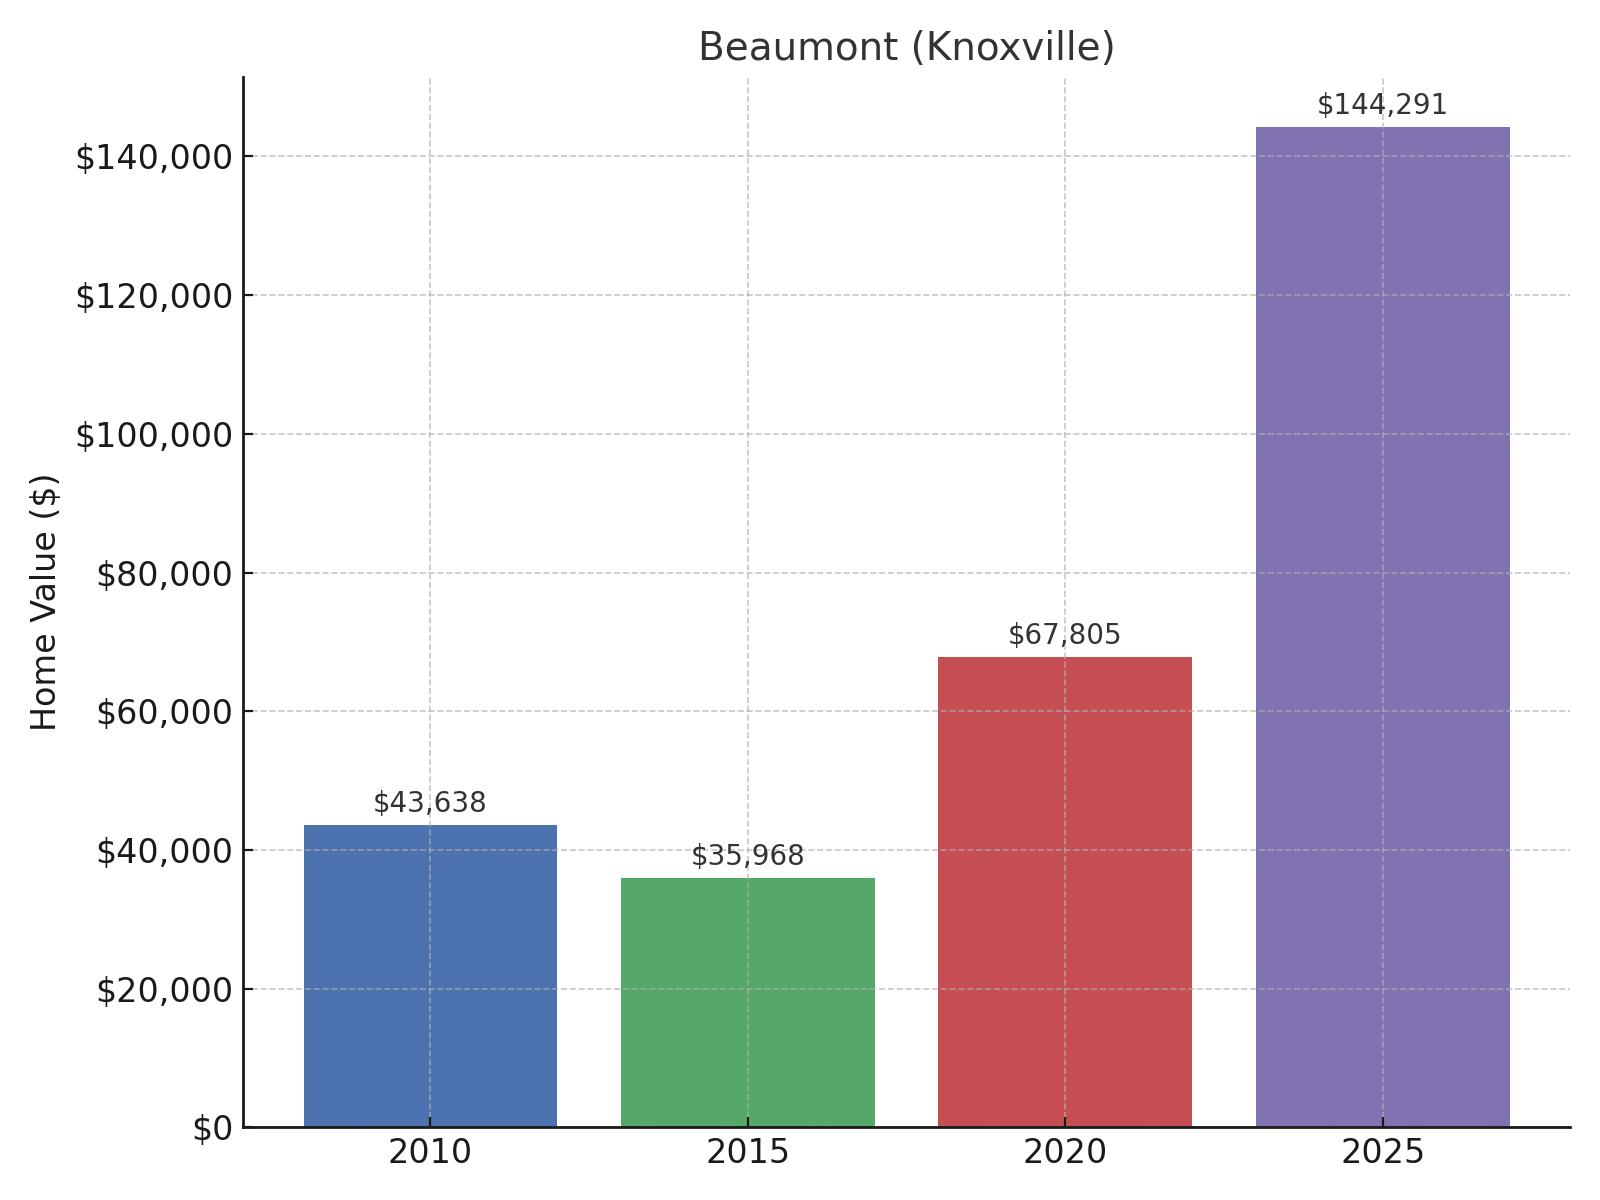
- 2025 Value: $144,291
- 2020 Value: $67,805
- 2015 Value: $35,968
- 2010 Value: $43,638
- Change 2020-2025: 112.80%
- Change 2015-2025: 301.16%
- Change 2010-2025: 230.66%
Situated just northwest of downtown Knoxville in Knox County, Beaumont stands out with the most dramatic growth story on this list. You can observe that property values here have more than tripled over the past decade, rising from just $35,968 in 2015 to $144,291 in 2025—an astonishing 301.16% increase. This formerly industrial area has undergone significant revitalization efforts, resulting in home values more than doubling in the past five years alone.
22. Fort Cheatem (Chattanooga)
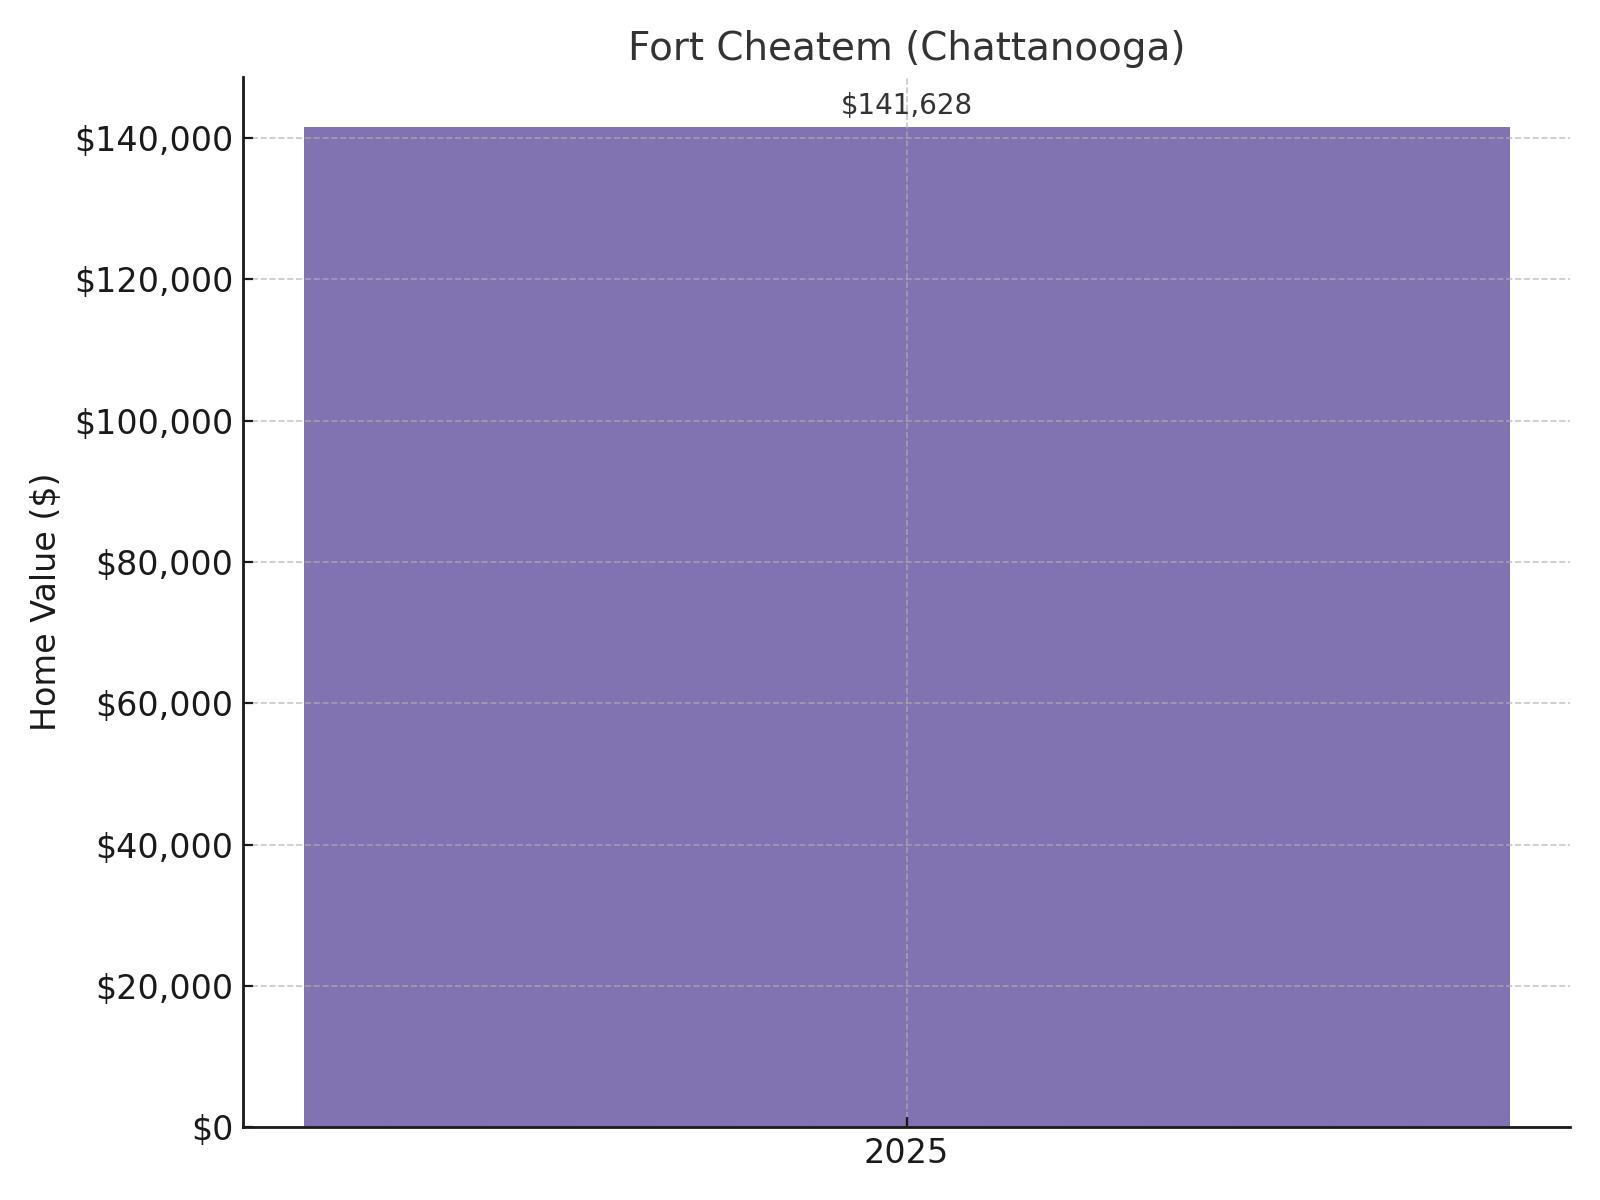
- 2025 Value: $141,628
- 2020 Value: Data not available
- 2015 Value: Data not available
- 2010 Value: Data not available
- Change 2020-2025: N/A
- Change 2015-2025: N/A
- Change 2010-2025: N/A
Found in the southeastern section of Chattanooga in Hamilton County, Fort Cheatem is a relatively new development on our tracking radar. You’ll notice that the neighborhood doesn’t have recorded values before 2025, suggesting this is either a newly developed area or one that has been recently redefined in Zillow’s tracking methodology. At $141,628, the area offers attractive pricing compared to many other Chattanooga neighborhoods.
21. Boyce Station (Chattanooga)

- 2025 Value: $139,418
- 2020 Value: $76,509
- 2015 Value: $42,991
- 2010 Value: $62,740
- Change 2020-2025: 82.22%
- Change 2015-2025: 224.29%
- Change 2010-2025: 122.22%
Located in the eastern part of Chattanooga in Hamilton County, Boyce Station has experienced remarkable growth over the past 15 years. You can see that home values more than doubled from $62,740 in 2010 to $139,418 in 2025, with particularly strong growth of 224.29% when measured from 2015. The neighborhood saw home values increase by 82.22% in just the past five years, indicating accelerating demand for this affordable area.
20. Eastdale (Chattanooga)
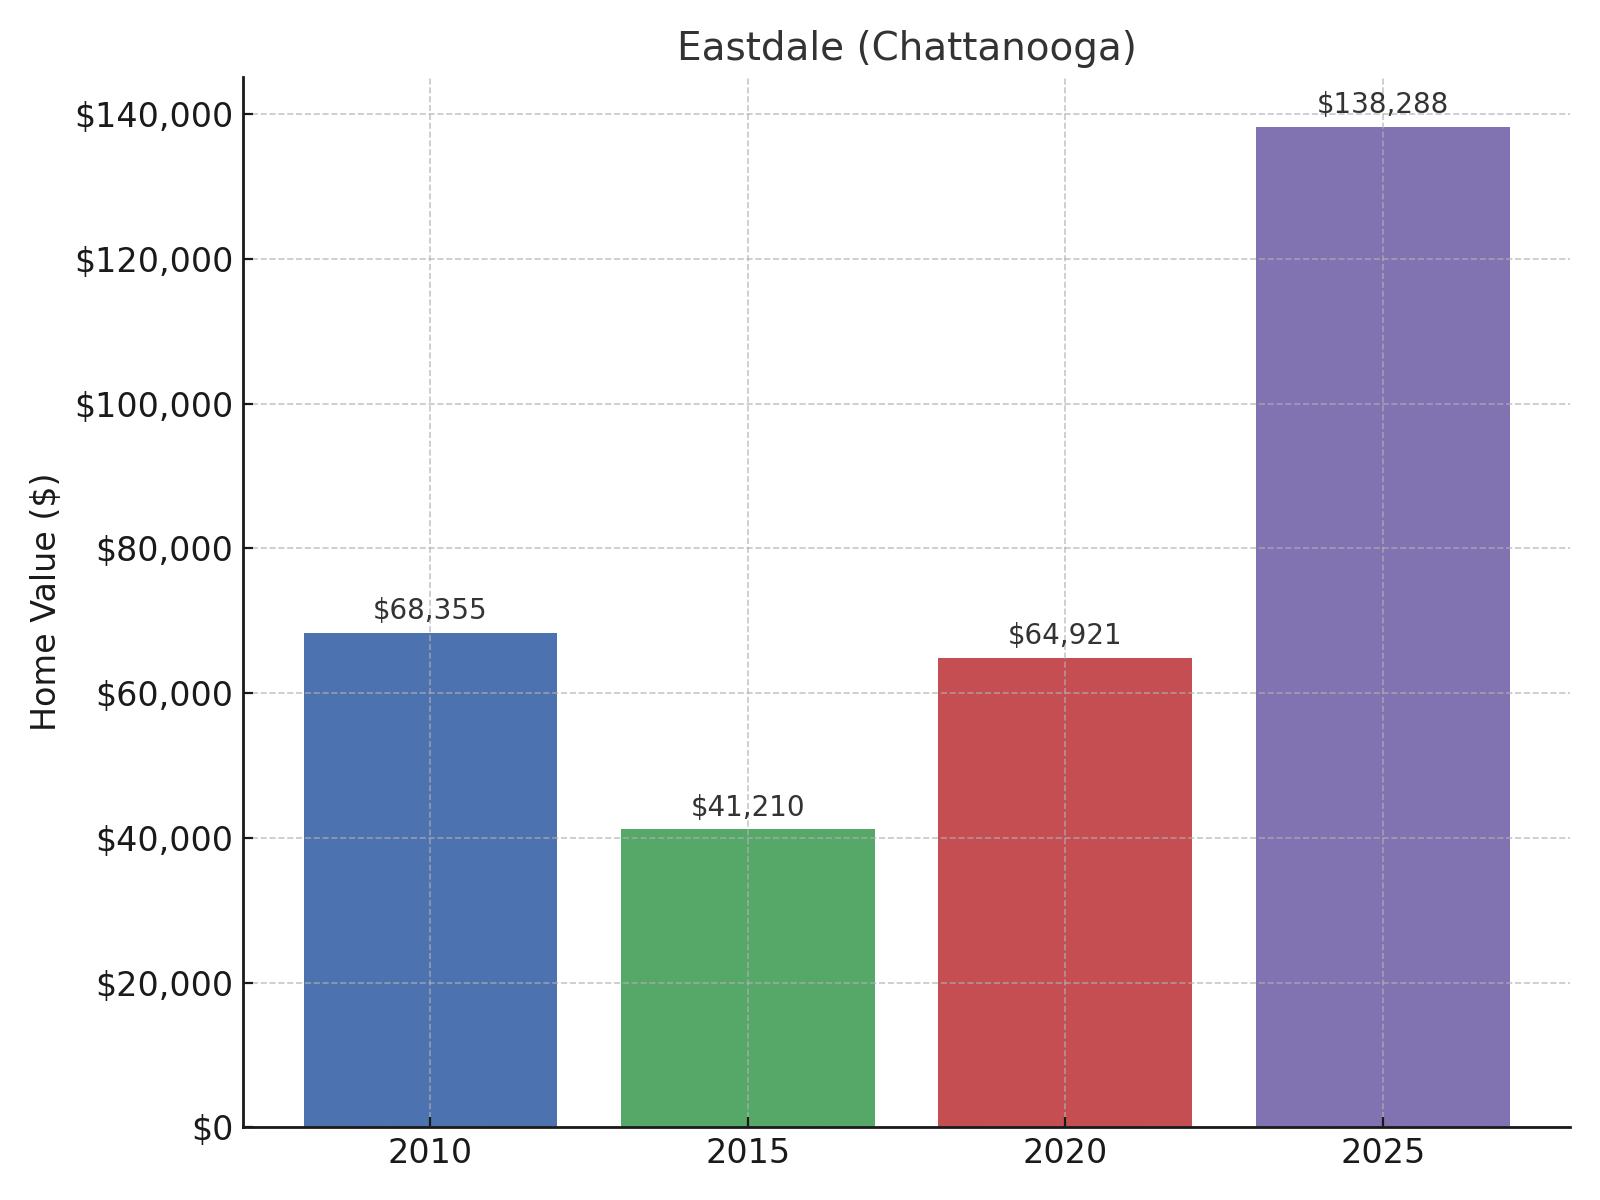
- 2025 Value: $138,288
- 2020 Value: $64,921
- 2015 Value: $41,210
- 2010 Value: $68,355
- Change 2020-2025: 113.01%
- Change 2015-2025: 235.57%
- Change 2010-2025: 102.31%
Positioned east of downtown Chattanooga in Hamilton County, Eastdale presents an interesting growth trajectory. You’ll observe that property values actually declined between 2010 and 2015, dropping from $68,355 to $41,210, before experiencing a dramatic resurgence. By 2025, values had more than doubled from their 2010 levels, reaching $138,288—a 102.31% overall increase. The most impressive growth occurred in the last five years, with values jumping 113.01% as revitalization efforts and renewed interest in the area took hold.
19. Riverside (Chattanooga)

- 2025 Value: $136,182
- 2020 Value: Data not available
- 2015 Value: Data not available
- 2010 Value: Data not available
- Change 2020-2025: N/A
- Change 2015-2025: N/A
- Change 2010-2025: N/A
Situated along the picturesque Tennessee River in Chattanooga, Riverside is another relatively new addition to tracked neighborhoods. You can see that like Fort Cheatem, this area lacks historical data prior to 2025, suggesting either recent development or reclassification in Zillow’s tracking system. With a current value of $136,182, Riverside offers affordable housing options with the added benefit of its location near the waterfront.
18. Cedar Hill (Chattanooga)
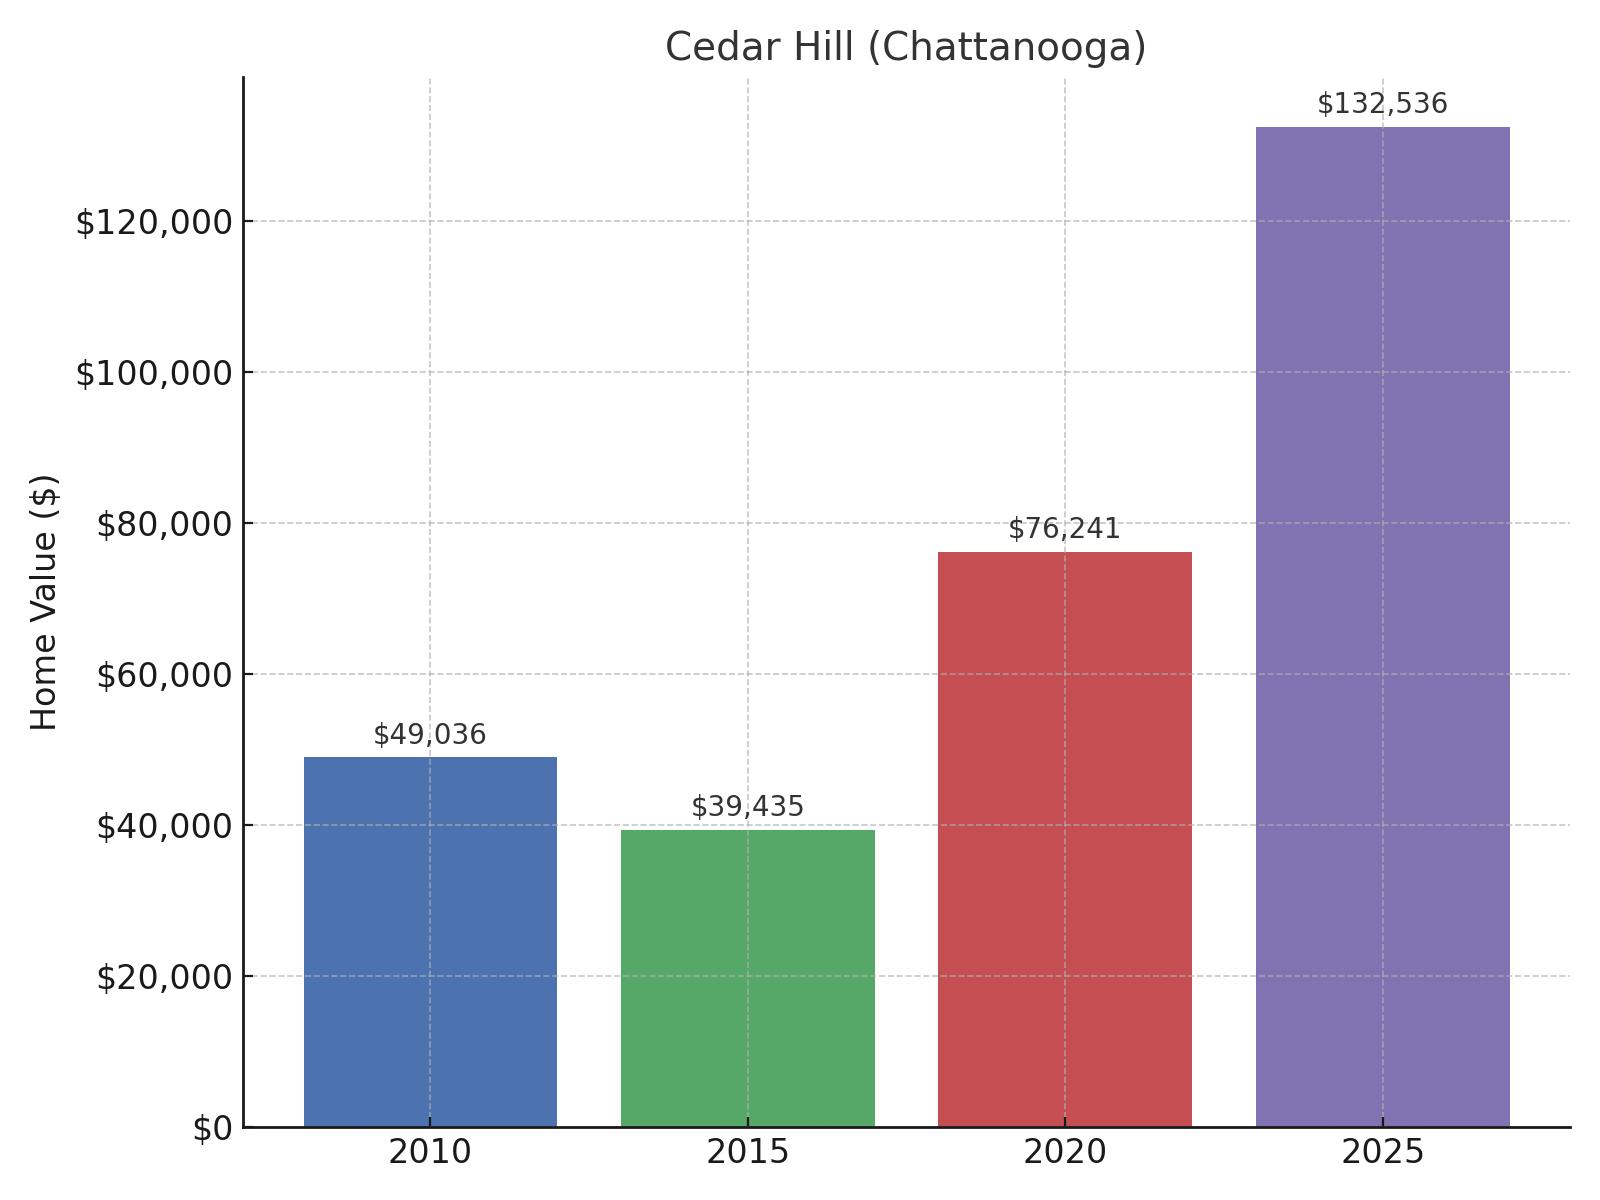
- 2025 Value: $132,536
- 2020 Value: $76,241
- 2015 Value: $39,435
- 2010 Value: $49,036
- Change 2020-2025: 73.84%
- Change 2015-2025: 236.09%
- Change 2010-2025: 170.28%
Nestled in the eastern part of Chattanooga in Hamilton County, Cedar Hill demonstrates a compelling growth narrative. You’ll note that property values initially declined from $49,036 in 2010 to $39,435 in 2015, before experiencing extraordinary growth over the next decade. By 2025, values had reached $132,536, representing a 236.09% increase from 2015 and a 170.28% increase from 2010. This neighborhood’s affordability combined with Chattanooga’s overall renaissance has created strong demand, resulting in nearly 74% growth in just the past five years.
17. Churchville (Chattanooga)

- 2025 Value: $130,117
- 2020 Value: $69,279
- 2015 Value: $46,155
- 2010 Value: $51,583
- Change 2020-2025: 87.82%
- Change 2015-2025: 181.91%
- Change 2010-2025: 152.25%
Located in southeastern Chattanooga in Hamilton County, Churchville showcases a pattern similar to other Chattanooga neighborhoods. You can observe that property values initially declined from $51,583 in 2010 to $46,155 in 2015, before beginning a strong upward trajectory. By 2025, values had reached $130,117, representing a 152.25% increase over 15 years. The neighborhood has seen particularly strong growth of 87.82% in the past five years as Chattanooga continues to attract new residents and investment.
16. Midtown (Memphis)
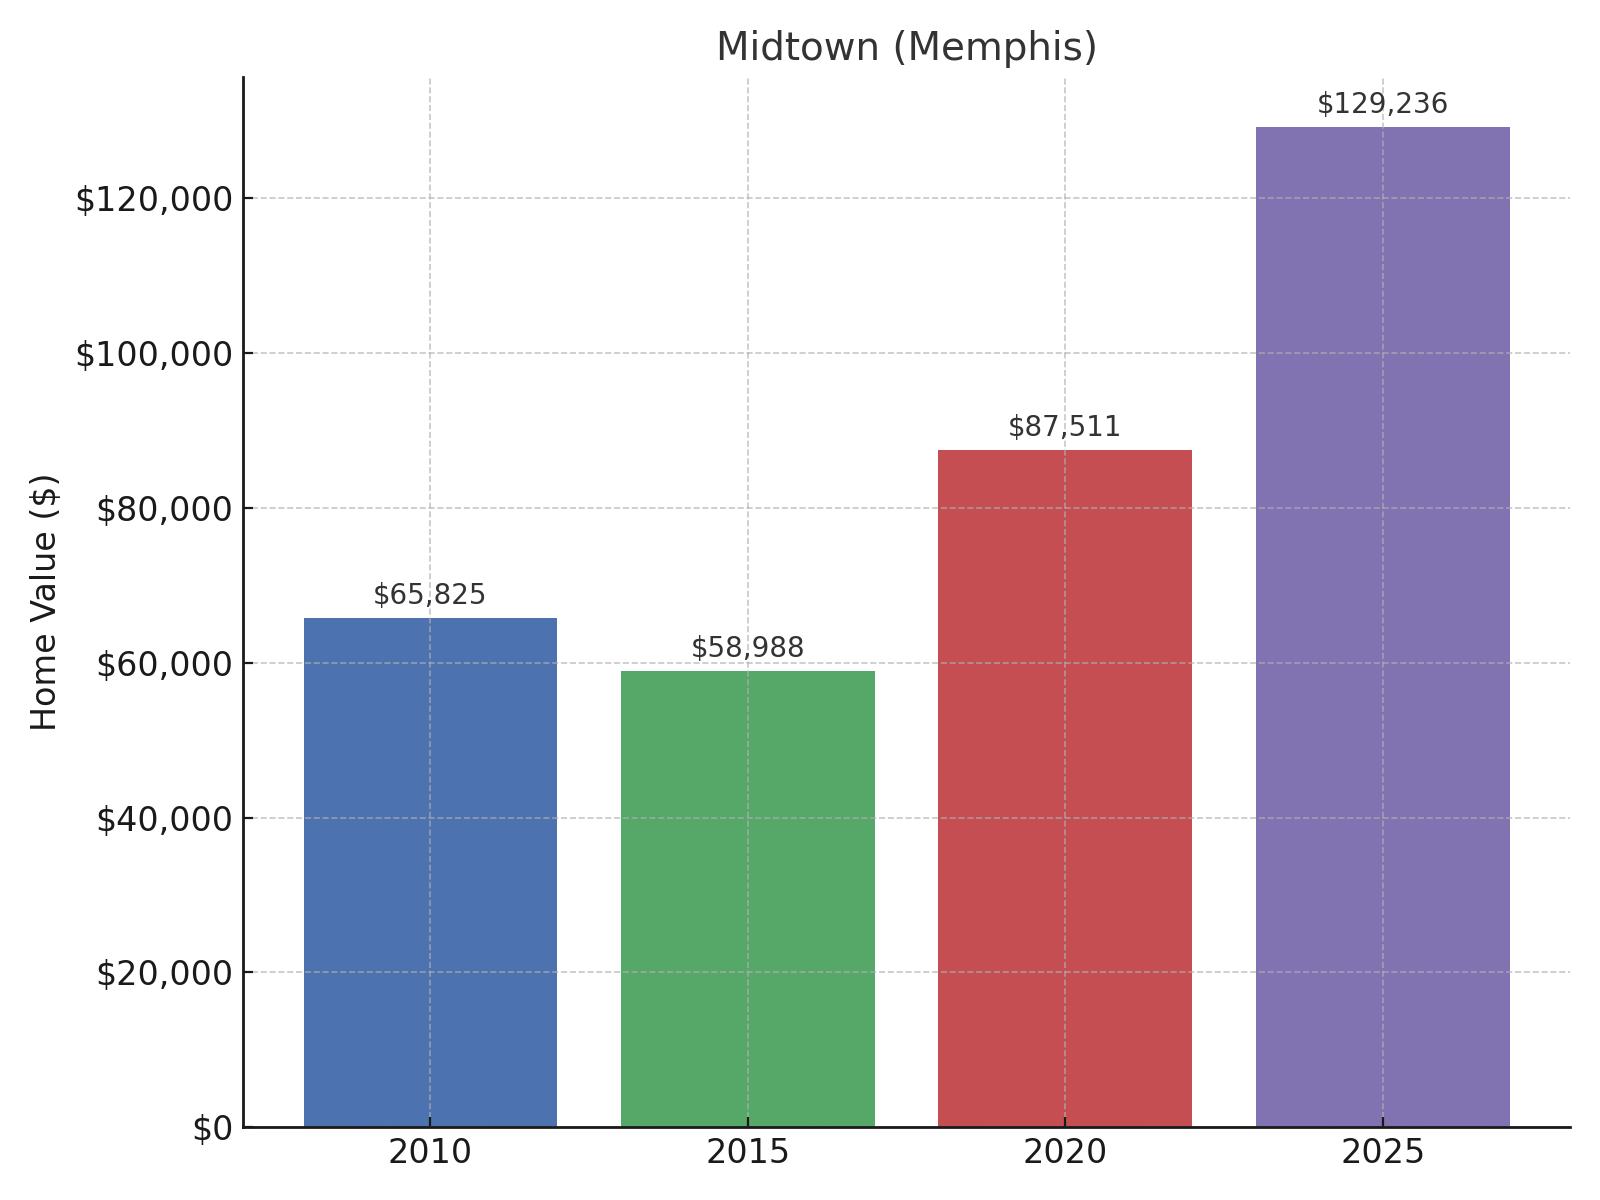
- 2025 Value: $129,236
- 2020 Value: $87,511
- 2015 Value: $58,988
- 2010 Value: $65,825
- Change 2020-2025: 47.68%
- Change 2015-2025: 119.09%
- Change 2010-2025: 96.33%
Centrally located in Memphis in Shelby County, Midtown offers surprising affordability considering its prime location. You’ll find that property values initially dipped from $65,825 in 2010 to $58,988 in 2015, before beginning a steady climb to $129,236 by 2025. This represents nearly double the value over 15 years with a 96.33% increase. The 47.68% growth over the past five years reflects the area’s continued appeal to urban professionals and creative types.
15. Wheeler Avenue (Chattanooga)

- 2025 Value: $123,165
- 2020 Value: Data not available
- 2015 Value: Data not available
- 2010 Value: Data not available
- Change 2020-2025: N/A
- Change 2015-2025: N/A
- Change 2010-2025: N/A
Situated in the eastern section of Chattanooga in Hamilton County, Wheeler Avenue appears to be another recently tracked neighborhood. You can see that like several other Chattanooga areas on this list, historical data is unavailable prior to 2025, suggesting it may be a newly defined or developed area. With current values at $123,165, the neighborhood offers an affordable entry point to the Chattanooga housing market. As the city continues to expand and develop its eastern corridors, Wheeler Avenue’s strategic location positions it well for potential future growth.
14. Barcelona Condos (Nashville)
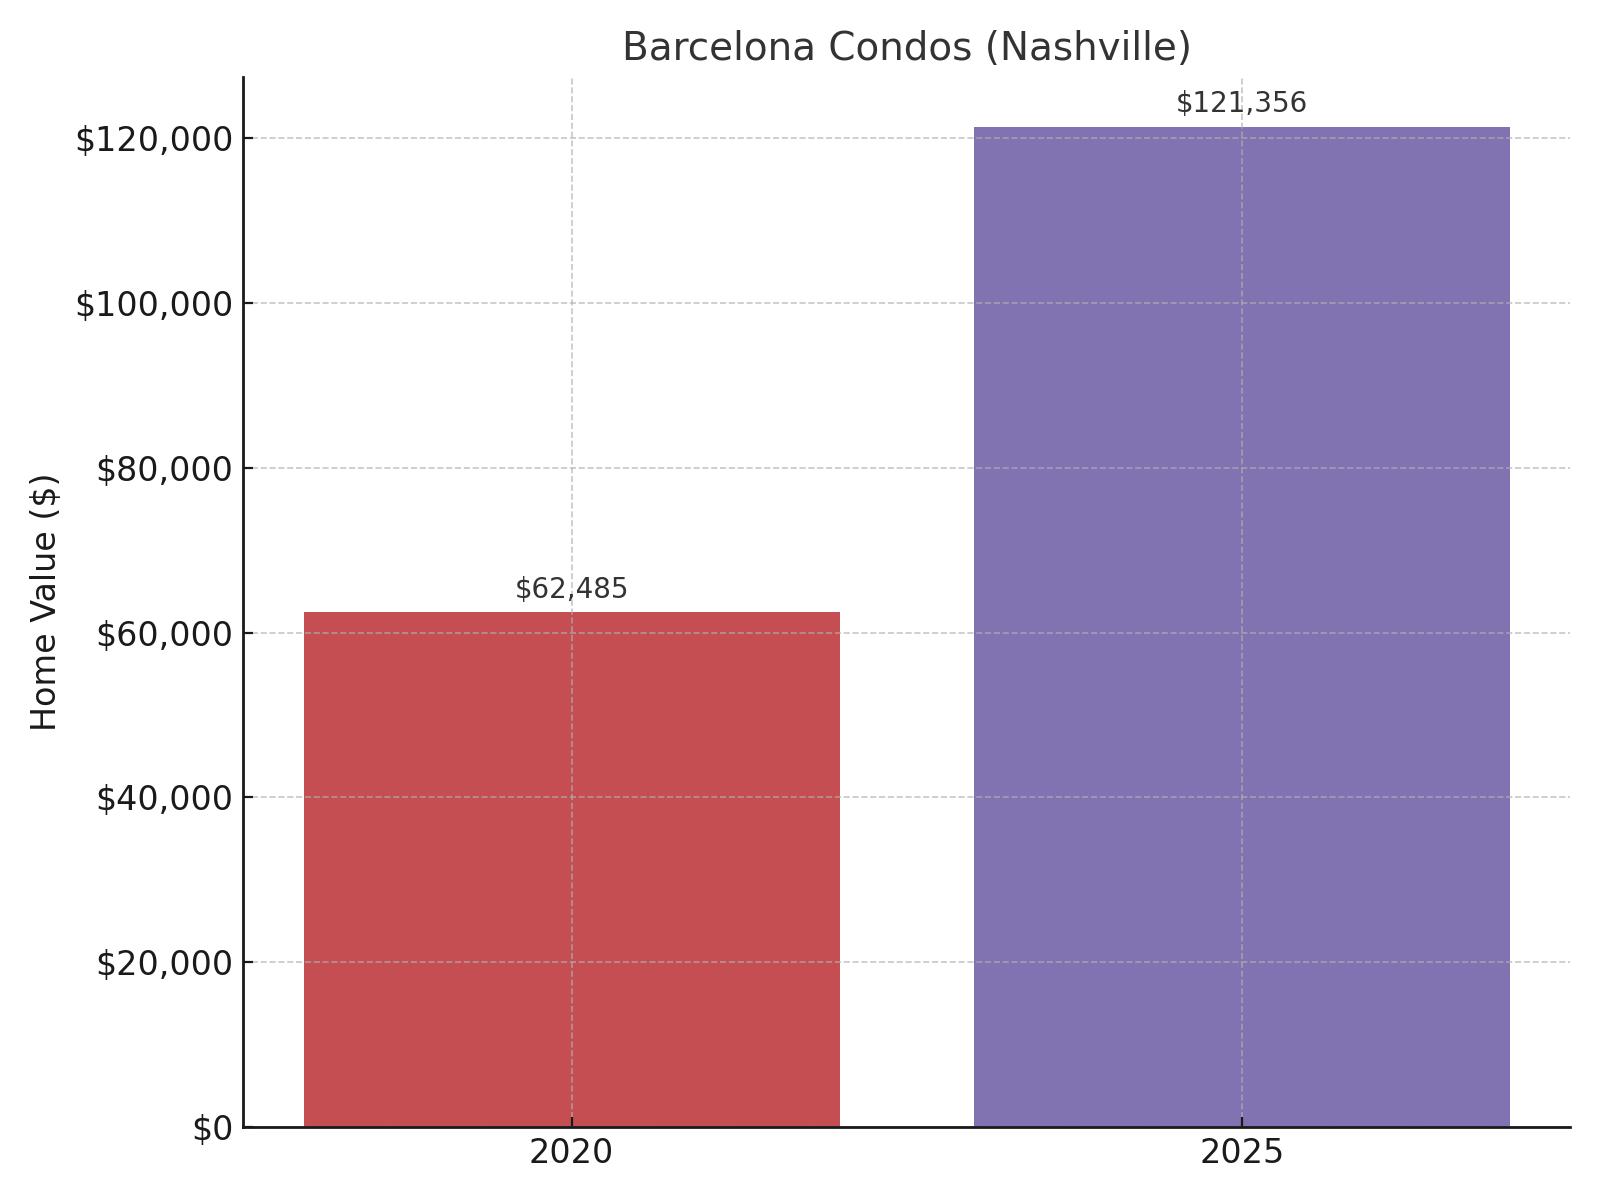
- 2025 Value: $121,356
- 2020 Value: $62,485
- 2015 Value: Data not available
- 2010 Value: Data not available
- Change 2020-2025: 94.22%
- Change 2015-2025: N/A
- Change 2010-2025: N/A
Located in Davidson County within the booming Nashville metropolitan area, Barcelona Condos provides a rare affordable housing option in Tennessee’s capital city. You’ll notice that this development appears to be relatively new to the market, with tracking data only available since 2020. In just five years, values have nearly doubled from $62,485 to $121,356, representing an impressive 94.22% growth rate. As one of just three Nashville properties on this list, Barcelona Condos offers an entry-level opportunity into Nashville’s otherwise expensive real estate market.
13. Parkway Village-Oakhaven (Memphis)

🔥 Would you like to save this?
- 2025 Value: $120,525
- 2020 Value: $80,788
- 2015 Value: $51,687
- 2010 Value: $44,794
- Change 2020-2025: 49.19%
- Change 2015-2025: 133.18%
- Change 2010-2025: 169.06%
Situated in southeast Memphis in Shelby County, Parkway Village-Oakhaven has experienced steady growth over the 15-year period. You can observe that property values have consistently increased from $44,794 in 2010 to $120,525 in 2025, representing a total growth of 169.06%. With nearly 50% growth in the last five years alone, the neighborhood continues to attract homebuyers seeking affordable options with good transportation access and proximity to employment centers.
12. Foust (Chattanooga)
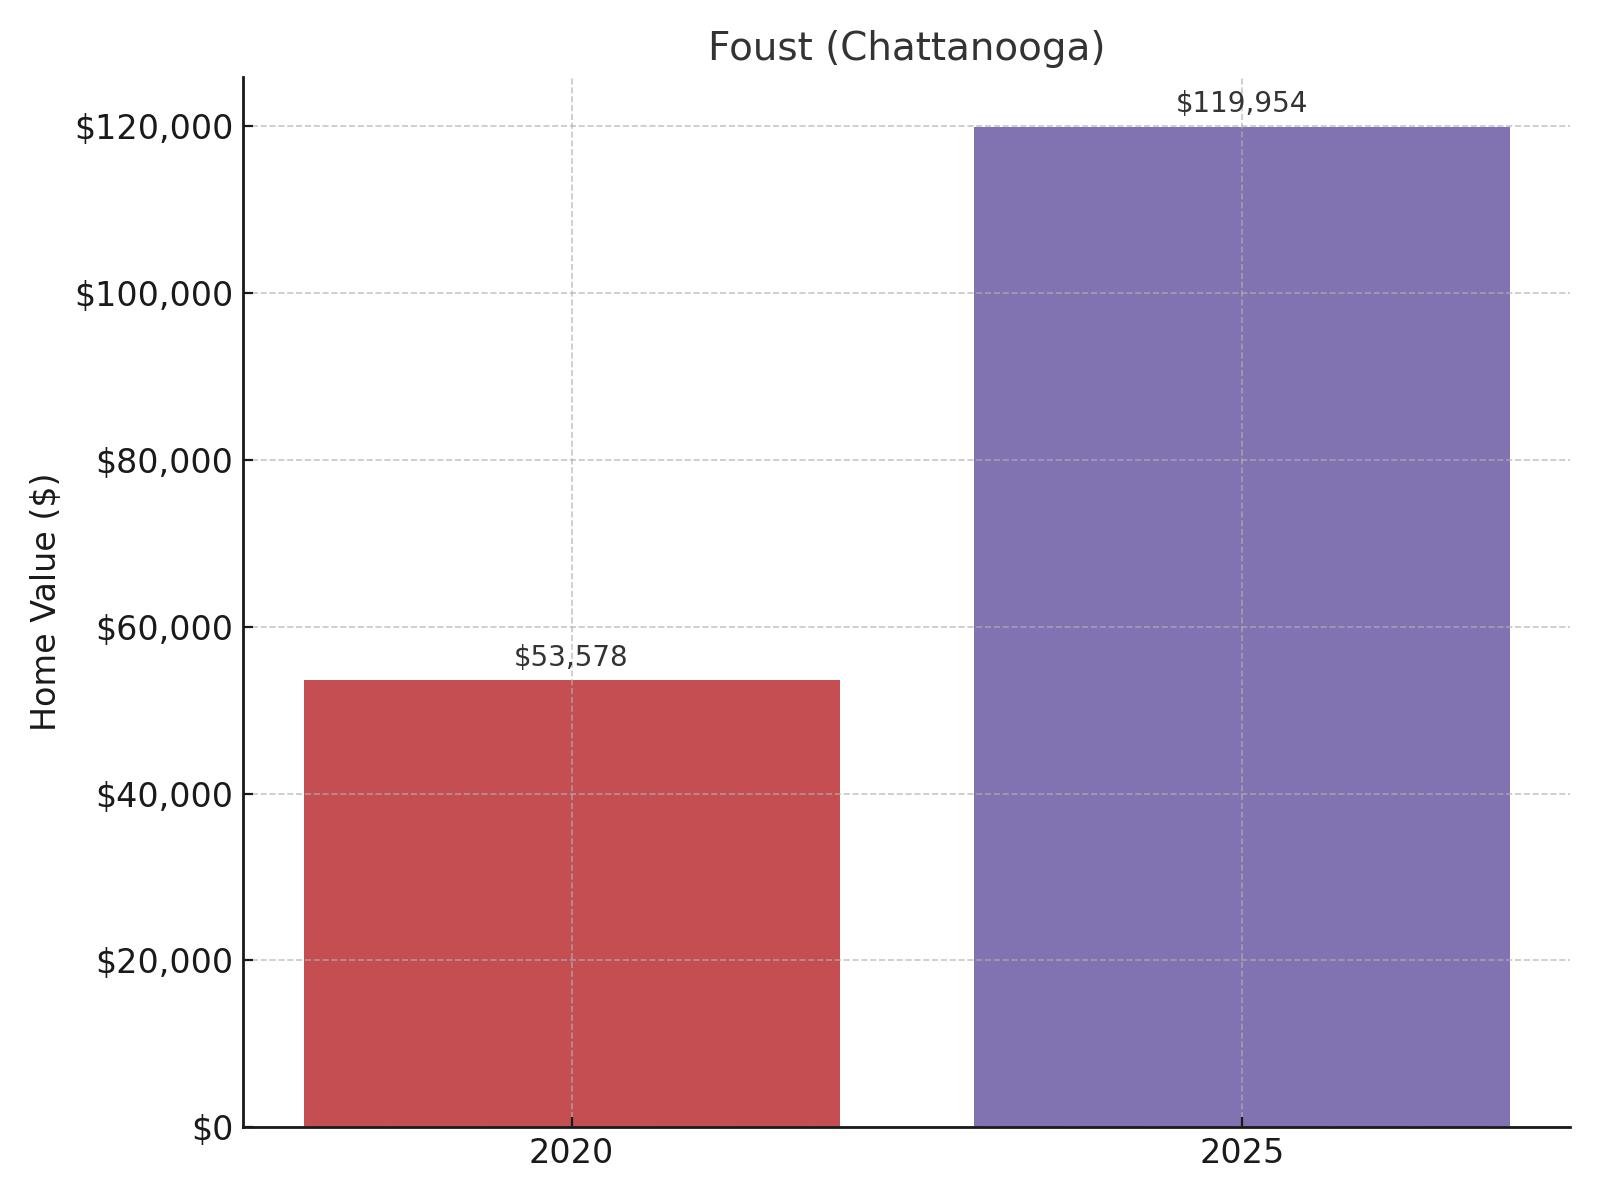
- 2025 Value: $119,954
- 2020 Value: $53,578
- 2015 Value: Data not available
- 2010 Value: Data not available
- Change 2020-2025: 123.89%
- Change 2015-2025: N/A
- Change 2010-2025: N/A
Located in the southeastern section of Chattanooga in Hamilton County, Foust has shown remarkable recent growth. You’ll find that this neighborhood only appears in the data from 2020 onward, but in that short time span has experienced the highest five-year growth rate on our list at 123.89%. Property values have more than doubled from $53,578 in 2020 to $119,954 in 2025, indicating strong market interest in this emerging area.
11. Pagoda Condos (Nashville)
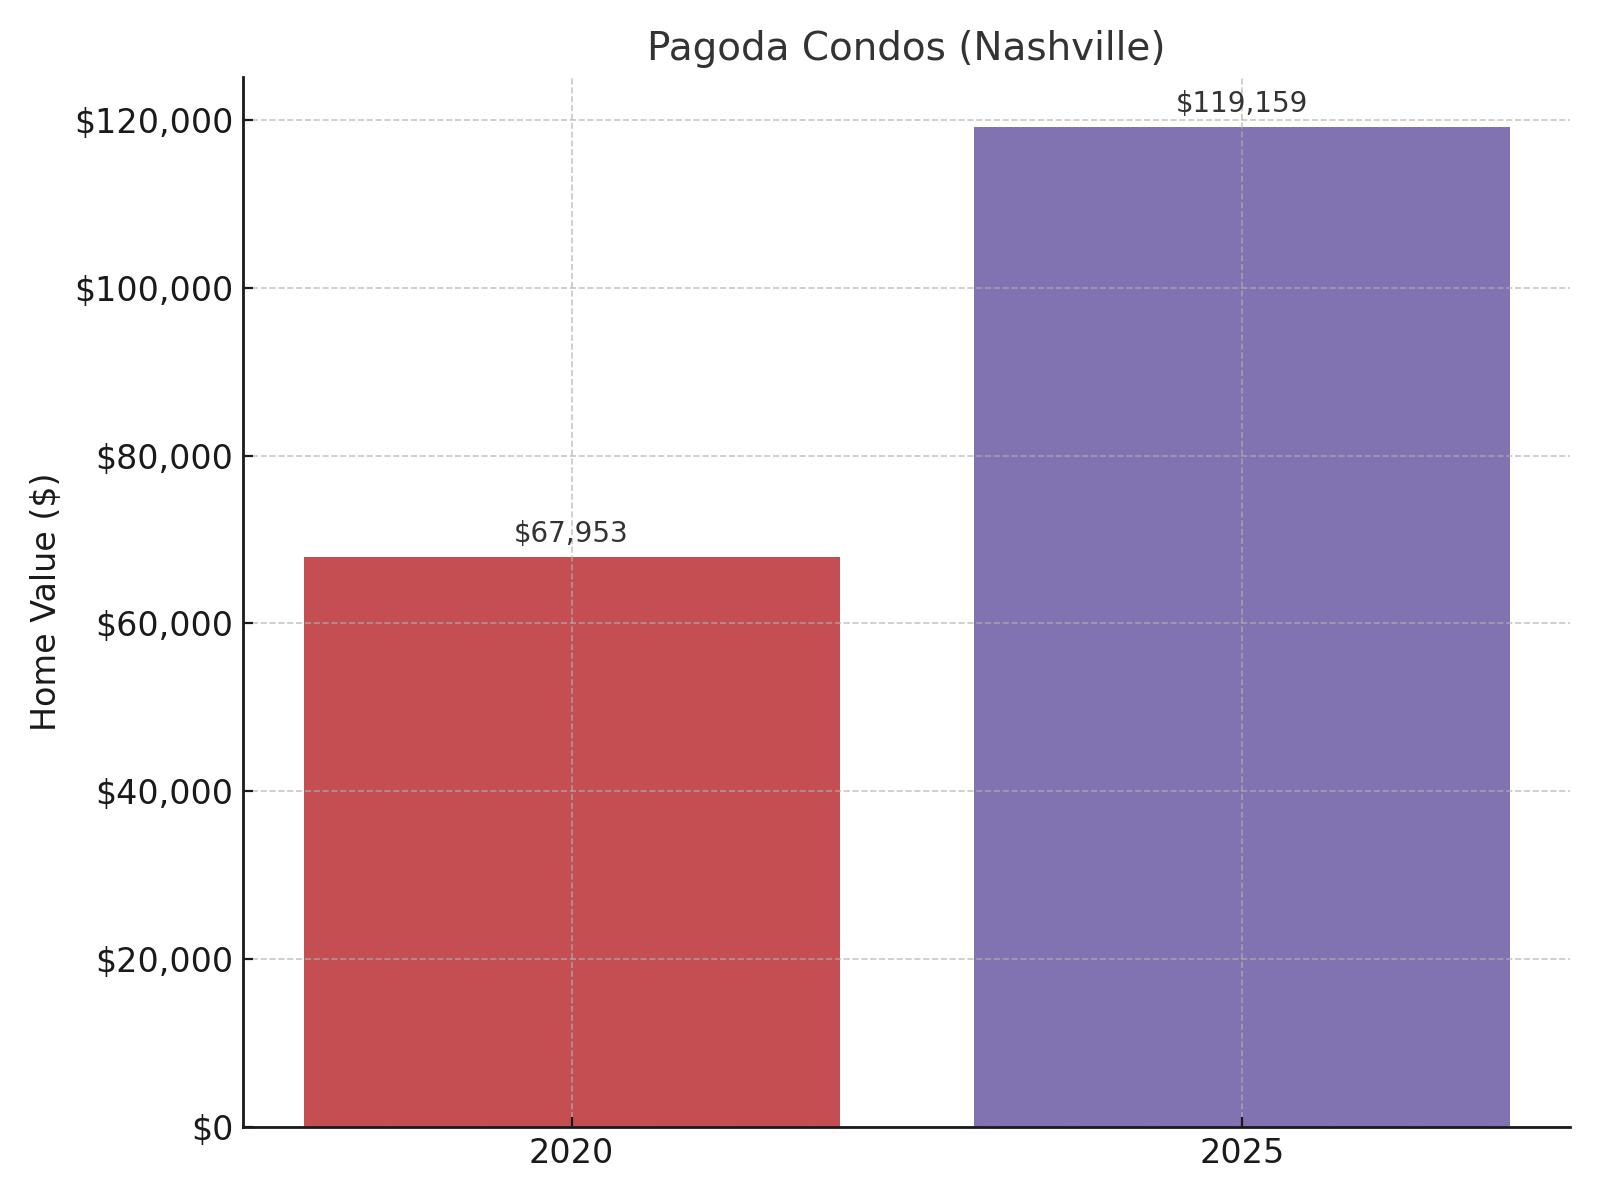
- 2025 Value: $119,159
- 2020 Value: $67,953
- 2015 Value: Data not available
- 2010 Value: Data not available
- Change 2020-2025: 75.36%
- Change 2015-2025: N/A
- Change 2010-2025: N/A
Located in Davidson County within the Nashville metropolitan area, Pagoda Condos offers another rare affordable housing option in Tennessee’s increasingly expensive capital city. You can see that this development has only been tracked since 2020, when units averaged $67,953 in value. By 2025, values had increased 75.36% to $119,159, demonstrating the strong demand for even entry-level properties in Nashville’s hot real estate market.
10. Avondale (Chattanooga)
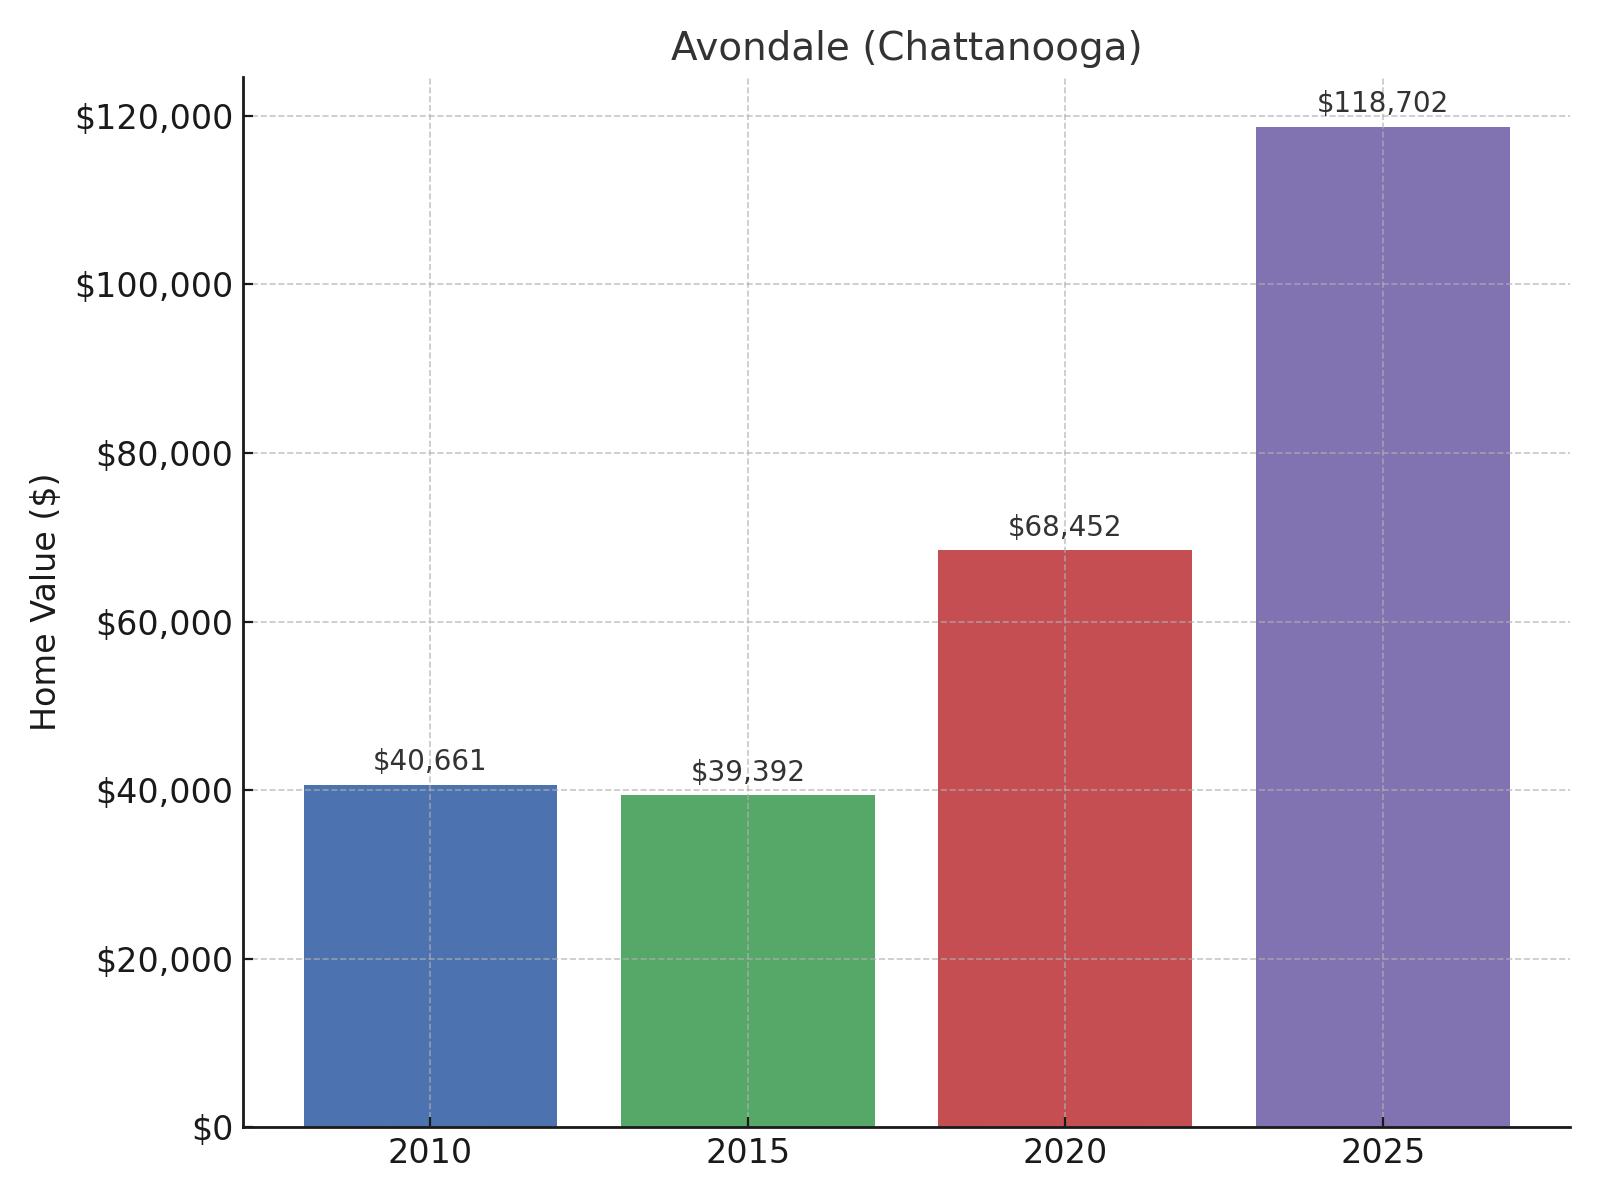
- 2025 Value: $118,702
- 2020 Value: $68,452
- 2015 Value: $39,392
- 2010 Value: $40,661
- Change 2020-2025: 73.41%
- Change 2015-2025: 201.34%
- Change 2010-2025: 191.93%
Positioned in the eastern part of Chattanooga in Hamilton County, Avondale tells a compelling story of neighborhood revitalization. You’ll observe that property values remained relatively flat between 2010 and 2015, hovering around $40,000, before beginning a dramatic upward trajectory. By 2025, values had nearly tripled to $118,702, representing a 201.34% increase over the 2015 values. The neighborhood has benefited from Chattanooga’s overall growth and targeted revitalization efforts, with a 73.41% increase occurring in just the past five years.
9. Clifton Hills (Chattanooga)
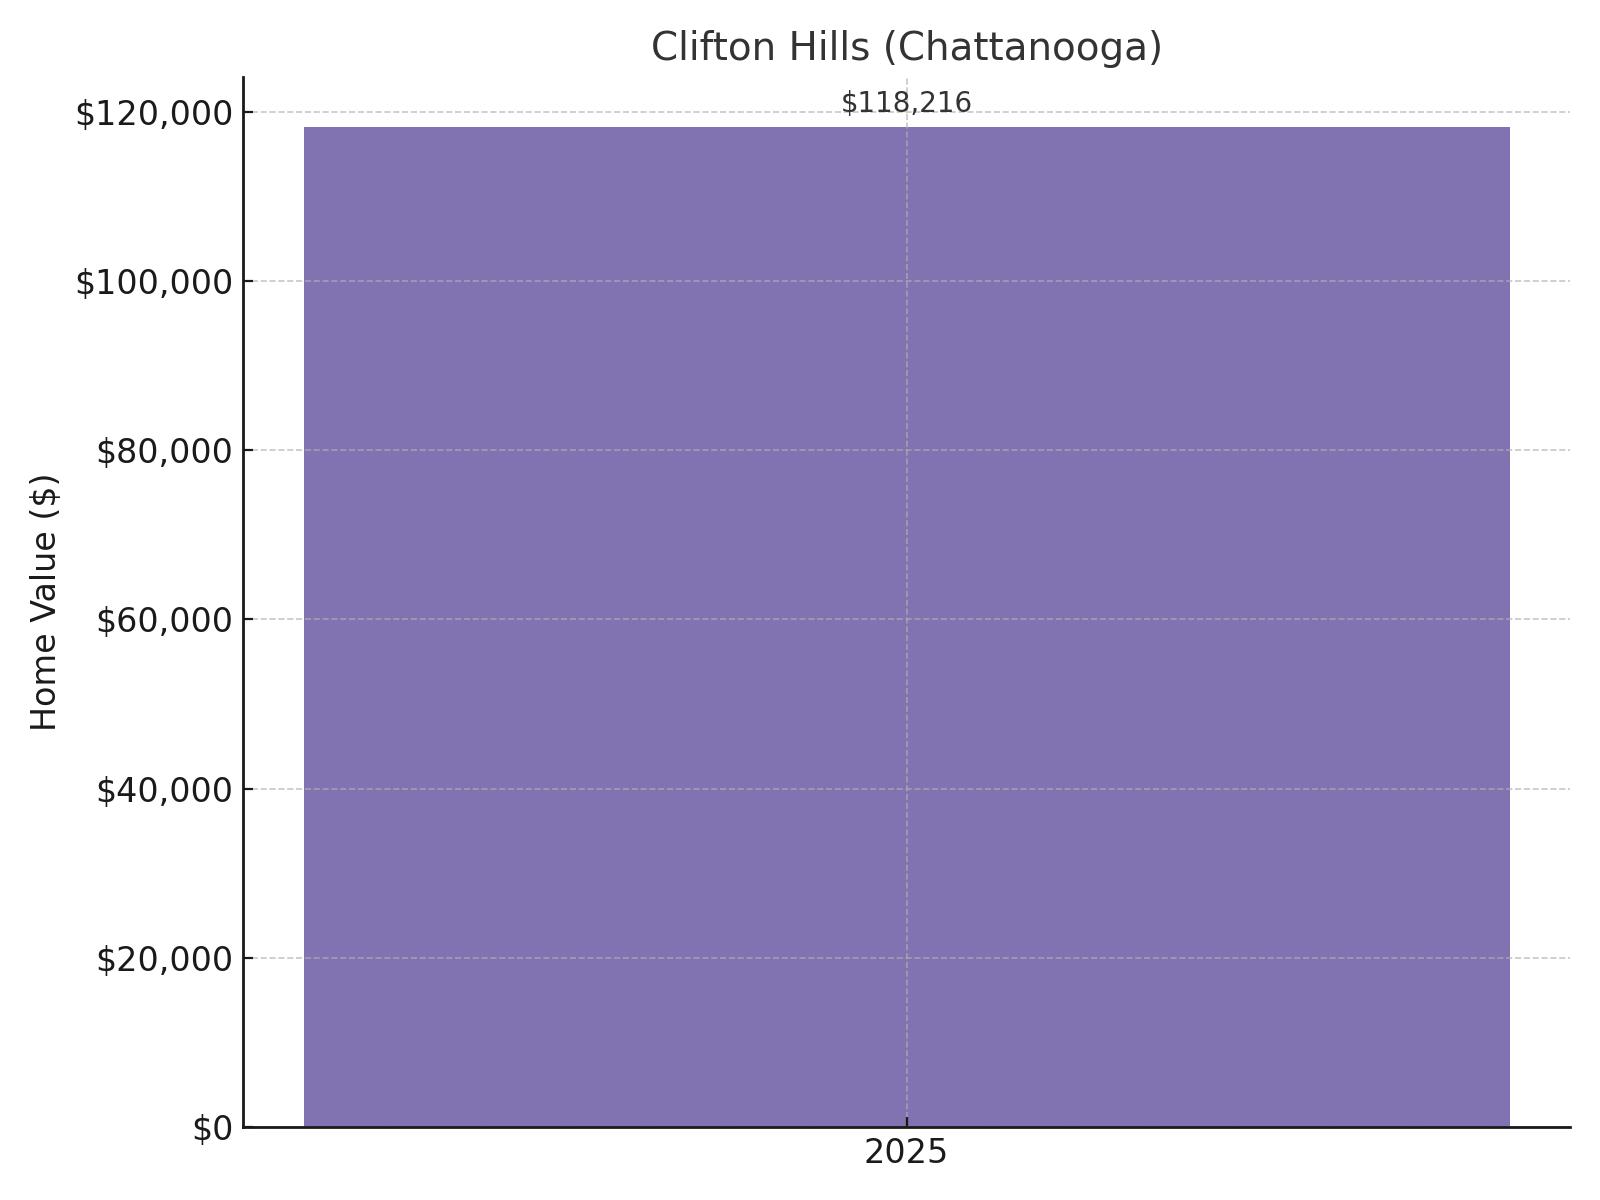
- 2025 Value: $118,216
- 2020 Value: Data not available
- 2015 Value: Data not available
- 2010 Value: Data not available
- Change 2020-2025: N/A
- Change 2015-2025: N/A
- Change 2010-2025: N/A
Located in the southern portion of Chattanooga in Hamilton County, Clifton Hills appears to be another recently tracked neighborhood. You can see that historical data is unavailable prior to 2025, suggesting either new development or redefinition in Zillow’s tracking methodology. With current values at $118,216, the neighborhood provides an affordable entry point into the Chattanooga housing market.
8. White Haven-Coro Lake (Memphis)
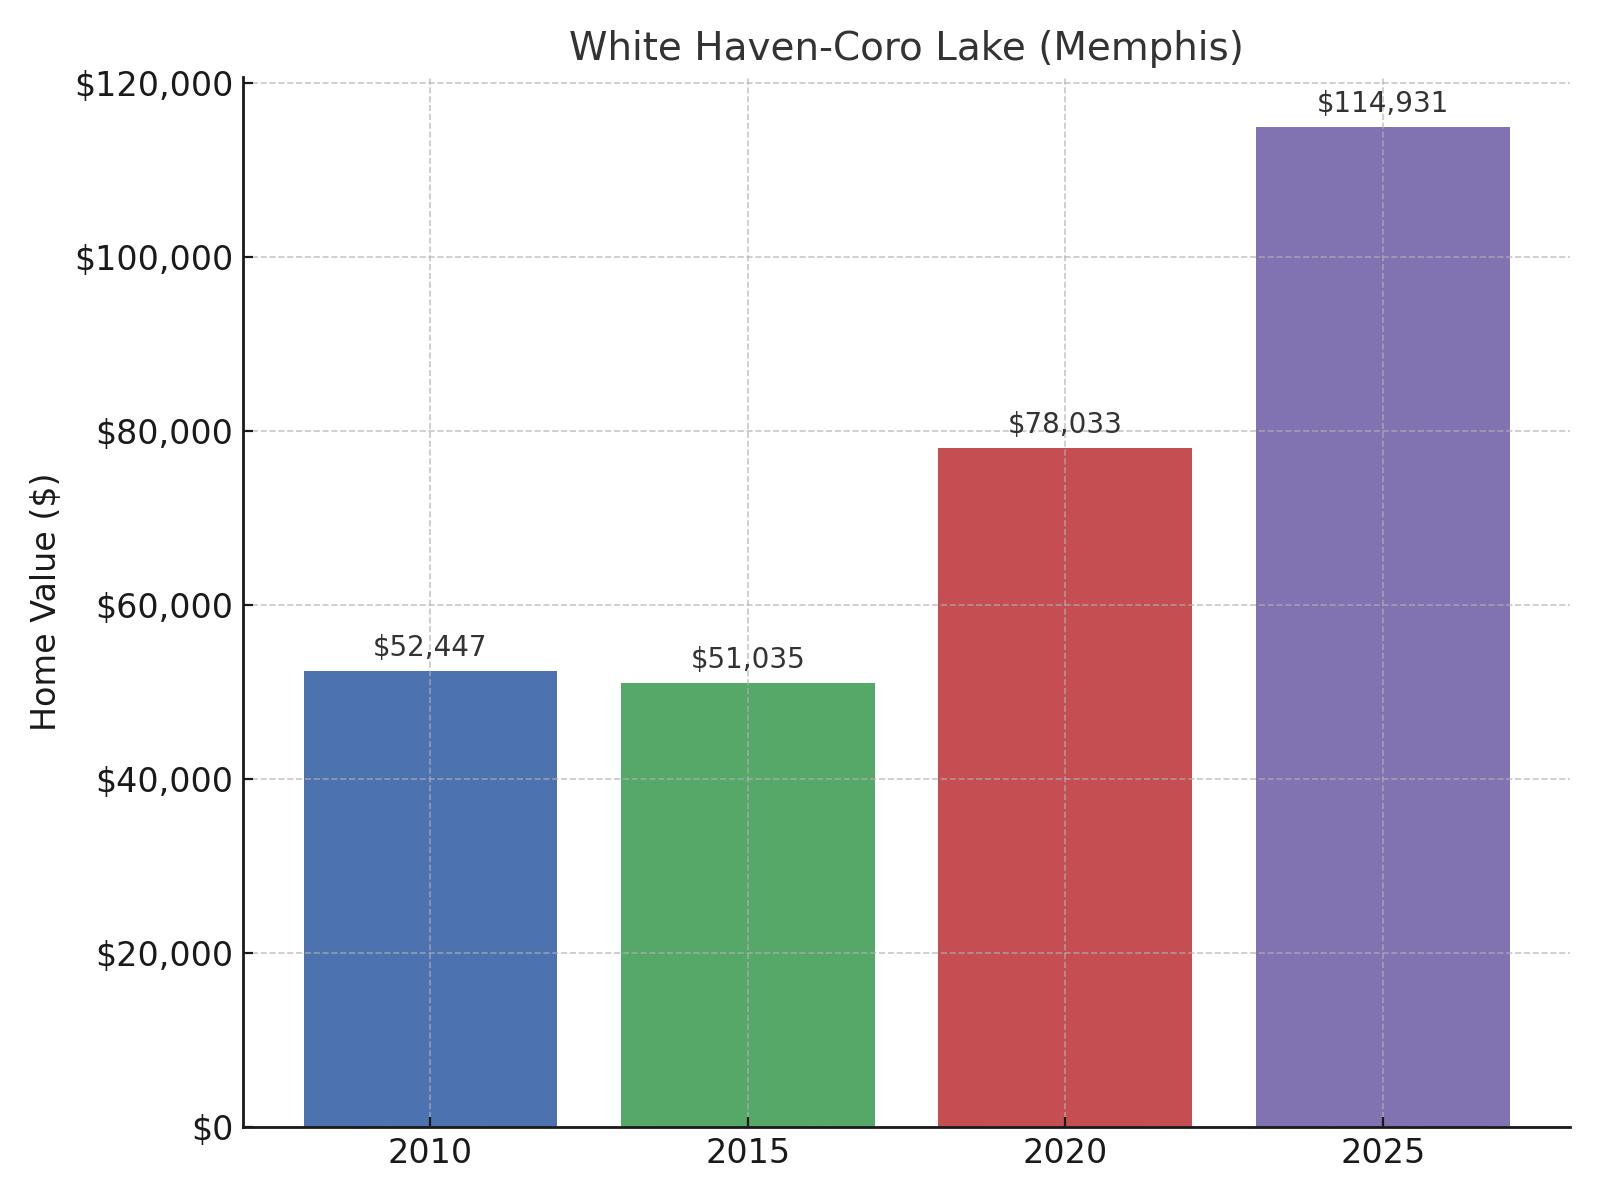
- 2025 Value: $114,931
- 2020 Value: $78,033
- 2015 Value: $51,035
- 2010 Value: $52,447
- Change 2020-2025: 47.28%
- Change 2015-2025: 125.20%
- Change 2010-2025: 119.14%
Located in the southwest part of Memphis in Shelby County, White Haven-Coro Lake offers solid value for homebuyers. You’ll find that property values initially dipped slightly from $52,447 in 2010 to $51,035 in 2015, before beginning a steady climb to $114,931 by 2025. This represents a 119.14% increase over the 15-year period. With 47.28% growth in the last five years, White Haven-Coro Lake continues to attract budget-conscious buyers looking for spacious homes and outdoor recreation opportunities.
7. Oak Hill (Chattanooga)
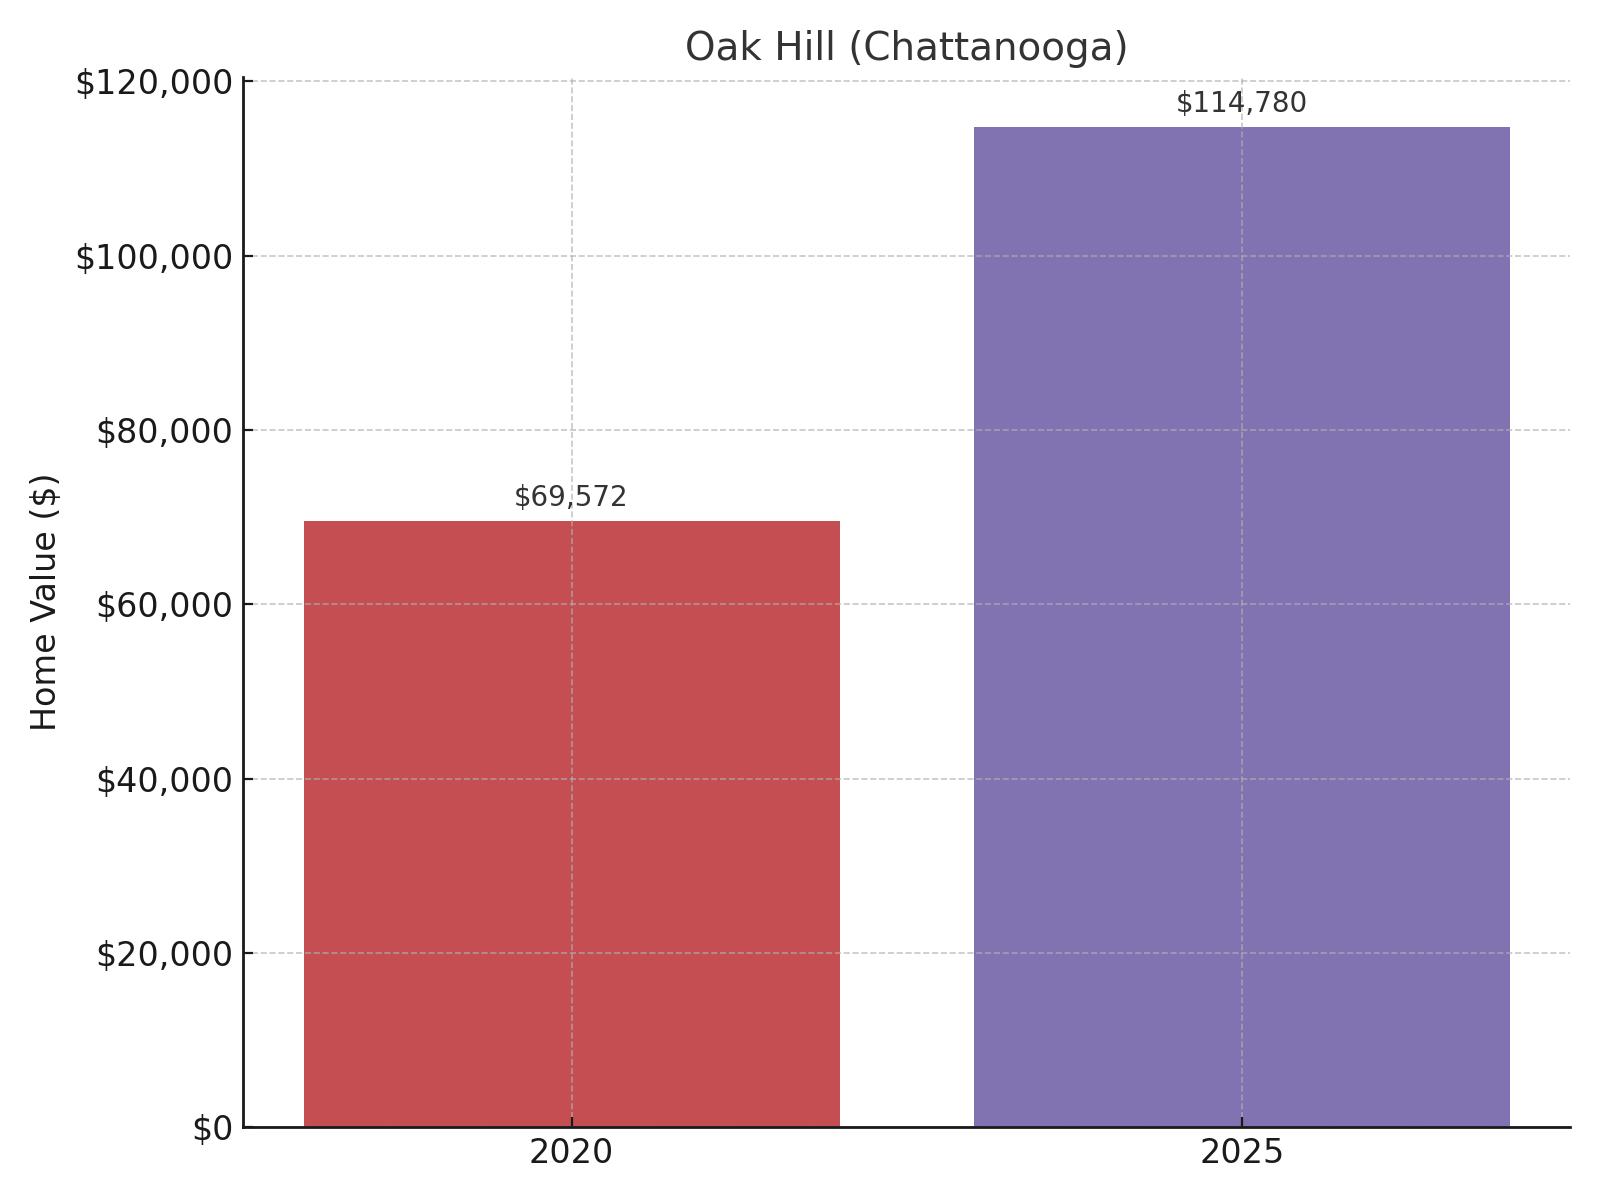
- 2025 Value: $114,780
- 2020 Value: $69,572
- 2015 Value: Data not available
- 2010 Value: Data not available
- Change 2020-2025: 64.98%
- Change 2015-2025: N/A
- Change 2010-2025: N/A
Nestled in the eastern section of Chattanooga in Hamilton County, Oak Hill is a relatively new addition to the tracked neighborhoods. You can observe that data only begins in 2020, when the average home value was $69,572. In just five years, values have increased nearly 65% to $114,780, demonstrating strong growth in this emerging area. As Chattanooga continues to expand eastward, this neighborhood is positioned to benefit from ongoing development while maintaining its accessible price point.
6. Harding Place Condos (Nashville)
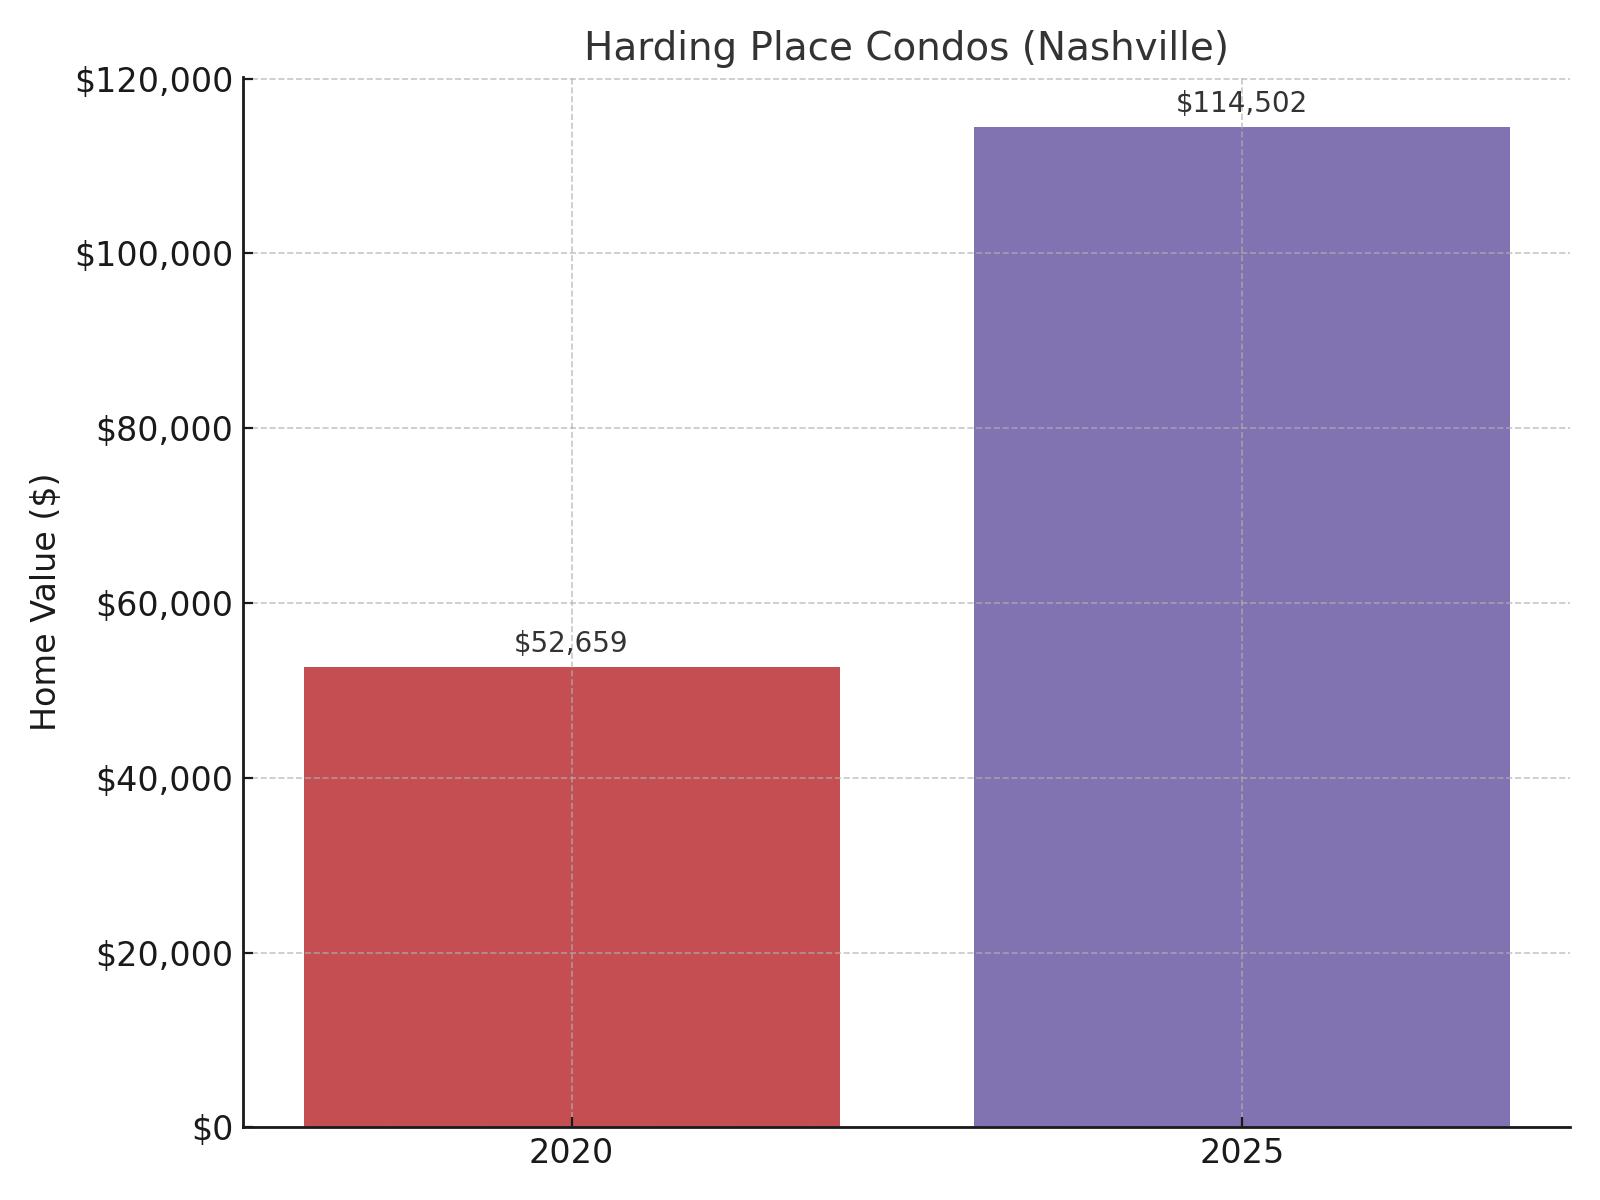
- 2025 Value: $114,502
- 2020 Value: $52,659
- 2015 Value: Data not available
- 2010 Value: Data not available
- Change 2020-2025: 117.44%
- Change 2015-2025: N/A
- Change 2010-2025: N/A
Situated in Davidson County within the Nashville metropolitan area, Harding Place Condos represents the third and final Nashville property on this list. You’ll note that this development has only been tracked since 2020, when units averaged $52,659 in value. By 2025, values had more than doubled to $114,502, representing an impressive 117.44% increase in just five years. This rapid appreciation reflects the intense demand for affordable housing options in Nashville’s otherwise expensive market.
5. Piney Woods (Chattanooga)
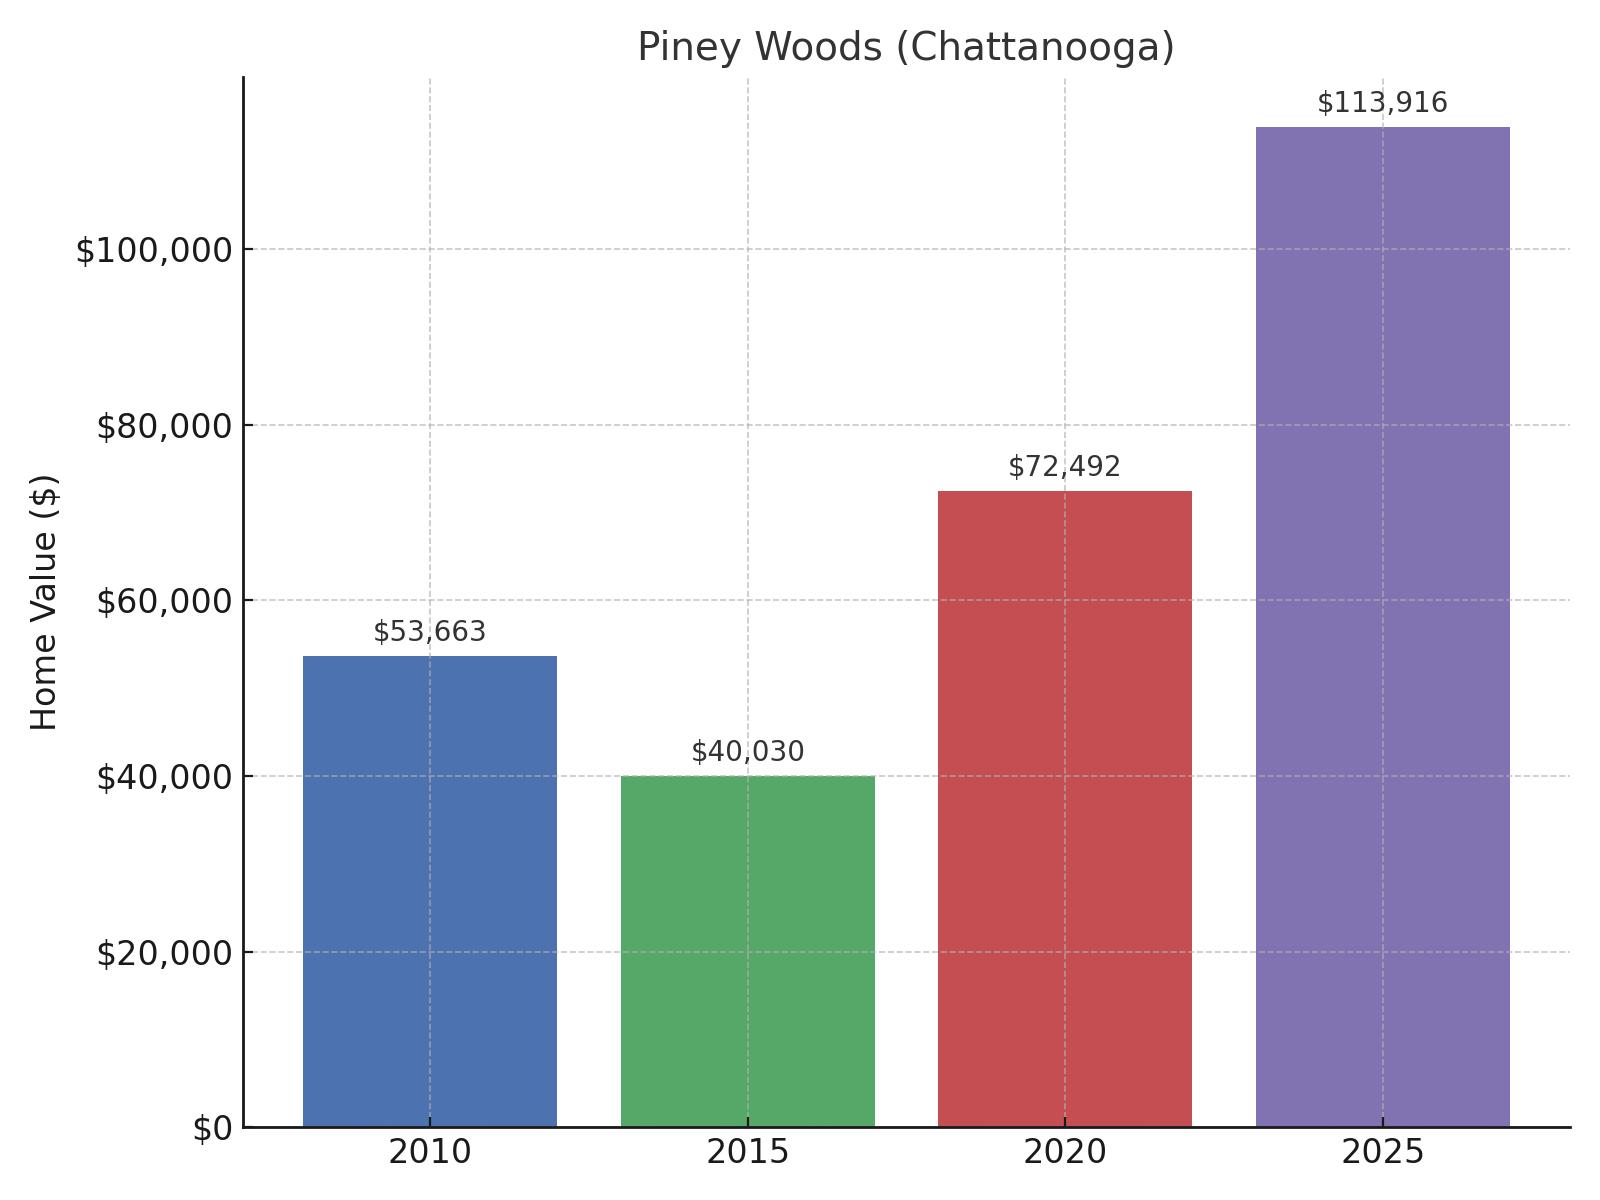
- 2025 Value: $113,916
- 2020 Value: $72,492
- 2015 Value: $40,030
- 2010 Value: $53,663
- Change 2020-2025: 57.14%
- Change 2015-2025: 184.58%
- Change 2010-2025: 112.28%
Tucked away in the northeastern part of Chattanooga in Hamilton County, Piney Woods showcases an interesting growth pattern typical of many Chattanooga neighborhoods. You can see that property values initially declined from $53,663 in 2010 to $40,030 in 2015, before experiencing substantial growth over the next decade. By 2025, values had more than doubled from their 2010 levels to $113,916—a 112.28% increase. The 57.14% growth over the past five years indicates steady demand as Chattanooga’s housing market continues to strengthen across all price points.
4. East Lake (Chattanooga)
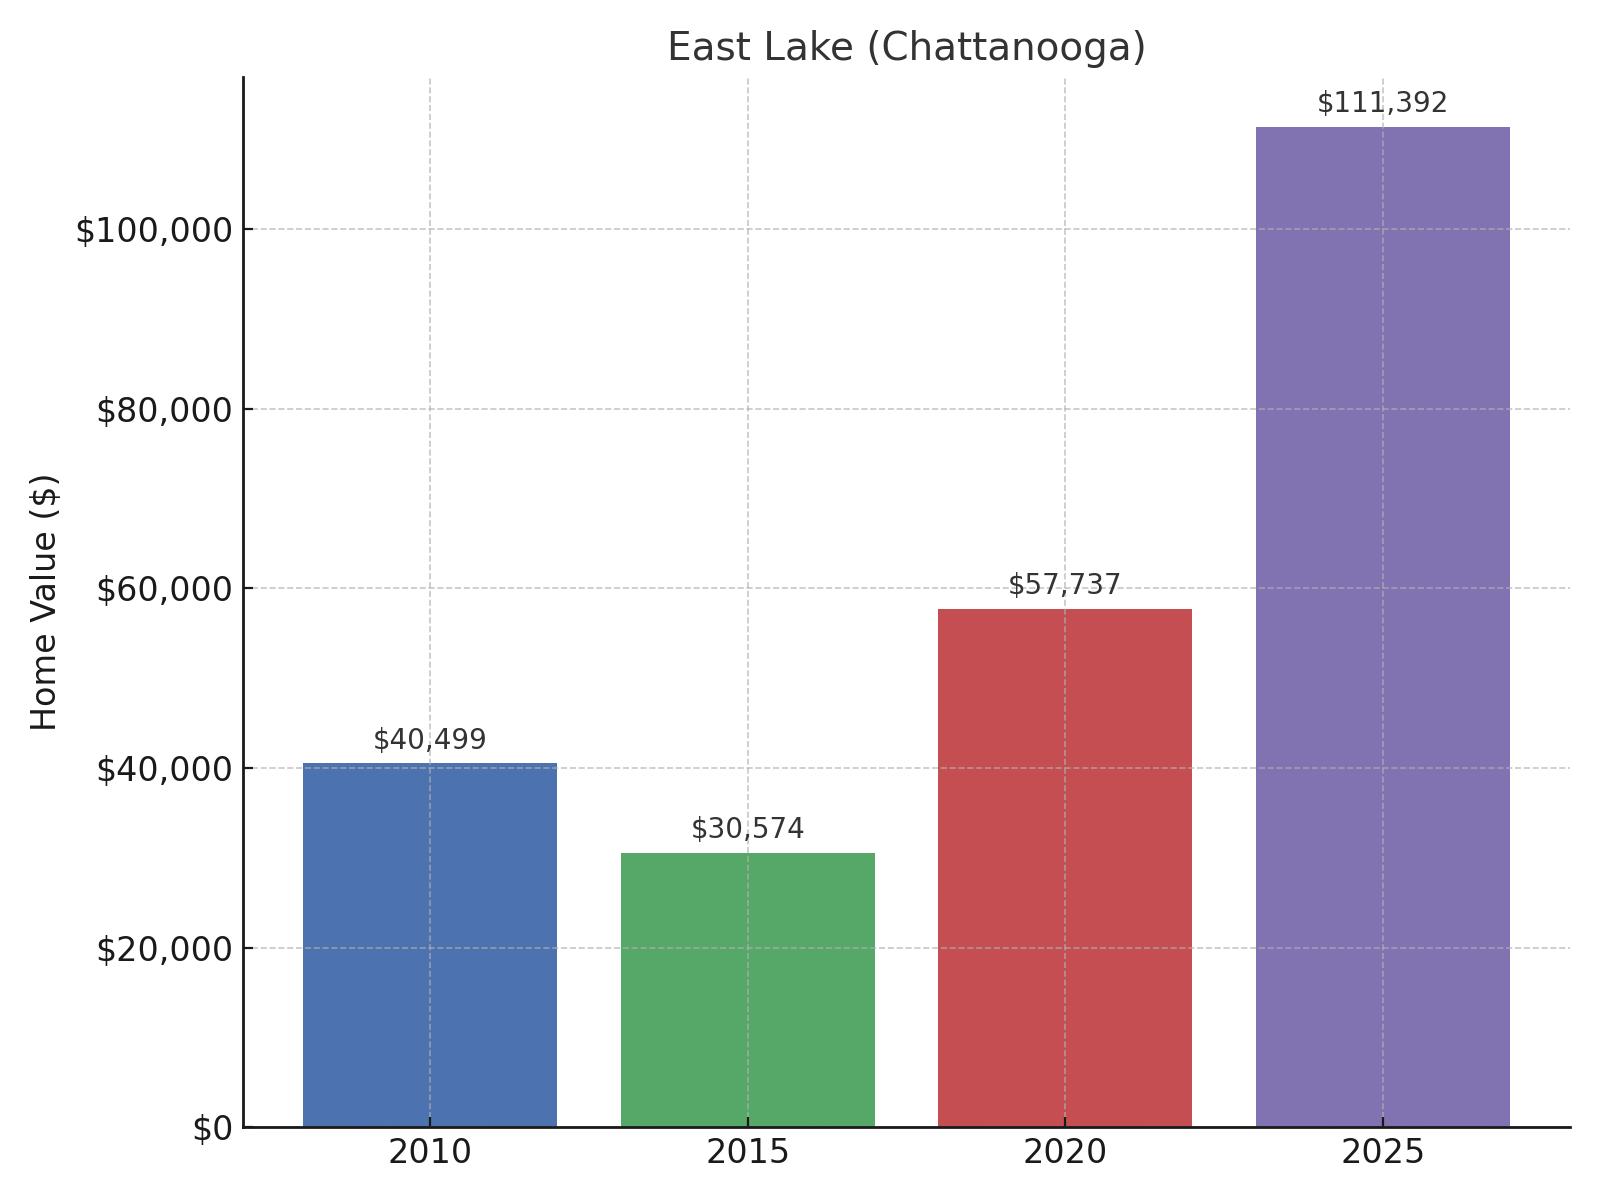
- 2025 Value: $111,392
- 2020 Value: $57,737
- 2015 Value: $30,574
- 2010 Value: $40,499
- Change 2020-2025: 92.93%
- Change 2015-2025: 264.34%
- Change 2010-2025: 175.05%
Located in southeastern Chattanooga around its namesake lake in Hamilton County, East Lake exhibits one of the most dramatic growth stories on this list. You’ll find that property values initially declined from $40,499 in 2010 to a low of $30,574 in 2015, before beginning an extraordinary recovery. By 2025, values had soared to $111,392, representing a 264.34% increase from the 2015 low point and a 175.05% increase over the 15-year period. With nearly 93% growth in just the past five years, East Lake demonstrates how affordable neighborhoods can experience rapid appreciation when investment and attention return to previously overlooked areas.
3. Berclair-Highland Heights (Memphis)
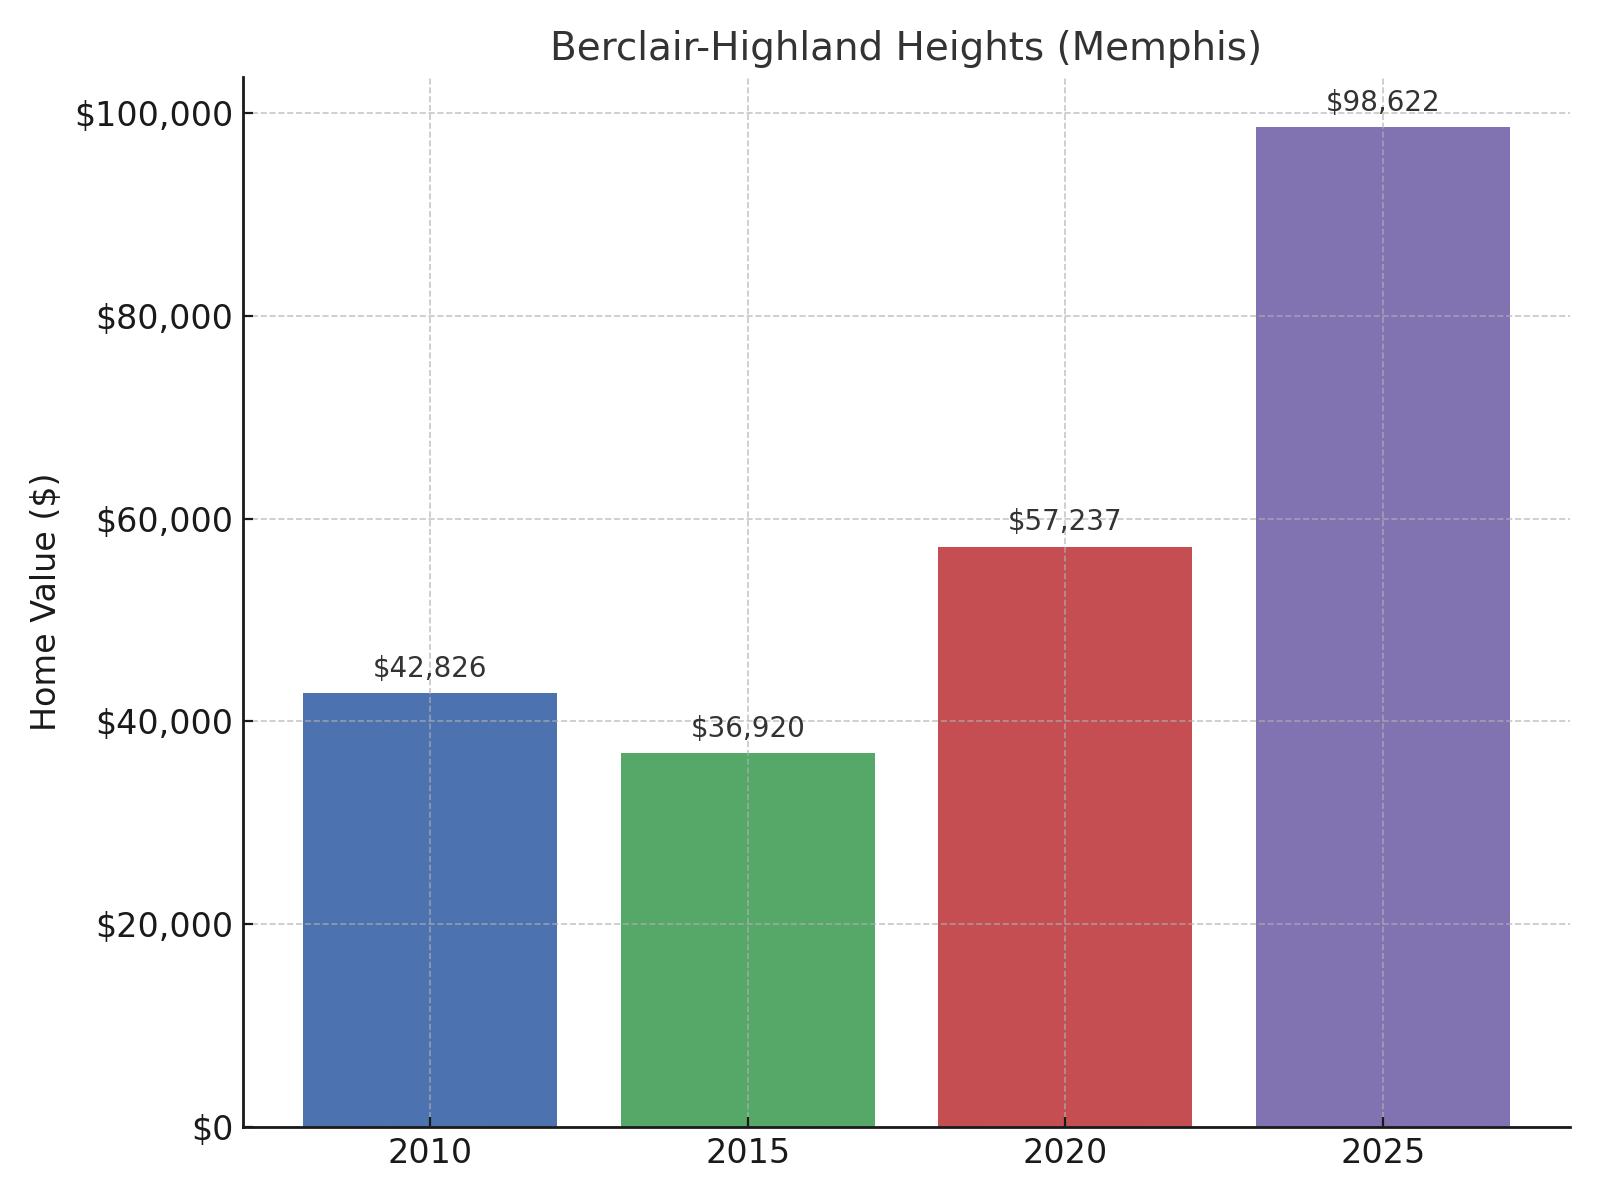
- 2025 Value: $98,622
- 2020 Value: $57,237
- 2015 Value: $36,920
- 2010 Value: $42,826
- Change 2020-2025: 72.31%
- Change 2015-2025: 167.13%
- Change 2010-2025: 130.29%
Positioned in northeast Memphis in Shelby County, Berclair-Highland Heights tells a compelling story of recovery and growth. You can observe that property values initially declined from $42,826 in 2010 to $36,920 in 2015, before beginning a strong upward trajectory. By 2025, values had reached $98,622, representing a 130.29% increase from 2010 and an impressive 167.13% increase from the 2015 low. The 72.31% growth in just the past five years reflects renewed interest in this affordable, conveniently located community.
2. Shelby Forest-Frayser (Memphis)

- 2025 Value: $87,912
- 2020 Value: $54,778
- 2015 Value: $31,723
- 2010 Value: $31,591
- Change 2020-2025: 60.49%
- Change 2015-2025: 177.12%
- Change 2010-2025: 178.28%
Sprawling across northern Memphis in Shelby County, Shelby Forest-Frayser offers the second most affordable housing option on our list. You’ll notice that property values remained relatively stagnant around $31,000 between 2010 and 2015, before experiencing significant growth over the next decade. By 2025, values had climbed to $87,912, representing a 178.28% increase over the 15-year period. The 60.49% growth over the past five years indicates strengthening demand as buyers discover this affordable neighborhood with unique outdoor recreational opportunities.
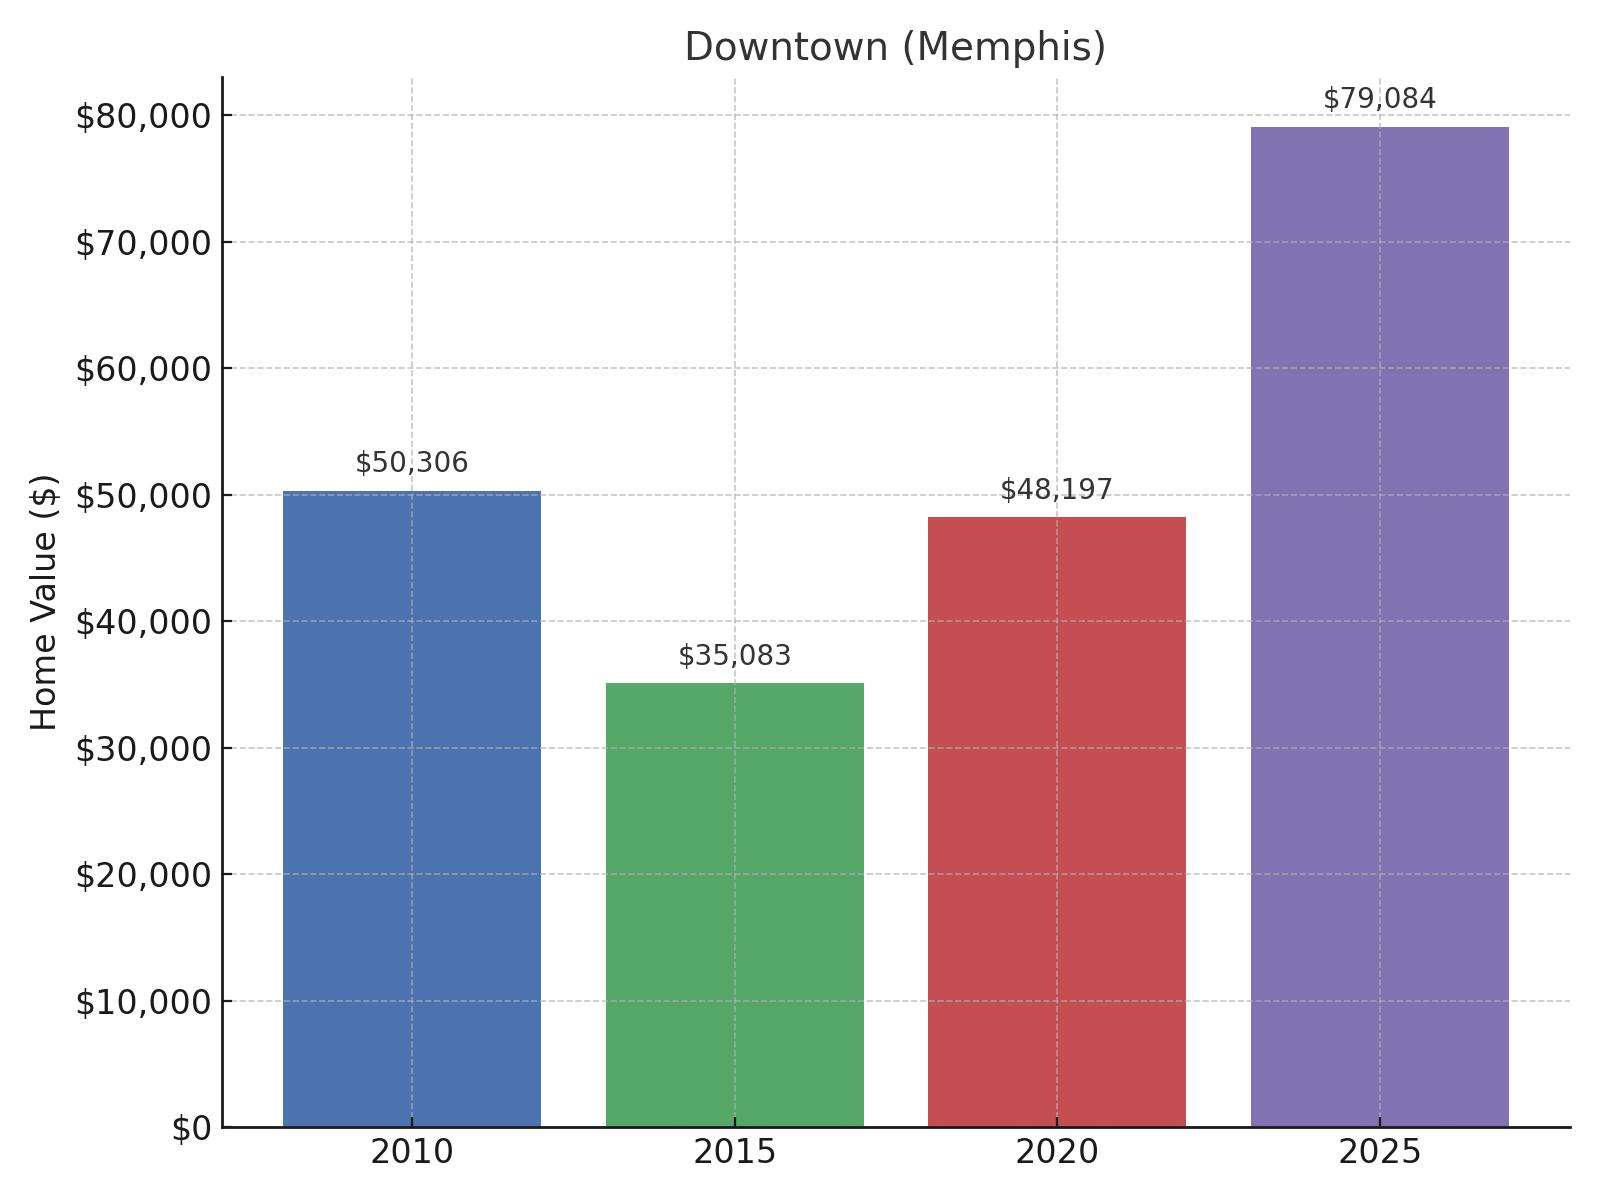
1. Downtown (Memphis)
🔥 Would you like to save this?
- 2025 Value: $79,084
- 2020 Value: $48,197
- 2015 Value: $35,083
- 2010 Value: $50,306
- Change 2020-2025: 64.09%
- Change 2015-2025: 125.42%
- Change 2010-2025: 57.21%
Situated at the heart of Memphis in Shelby County, Downtown claims the distinction of being the most affordable neighborhood on our list. You can see that property values experienced a significant decline from $50,306 in 2010 to $35,083 in 2015, before beginning a steady recovery to $79,084 by 2025. This represents a modest 57.21% increase over the 15-year period—the lowest long-term growth rate among the 25 neighborhoods. However, Downtown has shown strong recent performance with 64.09% growth in just the past five years.


