🔥 Would you like to save this?
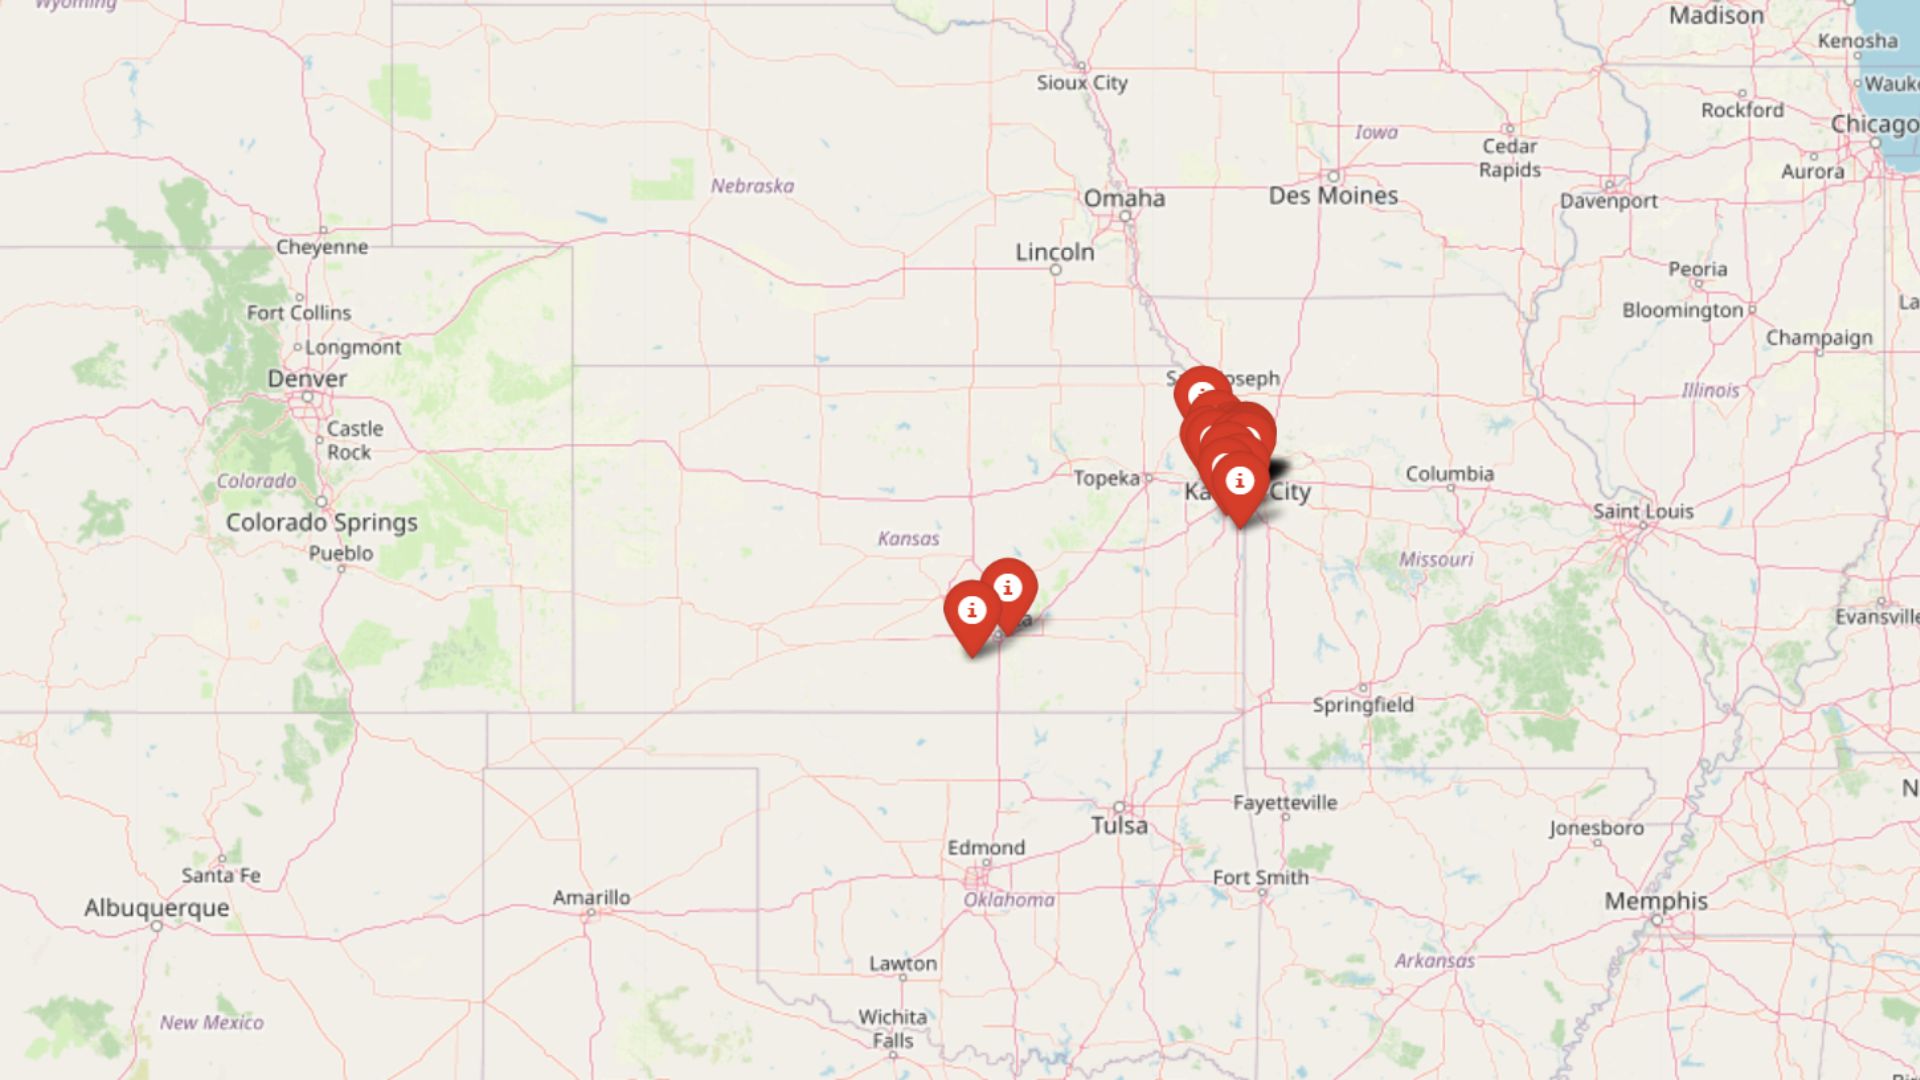
Kansas isn’t immune to rising home prices—some towns are seeing rapid growth that rivals national hotspots. Using the Zillow Home Values Index, analysts have identified 21 Kansas communities where property values have surged in recent years. From expanding suburbs to small rural towns, these markets are seeing prices climb fast, driven by strong demand, limited inventory, and shifting buyer trends. Whether you’re house hunting or tracking the market, these towns highlight where Kansas home values are rising quickest.
21. Viola – 124% Home Price Increase Since 2010
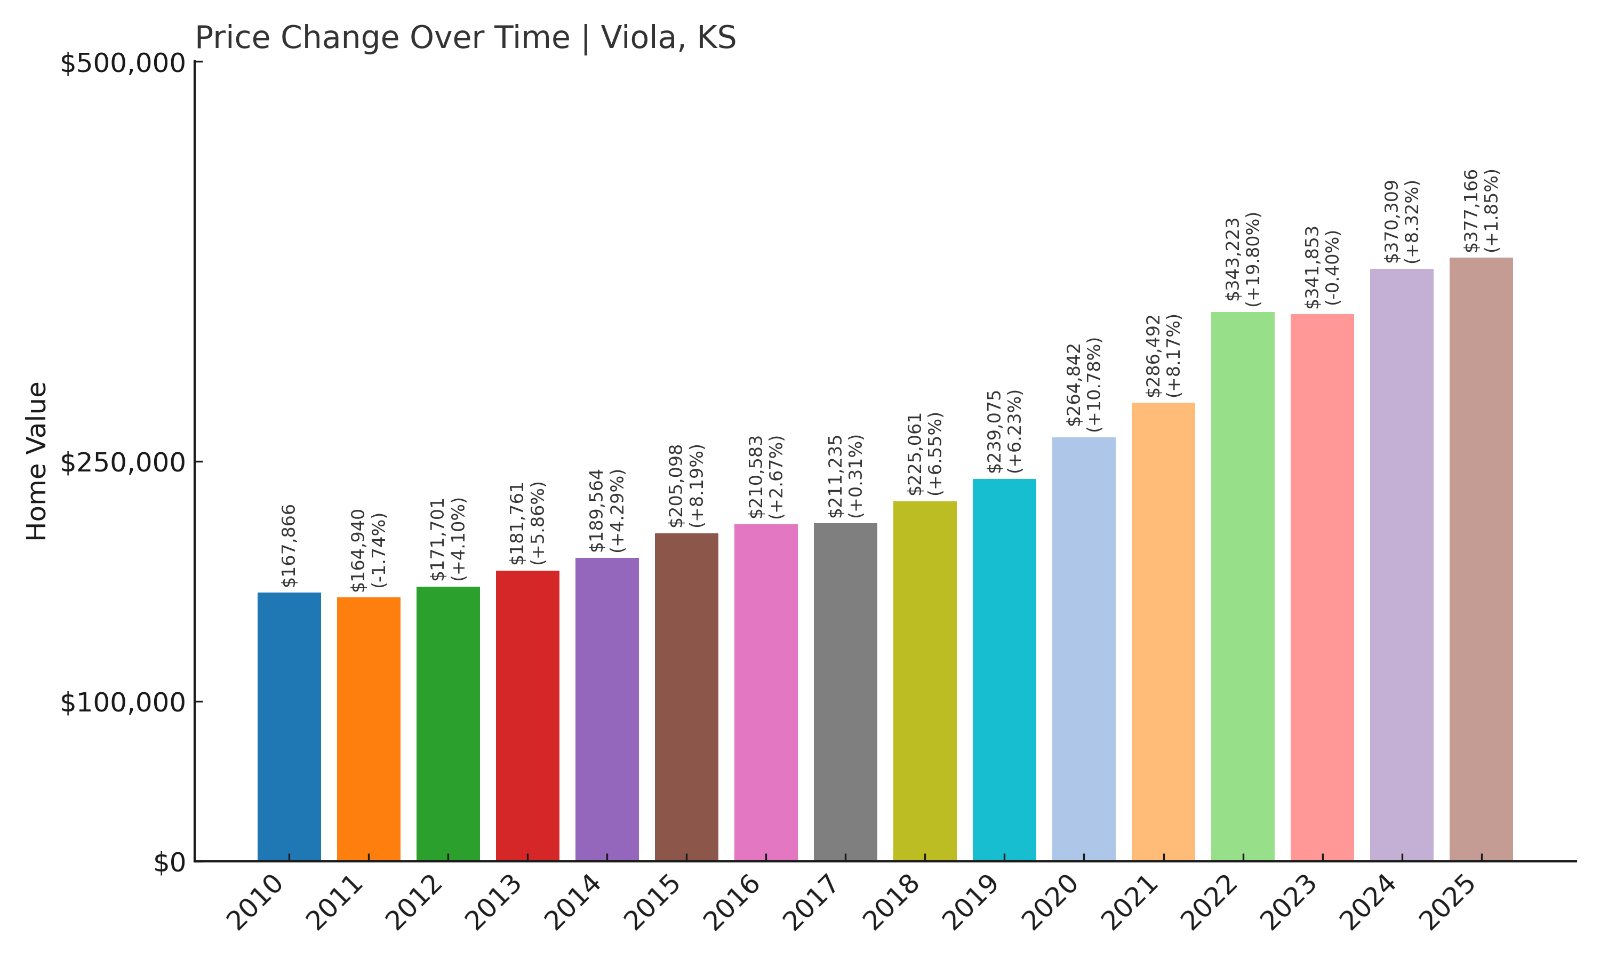
- 2010: $167,866
- 2011: $164,940 (-$2,927, -1.74% from previous year)
- 2012: $171,701 (+$6,761, +4.10% from previous year)
- 2013: $181,761 (+$10,061, +5.86% from previous year)
- 2014: $189,564 (+$7,803, +4.29% from previous year)
- 2015: $205,098 (+$15,534, +8.19% from previous year)
- 2016: $210,583 (+$5,485, +2.67% from previous year)
- 2017: $211,235 (+$652, +0.31% from previous year)
- 2018: $225,061 (+$13,826, +6.55% from previous year)
- 2019: $239,075 (+$14,014, +6.23% from previous year)
- 2020: $264,842 (+$25,767, +10.78% from previous year)
- 2021: $286,492 (+$21,650, +8.17% from previous year)
- 2022: $343,223 (+$56,731, +19.80% from previous year)
- 2023: $341,853 (-$1,370, -0.40% from previous year)
- 2024: $370,309 (+$28,456, +8.32% from previous year)
- 2025: $377,166 (+$6,857, +1.85% from previous year)
Viola has experienced a remarkable home price surge since 2010, growing by over 124%. From its early-2010s stagnation, prices picked up steadily, peaking with nearly 20% growth in 2022 alone. The current median price stands at $377,166, reflecting continued demand in this small Sedgwick County town.
In order to come up with the very specific design ideas, we create most designs with the assistance of state-of-the-art AI interior design software. Also, assume links that take you off the site are affiliate links such as links to Amazon. this means we may earn a commission if you buy something.
Viola – Strong Price Growth and Rural Charm
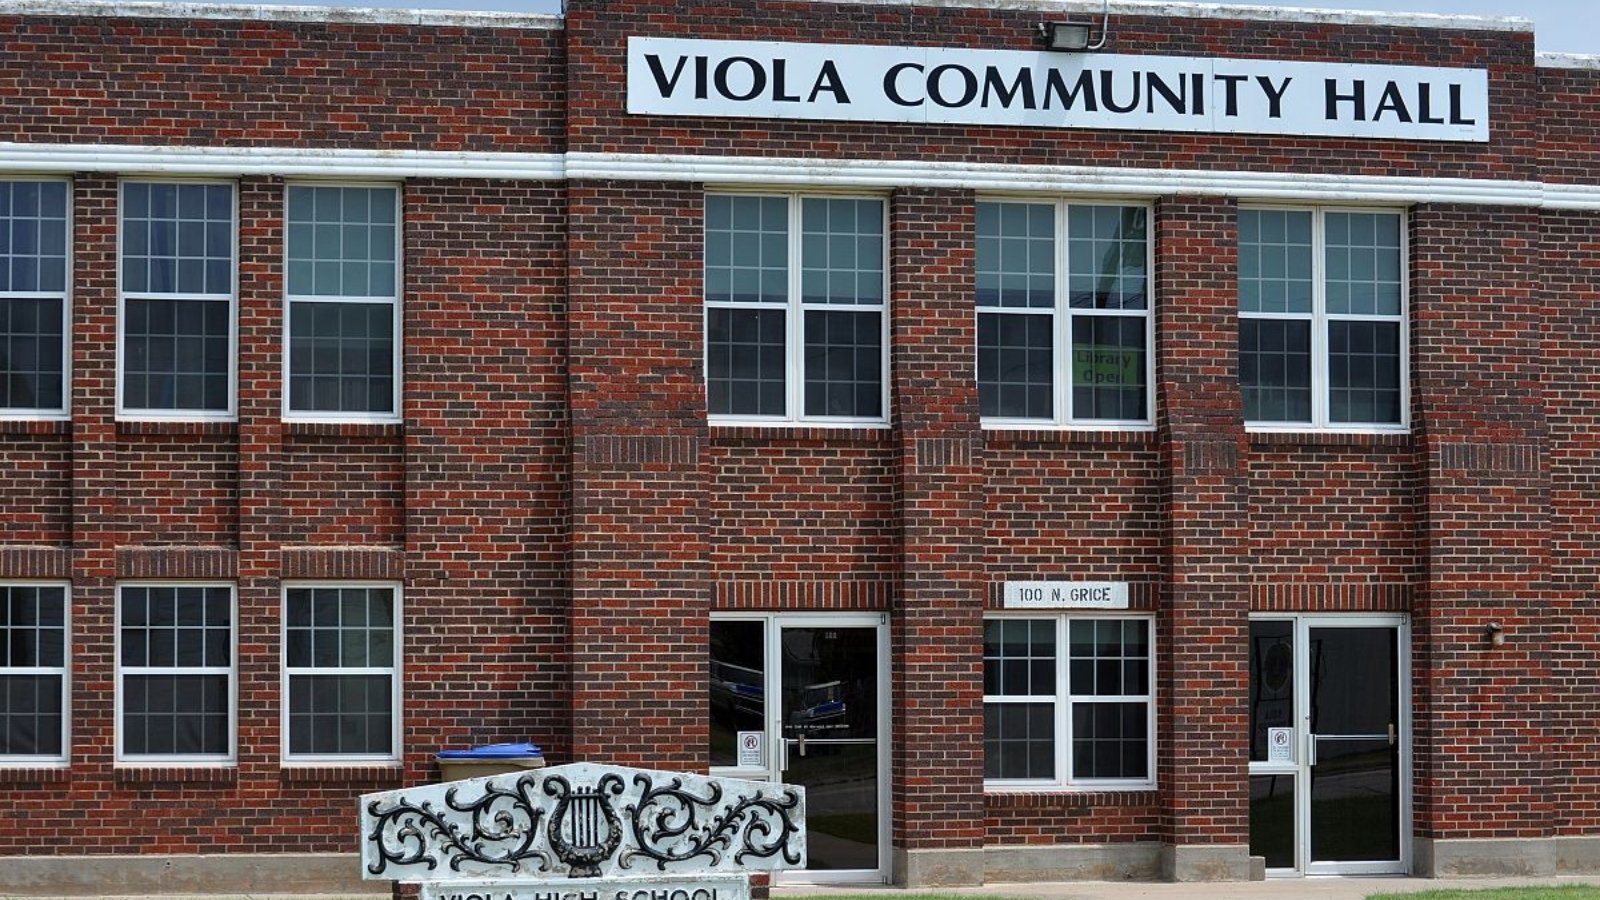
Viola is a quiet community southwest of Wichita, known for its agricultural roots and wide-open landscapes. The recent rise in prices likely reflects buyers seeking affordable land while remaining within commuting distance to Wichita jobs and amenities. Its housing stock consists mainly of single-family homes on larger plots, appealing to those valuing space and tranquility.
Although small, Viola has maintained gradual growth due to its proximity to larger urban centers. This price appreciation mirrors national trends in rural and exurban markets as remote work reshapes housing demand. The modest price jump in 2025 shows cooling compared to 2022 but still indicates resilience in buyer interest here.
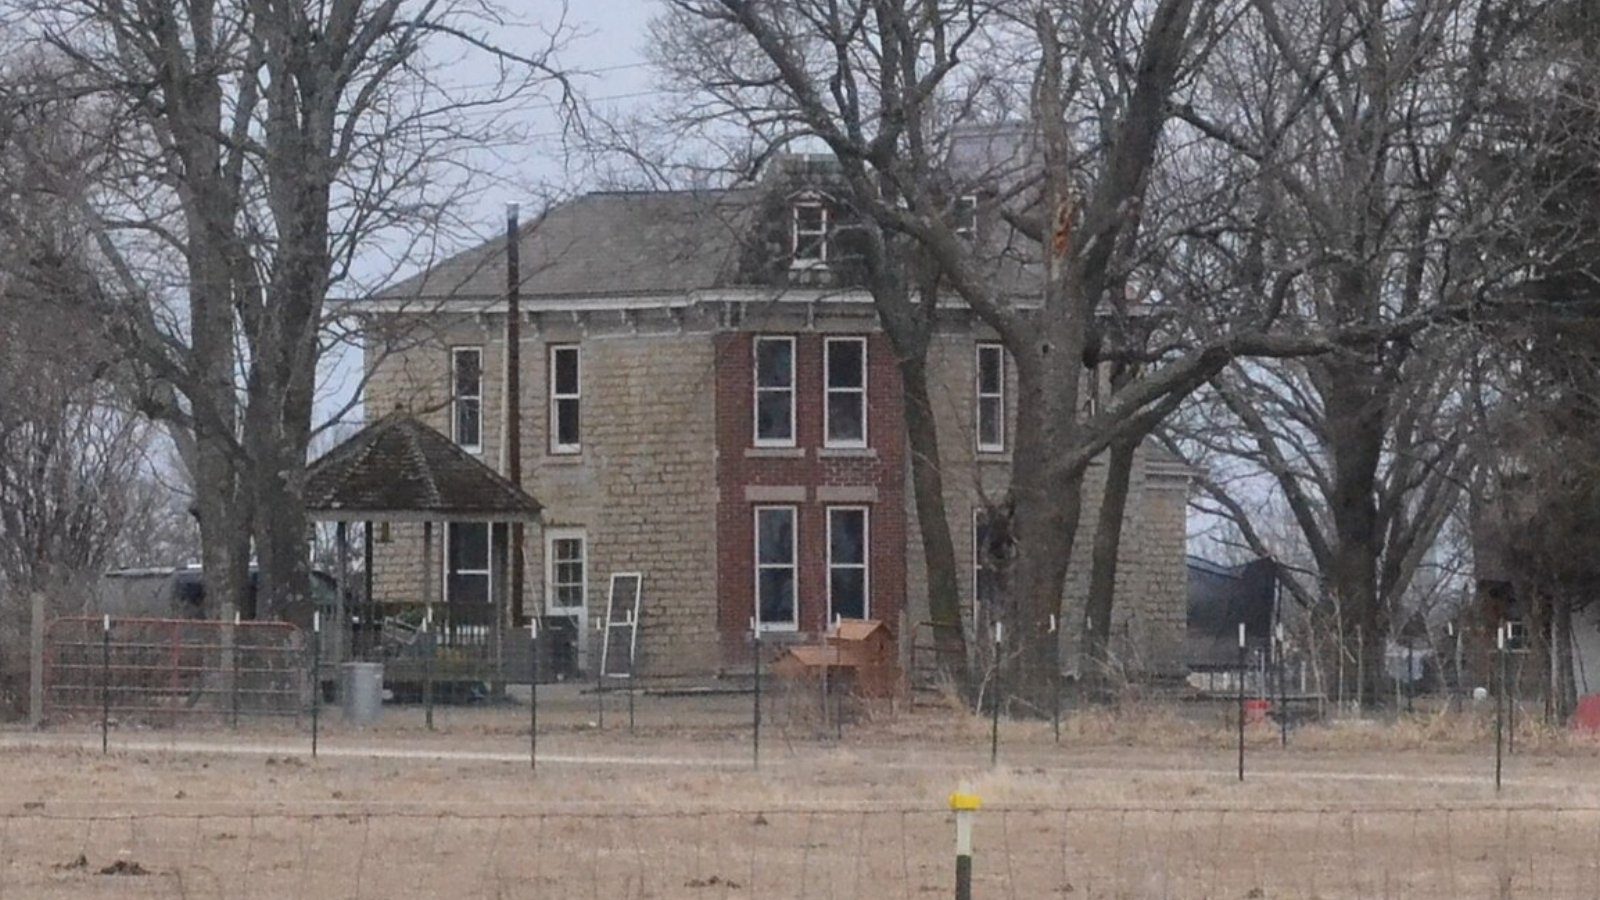
20. Easton – 179% Home Price Increase Since 2010
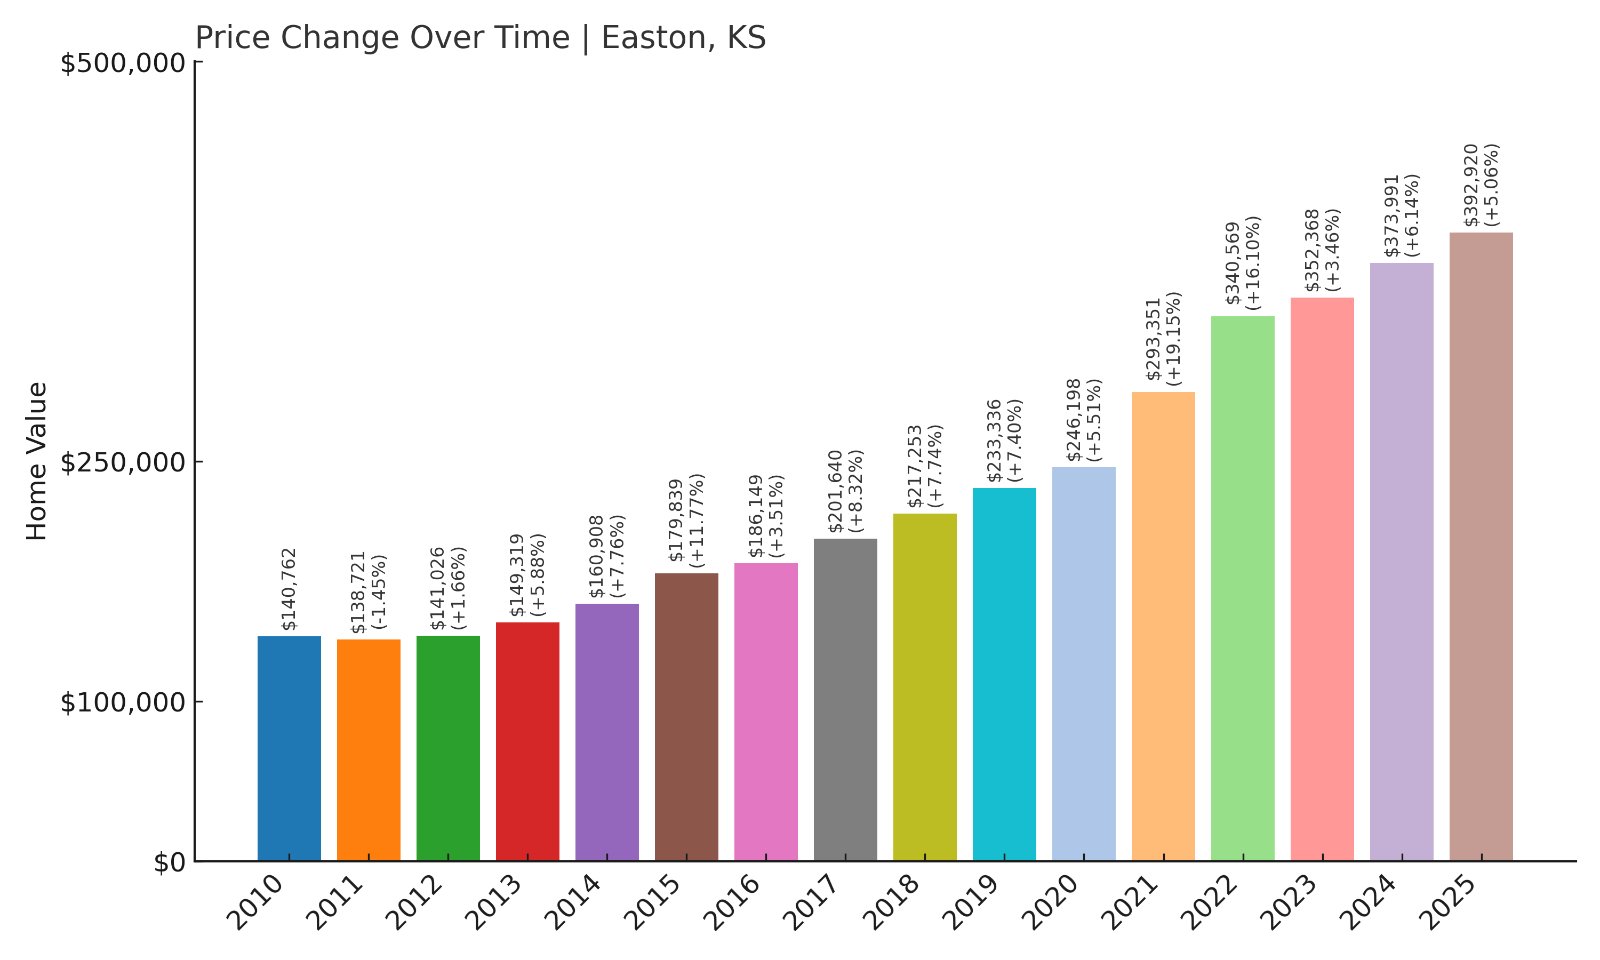
- 2010: $140,762
- 2011: $138,721 (-$2,041, -1.45% from previous year)
- 2012: $141,026 (+$2,305, +1.66% from previous year)
- 2013: $149,319 (+$8,294, +5.88% from previous year)
- 2014: $160,908 (+$11,588, +7.76% from previous year)
- 2015: $179,839 (+$18,931, +11.77% from previous year)
- 2016: $186,149 (+$6,310, +3.51% from previous year)
- 2017: $201,640 (+$15,491, +8.32% from previous year)
- 2018: $217,253 (+$15,613, +7.74% from previous year)
- 2019: $233,336 (+$16,083, +7.40% from previous year)
- 2020: $246,198 (+$12,861, +5.51% from previous year)
- 2021: $293,351 (+$47,153, +19.15% from previous year)
- 2022: $340,569 (+$47,219, +16.10% from previous year)
- 2023: $352,368 (+$11,799, +3.46% from previous year)
- 2024: $373,991 (+$21,623, +6.14% from previous year)
- 2025: $392,920 (+$18,929, +5.06% from previous year)
Easton has seen an impressive near-180% increase in home prices since 2010, driven by consistent annual gains and dramatic jumps in 2021 and 2022. Prices have grown steadily to a median of $392,920 in 2025, reflecting both local desirability and statewide housing trends.
Easton – Small-Town Growth With Big Gains
Easton is located in Leavenworth County, northeast Kansas, and offers small-town life within commuting reach of Kansas City. Its community vibe and low baseline prices a decade ago made it attractive for those priced out of larger nearby cities. New builds and renovations in the past five years have lifted its market profile.
The significant spikes in 2021 and 2022 suggest an influx of buyers during the pandemic housing boom, reflecting a broader shift towards quieter towns with strong commuter access. Even as price growth has moderated recently, Easton remains among Kansas’s fastest risers.
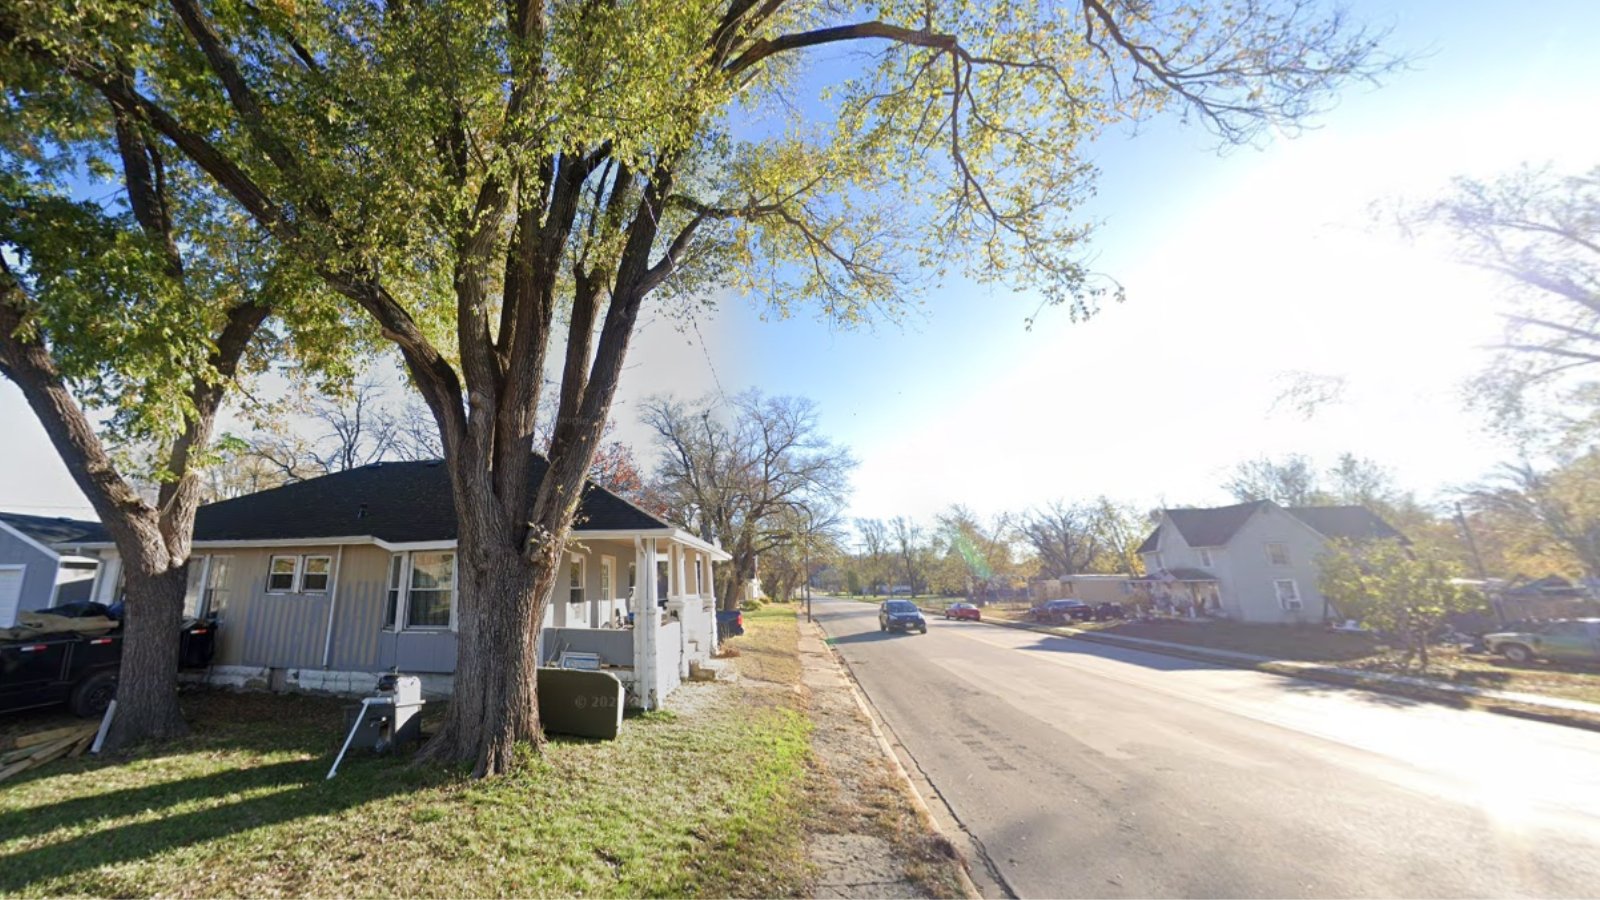
19. Louisburg – 136% Home Price Increase Since 2010
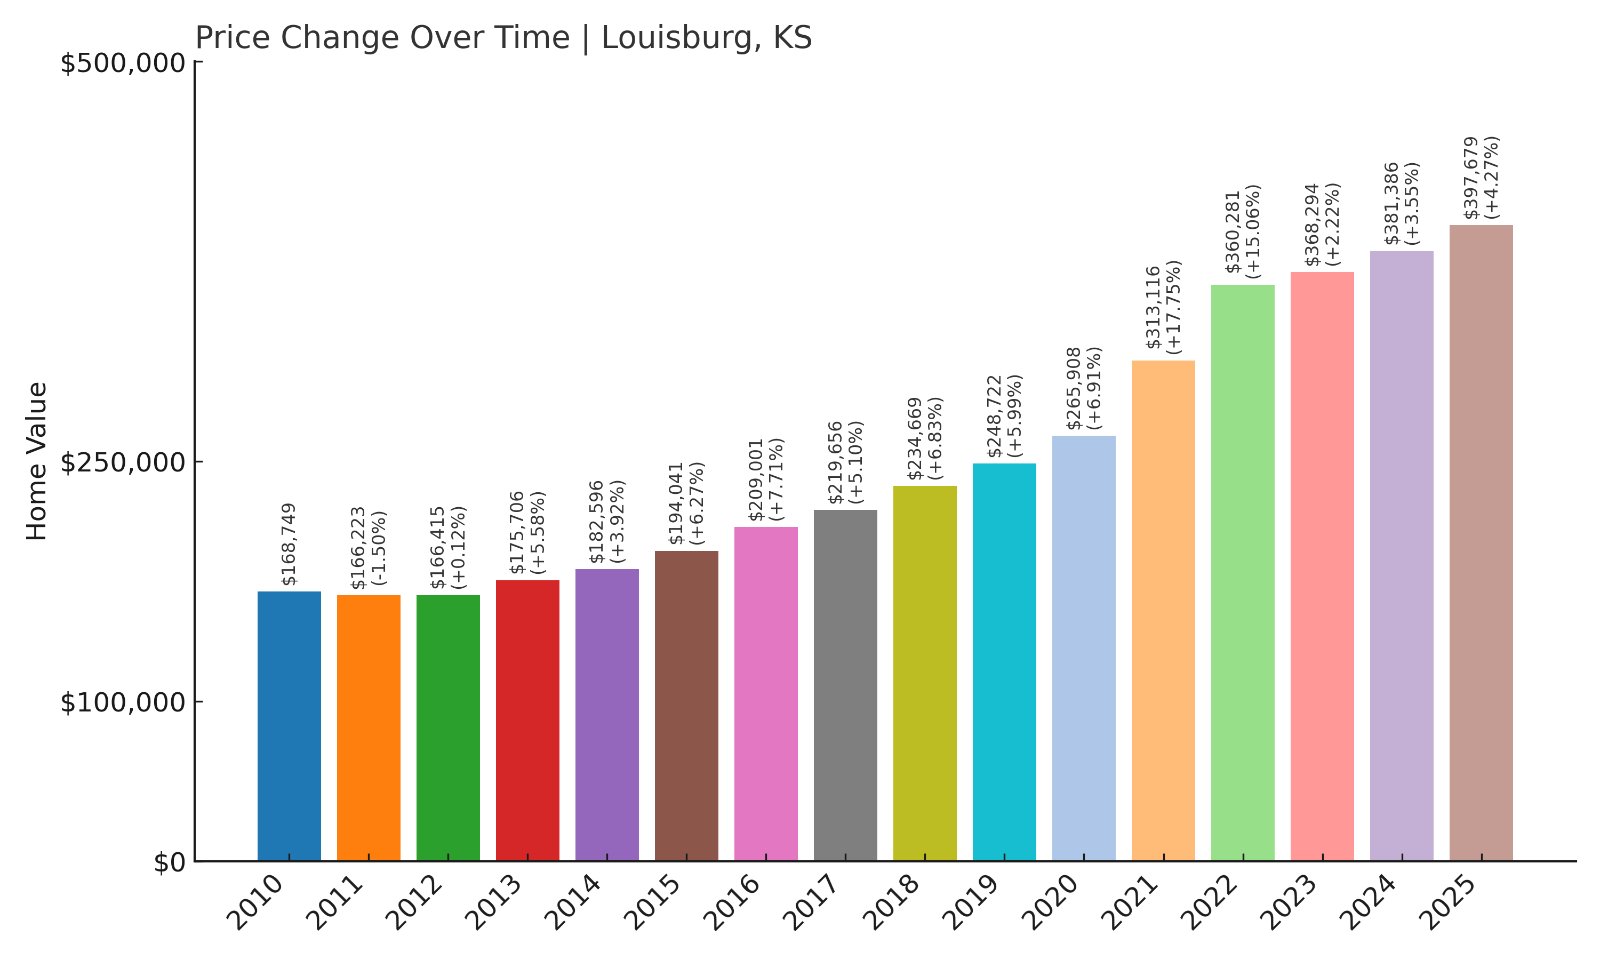
- 2010: $168,749
- 2011: $166,223 (-$2,526, -1.50% from previous year)
- 2012: $166,415 (+$193, +0.12% from previous year)
- 2013: $175,706 (+$9,291, +5.58% from previous year)
- 2014: $182,596 (+$6,890, +3.92% from previous year)
- 2015: $194,041 (+$11,445, +6.27% from previous year)
- 2016: $209,001 (+$14,960, +7.71% from previous year)
- 2017: $219,656 (+$10,655, +5.10% from previous year)
- 2018: $234,669 (+$15,014, +6.84% from previous year)
- 2019: $248,722 (+$14,053, +5.99% from previous year)
- 2020: $265,908 (+$17,186, +6.91% from previous year)
- 2021: $313,116 (+$47,208, +17.75% from previous year)
- 2022: $360,281 (+$47,165, +15.06% from previous year)
- 2023: $368,294 (+$8,013, +2.22% from previous year)
- 2024: $381,386 (+$13,092, +3.55% from previous year)
- 2025: $397,679 (+$16,293, +4.27% from previous year)
Louisburg’s home prices have grown 136% since 2010, driven by steady annual increases and rapid appreciation from 2020 onwards. Its 2025 median price of $397,679 reflects continued buyer demand in this town just south of the Kansas City metro.
Louisburg – Steady Rises and Pandemic-Era Boom
Louisburg, in Miami County, offers a mix of suburban comfort and rural surroundings. Known for Louisburg Cider Mill and Powell Observatory, its small-town amenities and proximity to Overland Park have helped sustain demand. Growth accelerated notably during the pandemic years as families sought out suburban homes with larger lots.
Recent data suggests prices have moderated to single-digit annual growth in 2024 and 2025. Still, with its strong schools and easy highway access, Louisburg remains an attractive option for Kansas homebuyers.
18. Shawnee – 97% Home Price Increase Since 2010
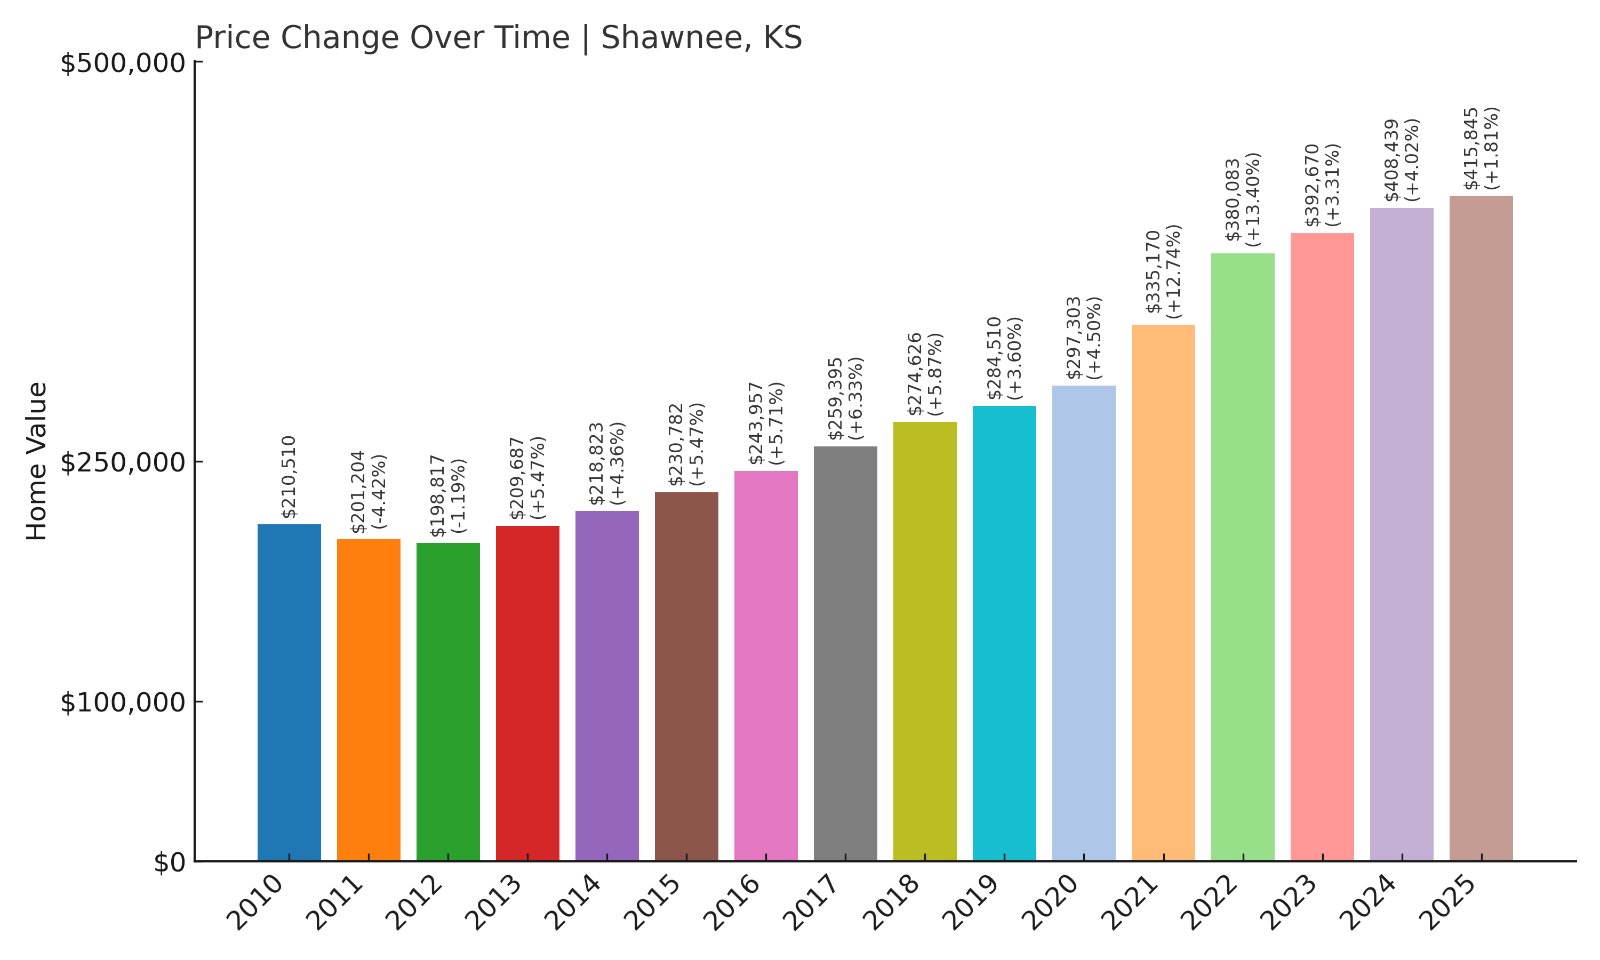
- 2010: $210,510
- 2011: $201,204 (-$9,306, -4.42% from previous year)
- 2012: $198,817 (-$2,387, -1.19% from previous year)
- 2013: $209,687 (+$10,870, +5.47% from previous year)
- 2014: $218,823 (+$9,136, +4.36% from previous year)
- 2015: $230,782 (+$11,959, +5.47% from previous year)
- 2016: $243,957 (+$13,175, +5.71% from previous year)
- 2017: $259,395 (+$15,438, +6.33% from previous year)
- 2018: $274,626 (+$15,231, +5.87% from previous year)
- 2019: $284,510 (+$9,884, +3.60% from previous year)
- 2020: $297,303 (+$12,793, +4.50% from previous year)
- 2021: $335,170 (+$37,867, +12.74% from previous year)
- 2022: $380,083 (+$44,913, +13.40% from previous year)
- 2023: $392,670 (+$12,587, +3.31% from previous year)
- 2024: $408,439 (+$15,769, +4.02% from previous year)
- 2025: $415,845 (+$7,405, +1.81% from previous year)
Home prices in Shawnee have nearly doubled since 2010, with particularly sharp increases in 2021 and 2022. Its current median price of $415,845 underscores its appeal as a Johnson County suburb within the Kansas City metro area.
Shawnee – A Popular Suburban Choice
Shawnee offers strong schools, numerous parks, and a convenient location just southwest of Kansas City. Its growth has been steady with major jumps post-2020 as demand for suburban homes intensified nationwide. The city is known for Shawnee Mission Park, which attracts residents seeking outdoor recreation.
While price increases have slowed to under 2% in 2025, Shawnee remains a sought-after community due to its family-friendly environment, business access, and robust local economy.
17. Olathe – 101% Home Price Increase Since 2010
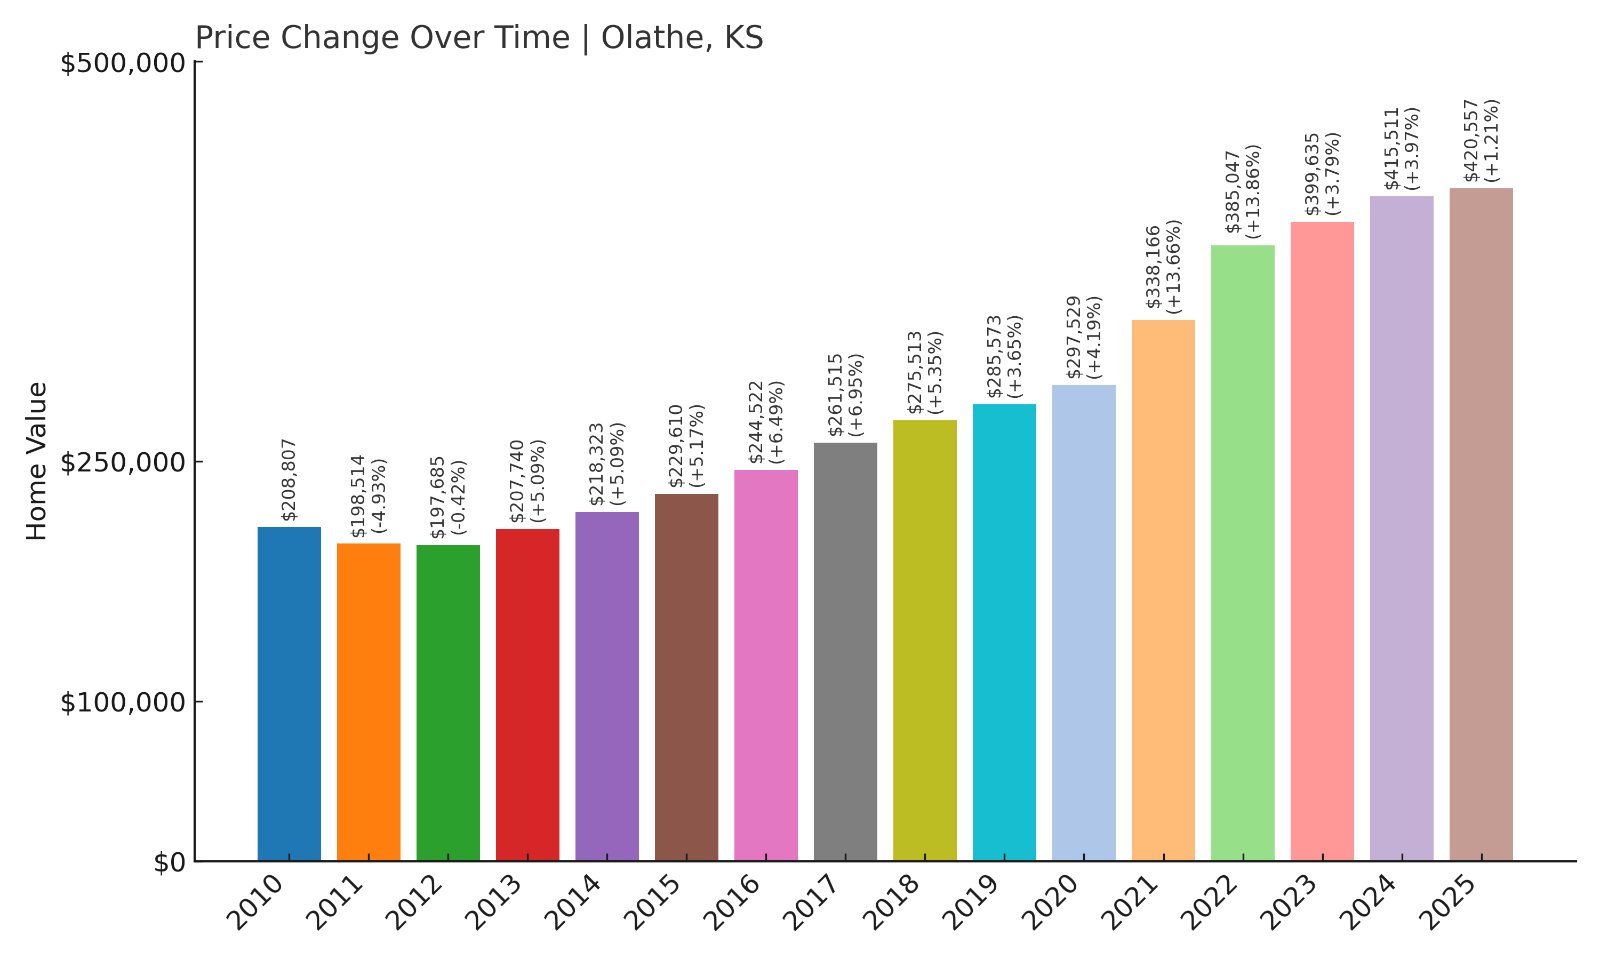
- 2010: $208,807
- 2011: $198,514 (-$10,294, -4.93% from previous year)
- 2012: $197,685 (-$828, -0.42% from previous year)
- 2013: $207,740 (+$10,055, +5.09% from previous year)
- 2014: $218,323 (+$10,583, +5.09% from previous year)
- 2015: $229,610 (+$11,287, +5.17% from previous year)
- 2016: $244,522 (+$14,912, +6.49% from previous year)
- 2017: $261,515 (+$16,993, +6.95% from previous year)
- 2018: $275,513 (+$13,998, +5.35% from previous year)
- 2019: $285,573 (+$10,060, +3.65% from previous year)
- 2020: $297,529 (+$11,957, +4.19% from previous year)
- 2021: $338,166 (+$40,637, +13.66% from previous year)
- 2022: $385,047 (+$46,881, +13.86% from previous year)
- 2023: $399,635 (+$14,588, +3.79% from previous year)
- 2024: $415,511 (+$15,876, +3.97% from previous year)
- 2025: $420,557 (+$5,046, +1.21% from previous year)
Olathe’s median home price has more than doubled since 2010, reaching $420,557 in 2025. Consistent year-on-year gains, punctuated by strong growth in 2021 and 2022, have secured its place among Kansas’s fastest-appreciating cities.
Olathe – Growth Fueled by Expansion
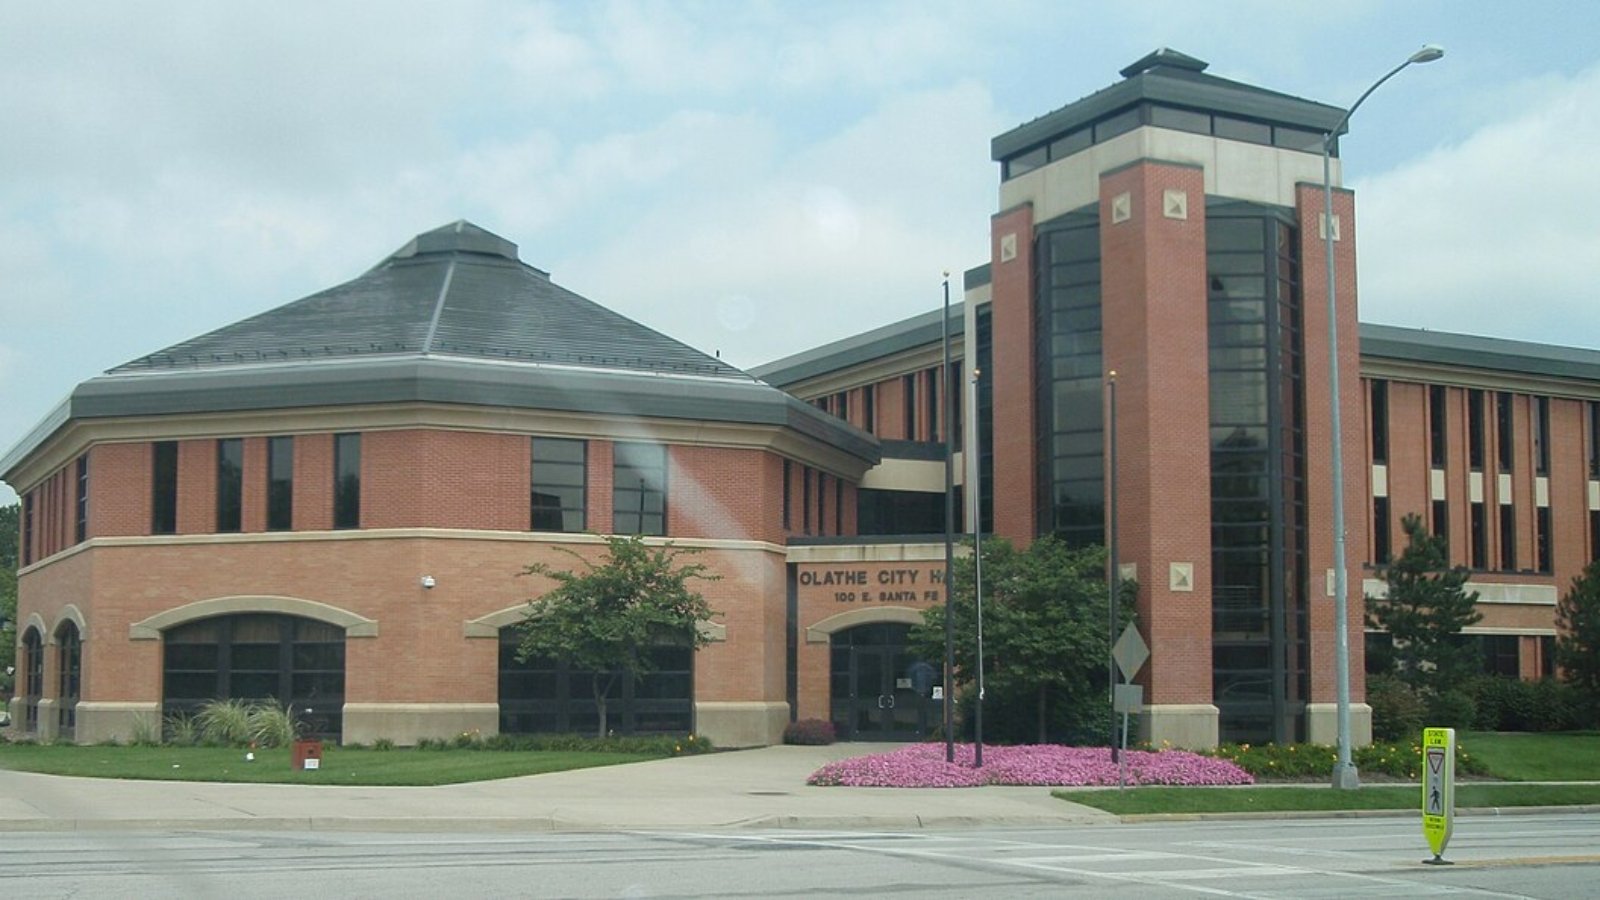
Olathe, the county seat of Johnson County, is among the fastest-growing cities in Kansas. Its population surge has driven demand for housing, alongside major employers like Garmin and a vibrant business park sector. This combination of job opportunities and suburban amenities has kept home values climbing.
Though price increases have slowed recently, the city’s schools, parks, and transportation connections continue to attract new residents. Its steady growth reflects a robust local economy and a resilient housing market.
16. De Soto – 117% Home Price Increase Since 2010
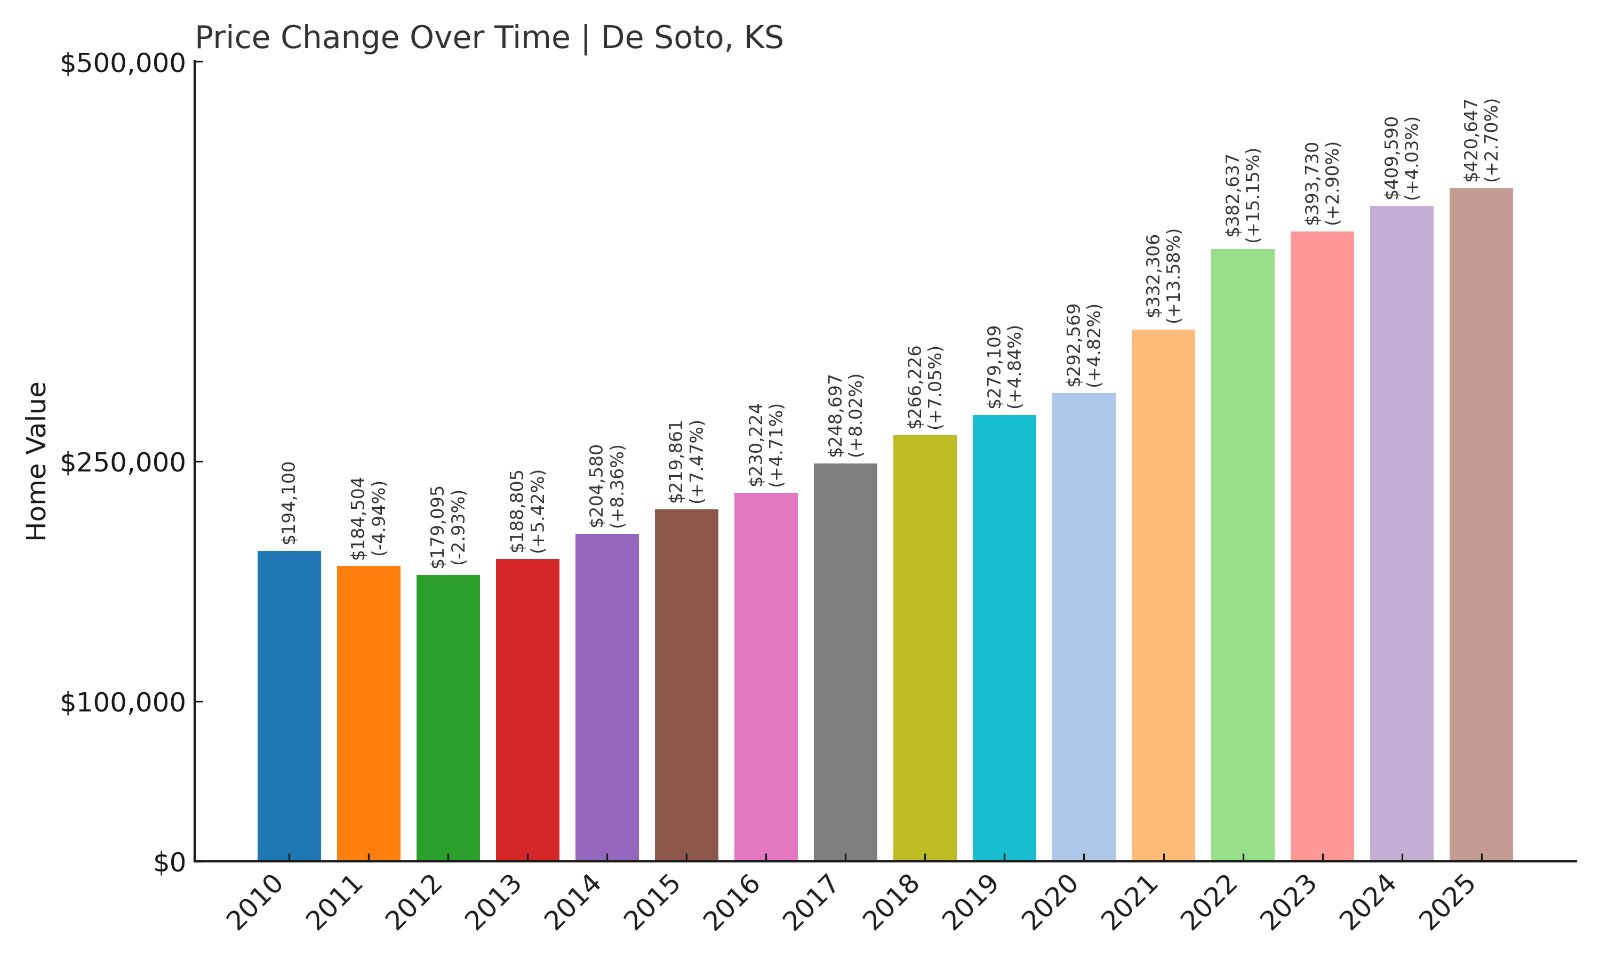
- 2010: $194,100
- 2011: $184,504 (-$9,596, -4.94% from previous year)
- 2012: $179,095 (-$5,409, -2.93% from previous year)
- 2013: $188,805 (+$9,710, +5.42% from previous year)
- 2014: $204,580 (+$15,775, +8.36% from previous year)
- 2015: $219,861 (+$15,281, +7.47% from previous year)
- 2016: $230,224 (+$10,364, +4.71% from previous year)
- 2017: $248,697 (+$18,473, +8.02% from previous year)
- 2018: $266,226 (+$17,529, +7.05% from previous year)
- 2019: $279,109 (+$12,883, +4.84% from previous year)
- 2020: $292,569 (+$13,459, +4.82% from previous year)
- 2021: $332,306 (+$39,737, +13.58% from previous year)
- 2022: $382,637 (+$50,332, +15.15% from previous year)
- 2023: $393,730 (+$11,093, +2.90% from previous year)
- 2024: $409,590 (+$15,860, +4.03% from previous year)
- 2025: $420,647 (+$11,057, +2.70% from previous year)
De Soto’s home prices have climbed by nearly 117% since 2010, with particularly strong growth during the pandemic years. Its 2025 median home price sits at $420,647, highlighting this Johnson County town’s rising profile within the Kansas City metro area.
De Soto – Expanding Industry and Housing Demand
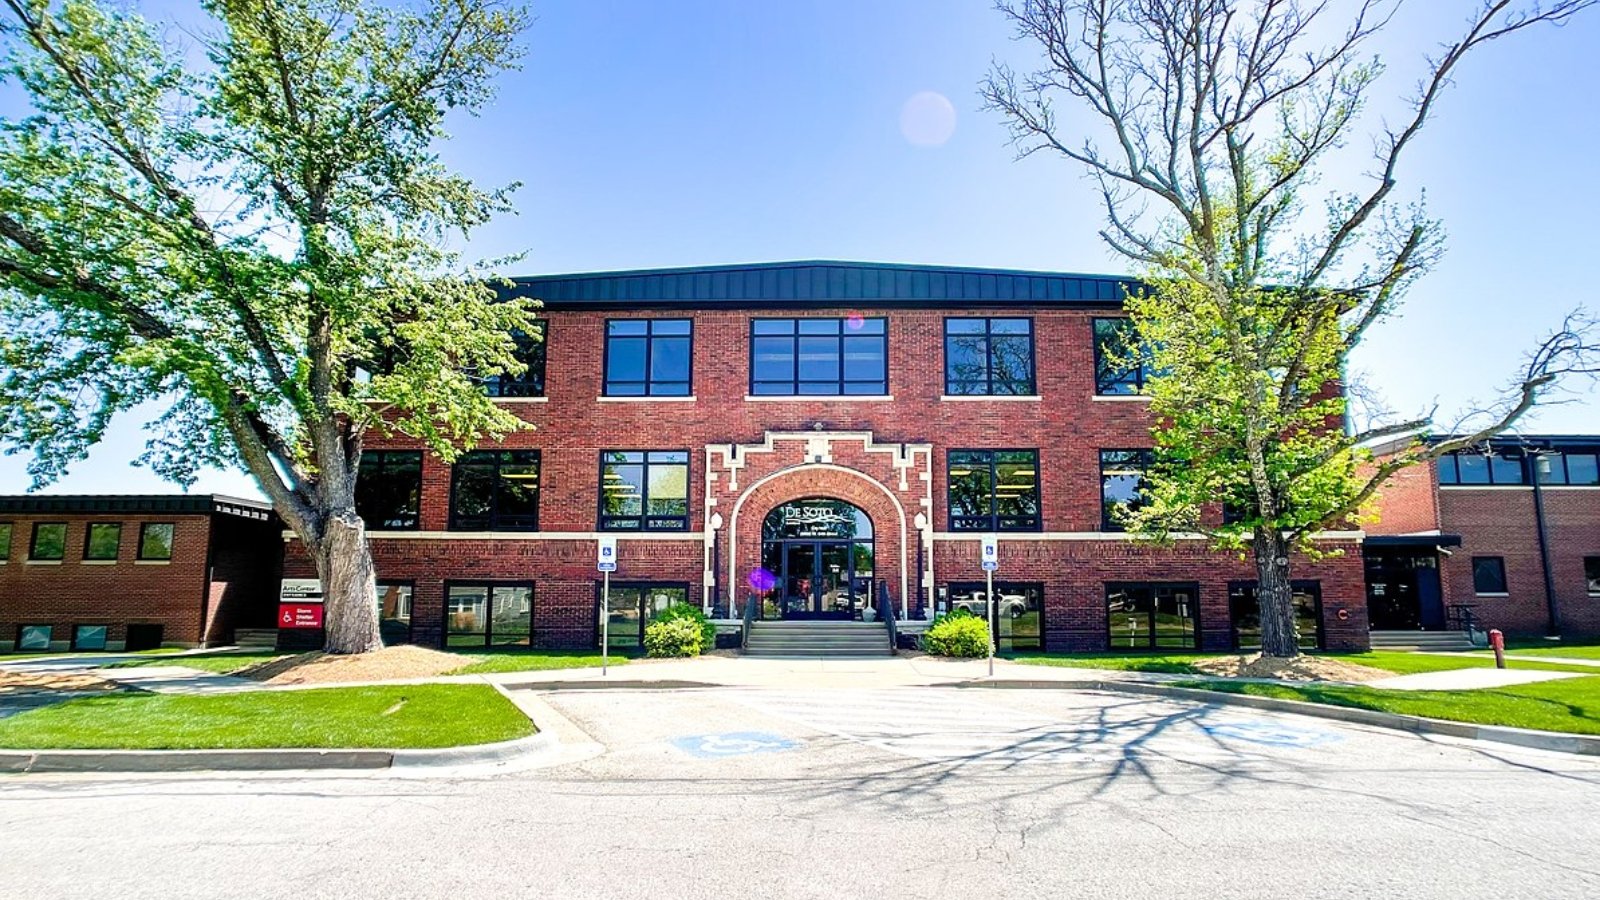
Located west of Lenexa, De Soto has seen major industrial investments, including Panasonic’s new battery plant, which is set to create thousands of jobs. This development has attracted more residents, raising demand for housing. De Soto combines a rural feel with quick access to big-city employment, making it appealing to families and professionals.
While annual growth rates have cooled since their peak in 2022, prices continue to rise steadily. De Soto’s strategic location along K-10 Highway and its expanding job base indicate that housing demand here is unlikely to slow down soon.
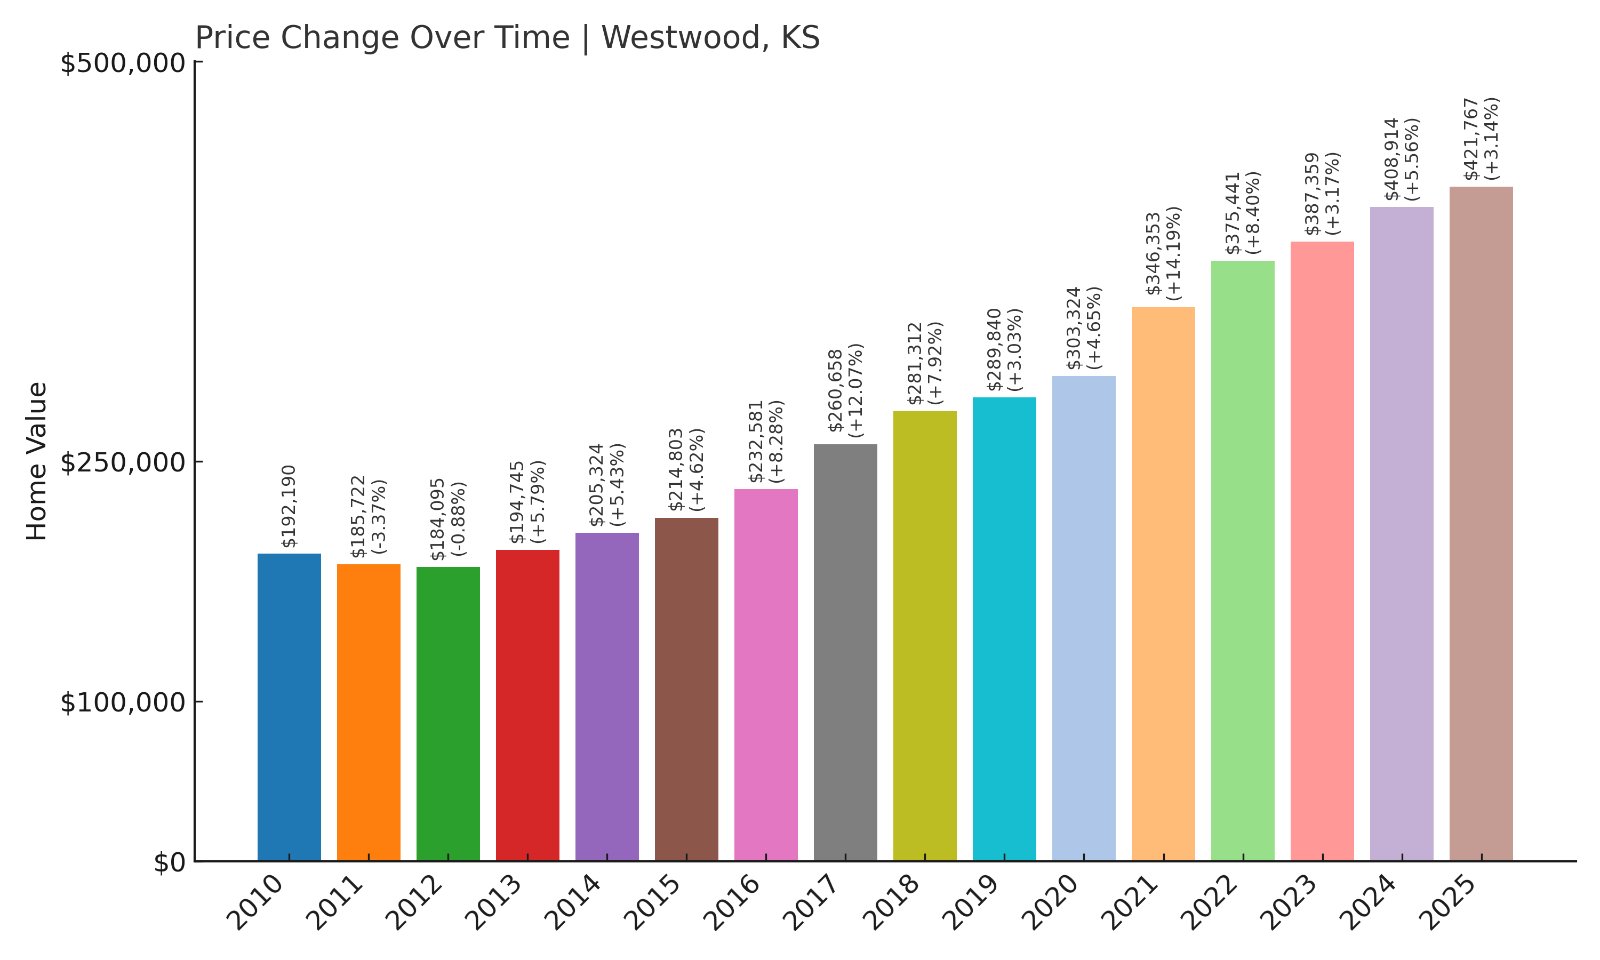
15. Westwood – 119% Home Price Increase Since 2010
🔥 Would you like to save this?
- 2010: $192,190
- 2011: $185,722 (-$6,468, -3.37% from previous year)
- 2012: $184,095 (-$1,626, -0.88% from previous year)
- 2013: $194,745 (+$10,650, +5.78% from previous year)
- 2014: $205,324 (+$10,578, +5.43% from previous year)
- 2015: $214,803 (+$9,480, +4.62% from previous year)
- 2016: $232,581 (+$17,778, +8.28% from previous year)
- 2017: $260,658 (+$28,077, +12.07% from previous year)
- 2018: $281,312 (+$20,654, +7.92% from previous year)
- 2019: $289,840 (+$8,528, +3.03% from previous year)
- 2020: $303,324 (+$13,483, +4.65% from previous year)
- 2021: $346,353 (+$43,030, +14.19% from previous year)
- 2022: $375,441 (+$29,088, +8.40% from previous year)
- 2023: $387,359 (+$11,918, +3.17% from previous year)
- 2024: $408,914 (+$21,555, +5.56% from previous year)
- 2025: $421,767 (+$12,853, +3.14% from previous year)
Westwood has seen home values rise by over 119% since 2010. The market has been buoyed by strong growth in 2021, followed by moderate yet steady increases in recent years, bringing the median price to $421,767 in 2025.
Westwood – Urban Accessibility Meets Neighborhood Charm
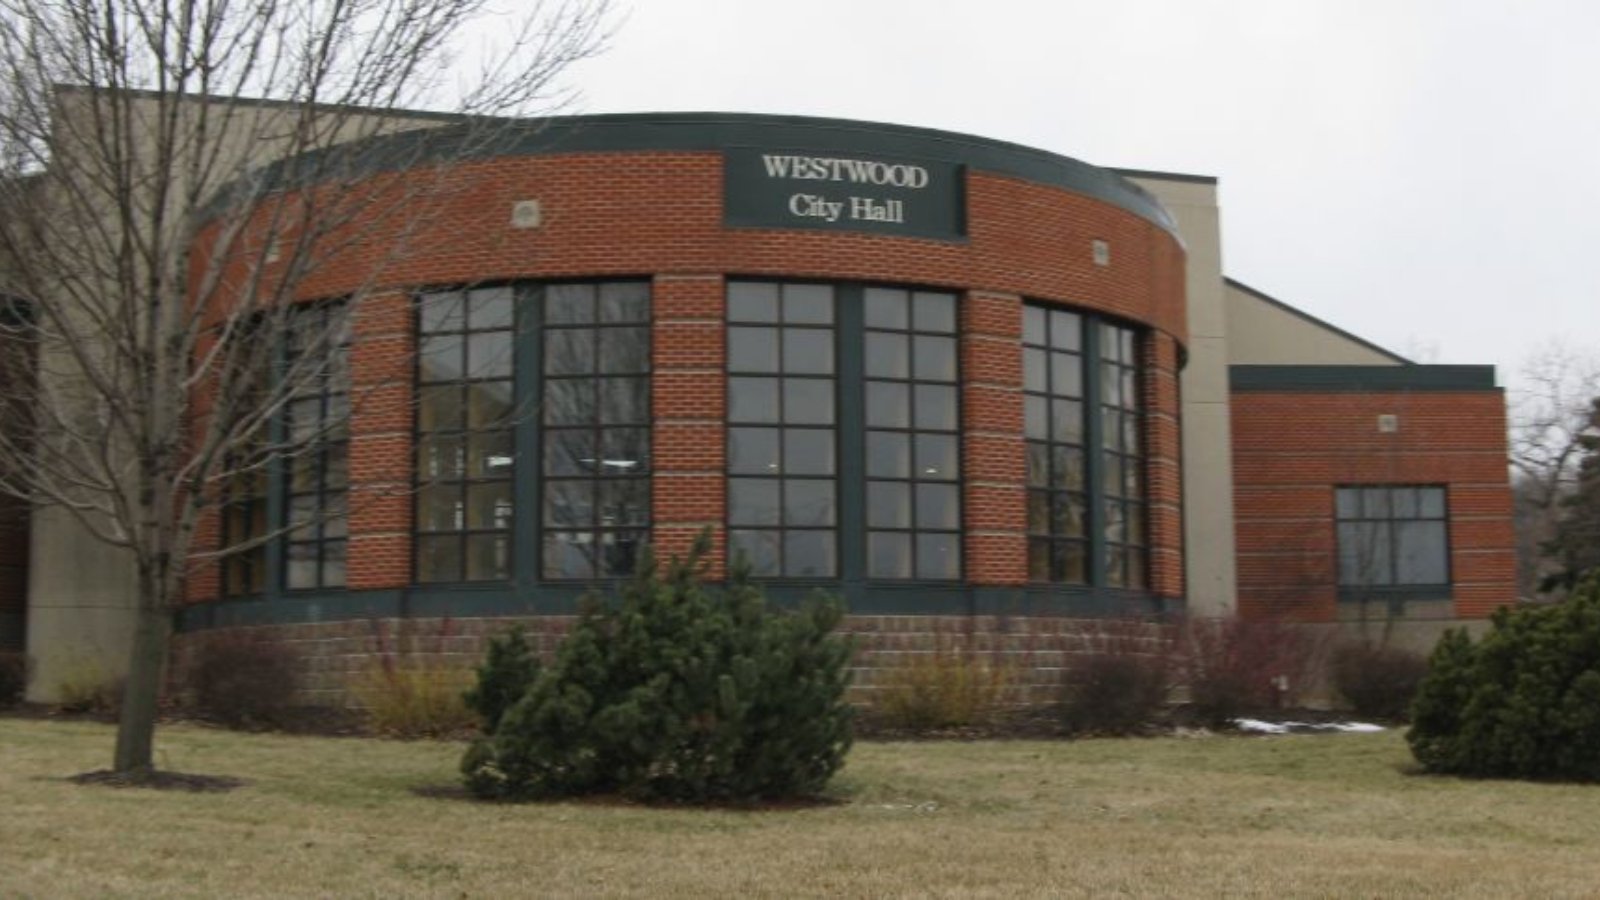
Located directly southwest of Kansas City, Westwood is known for its tree-lined streets and proximity to downtown. The area’s walkability and access to major hospitals and the University of Kansas Medical Center make it popular with professionals. Its limited land availability has also kept inventory tight, driving prices upward.
Residents appreciate its community feel despite urban proximity. Rising demand for older homes ripe for renovation has helped push values higher, and the recent consistent growth suggests ongoing interest in this small but highly connected neighborhood.
14. Spring Hill – 122% Home Price Increase Since 2010
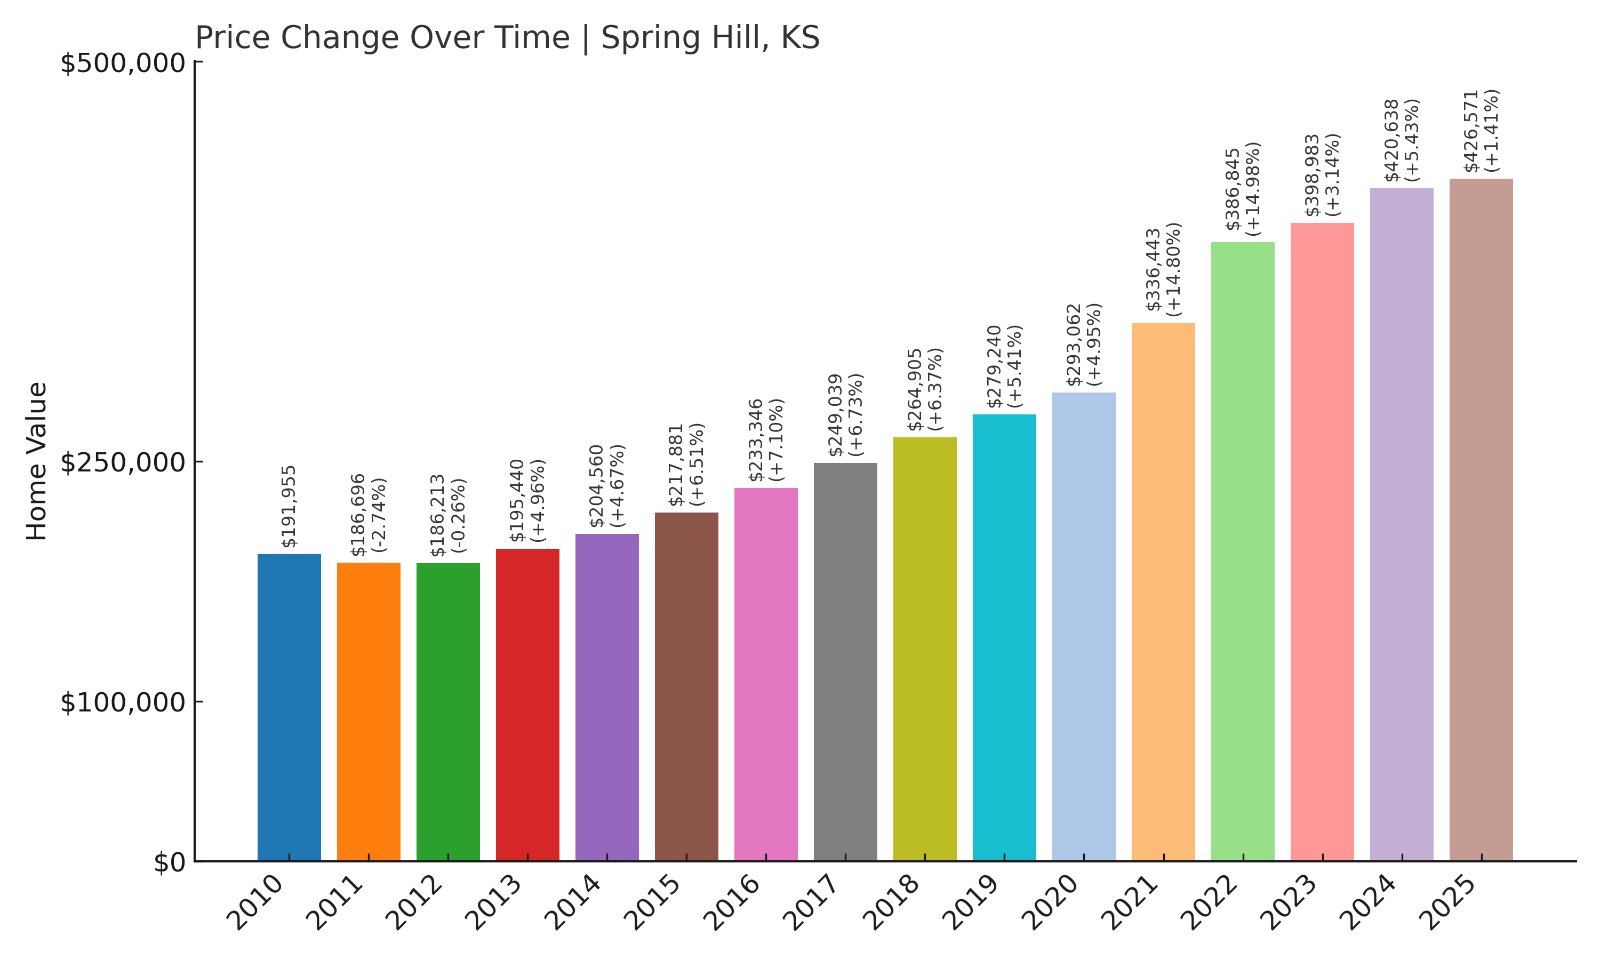
- 2010: $191,955
- 2011: $186,696 (-$5,260, -2.74% from previous year)
- 2012: $186,213 (-$482, -0.26% from previous year)
- 2013: $195,440 (+$9,226, +4.95% from previous year)
- 2014: $204,560 (+$9,121, +4.67% from previous year)
- 2015: $217,881 (+$13,320, +6.51% from previous year)
- 2016: $233,346 (+$15,465, +7.10% from previous year)
- 2017: $249,039 (+$15,693, +6.73% from previous year)
- 2018: $264,905 (+$15,866, +6.37% from previous year)
- 2019: $279,240 (+$14,335, +5.41% from previous year)
- 2020: $293,062 (+$13,822, +4.95% from previous year)
- 2021: $336,443 (+$43,381, +14.80% from previous year)
- 2022: $386,845 (+$50,402, +14.98% from previous year)
- 2023: $398,983 (+$12,138, +3.14% from previous year)
- 2024: $420,638 (+$21,654, +5.43% from previous year)
- 2025: $426,571 (+$5,934, +1.41% from previous year)
Spring Hill’s home prices have climbed by 122% since 2010, with sharp double-digit increases in 2021 and 2022 fueling its surge. The median price now stands at $426,571 in 2025, underscoring robust buyer interest.
Spring Hill – Fast-Growing Southern Suburb
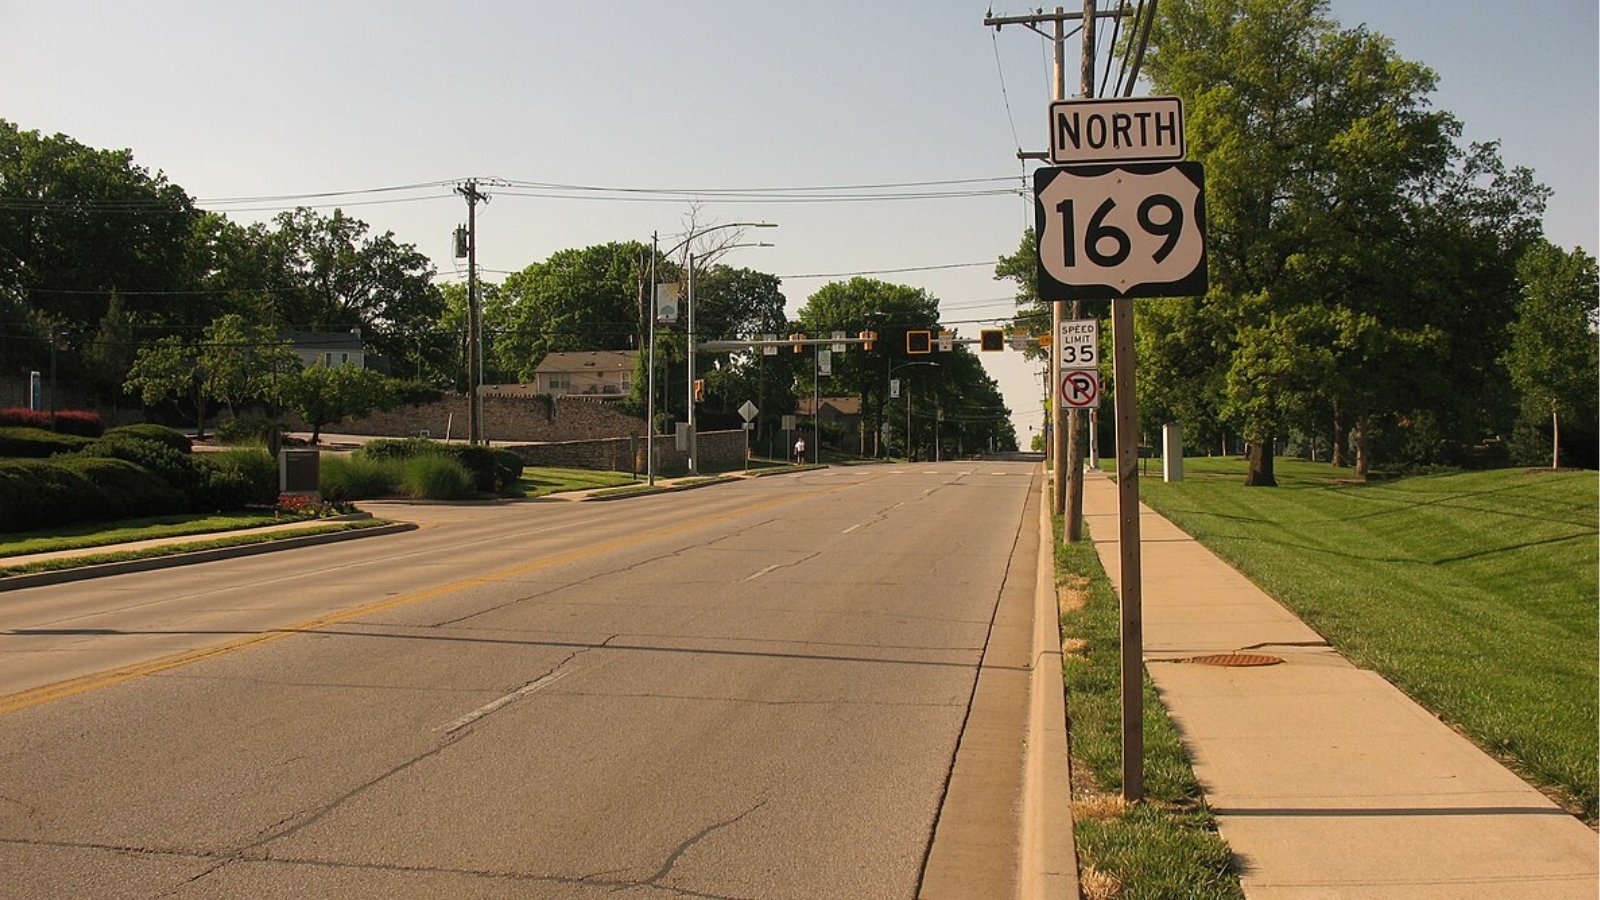
Located on the southern edge of the Kansas City metro, Spring Hill has attracted families looking for newer homes and expanding school districts. The town’s population has grown significantly over the past decade, fueling housing demand. Proximity to U.S. Route 169 makes commuting manageable for residents.
Its housing market’s biggest jumps coincided with regional demand spikes during the pandemic. While price growth has slowed recently, development continues, with new subdivisions enhancing the town’s appeal.
13. Basehor – 104% Home Price Increase Since 2010

- 2010: $211,472
- 2011: $207,645 (-$3,826, -1.81% from previous year)
- 2012: $207,850 (+$205, +0.10% from previous year)
- 2013: $211,063 (+$3,213, +1.55% from previous year)
- 2014: $217,140 (+$6,077, +2.88% from previous year)
- 2015: $228,660 (+$11,520, +5.31% from previous year)
- 2016: $239,152 (+$10,492, +4.59% from previous year)
- 2017: $254,950 (+$15,798, +6.61% from previous year)
- 2018: $272,881 (+$17,931, +7.03% from previous year)
- 2019: $284,749 (+$11,868, +4.35% from previous year)
- 2020: $305,000 (+$20,251, +7.11% from previous year)
- 2021: $348,299 (+$43,298, +14.20% from previous year)
- 2022: $401,524 (+$53,225, +15.28% from previous year)
- 2023: $409,064 (+$7,541, +1.88% from previous year)
- 2024: $421,369 (+$12,305, +3.01% from previous year)
- 2025: $431,853 (+$10,484, +2.49% from previous year)
Basehor has seen its home prices more than double since 2010, now reaching $431,853 in 2025. Growth accelerated from 2020 onward, with strong double-digit gains in 2021 and 2022 reflecting its expanding popularity.
Basehor – Growing With New Residential Developments
Situated northwest of Kansas City, Basehor is known for its family-friendly environment and excellent school district. Recent years have seen multiple residential developments, adding modern housing options and boosting the town’s appeal to commuters looking for quiet suburbs with good amenities.
While price growth has moderated to below 3% in 2025, demand remains strong, with Basehor continuing to attract buyers seeking newer homes at competitive prices within the metro region.
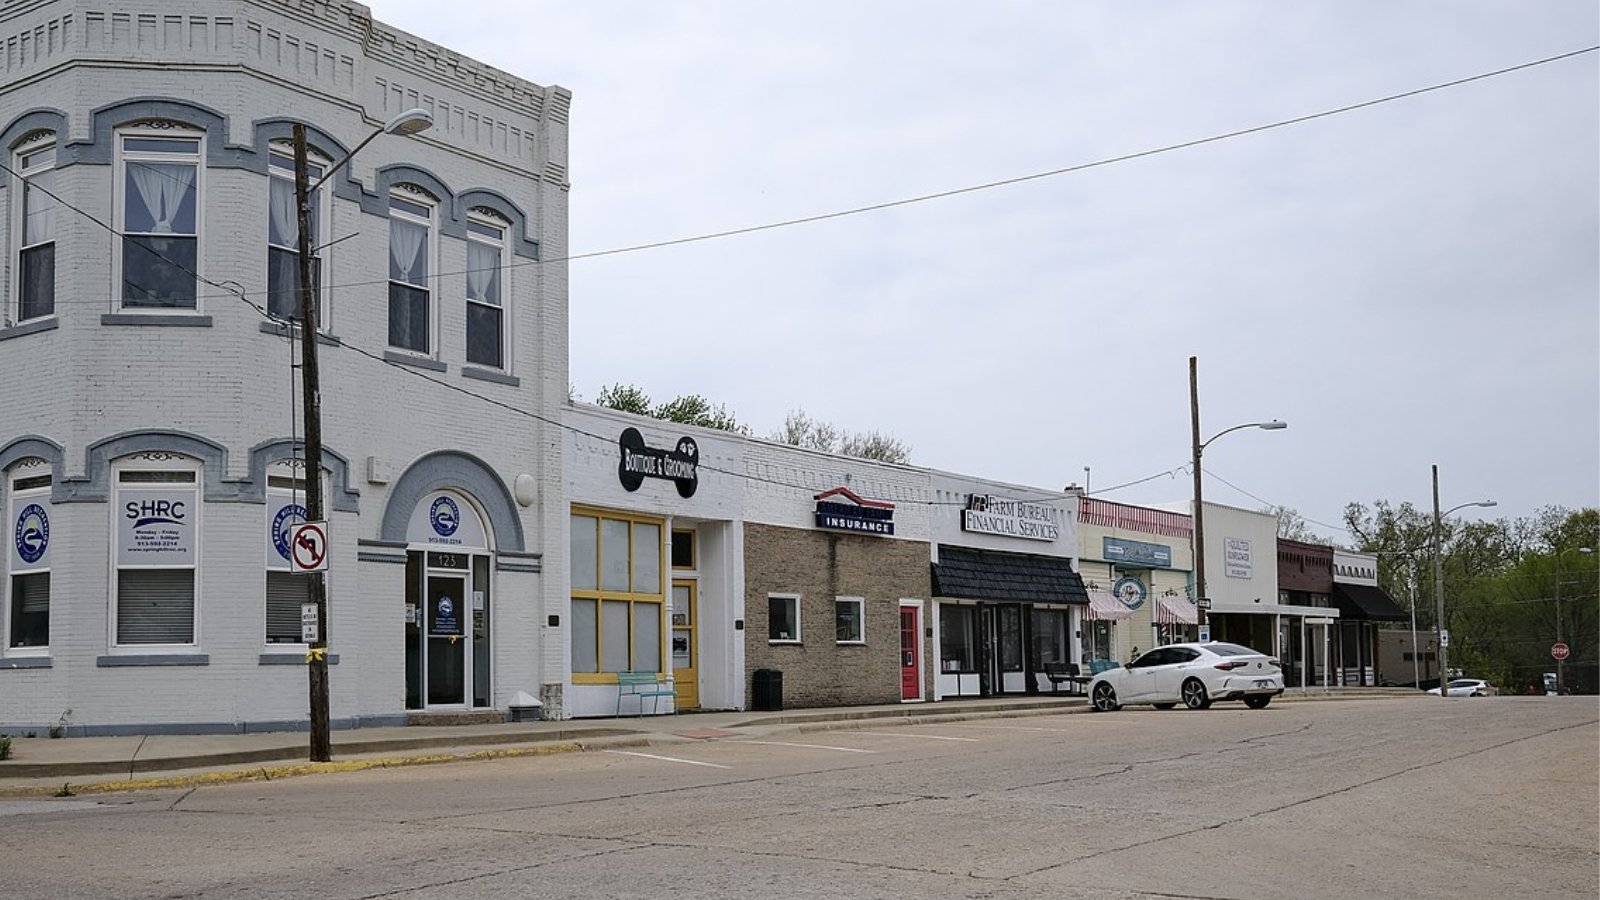
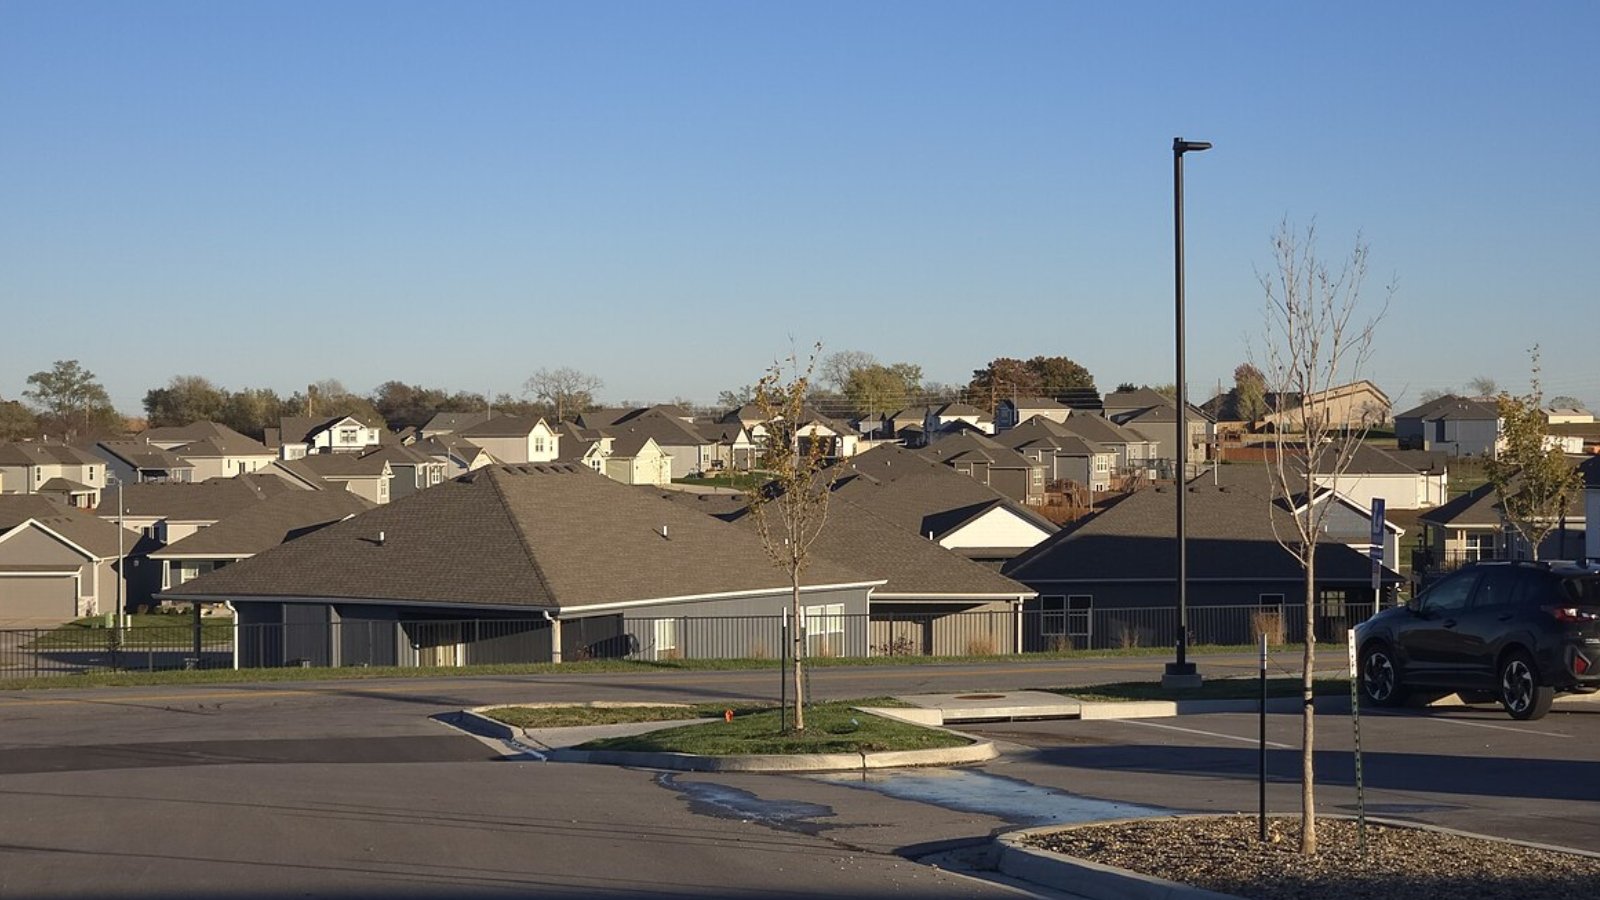
12. Linwood – 160% Home Price Increase Since 2010
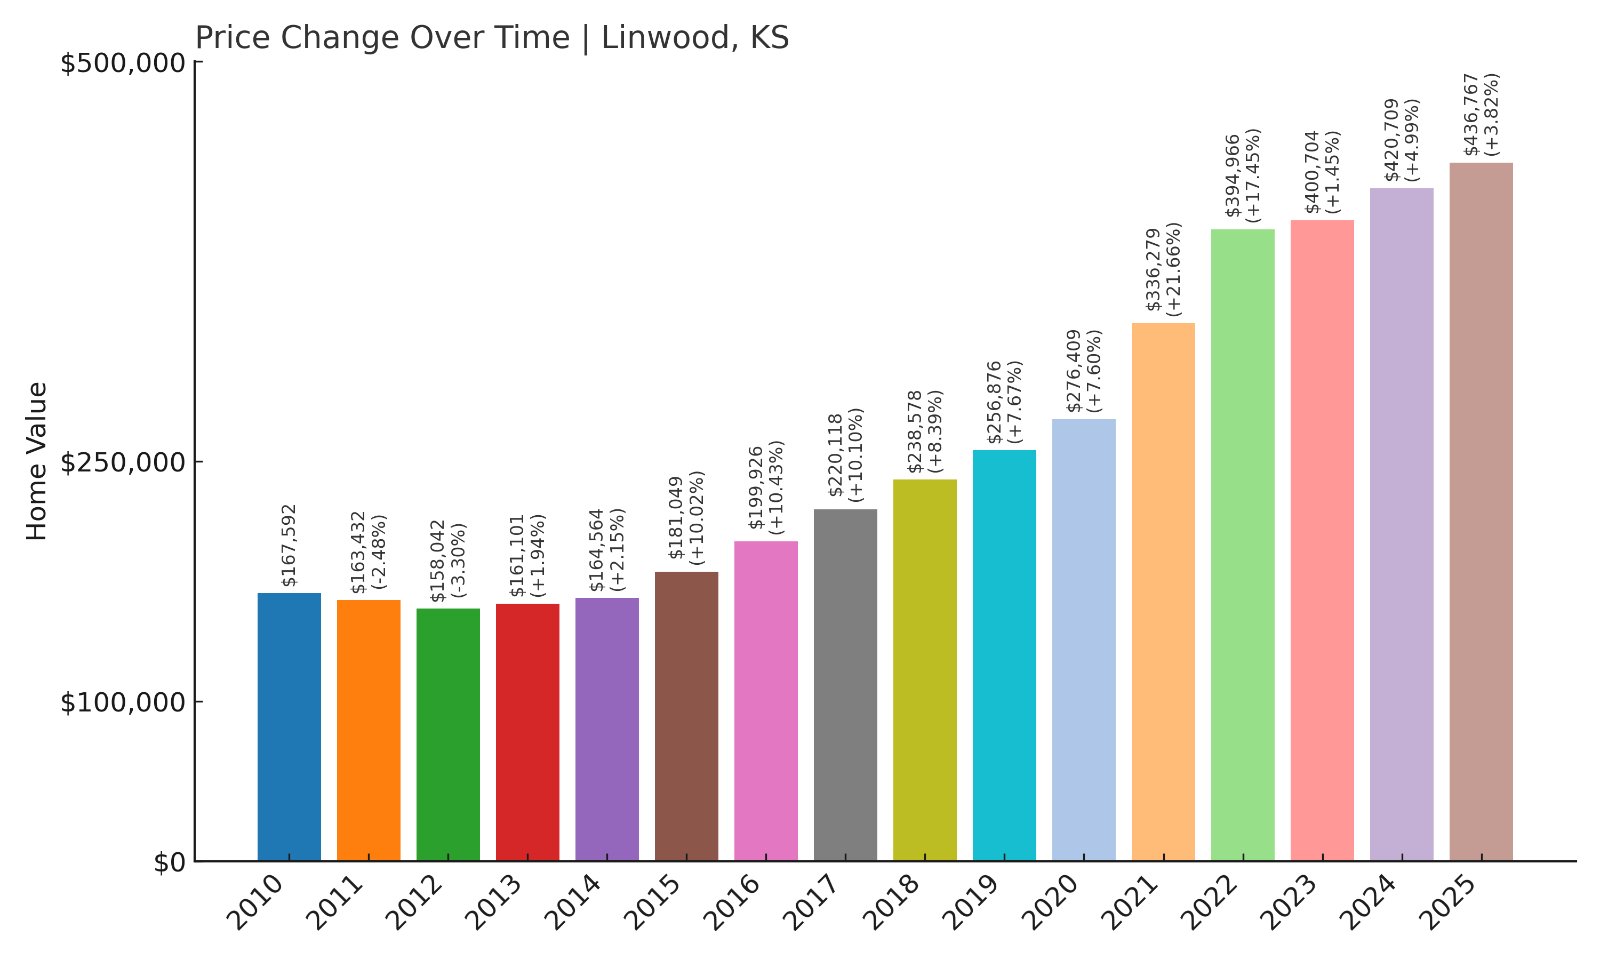
- 2010: $167,592
- 2011: $163,432 (-$4,160, -2.48% from previous year)
- 2012: $158,042 (-$5,390, -3.30% from previous year)
- 2013: $161,101 (+$3,058, +1.94% from previous year)
- 2014: $164,564 (+$3,463, +2.15% from previous year)
- 2015: $181,049 (+$16,485, +10.02% from previous year)
- 2016: $199,926 (+$18,877, +10.43% from previous year)
- 2017: $220,118 (+$20,192, +10.10% from previous year)
- 2018: $238,578 (+$18,460, +8.39% from previous year)
- 2019: $256,876 (+$18,298, +7.67% from previous year)
- 2020: $276,409 (+$19,532, +7.60% from previous year)
- 2021: $336,279 (+$59,870, +21.66% from previous year)
- 2022: $394,966 (+$58,687, +17.45% from previous year)
- 2023: $400,704 (+$5,738, +1.45% from previous year)
- 2024: $420,709 (+$20,005, +4.99% from previous year)
- 2025: $436,767 (+$16,057, +3.82% from previous year)
Linwood’s home prices have surged by 160% since 2010, with standout jumps in 2021 and 2022. The median price now stands at $436,767, reflecting growing demand in this rural community close to Lawrence and Kansas City.
Linwood – Rural Appeal With Urban Proximity
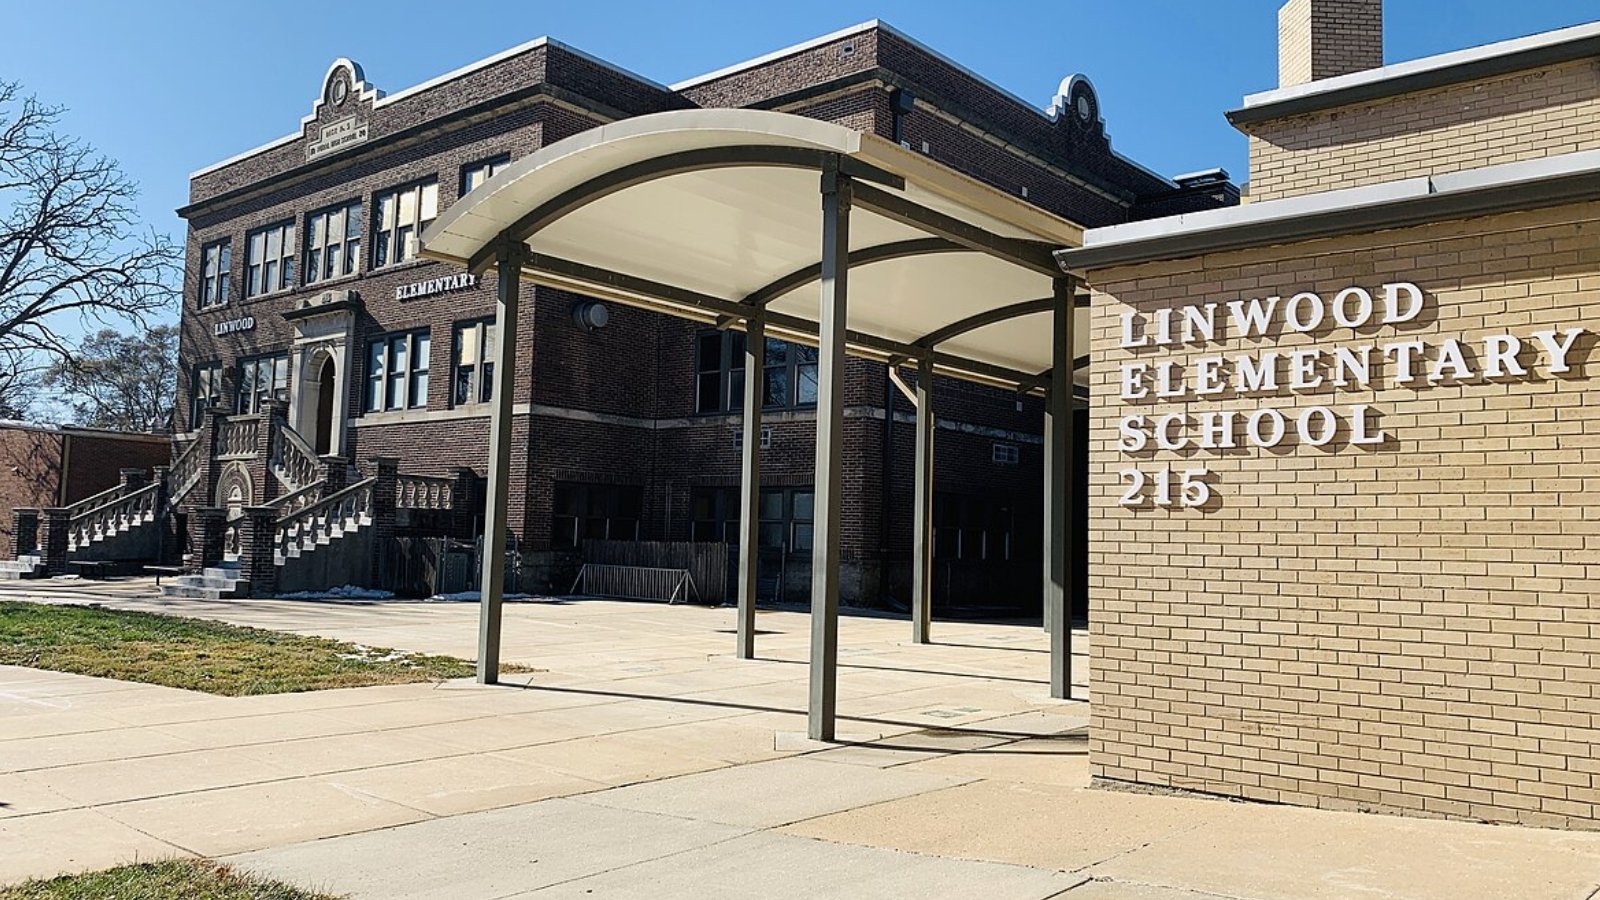
Located in Leavenworth County, Linwood offers a quiet lifestyle while still being accessible to both Lawrence and the Kansas City metro. Its appeal lies in larger property sizes, a small-town community feel, and new builds that have attracted buyers seeking affordability and space.
Despite slower growth in recent years compared to the 2021 peak, Linwood continues to benefit from buyers looking beyond city suburbs for lower-priced housing with convenient commuting options.
11. Lenexa – 98% Home Price Increase Since 2010
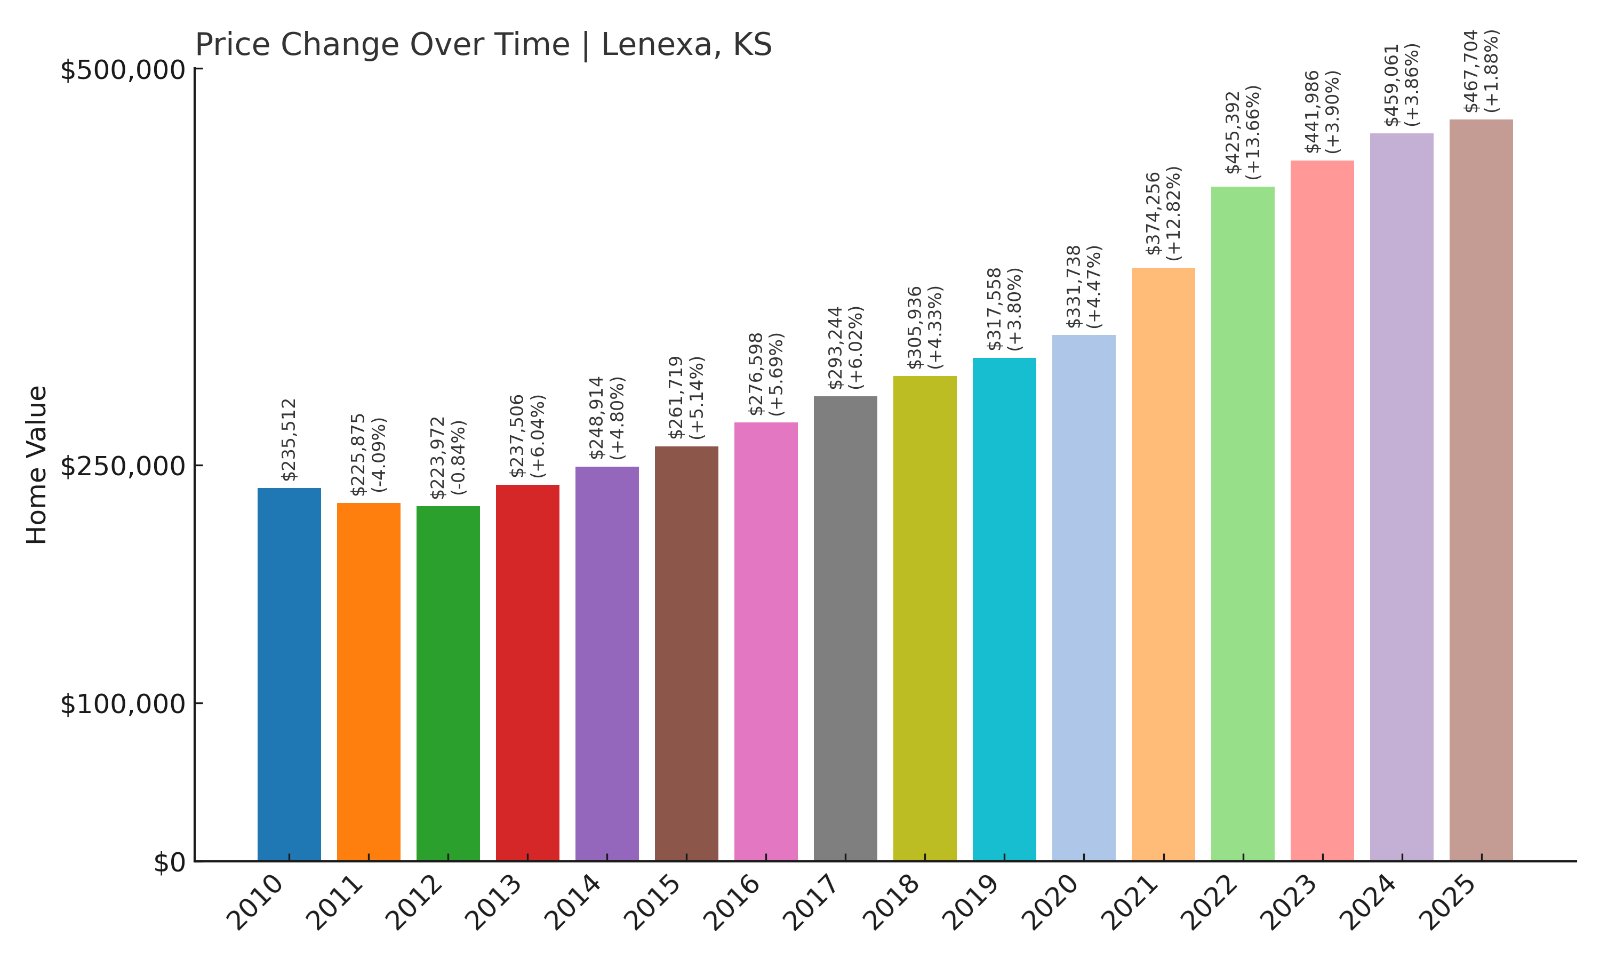
- 2010: $235,512
- 2011: $225,875 (-$9,638, -4.09% from previous year)
- 2012: $223,972 (-$1,903, -0.84% from previous year)
- 2013: $237,506 (+$13,534, +6.04% from previous year)
- 2014: $248,914 (+$11,409, +4.80% from previous year)
- 2015: $261,719 (+$12,804, +5.14% from previous year)
- 2016: $276,598 (+$14,880, +5.69% from previous year)
- 2017: $293,244 (+$16,646, +6.02% from previous year)
- 2018: $305,936 (+$12,692, +4.33% from previous year)
- 2019: $317,558 (+$11,622, +3.80% from previous year)
- 2020: $331,738 (+$14,180, +4.47% from previous year)
- 2021: $374,256 (+$42,518, +12.82% from previous year)
- 2022: $425,392 (+$51,136, +13.66% from previous year)
- 2023: $441,986 (+$16,594, +3.90% from previous year)
- 2024: $459,061 (+$17,075, +3.86% from previous year)
- 2025: $467,704 (+$8,643, +1.88% from previous year)
Lenexa’s home prices have climbed by nearly 98% since 2010. The city saw especially strong appreciation in 2021 and 2022, with the median price reaching $467,704 in 2025.
Lenexa – Master-Planned Growth and Strong Economy
Located in Johnson County, Lenexa has rapidly developed into a major suburb of Kansas City. The city is known for its modern master-planned communities, corporate headquarters, and the Lenexa City Center development, which has attracted businesses and residents alike.
Consistent demand for housing has pushed prices steadily upward, supported by job growth and high-quality amenities. Though price increases have slowed to under 2% in 2025, the city’s strategic development and strong economy continue to attract buyers looking for long-term value.
10. Overland Park – 103% Home Price Increase Since 2010
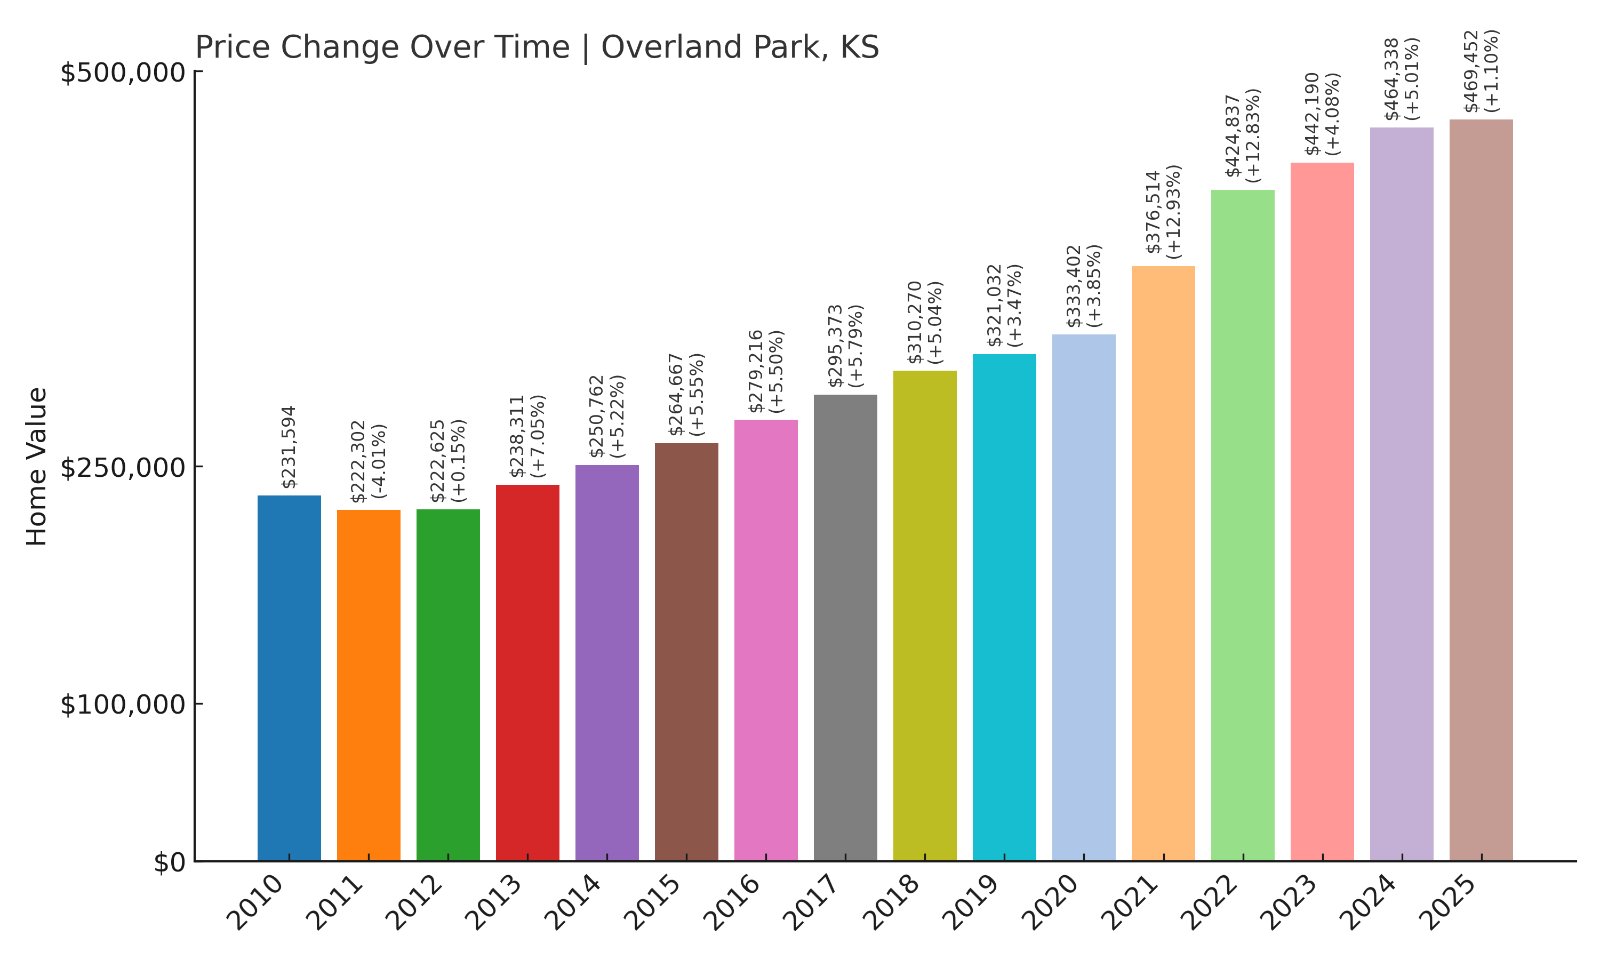
- 2010: $231,594
- 2011: $222,302 (-$9,292, -4.01% from previous year)
- 2012: $222,625 (+$323, +0.15% from previous year)
- 2013: $238,311 (+$15,686, +7.05% from previous year)
- 2014: $250,762 (+$12,451, +5.22% from previous year)
- 2015: $264,667 (+$13,906, +5.55% from previous year)
- 2016: $279,216 (+$14,549, +5.50% from previous year)
- 2017: $295,373 (+$16,157, +5.79% from previous year)
- 2018: $310,270 (+$14,897, +5.04% from previous year)
- 2019: $321,032 (+$10,763, +3.47% from previous year)
- 2020: $333,402 (+$12,370, +3.85% from previous year)
- 2021: $376,514 (+$43,112, +12.93% from previous year)
- 2022: $424,837 (+$48,323, +12.83% from previous year)
- 2023: $442,190 (+$17,353, +4.08% from previous year)
- 2024: $464,338 (+$22,148, +5.01% from previous year)
- 2025: $469,452 (+$5,114, +1.10% from previous year)
Overland Park’s home prices have more than doubled since 2010, with especially strong gains in 2021 and 2022. The median price now sits at $469,452 in 2025, reflecting continued demand for this major Kansas City suburb.
Overland Park – Kansas City Metro’s Largest Suburb
Overland Park is the second most populous city in Kansas and a major hub within Johnson County. Its top-rated schools, parks, and business centers make it one of the most desirable places to live in the state. The city’s consistent growth has fueled housing demand and kept prices rising steadily.
Major employers, including Sprint’s former campus and healthcare facilities, draw professionals from across the region. While price growth slowed in 2025, Overland Park’s strong economic base ensures long-term housing market stability.
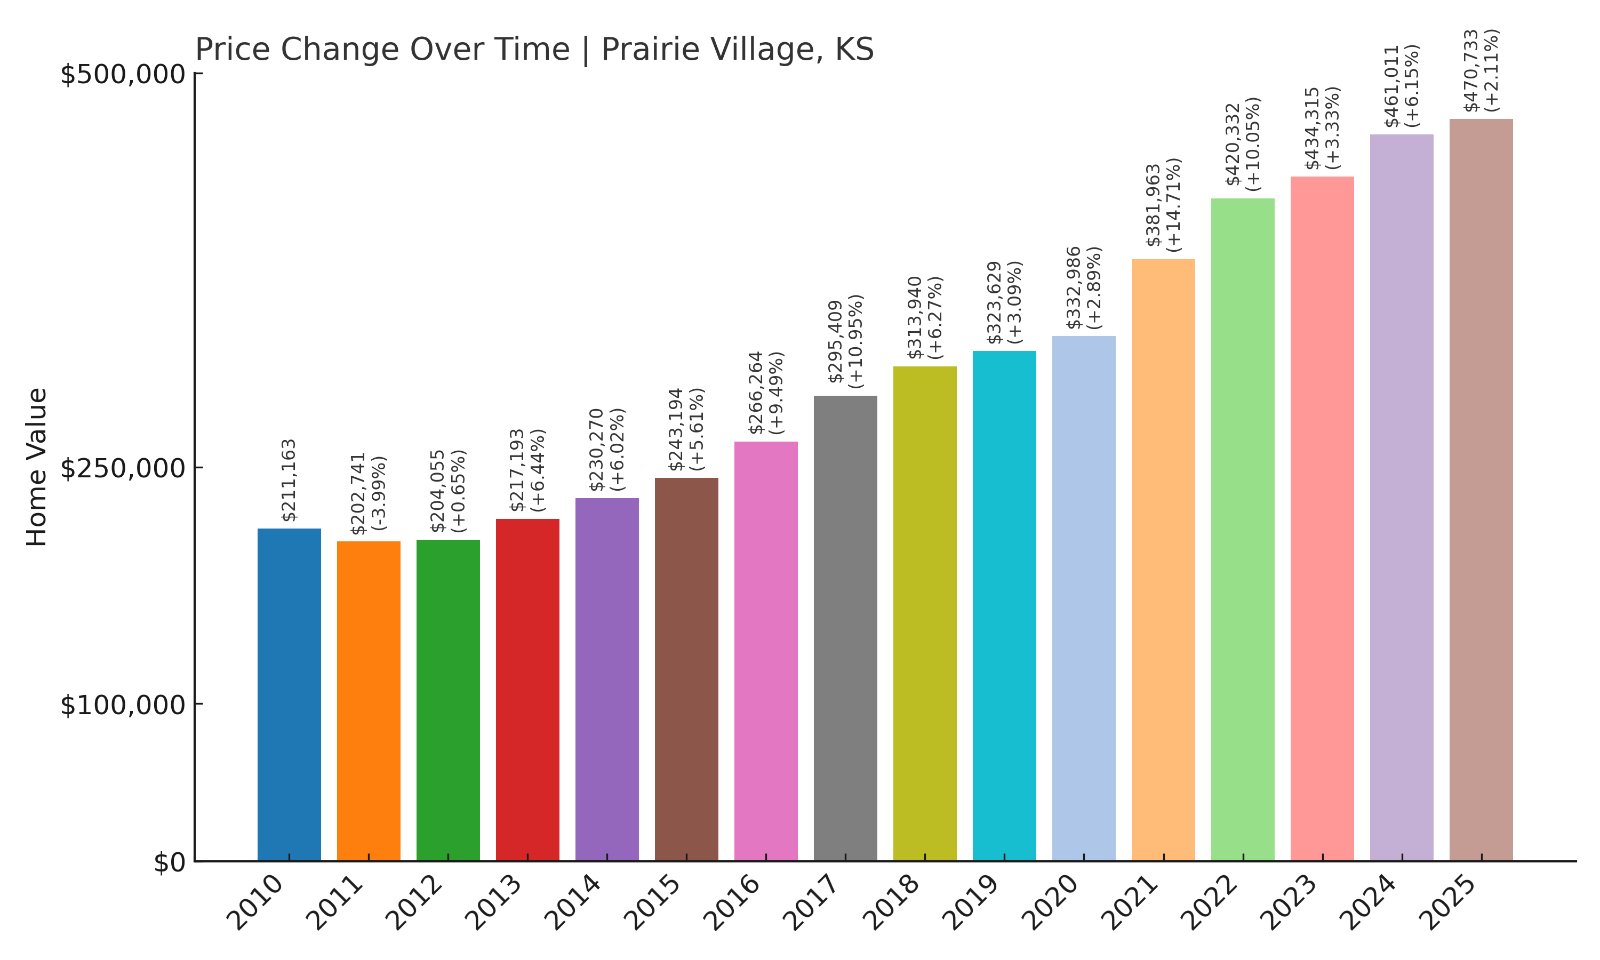
9. Prairie Village – 123% Home Price Increase Since 2010
🔥 Would you like to save this?
- 2010: $211,163
- 2011: $202,741 (-$8,422, -3.99% from previous year)
- 2012: $204,055 (+$1,314, +0.65% from previous year)
- 2013: $217,193 (+$13,138, +6.44% from previous year)
- 2014: $230,270 (+$13,077, +6.02% from previous year)
- 2015: $243,194 (+$12,924, +5.61% from previous year)
- 2016: $266,264 (+$23,069, +9.49% from previous year)
- 2017: $295,409 (+$29,145, +10.95% from previous year)
- 2018: $313,940 (+$18,532, +6.27% from previous year)
- 2019: $323,629 (+$9,689, +3.09% from previous year)
- 2020: $332,986 (+$9,357, +2.89% from previous year)
- 2021: $381,963 (+$48,977, +14.71% from previous year)
- 2022: $420,332 (+$38,369, +10.05% from previous year)
- 2023: $434,315 (+$13,983, +3.33% from previous year)
- 2024: $461,011 (+$26,696, +6.15% from previous year)
- 2025: $470,733 (+$9,722, +2.11% from previous year)
Prairie Village has seen its home prices increase by 123% since 2010. With strong double-digit growth in 2021 and 2022, the median price now stands at $470,733 in 2025.
Prairie Village – Classic Neighborhood With Modern Appeal
Prairie Village is an established suburb known for its mid-century homes, tree-lined streets, and proximity to downtown Kansas City. Residents value its walkable shopping centers and high-performing schools. Recent years have brought renovations and teardowns replaced with new builds, lifting overall home values.
Though price growth has slowed since its peak, the town remains attractive to professionals and families looking for historic character combined with modern amenities and easy urban access.
8. Eastborough – 83% Home Price Increase Since 2010
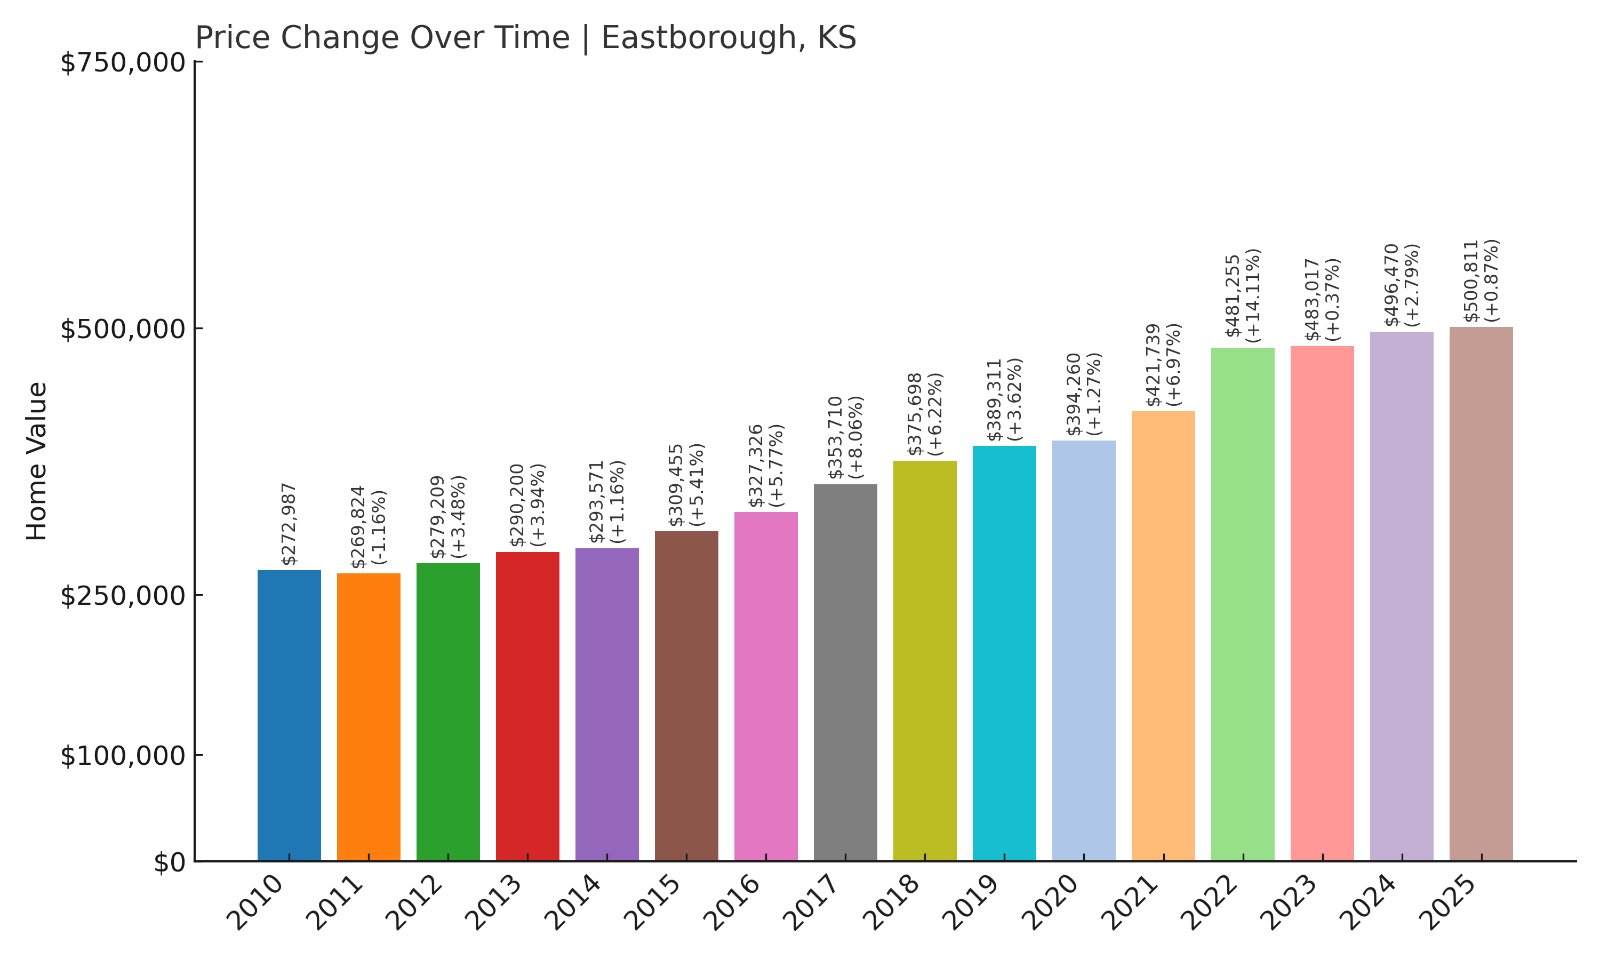
- 2010: $272,987
- 2011: $269,824 (-$3,164, -1.16% from previous year)
- 2012: $279,209 (+$9,385, +3.48% from previous year)
- 2013: $290,200 (+$10,991, +3.94% from previous year)
- 2014: $293,571 (+$3,371, +1.16% from previous year)
- 2015: $309,455 (+$15,884, +5.41% from previous year)
- 2016: $327,326 (+$17,871, +5.77% from previous year)
- 2017: $353,710 (+$26,384, +8.06% from previous year)
- 2018: $375,698 (+$21,988, +6.22% from previous year)
- 2019: $389,311 (+$13,613, +3.62% from previous year)
- 2020: $394,260 (+$4,949, +1.27% from previous year)
- 2021: $421,739 (+$27,479, +6.97% from previous year)
- 2022: $481,255 (+$59,516, +14.11% from previous year)
- 2023: $483,017 (+$1,762, +0.37% from previous year)
- 2024: $496,470 (+$13,453, +2.79% from previous year)
- 2025: $500,811 (+$4,341, +0.87% from previous year)
Eastborough has seen an 83% rise in home prices since 2010, reaching $500,811 in 2025. Growth peaked in 2022, with increases moderating in recent years.
Eastborough – Wichita’s Prestigious Enclave
Eastborough is a small city surrounded by Wichita, known for its tree-lined avenues and historic homes. Residents value the quiet, upscale atmosphere, unique city governance, and central location within the metro area. This exclusivity drives its high home values relative to surrounding neighborhoods.
Although recent growth has slowed, Eastborough remains one of the Wichita area’s most desirable addresses, with its distinctive architecture and private feel supporting long-term market stability.
7. Fairway – 102% Home Price Increase Since 2010
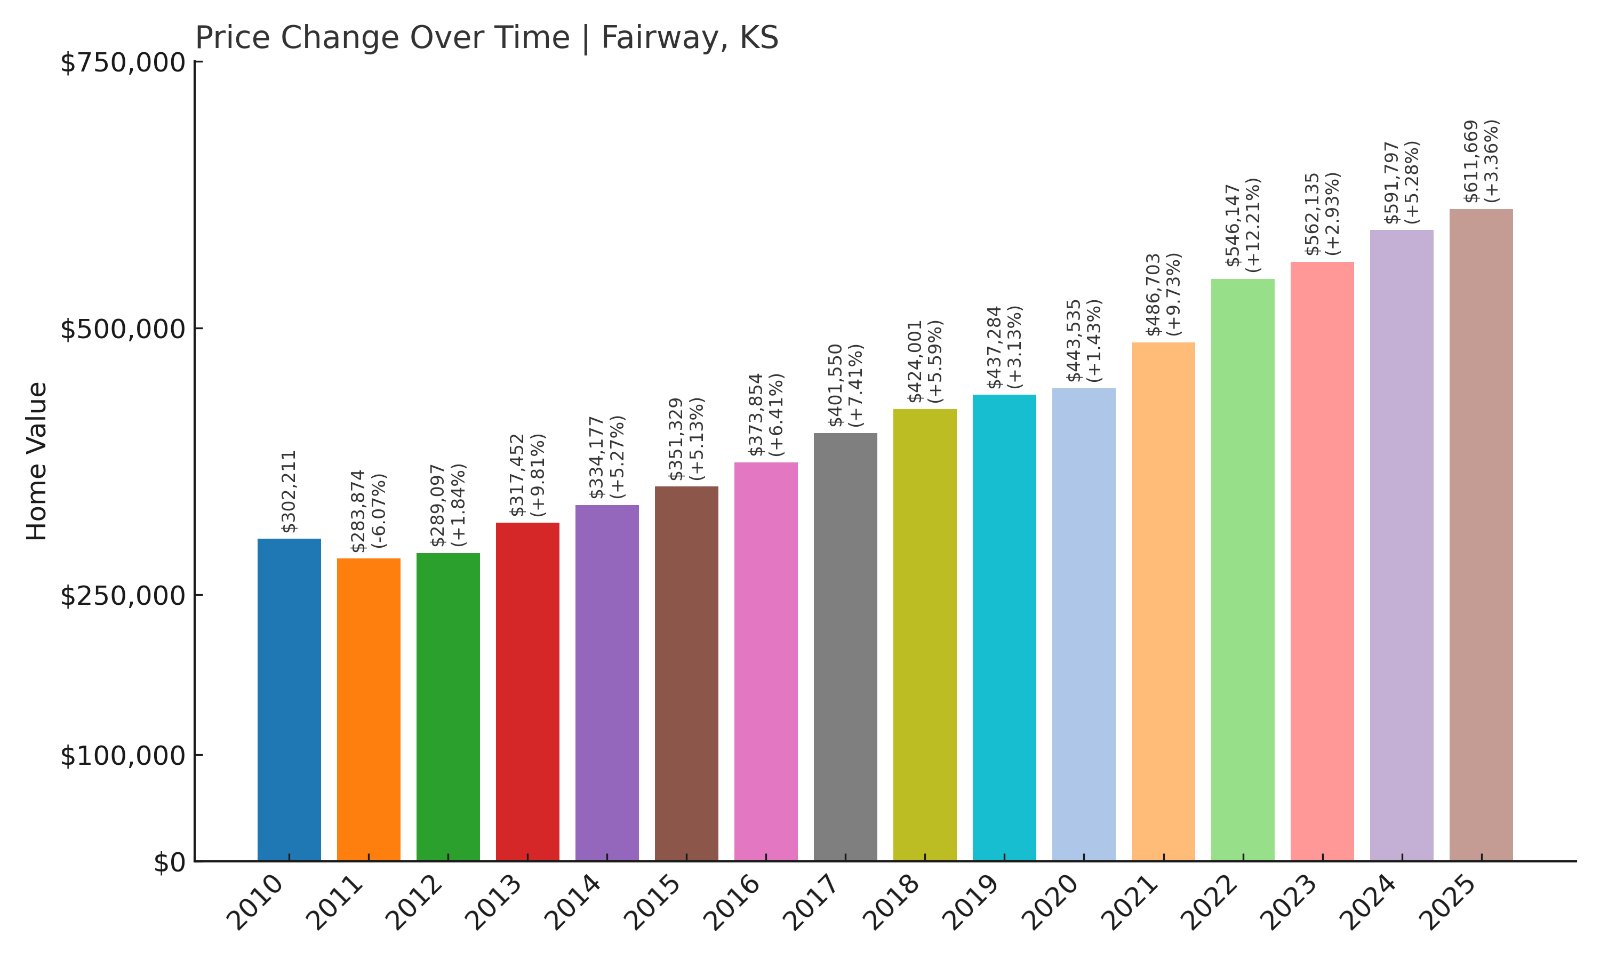
- 2010: $302,211
- 2011: $283,874 (-$18,336, -6.07% from previous year)
- 2012: $289,097 (+$5,222, +1.84% from previous year)
- 2013: $317,452 (+$28,355, +9.81% from previous year)
- 2014: $334,177 (+$16,725, +5.27% from previous year)
- 2015: $351,329 (+$17,152, +5.13% from previous year)
- 2016: $373,854 (+$22,525, +6.41% from previous year)
- 2017: $401,550 (+$27,696, +7.41% from previous year)
- 2018: $424,001 (+$22,451, +5.59% from previous year)
- 2019: $437,284 (+$13,283, +3.13% from previous year)
- 2020: $443,535 (+$6,251, +1.43% from previous year)
- 2021: $486,703 (+$43,169, +9.73% from previous year)
- 2022: $546,147 (+$59,444, +12.21% from previous year)
- 2023: $562,135 (+$15,988, +2.93% from previous year)
- 2024: $591,797 (+$29,662, +5.28% from previous year)
- 2025: $611,669 (+$19,873, +3.36% from previous year)
Fairway has experienced a 102% increase in home prices since 2010, with prices reaching $611,669 in 2025. Growth was particularly strong in 2022, followed by steady gains in subsequent years.
Fairway – The City of Trees’ Enduring Appeal

Fairway, often called “The City of Trees,” is known for its lush canopy and peaceful residential streets. Located in Johnson County, it offers quick access to downtown Kansas City while maintaining a quiet suburban atmosphere. Its older homes, often beautifully renovated, continue to attract buyers seeking character and charm.
The market here remains competitive due to limited inventory and high demand. Its proximity to the Kansas City Country Club and Shawnee Mission East High School further enhances Fairway’s reputation as a prime destination for families and professionals alike.
6. Westwood Hills – 97% Home Price Increase Since 2010
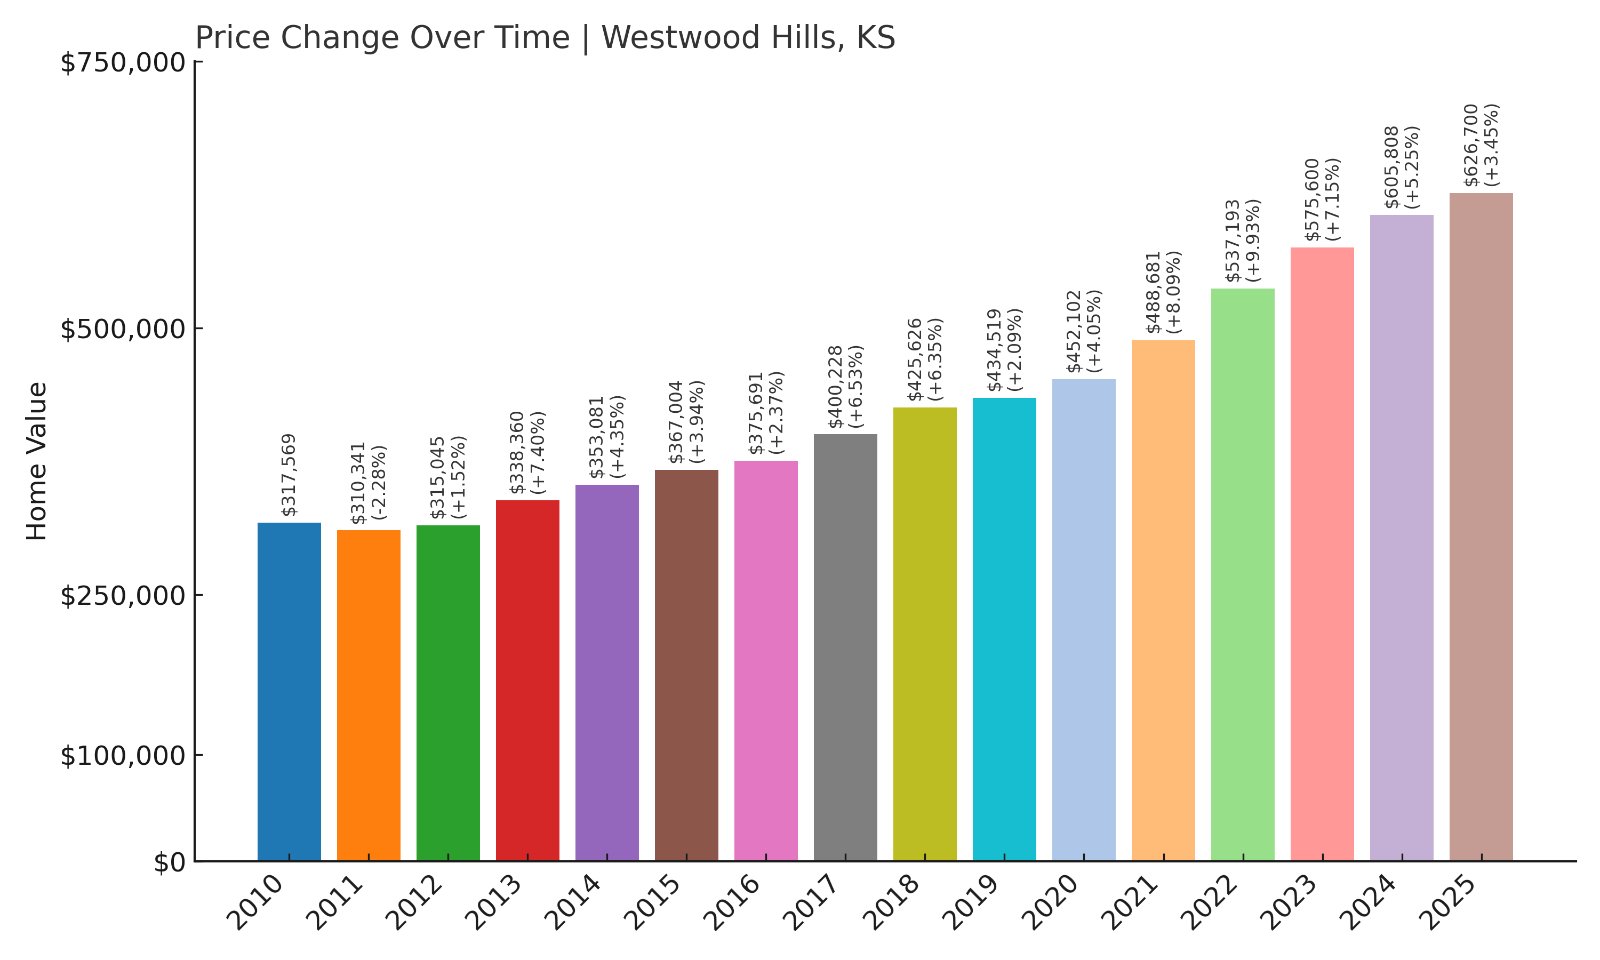
- 2010: $317,569
- 2011: $310,341 (-$7,228, -2.28% from previous year)
- 2012: $315,045 (+$4,704, +1.52% from previous year)
- 2013: $338,360 (+$23,315, +7.40% from previous year)
- 2014: $353,081 (+$14,721, +4.35% from previous year)
- 2015: $367,004 (+$13,924, +3.94% from previous year)
- 2016: $375,691 (+$8,687, +2.37% from previous year)
- 2017: $400,228 (+$24,537, +6.53% from previous year)
- 2018: $425,626 (+$25,398, +6.35% from previous year)
- 2019: $434,519 (+$8,893, +2.09% from previous year)
- 2020: $452,102 (+$17,582, +4.05% from previous year)
- 2021: $488,681 (+$36,579, +8.09% from previous year)
- 2022: $537,193 (+$48,512, +9.93% from previous year)
- 2023: $575,600 (+$38,407, +7.15% from previous year)
- 2024: $605,808 (+$30,209, +5.25% from previous year)
- 2025: $626,700 (+$20,892, +3.45% from previous year)
Westwood Hills has experienced a 97% increase in home prices since 2010. Steady annual growth has brought the median home value to $626,700 in 2025, reflecting its status as a premier Kansas enclave.
Westwood Hills – Historic Character and High Demand
Westwood Hills, nestled within Johnson County, is known for its Tudor-style homes and tree-lined streets. The town is one of the smallest cities in Kansas, creating a tight-knit community with limited housing inventory, which helps support property values.
Its proximity to Kansas City and nearby universities has maintained strong demand. The steady price growth in recent years, including a 3.45% rise in 2025, shows buyers continue to value its historic charm and central location.
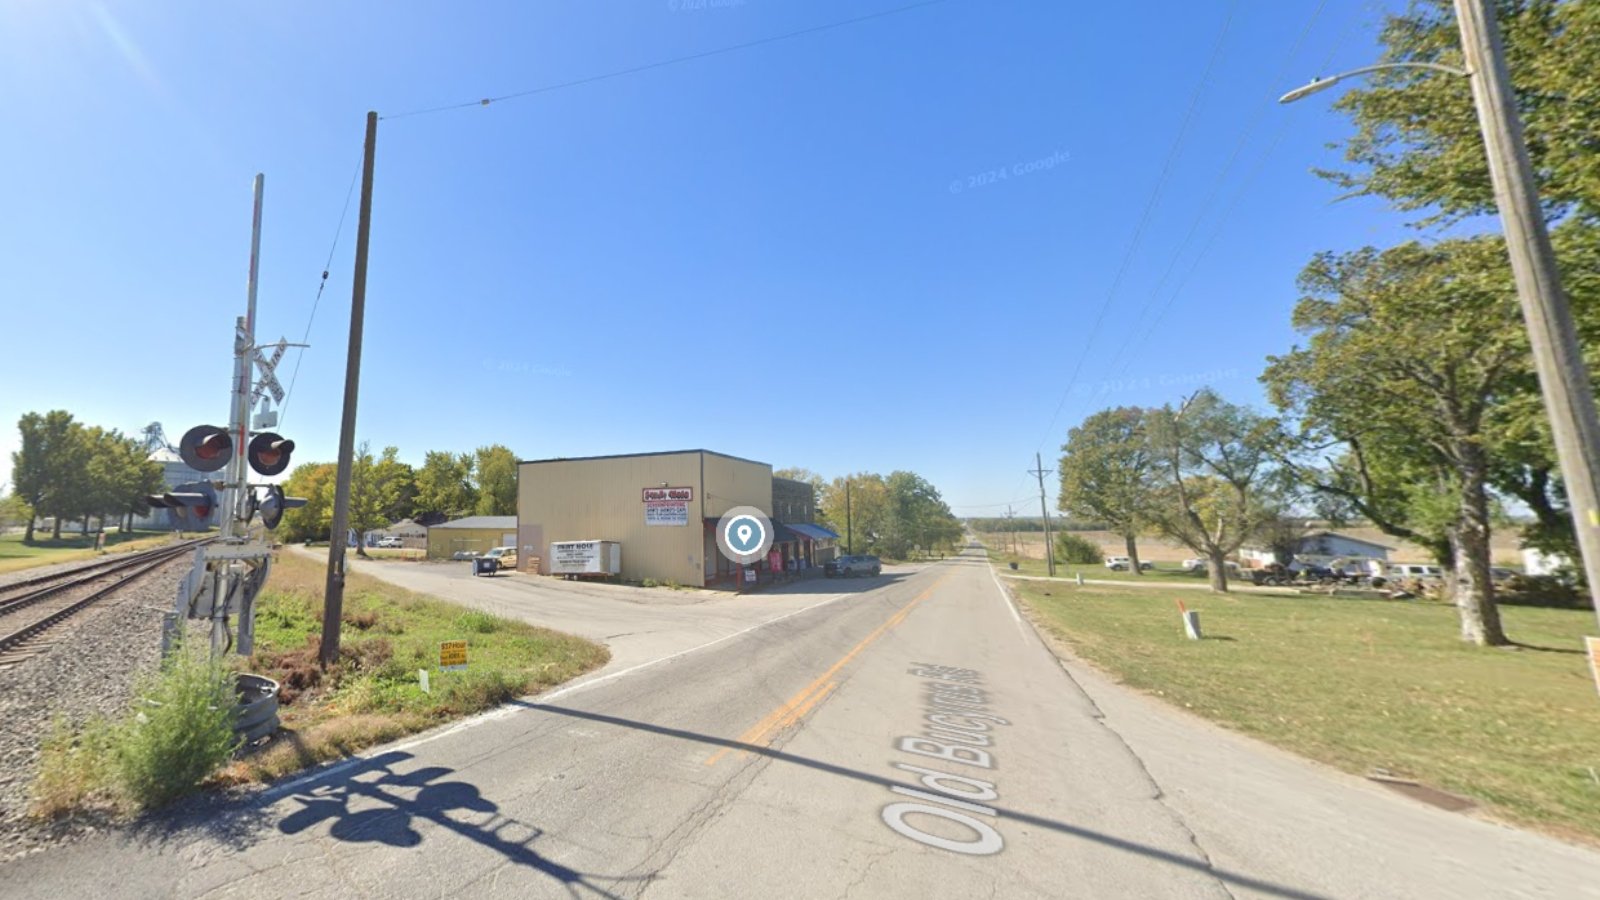
5. Bucyrus – 140% Home Price Increase Since 2010
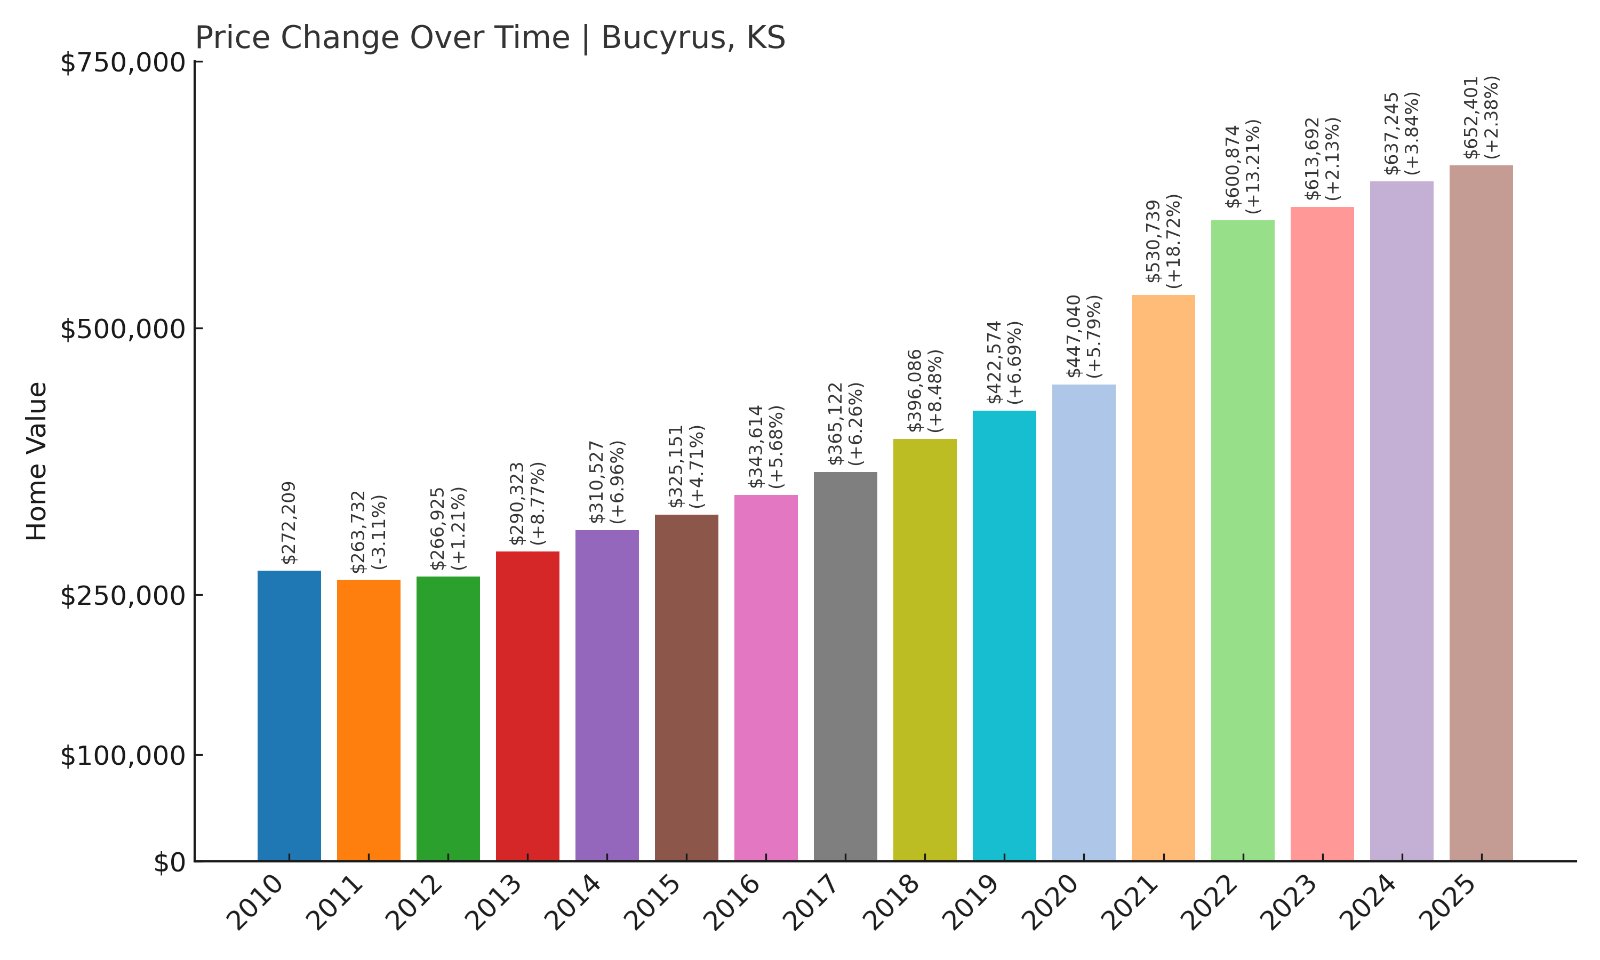
- 2010: $272,209
- 2011: $263,732 (-$8,476, -3.11% from previous year)
- 2012: $266,925 (+$3,193, +1.21% from previous year)
- 2013: $290,323 (+$23,398, +8.77% from previous year)
- 2014: $310,527 (+$20,203, +6.96% from previous year)
- 2015: $325,151 (+$14,624, +4.71% from previous year)
- 2016: $343,614 (+$18,463, +5.68% from previous year)
- 2017: $365,122 (+$21,509, +6.26% from previous year)
- 2018: $396,086 (+$30,964, +8.48% from previous year)
- 2019: $422,574 (+$26,488, +6.69% from previous year)
- 2020: $447,040 (+$24,466, +5.79% from previous year)
- 2021: $530,739 (+$83,700, +18.72% from previous year)
- 2022: $600,874 (+$70,135, +13.21% from previous year)
- 2023: $613,692 (+$12,818, +2.13% from previous year)
- 2024: $637,245 (+$23,553, +3.84% from previous year)
- 2025: $652,401 (+$15,156, +2.38% from previous year)
Bucyrus home prices have soared by 140% since 2010, with dramatic jumps in 2021 and 2022. The current median sits at $652,401 in 2025, underscoring its growing popularity.
Bucyrus – Luxury Estates and Rural Space
🔥 Would you like to save this?
Bucyrus is an unincorporated community in Miami County, south of Overland Park. Known for luxury estates on large lots, its semi-rural environment appeals to buyers looking for privacy while remaining within reach of Kansas City’s employment hubs.
Massive gains in 2021 and 2022 align with rising demand for spacious homes during the pandemic. Even though growth has slowed to around 2% in 2025, Bucyrus remains a sought-after area for those seeking country living with metropolitan convenience.
4. Leawood – 90% Home Price Increase Since 2010
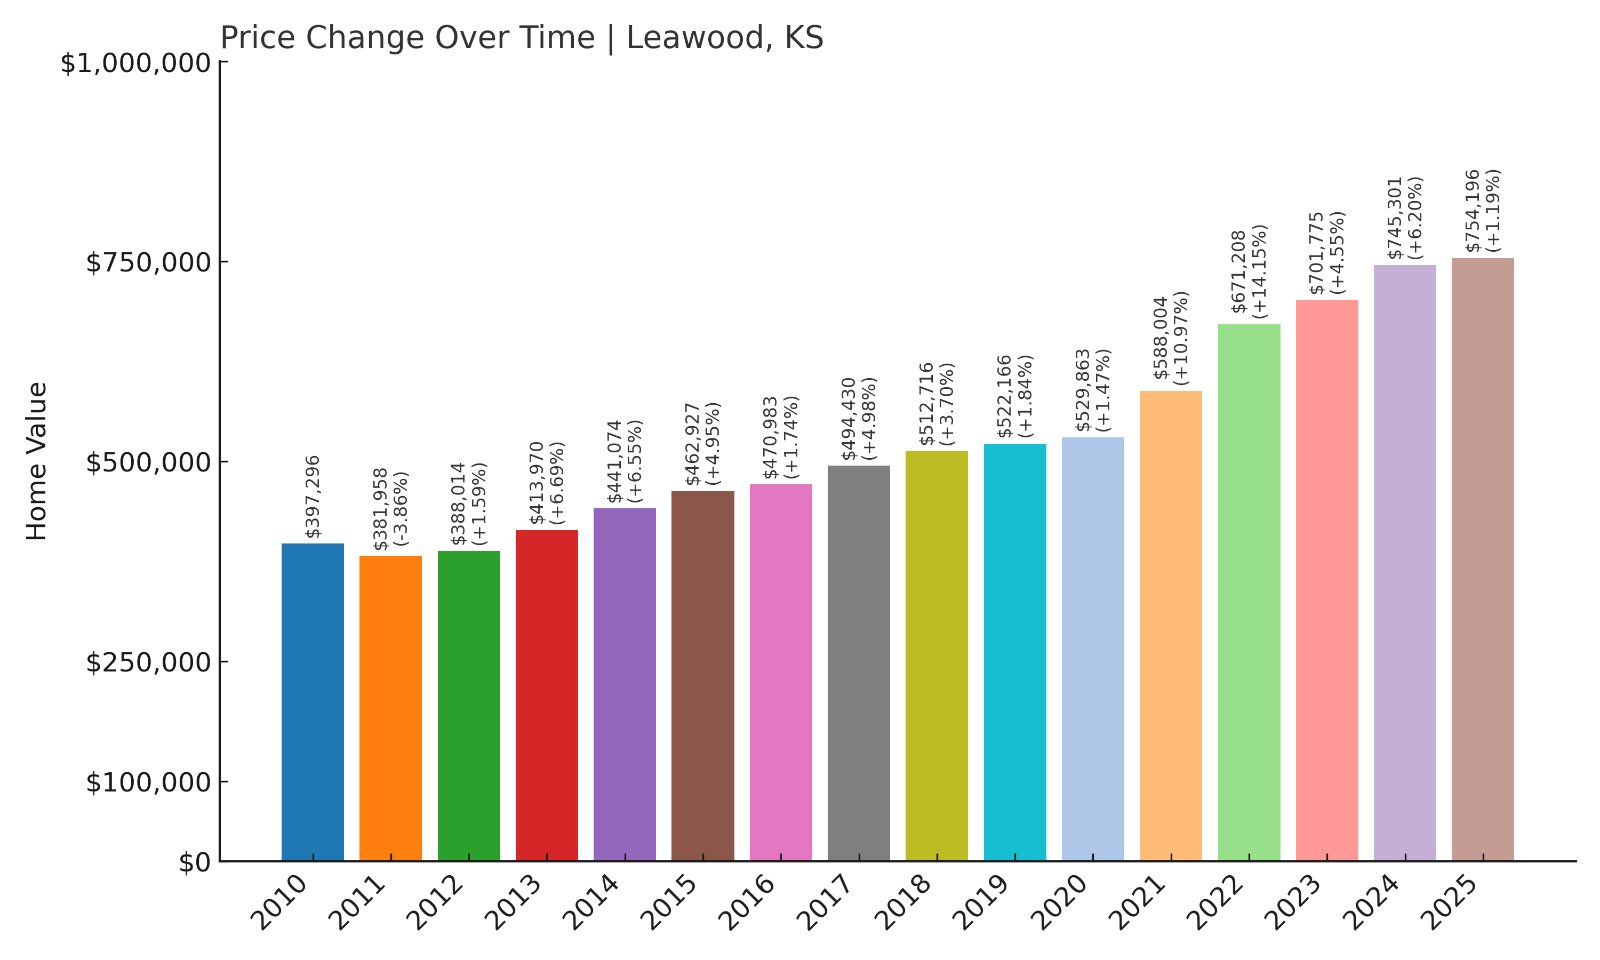
- 2010: $397,296
- 2011: $381,958 (-$15,338, -3.86% from previous year)
- 2012: $388,014 (+$6,056, +1.59% from previous year)
- 2013: $413,970 (+$25,956, +6.69% from previous year)
- 2014: $441,074 (+$27,103, +6.55% from previous year)
- 2015: $462,927 (+$21,853, +4.95% from previous year)
- 2016: $470,983 (+$8,056, +1.74% from previous year)
- 2017: $494,430 (+$23,447, +4.98% from previous year)
- 2018: $512,716 (+$18,286, +3.70% from previous year)
- 2019: $522,166 (+$9,449, +1.84% from previous year)
- 2020: $529,863 (+$7,697, +1.47% from previous year)
- 2021: $588,004 (+$58,140, +10.97% from previous year)
- 2022: $671,208 (+$83,204, +14.15% from previous year)
- 2023: $701,775 (+$30,567, +4.55% from previous year)
- 2024: $745,301 (+$43,526, +6.20% from previous year)
- 2025: $754,196 (+$8,895, +1.19% from previous year)
Leawood home prices have grown by 90% since 2010, reaching a median of $754,196 in 2025. Growth has been consistent, with large spikes during the post-pandemic housing boom.
Leawood – Affluent Suburb With High-End Appeal
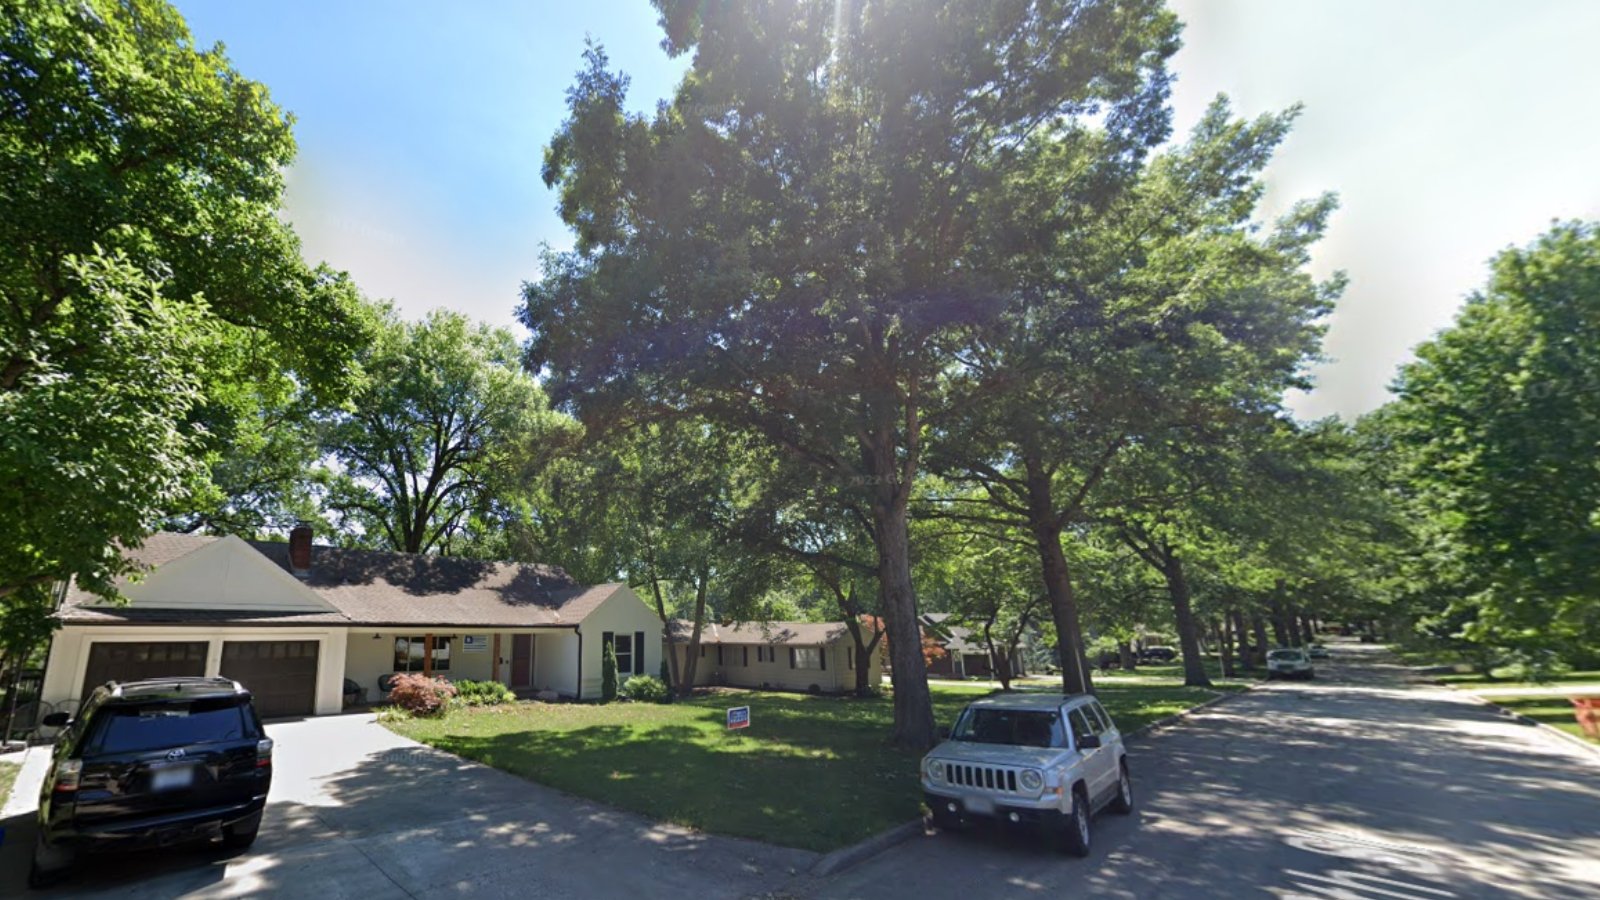
Leawood, located in Johnson County, is known for its upscale neighborhoods, luxury shopping centers, and strong schools. Its tree-lined streets and proximity to Overland Park and Kansas City make it a top choice for professionals and executives.
The city’s housing market remains stable, with its modest growth in 2025 reflecting a return to normalized appreciation after years of strong double-digit gains.
3. Mission Woods – 82% Home Price Increase Since 2012
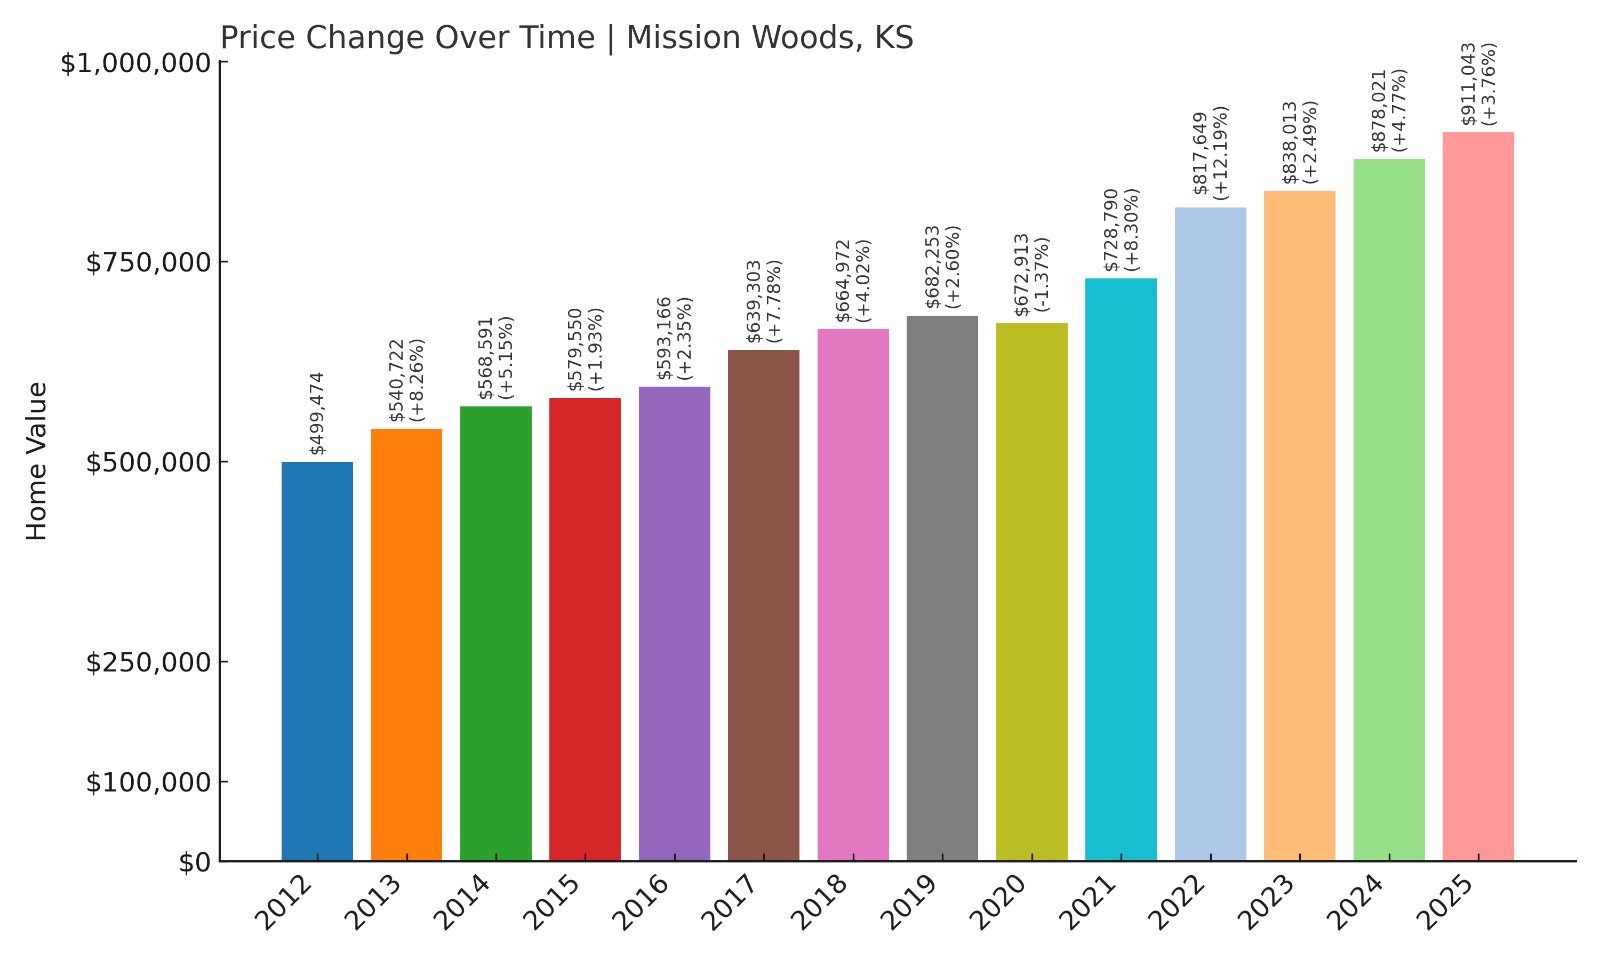
- 2012: $499,474
- 2013: $540,722 (+$41,248, +8.26% from previous year)
- 2014: $568,591 (+$27,869, +5.15% from previous year)
- 2015: $579,550 (+$10,959, +1.93% from previous year)
- 2016: $593,166 (+$13,616, +2.35% from previous year)
- 2017: $639,303 (+$46,137, +7.78% from previous year)
- 2018: $664,972 (+$25,670, +4.02% from previous year)
- 2019: $682,253 (+$17,281, +2.60% from previous year)
- 2020: $672,913 (-$9,341, -1.37% from previous year)
- 2021: $728,790 (+$55,878, +8.30% from previous year)
- 2022: $817,649 (+$88,859, +12.19% from previous year)
- 2023: $838,013 (+$20,364, +2.49% from previous year)
- 2024: $878,021 (+$40,008, +4.77% from previous year)
- 2025: $911,043 (+$33,022, +3.76% from previous year)
Mission Woods has seen an 82% increase in home prices since 2012, with a median price of $911,043 in 2025. Growth has been steady with significant increases in 2021 and 2022.
Mission Woods – Exclusive Enclave With Prestige
Mission Woods, one of Kansas’s smallest cities, is located near Mission Hills and Fairway. Known for its exclusivity and quiet streets, the town appeals to high-income buyers seeking privacy within the Kansas City metro area.
Limited land and its reputation for prestige have kept housing supply tight, supporting continued appreciation. Recent annual growth remains healthy, signaling lasting buyer interest.
2. Lake Quivira – 70% Home Price Increase Since 2010
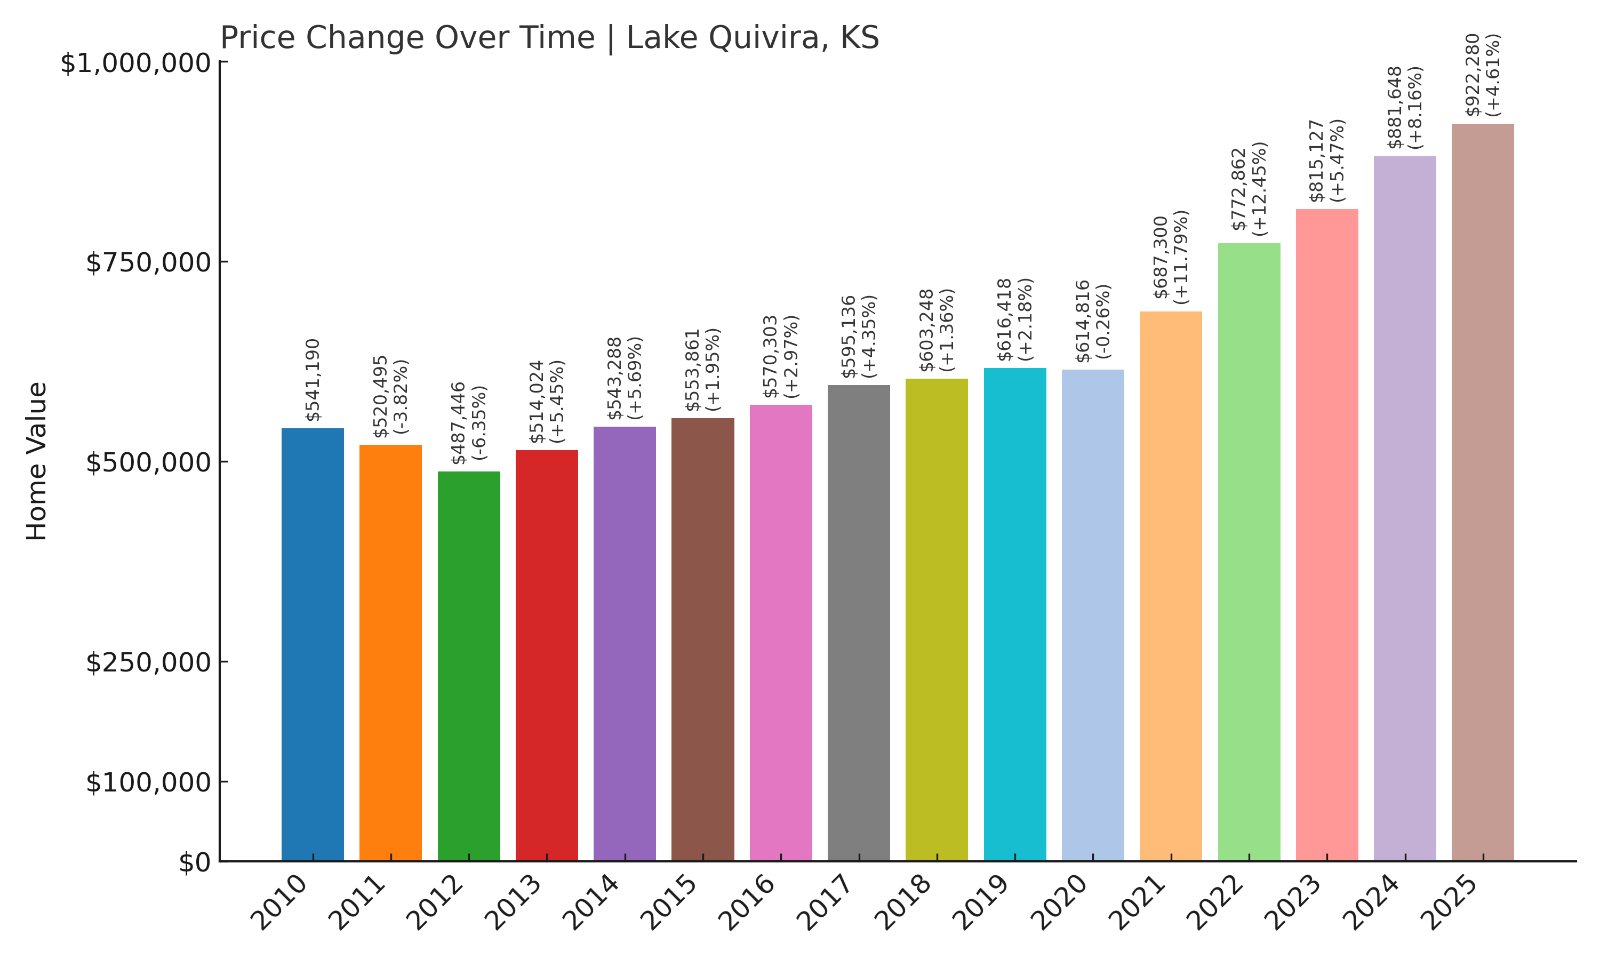
- 2010: $541,190
- 2011: $520,495 (-$20,695, -3.82% from previous year)
- 2012: $487,446 (-$33,050, -6.35% from previous year)
- 2013: $514,024 (+$26,578, +5.45% from previous year)
- 2014: $543,288 (+$29,264, +5.69% from previous year)
- 2015: $553,861 (+$10,573, +1.95% from previous year)
- 2016: $570,303 (+$16,442, +2.97% from previous year)
- 2017: $595,136 (+$24,833, +4.35% from previous year)
- 2018: $603,248 (+$8,112, +1.36% from previous year)
- 2019: $616,418 (+$13,170, +2.18% from previous year)
- 2020: $614,816 (-$1,601, -0.26% from previous year)
- 2021: $687,300 (+$72,484, +11.79% from previous year)
- 2022: $772,862 (+$85,562, +12.45% from previous year)
- 2023: $815,127 (+$42,265, +5.47% from previous year)
- 2024: $881,648 (+$66,521, +8.16% from previous year)
- 2025: $922,280 (+$40,632, +4.61% from previous year)
Lake Quivira’s home prices have grown by 70% since 2010, with the median now at $922,280. The largest gains occurred in 2021 and 2022, with steady increases continuing into 2025.
Lake Quivira – Lakeside Living and Private Amenities
Lake Quivira is known for its gated community surrounding a private lake and golf course. Residents enjoy boating, fishing, and exclusive community events, attracting buyers seeking resort-style living within the Kansas City metro.
Limited homesites and high community standards help maintain strong property values. The ongoing price growth indicates that Lake Quivira remains a desirable choice for affluent buyers looking for luxury and recreation.
1. Mission Hills – 85% Home Price Increase Since 2010
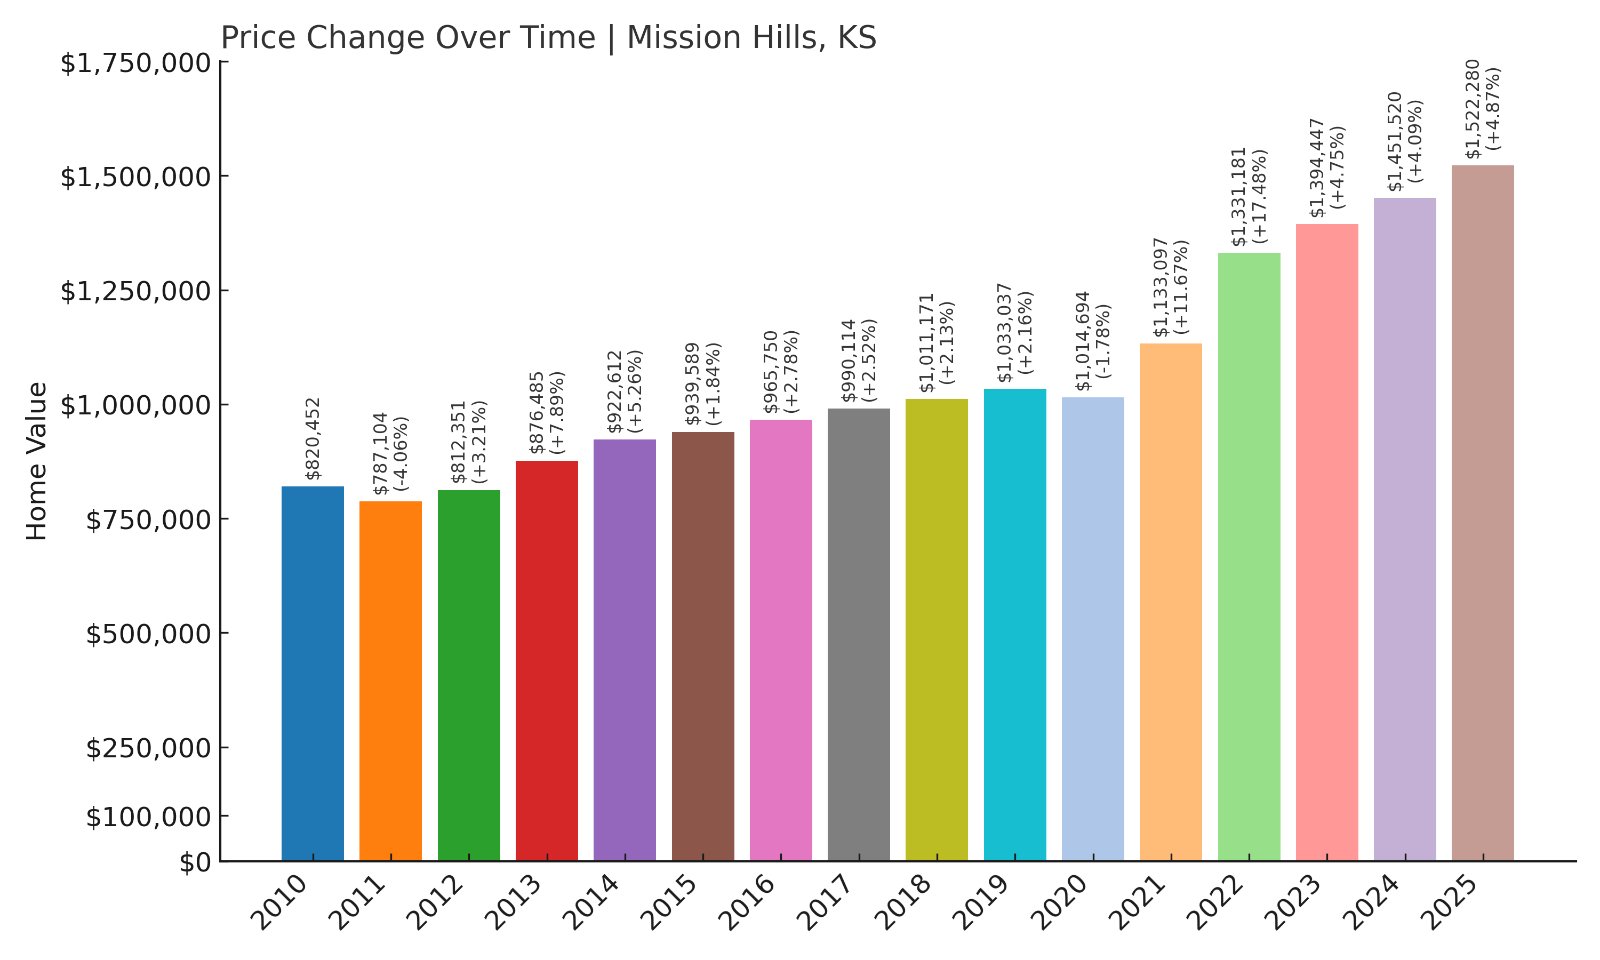
- 2010: $820,452
- 2011: $787,104 (-$33,349, -4.06% from previous year)
- 2012: $812,351 (+$25,248, +3.21% from previous year)
- 2013: $876,485 (+$64,134, +7.89% from previous year)
- 2014: $922,612 (+$46,127, +5.26% from previous year)
- 2015: $939,589 (+$16,977, +1.84% from previous year)
- 2016: $965,750 (+$26,161, +2.78% from previous year)
- 2017: $990,114 (+$24,364, +2.52% from previous year)
- 2018: $1,011,171 (+$21,057, +2.13% from previous year)
- 2019: $1,033,037 (+$21,866, +2.16% from previous year)
- 2020: $1,014,694 (-$18,343, -1.78% from previous year)
- 2021: $1,133,097 (+$118,403, +11.67% from previous year)
- 2022: $1,331,181 (+$198,083, +17.48% from previous year)
- 2023: $1,394,447 (+$63,267, +4.75% from previous year)
- 2024: $1,451,520 (+$57,073, +4.09% from previous year)
- 2025: $1,522,280 (+$70,760, +4.87% from previous year)
Mission Hills home prices have increased by 85% since 2010, now reaching $1,522,280 in 2025. Strong growth during the pandemic years cemented its place as Kansas’s most expensive town.
Mission Hills – Historic Prestige and Elite Reputation

Mission Hills is an exclusive city known for its grand estates, golf courses, and tree-lined boulevards. Established in the early 20th century, it remains Kansas’s wealthiest community and one of the most prestigious addresses in the Kansas City region.
Strong demand for luxury homes has kept prices climbing steadily. Its combination of architectural beauty, proximity to Kansas City, and enduring elite status ensures that Mission Hills remains the pinnacle of Kansas real estate.


