🔥 Would you like to save this?
Montana has its fair share of million-dollar mountain views—but not every town in Big Sky Country comes with a resort-sized price tag. Zillow’s Home Value Index shows that as of May 2025, there are still 20 towns where home prices stay down-to-earth. Whether it’s a peaceful rural hideout or a friendly small-town main street, these places offer real value and room to breathe without draining your bank account.
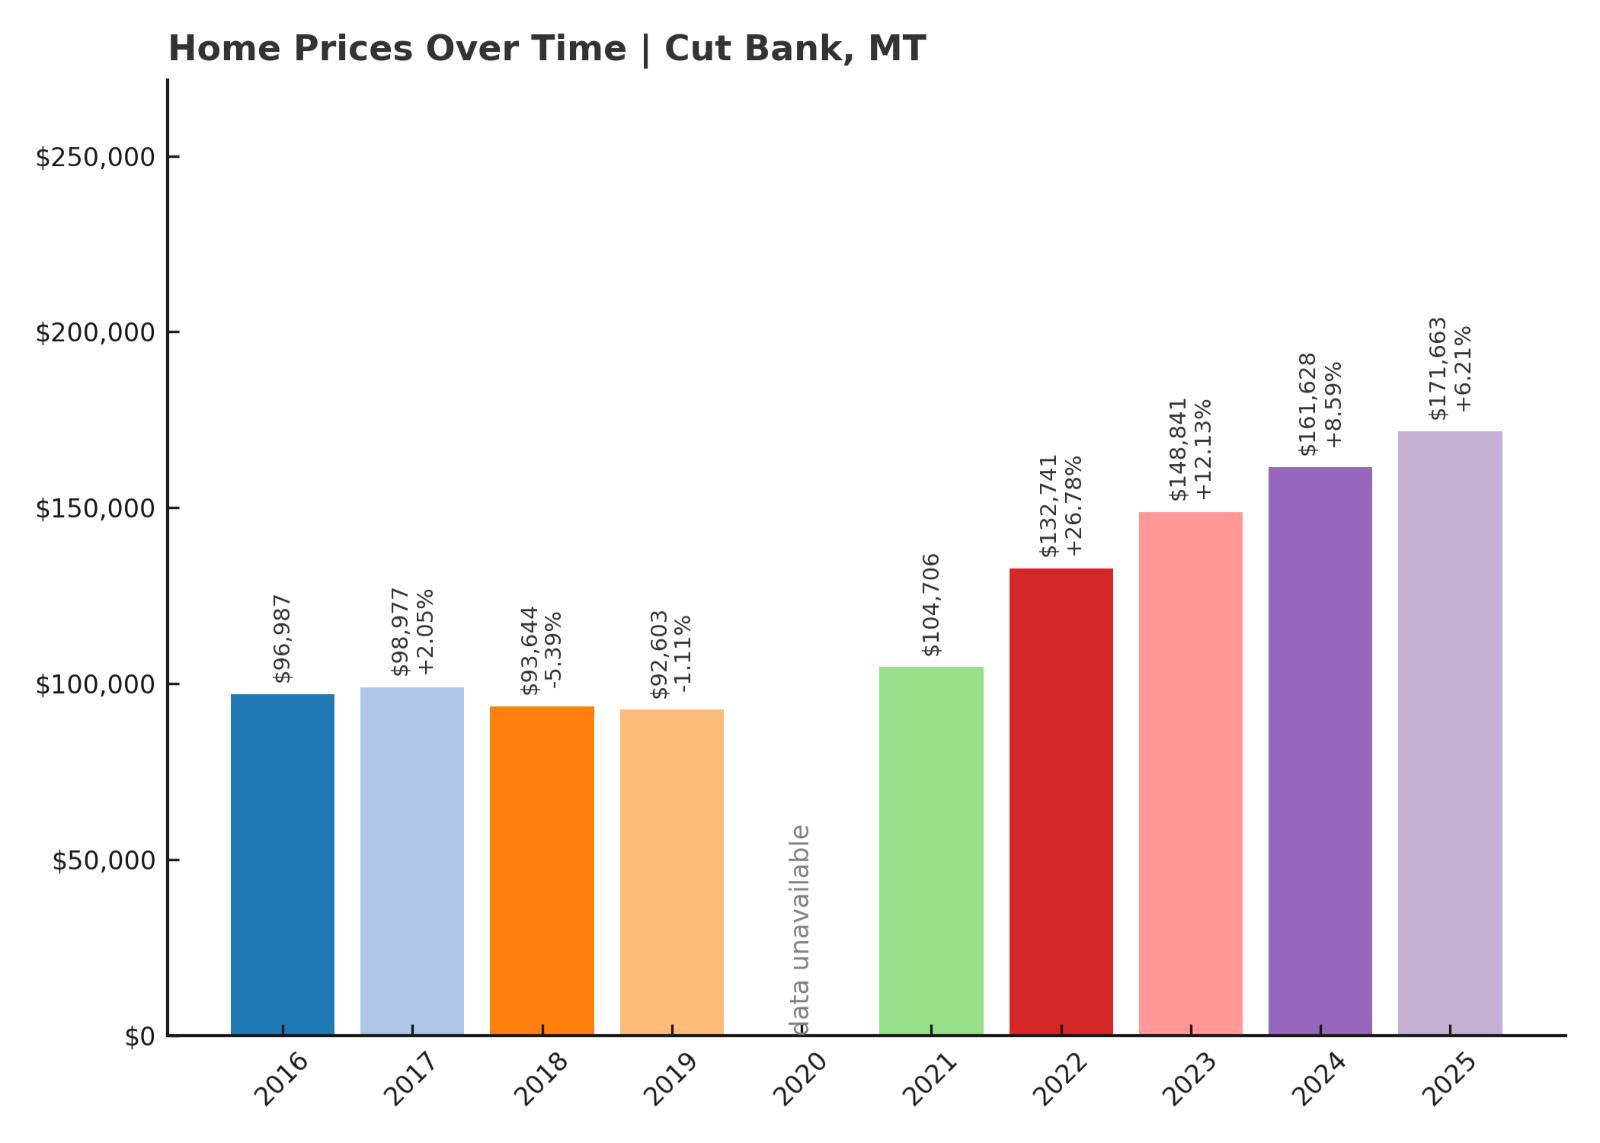
20. Cut Bank – 77% Home Price Increase Since 2016
- 2010: N/A
- 2011: N/A
- 2012: N/A
- 2013: N/A
- 2014: N/A
- 2015: N/A
- 2016: $96,987
- 2017: $98,977 (+$1,989, +2.05% from previous year)
- 2018: $93,644 (-$5,332, -5.39% from previous year)
- 2019: $92,603 (-$1,041, -1.11% from previous year)
- 2020: N/A
- 2021: $104,706
- 2022: $132,741 (+$28,035, +26.78% from previous year)
- 2023: $148,841 (+$16,100, +12.13% from previous year)
- 2024: $161,628 (+$12,786, +8.59% from previous year)
- 2025: $171,663 (+$10,035, +6.21% from previous year)
Cut Bank’s home prices rose from $96,987 in 2016 to $171,663 in 2025, a 77% increase. Most of the gains have come in the past four years, after a period of stagnation from 2016 to 2019. The biggest jump occurred in 2022, when values soared more than 26% in a single year. Prices have continued to climb steadily since then, signaling growing buyer interest. With relatively low starting prices, even moderate dollar increases result in substantial percentage gains. This makes Cut Bank one of the most improved markets in Montana by value appreciation.
In order to come up with the very specific design ideas, we create most designs with the assistance of state-of-the-art AI interior design software. Also, assume links that take you off the site are affiliate links such as links to Amazon. this means we may earn a commission if you buy something.
Cut Bank – Affordable Prices Near Glacier Country
Located in northwestern Montana, Cut Bank sits along the Hi-Line corridor and serves as a regional hub for Glacier County. It’s best known for its windy climate and access to Glacier National Park, drawing occasional interest from outdoor enthusiasts. The economy leans on agriculture, wind energy, and freight services, which have remained fairly steady over time. Cut Bank’s modest home values and wide-open spaces have become more appealing in the post-pandemic era, especially to remote workers. A lack of new housing construction has kept inventory tight, helping to support higher prices. With rail and highway access, it offers rare connectivity for such a small and rural town.
19. Culbertson – 76% Home Price Increase Since 2016
- 2010: N/A
- 2011: N/A
- 2012: N/A
- 2013: N/A
- 2014: N/A
- 2015: N/A
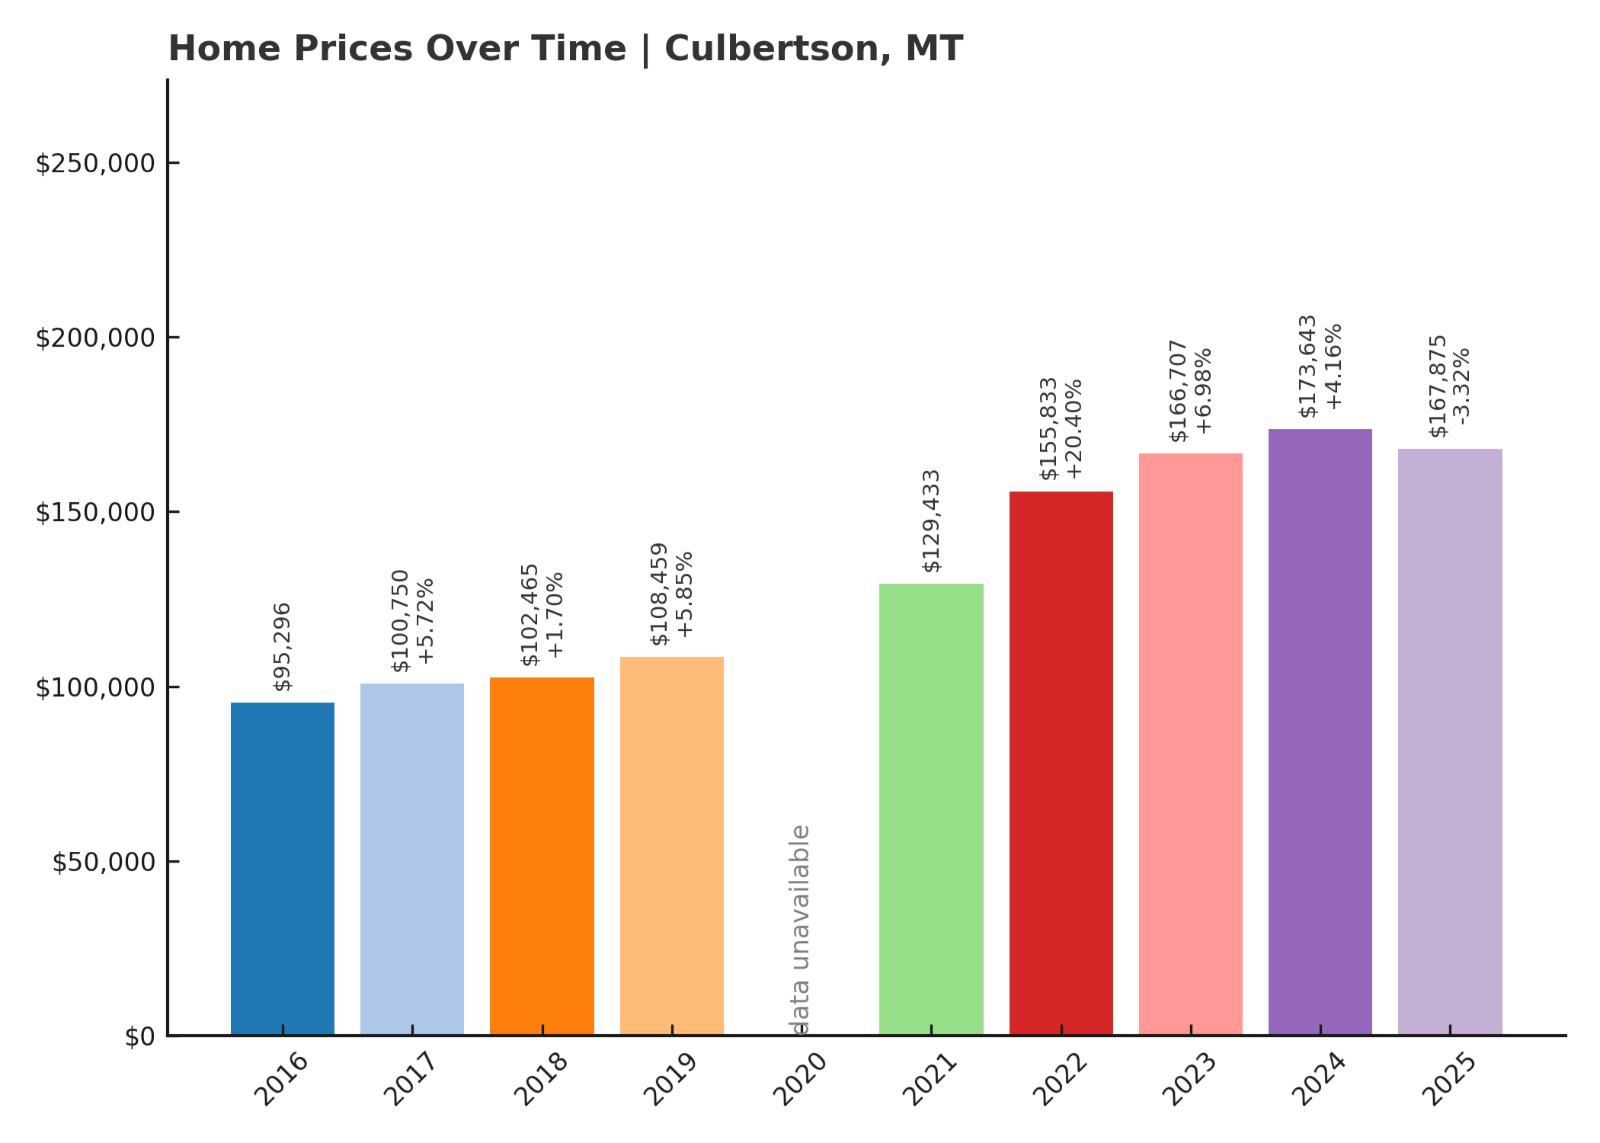
- 2016: $95,296
- 2017: $100,750 (+$5,454, +5.72% from previous year)
- 2018: $102,465 (+$1,715, +1.70% from previous year)
- 2019: $108,459 (+$5,994, +5.85% from previous year)
- 2020: N/A
- 2021: $129,433
- 2022: $155,833 (+$26,400, +20.40% from previous year)
- 2023: $166,707 (+$10,873, +6.98% from previous year)
- 2024: $173,643 (+$6,936, +4.16% from previous year)
- 2025: $167,875 (-$5,767, -3.32% from previous year)
Home values in Culbertson rose from $95,296 in 2016 to $167,875 by 2025, totaling a 76% increase. Growth was relatively smooth until a sharp climb started in 2021. The largest jump came in 2022, with over 20% year-over-year appreciation. Prices peaked in 2024 before dipping slightly in 2025, possibly reflecting market correction. Despite that, long-term trends show steady and impressive growth. The gains point to rising demand in this quiet northeastern corner of the state.
Culbertson – A Quiet Oil-Town Turned Rising Market
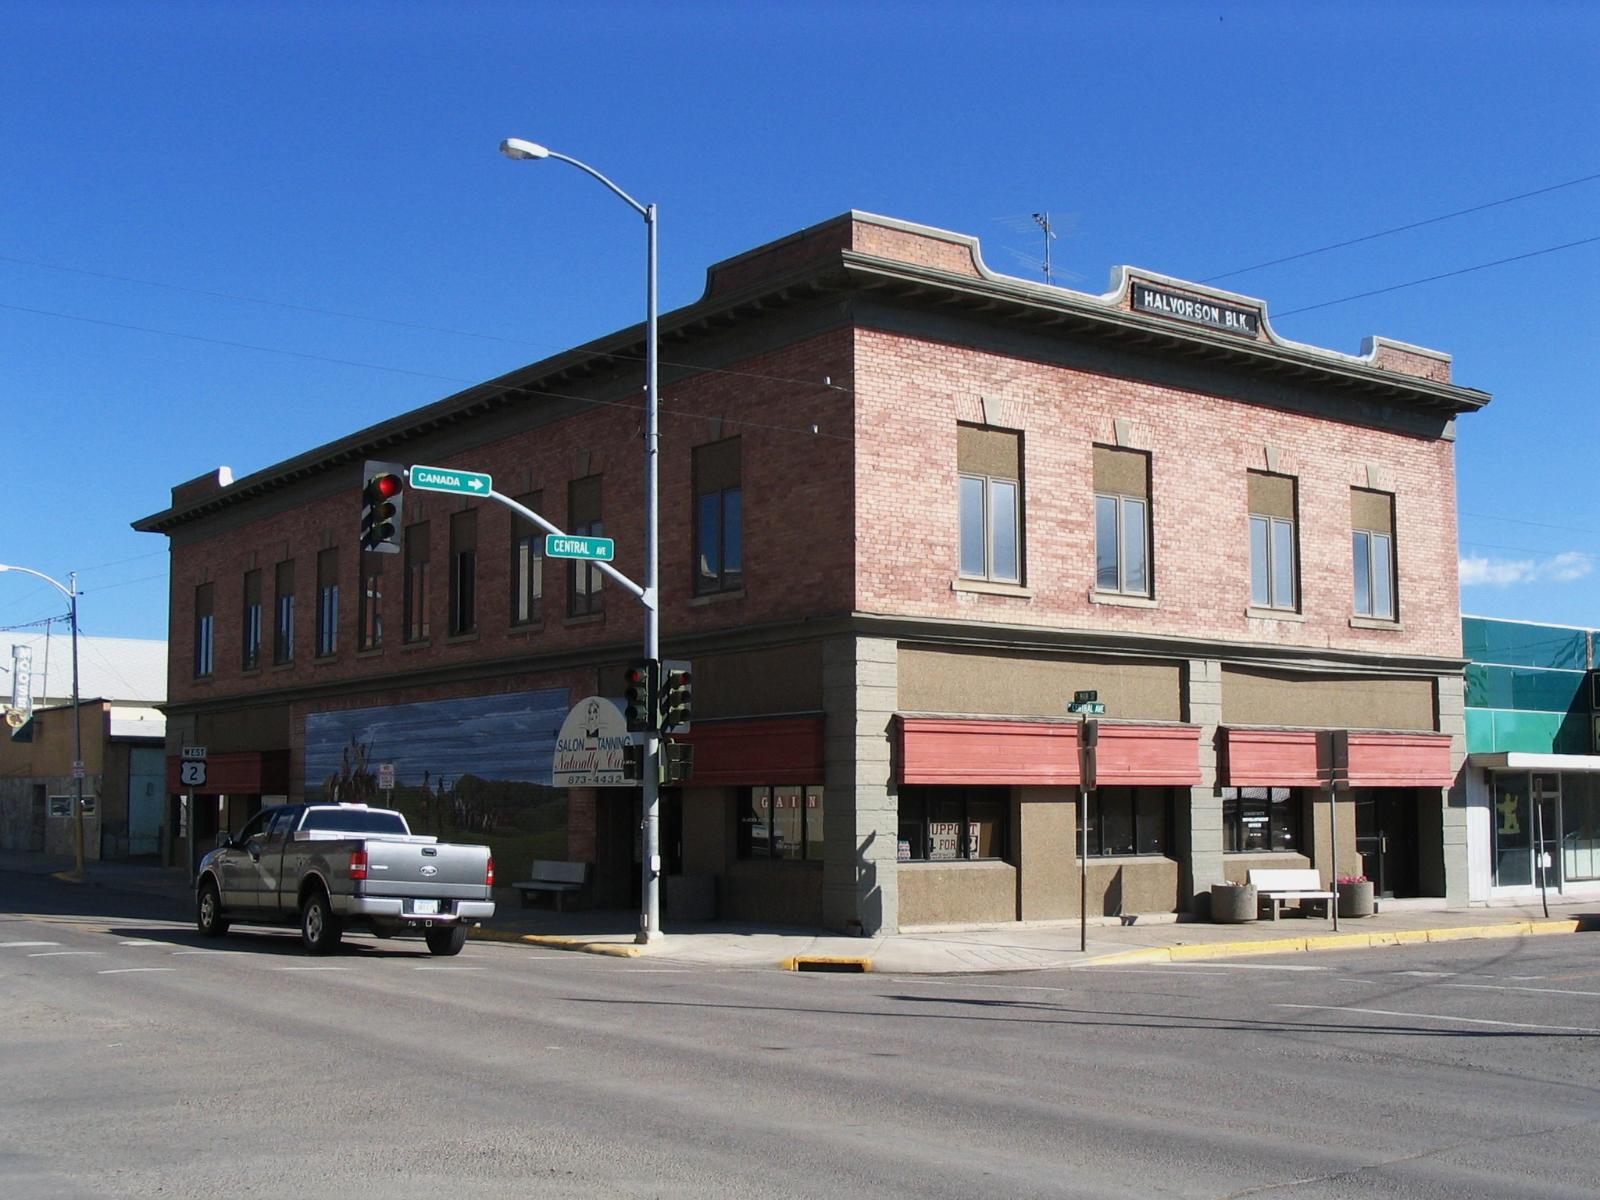
 Google Street viewCulbertson is located near Montana’s eastern edge, close to the Bakken oil fields of North Dakota. This proximity to energy development has helped lift the local economy and brought some new residents to town. While small, Culbertson has essential services, schools, and basic retail—attractive features for rural buyers. It’s also positioned along U.S. Route 2, giving it a logistical advantage over more remote communities. The rise in home values reflects both external demand and limited local supply. For buyers priced out of larger towns, Culbertson remains a practical, stable option with upside potential.
18. Westby – 66% Home Price Increase Since 2016
- 2010: N/A
- 2011: N/A
- 2012: N/A
- 2013: N/A
- 2014: N/A
- 2015: N/A
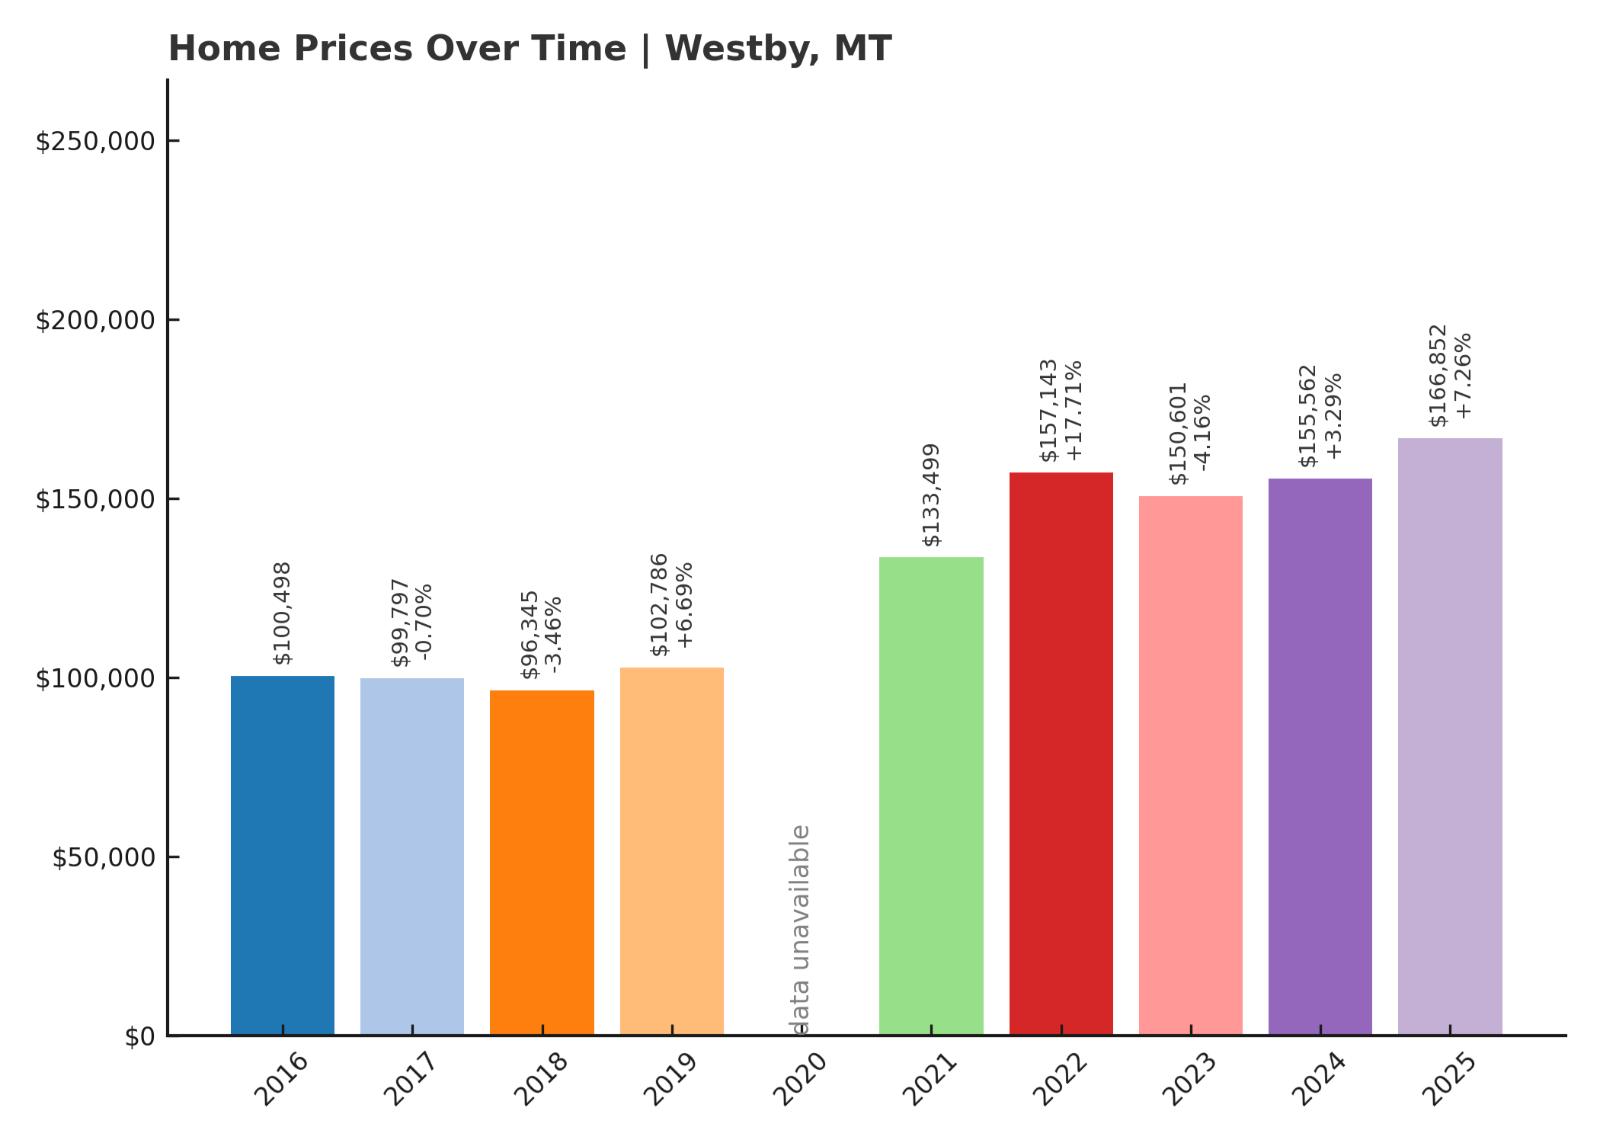
- 2016: $100,498
- 2017: $99,797 (-$700, -0.70% from previous year)
- 2018: $96,345 (-$3,452, -3.46% from previous year)
- 2019: $102,786 (+$6,441, +6.69% from previous year)
- 2020: N/A
- 2021: $133,499
- 2022: $157,143 (+$23,644, +17.71% from previous year)
- 2023: $150,601 (-$6,542, -4.16% from previous year)
- 2024: $155,562 (+$4,961, +3.29% from previous year)
- 2025: $166,852 (+$11,290, +7.26% from previous year)
Westby’s home values rose from $100,498 in 2016 to $166,852 in 2025, an increase of 66%. After some slight declines in the late 2010s, prices took off starting in 2021. The biggest jump came in 2022 with nearly 18% growth in one year. There was a small correction in 2023, but prices quickly rebounded. Since 2021, the overall trend has been one of strong upward movement. Westby’s long-term gains are solid, especially for a town of its size.
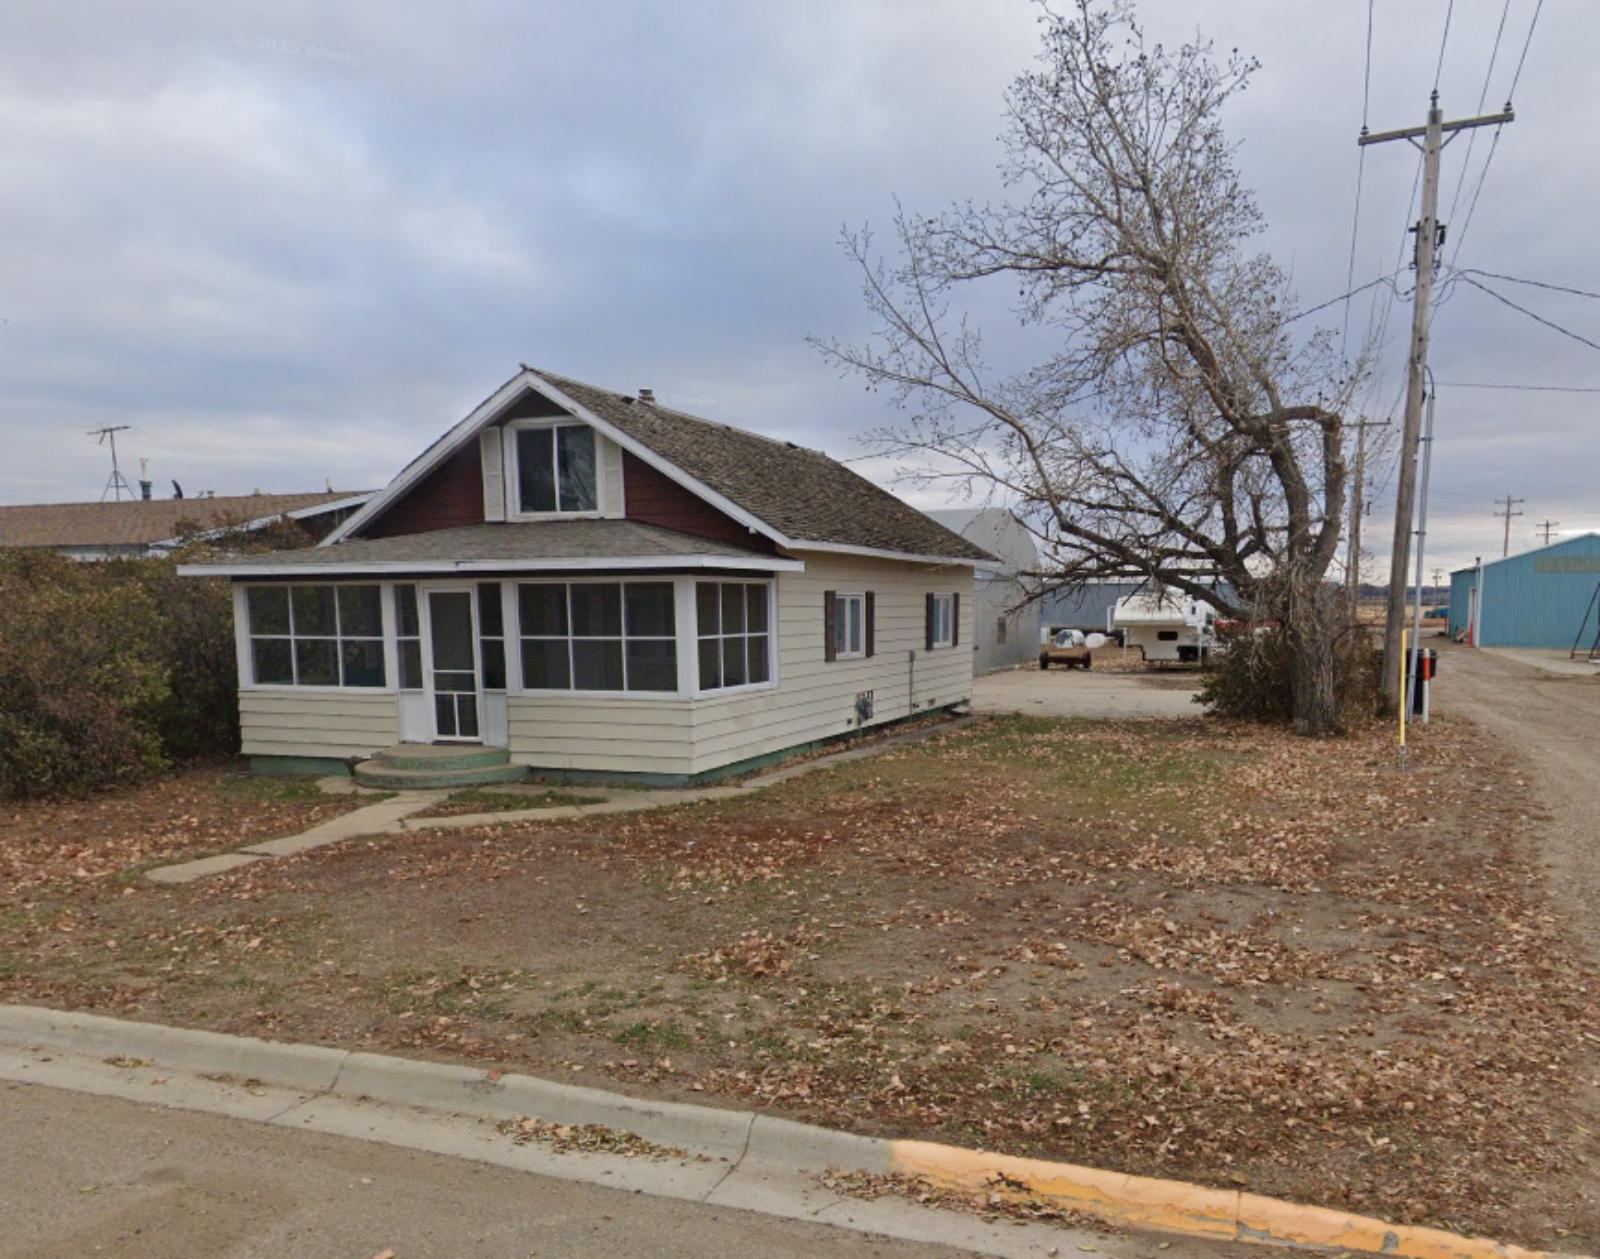
Westby – Remote But on the Radar
Tucked into the northeasternmost corner of Montana, Westby is about as remote as it gets. Its isolation, once a drawback, has become a draw for buyers looking for privacy, low taxes, and open land. Though the town is tiny—with a population under 200—it offers proximity to regional agricultural activity and has benefited from cross-border commerce with nearby North Dakota. Recent home price growth suggests increased interest from out-of-state buyers, likely attracted by affordability and rural charm. The rebound from its 2017–2018 dip also points to tighter inventory and renewed demand. With no signs of overdevelopment, Westby remains a market to watch for long-term value.
17. Walkerville – 231% Home Price Increase Since 2013

- 2010: N/A
- 2011: N/A
- 2012: N/A
- 2013: $46,644
- 2014: $52,057 (+$5,413, +11.60% from previous year)
- 2015: $51,673 (-$384, -0.74% from previous year)
- 2016: $60,060 (+$8,386, +16.23% from previous year)
- 2017: $59,697 (-$363, -0.60% from previous year)
- 2018: $68,321 (+$8,624, +14.45% from previous year)
- 2019: $69,490 (+$1,169, +1.71% from previous year)
- 2020: N/A
- 2021: $103,102
- 2022: $129,526 (+$26,424, +25.63% from previous year)
- 2023: $139,154 (+$9,627, +7.43% from previous year)
- 2024: $154,344 (+$15,190, +10.92% from previous year)
- 2025: $154,310 (-$34, -0.02% from previous year)
Walkerville’s home prices rose from $46,644 in 2013 to $154,310 in 2025, a massive 231% increase. Growth was steady through the late 2010s, then surged in 2021 and beyond. The most dramatic rise came between 2020 and 2022, where prices nearly doubled. Despite a flat year in 2025, the town has outpaced nearly all others in long-term appreciation. This kind of growth is uncommon for towns of its size. The price climb reflects changing perceptions and growing demand in the Butte area.
Walkerville – High Above Butte, and Climbing
Walkerville is perched on the hills overlooking Butte, giving it a unique identity as a smaller town with shared amenities. Once a separate mining camp, it’s now tightly connected to Butte’s economy and culture. Its historic homes and elevated views have become increasingly attractive, especially as Butte’s housing market tightened. Walkerville offers more peace and fewer crowds while still giving residents access to jobs, shopping, and services just minutes away. The recent home price boom reflects renewed attention to the area, possibly driven by buyers seeking affordable housing near urban cores. With strong demand and limited inventory, Walkerville’s price rise is more than just a fluke—it’s part of a larger regional shift.
16. Winnett – 82% Home Price Increase Since 2016

- 2010: N/A
- 2011: N/A
- 2012: N/A
- 2013: N/A
- 2014: N/A
- 2015: N/A
- 2016: $84,036
- 2017: $82,947 (-$1,089, -1.30% from previous year)
- 2018: $92,756 (+$9,809, +11.83% from previous year)
- 2019: $101,888 (+$9,132, +9.84% from previous year)
- 2020: N/A
- 2021: $115,229
- 2022: $131,187 (+$15,959, +13.85% from previous year)
- 2023: $124,219 (-$6,968, -5.31% from previous year)
- 2024: $133,212 (+$8,993, +7.24% from previous year)
- 2025: $152,861 (+$19,649, +14.75% from previous year)
Winnett’s average home price has climbed from $84,036 in 2016 to $152,861 in 2025, reflecting an 82% gain. Growth was strongest in the early 2020s, with double-digit increases in 2022 and 2025. Although 2023 saw a dip, prices quickly rebounded the following year. The pattern suggests market momentum is still strong. As one of Montana’s smallest county seats, even modest demand can impact values significantly. Low supply and regional interest have helped push Winnett onto this list.
Winnett – Remote, Quiet, and Climbing

Winnett is the only incorporated town in Petroleum County, and it serves as the county seat despite having fewer than 200 residents. Its location in central Montana places it far from major cities, yet its appeal lies in the very things that make it remote—quiet, safety, and low taxes. Agricultural activity dominates the local economy, with ranching and dryland wheat farming providing the primary income. In recent years, buyers seeking large tracts of land or second homes have looked toward Winnett for value. Price increases here are tied more to land desirability than local development. As demand for remote properties continues, Winnett’s home values are likely to remain on the rise.
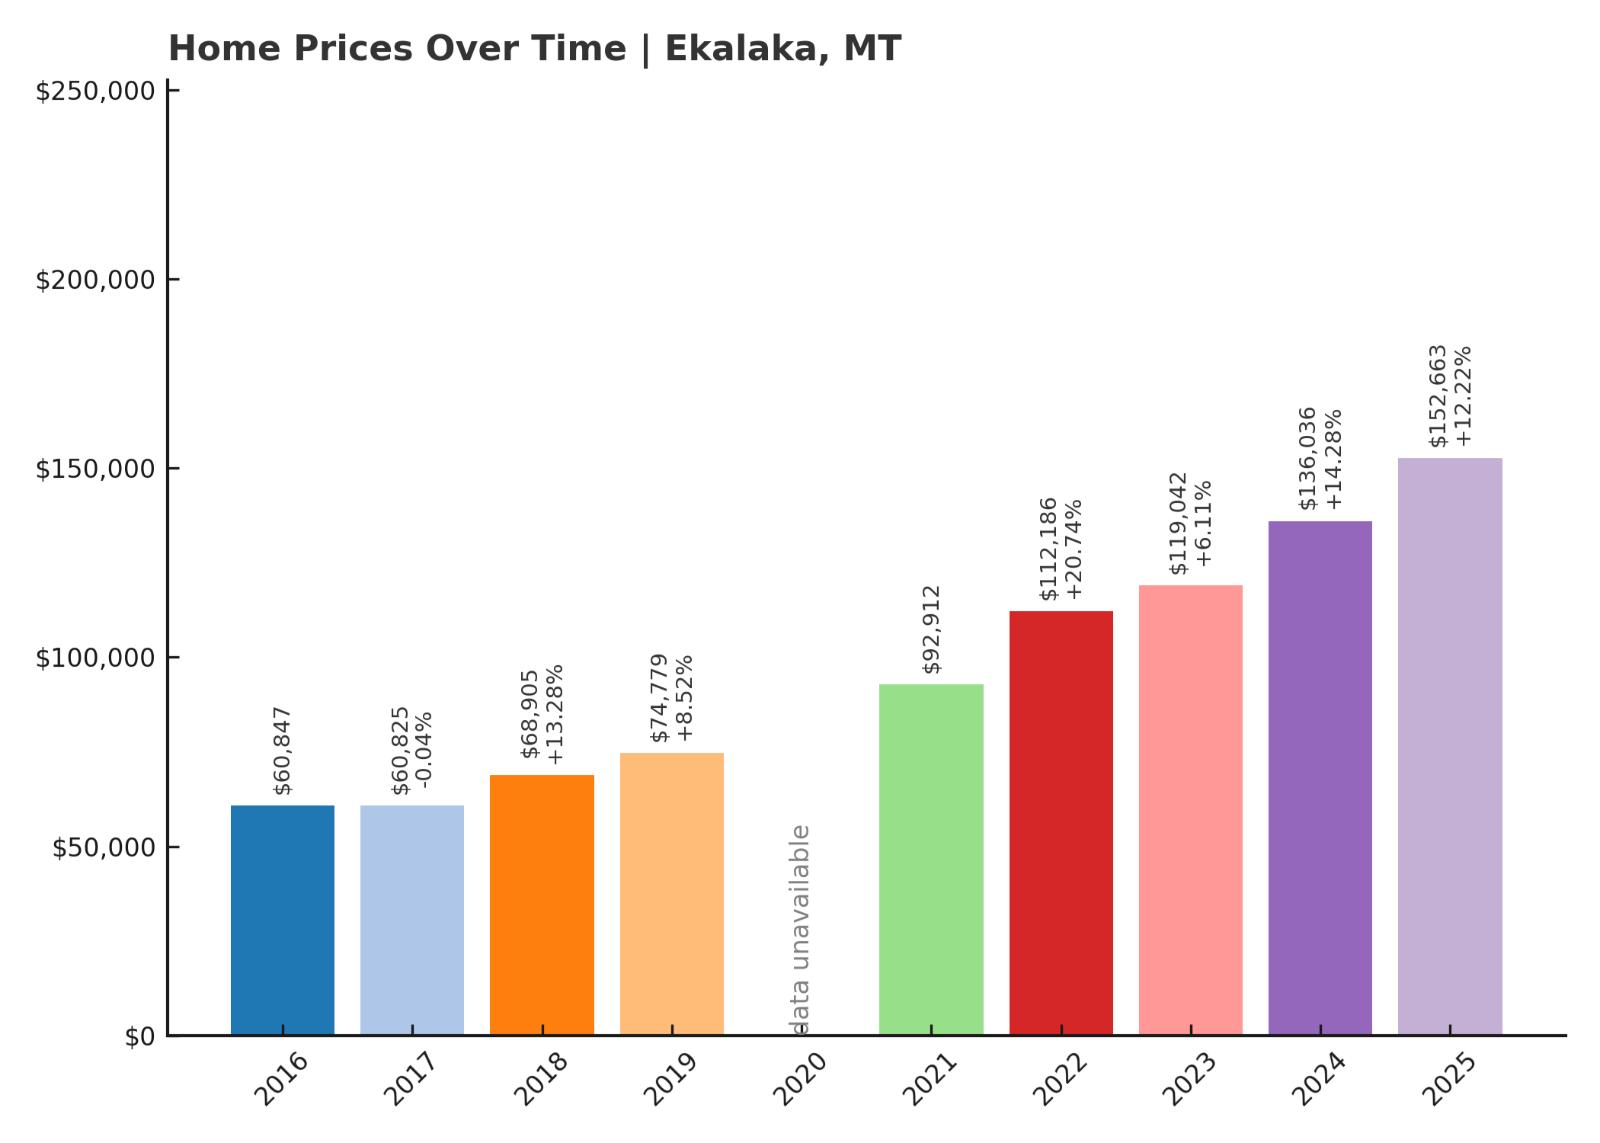
15. Ekalaka – 151% Home Price Increase Since 2016
- 2010: N/A
- 2011: N/A
- 2012: N/A
- 2013: N/A
- 2014: N/A
- 2015: N/A
- 2016: $60,847
- 2017: $60,825 (-$22, -0.04% from previous year)
- 2018: $68,905 (+$8,080, +13.28% from previous year)
- 2019: $74,779 (+$5,873, +8.52% from previous year)
- 2020: N/A
- 2021: $92,912
- 2022: $112,186 (+$19,274, +20.74% from previous year)
- 2023: $119,042 (+$6,856, +6.11% from previous year)
- 2024: $136,036 (+$16,995, +14.28% from previous year)
- 2025: $152,663 (+$16,627, +12.22% from previous year)
Home prices in Ekalaka have climbed from $60,847 in 2016 to $152,663 in 2025, showing a 151% increase. The most rapid growth occurred between 2021 and 2025, with particularly strong gains in 2022 and 2024. Prices have increased steadily in recent years, without any major drop. Earlier years showed modest growth, but momentum clearly picked up in the 2020s. With continued year-over-year increases, Ekalaka is now among the fastest appreciating markets in southeastern Montana. This reflects broader interest in small towns with affordable price points and space to grow.
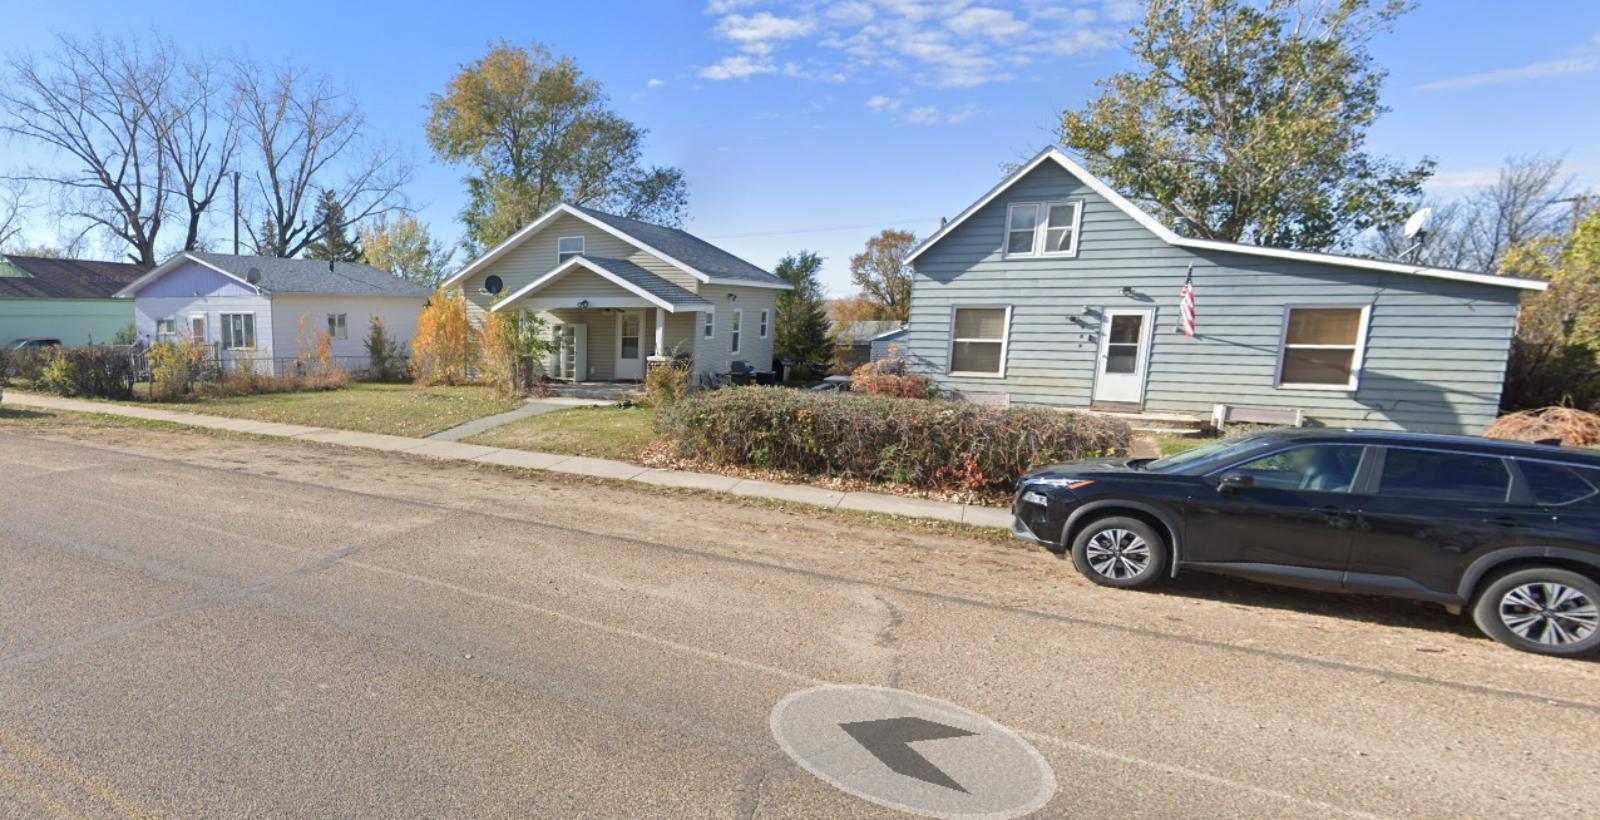
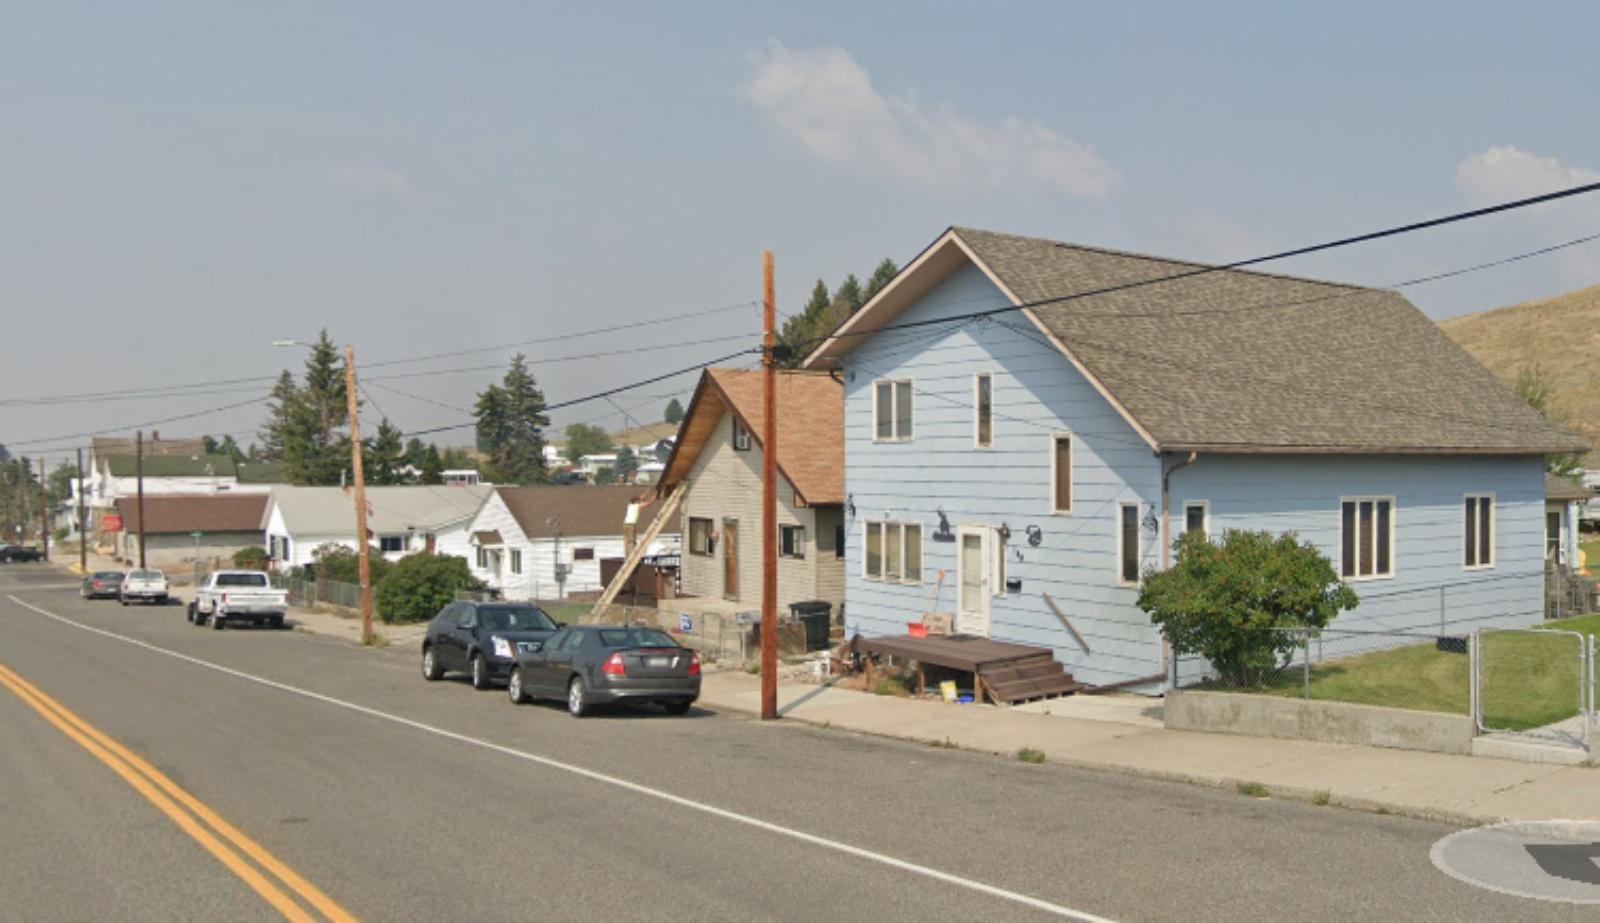
Ekalaka – Scenic Isolation and Steady Gains
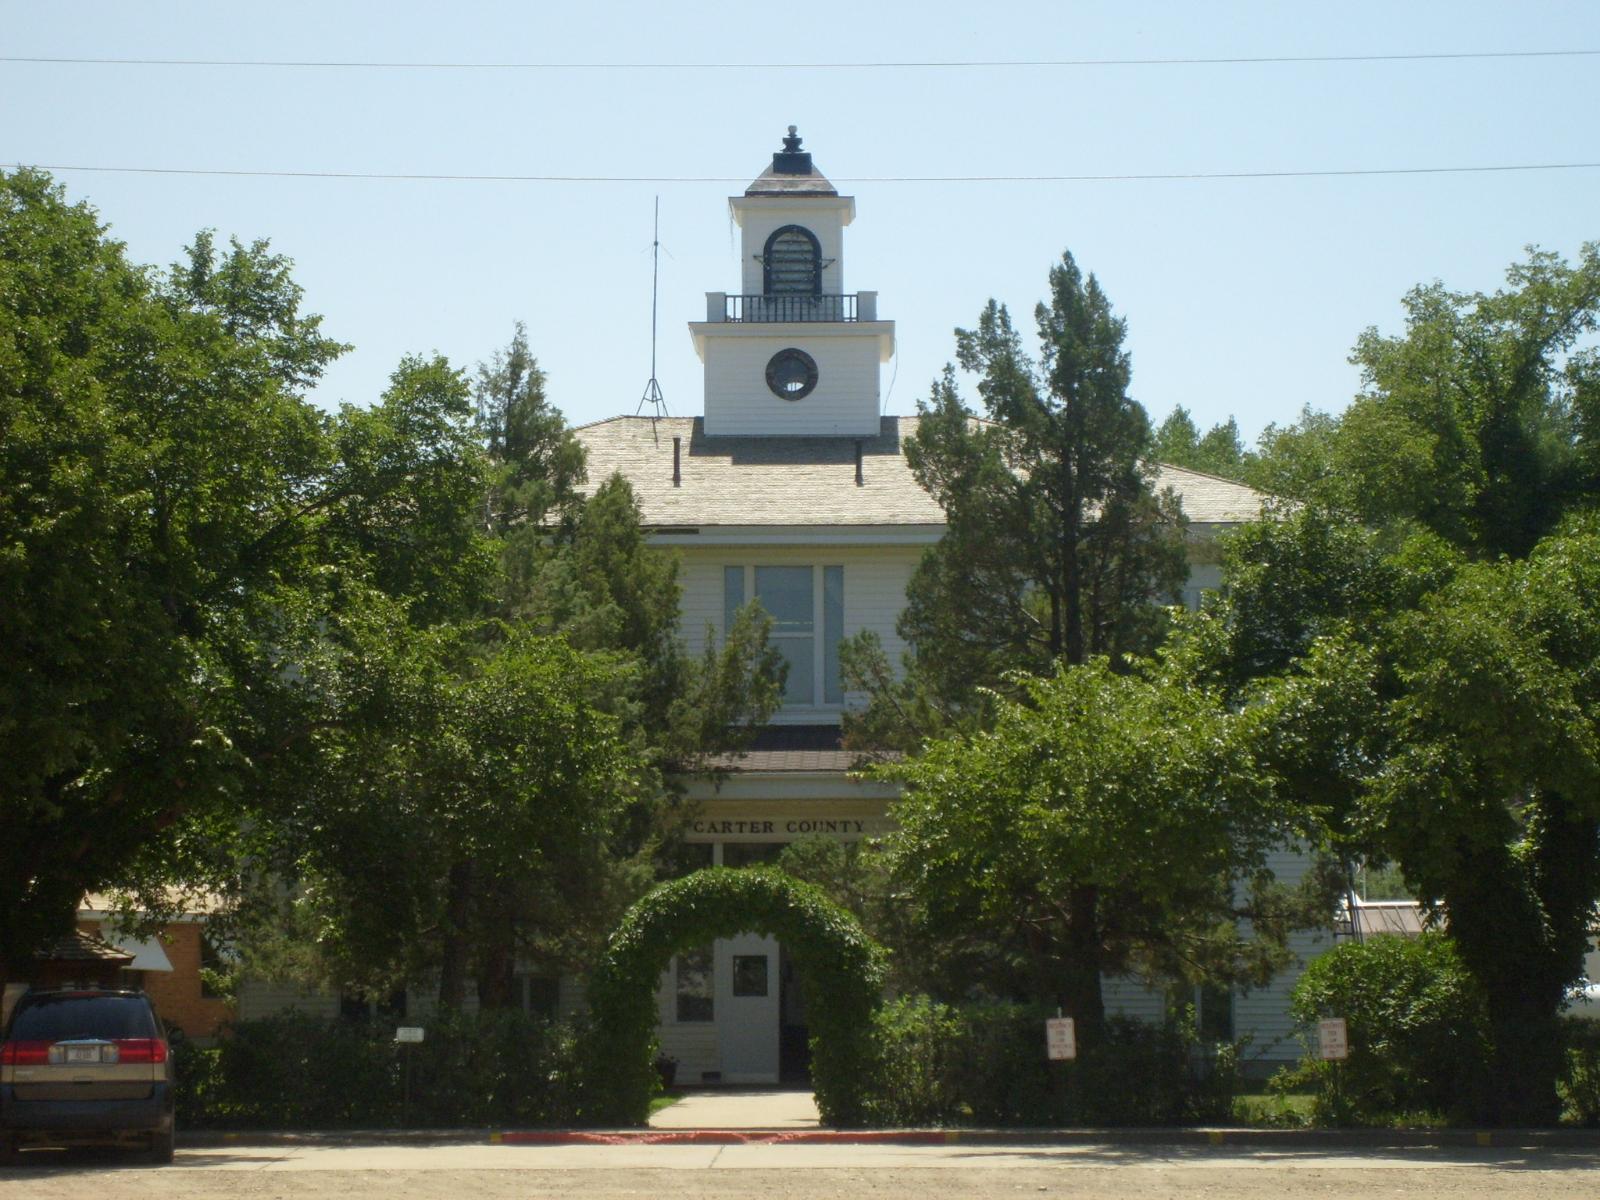
Ekalaka is a remote town in Carter County and serves as a gateway to the scenic badlands of southeastern Montana. It’s well known locally for its proximity to Medicine Rocks State Park and for offering some of the state’s most dramatic geological landscapes. Ekalaka’s small population and geographic isolation have historically kept property values low, but that is changing. Recent years have brought a wave of interest from buyers seeking privacy, natural beauty, and escape from urban pressures. Infrastructure improvements and better internet access may also be contributing to increased appeal. For those willing to trade convenience for space and serenity, Ekalaka is quickly becoming a serious consideration.
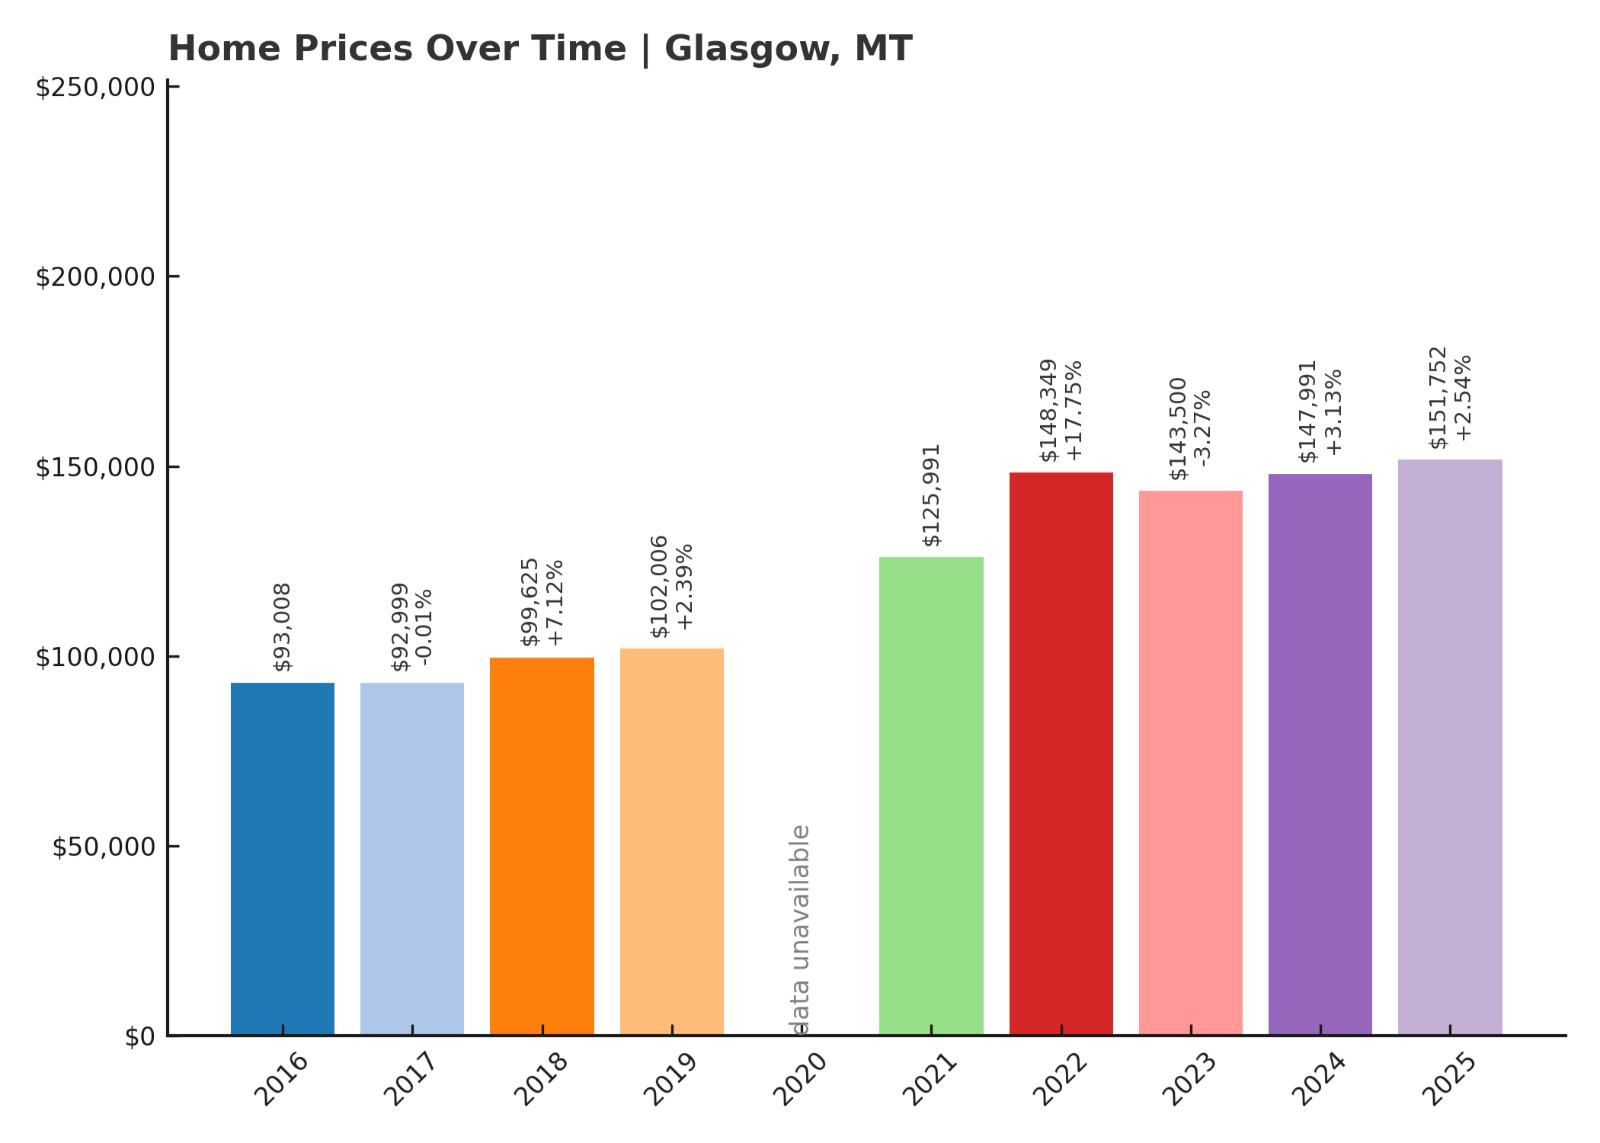
14. Glasgow – 63% Home Price Increase Since 2016
🔥 Would you like to save this?
- 2010: N/A
- 2011: N/A
- 2012: N/A
- 2013: N/A
- 2014: N/A
- 2015: N/A
- 2016: $93,008
- 2017: $92,999 (-$9, -0.01% from previous year)
- 2018: $99,625 (+$6,626, +7.12% from previous year)
- 2019: $102,006 (+$2,381, +2.39% from previous year)
- 2020: N/A
- 2021: $125,991
- 2022: $148,349 (+$22,359, +17.75% from previous year)
- 2023: $143,500 (-$4,849, -3.27% from previous year)
- 2024: $147,991 (+$4,491, +3.13% from previous year)
- 2025: $151,752 (+$3,761, +2.54% from previous year)
From 2016 to 2025, Glasgow home prices grew from $93,008 to $151,752, an increase of 63%. The strongest growth occurred between 2021 and 2022, with prices rising nearly 18% in a single year. While there was a brief decline in 2023, the overall trend remains positive. Price gains since 2024 have been modest but steady. Glasgow’s ability to sustain long-term growth highlights its position as a regional anchor town. Its size and services make it more stable than many smaller Montana communities.
Glasgow – A Regional Hub With Room to Grow
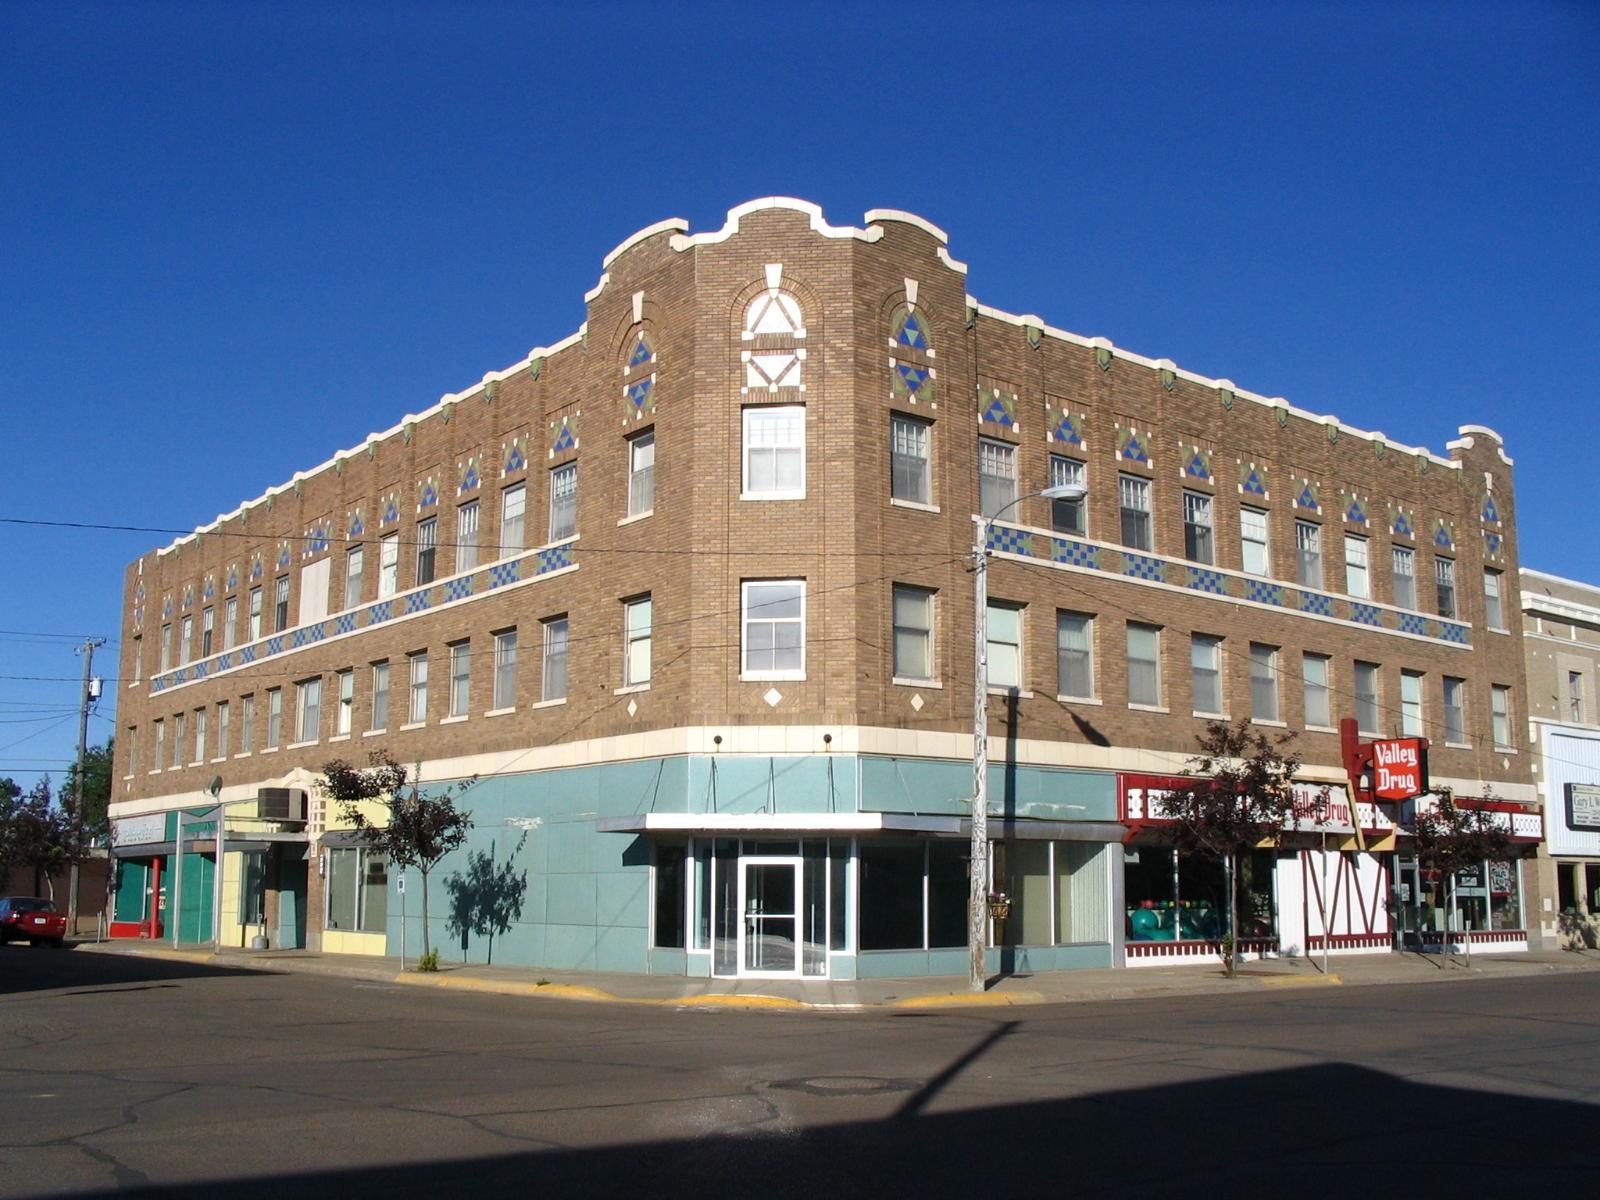
Glasgow is located in northeastern Montana and serves as a commercial center for the surrounding rural counties. With a hospital, schools, an airport, and a range of shops and services, it plays an outsized role in an otherwise sparsely populated region. Its real estate market has benefited from that centrality, drawing both residents and investors looking for a reliable, mid-sized market. The town is also near Fort Peck Lake and the Missouri River, offering outdoor activities that add to its appeal. Glasgow’s housing market is less volatile than smaller rural towns, but its steady climb in home values shows growing confidence in the area. As rural Montana continues to attract interest, Glasgow offers a balance of stability and upside potential.
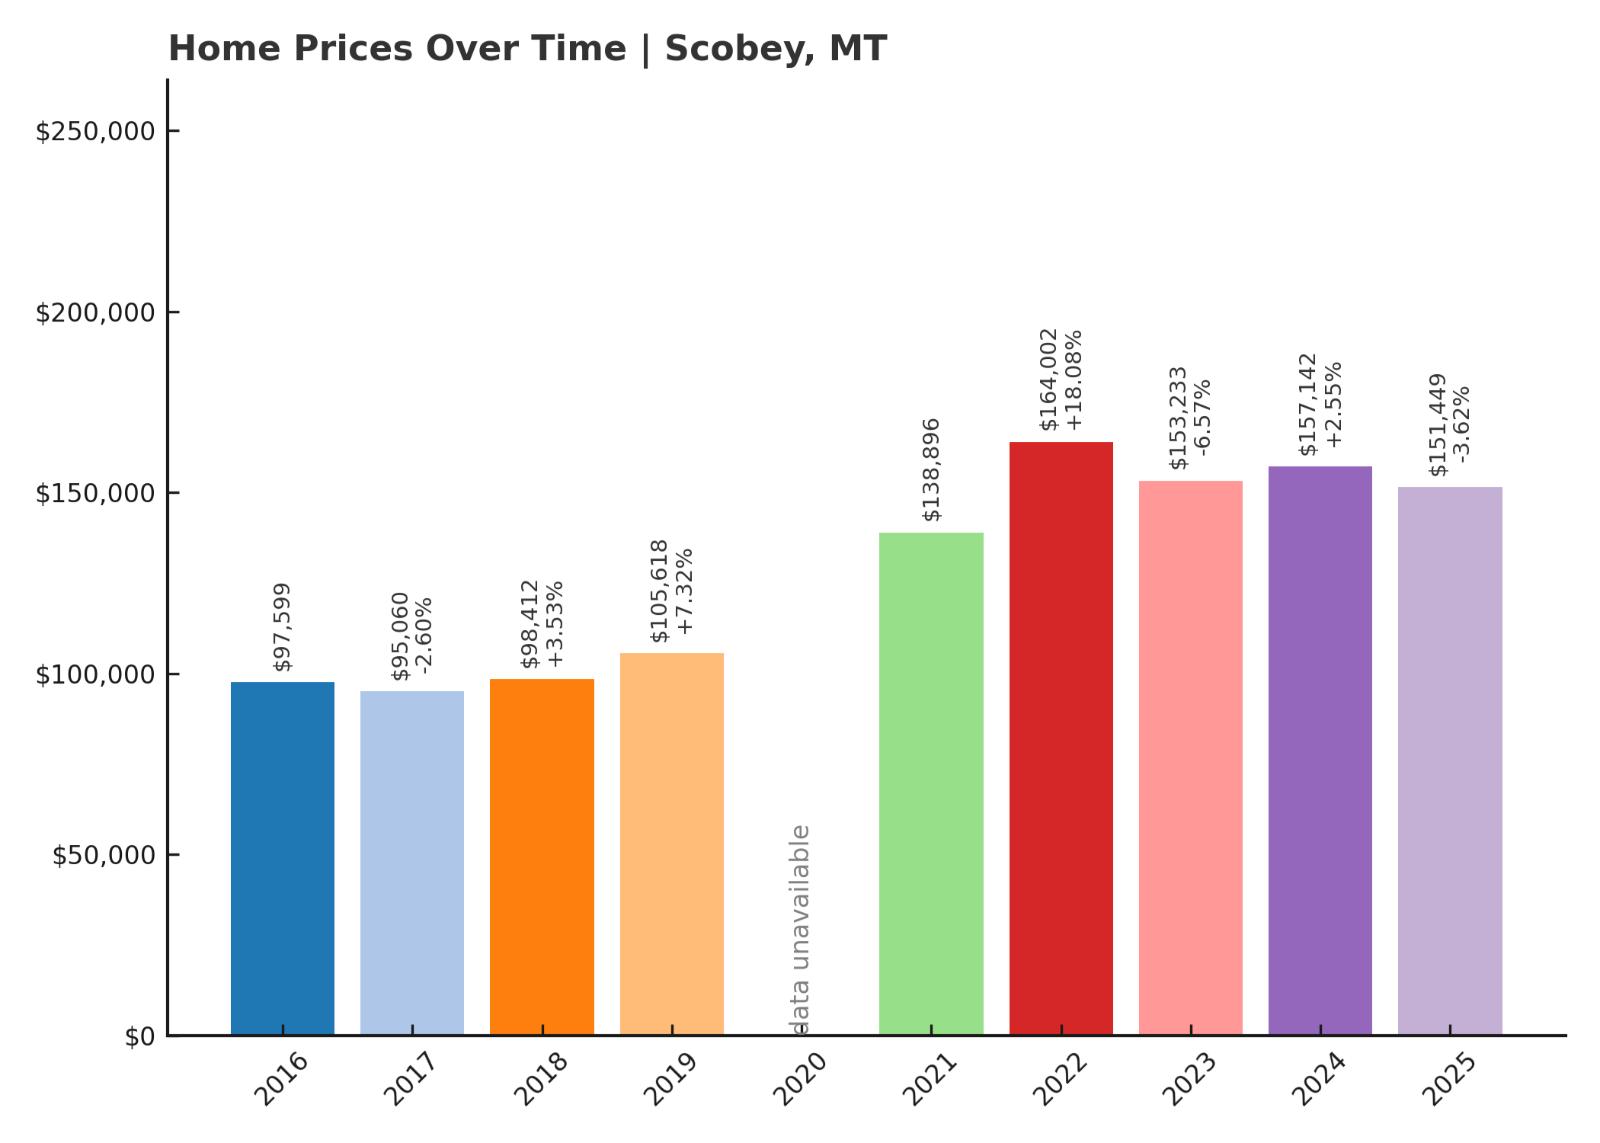
13. Scobey – 55% Home Price Increase Since 2016
- 2010: N/A
- 2011: N/A
- 2012: N/A
- 2013: N/A
- 2014: N/A
- 2015: N/A
- 2016: $97,599
- 2017: $95,060 (-$2,539, -2.60% from previous year)
- 2018: $98,412 (+$3,351, +3.53% from previous year)
- 2019: $105,618 (+$7,206, +7.32% from previous year)
- 2020: N/A
- 2021: $138,896
- 2022: $164,002 (+$25,106, +18.08% from previous year)
- 2023: $153,233 (-$10,769, -6.57% from previous year)
- 2024: $157,142 (+$3,910, +2.55% from previous year)
- 2025: $151,449 (-$5,693, -3.62% from previous year)
Scobey’s home values rose from $97,599 in 2016 to $151,449 in 2025, a 55% gain. The sharpest jump came between 2020 and 2022, as prices jumped by more than $25,000 in one year. Values have declined slightly since then, but the long-term trend remains positive. Year-to-year swings suggest a market influenced by low inventory and seasonal demand. Even with recent volatility, prices remain well above their pre-2021 levels. Scobey’s appreciation over the decade places it firmly in the state’s top risers.
Scobey – Far East Montana With Surprising Momentum

Scobey is a remote town in Daniels County, close to the Canadian border and surrounded by farmland. Its isolation hasn’t stopped home values from climbing, especially as rural properties gained favor during the pandemic. Scobey offers basic amenities and a small-town atmosphere, which appeals to buyers seeking peace and simplicity. Limited housing stock and a tight-knit community may be helping sustain price levels. The fluctuations of the past few years suggest a market with low turnover and high sensitivity to even small shifts in demand. For buyers looking east of the usual Montana hotspots, Scobey is gaining quiet traction.
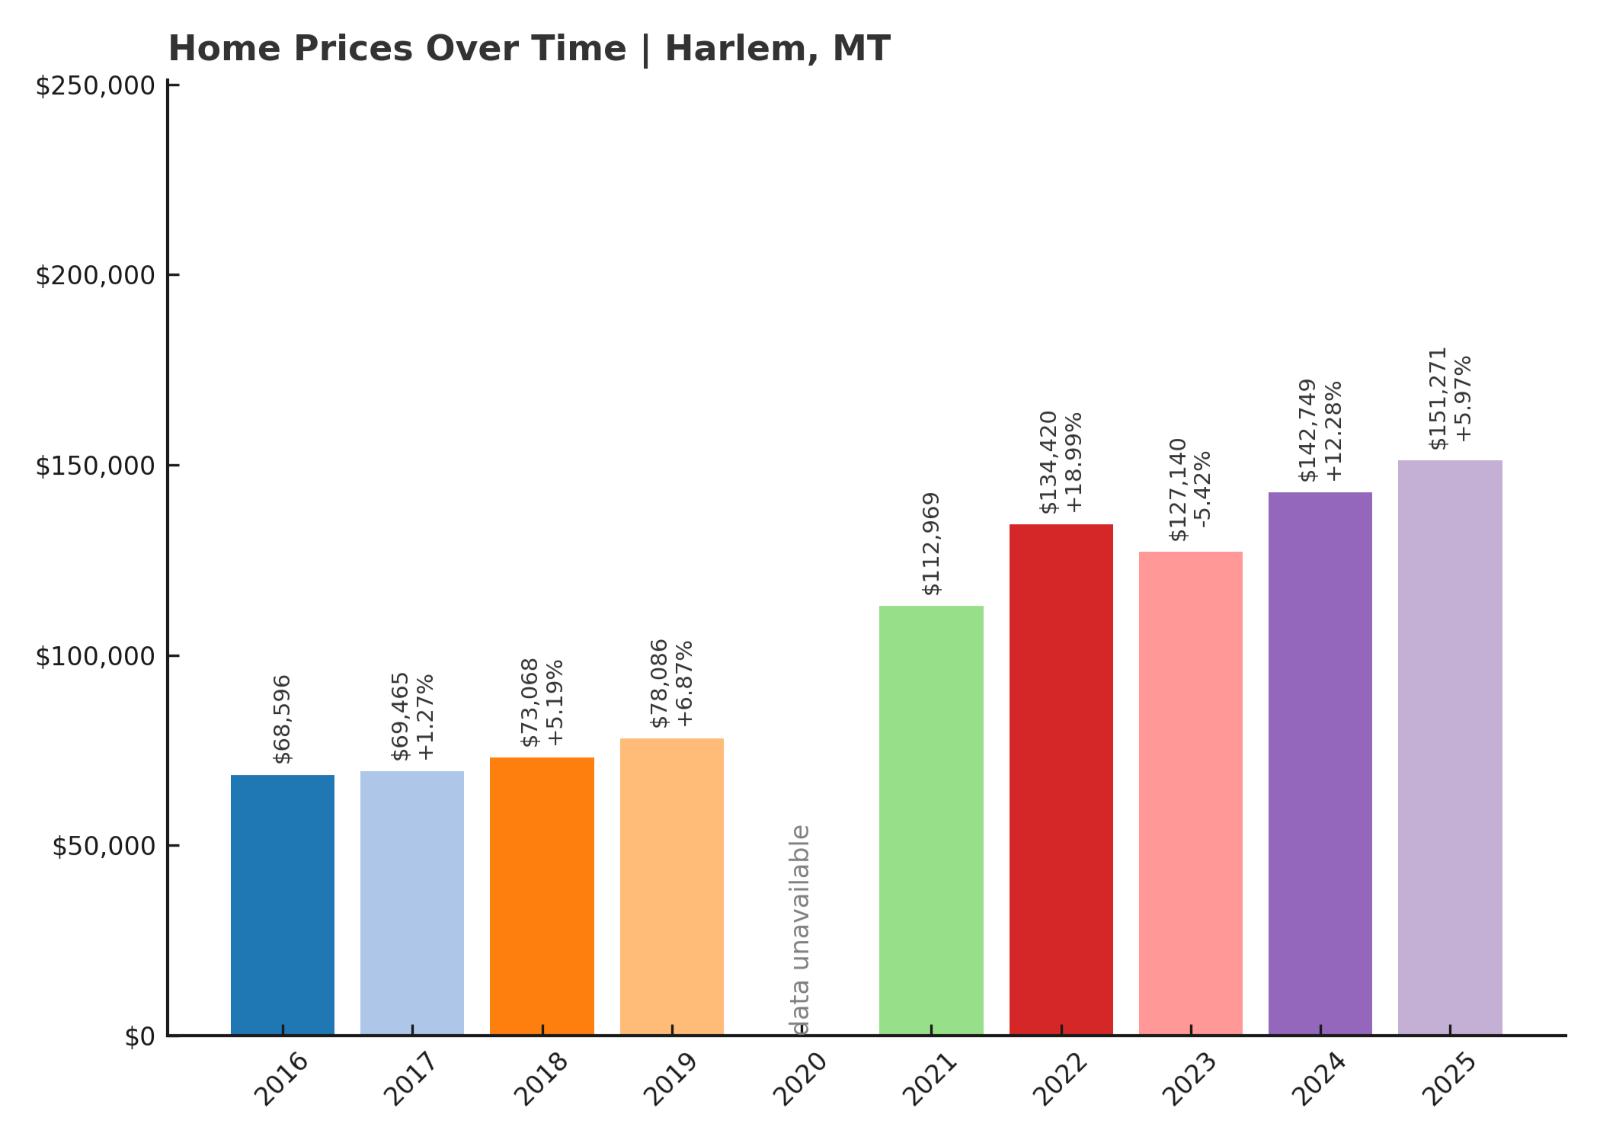
12. Harlem – 120% Home Price Increase Since 2016
- 2010: N/A
- 2011: N/A
- 2012: N/A
- 2013: N/A
- 2014: N/A
- 2015: N/A
- 2016: $68,596
- 2017: $69,465 (+$869, +1.27% from previous year)
- 2018: $73,068 (+$3,604, +5.19% from previous year)
- 2019: $78,086 (+$5,018, +6.87% from previous year)
- 2020: N/A
- 2021: $112,969
- 2022: $134,420 (+$21,451, +18.99% from previous year)
- 2023: $127,140 (-$7,280, -5.42% from previous year)
- 2024: $142,749 (+$15,609, +12.28% from previous year)
- 2025: $151,271 (+$8,522, +5.97% from previous year)
Home prices in Harlem more than doubled from $68,596 in 2016 to $151,271 in 2025, an increase of 120%. While growth was steady in the late 2010s, the most dramatic jump came between 2020 and 2022. Prices temporarily dipped in 2023 but rebounded strongly in 2024 and 2025. This pattern suggests market resilience after short-term volatility. Demand for affordable rural housing has likely contributed to the town’s rise. Harlem’s housing market now stands among the most improved in north-central Montana.
Harlem – Steady Growth in a Small Railroad Town
Harlem is located in Blaine County, just south of the Fort Belknap Indian Reservation and along U.S. Route 2. Historically a railroad town, Harlem remains small but serves as a local hub for farming communities in the region. Its proximity to tribal lands gives it cultural significance, and recent investments in nearby areas may be drawing new interest. Residents enjoy access to basic services like schools, healthcare, and a library, which adds to the town’s stability. As urban buyers seek lower costs, towns like Harlem offer value without giving up essential infrastructure. With home prices still under the state average, it remains an attractive option for first-time buyers and retirees alike.
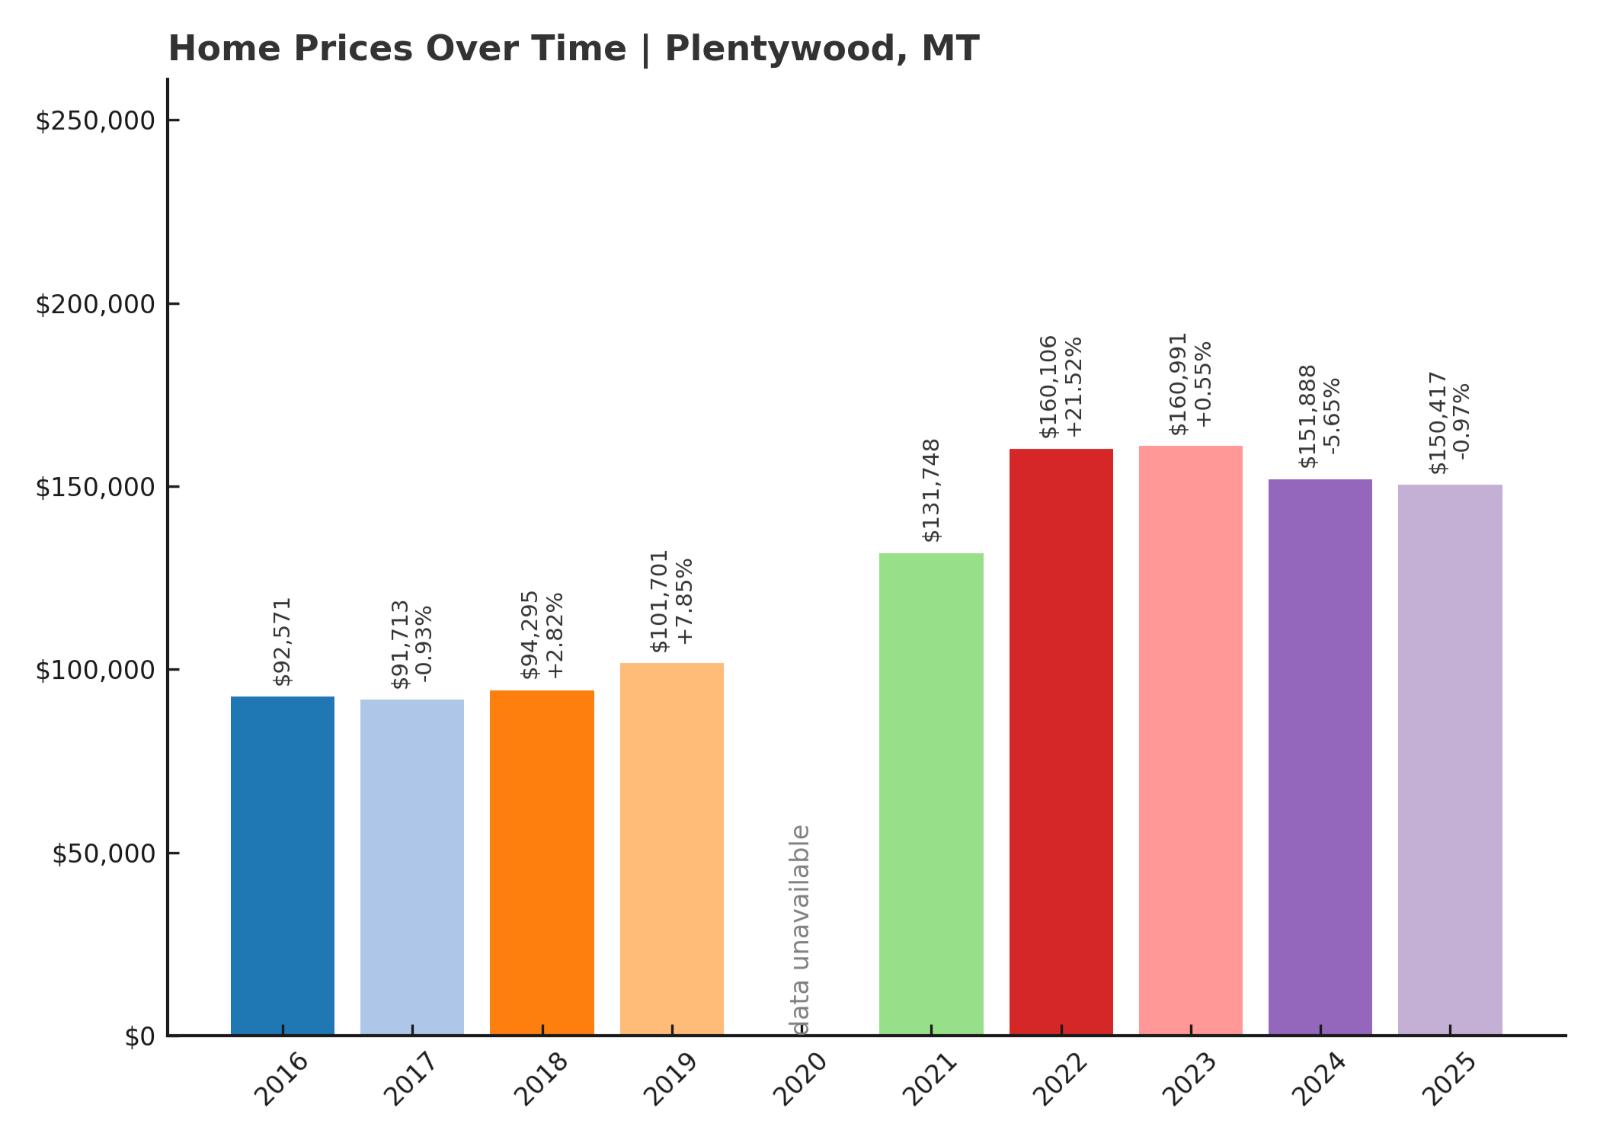
11. Plentywood – 62% Home Price Increase Since 2016
- 2010: N/A
- 2011: N/A
- 2012: N/A
- 2013: N/A
- 2014: N/A
- 2015: N/A
- 2016: $92,571
- 2017: $91,713 (-$858, -0.93% from previous year)
- 2018: $94,295 (+$2,583, +2.82% from previous year)
- 2019: $101,701 (+$7,406, +7.85% from previous year)
- 2020: N/A
- 2021: $131,748
- 2022: $160,106 (+$28,358, +21.52% from previous year)
- 2023: $160,991 (+$885, +0.55% from previous year)
- 2024: $151,888 (-$9,103, -5.65% from previous year)
- 2025: $150,417 (-$1,471, -0.97% from previous year)
Plentywood’s home values have grown from $92,571 in 2016 to $150,417 in 2025, marking a 62% increase. The most dramatic jump came in 2022, with prices rising more than 21% year-over-year. While prices have cooled slightly since then, the broader trend remains positive. Price stability in 2023 followed by a minor dip suggests a correction rather than a crash. Overall, Plentywood has posted consistent gains with relatively few wild swings. It’s now one of northeast Montana’s most valuable small-town markets.
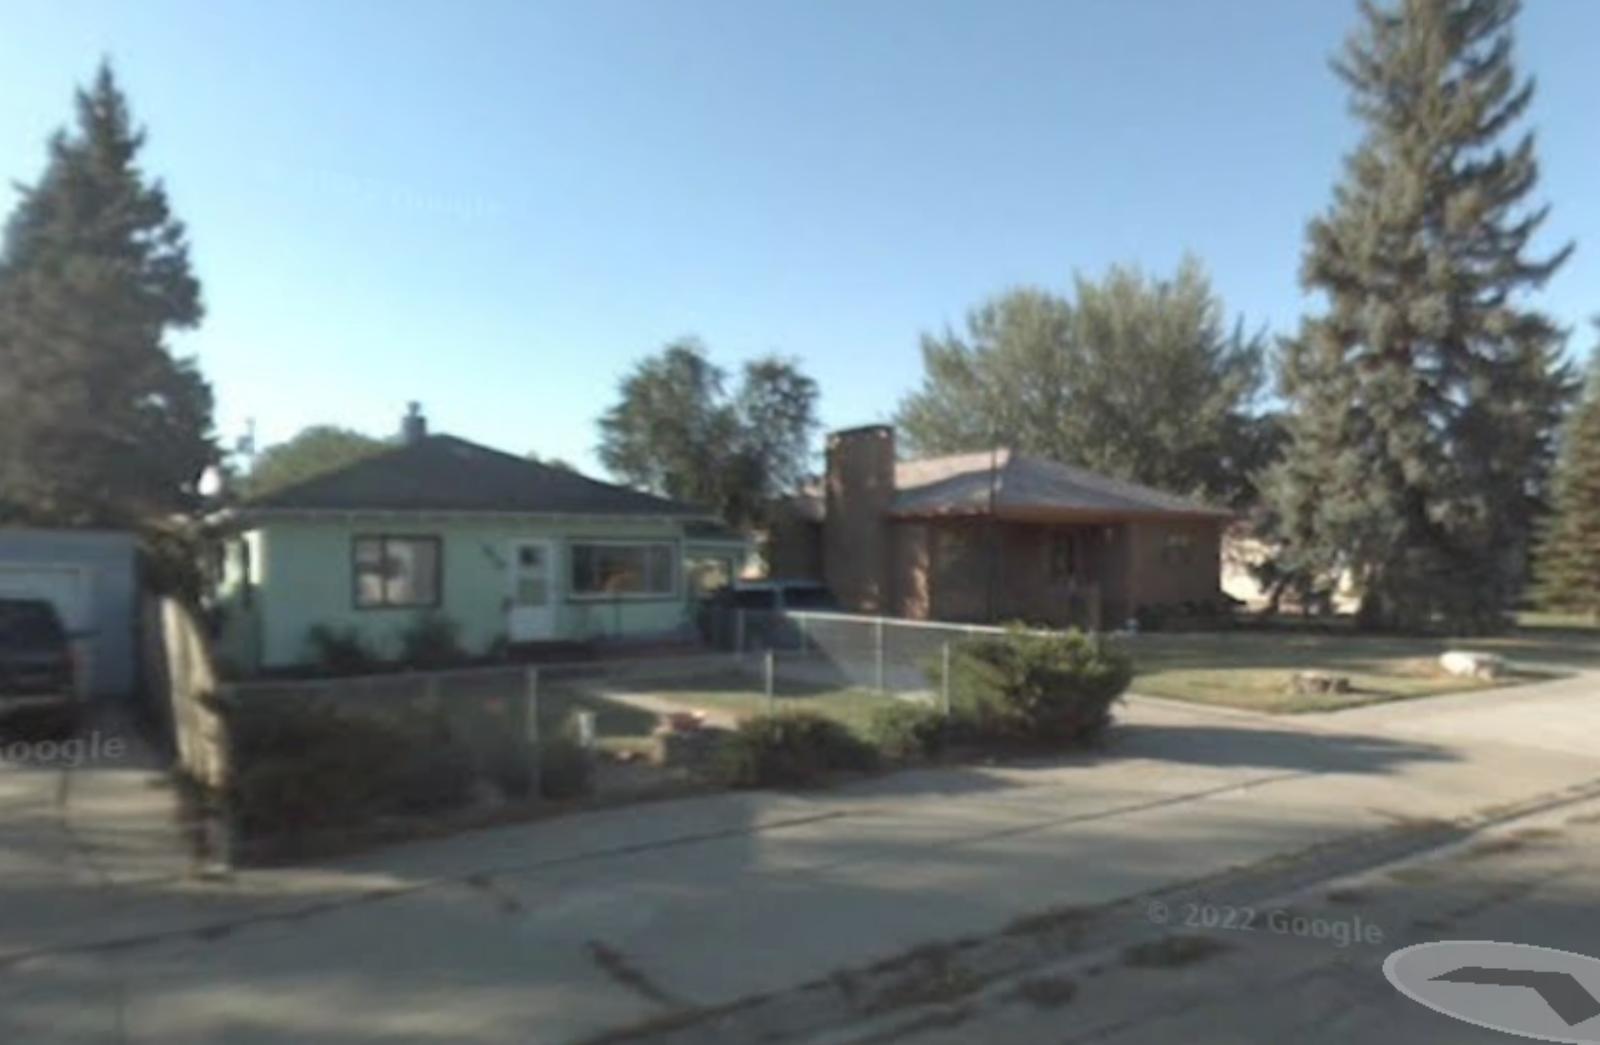
Plentywood – Oilfield Access and Market Appeal
Located in Sheridan County near the Canadian border, Plentywood is a service center for farming and oilfield activity in northeast Montana. The town is larger than many of its neighbors and offers amenities like a hospital, schools, and a small airport. Its strategic position near the Bakken oil region likely explains some of the housing demand. While energy markets fluctuate, the demand for worker housing and investment properties has remained steady. Additionally, Plentywood has benefitted from being one of the few places in the region with housing availability and basic infrastructure. As demand for housing remains strong in nearby oil towns, Plentywood continues to attract buyers priced out of more volatile markets.
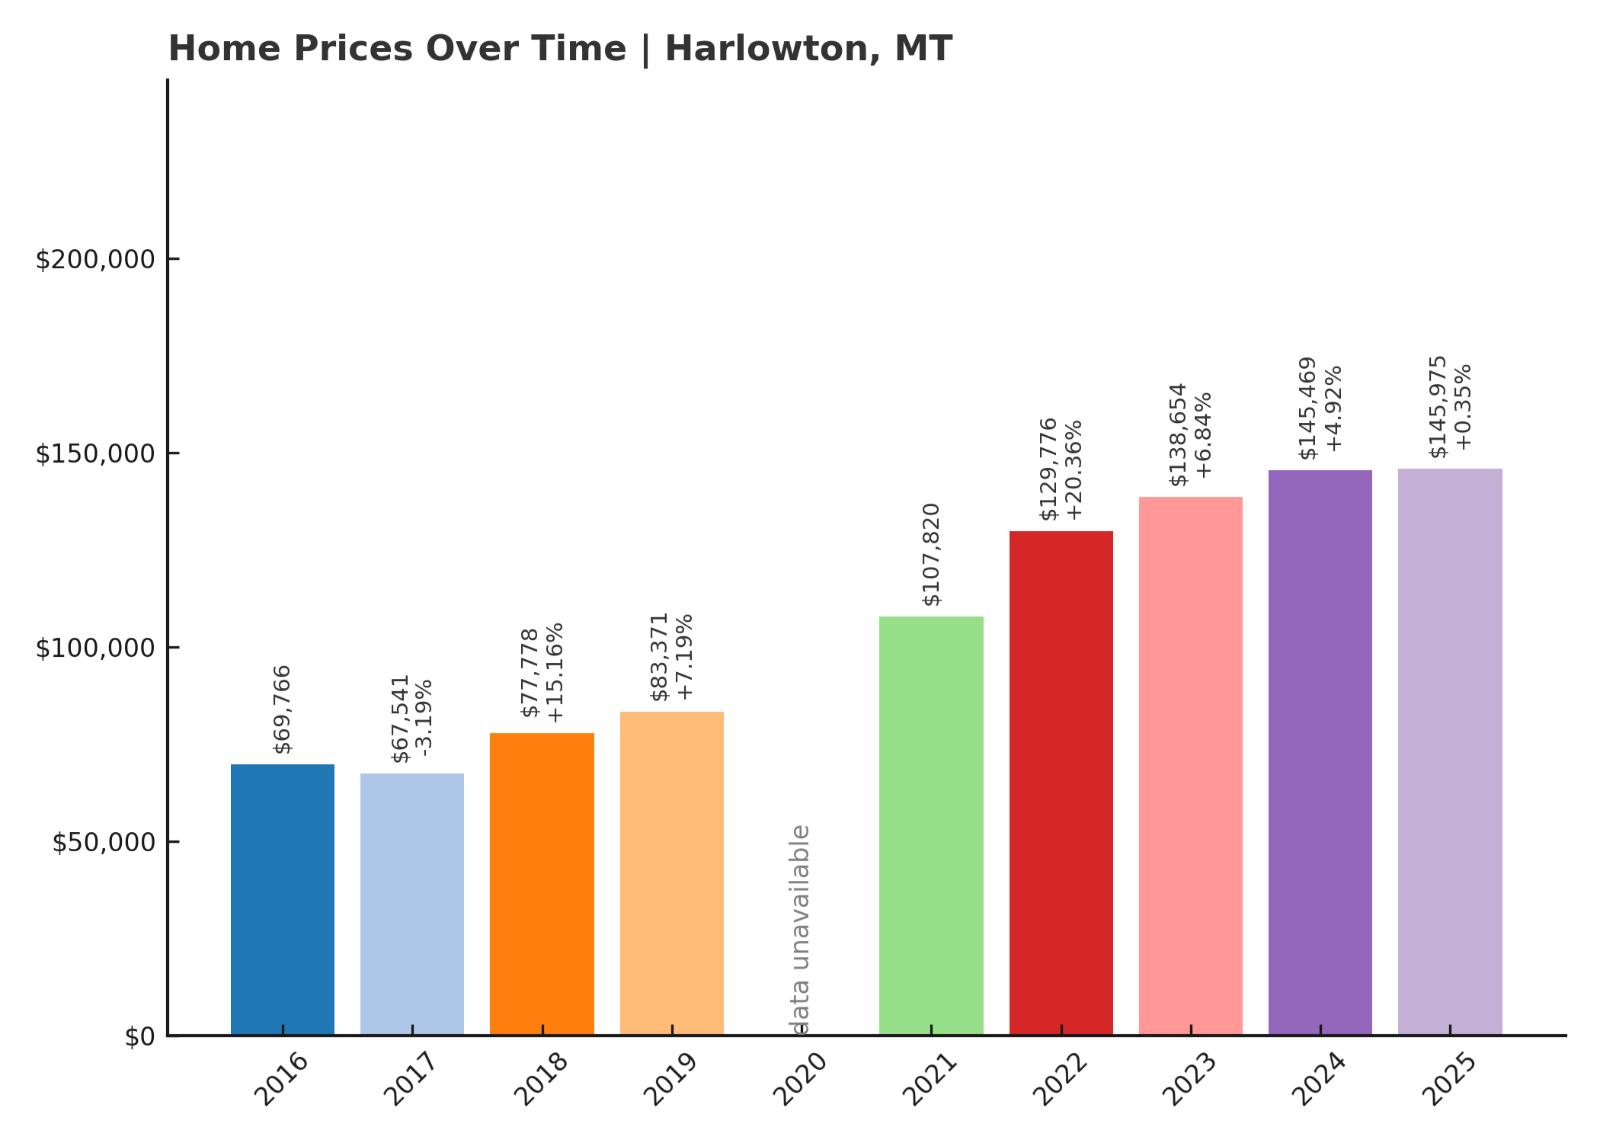
10. Harlowton – 110% Home Price Increase Since 2016
- 2010: N/A
- 2011: N/A
- 2012: N/A
- 2013: N/A
- 2014: N/A
- 2015: N/A
- 2016: $69,766
- 2017: $67,541 (-$2,225, -3.19% from previous year)
- 2018: $77,778 (+$10,237, +15.16% from previous year)
- 2019: $83,371 (+$5,593, +7.19% from previous year)
- 2020: N/A
- 2021: $107,820
- 2022: $129,776 (+$21,956, +20.36% from previous year)
- 2023: $138,654 (+$8,878, +6.84% from previous year)
- 2024: $145,469 (+$6,816, +4.92% from previous year)
- 2025: $145,975 (+$506, +0.35% from previous year)
Home prices in Harlowton grew from $69,766 in 2016 to $145,975 in 2025, a 110% increase. The sharpest price jump came between 2020 and 2022, where the market gained more than $21,000 in a year. Growth continued at a slower pace after 2022, but the overall upward trend remained intact. The housing market appears to be stabilizing as values in 2025 showed little movement. With prices now more than doubling over nine years, Harlowton has become one of central Montana’s rising housing markets. Its trajectory reflects both local demand and regional interest in affordable real estate.
Harlowton – Affordable Living With Scenic Backdrops

Harlowton is located in Wheatland County and sits along the Musselshell River, offering a mix of prairie landscapes and small-town charm. It’s historically known as a railway junction and has gradually evolved into a residential base for those seeking affordability within a rural setting. The town offers basic amenities, schools, and easy access to recreational opportunities in nearby mountain ranges. Its real estate has long been undervalued, which may explain the recent surge in buyer activity. For people relocating from higher-cost areas, Harlowton presents a compelling value proposition. With modest price increases continuing, the market remains attractive for long-term homeowners and investors alike.
9. Richey – 73% Home Price Increase Since 2016
- 2010: N/A
- 2011: N/A
- 2012: N/A
- 2013: N/A
- 2014: N/A
- 2015: N/A
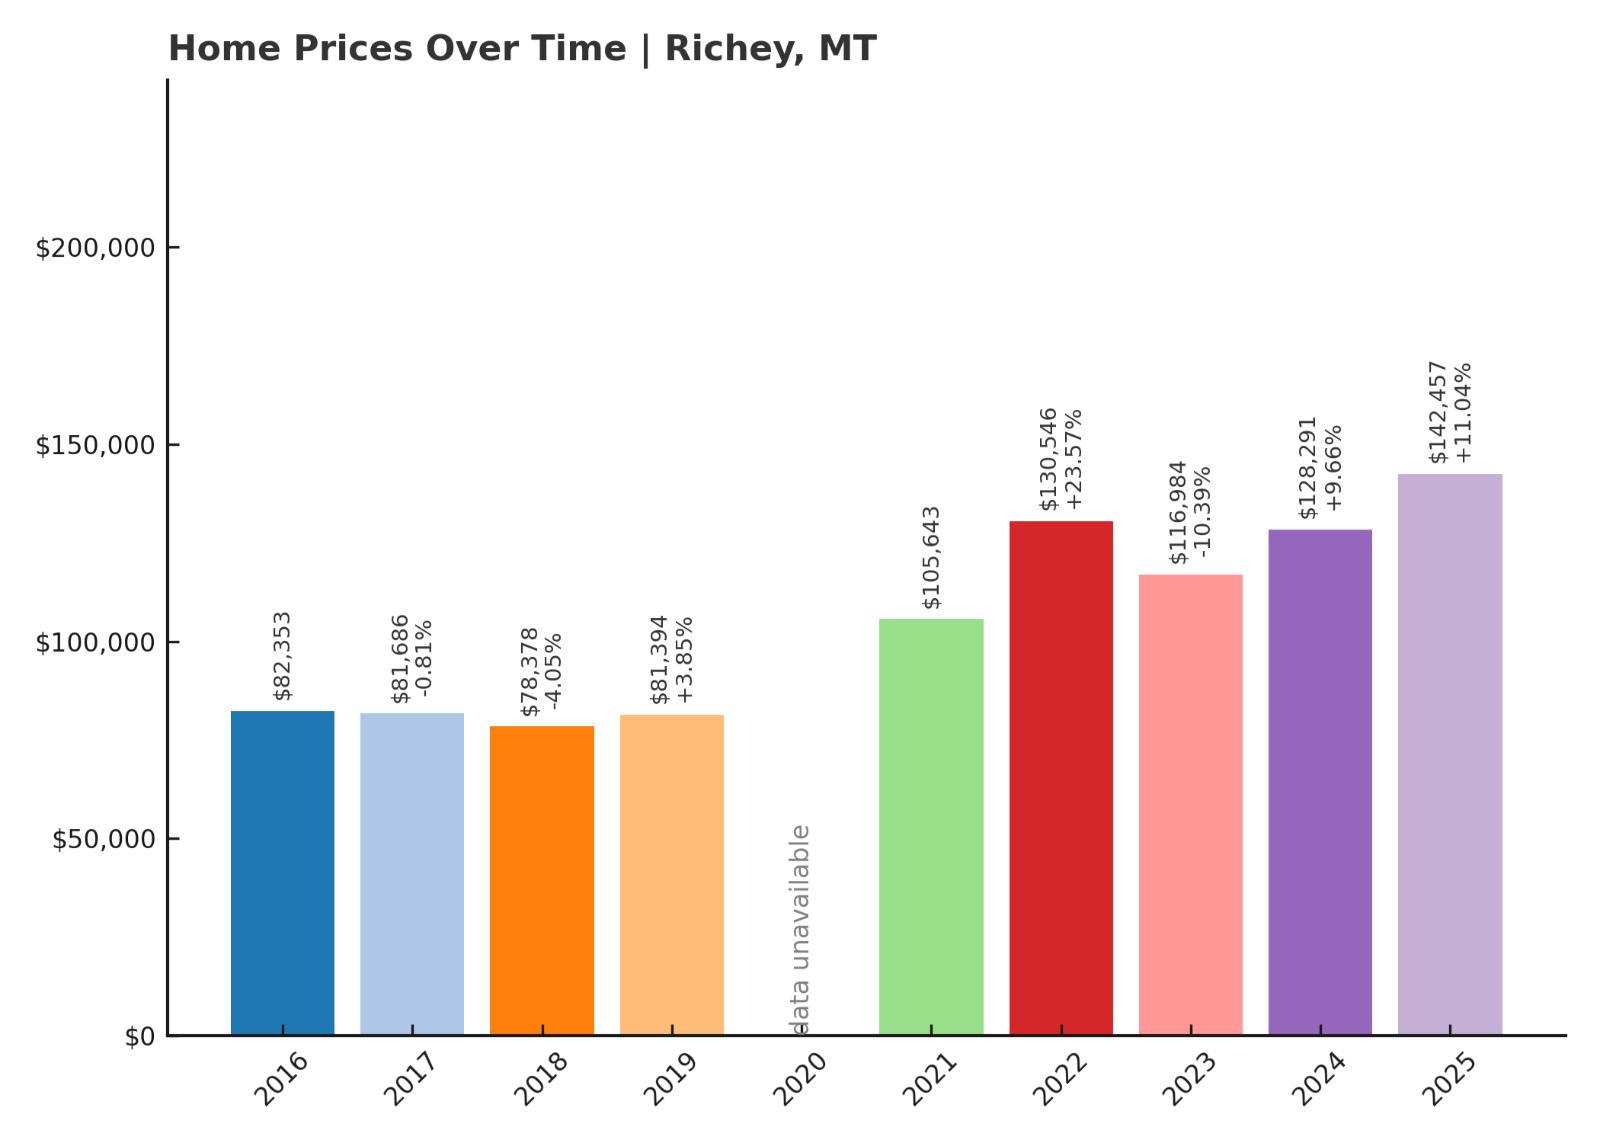
- 2016: $82,353
- 2017: $81,686 (-$666, -0.81% from previous year)
- 2018: $78,378 (-$3,308, -4.05% from previous year)
- 2019: $81,394 (+$3,015, +3.85% from previous year)
- 2020: N/A
- 2021: $105,643
- 2022: $130,546 (+$24,903, +23.57% from previous year)
- 2023: $116,984 (-$13,562, -10.39% from previous year)
- 2024: $128,291 (+$11,306, +9.66% from previous year)
- 2025: $142,457 (+$14,167, +11.04% from previous year)
Richey’s home prices increased from $82,353 in 2016 to $142,457 in 2025, marking a 73% rise. After an early decline, prices turned around starting in 2019 and have been climbing steadily since 2021. The biggest gain came in 2022, with over 23% growth in a single year. Although 2023 saw a drop, the market quickly recovered with double-digit gains in 2024 and 2025. These trends suggest strong demand and tight inventory. Richey’s market now reflects the broader interest in affordable, rural Montana towns.
Richey – Quiet Plains, Solid Returns
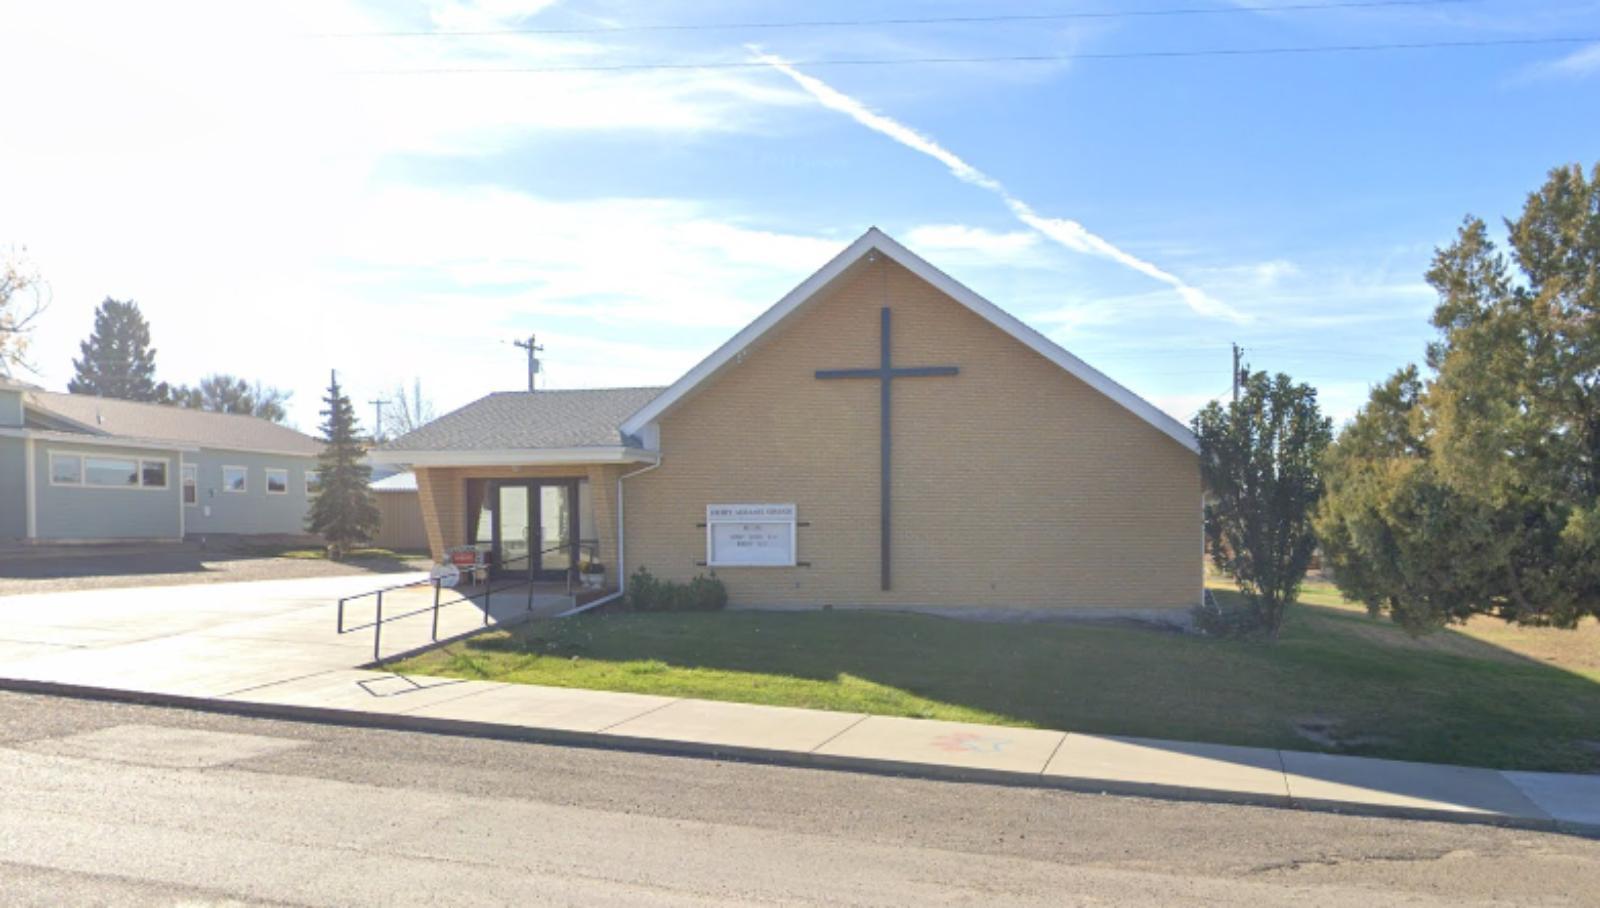
Located in Dawson County, Richey is a small agricultural community surrounded by wheat fields and wide-open prairie. Its remote setting and tight-knit population make it a peaceful place to live, which is increasingly valued by people leaving crowded urban centers. There’s limited housing stock, so even a few sales can cause noticeable shifts in the market. The 2022 surge likely reflects both regional interest and a lack of available listings. With its proximity to Sidney and connections to Montana’s oil and farming economy, Richey is better positioned than many towns its size. The steady recovery since 2023 shows confidence hasn’t waned, even amid temporary price dips.
8. Lodge Grass – 85% Home Price Increase Since 2016
🔥 Would you like to save this?
- 2010: N/A
- 2011: N/A
- 2012: N/A
- 2013: N/A
- 2014: N/A
- 2015: N/A
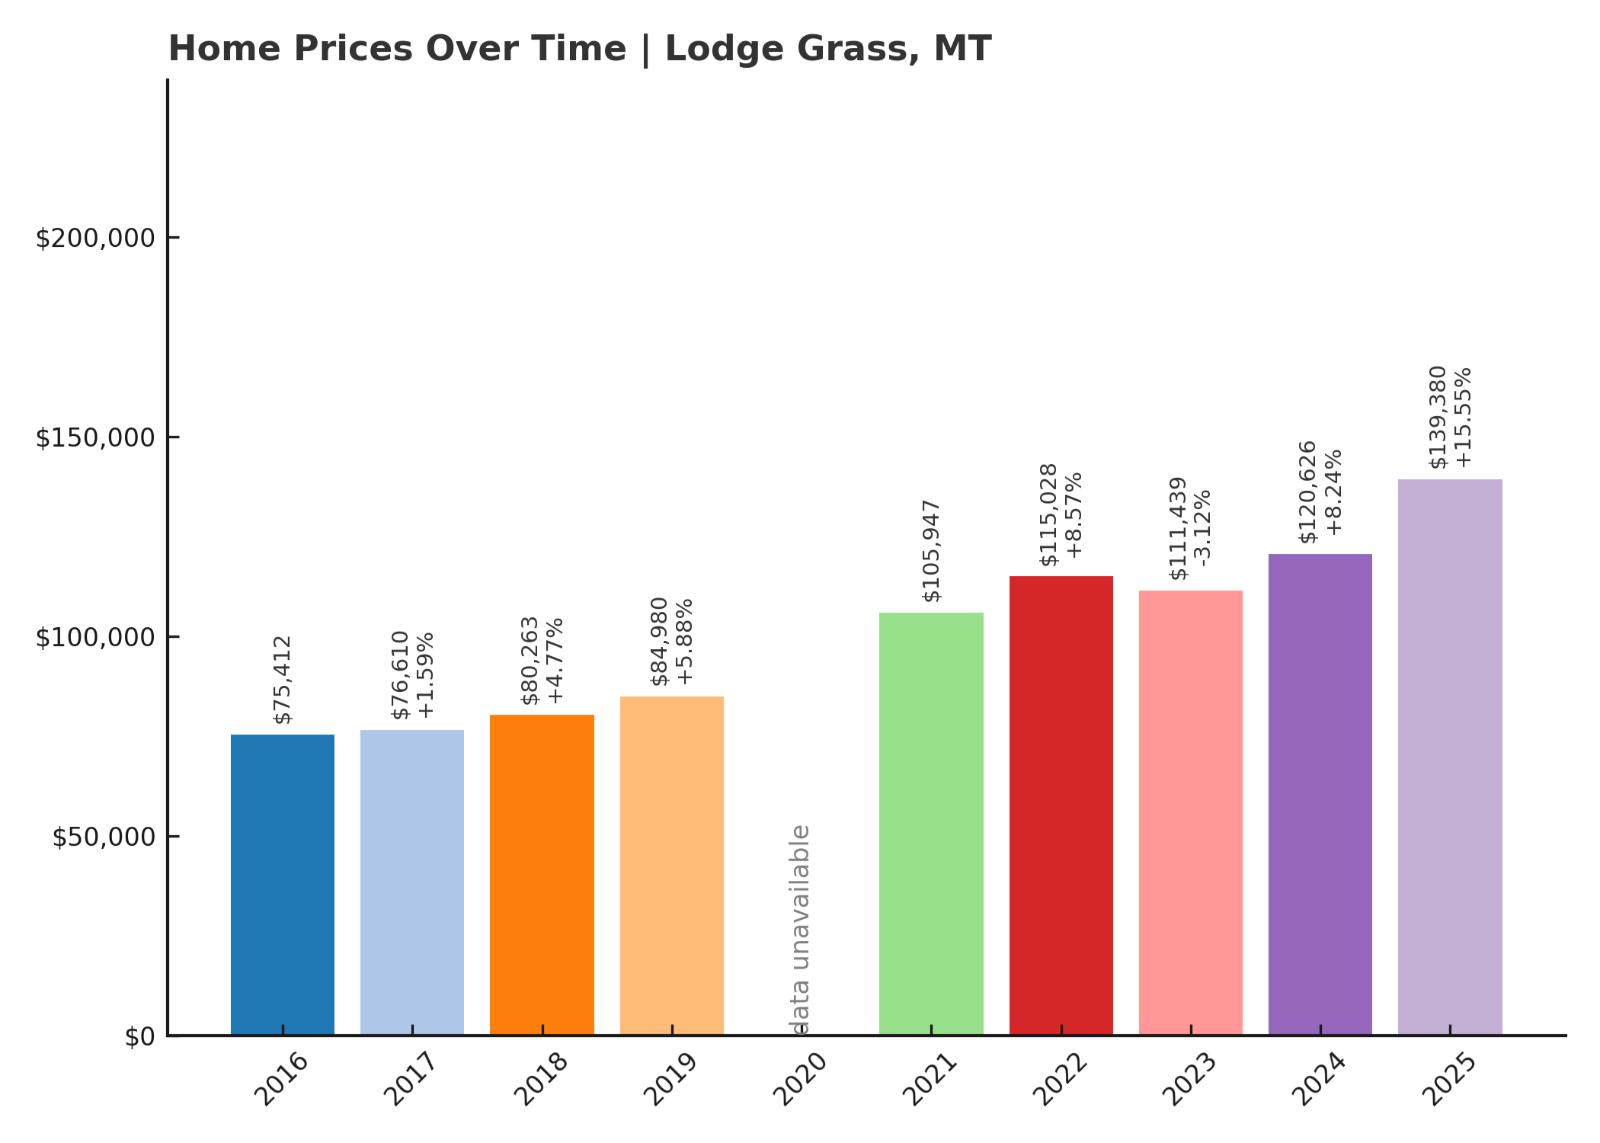
- 2016: $75,412
- 2017: $76,610 (+$1,198, +1.59% from previous year)
- 2018: $80,263 (+$3,653, +4.77% from previous year)
- 2019: $84,980 (+$4,717, +5.88% from previous year)
- 2020: N/A
- 2021: $105,947
- 2022: $115,028 (+$9,081, +8.57% from previous year)
- 2023: $111,439 (-$3,589, -3.12% from previous year)
- 2024: $120,626 (+$9,187, +8.24% from previous year)
- 2025: $139,380 (+$18,754, +15.55% from previous year)
Home prices in Lodge Grass jumped from $75,412 in 2016 to $139,380 in 2025—an 85% increase. Growth was consistent through 2019 and accelerated significantly after 2021. A small dip in 2023 was quickly reversed by strong gains the following two years. In 2025 alone, home values grew more than 15%, showing renewed interest in the area. Despite its small size, Lodge Grass has become one of Big Horn County’s most active markets. Its pricing trends indicate increased buyer demand and limited housing supply.
Lodge Grass – Crow Country With Rising Demand
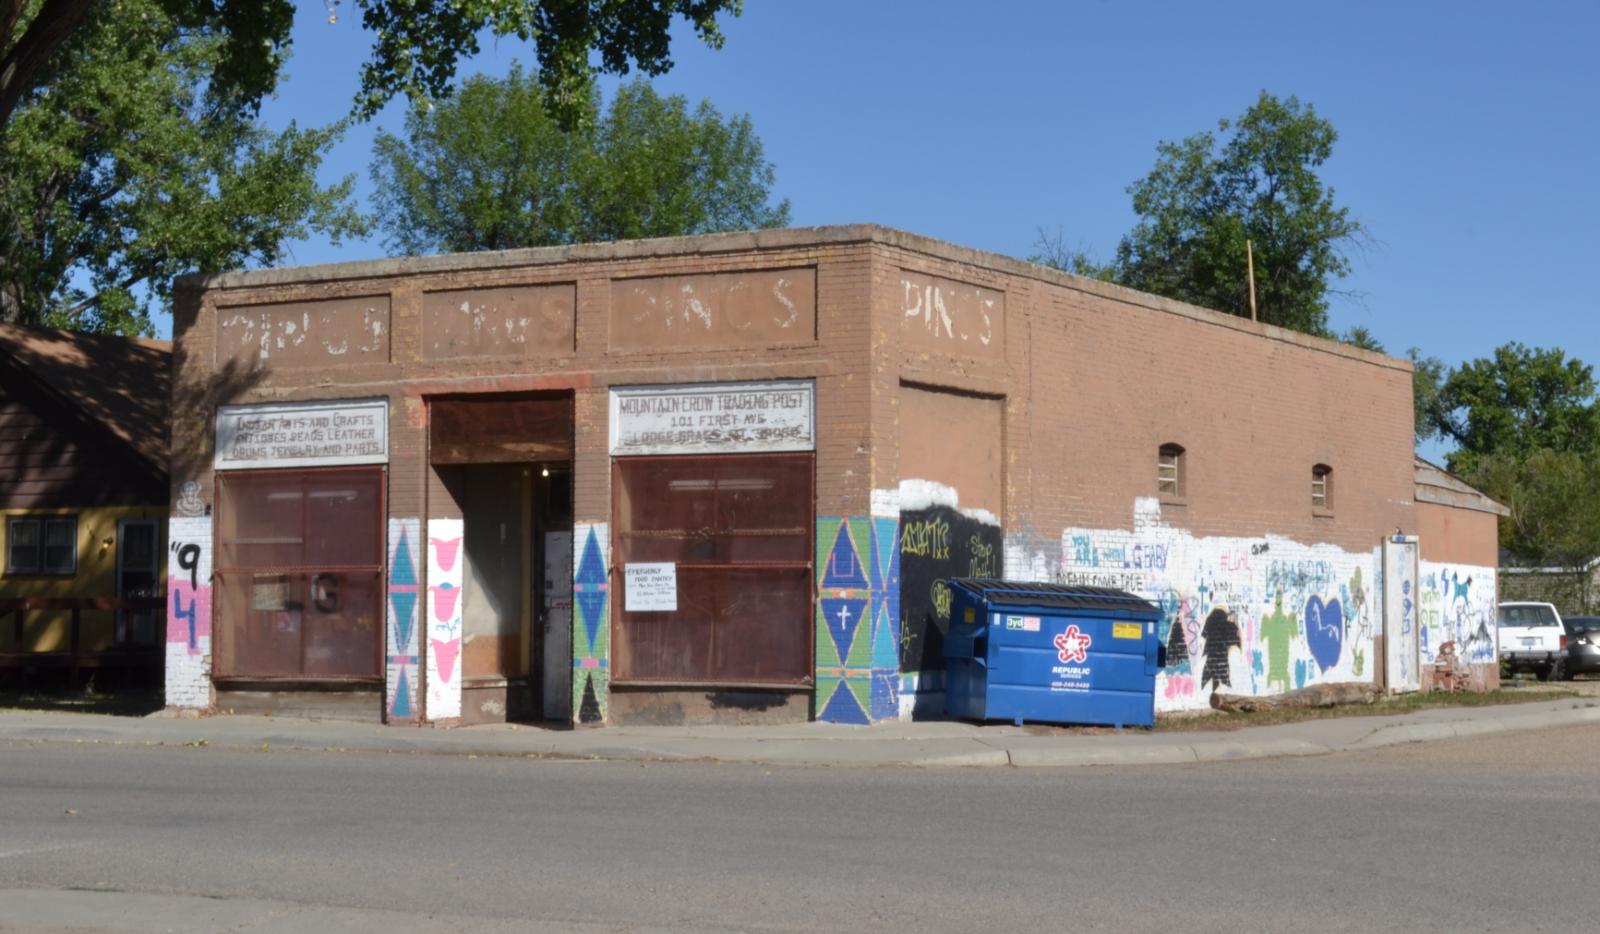
Lodge Grass is located within the Crow Indian Reservation in southern Montana, offering scenic surroundings and cultural richness. Though it’s a small town, it benefits from its location near Interstate 90, which provides access to larger cities like Billings. Historically underserved by outside investors, the town has recently seen increased attention from buyers looking for low-cost entry points. The 2025 price spike suggests that demand is outpacing supply, even in relatively remote areas. Local efforts to improve infrastructure and housing could continue driving growth. For now, Lodge Grass stands out for offering affordability in a region that’s starting to heat up.
7. Saco – 111% Home Price Increase Since 2016

- 2010: N/A
- 2011: N/A
- 2012: N/A
- 2013: N/A
- 2014: N/A
- 2015: N/A
- 2016: $64,241
- 2017: $64,924 (+$683, +1.06% from previous year)
- 2018: $70,035 (+$5,111, +7.87% from previous year)
- 2019: $77,570 (+$7,534, +10.76% from previous year)
- 2020: N/A
- 2021: $98,308
- 2022: $123,043 (+$24,736, +25.16% from previous year)
- 2023: $113,378 (-$9,665, -7.86% from previous year)
- 2024: $125,748 (+$12,370, +10.91% from previous year)
- 2025: $135,768 (+$10,021, +7.97% from previous year)
Saco’s average home value rose from $64,241 in 2016 to $135,768 in 2025—a 111% increase. The market grew steadily in the late 2010s, then accelerated sharply after 2020. A large jump in 2022 was followed by a brief correction in 2023. Growth resumed in 2024 and 2025, adding over $22,000 in value across those two years. That recovery underscores the resilience of demand in this small town. Saco now ranks among the fastest appreciating housing markets in northern Montana.
Saco – Tiny Town, Big Gains
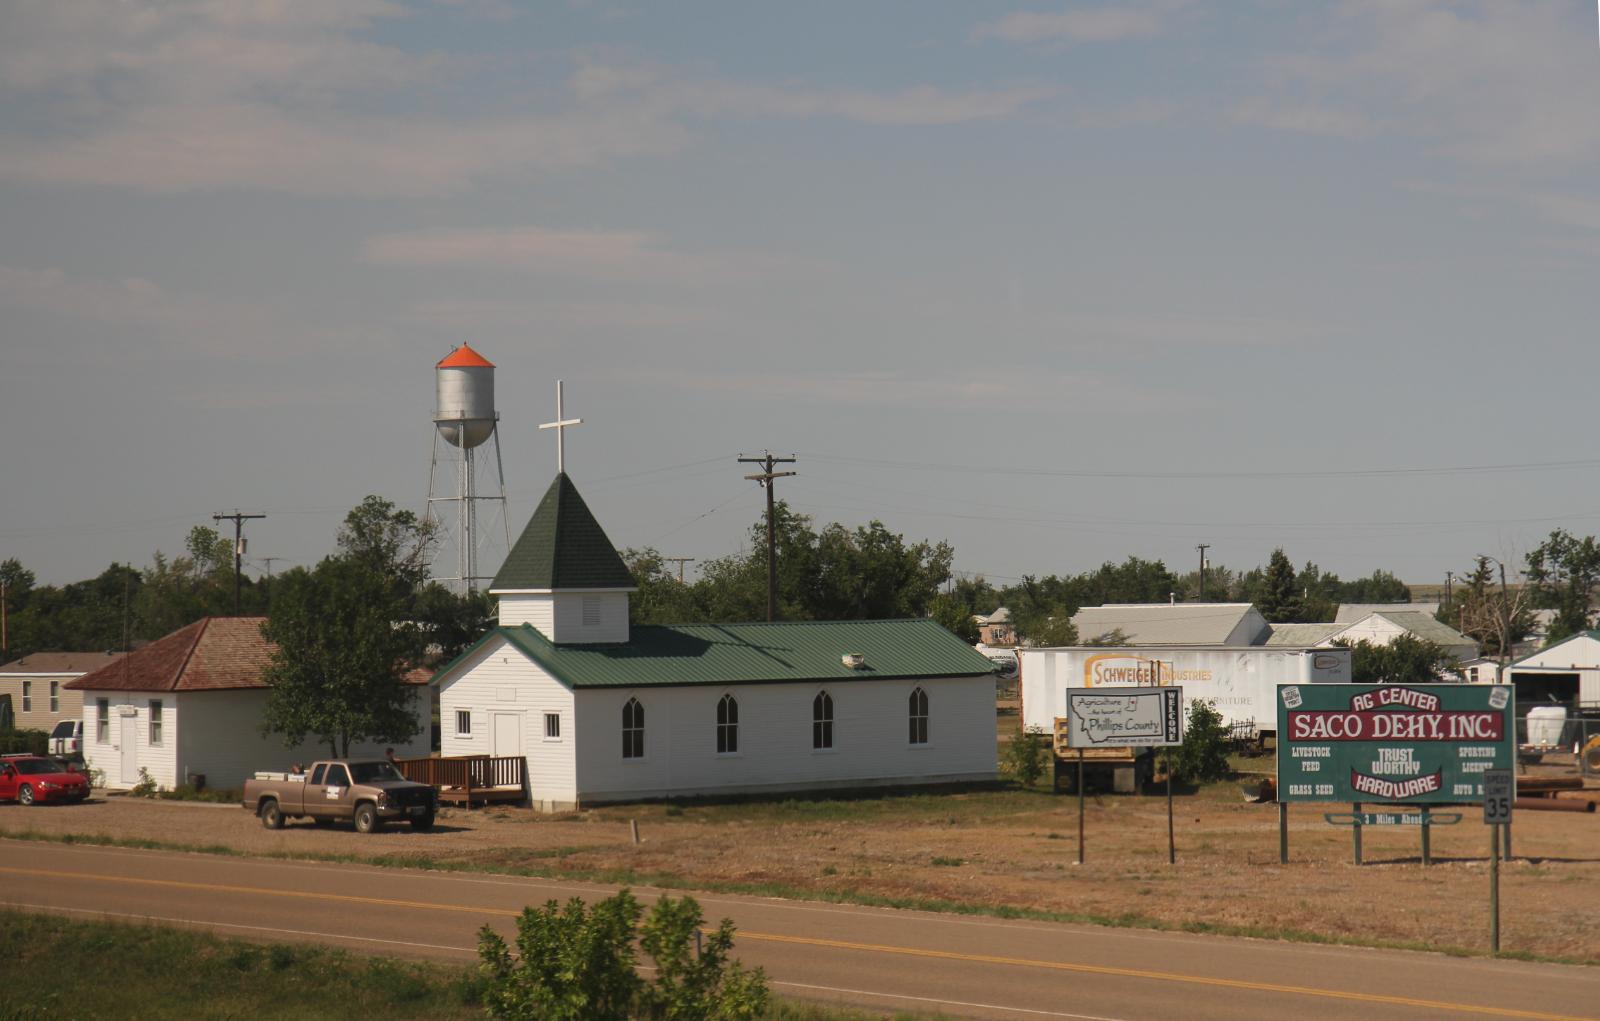
Saco is a quiet community in Phillips County with fewer than 200 residents, located along U.S. Route 2 in the northern tier of the state. It’s often overlooked, but its strategic location near Fort Peck Lake and Malta gives it relevance in the regional housing scene. The surrounding area offers recreational opportunities like fishing, hunting, and boating, which appeal to both retirees and outdoor lovers. Saco’s dramatic rise in property values points to low inventory and increasing attention from buyers priced out of more populated towns. Despite its size, the town has managed to attract interest with its scenic appeal and quiet pace of life. For those seeking a rural lifestyle with long-term value, Saco is proving to be a smart choice.
6. Fallon – 76% Home Price Increase Since 2016
- 2010: N/A
- 2011: N/A
- 2012: N/A
- 2013: N/A
- 2014: N/A
- 2015: N/A
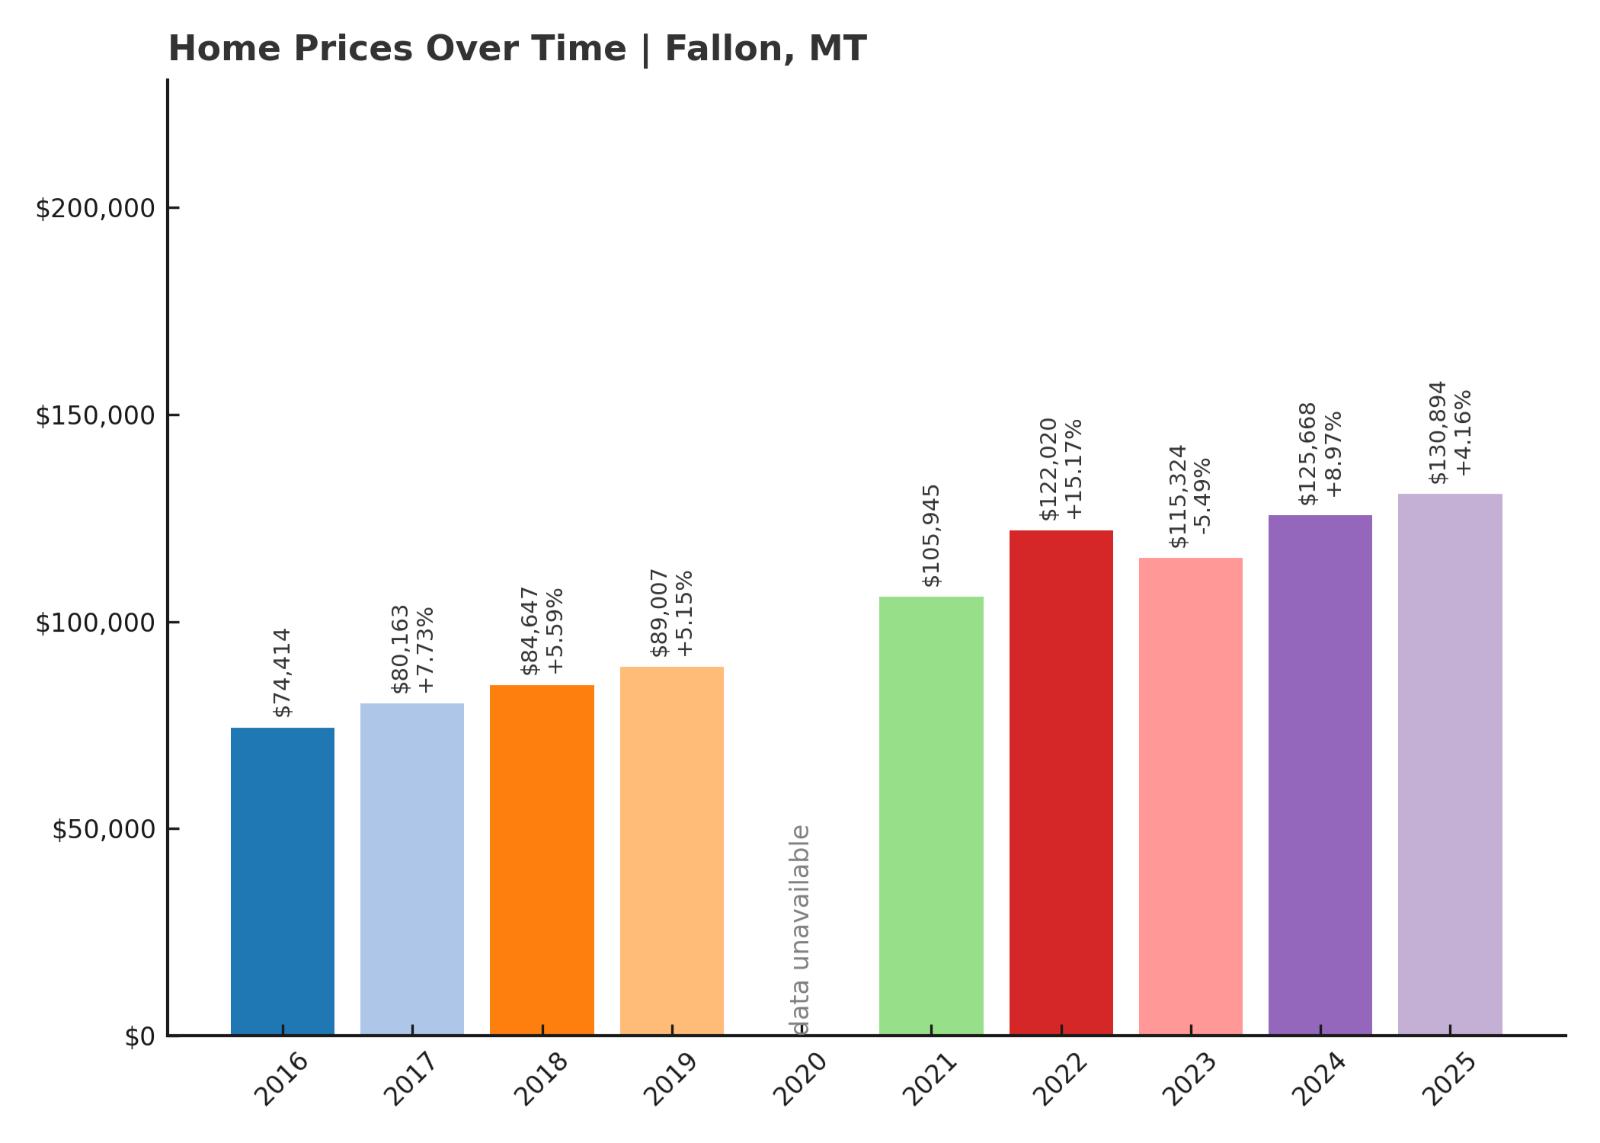
- 2016: $74,414
- 2017: $80,163 (+$5,749, +7.73% from previous year)
- 2018: $84,647 (+$4,484, +5.59% from previous year)
- 2019: $89,007 (+$4,359, +5.15% from previous year)
- 2020: N/A
- 2021: $105,945
- 2022: $122,020 (+$16,075, +15.17% from previous year)
- 2023: $115,324 (-$6,696, -5.49% from previous year)
- 2024: $125,668 (+$10,345, +8.97% from previous year)
- 2025: $130,894 (+$5,226, +4.16% from previous year)
Fallon’s home prices increased from $74,414 in 2016 to $130,894 in 2025, a 76% gain. The growth was steady through 2019, with prices rising 5–8% annually. A major surge occurred in 2022 with a jump of over $16,000, followed by a brief dip in 2023. Despite that correction, the market bounced back in 2024 and continued upward in 2025. This pattern suggests a healthy market with room for growth and natural adjustments. Fallon’s affordability compared to nearby towns has likely driven interest. With no dramatic volatility, it has become one of the more consistent markets in eastern Montana.
Fallon – A Quiet Crossroads With Long-Term Potential
Fallon is a small unincorporated town in Prairie County, nestled along the Yellowstone River and within reach of I-94. Though its population is limited, the town benefits from being within a short drive of Glendive and Miles City, providing access to medical care, schools, and retail while still offering a deeply rural lifestyle. The surrounding land is mostly agricultural, and that stability appears to have translated into slow but reliable home price growth. Fallon’s housing market is driven not by tourism or industry booms, but by steady demand from long-term residents and rural buyers looking for space and affordability. The town doesn’t see a lot of turnover, and limited construction means any increase in demand directly impacts prices. With its proximity to water, highway access, and peaceful surroundings, Fallon checks a lot of boxes for those seeking simplicity and value. That makes it a quiet but meaningful entry on this list.
What makes Fallon stand out is its consistency over the last decade. While other towns on this list had sharp price swings, Fallon’s gains came steadily, anchored by strong fundamentals rather than hype. Even the dip in 2023 didn’t shake its market, which recovered quickly and posted additional growth the following years. That kind of resilience is often overlooked but deeply important for buyers seeking long-term value. With the rise in remote work, towns like Fallon—once considered too isolated—are becoming more viable options. Its home values remain well below the state average, yet the upward trend shows that more people are taking notice. Fallon may not be flashy, but its steady climb makes it one of the most reliable housing markets in rural Montana.
5. Browning – 97% Home Price Increase Since 2016

- 2010: N/A
- 2011: N/A
- 2012: N/A
- 2013: N/A
- 2014: N/A
- 2015: N/A
- 2016: $63,722
- 2017: $68,019 (+$4,297, +6.74% from previous year)
- 2018: $64,534 (-$3,485, -5.12% from previous year)
- 2019: $68,029 (+$3,495, +5.42% from previous year)
- 2020: N/A
- 2021: $88,599
- 2022: $112,830 (+$24,231, +27.35% from previous year)
- 2023: $112,496 (-$334, -0.30% from previous year)
- 2024: $119,425 (+$6,929, +6.16% from previous year)
- 2025: $125,611 (+$6,186, +5.18% from previous year)
Browning’s home values rose from $63,722 in 2016 to $125,611 in 2025, marking a 97% increase. After steady gains through the late 2010s, prices surged sharply in 2022 with a 27% year-over-year jump. That spike was followed by continued moderate growth, despite a brief flatline in 2023. The town has consistently added value in recent years, with no large-scale reversals. Limited housing supply and increased regional interest are likely contributing factors. Even after its recent peak, prices remain significantly higher than where they started. Browning now ranks among the most appreciated markets in western Montana.
Browning – A Cultural Hub Near Glacier With Market Momentum
Browning is the capital of the Blackfeet Nation and sits just east of Glacier National Park in Glacier County. It’s a town steeped in history and tradition, offering both cultural vibrancy and proximity to one of the country’s most visited natural parks. In recent years, demand for housing here has increased, particularly from those looking to live near outdoor destinations without the price tags of nearby resort towns. Browning has remained more affordable than its neighbors, and that has likely drawn interest from both locals and out-of-town buyers. The town also benefits from tribal infrastructure, education centers, and employment opportunities, which add economic stability to the housing market. While it lacks the polish of tourist-driven towns, its authenticity and location have turned heads. As rural markets grow tighter, Browning is showing it can be both meaningful and financially promising for homebuyers.
Real estate in Browning has long been under the radar, but price trends now suggest a change in perception. Buyers are starting to value the area’s connection to land, community, and heritage—all things that can’t be replicated elsewhere. Development remains limited, which has helped protect property values from overbuilding. At the same time, tribal and federal investments in infrastructure and healthcare have improved living standards. For those seeking a Montana town with real roots, access to world-class nature, and growing home equity, Browning is emerging as a serious contender. The nearly 100% increase in prices over nine years makes that clear. This momentum may continue as interest in culturally rich, outdoor-adjacent communities expands.
4. Wolf Point – 71% Home Price Increase Since 2016
- 2010: N/A
- 2011: N/A
- 2012: N/A
- 2013: N/A
- 2014: N/A
- 2015: N/A
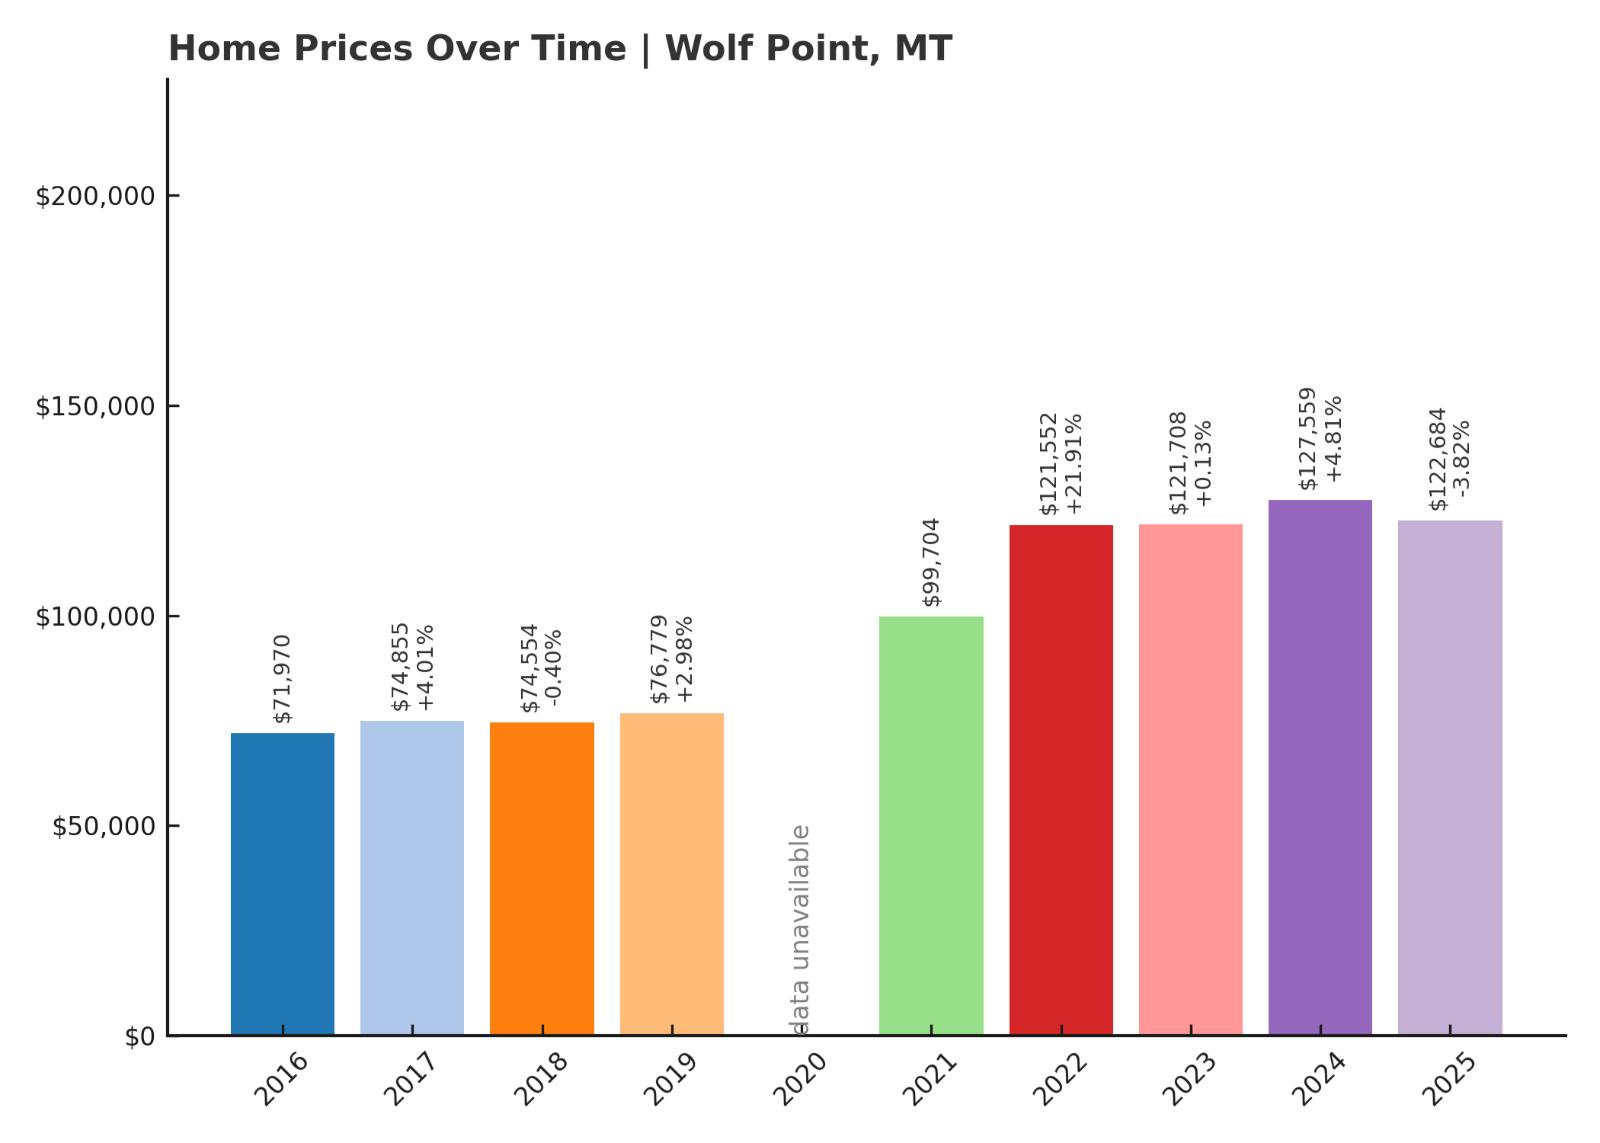
- 2016: $71,970
- 2017: $74,855 (+$2,885, +4.01% from previous year)
- 2018: $74,554 (-$301, -0.40% from previous year)
- 2019: $76,779 (+$2,225, +2.98% from previous year)
- 2020: N/A
- 2021: $99,704
- 2022: $121,552 (+$21,848, +21.91% from previous year)
- 2023: $121,708 (+$156, +0.13% from previous year)
- 2024: $127,559 (+$5,850, +4.81% from previous year)
- 2025: $122,684 (-$4,874, -3.82% from previous year)
Wolf Point’s home values climbed from $71,970 in 2016 to $122,684 in 2025, a 71% increase overall. The most dramatic gain came in 2022, when prices jumped nearly $22,000. Since then, growth has steadied, with small year-to-year changes through 2025. A slight drop in the most recent year could reflect normal market fluctuation after a sustained rise. Despite that, the long-term trend remains strongly upward. Wolf Point’s housing market shows a level of consistency that’s rare in rural Montana. The town’s services, transportation links, and location help reinforce steady demand.
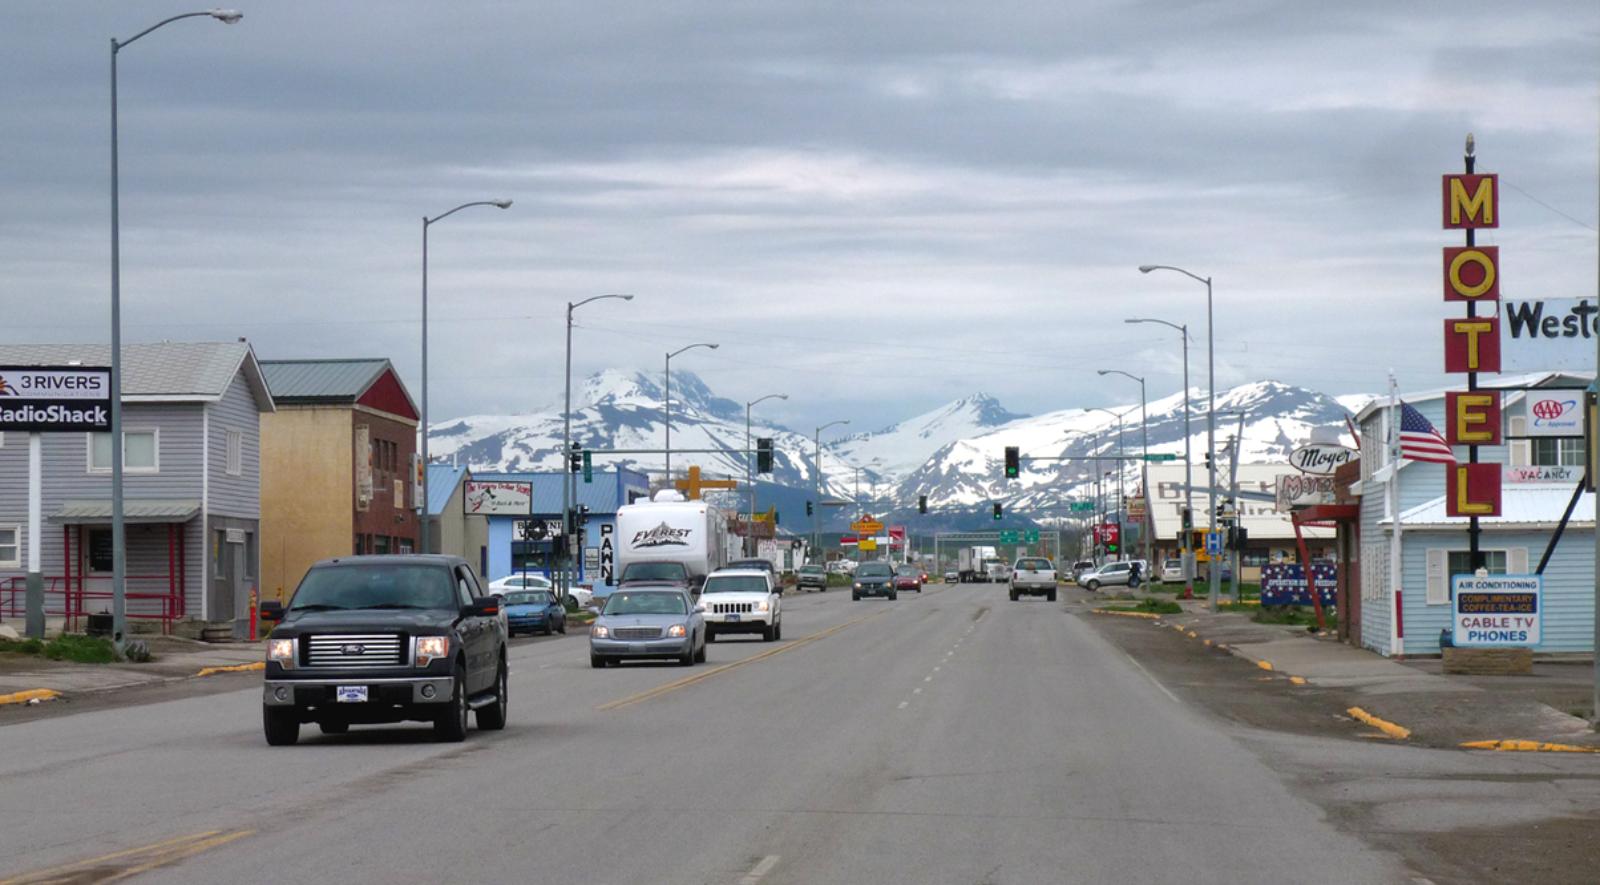
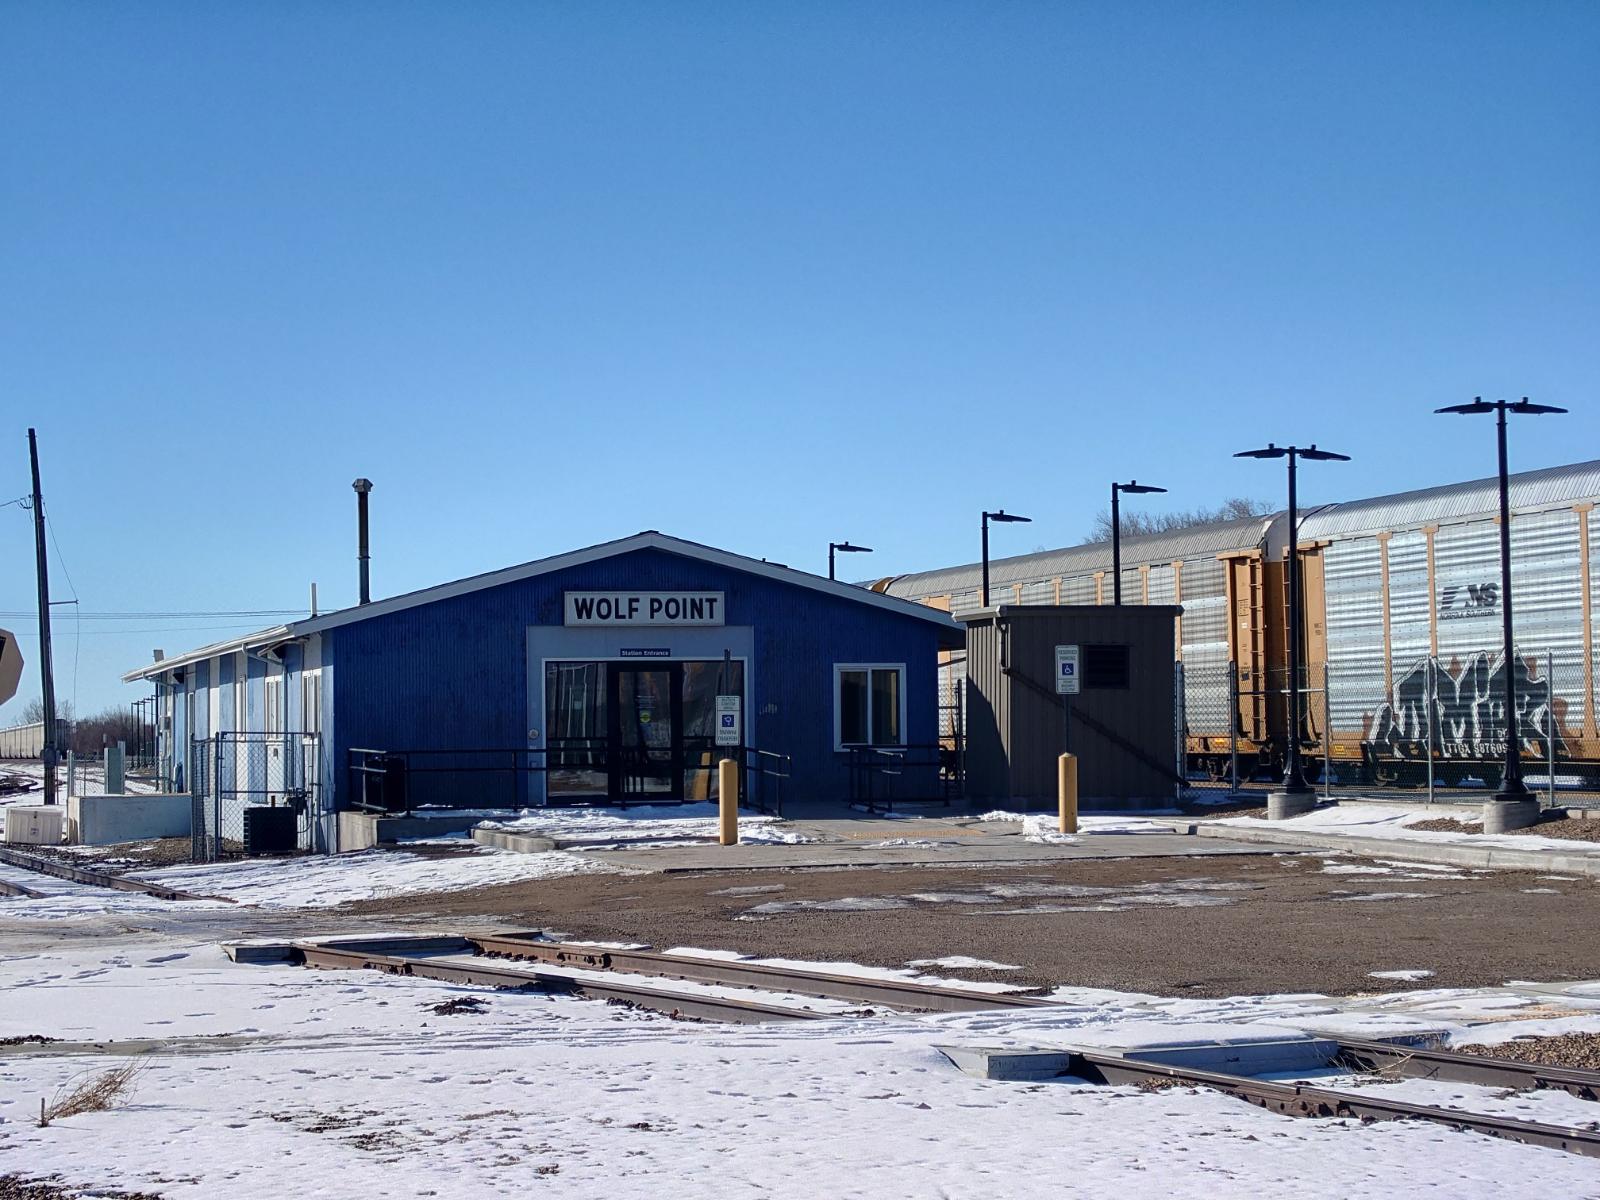
Wolf Point – The Economic and Transit Heart of the Hi-Line
🔥 Would you like to save this?
Wolf Point is the largest city on the Fort Peck Indian Reservation and acts as a regional economic and transportation hub for northeastern Montana. It offers amenities not typically found in small towns, including a hospital, airport, community college, and a stop on the Amtrak Empire Builder line. This infrastructure makes Wolf Point more connected and self-sufficient than most rural communities. Its location along the Missouri River adds natural beauty, while the town’s cultural life—including events like the Wild Horse Stampede—attracts attention from across the region. In recent years, buyers seeking reliable investment in an otherwise remote part of the state have turned to Wolf Point. Housing remains relatively affordable, but consistent appreciation suggests growing confidence in the market. Its unique mix of practicality and culture continues to sustain long-term demand.
As other rural towns struggle with depopulation or underinvestment, Wolf Point stands apart by maintaining a robust service economy. Tribal and local government operations provide stable employment, and the availability of healthcare and education supports quality of life. Its housing market reflects this with fewer sharp spikes and dips compared to more isolated areas. While the 2025 price drop could raise eyebrows, it’s minor in the context of nearly a decade of steady growth. Wolf Point remains a foundational town for this region of Montana, and its housing market is backed by solid fundamentals. For investors and homebuyers alike, it’s one of the more reliable bets in the northeastern plains.
3. Terry – 38% Home Price Increase Since 2016
- 2010: N/A
- 2011: N/A
- 2012: N/A
- 2013: N/A
- 2014: N/A
- 2015: N/A
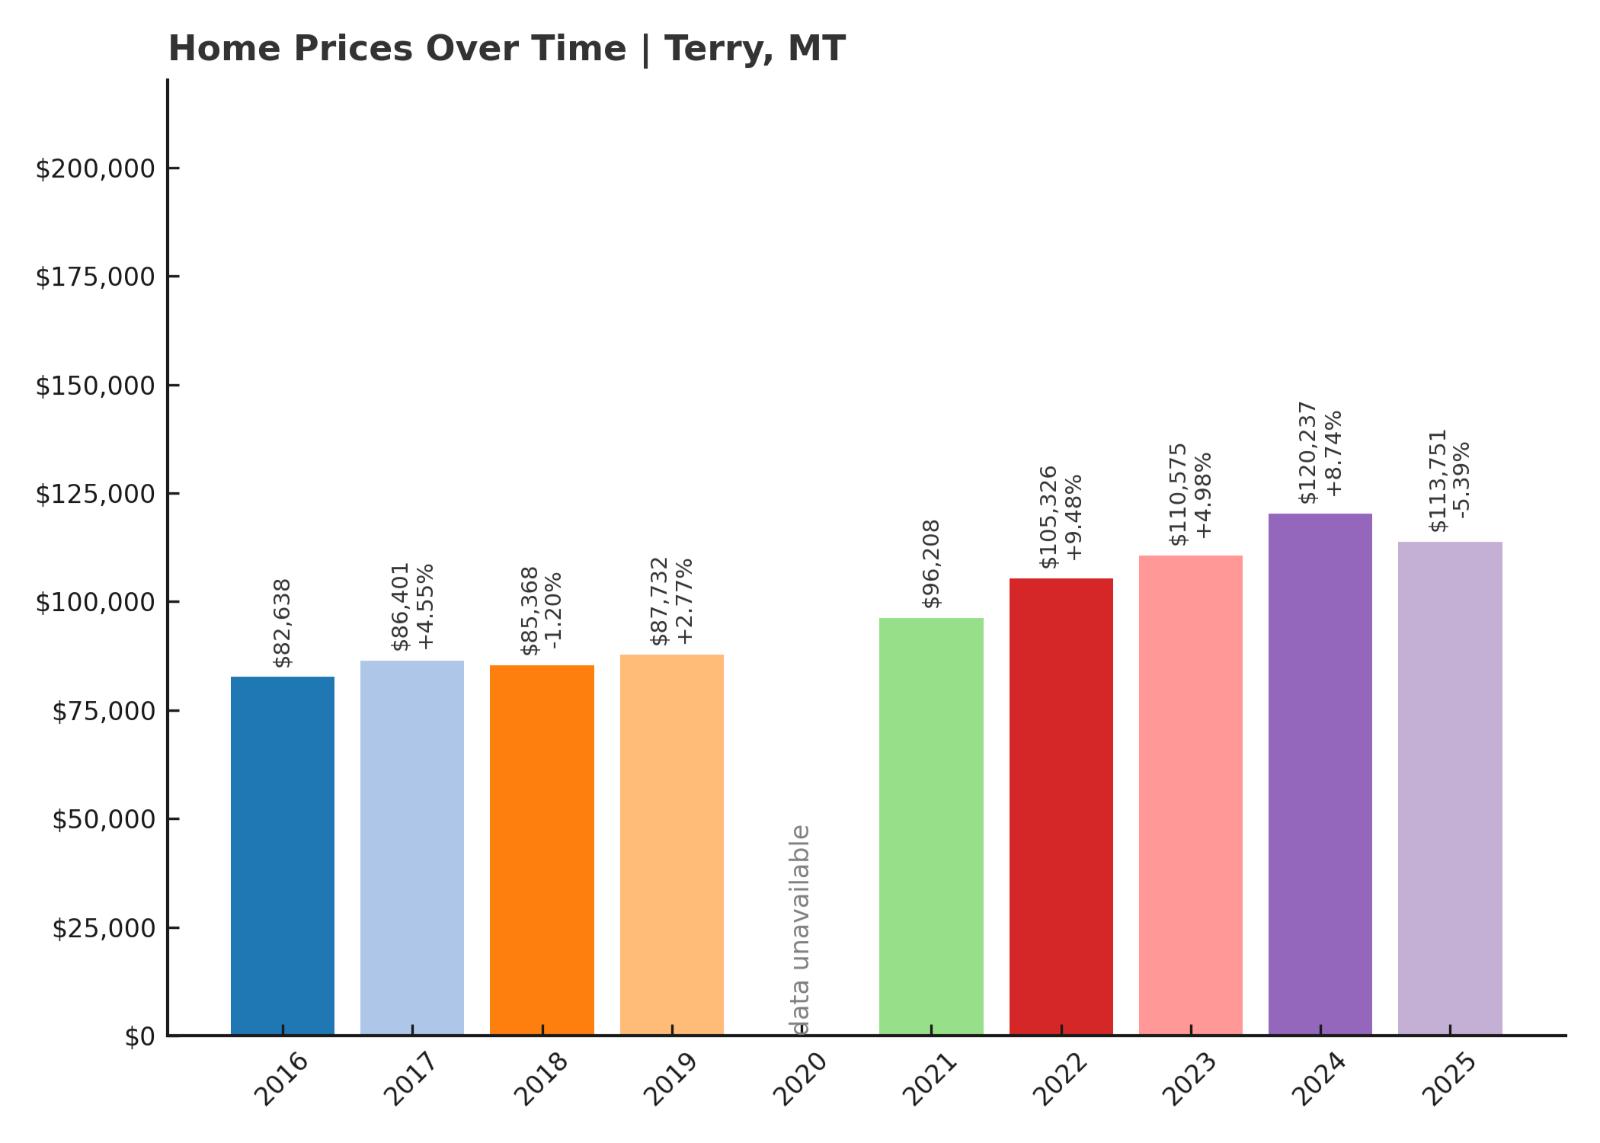
- 2016: $82,638
- 2017: $86,401 (+$3,763, +4.55% from previous year)
- 2018: $85,368 (-$1,033, -1.20% from previous year)
- 2019: $87,732 (+$2,364, +2.77% from previous year)
- 2020: N/A
- 2021: $96,208
- 2022: $105,326 (+$9,118, +9.48% from previous year)
- 2023: $110,575 (+$5,249, +4.98% from previous year)
- 2024: $120,237 (+$9,662, +8.74% from previous year)
- 2025: $113,751 (-$6,486, -5.39% from previous year)
Terry’s average home price rose from $82,638 in 2016 to $113,751 in 2025, a total increase of 38%. The market saw steady but moderate growth from 2016 through 2023, with a particularly strong gain in 2022. Prices peaked in 2024 before pulling back slightly in 2025, possibly reflecting seasonal or supply-driven corrections. Despite the recent dip, the long-term upward trajectory is clear. Terry’s market appears driven by gradual demand increases rather than speculation. The town’s affordability and consistency have helped maintain buyer interest. With prices holding well above their 2016 levels, Terry has earned a place on this list of Montana’s fastest risers.
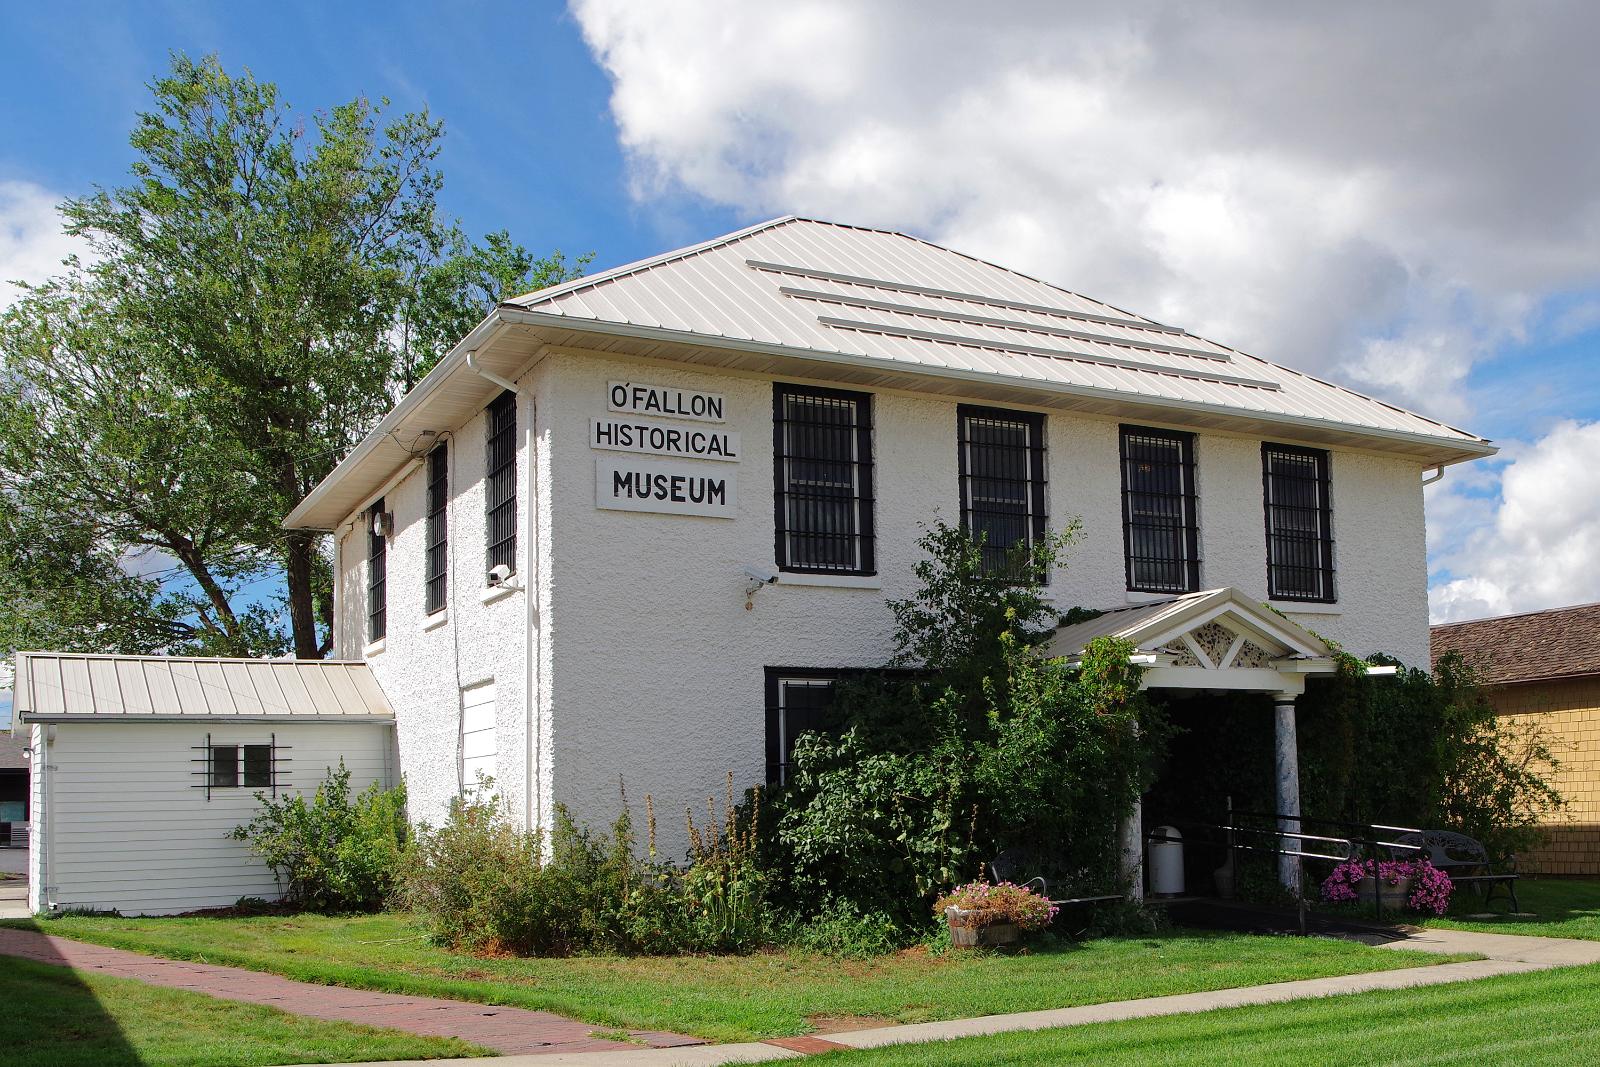
Terry – Historic and Affordable in the Eastern Plains

Terry is a small town in Prairie County, located along I-94 in eastern Montana. Known for its Old West charm and quiet living, Terry is home to the Prairie County Museum and scenic access to the Yellowstone River. The town has been attracting retirees and remote workers who want a peaceful lifestyle without completely leaving infrastructure behind. It offers essential amenities like a library, grocery store, post office, and school, with easy driving access to Glendive for additional services. The housing stock is largely older homes on spacious lots, appealing to those who want room to breathe. As home prices rise across the state, buyers are giving places like Terry a second look. Its combination of history, affordability, and small-town charm has made it one of eastern Montana’s most quietly appreciated markets.
2. Medicine Lake – 18% Home Price Increase Since 2021
- 2010: N/A
- 2011: N/A
- 2012: N/A
- 2013: N/A
- 2014: N/A
- 2015: N/A
- 2016: N/A
- 2017: N/A
- 2018: N/A
- 2019: N/A
- 2020: N/A
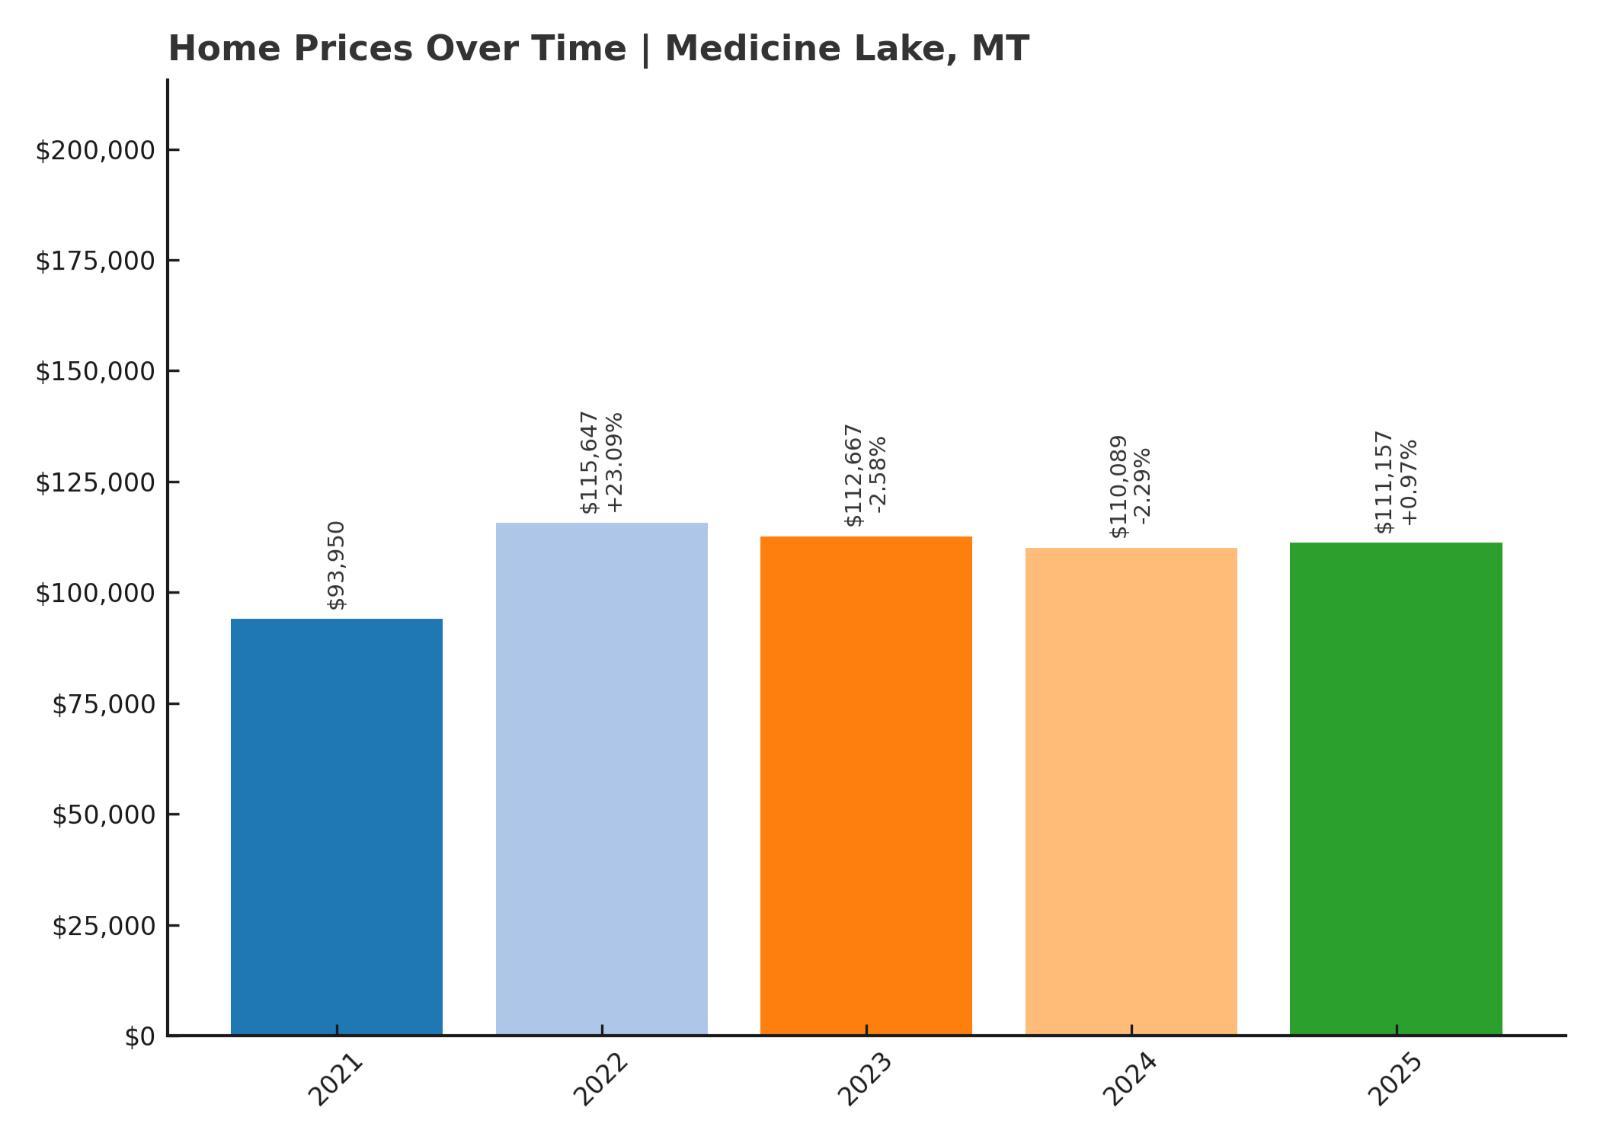
- 2021: $93,950
- 2022: $115,647 (+$21,696, +23.09% from previous year)
- 2023: $112,667 (-$2,980, -2.58% from previous year)
- 2024: $110,089 (-$2,577, -2.29% from previous year)
- 2025: $111,157 (+$1,068, +0.97% from previous year)
Since Zillow began reporting prices for Medicine Lake in 2021, home values have increased by 18%, rising from $93,950 to $111,157. The sharpest increase came in 2022, with a 23% gain in a single year. Prices have dipped slightly since that peak but are still well above where they began. The trend points to a market that surged on limited supply, followed by stabilization. The town remains one of the more affordable markets in northeast Montana. Its value growth, while recent, shows how quickly small towns can gain attention. Buyers looking for quiet surroundings and lower prices continue to show interest.
Medicine Lake – Small, Secluded, and Gaining Ground
Medicine Lake is a tiny community in Sheridan County, named after the nearby lake and wildlife refuge that attract nature lovers and birdwatchers. With fewer than 300 residents, it’s one of the smallest towns on this list, but it offers unmatched serenity and access to outdoor beauty. The surrounding area is known for fishing, boating, and seasonal hunting, which adds recreational appeal. Medicine Lake is also within reasonable driving distance of Plentywood and Sidney, giving residents access to larger towns without sacrificing peace and quiet. The limited housing stock means even minor changes in demand can push prices up quickly. As Montana continues to attract attention for rural living, places like Medicine Lake stand to benefit from those seeking privacy and natural surroundings. Despite its small size, it’s clearly on the radar for buyers looking for a different pace of life.
1. Nashua – 55% Home Price Increase Since 2016
- 2010: N/A
- 2011: N/A
- 2012: N/A
- 2013: N/A
- 2014: N/A
- 2015: N/A
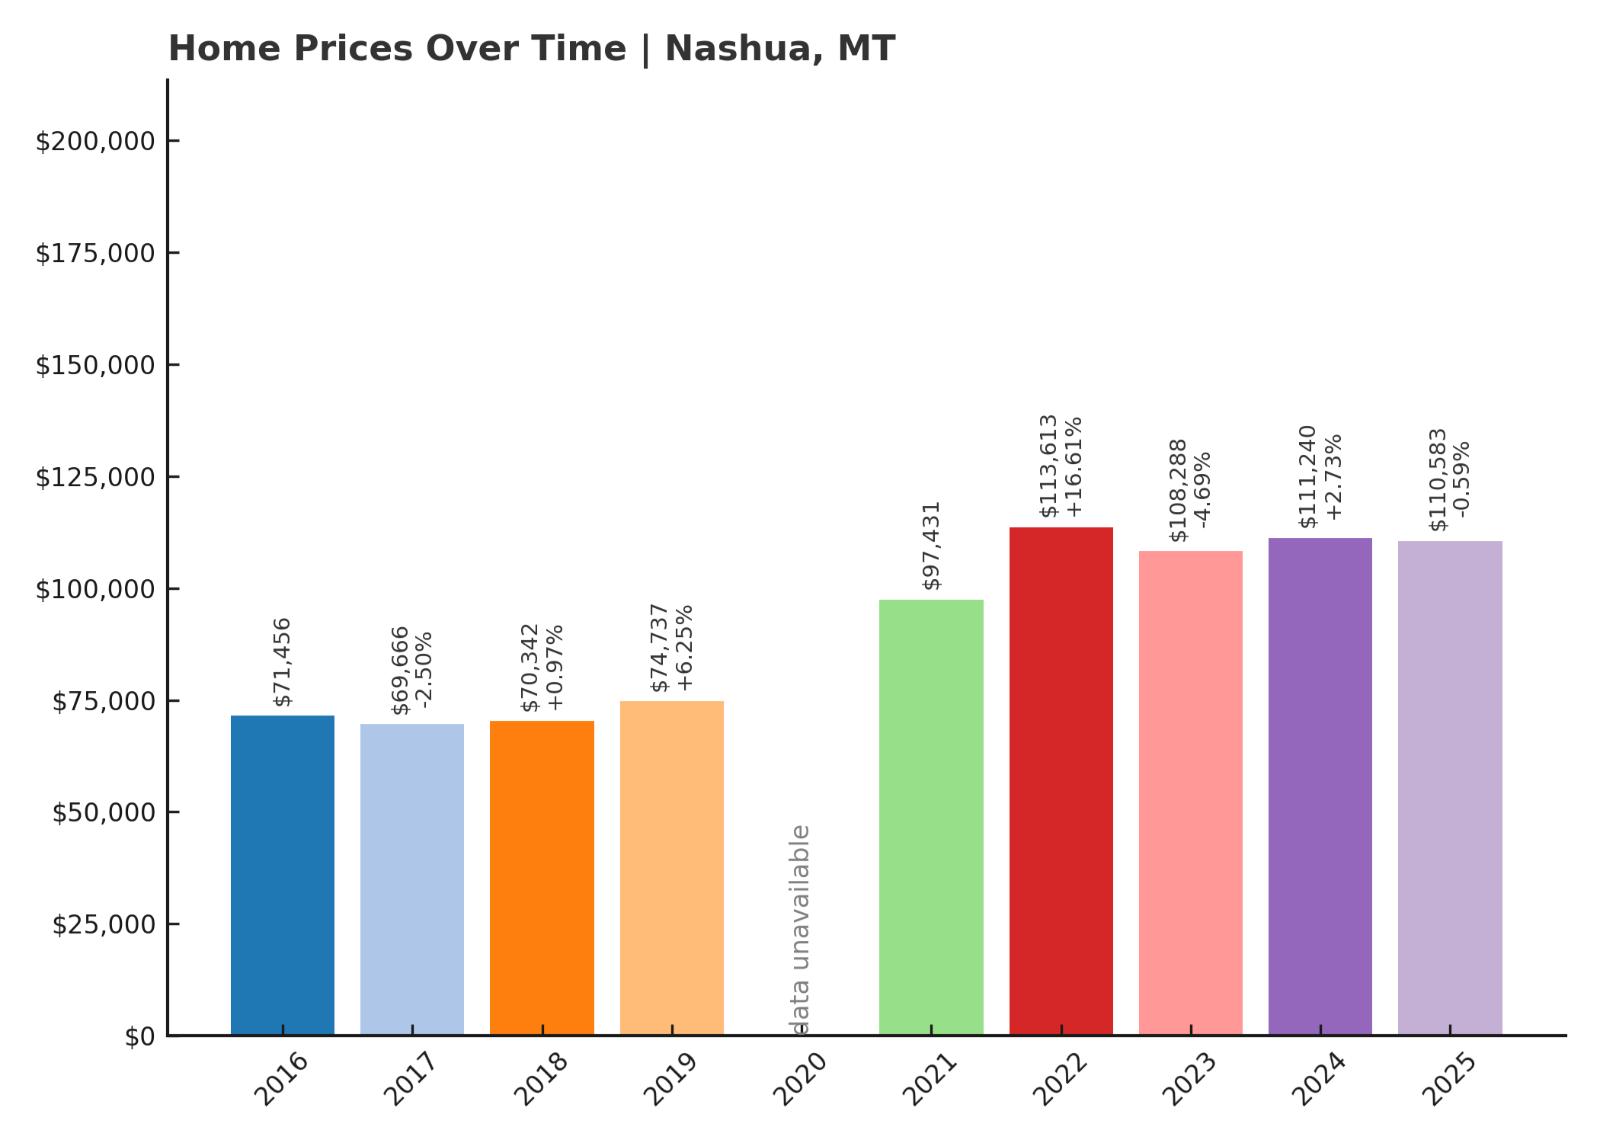
- 2016: $71,456
- 2017: $69,666 (-$1,790, -2.50% from previous year)
- 2018: $70,342 (+$675, +0.97% from previous year)
- 2019: $74,737 (+$4,395, +6.25% from previous year)
- 2020: N/A
- 2021: $97,431
- 2022: $113,613 (+$16,182, +16.61% from previous year)
- 2023: $108,288 (-$5,325, -4.69% from previous year)
- 2024: $111,240 (+$2,952, +2.73% from previous year)
- 2025: $110,583 (-$657, -0.59% from previous year)
Home prices in Nashua have increased from $71,456 in 2016 to $110,583 in 2025, a rise of 55%. After a dip in 2017, the market gained steady ground through 2019 and accelerated sharply between 2020 and 2022. Although the past two years saw modest declines, prices have largely held above their 2021 peak. This kind of plateau often suggests a maturing market rather than weakening demand. Buyers seem to be settling into Nashua’s affordability and livability. Compared to more volatile towns, Nashua’s long-term gains make it one of Montana’s more consistent rural markets. The town’s market reflects rising interest in small communities with strong foundations.
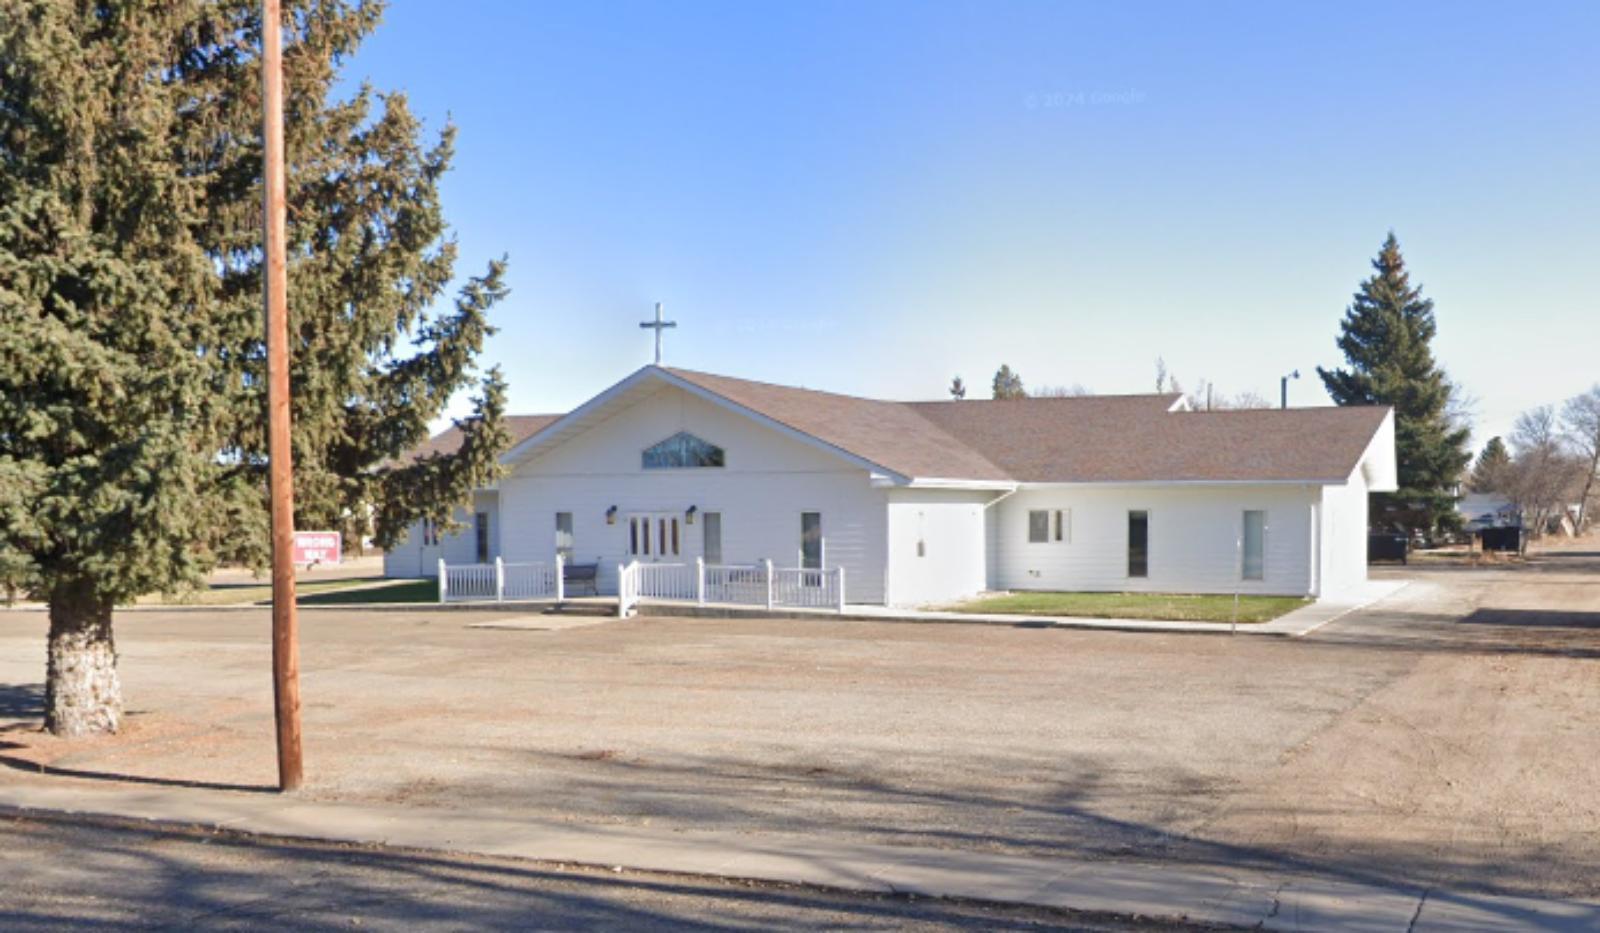
Nashua – A Small Town That’s Held Its Value
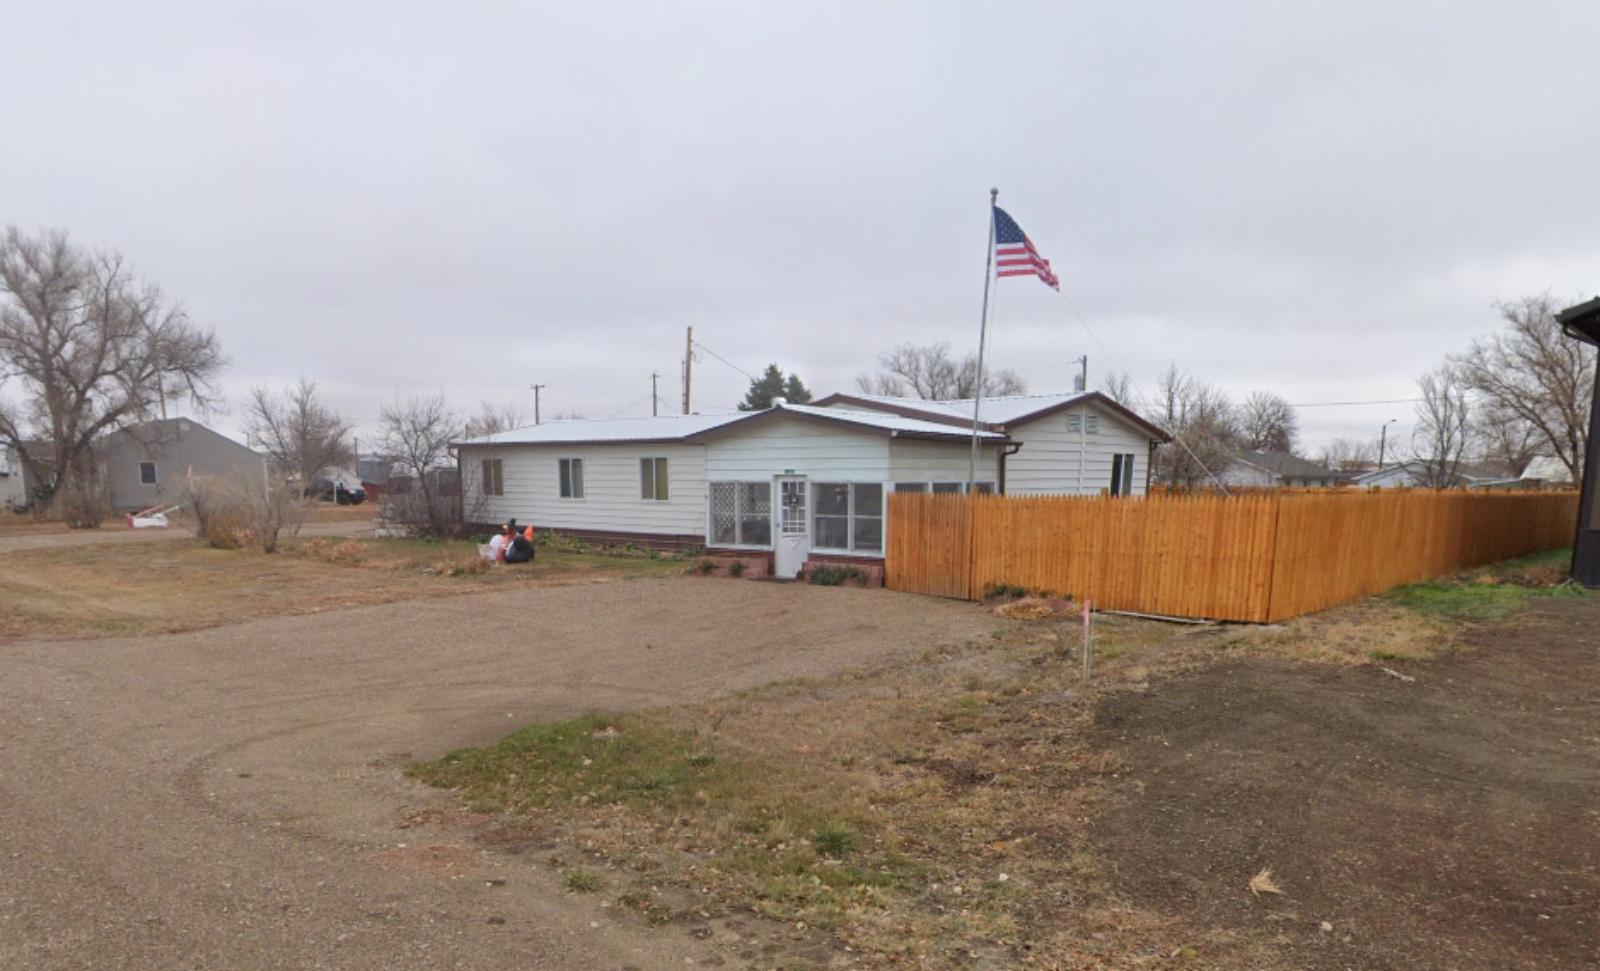
Nashua is located in Valley County along Highway 2 and the Milk River, just west of Glasgow. While modest in size, it offers access to regional infrastructure while maintaining a slower pace of life. The town features a post office, school, basic services, and close proximity to Fort Peck Lake and its popular recreational areas. Nashua’s growth may be modest compared to some hot markets, but it has been reliable and relatively even. The town offers a desirable mix of affordability and access to nature, without being completely isolated. Its housing stock is limited, which helps support prices even when demand slows. For buyers seeking a budget-friendly, low-stress place to settle, Nashua continues to hold quiet but solid appeal.