
Cities with the most expensive homes in Indiana
Purchasing a home is one of the most important investments there is. More than a place to live, homeownership is an asset with the potential to tremendously rise in value. But with home prices reaching record heights, affordability plays a huge role for buyers.
The typical home value in the United States was $358,761 in November, 2.3% higher than the year before.
High mortgage rates are also making monthly payments more expensive; as of December 19, the 30-year fixed mortgage rate sits at 6.72%.
Although home prices have inflated all across the U.S., there are some cities that command a higher price tag than others. Location, size, age, and condition are all contributing factors to home value.
Stacker compiled a list of cities with the most expensive homes in Indiana using data from Zillow. Cities are ranked by the Zillow Home Values Index for all homes as of November 2024. The charts in this story were created automatically using Matplotlib.
Metros with the most cities in the top 30 in Indiana
#1. Indianapolis-Carmel-Anderson, IN: 12
#2. Chicago-Naperville-Elgin, IL-IN-WI: 3
#3. Angola, IN: 2
#3. Cincinnati, OH-KY-IN: 2
#3. Elkhart-Goshen, IN: 2
#3. Michigan City-La Porte, IN: 2
#7. Bloomington, IN: 1
#7. Fort Wayne, IN: 1
#7. Lafayette-West Lafayette, IN: 1
#7. Louisville/Jefferson County, KY-IN: 1
#7. South Bend-Mishawaka, IN-MI: 1
You may also like: How Indiana’s decreasing gasoline sales compare nationwide
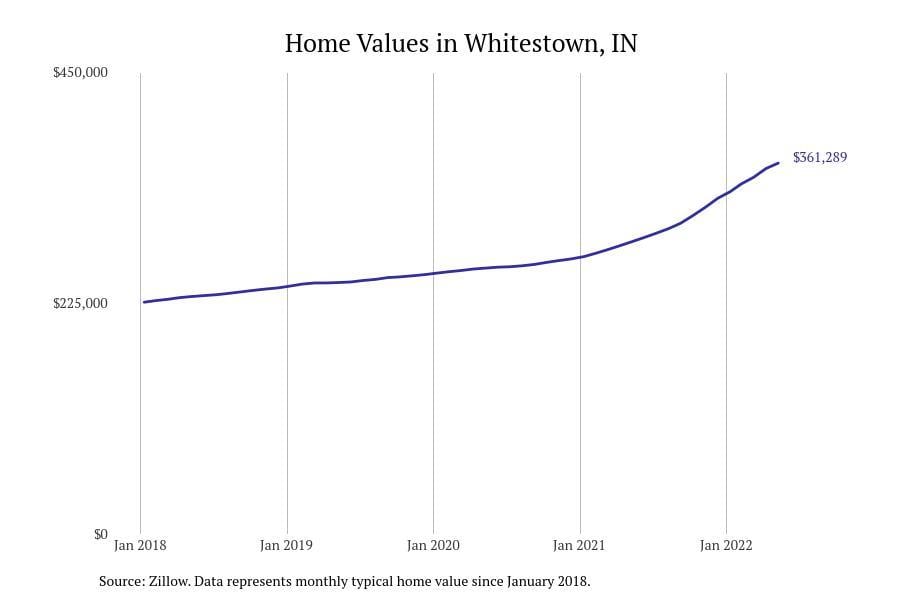
#30. Whitestown
– Typical home value: $350,492
– 1-year price change: -0.5%
– 5-year price change: +40.2%
– Metro area: Indianapolis-Carmel-Anderson, IN
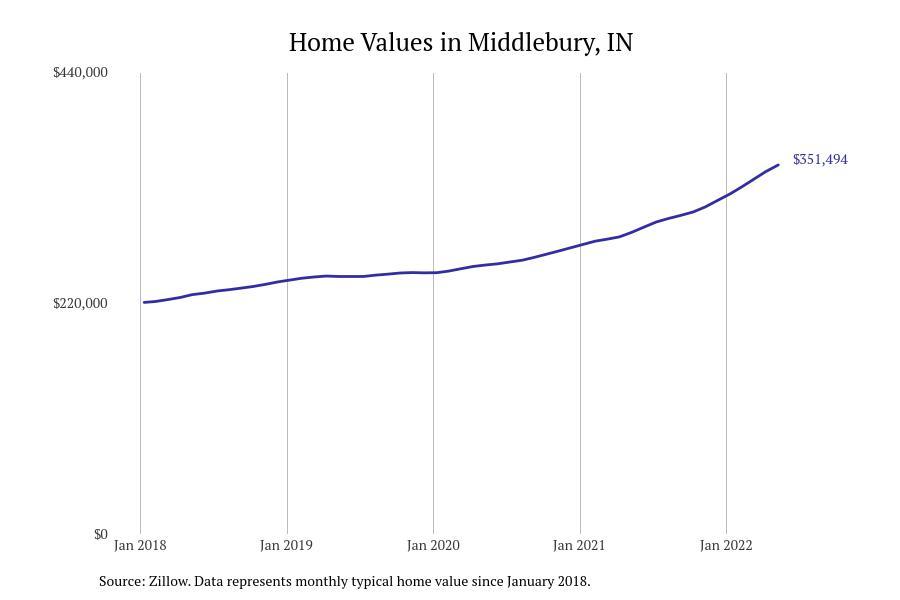
#29. Middlebury
– Typical home value: $350,687
– 1-year price change: +2.8%
– 5-year price change: +42.1%
– Metro area: Elkhart-Goshen, IN
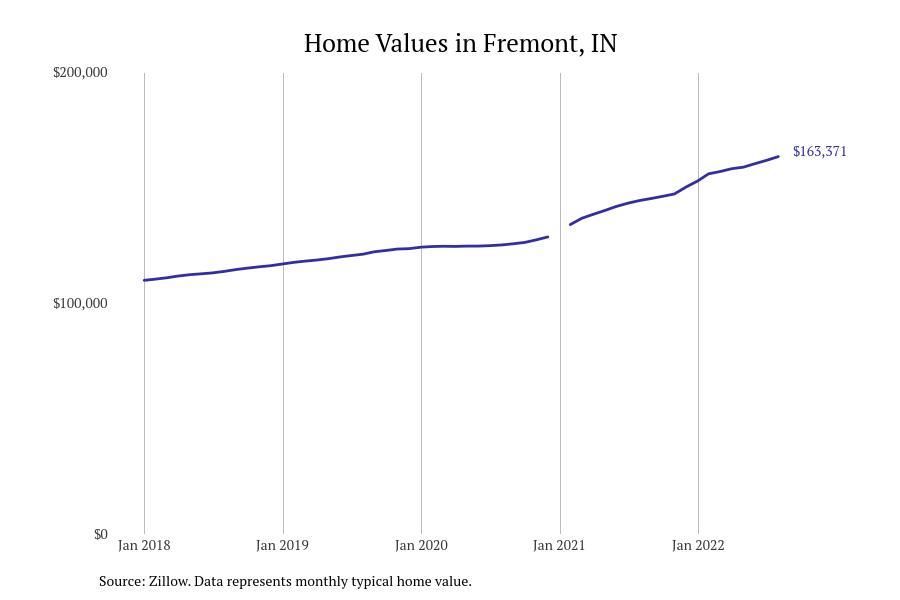
#28. Fremont
– Typical home value: $352,285
– 1-year price change: +7.9%
– 5-year price change: +55.8%
– Metro area: Angola, IN
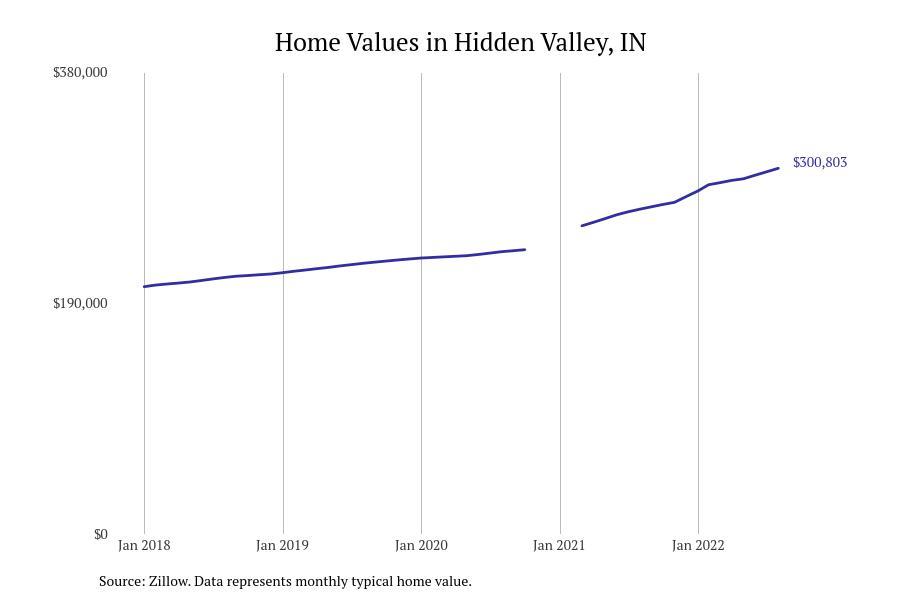
#27. Hidden Valley
– Typical home value: $352,317
– 1-year price change: +4.5%
– 5-year price change: +48.6%
– Metro area: Cincinnati, OH-KY-IN
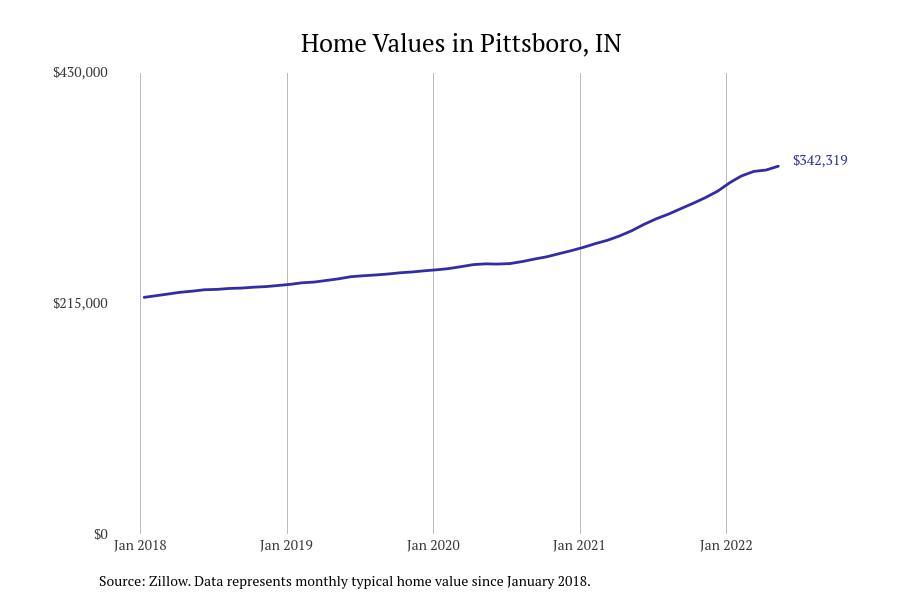
#26. Pittsboro
– Typical home value: $354,555
– 1-year price change: +3.0%
– 5-year price change: +50.5%
– Metro area: Indianapolis-Carmel-Anderson, IN
You may also like: Counties where homes are selling the fastest in Indiana
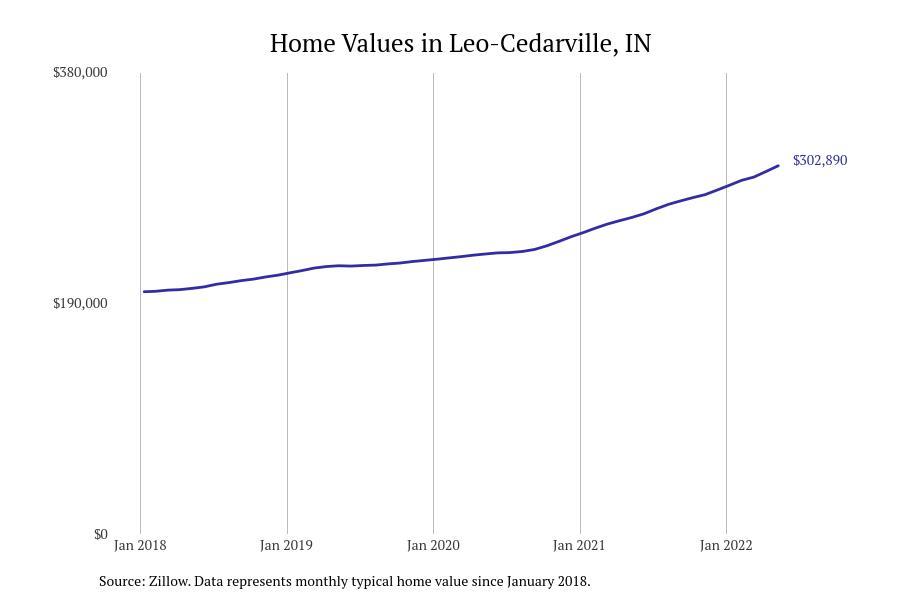
#25. Leo-Cedarville
– Typical home value: $354,766
– 1-year price change: +4.8%
– 5-year price change: +50.6%
– Metro area: Fort Wayne, IN
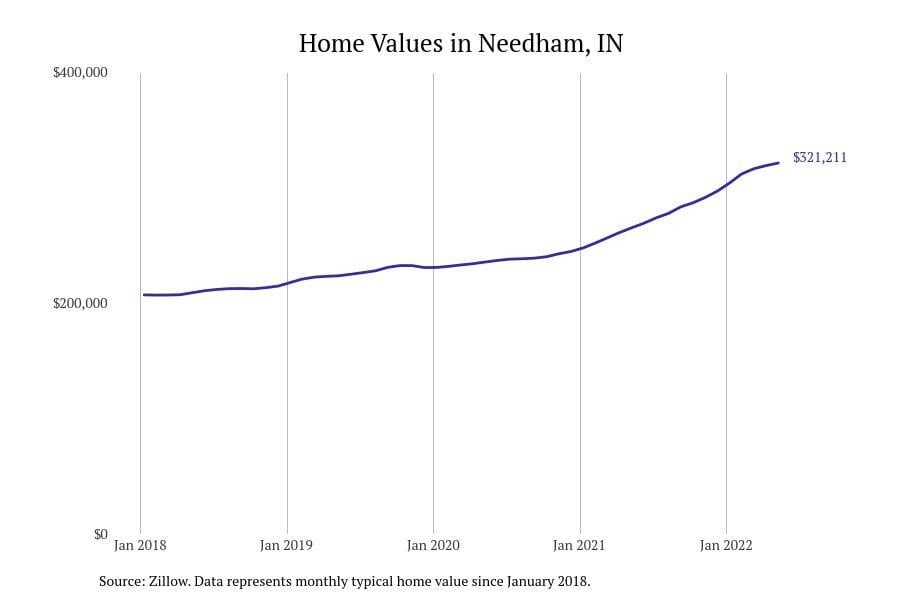
#24. Needham
– Typical home value: $359,016
– 1-year price change: +5.7%
– 5-year price change: +64.3%
– Metro area: Indianapolis-Carmel-Anderson, IN
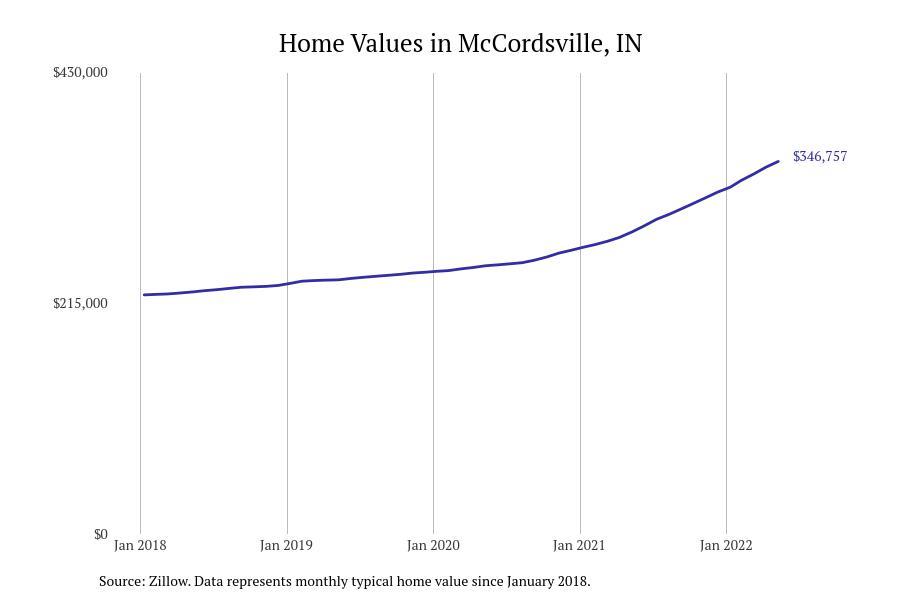
#23. McCordsville
– Typical home value: $360,347
– 1-year price change: +2.6%
– 5-year price change: +48.7%
– Metro area: Indianapolis-Carmel-Anderson, IN
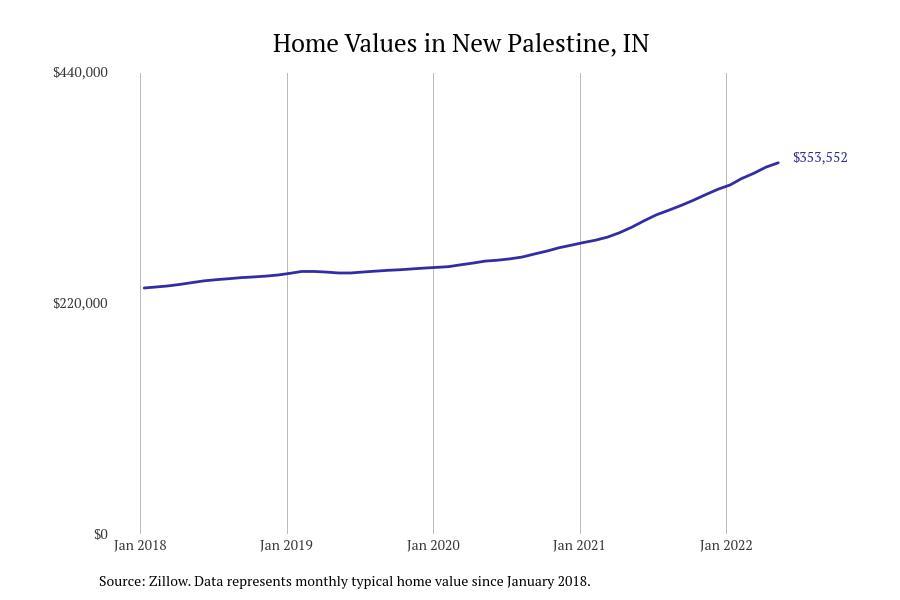
#22. New Palestine
– Typical home value: $361,924
– 1-year price change: +2.6%
– 5-year price change: +45.5%
– Metro area: Indianapolis-Carmel-Anderson, IN
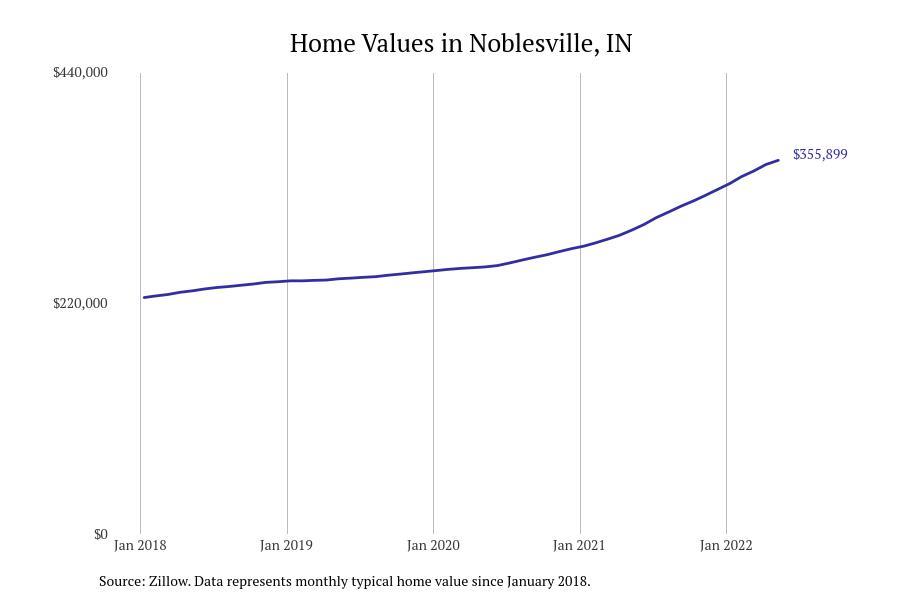
#21. Noblesville
– Typical home value: $365,288
– 1-year price change: +2.0%
– 5-year price change: +51.9%
– Metro area: Indianapolis-Carmel-Anderson, IN
You may also like: Counties with the highest STI rates in Indiana
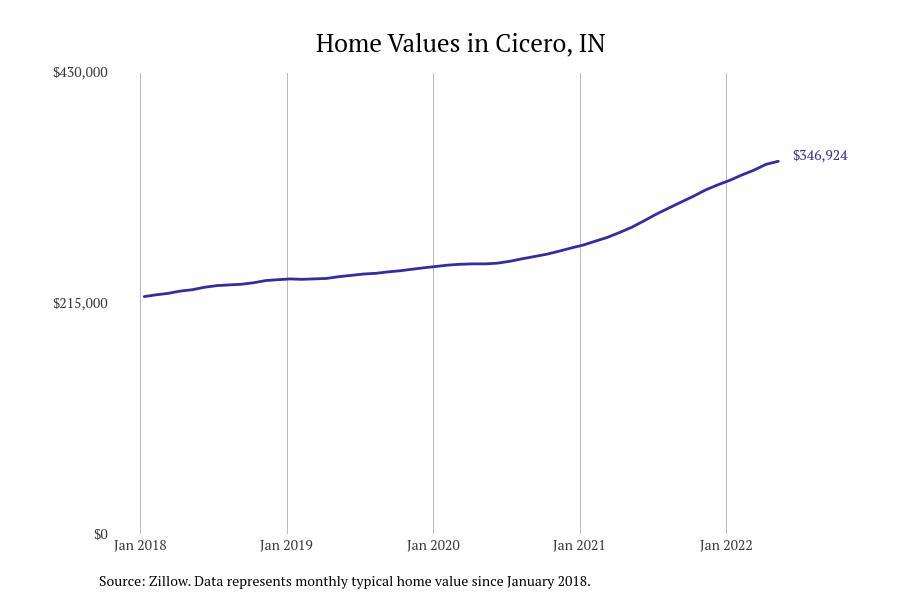
#20. Cicero
– Typical home value: $368,583
– 1-year price change: +2.4%
– 5-year price change: +50.5%
– Metro area: Indianapolis-Carmel-Anderson, IN
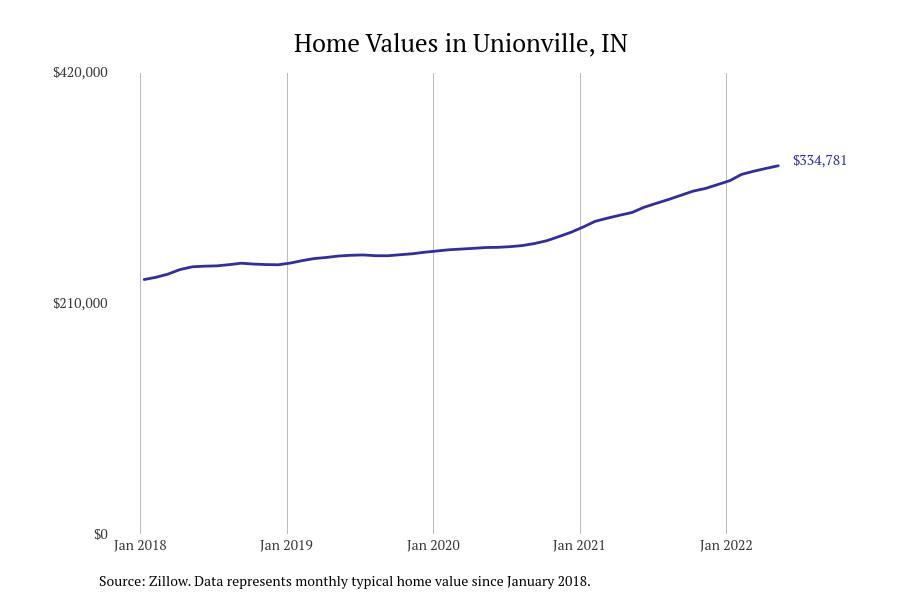
#19. Unionville
– Typical home value: $371,607
– 1-year price change: +5.0%
– 5-year price change: +55.0%
– Metro area: Bloomington, IN
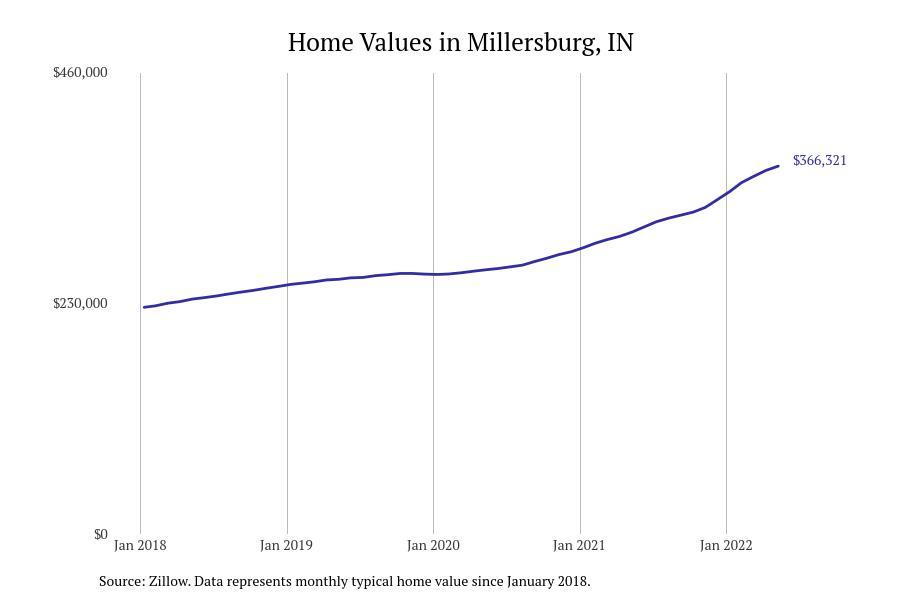
#18. Millersburg
– Typical home value: $376,351
– 1-year price change: +3.8%
– 5-year price change: +43.5%
– Metro area: Elkhart-Goshen, IN
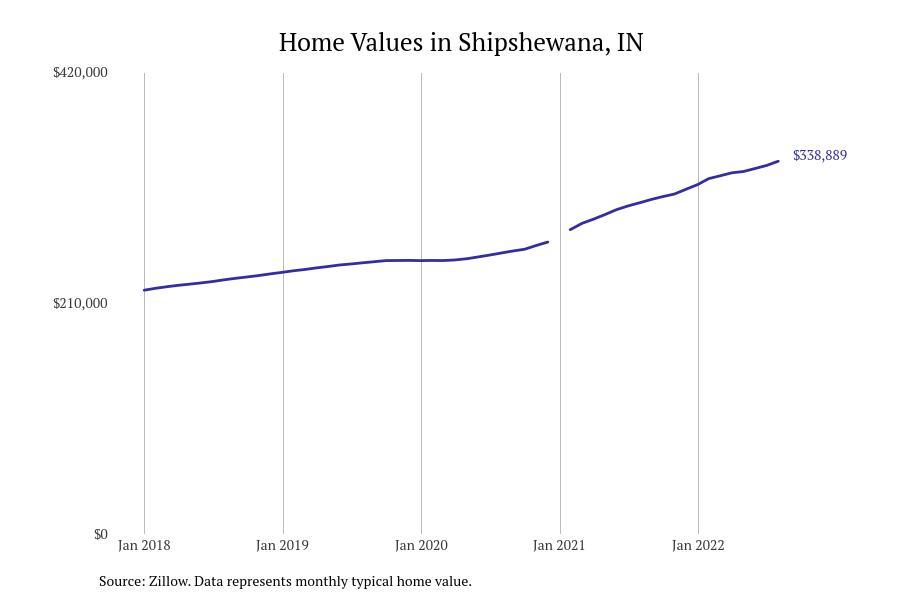
#17. Shipshewana
– Typical home value: $377,551
– 1-year price change: +4.6%
– 5-year price change: +46.8%
– Metro area: not in a metro area
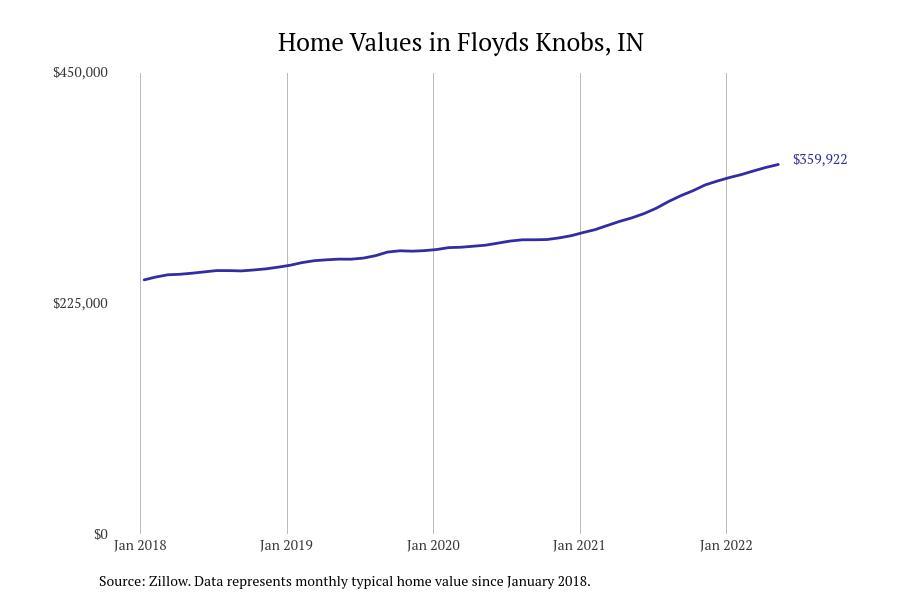
#16. Floyds Knobs
– Typical home value: $379,142
– 1-year price change: +3.0%
– 5-year price change: +36.8%
– Metro area: Louisville/Jefferson County, KY-IN
You may also like: Best colleges in Indiana
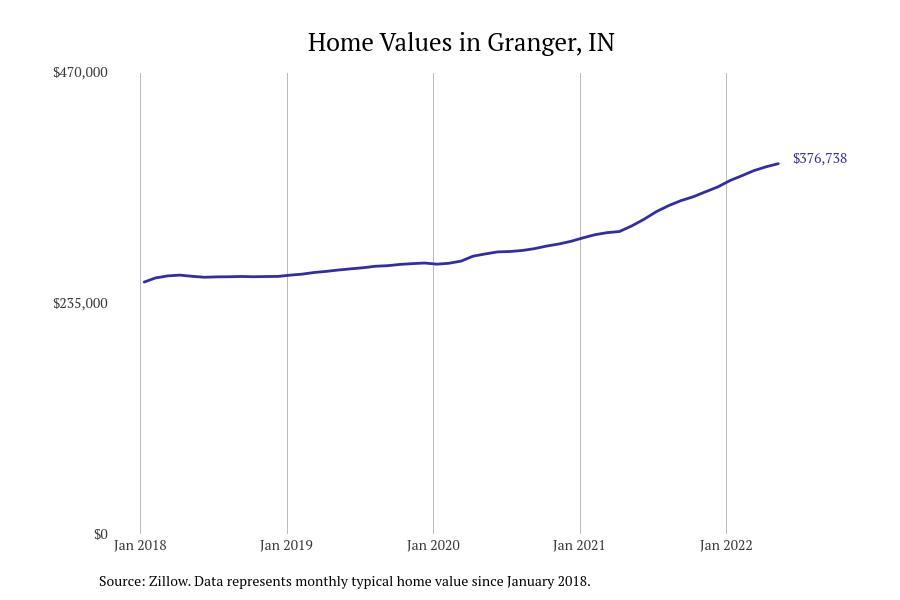
#15. Granger
– Typical home value: $380,993
– 1-year price change: +2.9%
– 5-year price change: +42.7%
– Metro area: South Bend-Mishawaka, IN-MI
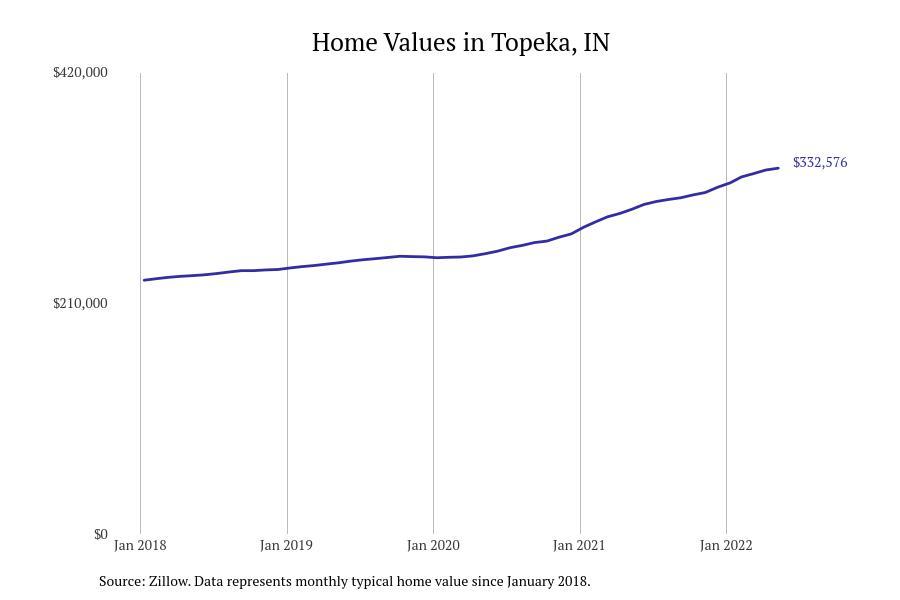
#14. Topeka
– Typical home value: $383,749
– 1-year price change: +3.7%
– 5-year price change: +35.3%
– Metro area: not in a metro area
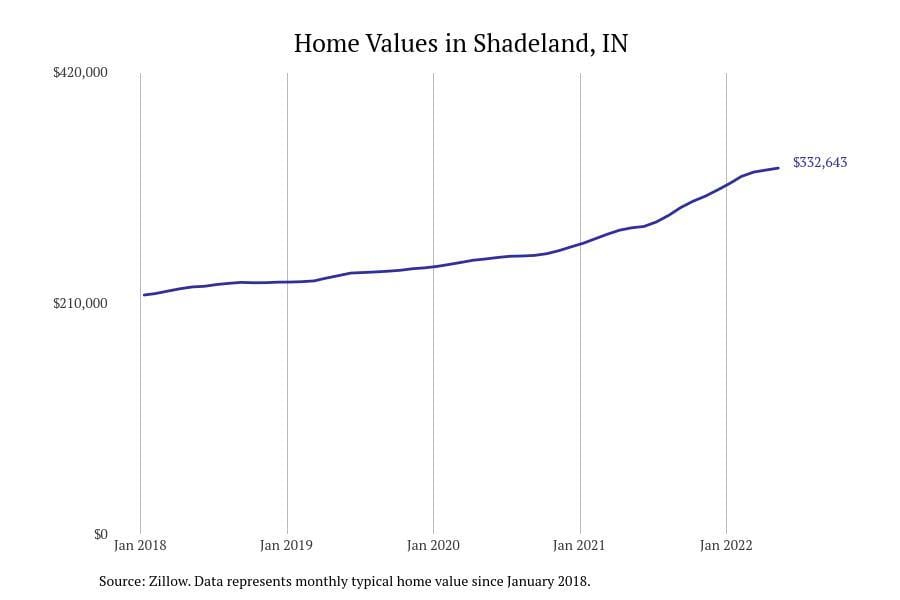
#13. Shadeland
– Typical home value: $387,794
– 1-year price change: +6.7%
– 5-year price change: +51.6%
– Metro area: Lafayette-West Lafayette, IN
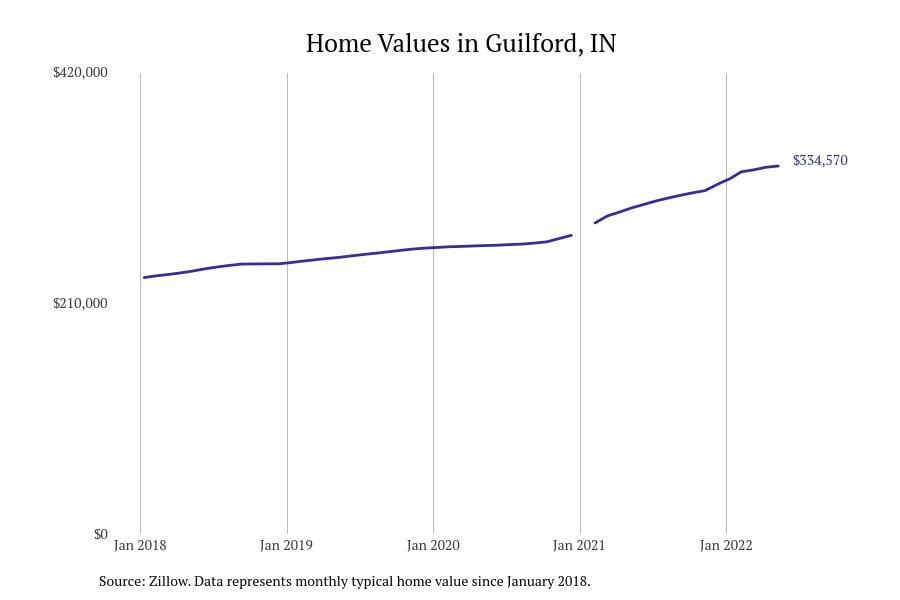
#12. Guilford
– Typical home value: $393,035
– 1-year price change: +5.2%
– 5-year price change: +55.9%
– Metro area: Cincinnati, OH-KY-IN
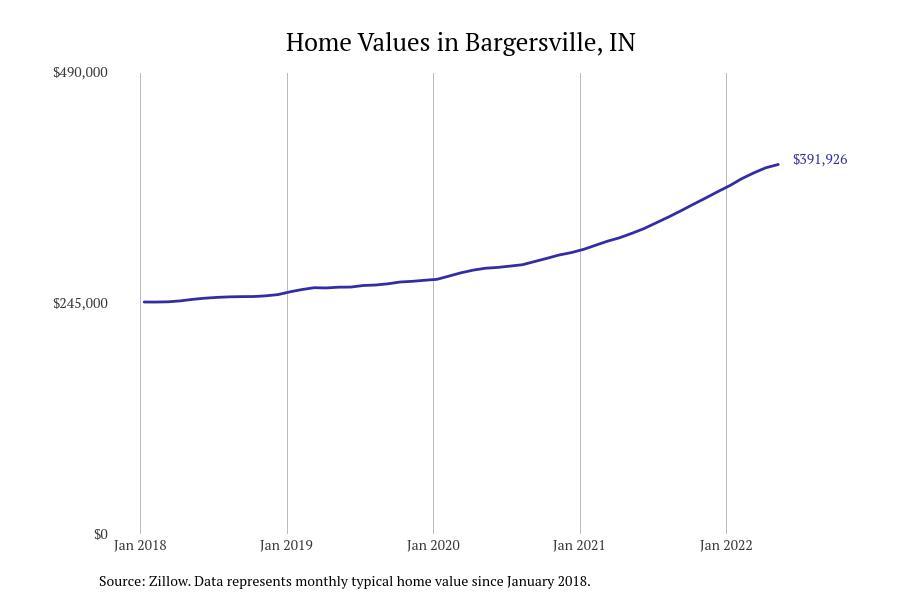
#11. Bargersville
– Typical home value: $414,058
– 1-year price change: +2.6%
– 5-year price change: +50.1%
– Metro area: Indianapolis-Carmel-Anderson, IN
You may also like: Highest-rated free things to do in Indiana, according to Tripadvisor
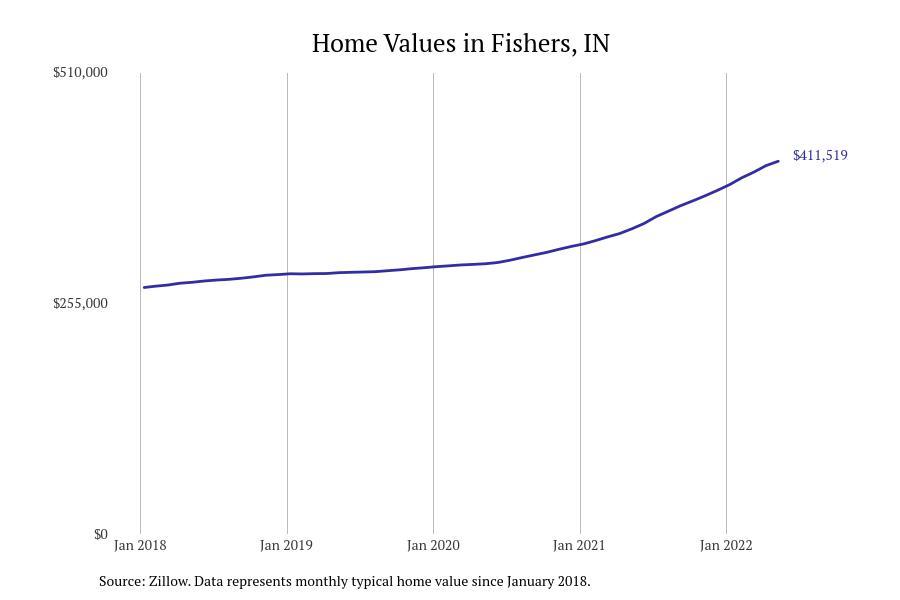
#10. Fishers
– Typical home value: $419,453
– 1-year price change: +2.1%
– 5-year price change: +49.1%
– Metro area: Indianapolis-Carmel-Anderson, IN
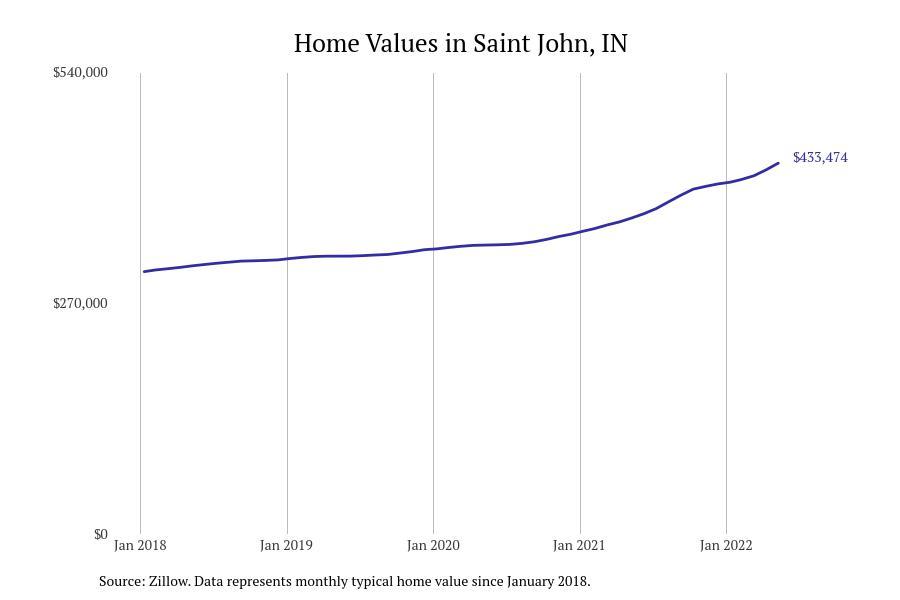
#9. Saint John
– Typical home value: $433,115
– 1-year price change: +2.0%
– 5-year price change: +31.6%
– Metro area: Chicago-Naperville-Elgin, IL-IN-WI
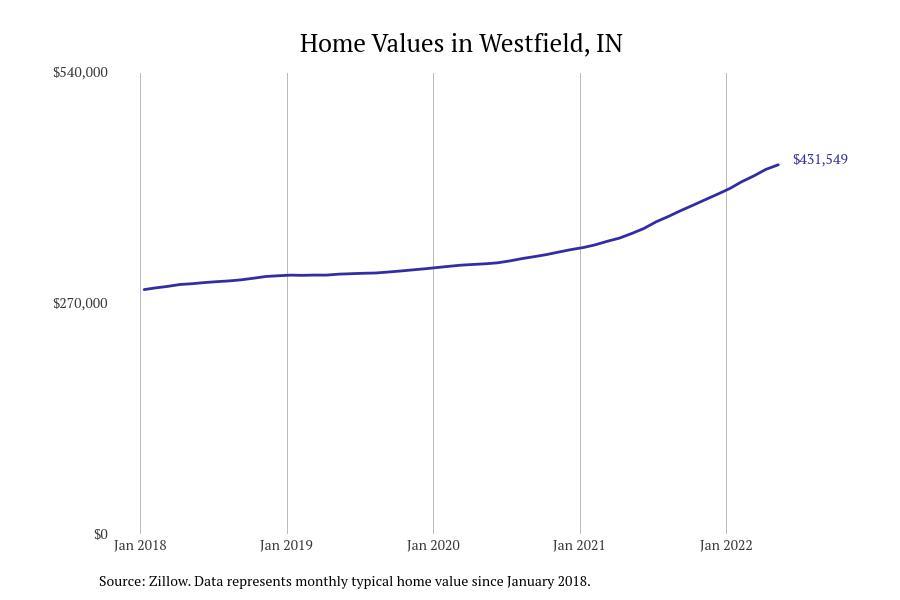
#8. Westfield
– Typical home value: $445,776
– 1-year price change: +1.4%
– 5-year price change: +47.4%
– Metro area: Indianapolis-Carmel-Anderson, IN
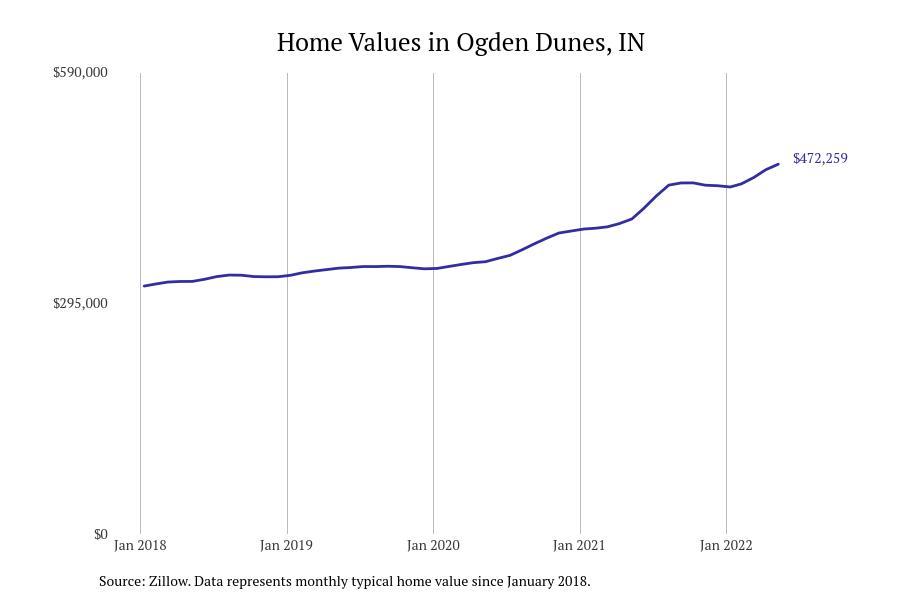
#7. Ogden Dunes
– Typical home value: $477,375
– 1-year price change: +3.2%
– 5-year price change: +42.3%
– Metro area: Chicago-Naperville-Elgin, IL-IN-WI
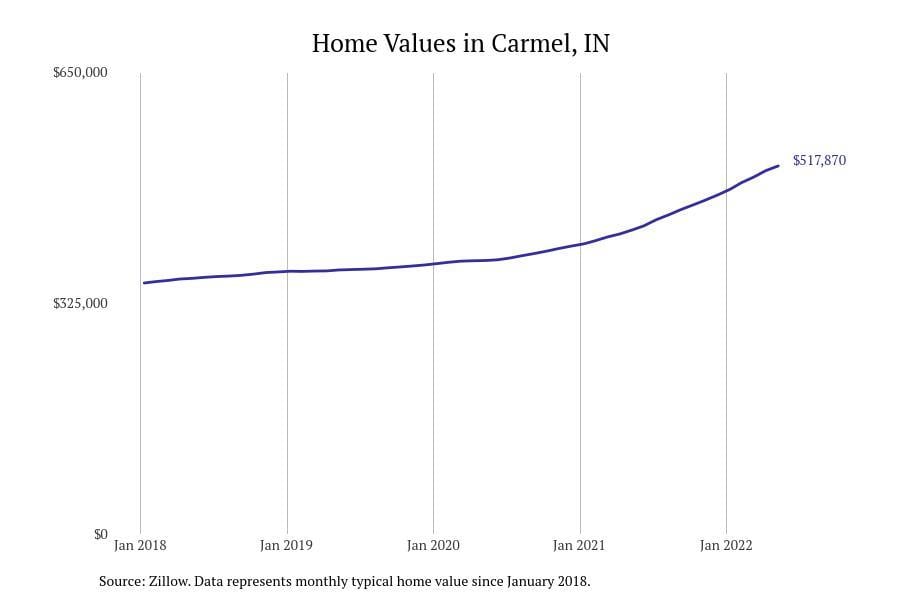
#6. Carmel
– Typical home value: $524,440
– 1-year price change: +3.6%
– 5-year price change: +51.0%
– Metro area: Indianapolis-Carmel-Anderson, IN
You may also like: How Indiana is committing to electric vehicles
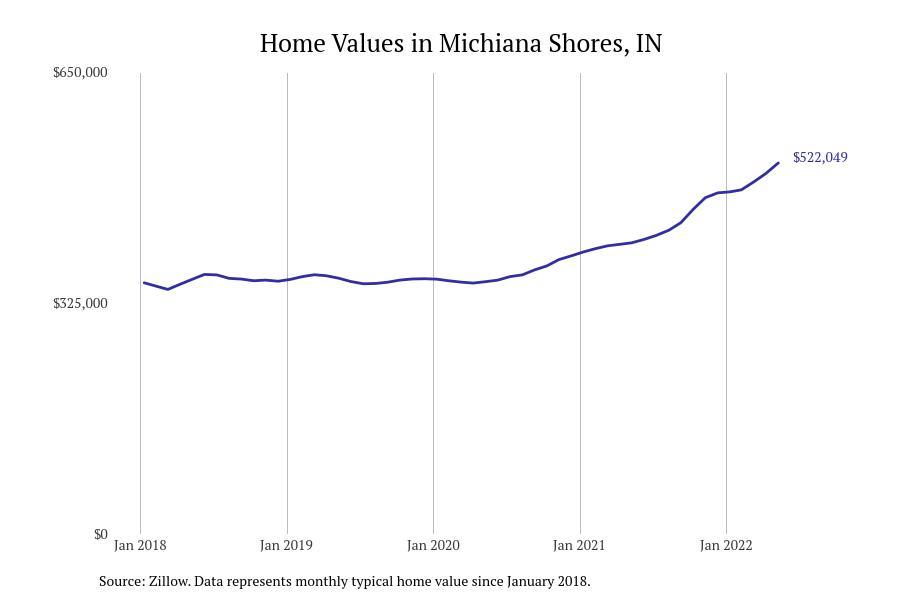
#5. Michiana Shores
– Typical home value: $577,288
– 1-year price change: +3.1%
– 5-year price change: +55.8%
– Metro area: Michigan City-La Porte, IN
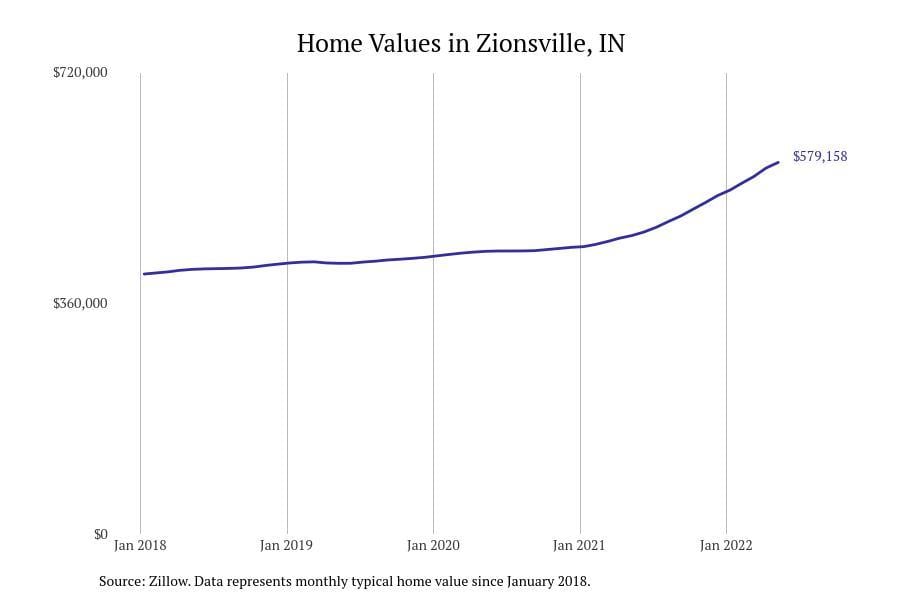
#4. Zionsville
– Typical home value: $603,365
– 1-year price change: +4.1%
– 5-year price change: +45.8%
– Metro area: Indianapolis-Carmel-Anderson, IN
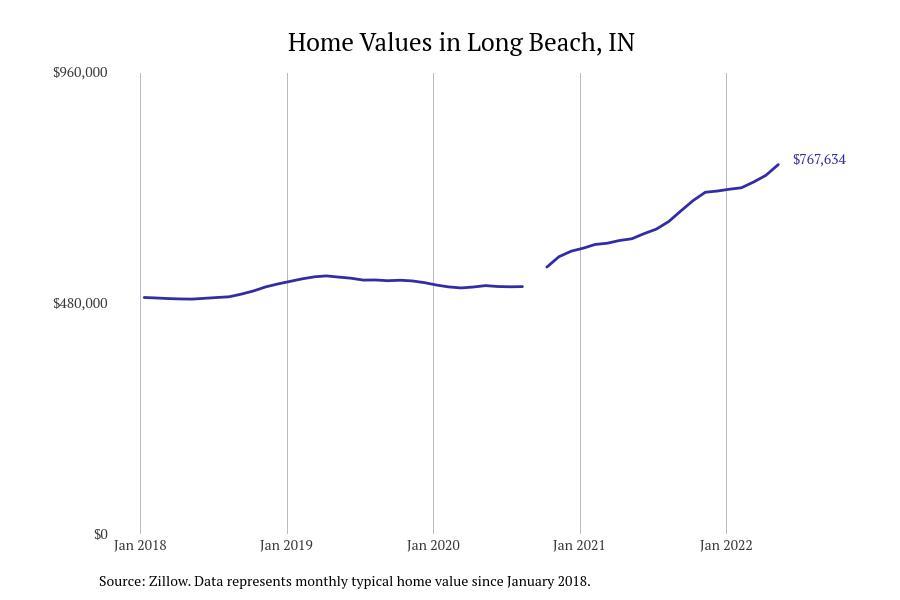
#3. Long Beach
– Typical home value: $713,492
– 1-year price change: +3.3%
– 5-year price change: +62.6%
– Metro area: Michigan City-La Porte, IN
#2. Clear Lake
– Typical home value: $763,252
– 1-year price change: +0.4%
– 5-year price change: +50.6%
– Metro area: Angola, IN
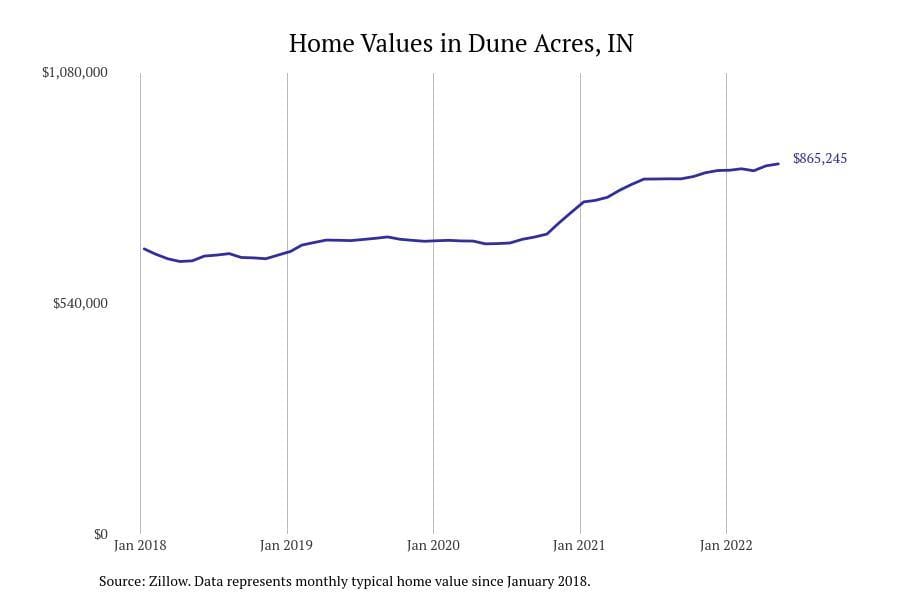
#1. Dune Acres
– Typical home value: $855,087
– 1-year price change: +3.6%
– 5-year price change: +43.9%
– Metro area: Chicago-Naperville-Elgin, IL-IN-WI
You may also like: Airports using biometric facial recognition in Indiana
By Stacker


