Cities with the most expensive towns to buy a home in the New York City metro area
If you’re looking to buy a home near New York City, be prepared—some of the most desirable towns in the metro area come with jaw-dropping price tags.
Purchasing a home is one of the most important investments there is. More than a place to live, homeownership is an asset with the potential to tremendously rise in value. But with home prices reaching record heights, affordability plays a huge role for buyers.
The typical home value in the United States was $358,461 in December, 2.6% higher than the year before.
High mortgage rates are also making monthly payments more expensive; as of January 16, the 30-year fixed mortgage rate sits at 7.04%.
Although home prices have inflated all across the U.S., there are some cities that command a higher price tag than others. Location, size, age, and condition are all contributing factors to home value.
Stacker compiled a list of cities with the most expensive homes in the New York City metro area using data from Zillow. Charts show the monthly typical home value since January 2018. Data was available for 560 cities and towns.
You may also like: Most expensive homes for sale in New York City
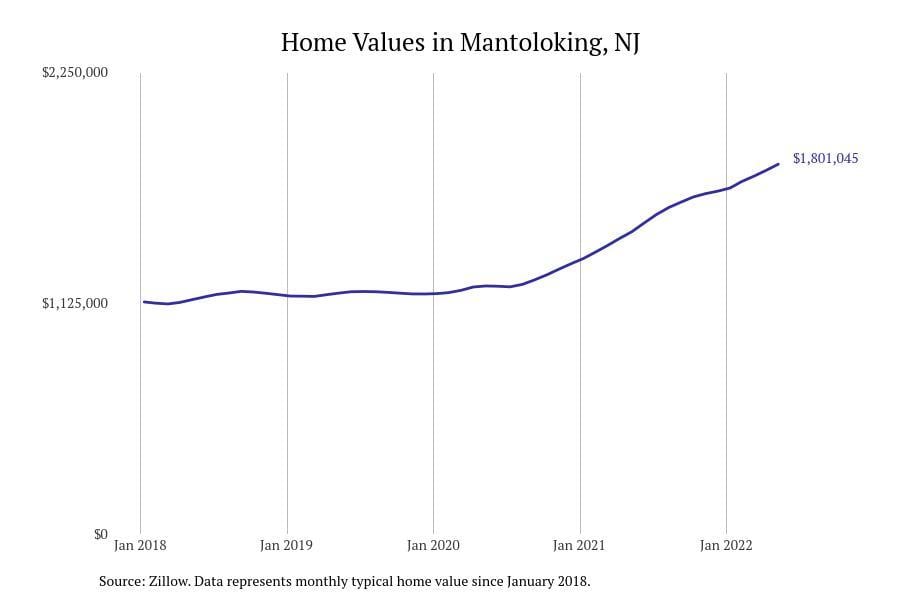
#30. Mantoloking, NJ
– Typical home value: $1,822,775
– 1-year price change: +11.3%
– 5-year price change: +73.4%
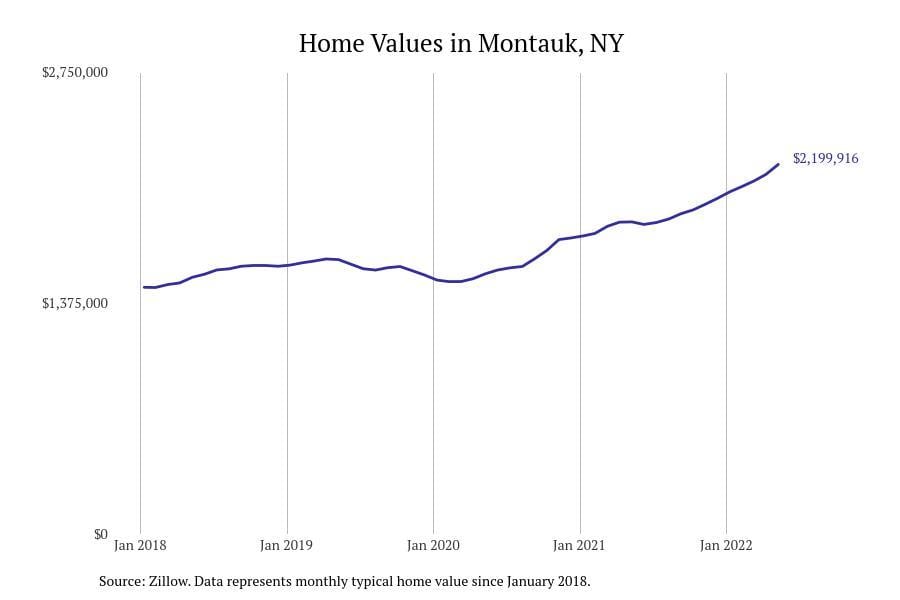
#29. Montauk, NY
– Typical home value: $1,857,722
– 1-year price change: +6.4%
– 5-year price change: +58.9%
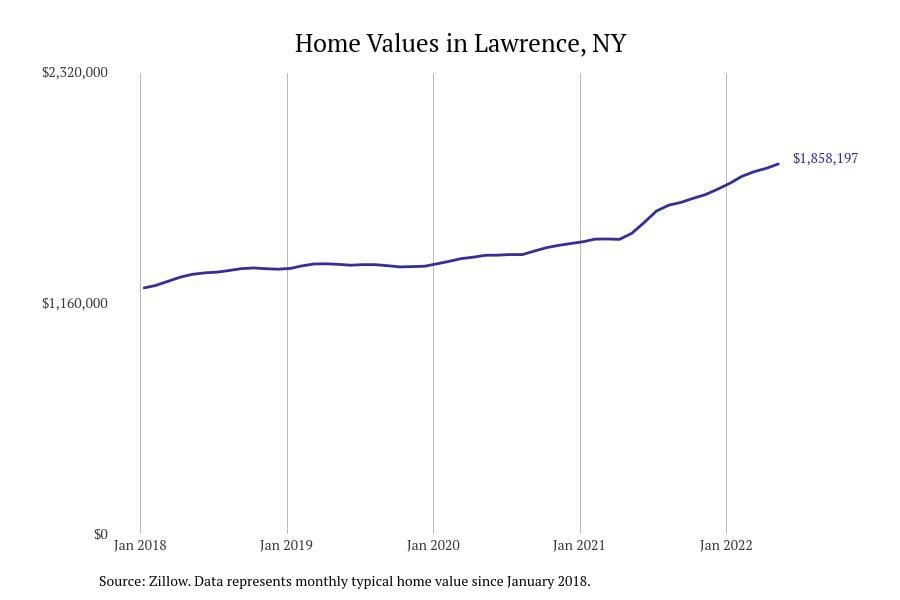
#28. Lawrence, NY
– Typical home value: $1,903,719
– 1-year price change: +9.7%
– 5-year price change: +73.5%
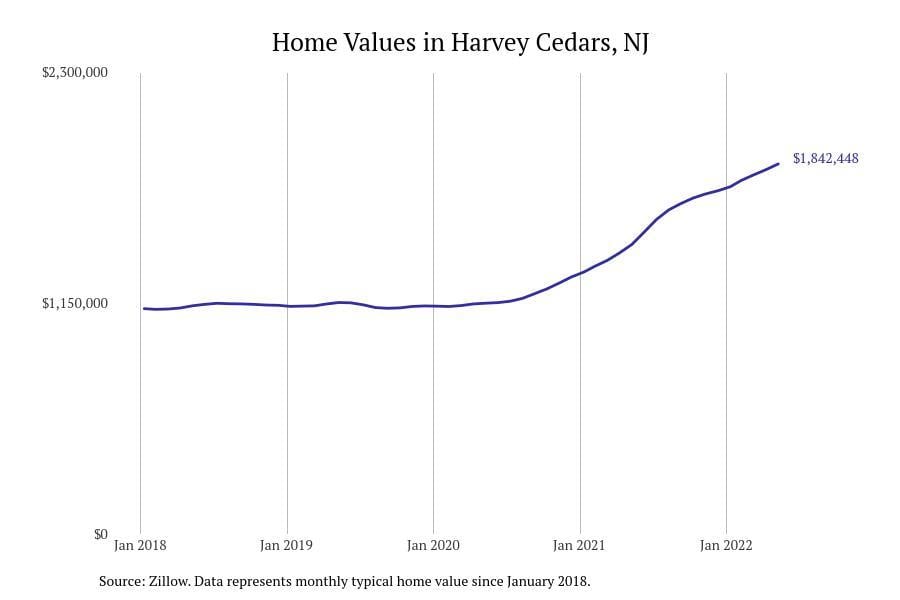
#27. Harvey Cedars, NJ
– Typical home value: $1,942,328
– 1-year price change: +7.4%
– 5-year price change: +73.5%
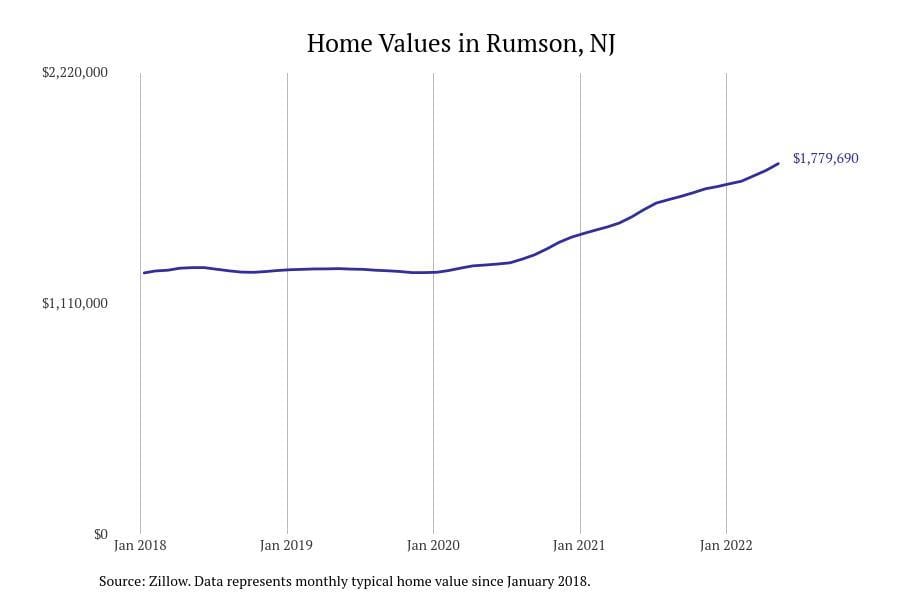
#26. Rumson, NJ
– Typical home value: $1,981,861
– 1-year price change: +7.0%
– 5-year price change: +67.5%
You may also like: The 50 top-selling used cars in New York City metro area so far in 2024
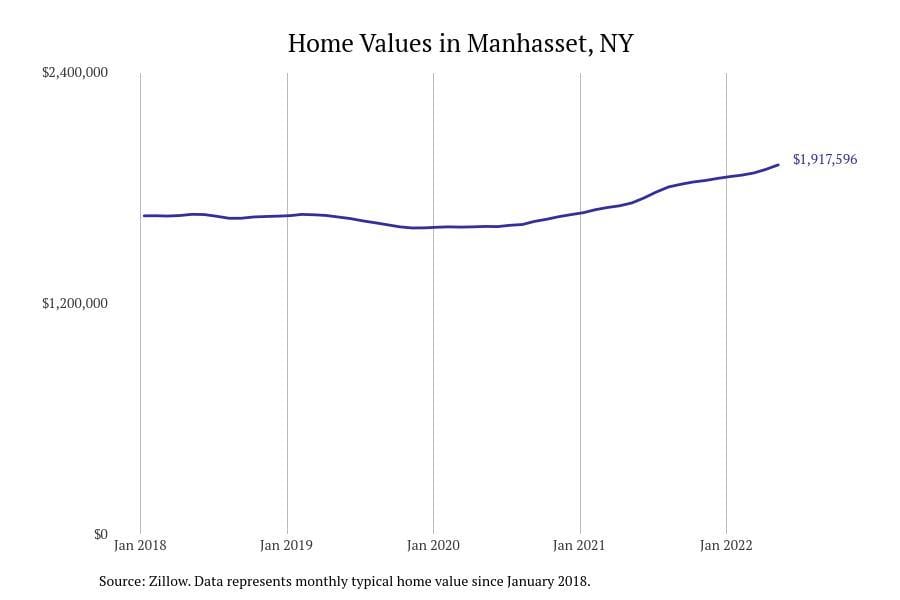
#25. Manhasset, NY
– Typical home value: $1,984,740
– 1-year price change: +8.3%
– 5-year price change: +32.0%
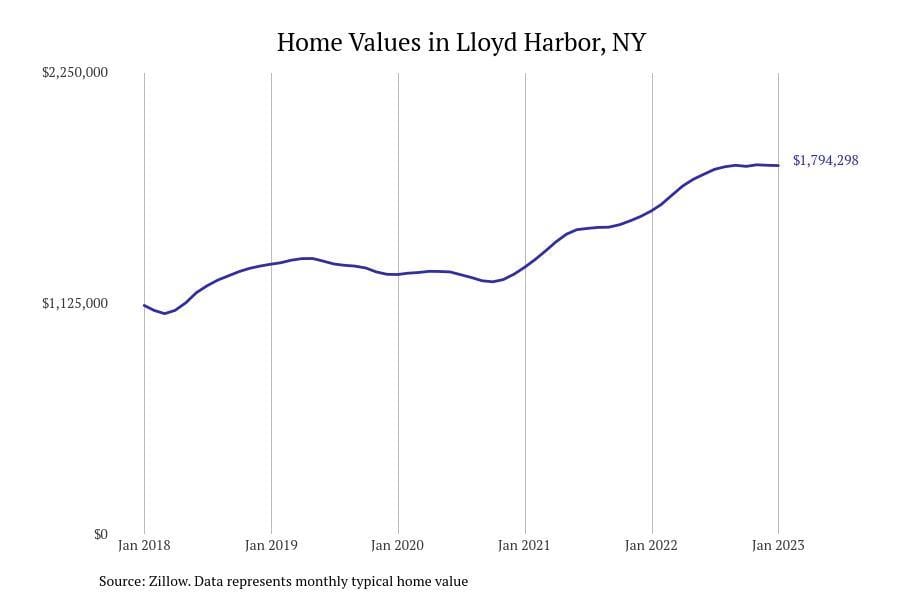
#24. Lloyd Harbor, NY
– Typical home value: $2,021,312
– 1-year price change: +1.9%
– 5-year price change: +33.0%
🏡 Find Your Perfect Town in the USA
Tell us about your ideal lifestyle and we'll recommend 10 amazing towns across America that match your preferences!
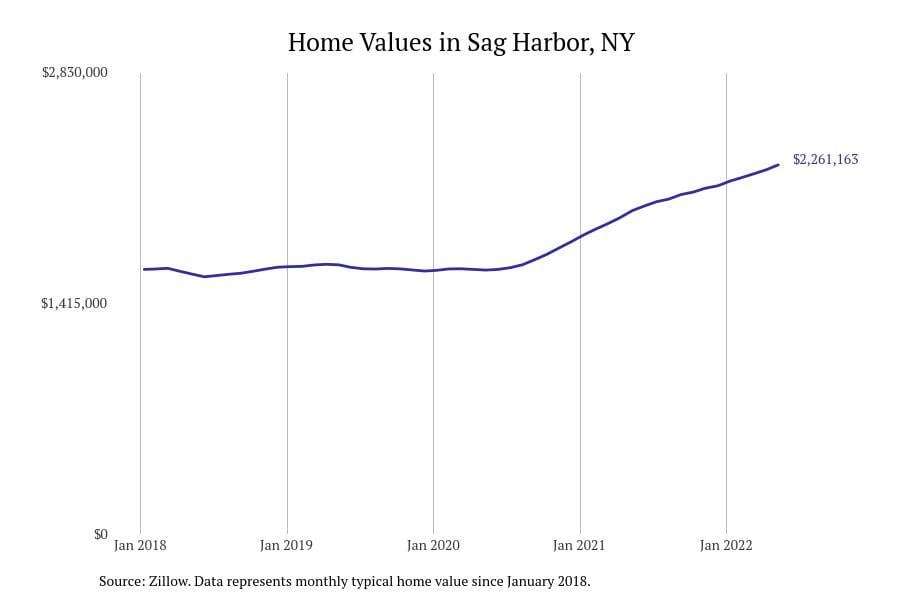
#23. Sag Harbor, NY
– Typical home value: $2,032,705
– 1-year price change: +4.3%
– 5-year price change: +53.5%
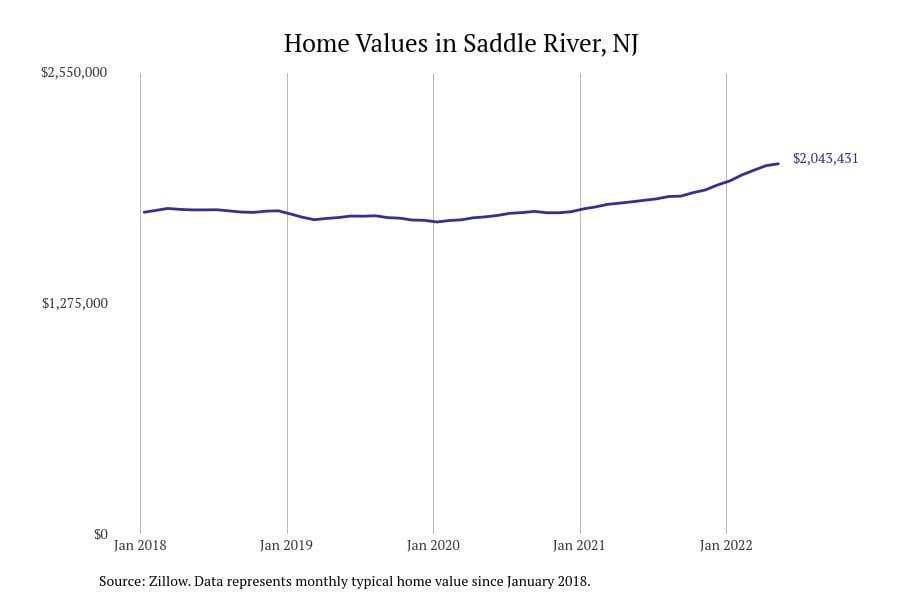
#22. Saddle River, NJ
– Typical home value: $2,032,852
– 1-year price change: +8.2%
– 5-year price change: +35.6%
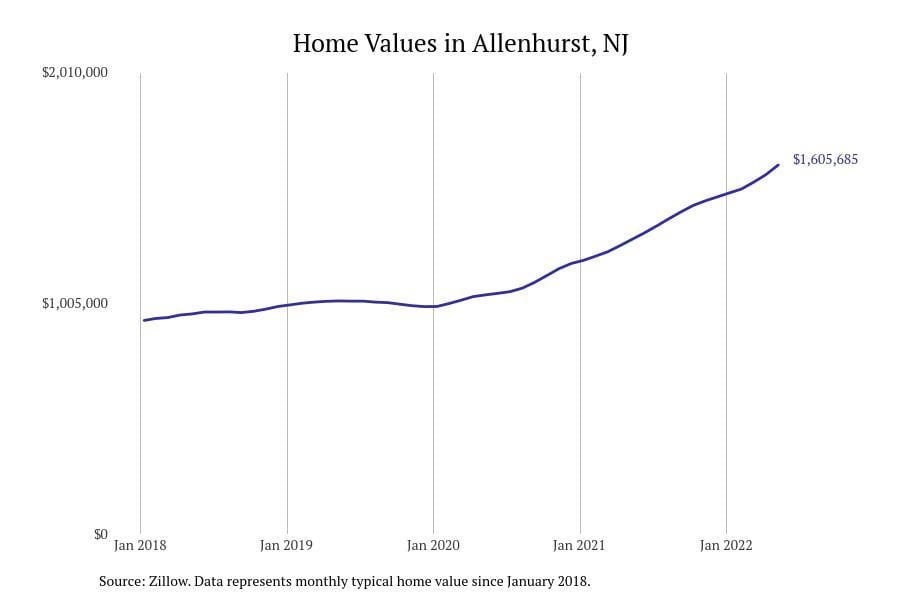
#21. Allenhurst, NJ
– Typical home value: $2,038,398
– 1-year price change: +8.3%
– 5-year price change: +117.1%
You may also like: Best places for 9 popular indoor activities in New York City
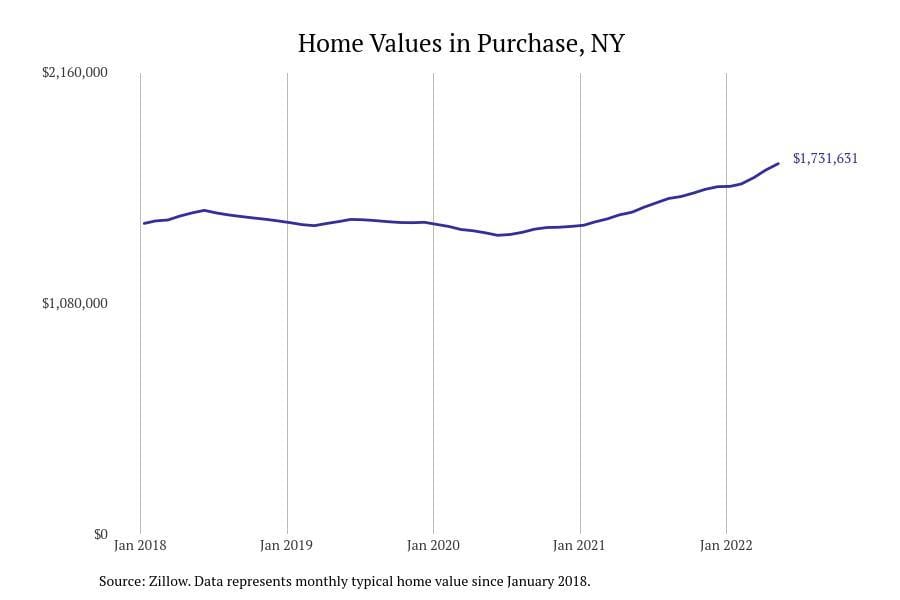
#20. Purchase, NY
– Typical home value: $2,052,999
– 1-year price change: +8.4%
– 5-year price change: +42.8%

#19. Laurel Hollow, NY
– Typical home value: $2,072,799
– 1-year price change: +9.5%
– 5-year price change: +45.9%
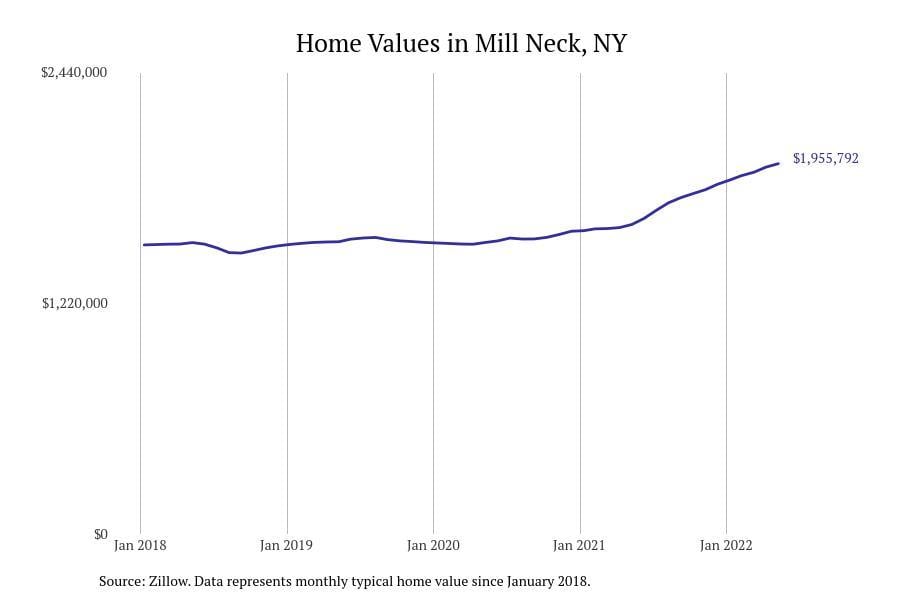
#18. Mill Neck, NY
– Typical home value: $2,082,080
– 1-year price change: +9.4%
– 5-year price change: +45.0%
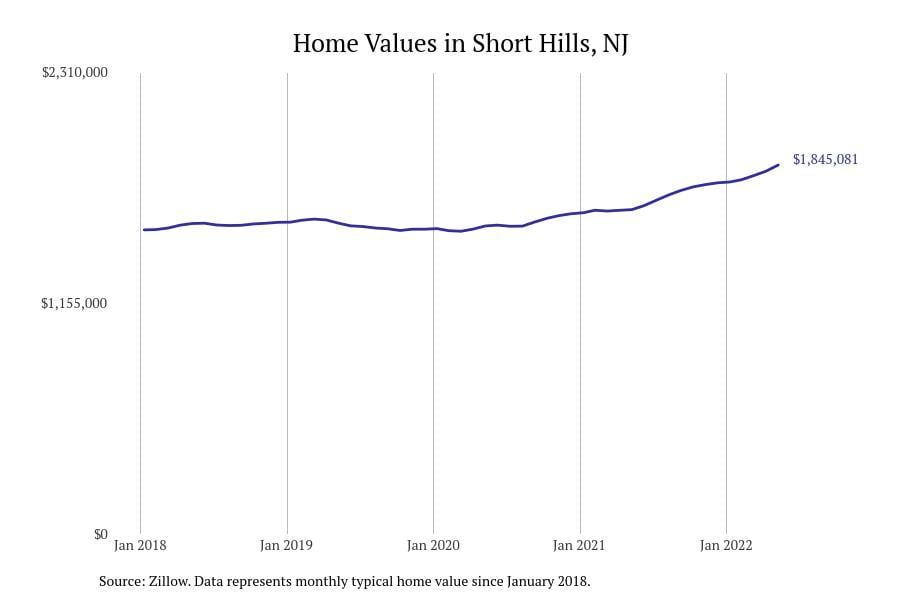
#17. Short Hills, NJ
– Typical home value: $2,083,023
– 1-year price change: +9.4%
– 5-year price change: +56.2%
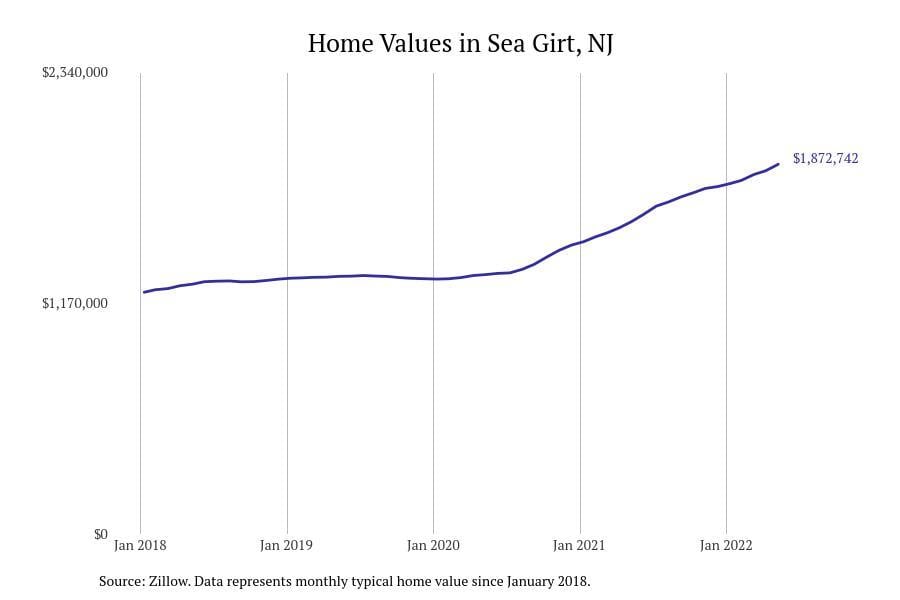
#16. Sea Girt, NJ
– Typical home value: $2,085,081
– 1-year price change: +10.8%
– 5-year price change: +83.1%
You may also like: Highest-rated Mexican restaurants in New York City by diners
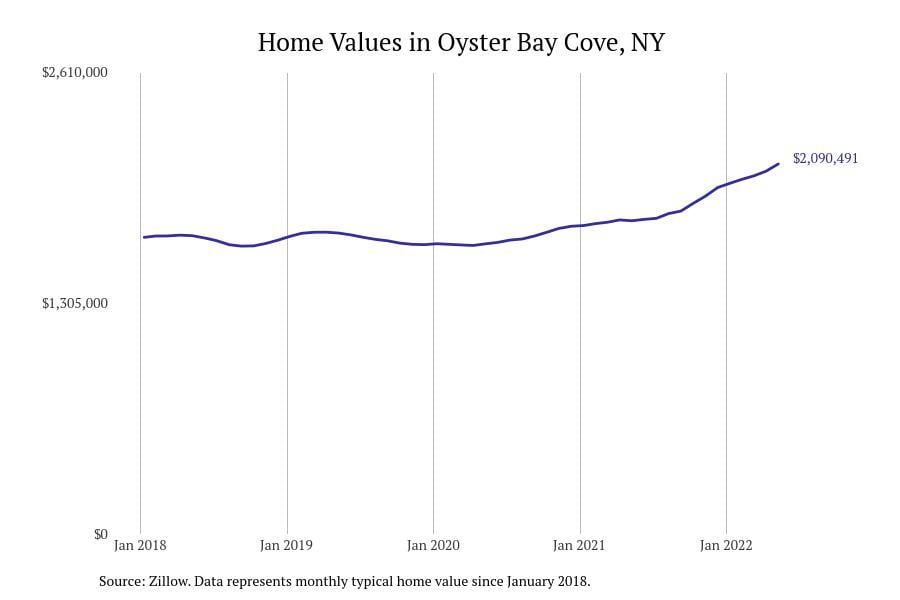
#15. Oyster Bay Cove, NY
– Typical home value: $2,110,689
– 1-year price change: +9.8%
– 5-year price change: +49.4%
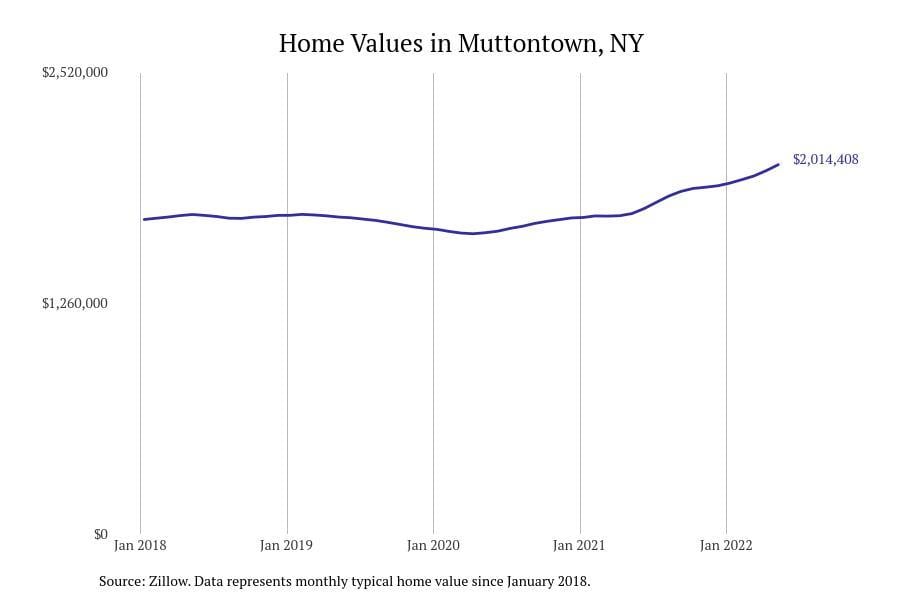
#14. Muttontown, NY
– Typical home value: $2,122,780
– 1-year price change: +7.4%
– 5-year price change: +35.4%
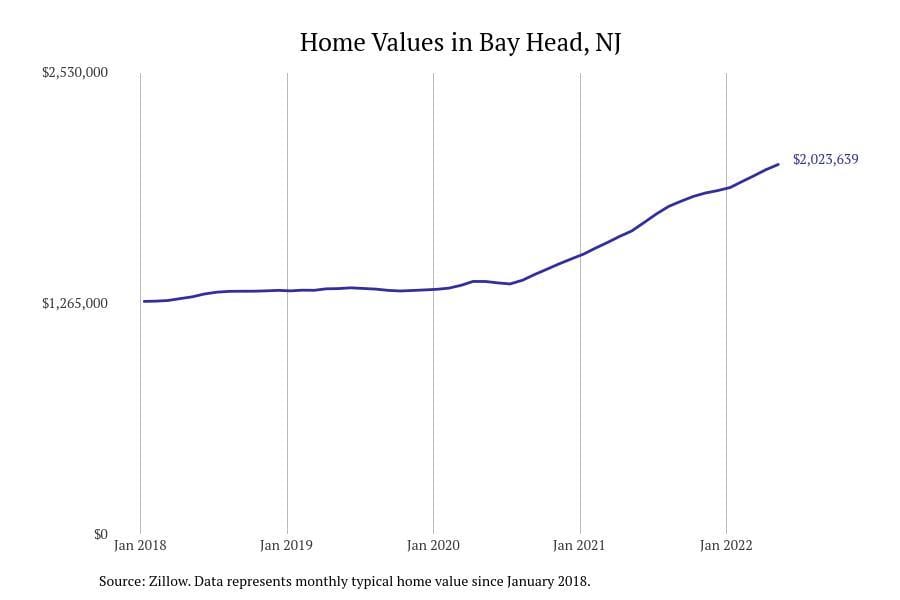
#13. Bay Head, NJ
– Typical home value: $2,137,622
– 1-year price change: +9.7%
– 5-year price change: +62.9%

#12. Upper Brookville, NY
– Typical home value: $2,332,279
– 1-year price change: +11.8%
– 5-year price change: +46.2%
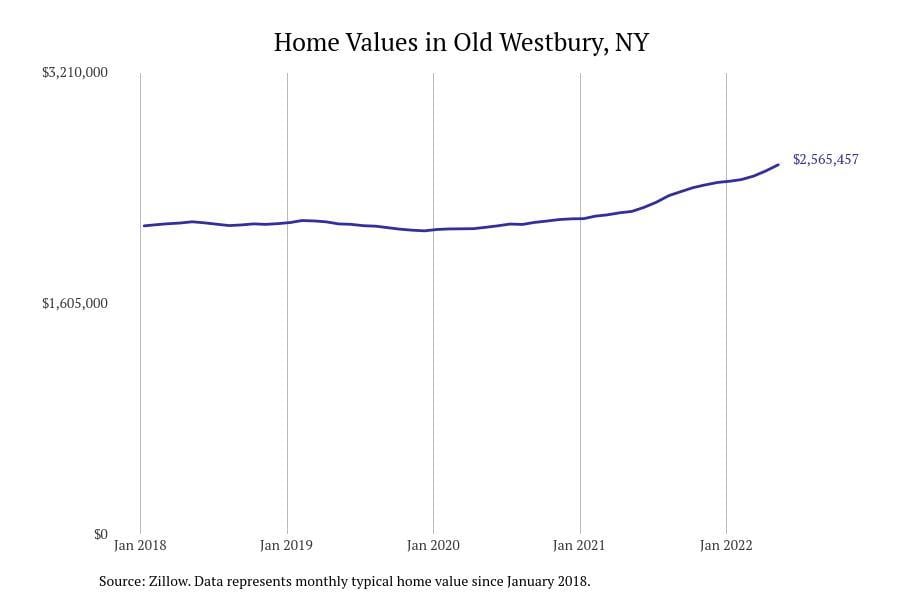
#11. Old Westbury, NY
– Typical home value: $2,648,073
– 1-year price change: +9.2%
– 5-year price change: +49.7%
You may also like: How gas prices have changed in New York City in the last week
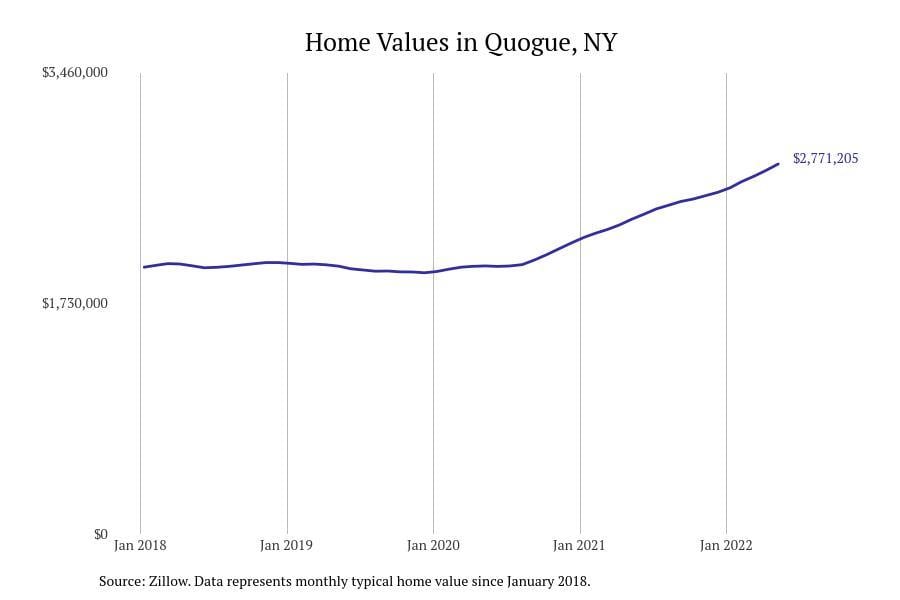
#10. Quogue, NY
– Typical home value: $2,745,376
– 1-year price change: +4.7%
– 5-year price change: +56.5%
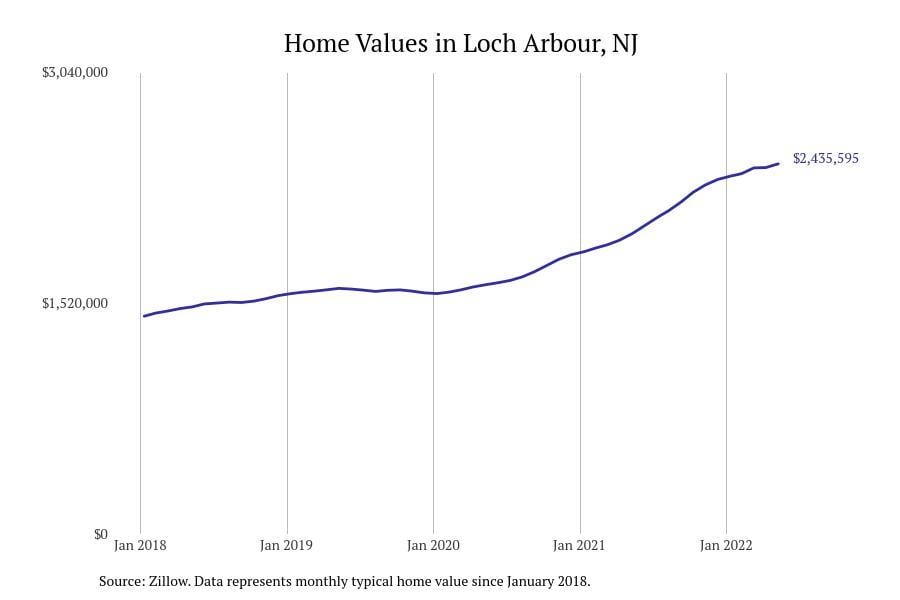
#9. Loch Arbour, NJ
– Typical home value: $2,782,468
– 1-year price change: +10.0%
– 5-year price change: data not available
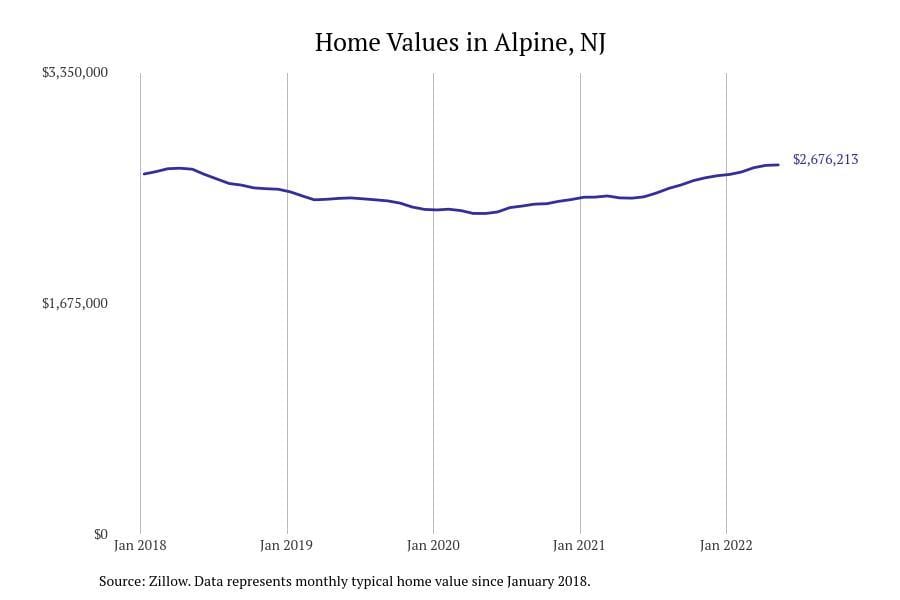
#8. Alpine, NJ
– Typical home value: $2,800,007
– 1-year price change: +7.1%
– 5-year price change: +37.8%
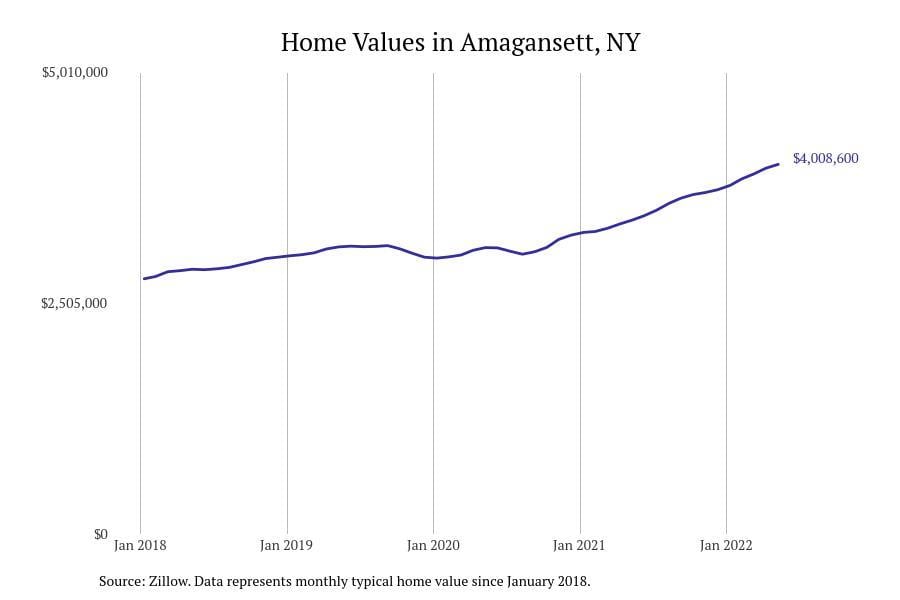
#7. Amagansett, NY
– Typical home value: $2,903,178
– 1-year price change: +0.0%
– 5-year price change: +39.9%
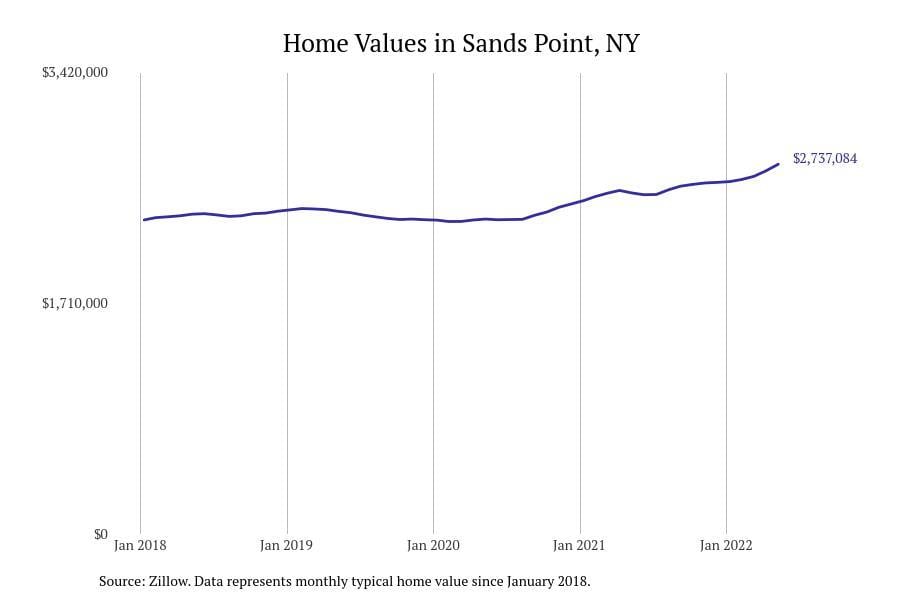
#6. Sands Point, NY
– Typical home value: $2,918,357
– 1-year price change: +7.5%
– 5-year price change: +37.6%
You may also like: Highest-ranked pizza restaurants in New York City by diners
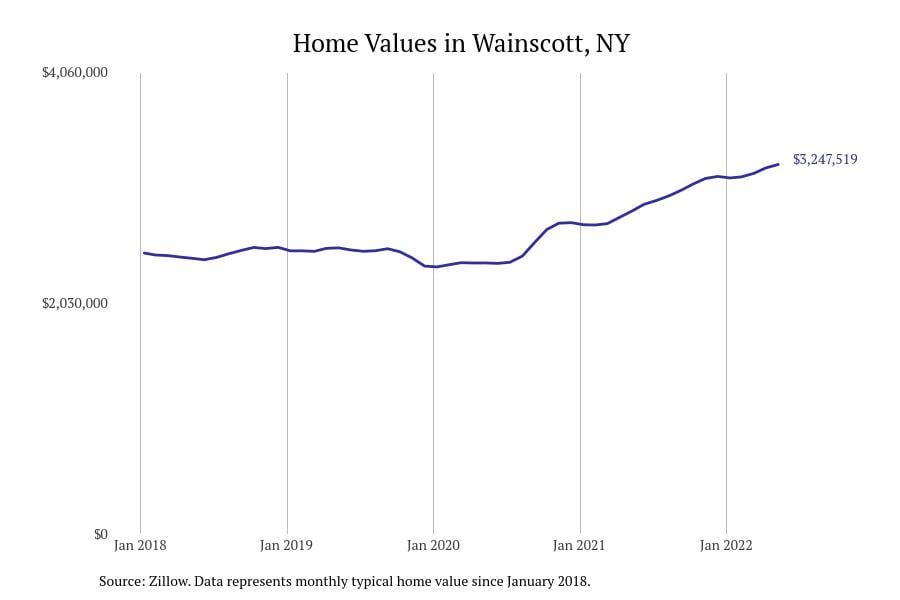
#5. Wainscott, NY
– Typical home value: $3,393,757
– 1-year price change: +1.2%
– 5-year price change: +37.5%
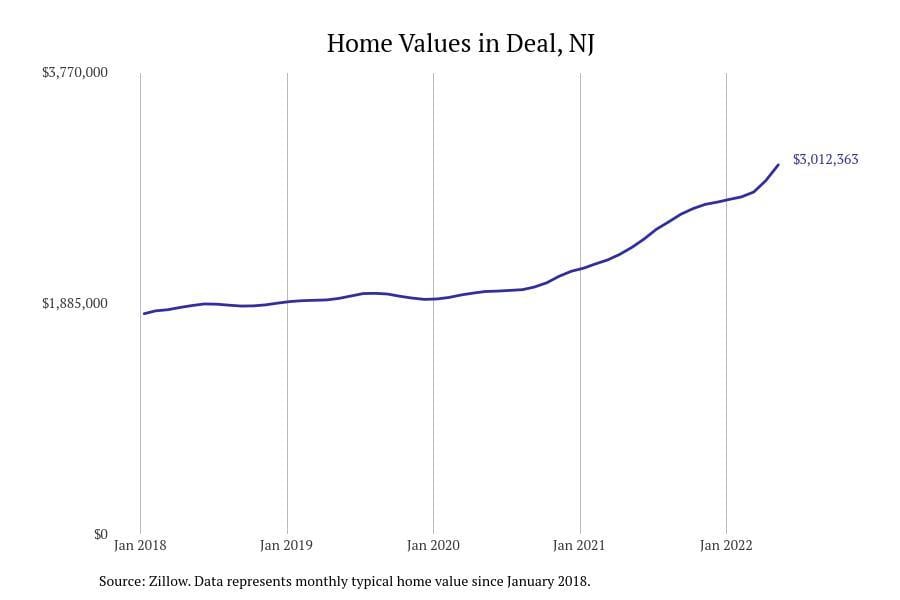
#4. Deal, NJ
– Typical home value: $3,772,249
– 1-year price change: +8.6%
– 5-year price change: +101.5%
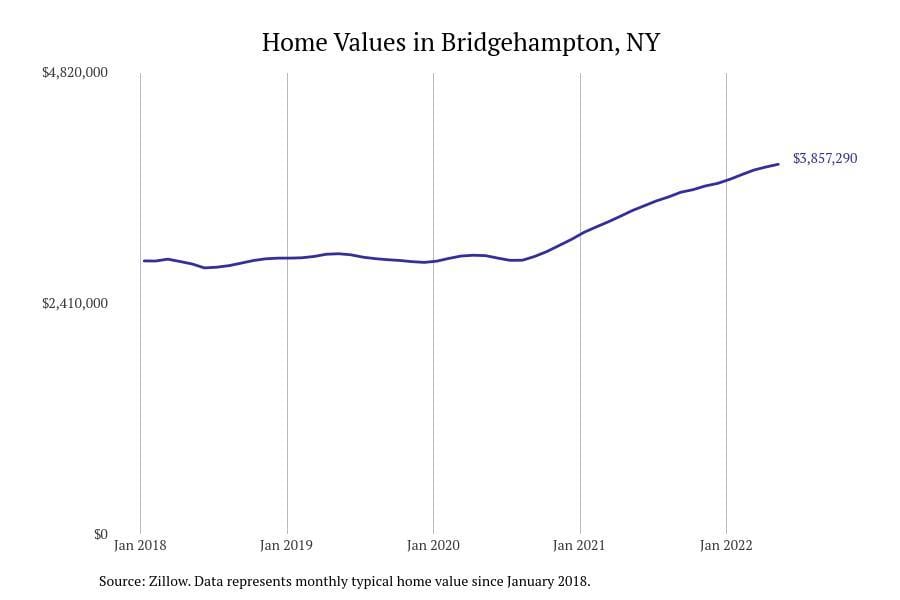
#3. Bridgehampton, NY
– Typical home value: $4,038,797
– 1-year price change: +6.1%
– 5-year price change: +56.0%
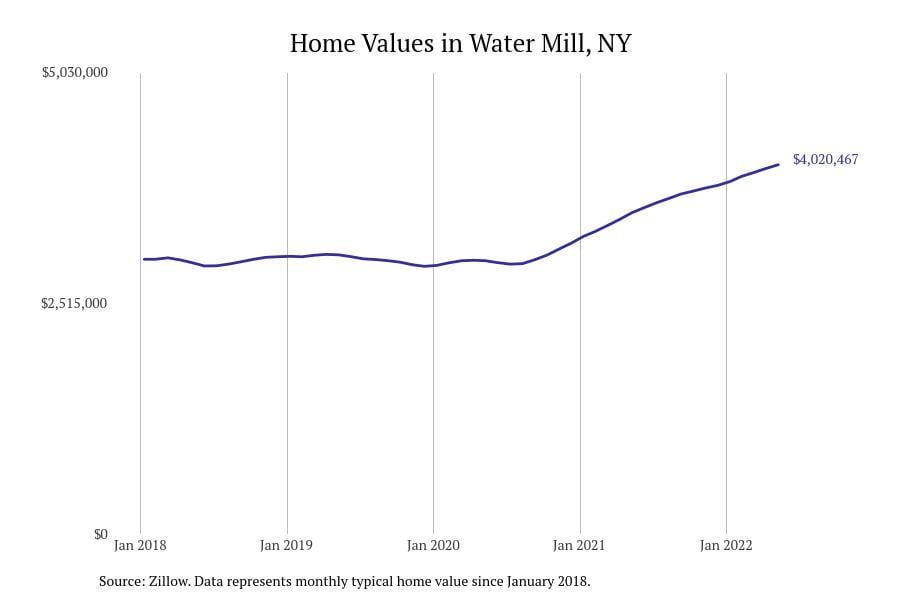
#2. Water Mill, NY
– Typical home value: $4,305,597
– 1-year price change: +6.0%
– 5-year price change: +54.5%
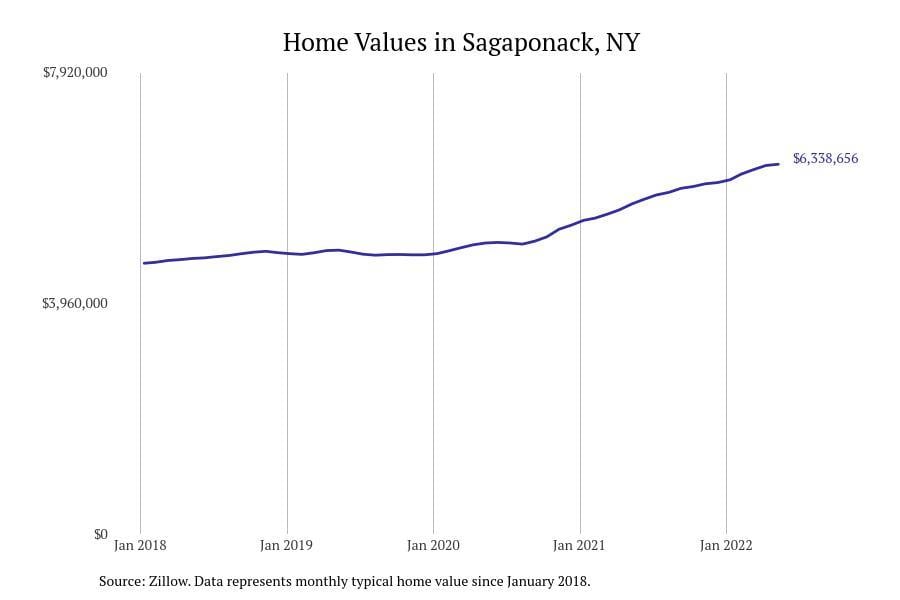
#1. Sagaponack, NY
– Typical home value: $6,676,419
– 1-year price change: +9.7%
– 5-year price change: +56.3%
You may also like: Movies and TV shows casting in New York City
By Stacker
🏡 Find Your Perfect Town in the USA
Tell us about your ideal lifestyle and we'll recommend 10 amazing towns across America that match your preferences!