Would you like to save this?
Housing patterns are repeating themselves across Ohio—and not in a good way. Data from the Zillow Home Value Index shows 17 towns hitting the same risk signals seen before previous market drops. Overextended prices, extreme volatility, and slowing momentum are forming a dangerous pattern that mirrors conditions before past housing corrections.
Our analysis spans 15 years of data and five proven crash indicators, revealing the most vulnerable markets across the state. In some towns, home values have surged more than 150% since 2010. Others have already weathered multiple 8%+ downturns. The warning signs are clear—and in places like Johnstown and Buckeye Lake, the numbers suggest the next correction may be close.
17. Buckeye Lake – Crash Risk Percentage: 77%
- Crash Risk Percentage: 77%
- Historical crashes (8%+ drops): 2
- Worst historical crash: -13.0% (2017)
- Total price increase since 2010: 142.7%
- Overextended above long-term average: 65.9%
- Price volatility (annual swings): 12.4%
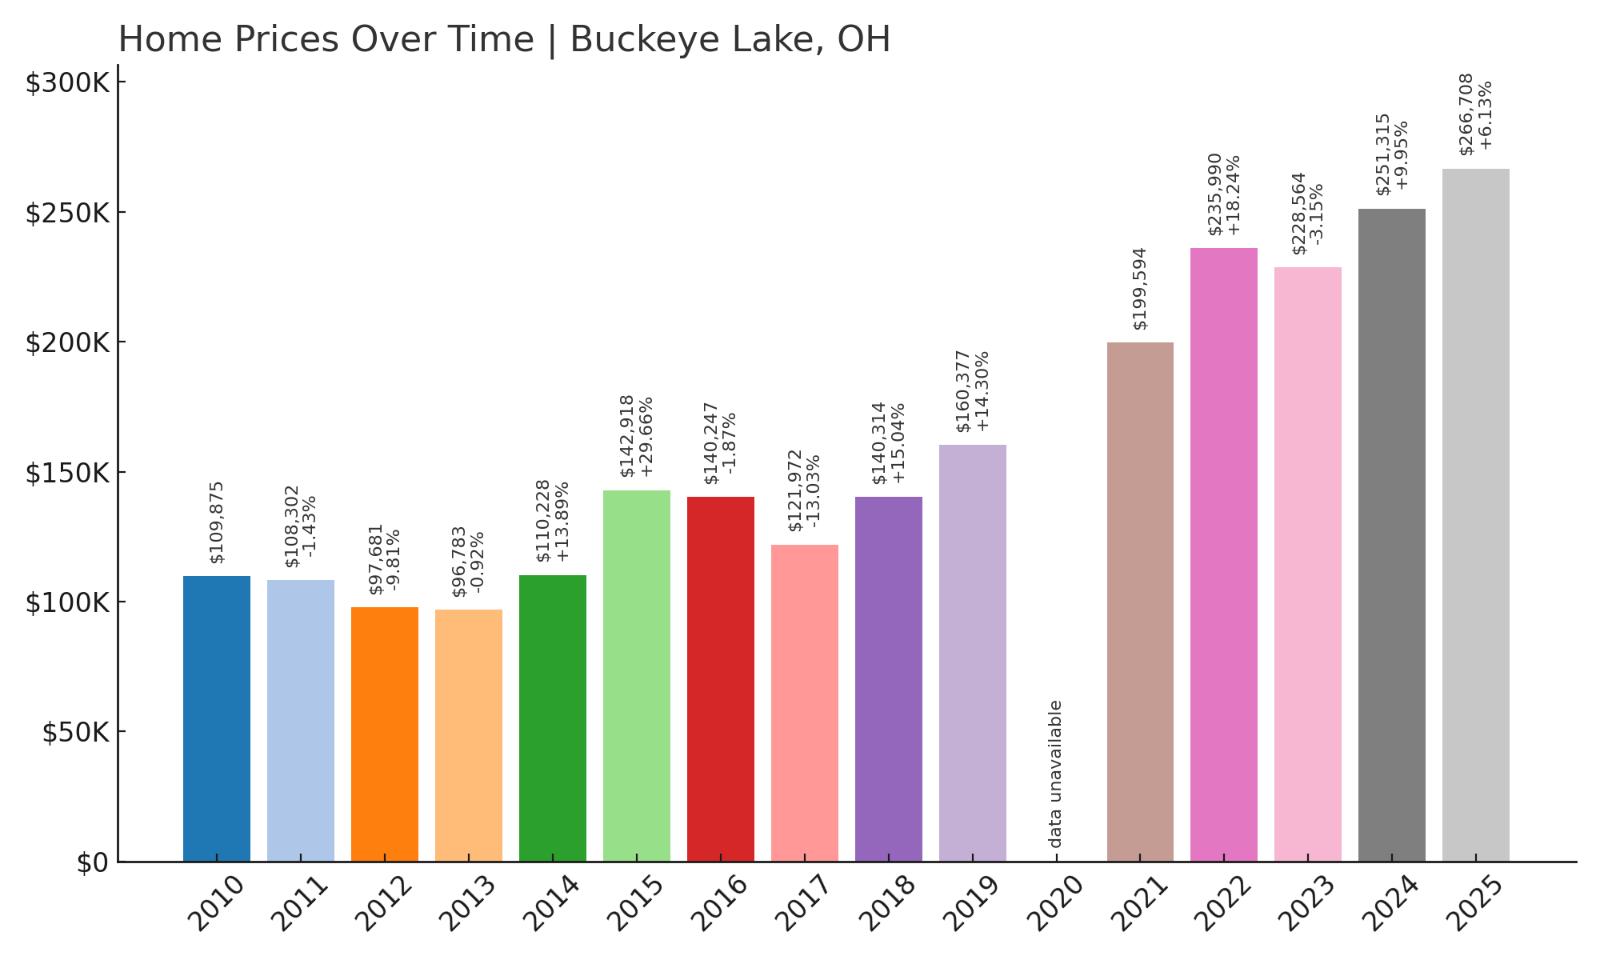
- Current 2025 price: $266,708
Buckeye Lake has experienced explosive growth with home values more than doubling since 2010, creating significant vulnerability in today’s market. The community suffered two major crashes in recent history, including a devastating 13% drop in 2017 that wiped out years of gains. Currently trading 66% above its long-term average, the market shows classic signs of overheating that preceded previous corrections.
Buckeye Lake – Volatile Growth Patterns Signal Instability
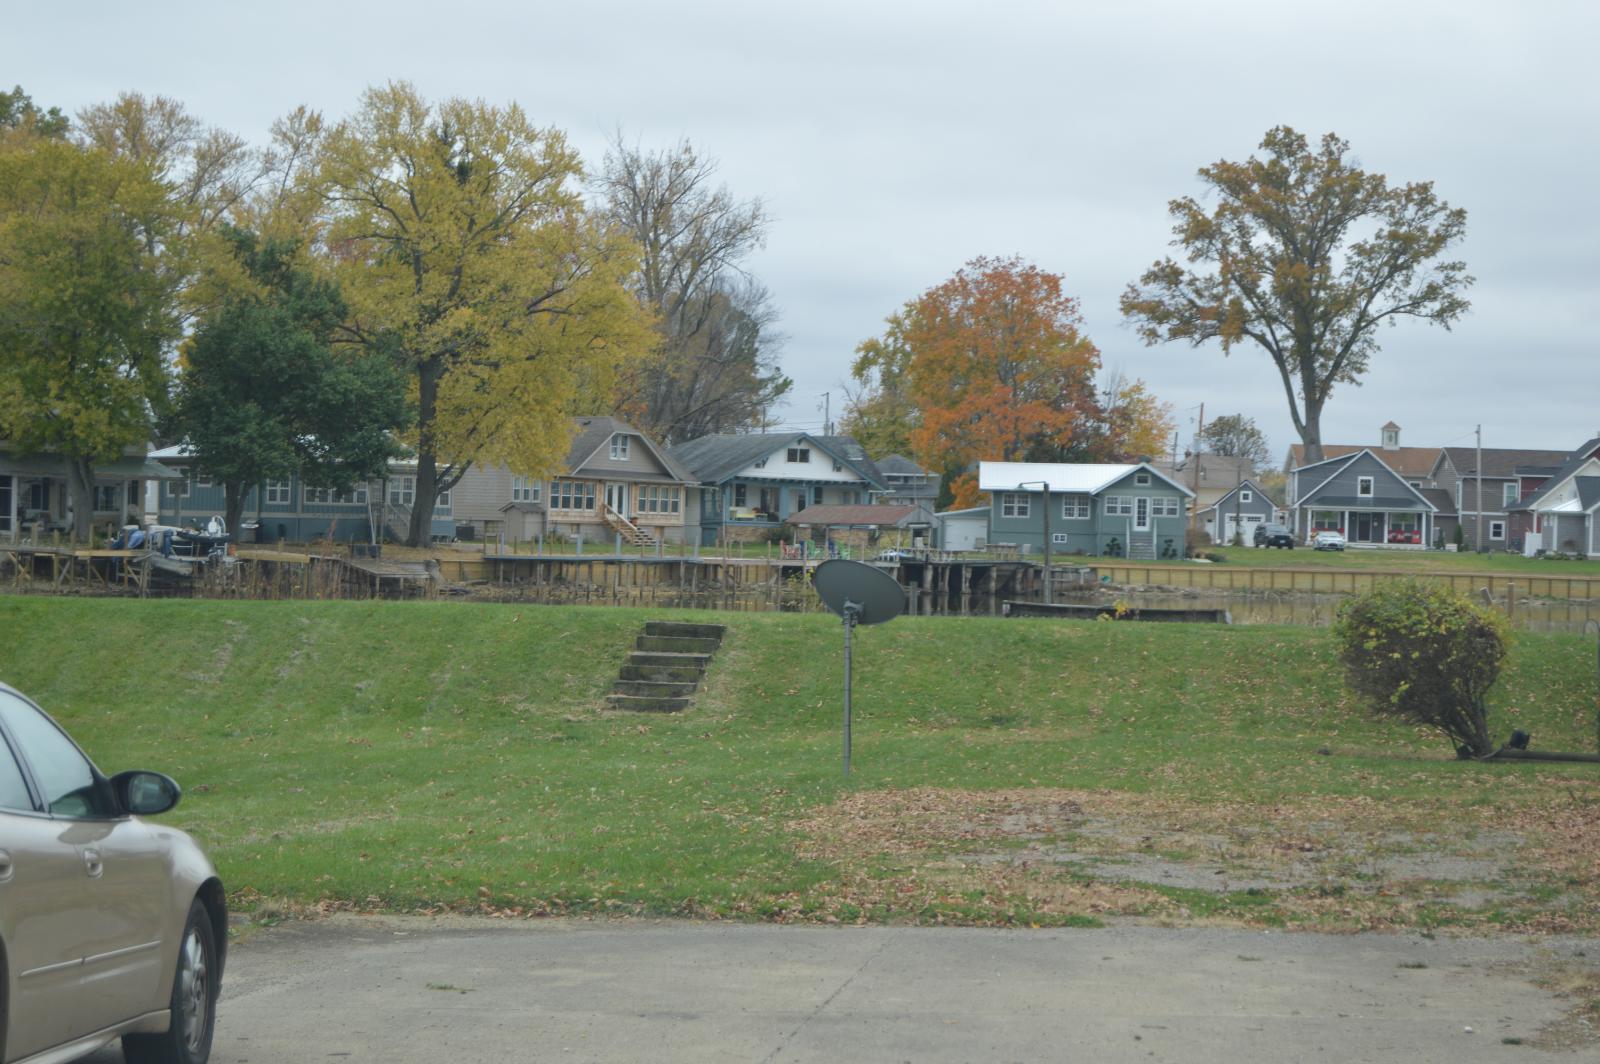
Located in Licking County about 30 miles east of Columbus, Buckeye Lake began as a canal feeder reservoir in the 1820s before transforming into a popular recreational community. The town’s proximity to Ohio’s capital has driven substantial residential development, particularly among buyers seeking lakefront properties and affordable alternatives to Columbus suburbs. However, this demand surge has created dangerous price volatility, with annual swings averaging over 12% that far exceed sustainable market patterns.
The numbers tell a concerning story of boom-bust cycles that could repeat. After crashing 13% in 2017, prices rebounded dramatically through the pandemic era, jumping 18% in 2022 alone before moderating to just 6% growth in 2025. This pattern of extreme appreciation followed by sharp corrections mirrors classic bubble behavior, suggesting current values around $267,000 may be unsustainable given the area’s economic fundamentals and historical price ranges.
16. Heath – Crash Risk Percentage: 78%
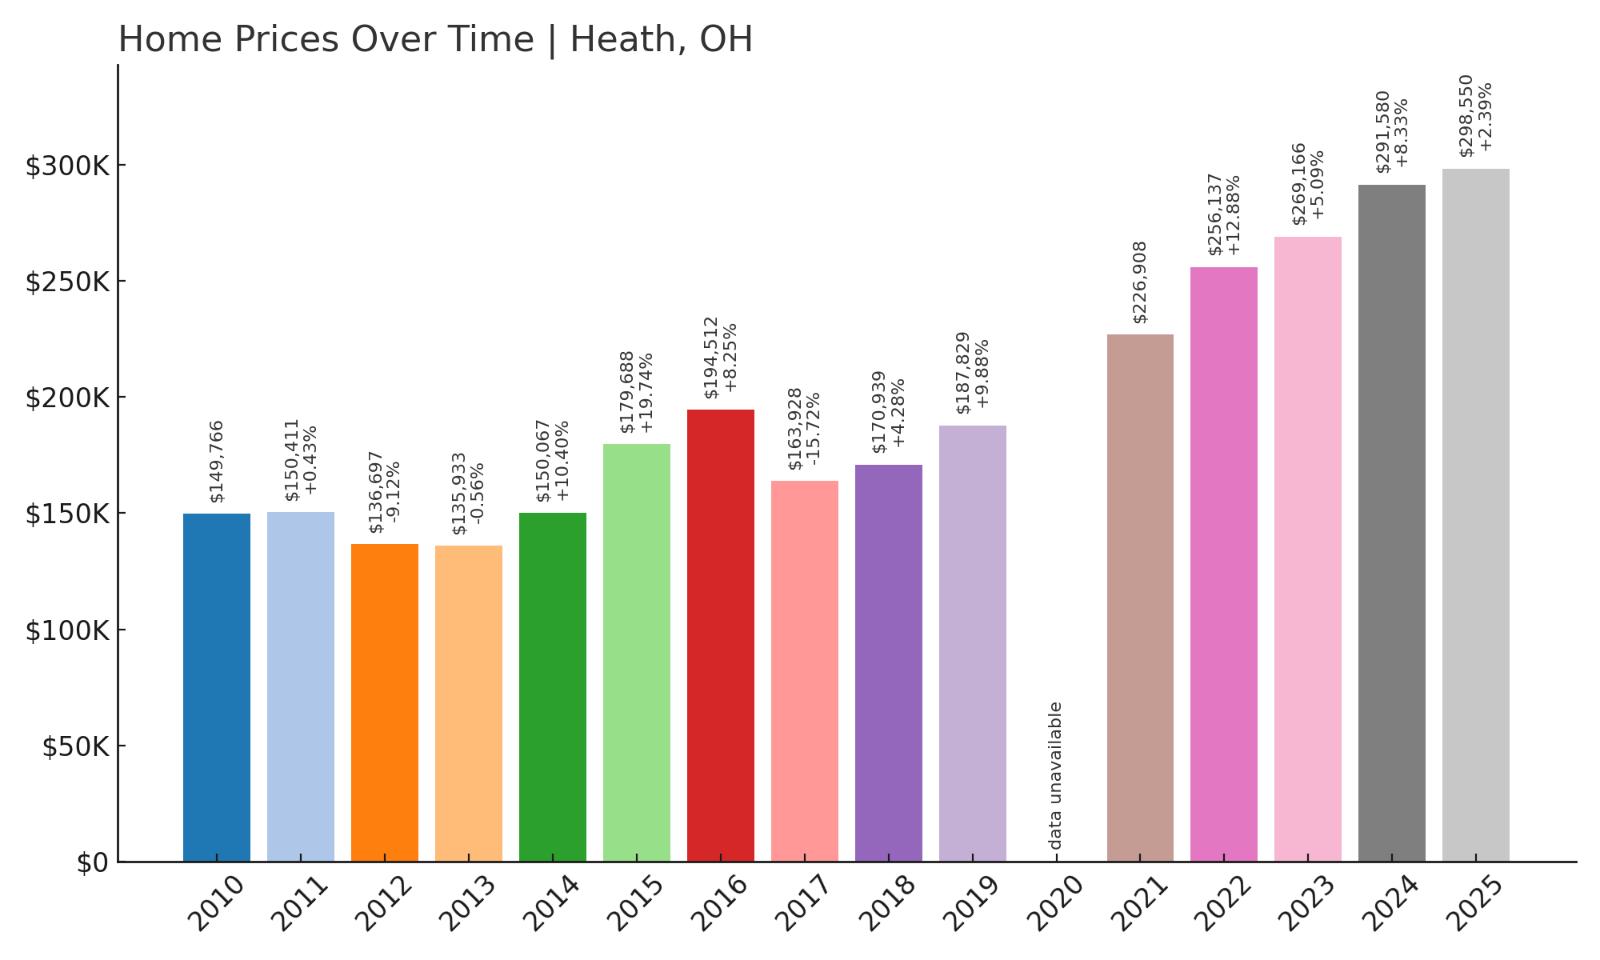
- Crash Risk Percentage: 78%
- Historical crashes (8%+ drops): 2
- Worst historical crash: -15.7% (2017)
- Total price increase since 2010: 99.3%
- Overextended above long-term average: 51.2%
- Price volatility (annual swings): 9.7%
- Current 2025 price: $298,550
Heath’s housing market displays concerning instability with two significant crashes in recent years, including a brutal 15.7% decline in 2017 that ranks among the worst corrections in our analysis. Despite nearly doubling in value since 2010, the market remains vulnerable to another downturn given its pattern of volatile swings and current overextension above historical norms. The community’s 51% premium over long-term averages suggests prices have outpaced underlying economic fundamentals.
Heath – Previous Crash Patterns Raise Red Flags
Kitchen Style?
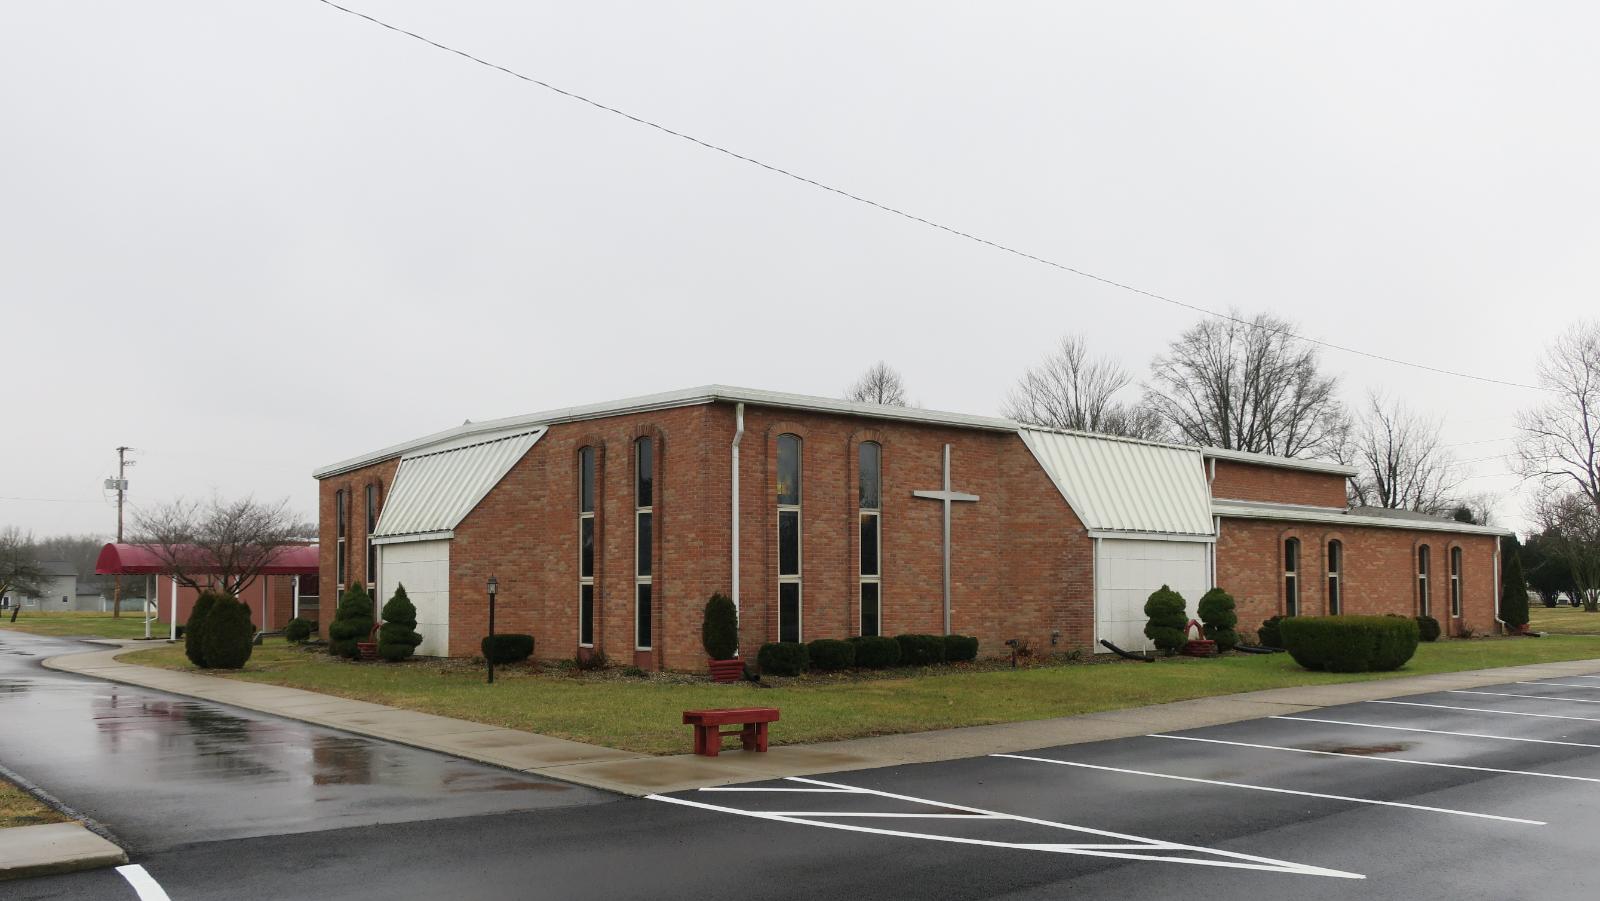
This Licking County community of approximately 10,000 residents sits strategically along State Route 79, connecting Newark to the greater Columbus metropolitan area. Heath’s industrial base includes major employers like Owens Corning and several manufacturing facilities, providing economic stability that initially supported housing demand. However, the town’s real estate market has proven surprisingly volatile, experiencing boom-bust cycles that seem disconnected from its steady economic foundation.
The 2017 crash that eliminated nearly 16% of home values serves as a stark warning about Heath’s vulnerability to market corrections. Current prices around $299,000 represent nearly 100% appreciation since 2010, creating affordability concerns for local workers whose wages haven’t kept pace. With the market still trading significantly above its historical trend and showing similar overheating patterns that preceded the 2017 correction, Heath appears positioned for another potential downturn that could test recent buyers’ equity positions.
15. Hanover – Crash Risk Percentage: 78%
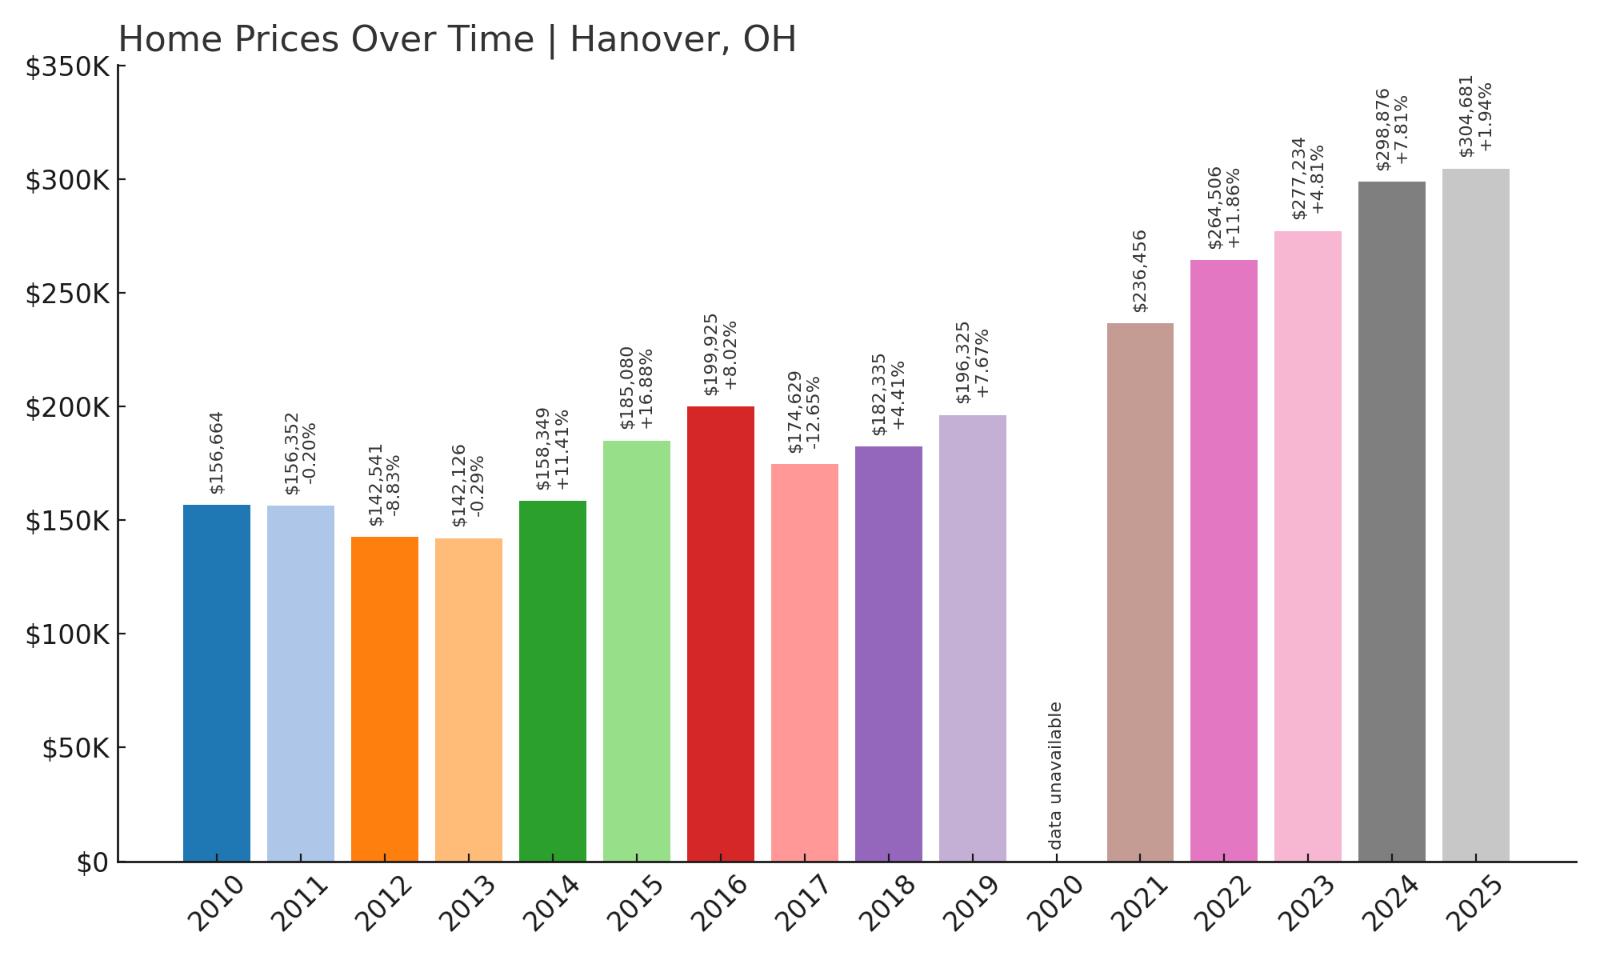
- Crash Risk Percentage: 78%
- Historical crashes (8%+ drops): 2
- Worst historical crash: -12.7% (2017)
- Total price increase since 2010: 94.5%
- Overextended above long-term average: 48.6%
- Price volatility (annual swings): 8.8%
- Current 2025 price: $304,681
Hanover’s housing market has experienced substantial appreciation since 2010, with values climbing 94.5% to current levels around $305,000. The community has endured two major price corrections, including a significant 12.7% crash in 2017 that demonstrates the market’s susceptibility to rapid downturns. Trading nearly 49% above its long-term average, Hanover shows classic signs of market overextension that historically precede corrections.
Hanover – Small Town Market Shows Big Volatility
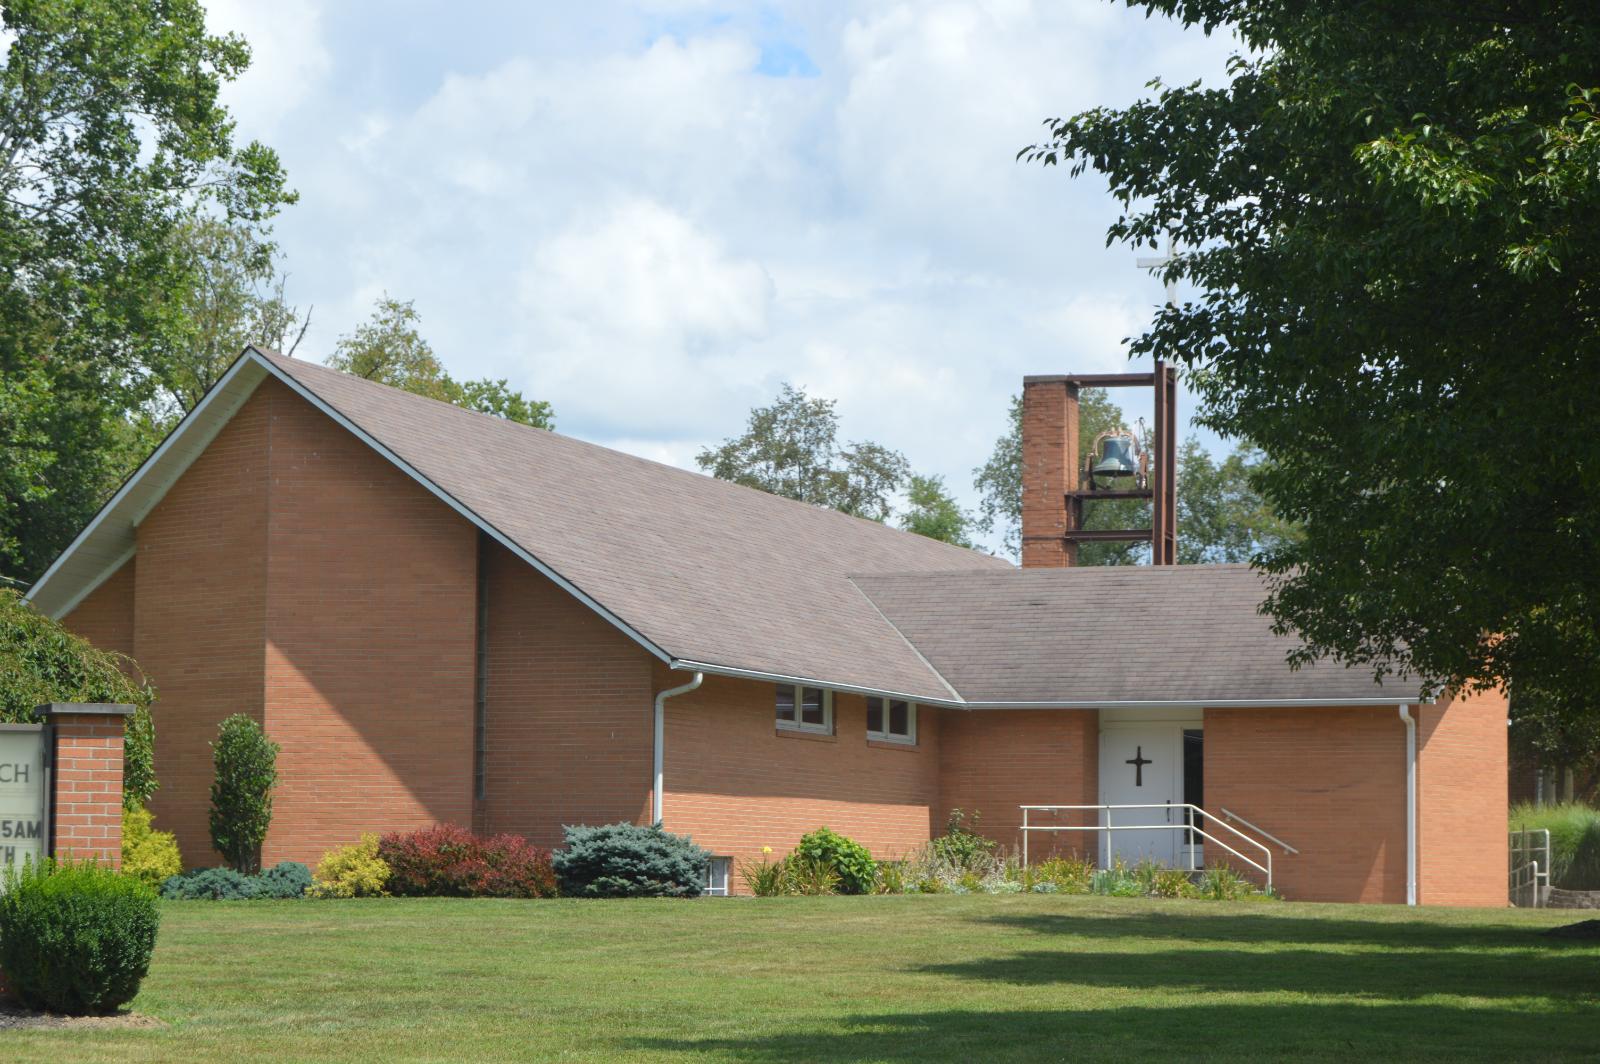
Located in Licking County near the historic Granville area, Hanover maintains a rural character while benefiting from proximity to both Newark and Columbus employment centers. The unincorporated community has attracted buyers seeking affordable alternatives to more expensive nearby markets, driving steady development of single-family homes and small subdivisions. However, this demand surge has created pricing pressures that appear unsustainable given the area’s limited local employment opportunities and rural infrastructure.
The data reveals troubling volatility patterns that suggest current prices may be artificially inflated. After the devastating 12.7% crash in 2017, prices recovered through aggressive appreciation that peaked with strong gains in 2022 and 2024. However, growth has slowed dramatically to under 2% in 2025, indicating momentum loss that often signals market tops. With values nearly 95% higher than 2010 levels and trading well above historical norms, Hanover appears vulnerable to another correction that could impact recent buyers who purchased near current peak prices.
14. Saint Louisville – Crash Risk Percentage: 78%
Home Stratosphere Guide
Your Personality Already Knows
How Your Home Should Feel
113 pages of room-by-room design guidance built around your actual brain, your actual habits, and the way you actually live.
You might be an ISFJ or INFP designer…
You design through feeling — your spaces are personal, comforting, and full of meaning. The guide covers your exact color palettes, room layouts, and the one mistake your type always makes.
The full guide maps all 16 types to specific rooms, palettes & furniture picks ↓
You might be an ISTJ or INTJ designer…
You crave order, function, and visual calm. The guide shows you how to create spaces that feel both serene and intentional — without ending up sterile.
The full guide maps all 16 types to specific rooms, palettes & furniture picks ↓
You might be an ENFP or ESTP designer…
You design by instinct and energy. Your home should feel alive. The guide shows you how to channel that into rooms that feel curated, not chaotic.
The full guide maps all 16 types to specific rooms, palettes & furniture picks ↓
You might be an ENTJ or ESTJ designer…
You value quality, structure, and things done right. The guide gives you the framework to build rooms that feel polished without overthinking every detail.
The full guide maps all 16 types to specific rooms, palettes & furniture picks ↓
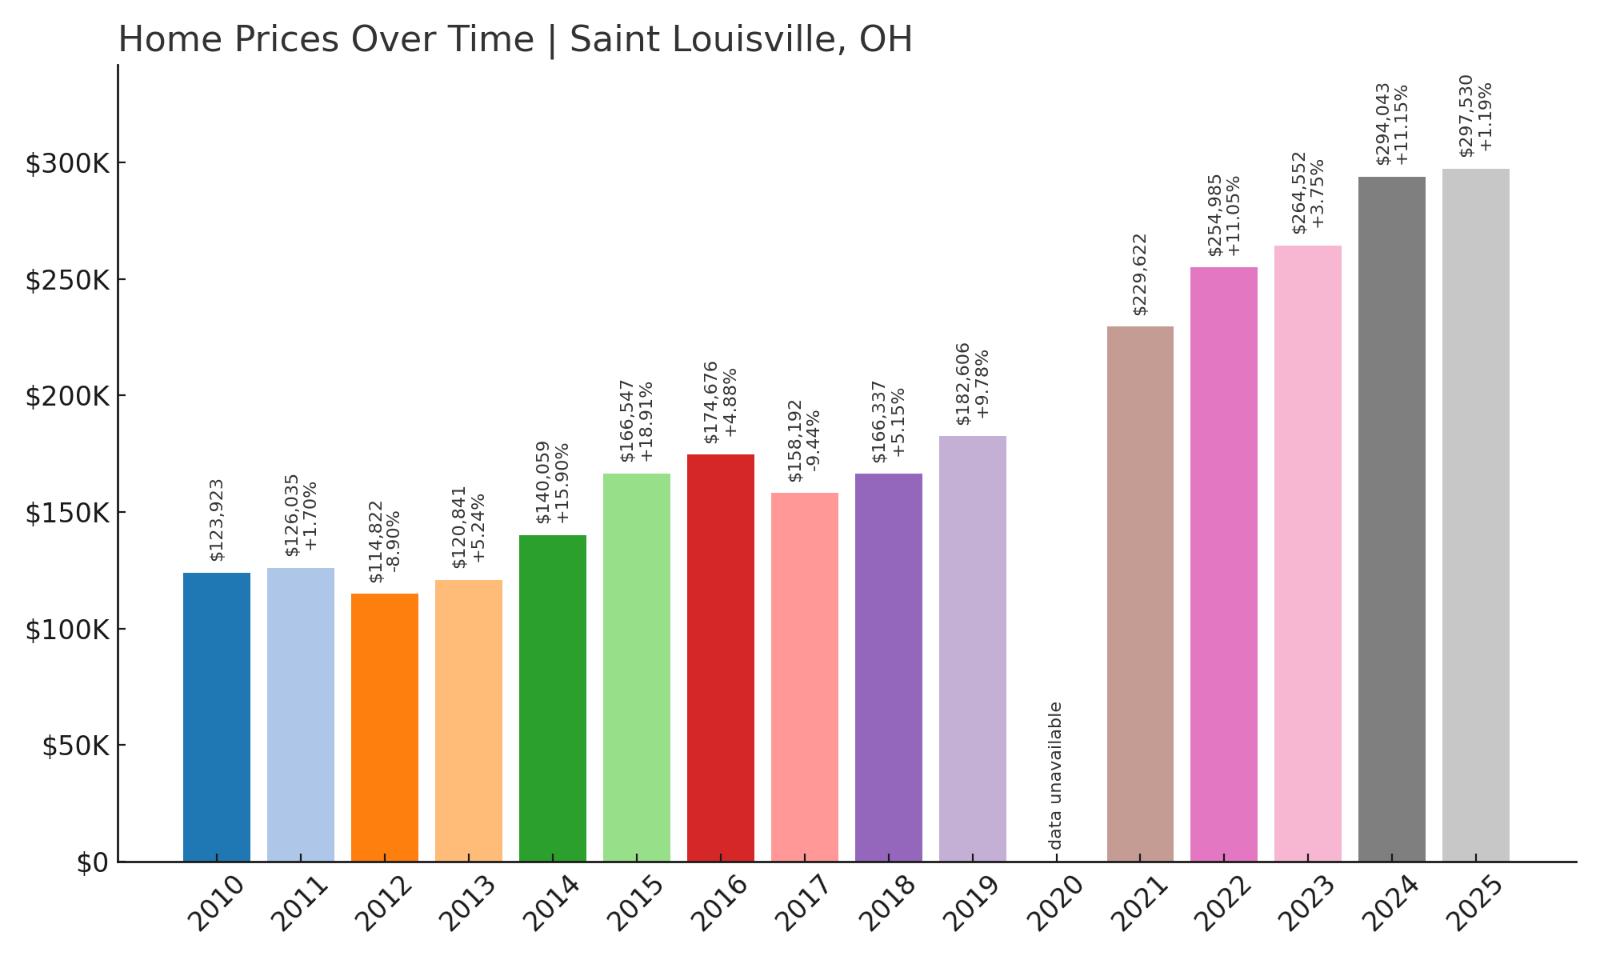
- Crash Risk Percentage: 78%
- Historical crashes (8%+ drops): 2
- Worst historical crash: -9.4% (2017)
- Total price increase since 2010: 140.1%
- Overextended above long-term average: 58.6%
- Price volatility (annual swings): 9.5%
- Current 2025 price: $297,530
Saint Louisville has posted remarkable gains with home values surging 140% since 2010, but this explosive growth comes with significant crash risk given the market’s history of corrections. The community experienced two notable downturns, including a 9.4% decline in 2017 that erased substantial equity for homeowners. Currently trading 58.6% above its long-term average, the market displays dangerous overextension that mirrors conditions before previous crashes.
Saint Louisville – Explosive Growth Creates Vulnerability
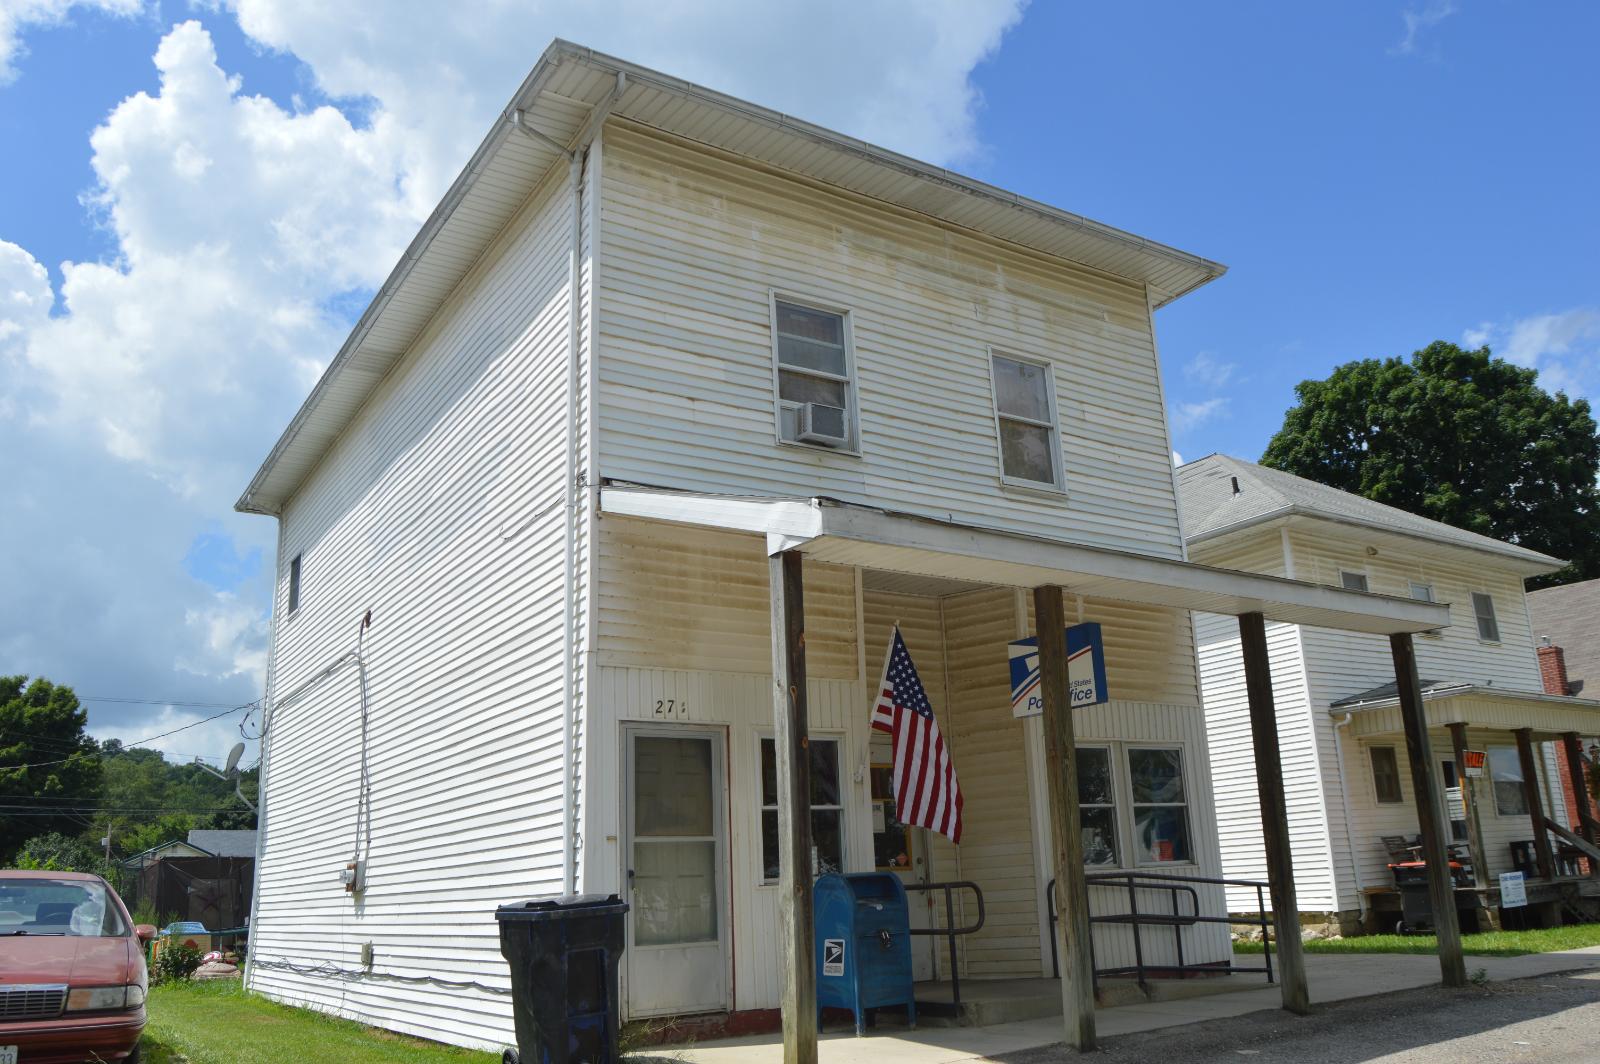
This small Licking County community has transformed from a quiet rural area into an increasingly popular residential destination for commuters working in nearby Columbus and Newark. Saint Louisville’s appeal stems from its combination of affordable housing options, rural atmosphere, and reasonable commuting distances to major employment centers. However, the surge in demand has pushed prices to levels that appear disconnected from local economic fundamentals and historical pricing patterns.
The market’s 140% appreciation since 2010 represents one of the most aggressive growth rates in our analysis, creating serious affordability concerns for potential buyers. Recent data shows momentum slowing dramatically, with growth decelerating from over 11% in 2024 to just 1.2% in 2025, suggesting the market may be running out of steam. This combination of extreme overvaluation, historical crash patterns, and declining growth momentum positions Saint Louisville for a potential correction that could significantly impact property values and homeowner equity in the coming months.
13. Granville – Crash Risk Percentage: 78%
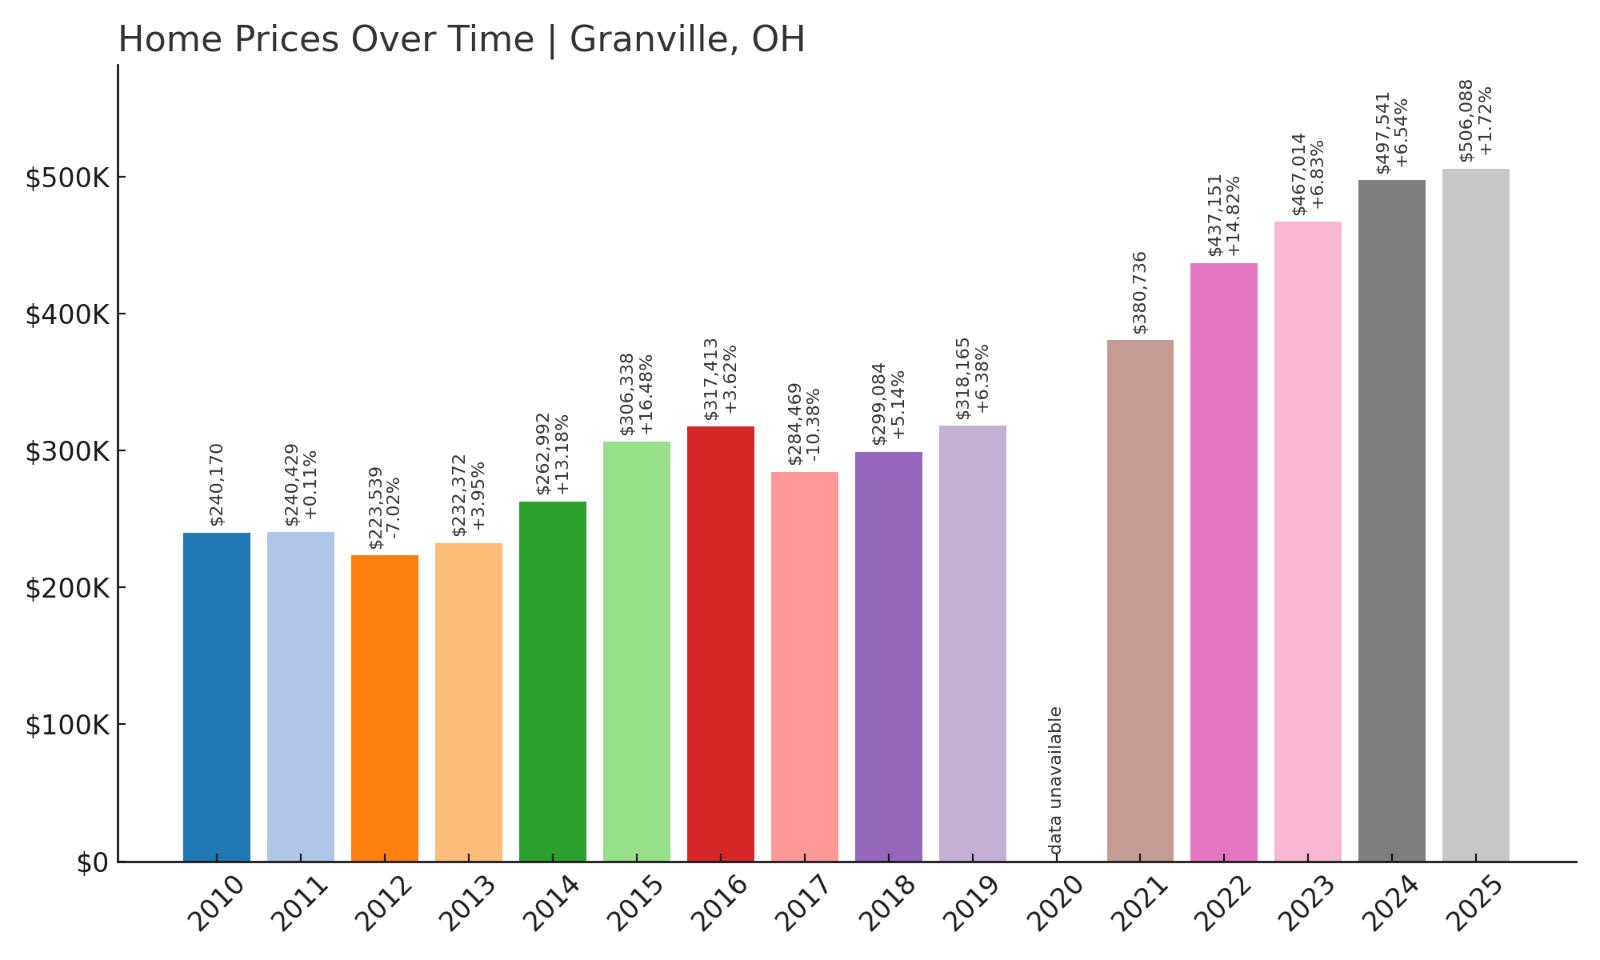
- Crash Risk Percentage: 78%
- Historical crashes (8%+ drops): 1
- Worst historical crash: -10.4% (2017)
- Total price increase since 2010: 110.7%
- Overextended above long-term average: 51.4%
- Price volatility (annual swings): 8.3%
- Current 2025 price: $506,088
Granville commands premium prices at over $506,000, reflecting its status as an upscale community, but this elevated valuation brings substantial downside risk. The market suffered a significant 10.4% correction in 2017, demonstrating that even affluent areas remain vulnerable to housing downturns. With values 110% higher than 2010 levels and trading 51% above long-term averages, Granville shows clear signs of market overextension despite its desirable characteristics.
Granville – Premium Market Faces Correction Risk

Home to Denison University, Granville ranks among Ohio’s most prestigious small communities, featuring historic charm, excellent schools, and a thriving downtown district. The village’s combination of academic influence, cultural amenities, and proximity to Columbus has created sustained demand for housing, particularly among affluent professionals and university faculty. However, this demand has pushed median home prices above half a million dollars, creating affordability barriers that limit the buyer pool and increase market vulnerability.
Despite its premium status, Granville couldn’t escape the 2017 housing correction that eliminated over 10% of home values, proving that even desirable markets face downside risk during broader corrections. Current prices represent more than doubling since 2010, with much of the appreciation occurring during the pandemic housing boom when buyers fled urban areas. Recent growth has slowed to under 2% annually, suggesting momentum loss that often precedes market corrections in high-priced communities where buyer demand becomes increasingly price-sensitive.
12. South Middletown – Crash Risk Percentage: 79%
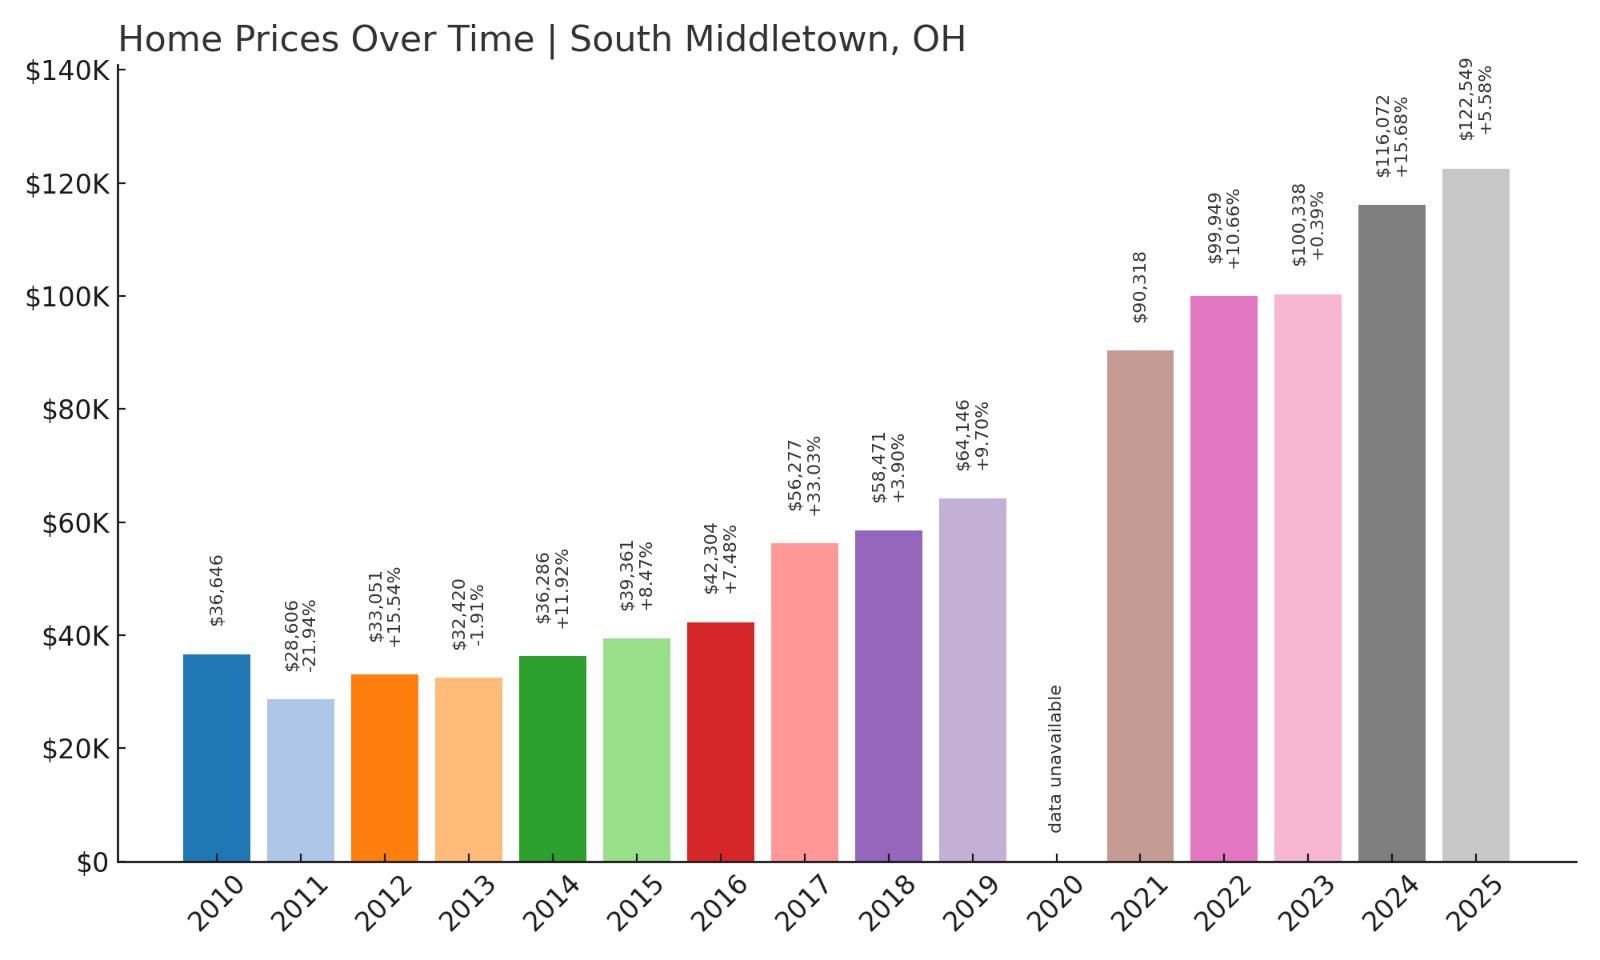
- Crash Risk Percentage: 79%
- Historical crashes (8%+ drops): 1
- Worst historical crash: -21.9% (2011)
- Total price increase since 2010: 234.4%
- Overextended above long-term average: 92.1%
- Price volatility (annual swings): 14.5%
- Current 2025 price: $122,549
South Middletown presents extreme crash risk with the most dramatic price appreciation in our analysis, posting a staggering 234% increase since 2010. The market demonstrated severe vulnerability during the last housing crisis, plummeting nearly 22% in 2011 in what represents the worst single-year decline among all communities studied. Currently trading 92% above its long-term average with excessive volatility averaging 14.5% annually, the market shows dangerous instability.
South Middletown – Extreme Volatility Creates Major Risk
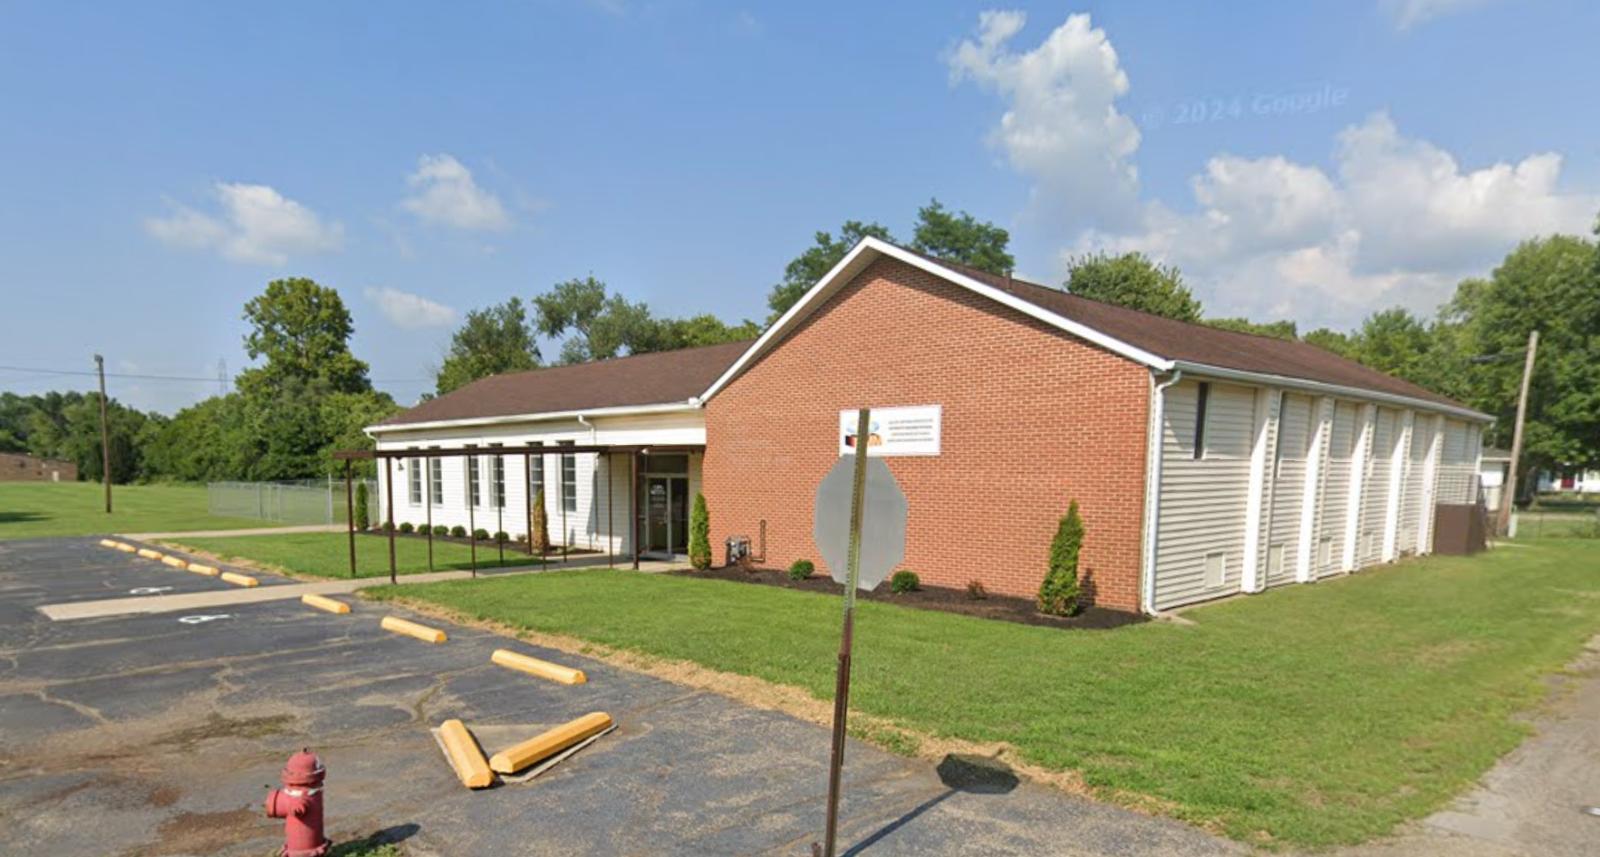
Located in Butler County near the larger city of Middletown, this community experienced devastating economic impacts during the manufacturing decline that affected much of southwestern Ohio. The area’s housing market reflected this economic distress with the catastrophic 22% crash in 2011 that left many homeowners underwater. However, subsequent recovery efforts and industrial revitalization have driven an unprecedented housing boom that pushed values from under $30,000 in 2011 to over $122,000 today.
This remarkable price recovery, while positive for existing owners, has created dangerous overextension that appears unsustainable given local economic conditions. The market’s extreme volatility, with annual swings averaging nearly 15%, indicates fundamental instability that makes accurate pricing difficult. Current values trading 92% above historical norms suggest the pendulum may have swung too far toward overvaluation, particularly considering the area’s limited employment opportunities and relatively modest median incomes that struggle to support current price levels.
11. Arlington Heights – Crash Risk Percentage: 79%
- Crash Risk Percentage: 79%
- Historical crashes (8%+ drops): 1
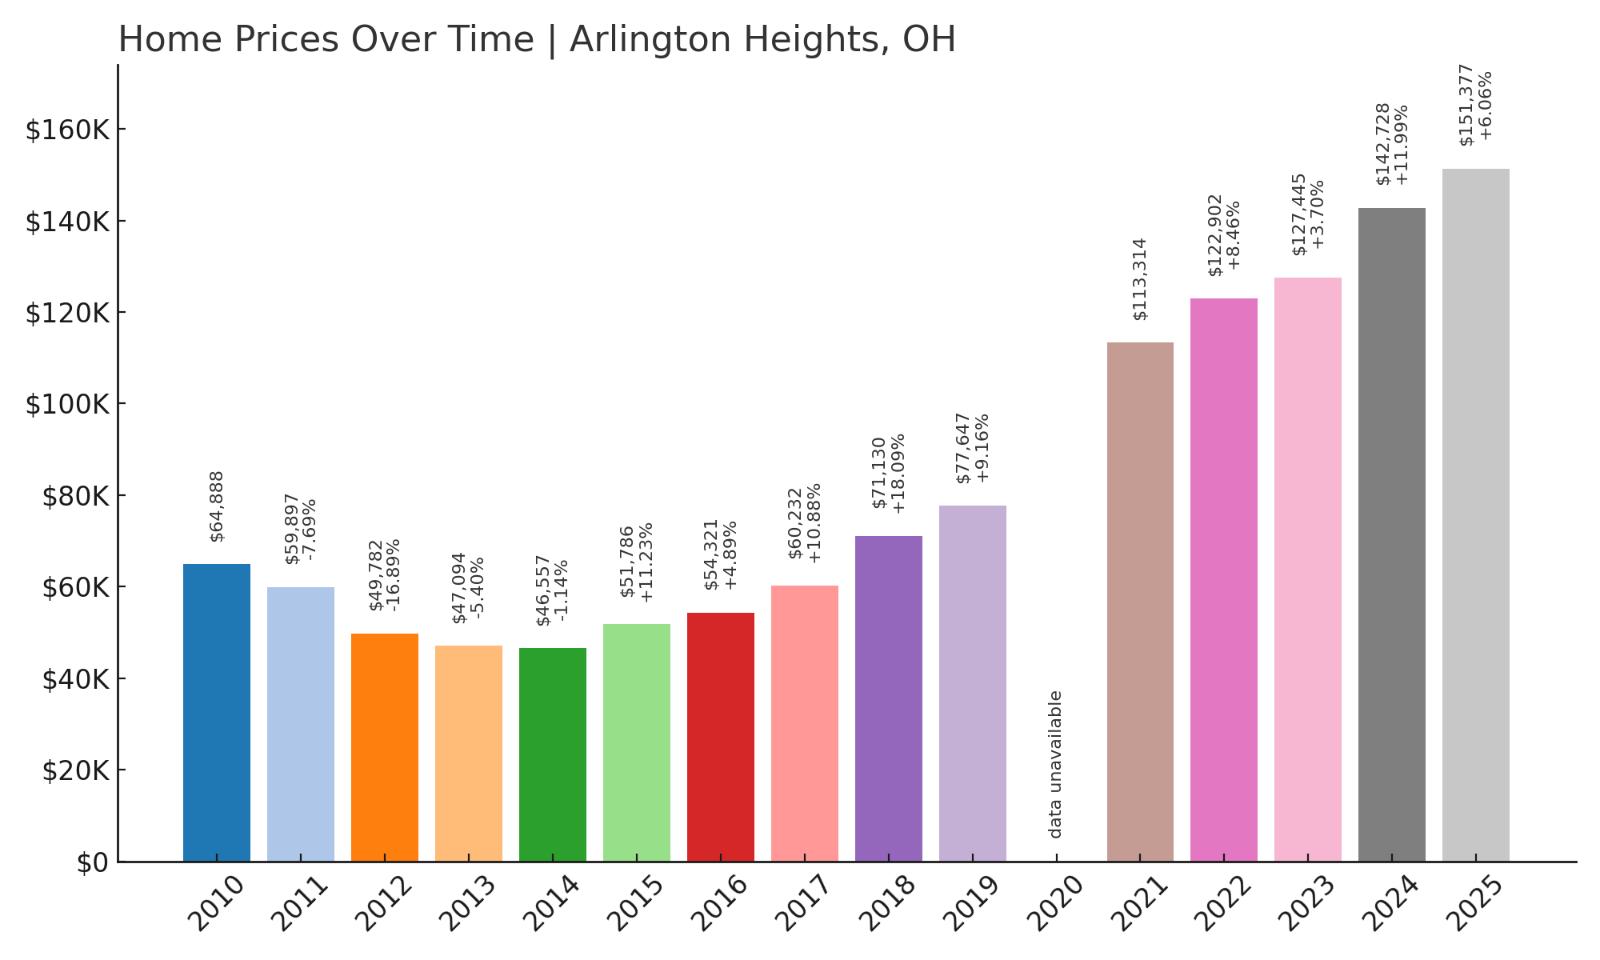
- Worst historical crash: -16.9% (2012)
- Total price increase since 2010: 133.3%
- Overextended above long-term average: 83.0%
- Price volatility (annual swings): 14.1%
- Current 2025 price: $151,377
Arlington Heights has experienced remarkable appreciation with values climbing 133% since 2010, but this growth comes with substantial risk given the market’s history of severe corrections. The community endured a devastating 16.9% crash in 2012 that wiped out years of equity for homeowners. Currently trading 83% above its long-term average with high volatility patterns, the market displays classic warning signs of overextension that preceded previous downturns.
Arlington Heights – Recovery Creates New Vulnerability
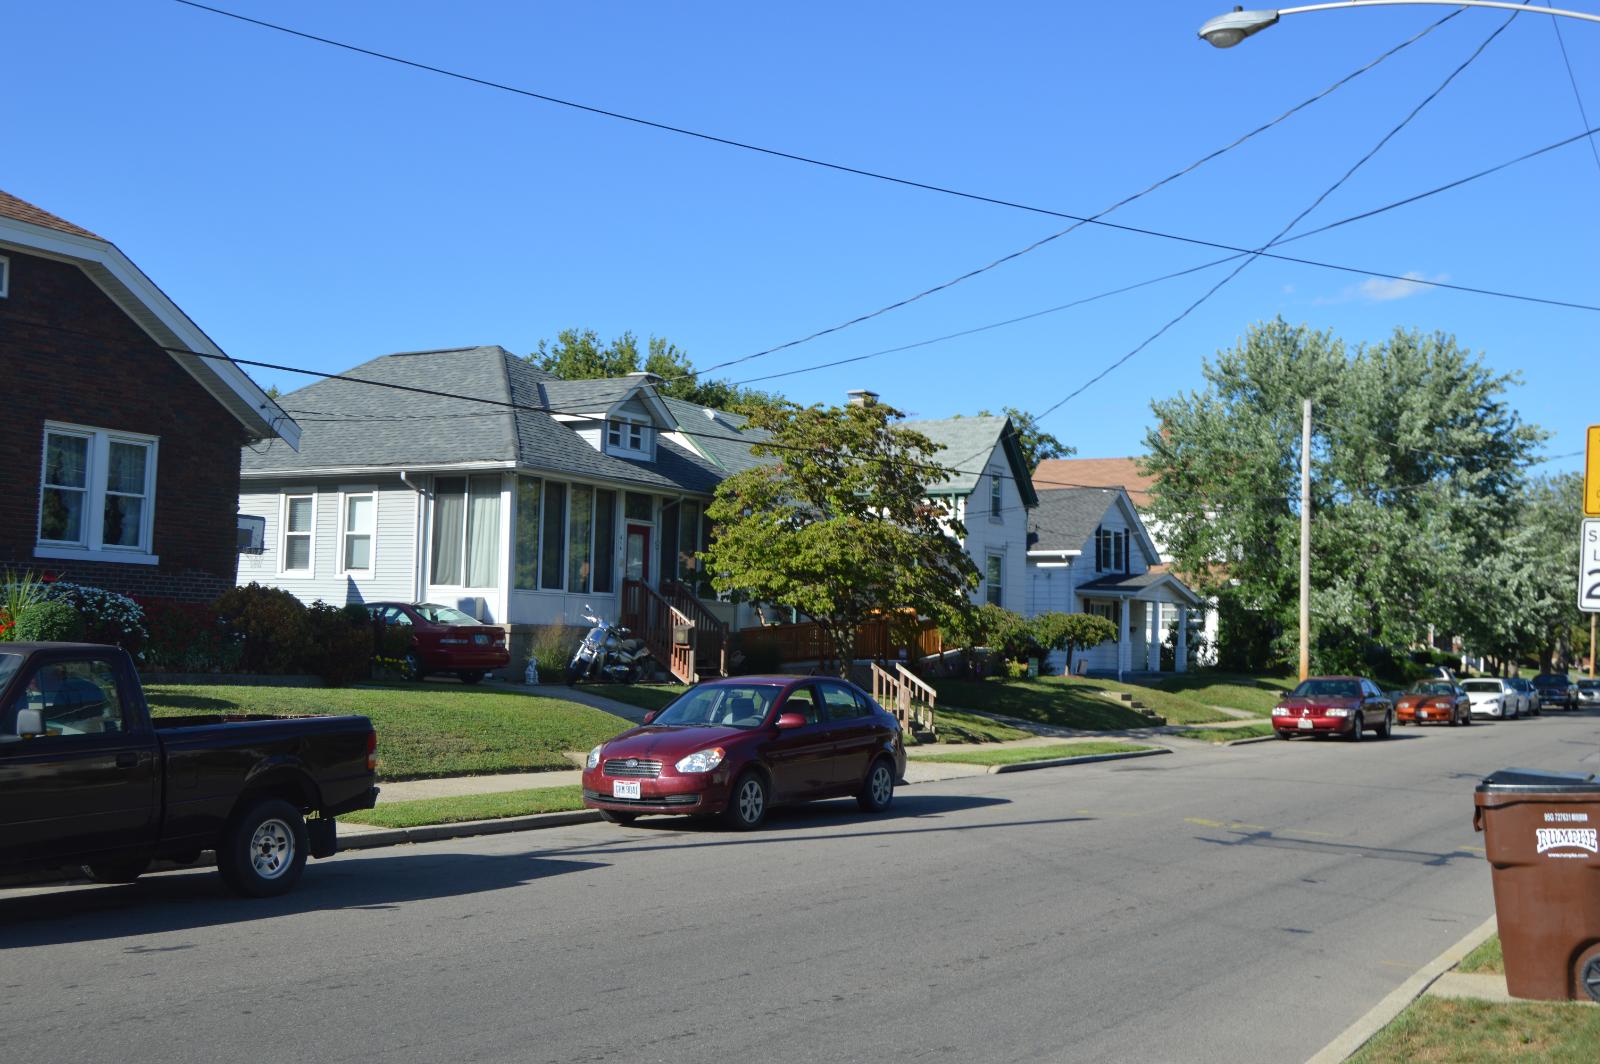
This Hamilton County community represents a classic example of post-recession recovery creating new market risks. Located near Cincinnati’s urban core, Arlington Heights suffered severe impacts during the housing crisis, with the 2012 crash eliminating nearly 17% of home values as foreclosures mounted and buyer demand collapsed. The subsequent recovery has been dramatic, with prices more than tripling from their 2012 lows to current levels around $151,000.
However, this aggressive appreciation has pushed values far beyond historical norms, creating affordability concerns in a market traditionally known for modest home prices. The community’s 83% premium over long-term averages indicates dangerous overextension, particularly given limited local employment opportunities and competition from other affordable Cincinnati-area neighborhoods. Recent momentum has remained strong with 6% growth in 2025, but this continued appreciation at already elevated levels increases the risk of another correction that could impact recent buyers who entered the market near current peaks.
10. Warrensville Heights – Crash Risk Percentage: 79%
- Crash Risk Percentage: 79%
- Historical crashes (8%+ drops): 2
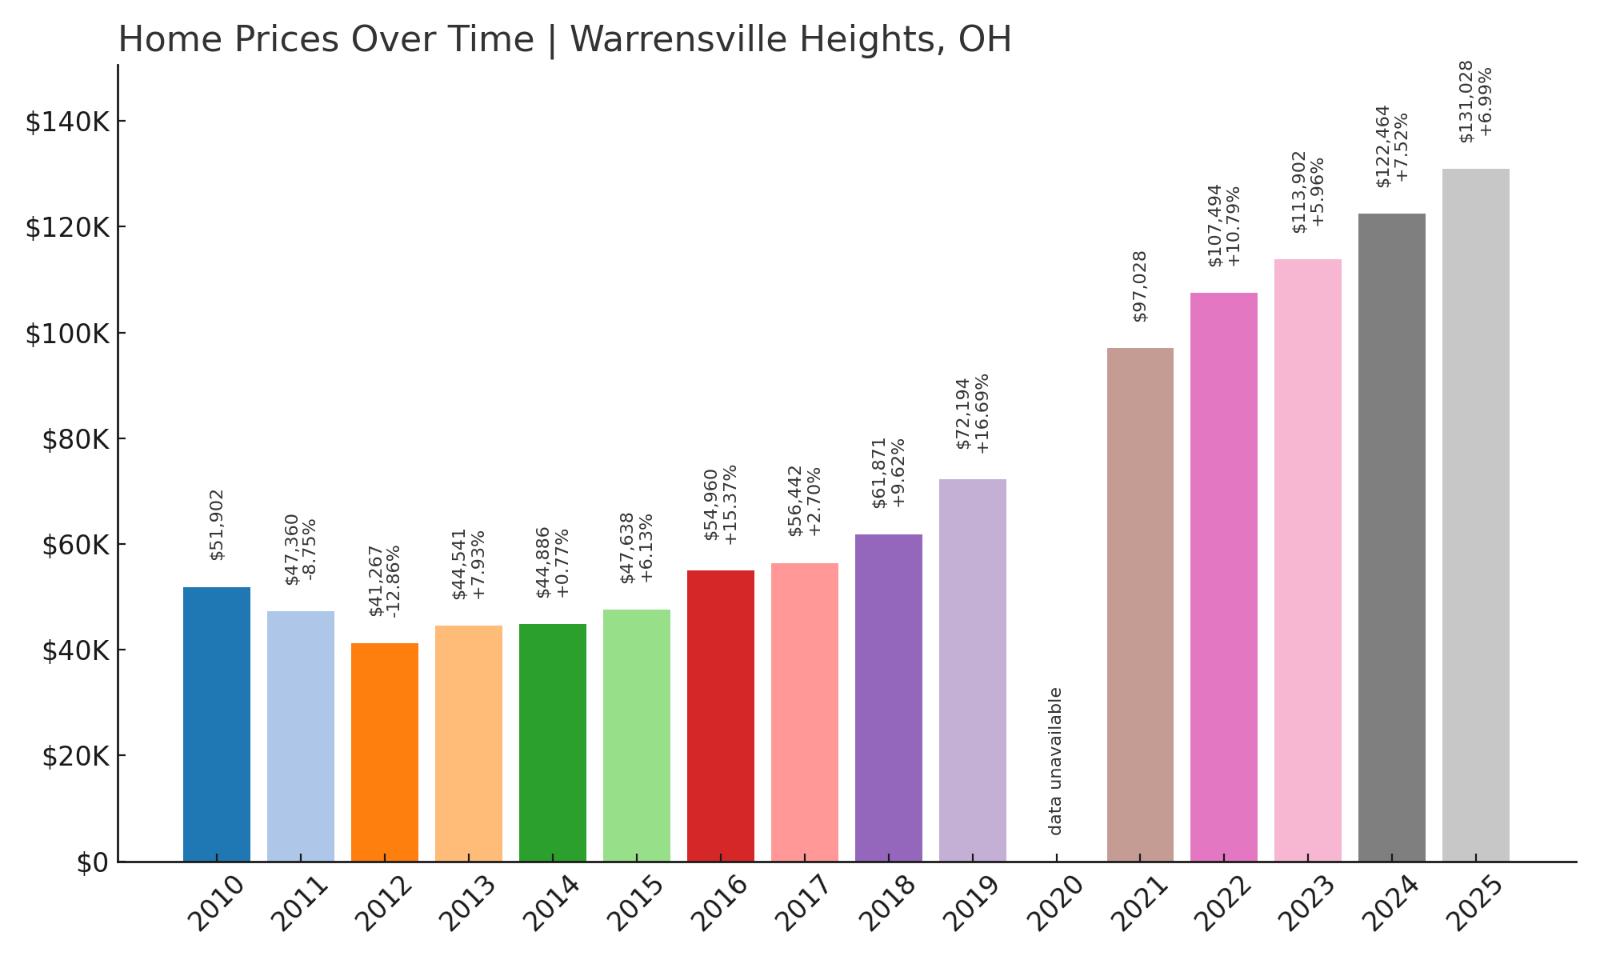
- Worst historical crash: -12.9% (2012)
- Total price increase since 2010: 152.5%
- Overextended above long-term average: 79.5%
- Price volatility (annual swings): 11.0%
- Current 2025 price: $131,028
Warrensville Heights has posted impressive gains with home values climbing 152% since 2010, but the market’s history of multiple crashes raises serious concerns about sustainability. The community experienced two significant downturns, including a 12.9% decline in 2012 that demonstrated vulnerability to broader economic pressures. Trading nearly 80% above its long-term average, the market shows dangerous overextension that mirrors conditions before previous corrections.
Warrensville Heights – Multiple Crashes Signal Instability

Located in Cuyahoga County southeast of Cleveland, Warrensville Heights serves as an established suburban community with diverse housing options and convenient access to major employment centers. The city’s proximity to Cleveland’s medical district and downtown business core has supported residential demand, particularly among middle-income buyers seeking affordable alternatives to pricier inner-ring suburbs. However, the market has proven vulnerable to economic downturns, experiencing multiple corrections that suggest underlying instability.
The community’s pattern of boom-bust cycles raises red flags about current valuation levels around $131,000. After the significant 2012 crash, prices recovered aggressively through the pandemic era, but this appreciation has pushed values far above historical norms. Recent growth remains robust at nearly 7% in 2025, but this continued momentum at already elevated levels increases correction risk, particularly if Cleveland-area employment conditions weaken or mortgage rates impact affordability for the price-sensitive buyers who typically drive demand in this market segment.
9. Pataskala – Crash Risk Percentage: 80%
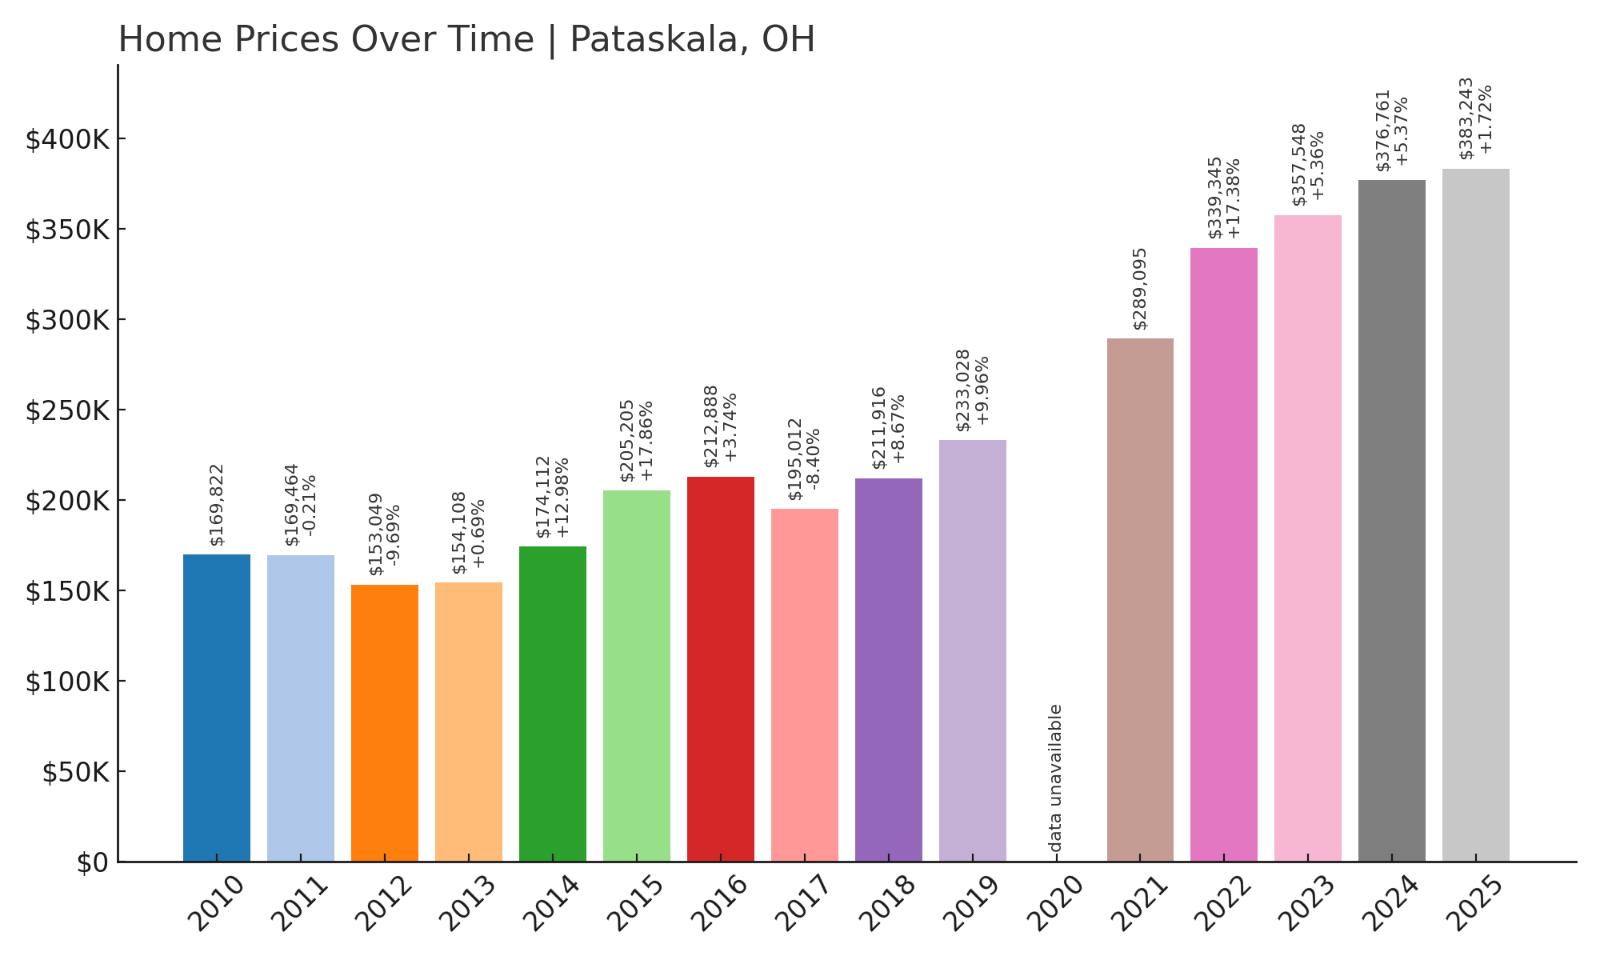
- Crash Risk Percentage: 80%
- Historical crashes (8%+ drops): 2
- Worst historical crash: -9.7% (2012)
- Total price increase since 2010: 125.7%
- Overextended above long-term average: 58.6%
- Price volatility (annual swings): 9.4%
- Current 2025 price: $383,243
Pataskala commands premium pricing at over $383,000, reflecting strong demand for this desirable Licking County community, but the market’s crash history and current overvaluation create significant downside risk. The city experienced two notable corrections, including a 9.7% decline in 2012 that impacted homeowner equity. With values up 125% since 2010 and trading 58.6% above long-term averages, Pataskala shows clear signs of market overextension despite its attractive characteristics.
Pataskala – Suburban Appeal Drives Overvaluation

This growing Licking County city has emerged as a premier suburban destination for Columbus-area professionals, offering excellent schools, family-friendly neighborhoods, and convenient highway access to employment centers. Pataskala’s combination of small-town charm and metropolitan amenities has attracted steady population growth, driving sustained housing demand that pushed median prices well into the mid-$300,000 range. However, this appreciation has created affordability challenges that limit the buyer pool and increase market vulnerability.
Despite its desirable characteristics, Pataskala couldn’t avoid previous housing corrections, including the 2012 downturn that eliminated nearly 10% of home values. Current prices represent more than doubling since 2010, with much of the appreciation occurring during recent years when buyers sought suburban alternatives to urban living. Growth has decelerated significantly to under 2% in 2025, suggesting momentum loss that often precedes corrections in higher-priced suburban markets where buyer sensitivity to economic conditions and mortgage rates tends to be more pronounced.
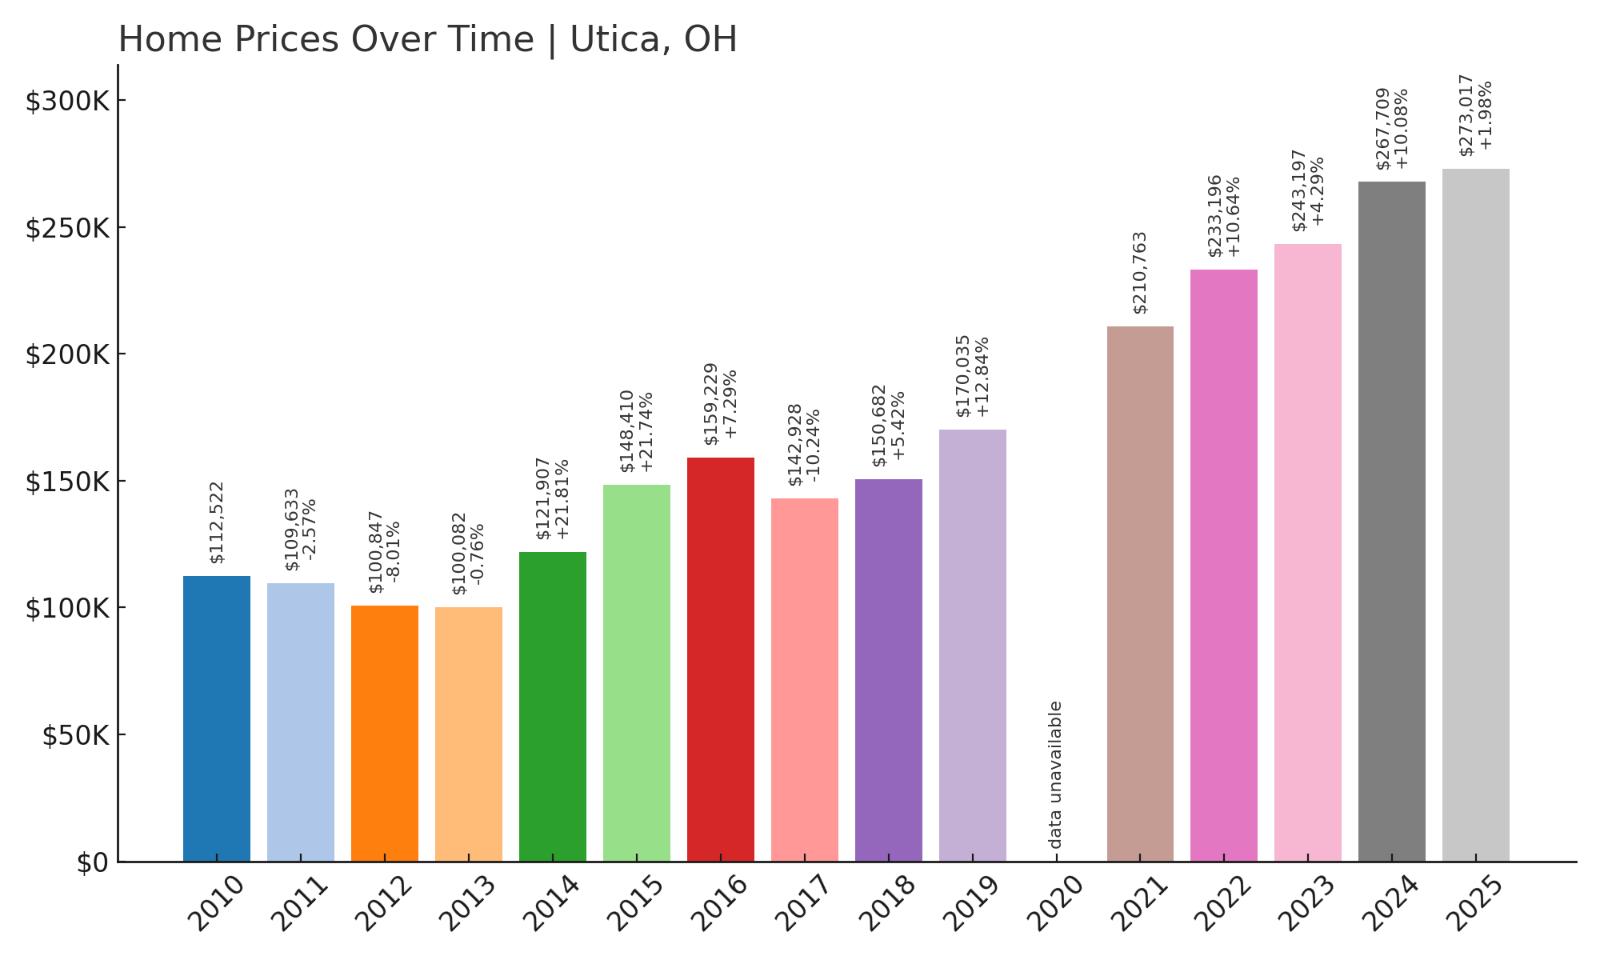
8. Utica – Crash Risk Percentage: 80%
Would you like to save this?
- Crash Risk Percentage: 80%
- Historical crashes (8%+ drops): 2
- Worst historical crash: -10.2% (2017)
- Total price increase since 2010: 142.6%
- Overextended above long-term average: 61.0%
- Price volatility (annual swings): 10.5%
- Current 2025 price: $273,017
Utica has experienced substantial appreciation with home values climbing 142% since 2010, but this growth trajectory includes concerning volatility and correction history. The market suffered two significant downturns, including a notable 10.2% crash in 2017 that demonstrated vulnerability to rapid price declines. Currently trading 61% above its long-term average with elevated volatility patterns, Utica displays warning signs that preceded previous market corrections.
Utica – Rural Charm Meets Market Risk
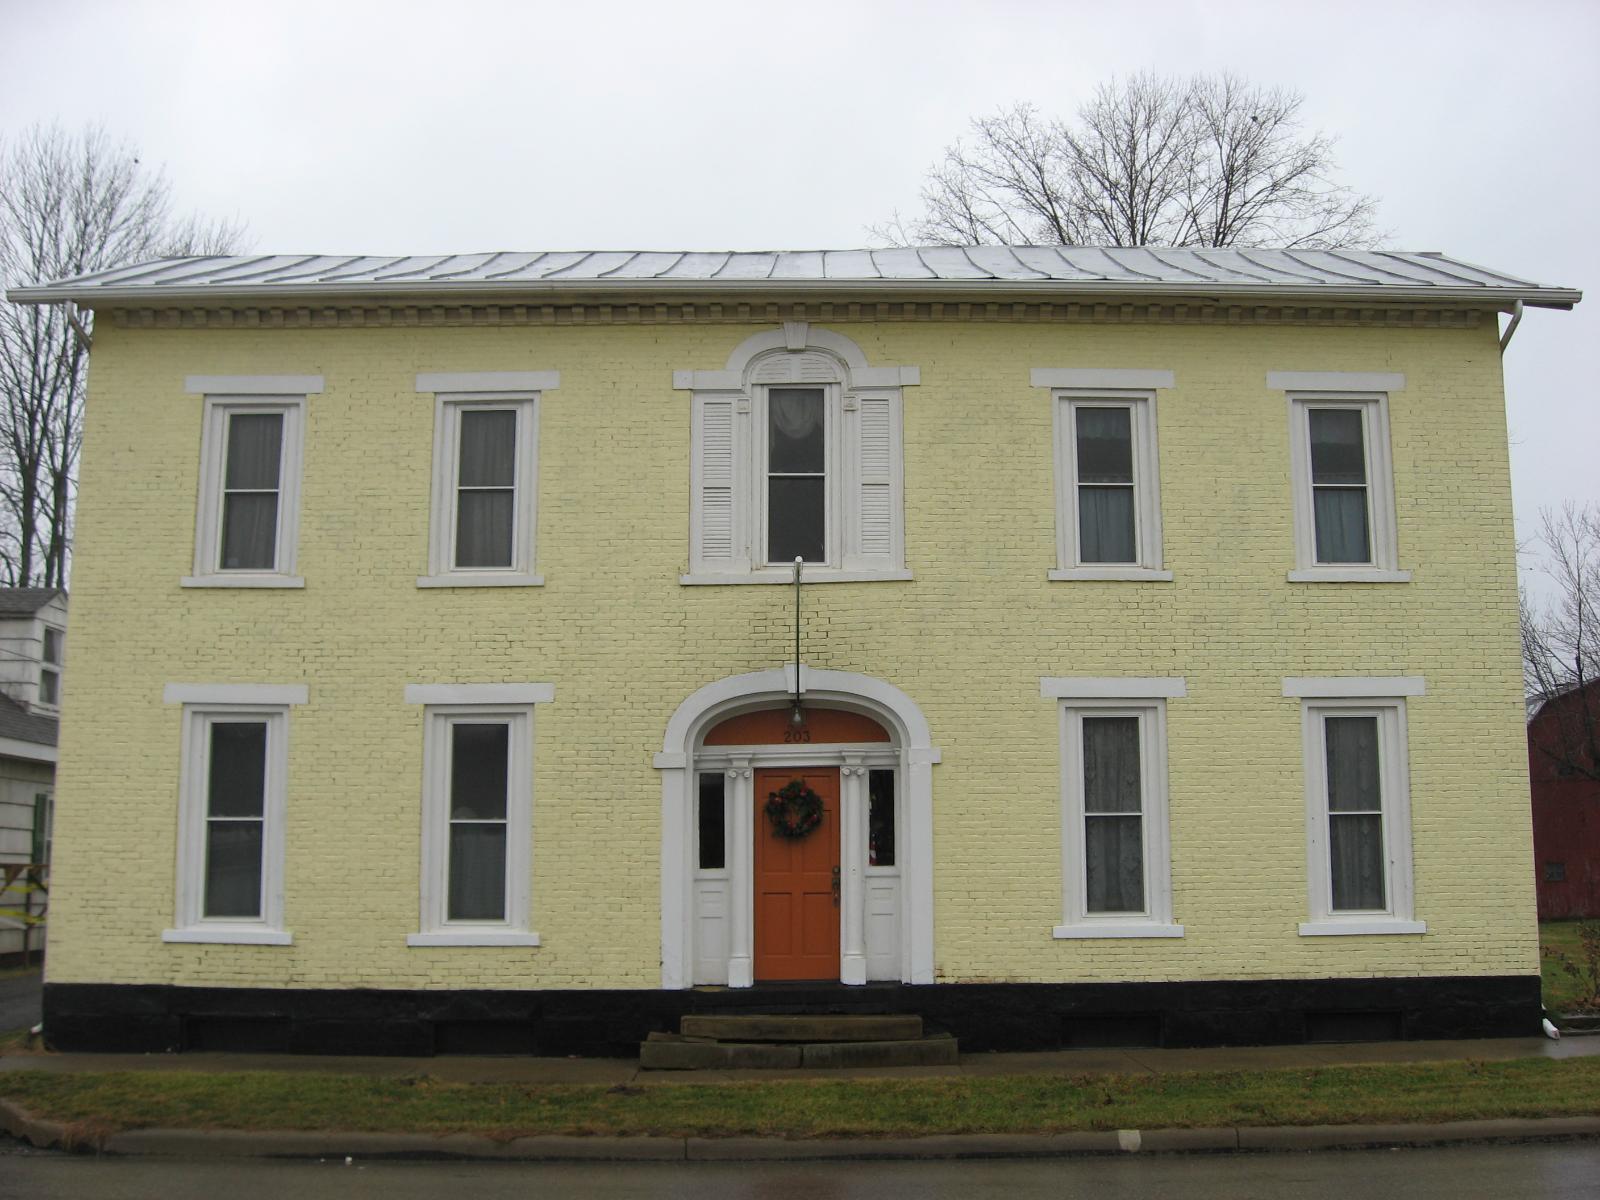
Located in Licking County’s scenic countryside, Utica maintains its small-town character while attracting buyers seeking rural alternatives to urban and suburban living. The village’s historic downtown, annual festivals, and proximity to recreational areas like the Ohio & Erie Canal have created appeal among those wanting authentic small-town experiences. However, this demand surge has driven prices to levels that appear disconnected from local economic fundamentals and historical pricing patterns in rural Ohio communities.
The market’s vulnerability became evident during the 2017 correction that eliminated over 10% of home values, proving that even charming rural communities face downside risk during broader housing adjustments. Current prices around $273,000 represent aggressive appreciation that has outpaced income growth in the agricultural and small-business economy that defines much of Licking County. Recent growth has slowed to under 2% annually, indicating potential momentum loss that often signals market tops in communities where buyer demand becomes increasingly sensitive to pricing pressures and economic uncertainty.
7. Newark – Crash Risk Percentage: 82%
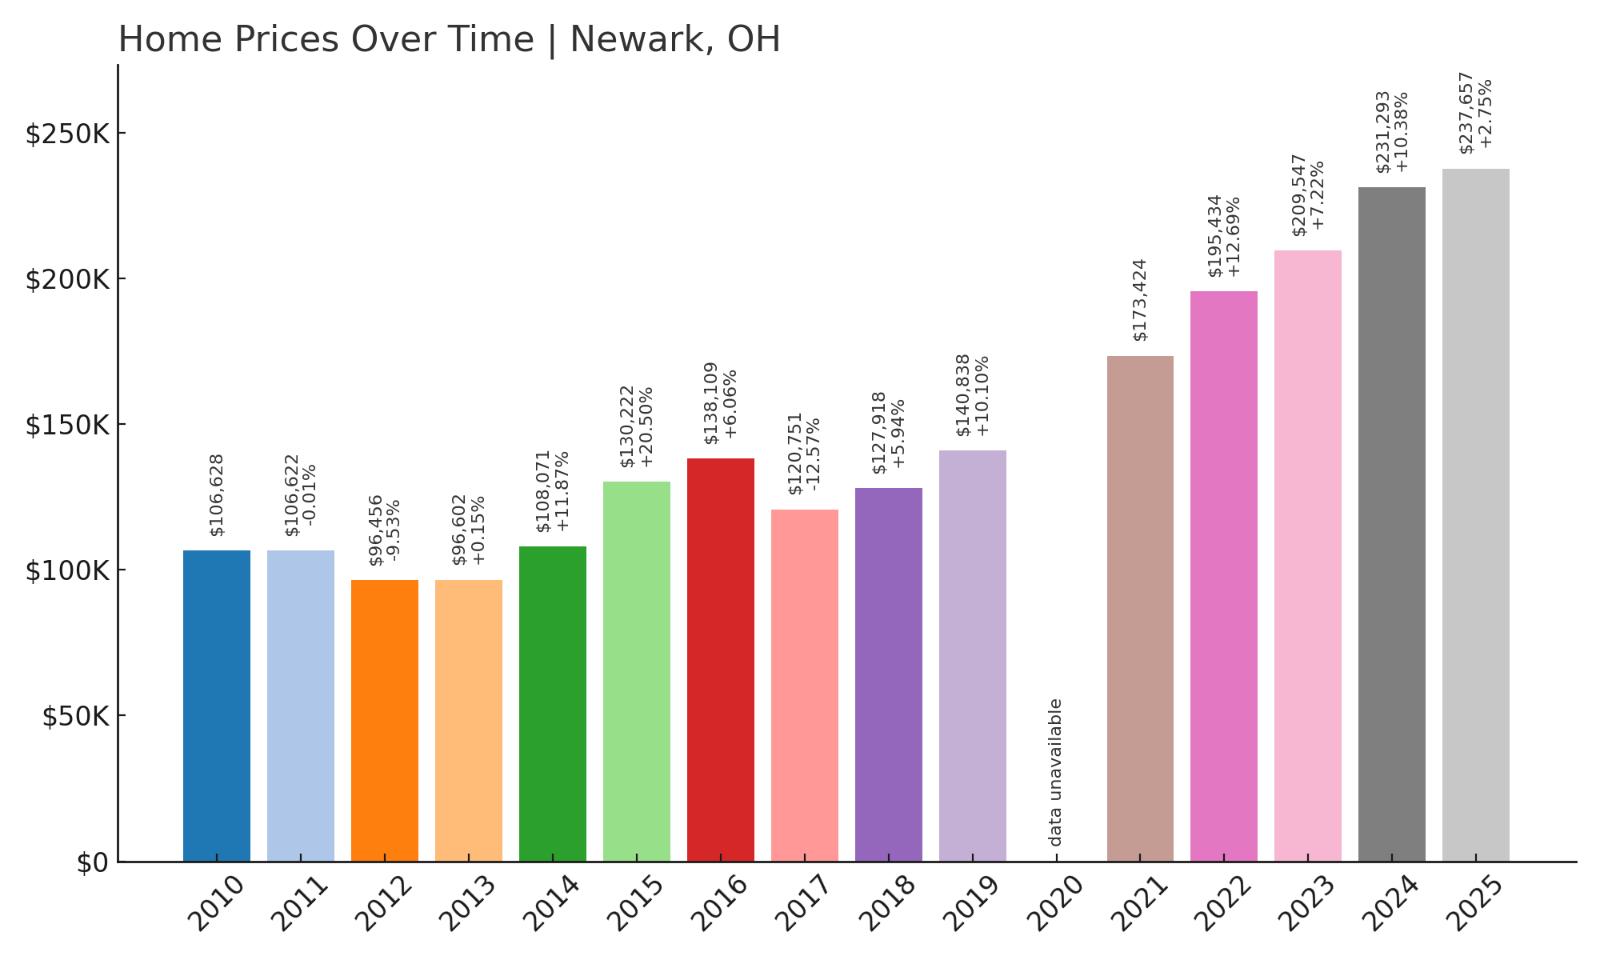
- Crash Risk Percentage: 82%
- Historical crashes (8%+ drops): 2
- Worst historical crash: -12.6% (2017)
- Total price increase since 2010: 122.9%
- Overextended above long-term average: 60.6%
- Price volatility (annual swings): 9.7%
- Current 2025 price: $237,657
Newark faces significant crash risk with an 82% vulnerability score, driven by multiple historical corrections and current market overextension. The Licking County seat experienced two major downturns, including a devastating 12.6% crash in 2017 that ranks among the worst single-year declines in our analysis. With home values up 122% since 2010 and trading 60% above long-term averages, Newark shows classic signs of dangerous overvaluation that historically precede market corrections.
Newark – County Seat Shows Serious Vulnerability
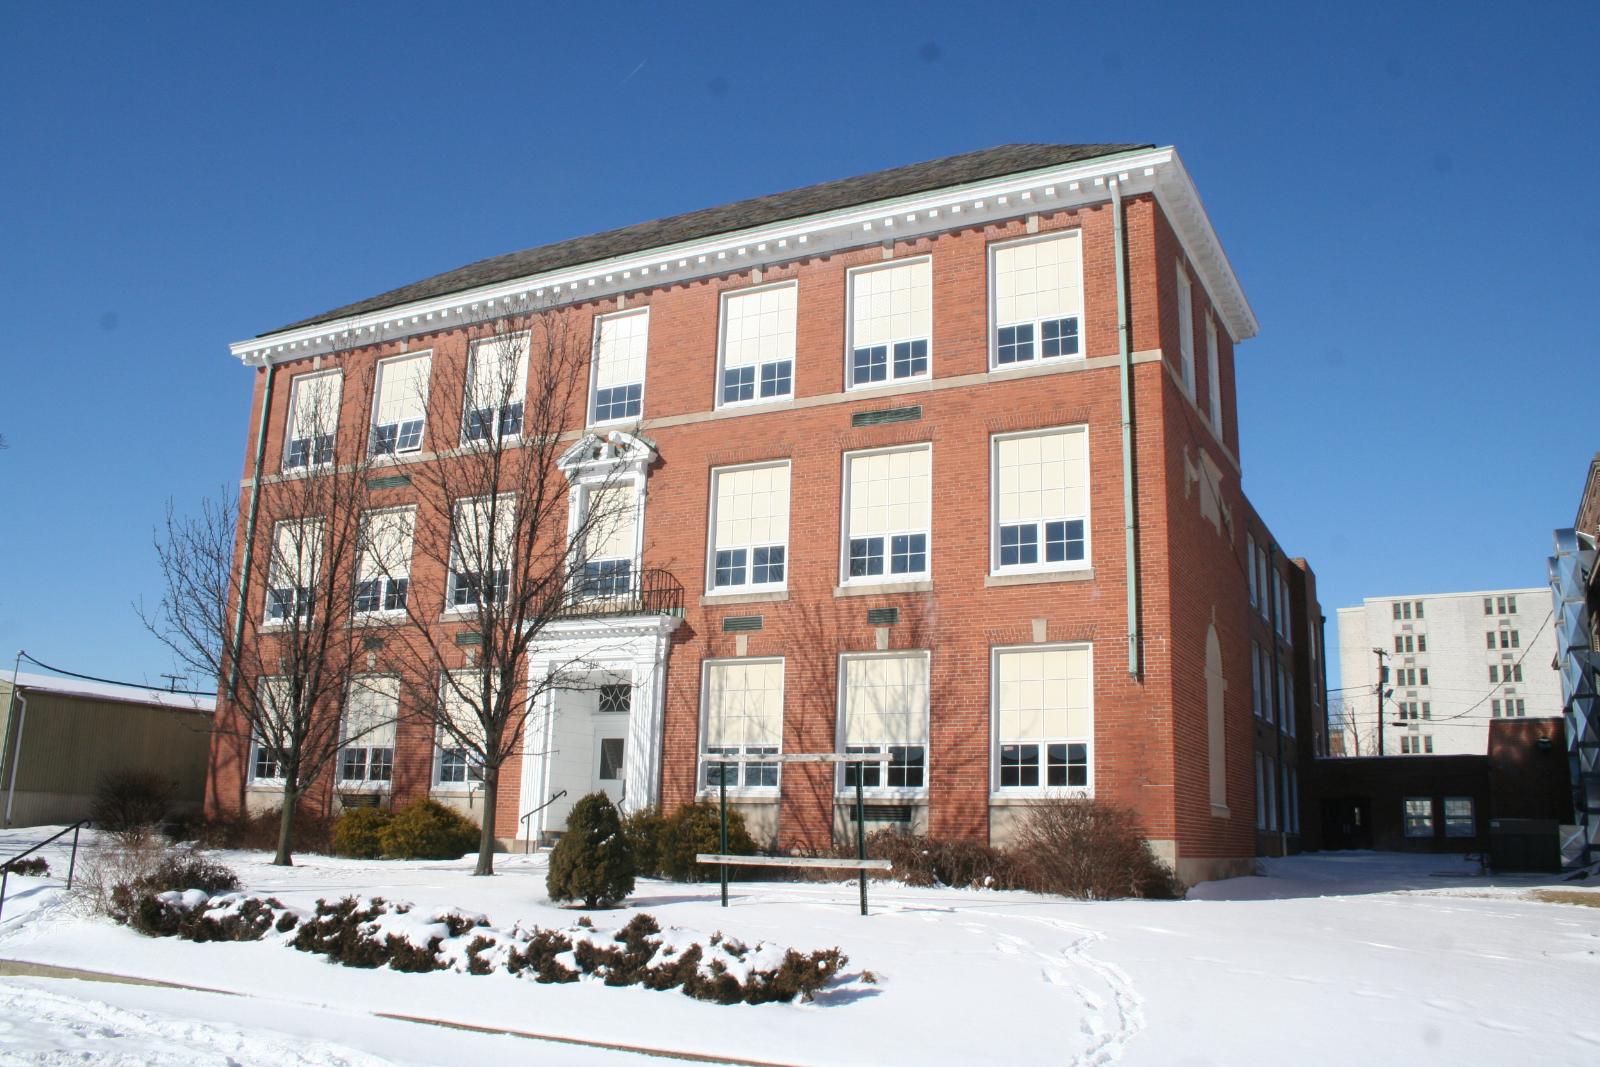
As Licking County’s largest city and administrative center, Newark serves as a regional hub with diverse employment opportunities in manufacturing, healthcare, and government services. The city’s economic stability initially supported housing demand, particularly among buyers seeking affordable alternatives to Columbus while maintaining reasonable commuting distances. Major employers like Owens Corning and Newark City Schools provide employment anchors, but recent housing appreciation has outpaced local wage growth, creating affordability pressures that threaten market sustainability.
The 2017 housing correction that eliminated 12.6% of home values serves as a stark reminder of Newark’s vulnerability to market downturns. Current prices around $238,000 represent more than doubling since 2010, with much of this appreciation occurring during the pandemic housing boom when buyers sought affordable markets outside major metropolitan areas. However, growth has decelerated sharply to under 3% in 2025, suggesting the market may be losing momentum at elevated valuation levels that appear increasingly disconnected from local economic fundamentals and historical pricing patterns.
6. Alexandria – Crash Risk Percentage: 83%
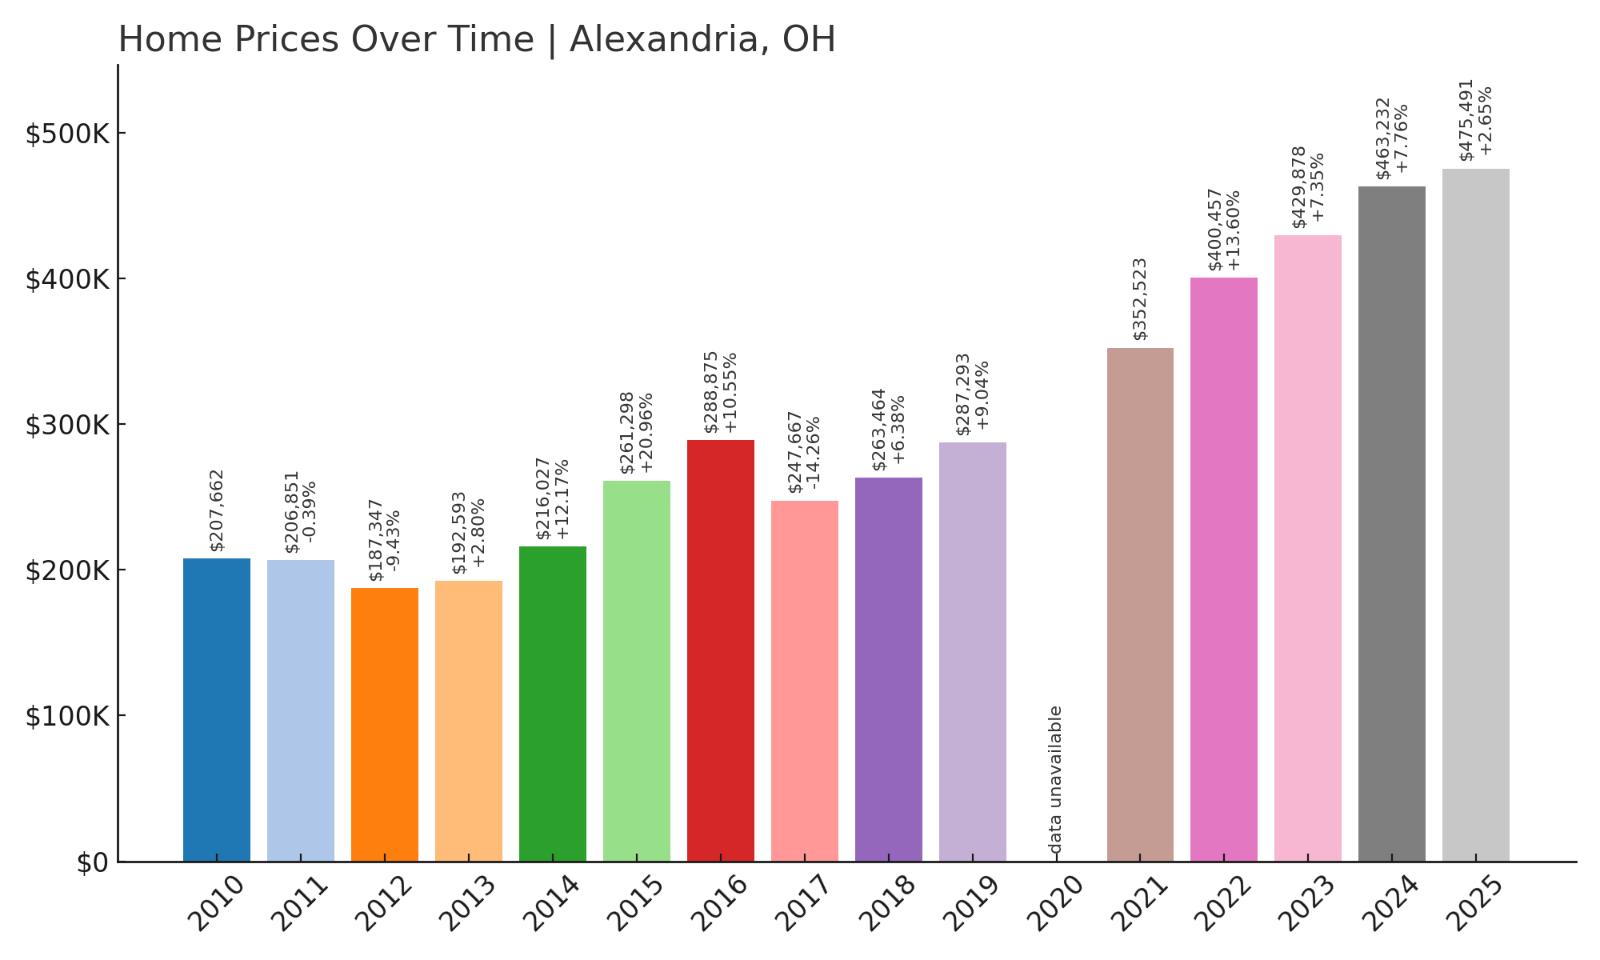
- Crash Risk Percentage: 83%
- Historical crashes (8%+ drops): 2
- Worst historical crash: -14.3% (2017)
- Total price increase since 2010: 129.0%
- Overextended above long-term average: 59.2%
- Price volatility (annual swings): 9.9%
- Current 2025 price: $475,491
Alexandria commands premium pricing approaching $476,000, but this elevated valuation comes with substantial downside risk given the market’s correction history and current overextension. The community suffered a severe 14.3% crash in 2017, demonstrating that even affluent markets remain vulnerable to significant price declines. With values up 129% since 2010 and trading 59% above long-term averages, Alexandria displays dangerous overvaluation that mirrors conditions before previous corrections.
Alexandria – Premium Pricing Creates Major Exposure
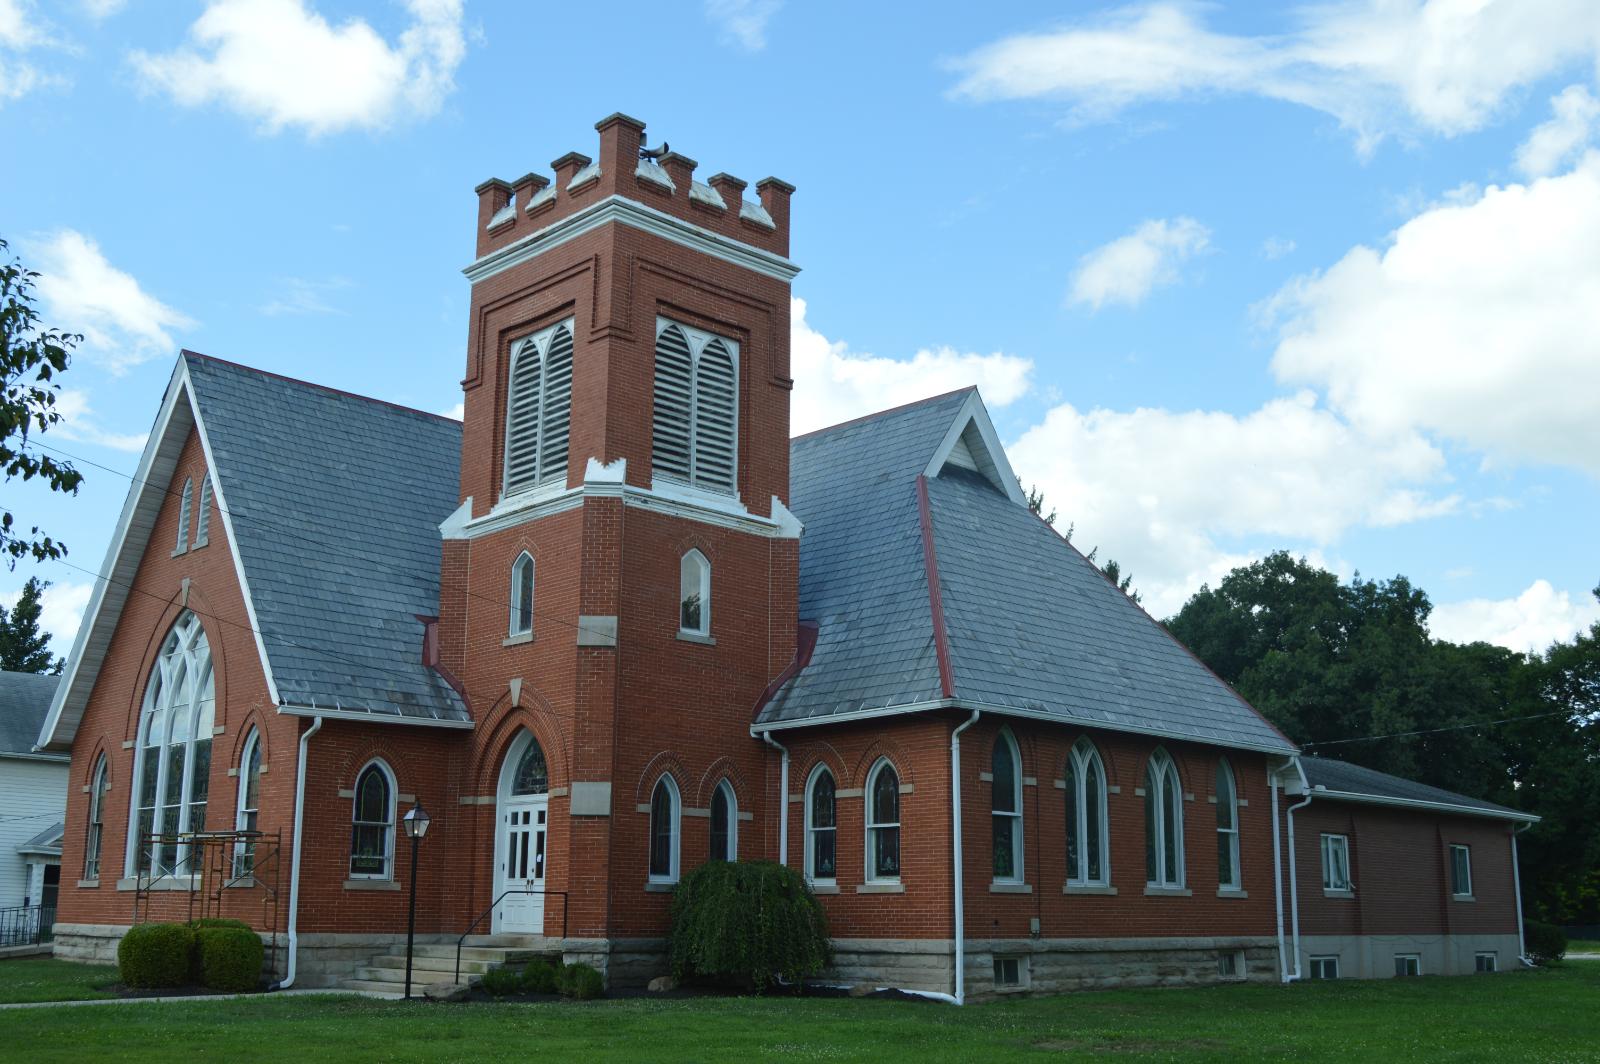
This exclusive Licking County community has attracted affluent buyers seeking upscale rural properties within commuting distance of Columbus and Newark employment centers. Alexandria’s appeal stems from its combination of large lot sizes, custom homes, and scenic countryside settings that provide privacy and prestige. However, median prices approaching half a million dollars have created a narrow buyer pool limited to high-income households, increasing market vulnerability during economic downturns when luxury spending typically contracts first.
The devastating 14.3% crash in 2017 eliminated significant wealth for Alexandria homeowners, proving that premium markets face substantial correction risk during broader housing adjustments. Current valuation levels represent more than doubling since 2010, with much of the appreciation driven by pandemic-era demand for rural luxury properties. Recent growth has moderated to under 3% annually, suggesting momentum loss that often precedes corrections in high-end markets where buyer demand becomes increasingly sensitive to economic conditions, mortgage rates, and wealth effects from other asset classes.
5. Litchfield – Crash Risk Percentage: 84%
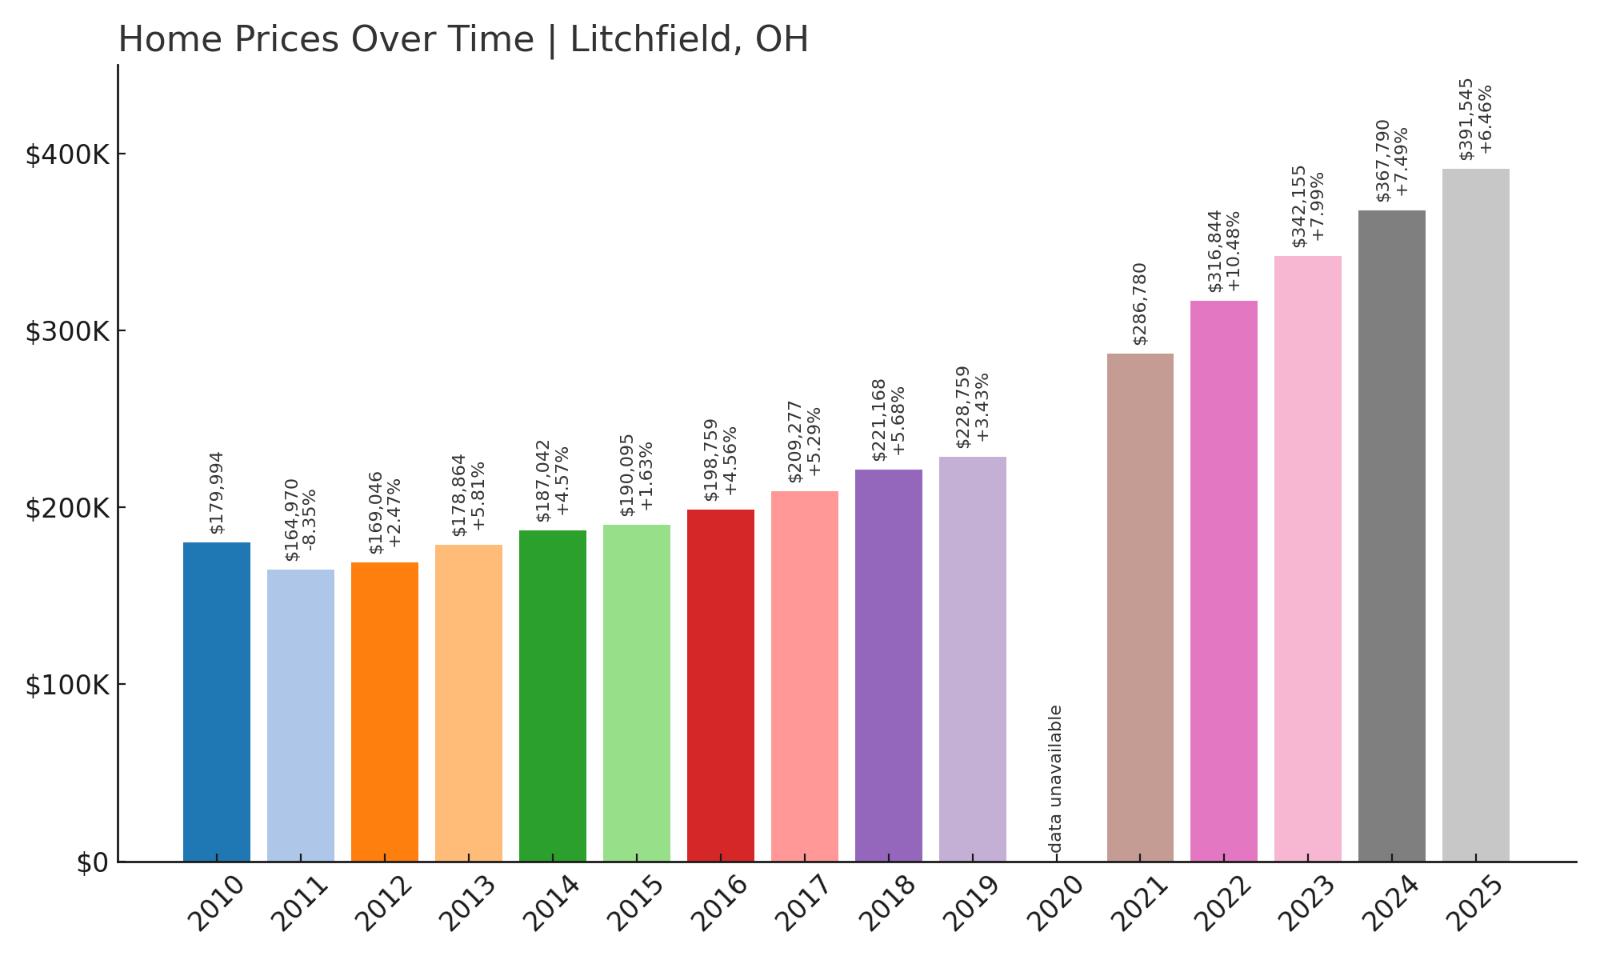
- Crash Risk Percentage: 84%
- Historical crashes (8%+ drops): 1
- Worst historical crash: -8.3% (2011)
- Total price increase since 2010: 117.5%
- Overextended above long-term average: 61.7%
- Price volatility (annual swings): 7.0%
- Current 2025 price: $391,545
Litchfield ranks among the highest crash risks in our analysis despite experiencing only one major historical correction, reflecting the market’s current dangerous overextension and elevated pricing. The community endured an 8.3% decline in 2011 during the broader housing crisis, demonstrating vulnerability to economic pressures. With home values up 117% since 2010 and trading 61% above long-term averages, Litchfield shows signs of unsustainable appreciation that threatens market stability.
Litchfield – Steady Appreciation Masks Growing Risk
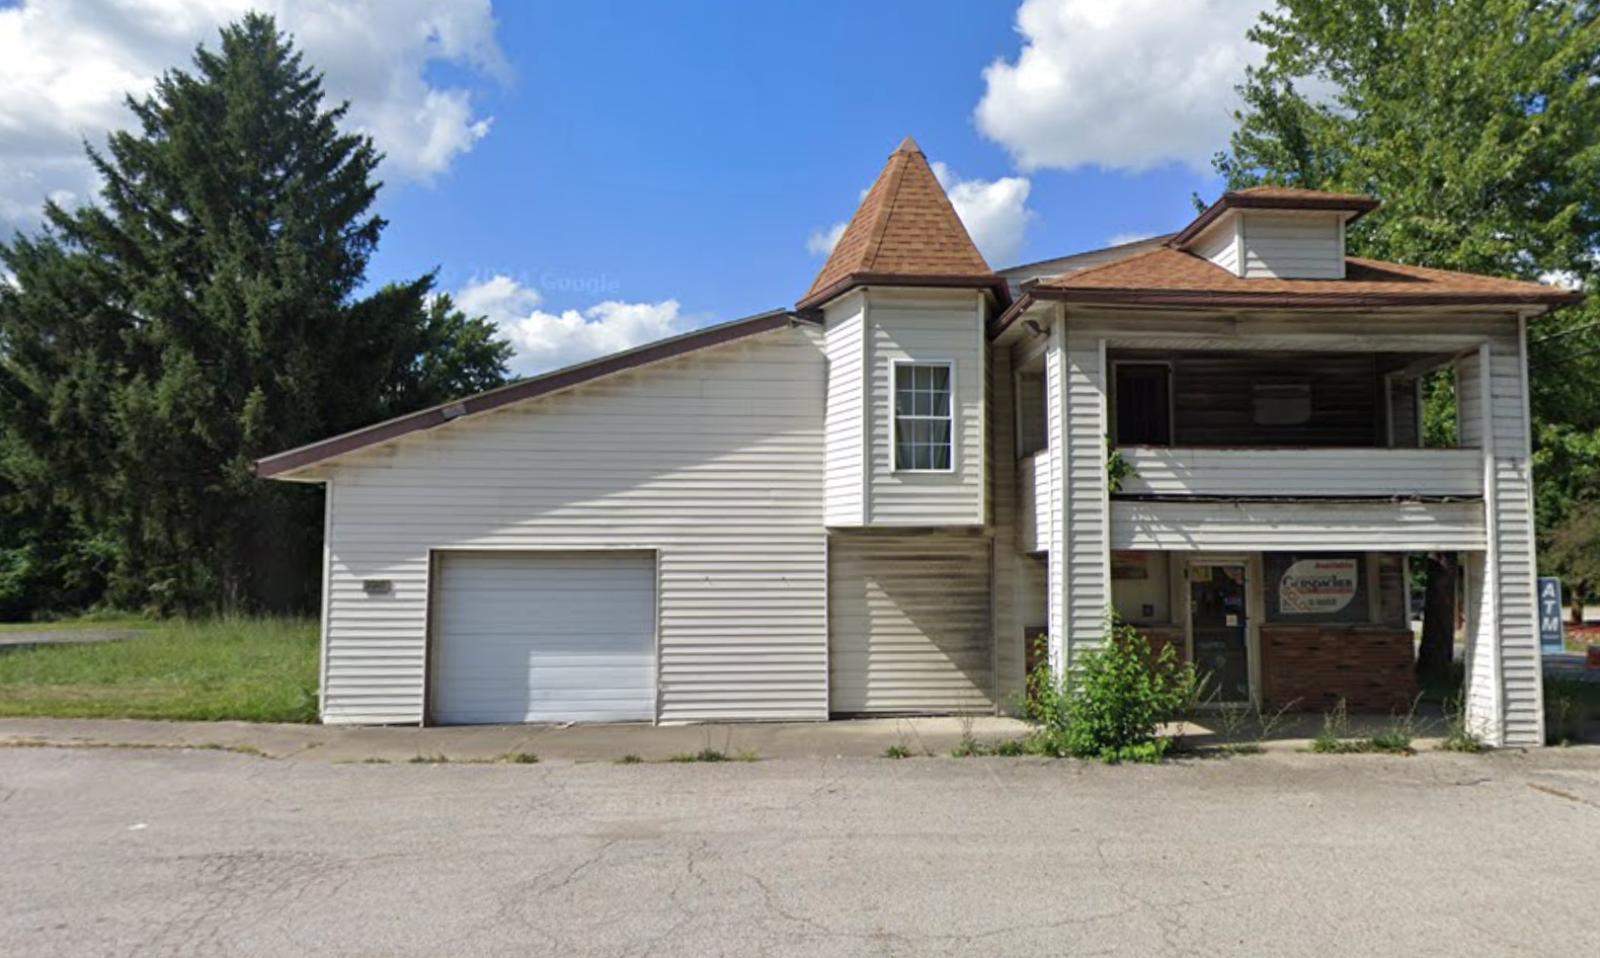
Located in Medina County southwest of Cleveland, Litchfield has developed as an upscale suburban community attracting professionals working in Cleveland’s western suburbs and downtown core. The township’s combination of newer developments, quality schools, and reasonable commuting distances has supported steady demand for housing in the upper-middle price ranges. However, median home prices approaching $392,000 represent significant appreciation that has outpaced income growth in the broader Cleveland metropolitan area.
While Litchfield experienced a relatively modest 8.3% correction in 2011, current market conditions suggest greater vulnerability than historical patterns might indicate. The community’s 117% appreciation since 2010 has pushed values far beyond historical norms, creating affordability barriers that limit buyer demand to high-income households. Recent growth has remained strong at over 6% in 2025, but this continued momentum at already elevated levels increases correction risk, particularly if Cleveland-area employment conditions weaken or mortgage rate increases impact the luxury home buyers who typically drive demand in premium suburban markets like Litchfield.
4. Blacklick Estates – Crash Risk Percentage: 85%
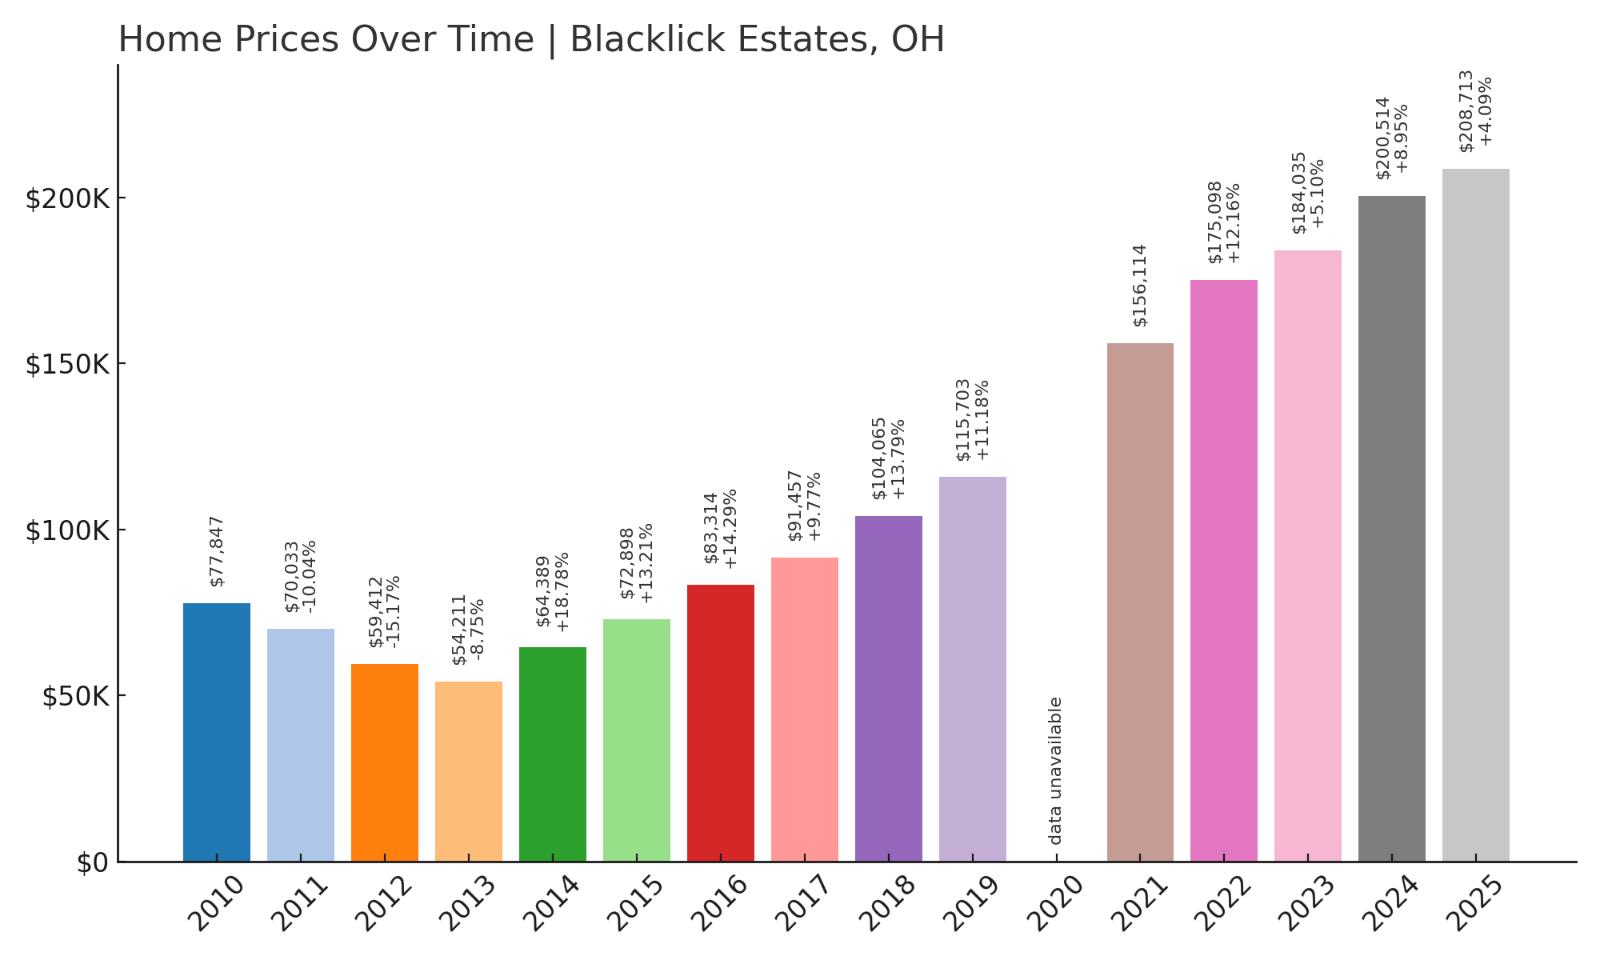
- Crash Risk Percentage: 85%
- Historical crashes (8%+ drops): 3
- Worst historical crash: -15.2% (2012)
- Total price increase since 2010: 168.1%
- Overextended above long-term average: 82.3%
- Price volatility (annual swings): 12.5%
- Current 2025 price: $208,713
Blacklick Estates presents extreme crash risk with three historical corrections and massive overvaluation that creates serious vulnerability. The market suffered a catastrophic 15.2% decline in 2012, representing one of the worst single-year crashes in our analysis. With values surging 168% since 2010 and trading 82% above long-term averages, the market displays dangerous instability with excessive volatility averaging 12.5% annually.
Blacklick Estates – Multiple Crashes Signal Major Instability
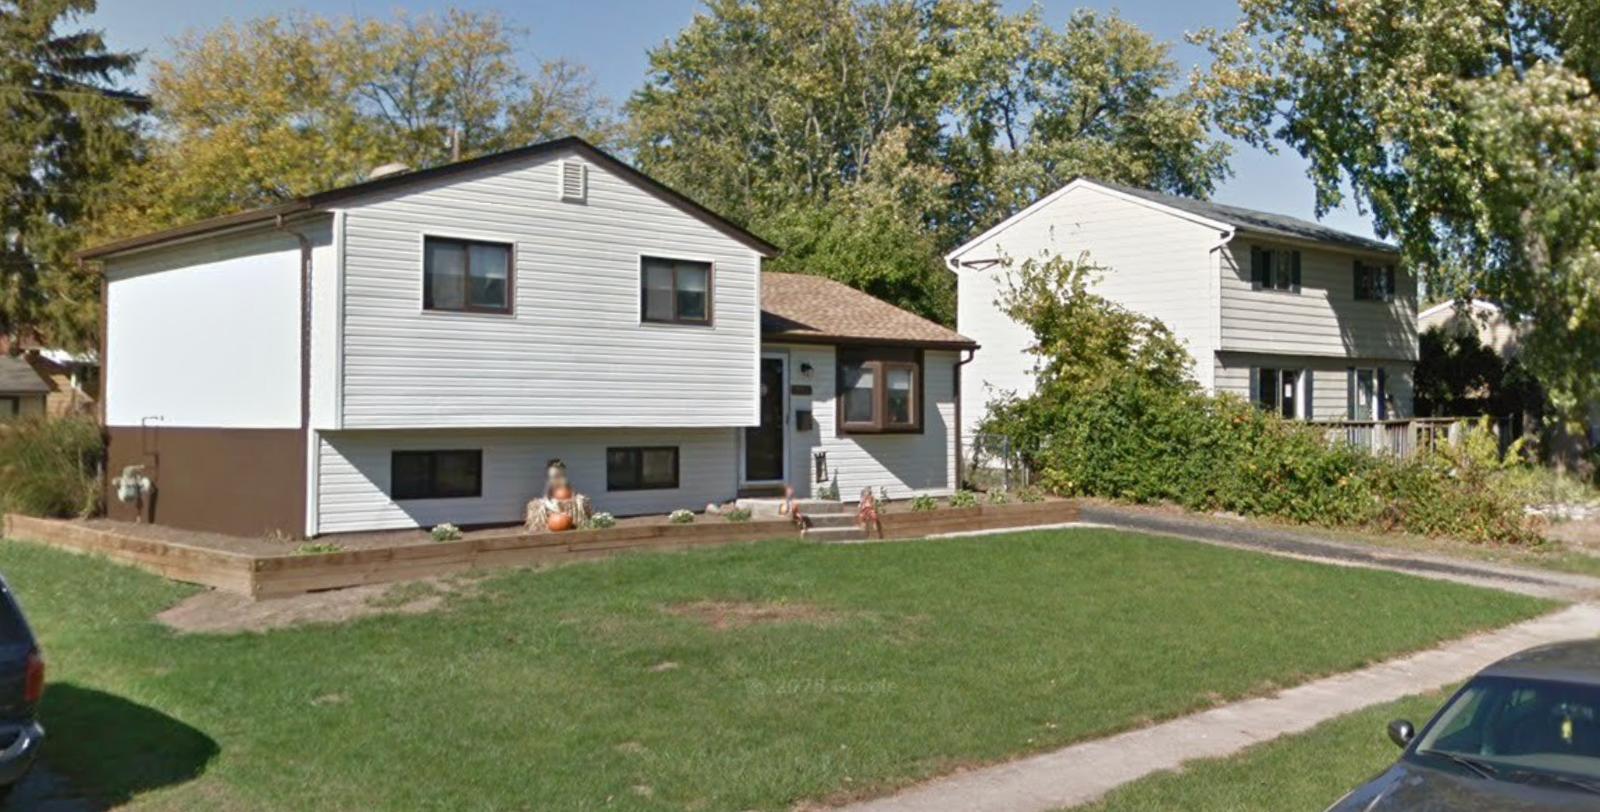
This Franklin County community near Reynoldsburg has experienced remarkable transformation from a modest residential area to a rapidly appreciating market that attracts Columbus-area buyers. Located along major transportation corridors with convenient access to downtown Columbus and eastern suburbs, Blacklick Estates initially offered affordable housing options for middle-income families. However, the area’s development boom and proximity advantages have driven prices to levels that appear unsustainable given historical patterns and local economic fundamentals.
The market’s history of three major crashes, including the devastating 15.2% decline in 2012, demonstrates exceptional vulnerability to economic downturns and market corrections. Current prices around $209,000 represent nearly tripling since 2010, with much of this appreciation occurring during recent years when buyers sought affordable alternatives within the Columbus metropolitan area. This aggressive growth has pushed values 82% above historical norms, creating mathematical unsustainability that significantly increases correction risk given the area’s pattern of boom-bust cycles and high volatility that makes accurate pricing extremely difficult.
3. Elmwood Place – Crash Risk Percentage: 87%
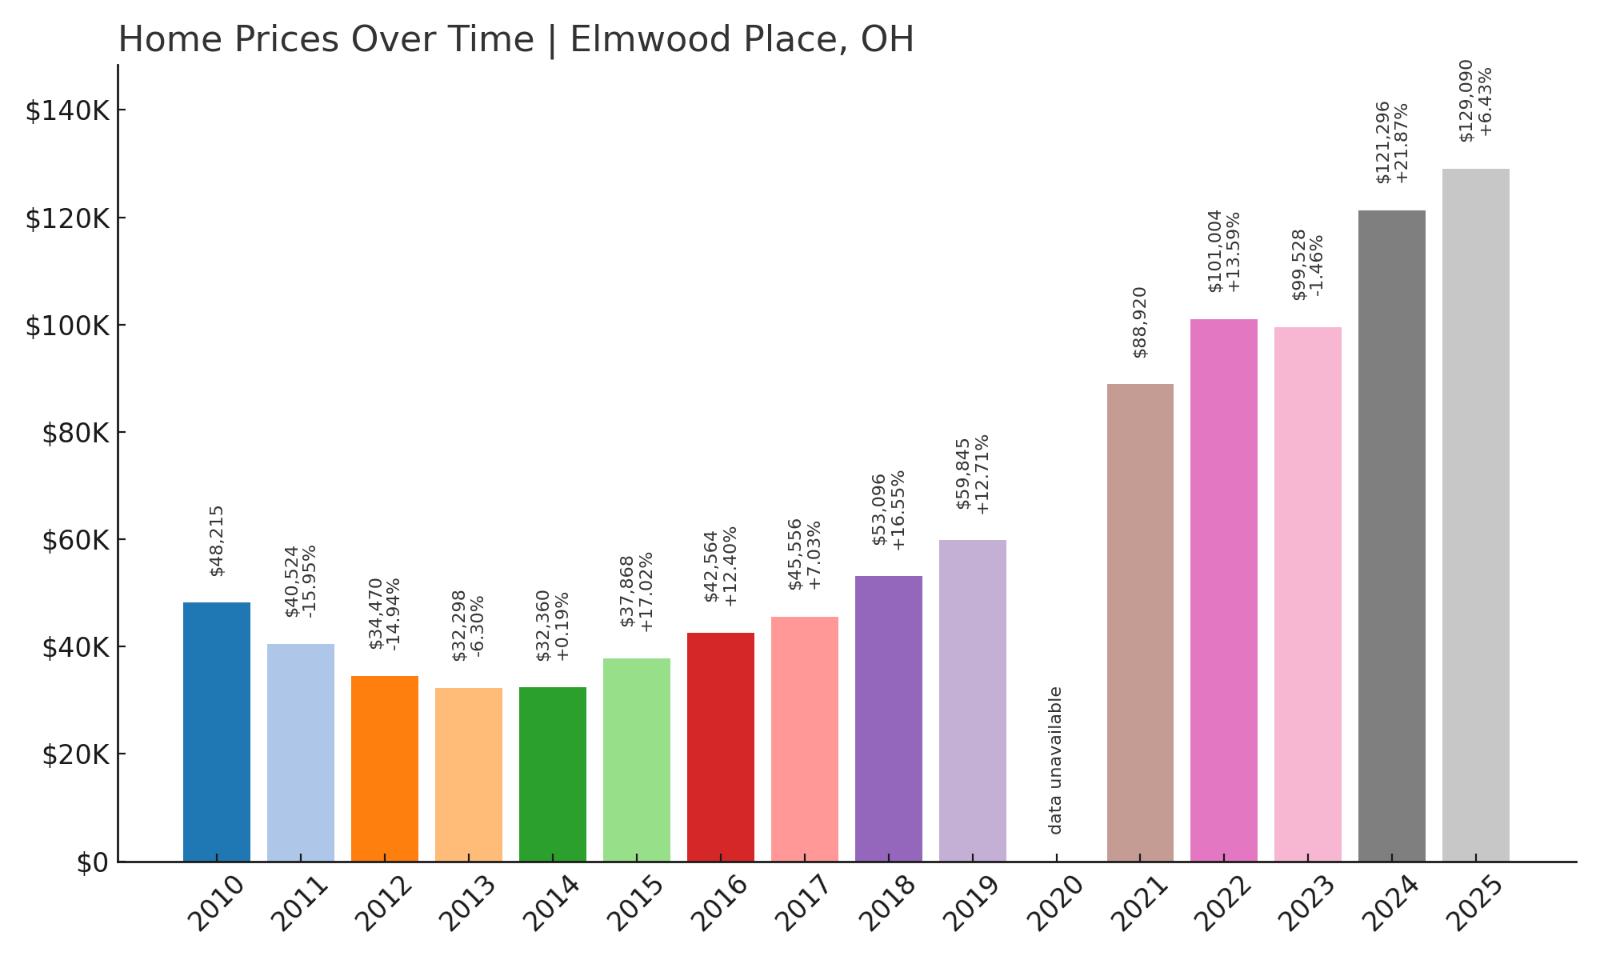
- Crash Risk Percentage: 87%
- Historical crashes (8%+ drops): 2
- Worst historical crash: -16.0% (2011)
- Total price increase since 2010: 167.7%
- Overextended above long-term average: 100.3%
- Price volatility (annual swings): 16.0%
- Current 2025 price: $129,090
Elmwood Place faces severe crash risk with an 87% vulnerability score driven by extreme overvaluation and dangerous volatility patterns. The community experienced two major corrections, including a devastating 16% crash in 2011 that ranks among the worst declines in our analysis. Currently trading over 100% above its long-term average with explosive 167% appreciation since 2010, the market displays the most extreme overextension in our study, combined with excessive volatility averaging 16% annually.
Elmwood Place – Extreme Overvaluation Creates Maximum Risk
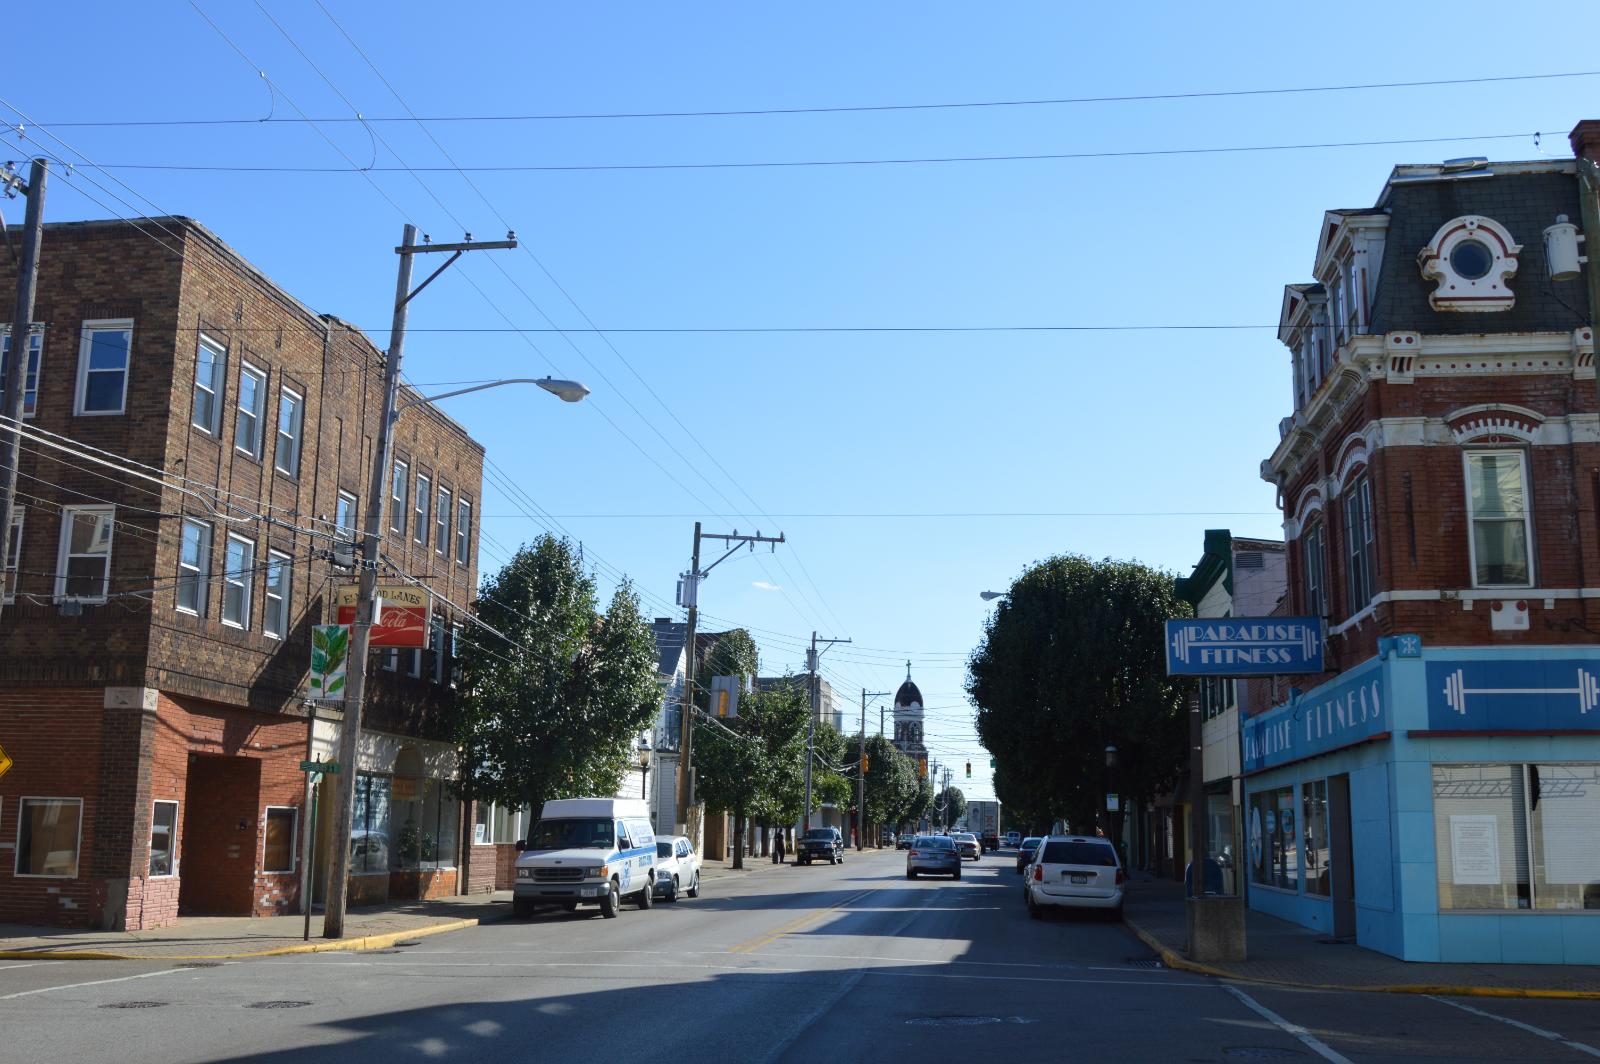
This small Hamilton County village near Cincinnati has undergone dramatic transformation from an affordable working-class community to a rapidly appreciating market that defies local economic fundamentals. Elmwood Place’s compact size of just 0.3 square miles and population under 2,500 creates thin market conditions where individual transactions can dramatically impact median prices. The community’s proximity to Cincinnati’s urban core initially attracted investors and first-time buyers seeking affordable options, but subsequent speculation has driven prices to unsustainable levels.
The market’s extreme instability became evident during the 2011 housing crisis when values plummeted 16%, wiping out years of equity for homeowners. Current prices around $129,000 represent nearly tripling since that crash, with the recovery creating dangerous overvaluation that exceeds long-term averages by over 100%. This mathematical impossibility to sustain such overextension, combined with 16% annual volatility that far exceeds healthy market patterns, positions Elmwood Place for a potentially severe correction that could devastate homeowner equity and highlight the risks of speculative investing in small, illiquid housing markets.
2. Whitehall – Crash Risk Percentage: 89%
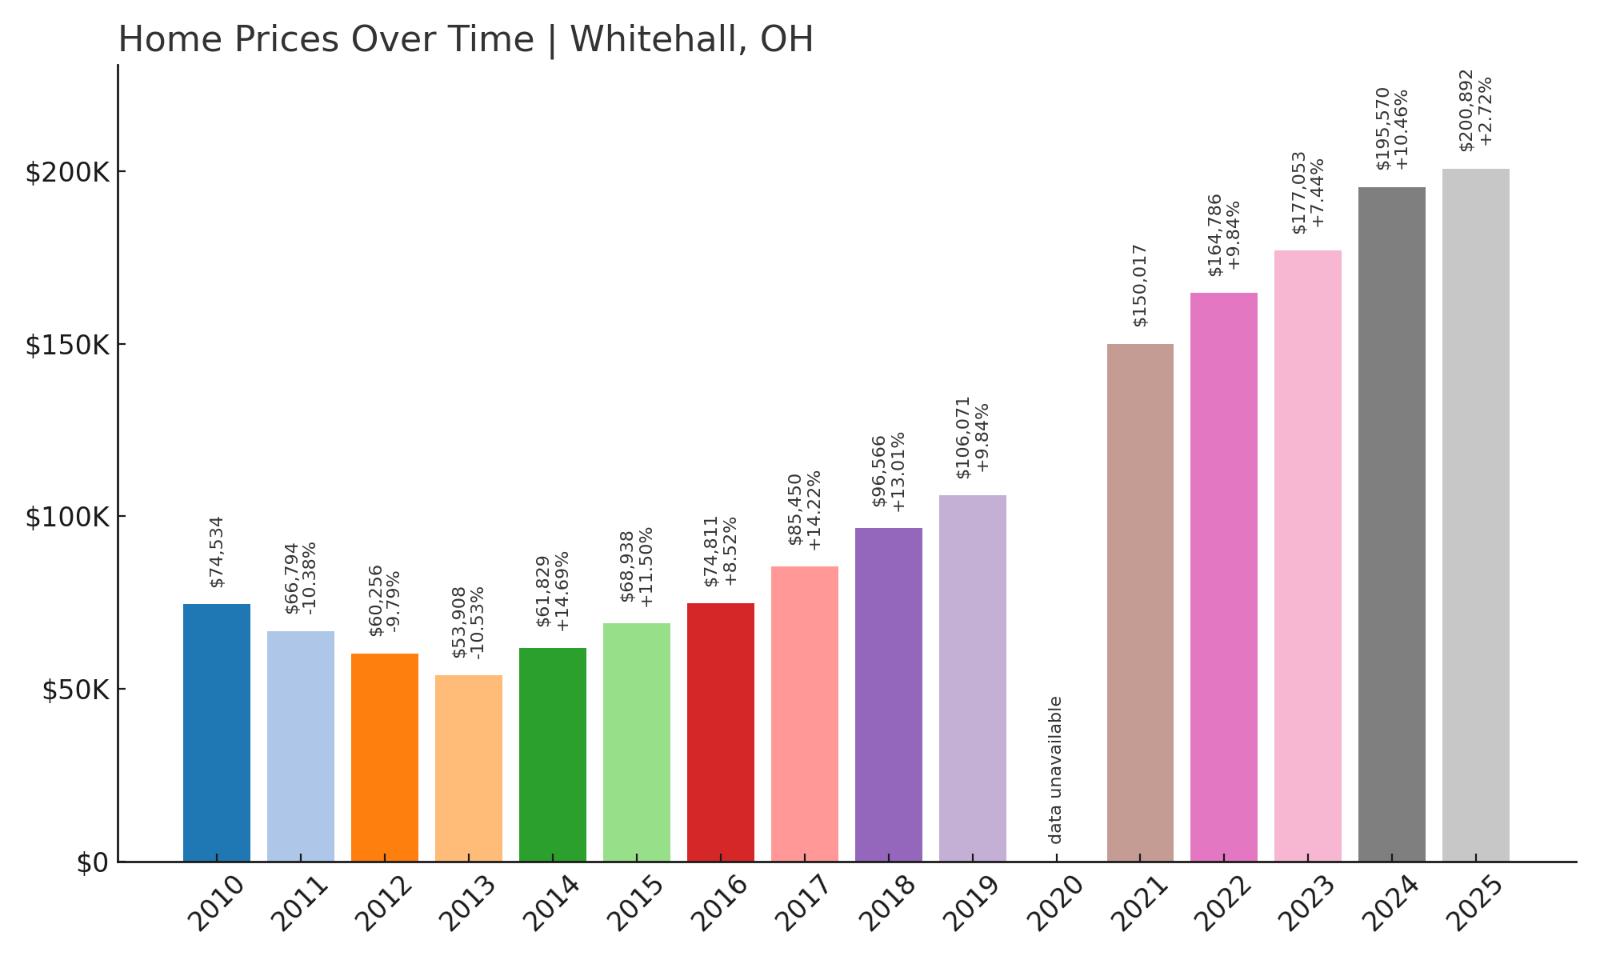
- Crash Risk Percentage: 89%
- Historical crashes (8%+ drops): 3
- Worst historical crash: -10.5% (2013)
- Total price increase since 2010: 169.5%
- Overextended above long-term average: 84.0%
- Price volatility (annual swings): 12.9%
- Current 2025 price: $200,892
Whitehall ranks second in crash risk with an 89% vulnerability score, reflecting three historical corrections and extreme current overvaluation. The Franklin County city endured multiple significant downturns, including a 10.5% crash in 2013 that demonstrated persistent market instability. With home values surging 169% since 2010 and trading 84% above long-term averages, Whitehall displays dangerous overextension combined with excessive volatility that creates serious correction risk.
Whitehall – Multiple Crashes Warn of Impending Correction
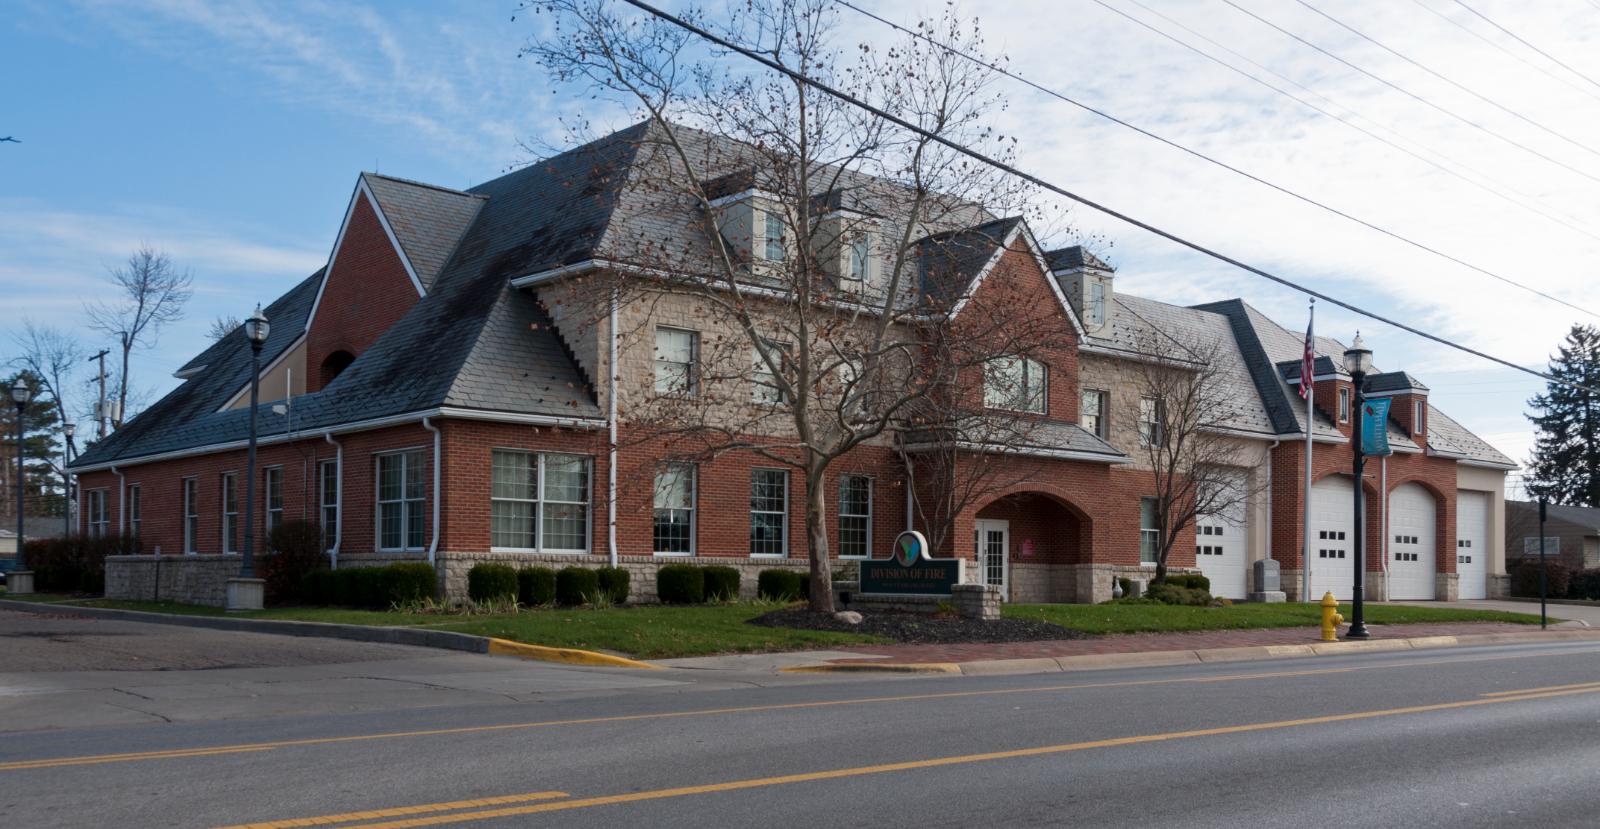
Located directly east of downtown Columbus, Whitehall serves as an established inner-ring suburb that has historically provided affordable housing options for working families and young professionals. The city’s convenient access to major employment centers, including downtown Columbus and Port Columbus, initially supported steady housing demand in the modest price ranges. However, recent appreciation has transformed Whitehall from an affordable alternative into a rapidly appreciating market that appears disconnected from local economic conditions and resident income levels.
The community’s history of three major crashes, including corrections in multiple years during the 2010s, demonstrates exceptional vulnerability to economic pressures and market downturns. Current prices around $201,000 represent nearly tripling since 2010, with much of this appreciation occurring during the pandemic housing boom when investors targeted affordable Columbus-area markets. This aggressive growth has pushed values 84% above historical norms while creating affordability barriers for the working-class families who traditionally comprised Whitehall’s buyer base, suggesting the market has become fundamentally mispriced relative to local economic fundamentals.
1. Johnstown – Crash Risk Percentage: 92%
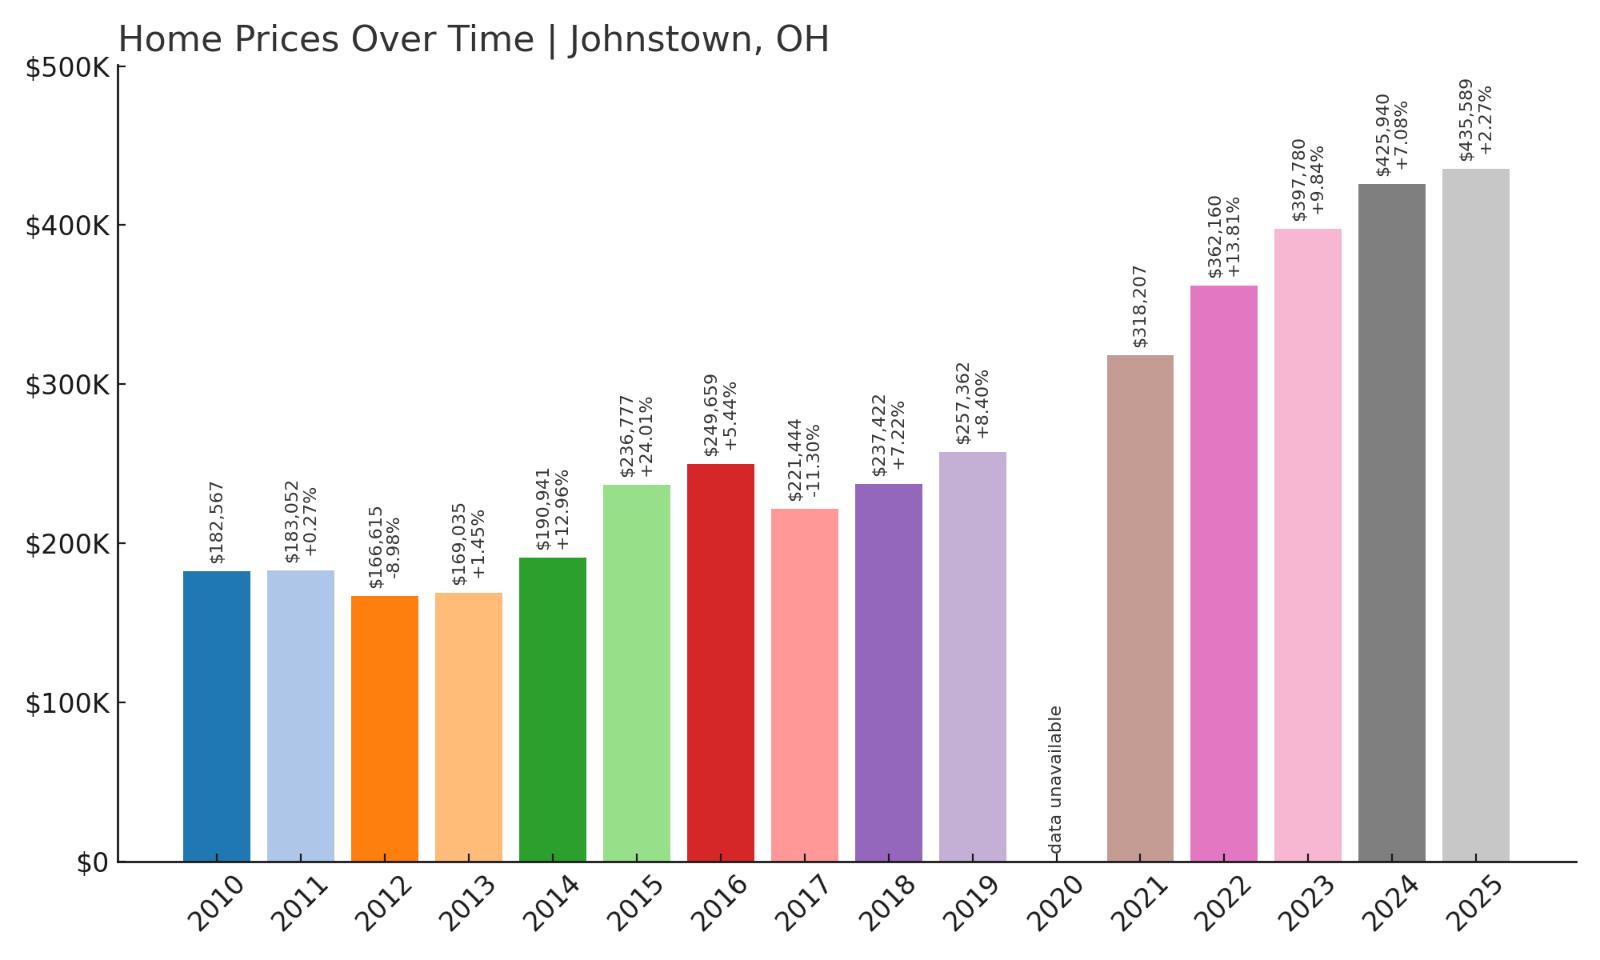
- Crash Risk Percentage: 92%
- Historical crashes (8%+ drops): 2
- Worst historical crash: -11.3% (2017)
- Total price increase since 2010: 138.6%
- Overextended above long-term average: 61.9%
- Price volatility (annual swings): 10.0%
- Current 2025 price: $435,589
Johnstown tops our crash risk analysis with a dangerous 92% vulnerability score, driven by premium pricing that creates maximum exposure to market corrections. The Licking County community suffered two significant downturns, including an 11.3% crash in 2017 that eliminated substantial homeowner equity. With median prices approaching $436,000 and values up 138% since 2010, Johnstown displays the classic combination of luxury market pricing and overextension that historically produces the most severe corrections.
Johnstown – Premium Pricing Creates Maximum Vulnerability
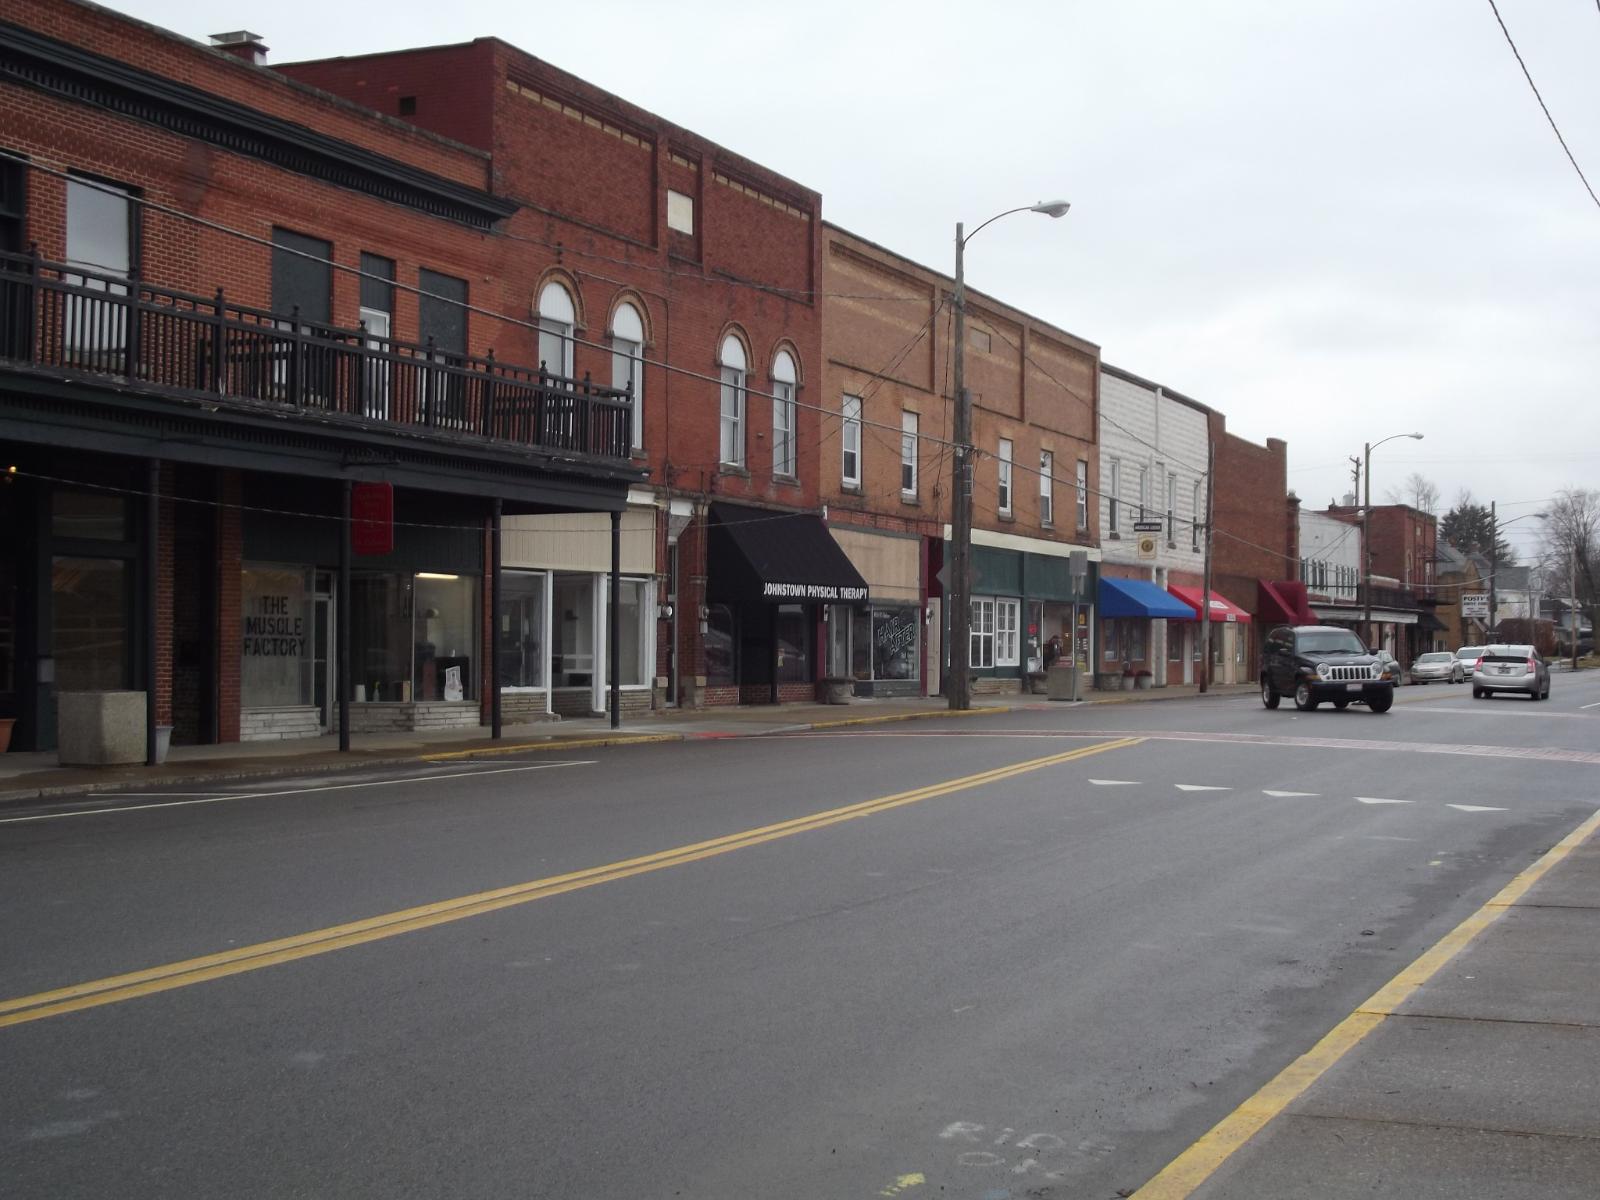
This affluent Licking County community has emerged as one of central Ohio’s premier residential destinations, attracting high-income professionals seeking upscale suburban living within commuting distance of Columbus. Johnstown’s combination of excellent schools, new construction developments, and proximity to major employment centers has driven sustained demand in the luxury home market. However, median prices approaching $436,000 represent a dramatic departure from historical norms and create vulnerability among the limited pool of buyers who can afford such elevated pricing levels.
The 2017 correction that eliminated over 11% of home values demonstrates that even premium markets face substantial downside risk during broader housing adjustments. Current prices represent more than doubling since 2010, with much of this appreciation occurring during recent years when wealthy buyers sought suburban alternatives to urban living. However, recent growth has decelerated to just 2.3% in 2025, suggesting momentum loss that often signals market tops in luxury communities where buyer demand becomes highly sensitive to economic conditions, stock market performance, and interest rate changes that affect the affluent households who drive demand in markets like Johnstown.


