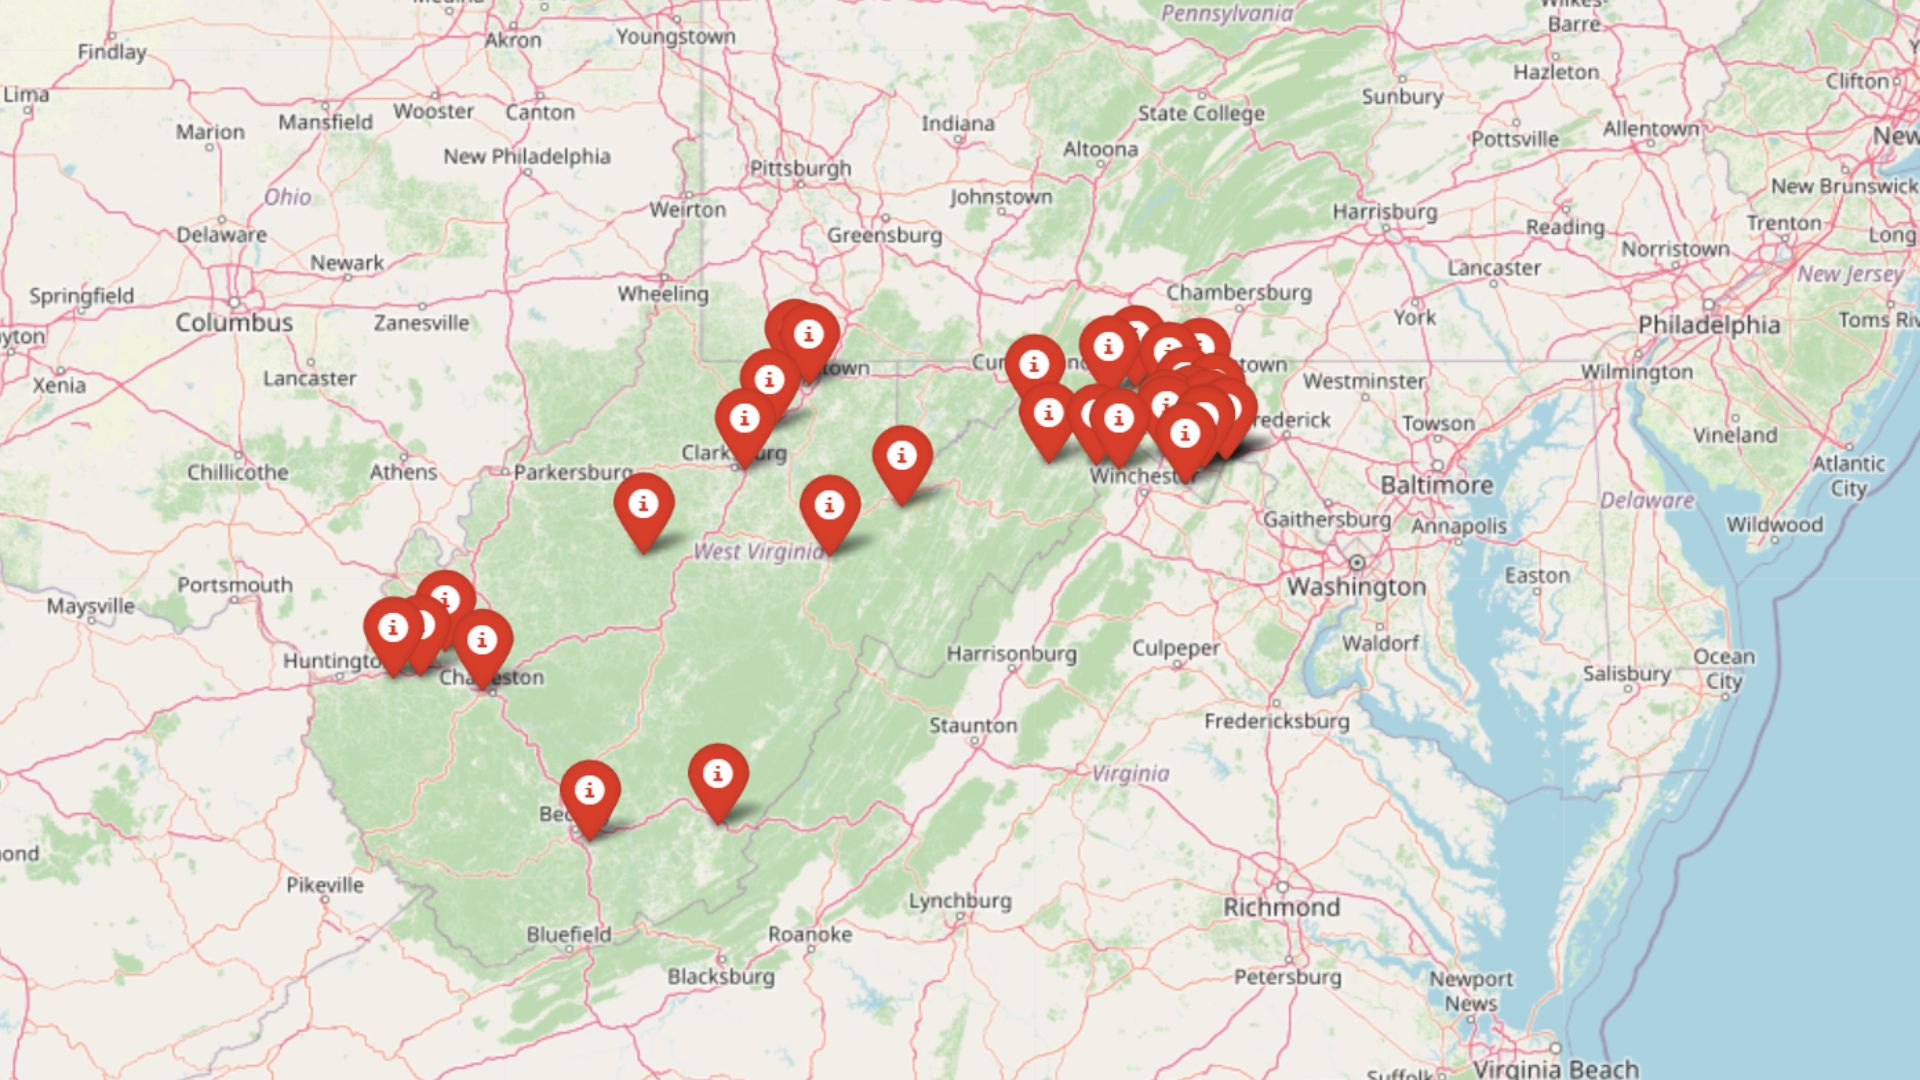
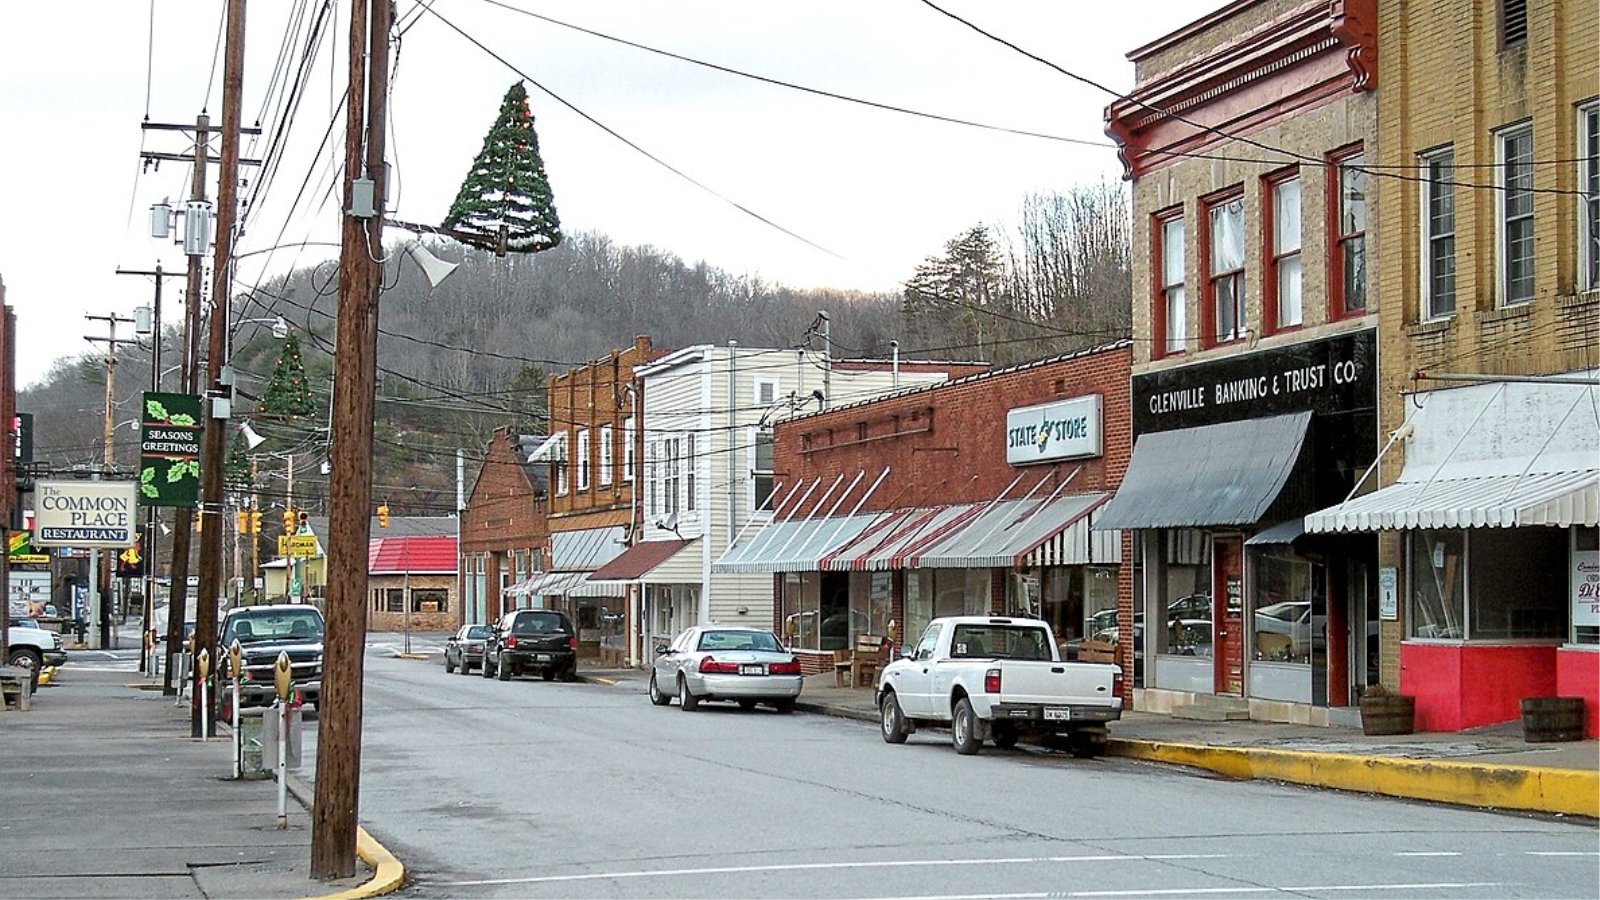
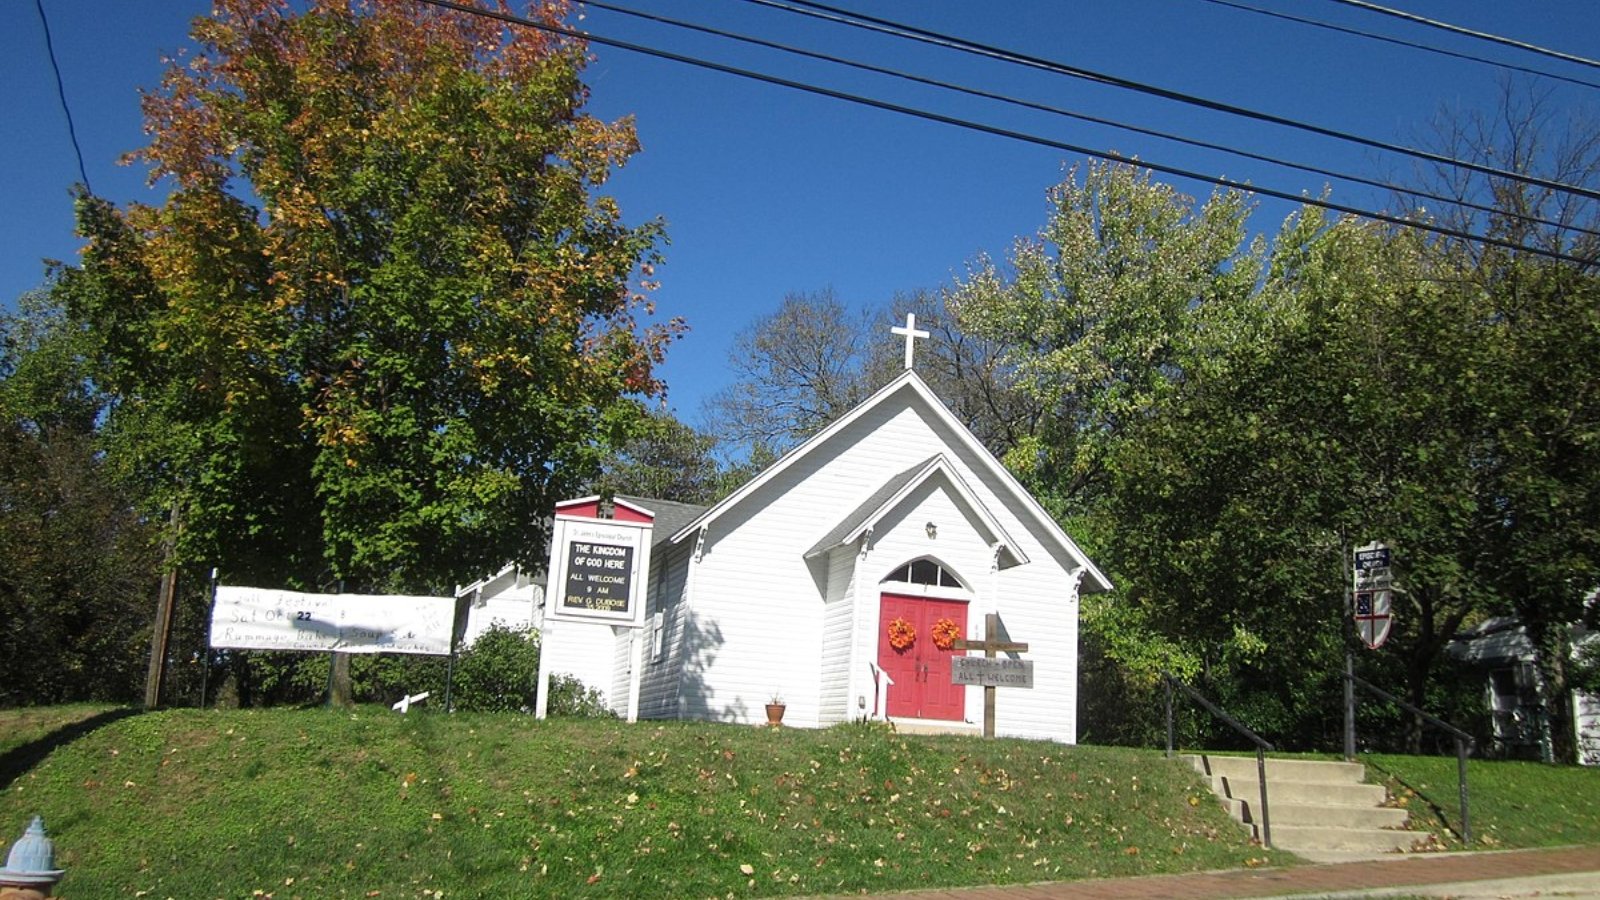
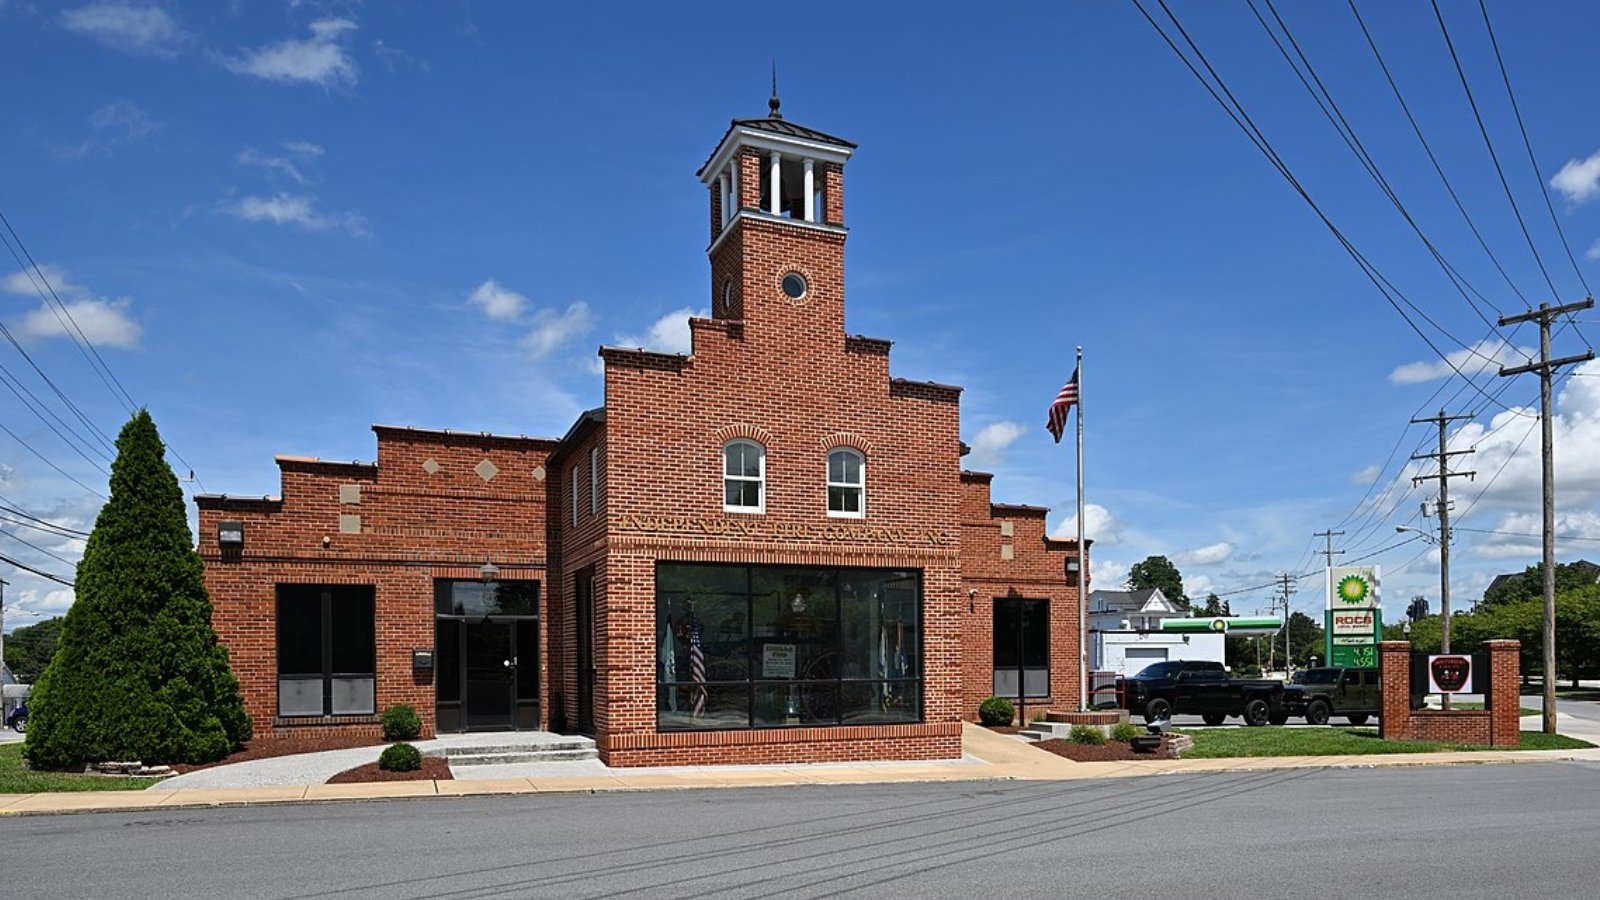
West Virginia may be known for affordability, but some towns are breaking the mold with steep property values. According to the Zillow Home Value Index, 33 communities across the Mountain State now rank among its most expensive housing markets. From scenic retreats to booming hubs, these towns are seeing home prices climb higher than ever—often driven by demand for charm, land, or proximity to outdoor living. Whether you’re house hunting or just market-watching, these rankings reveal where West Virginia real estate carries the biggest price tags.
33. Daniels – 58.5% Home Price Increase Since 2010
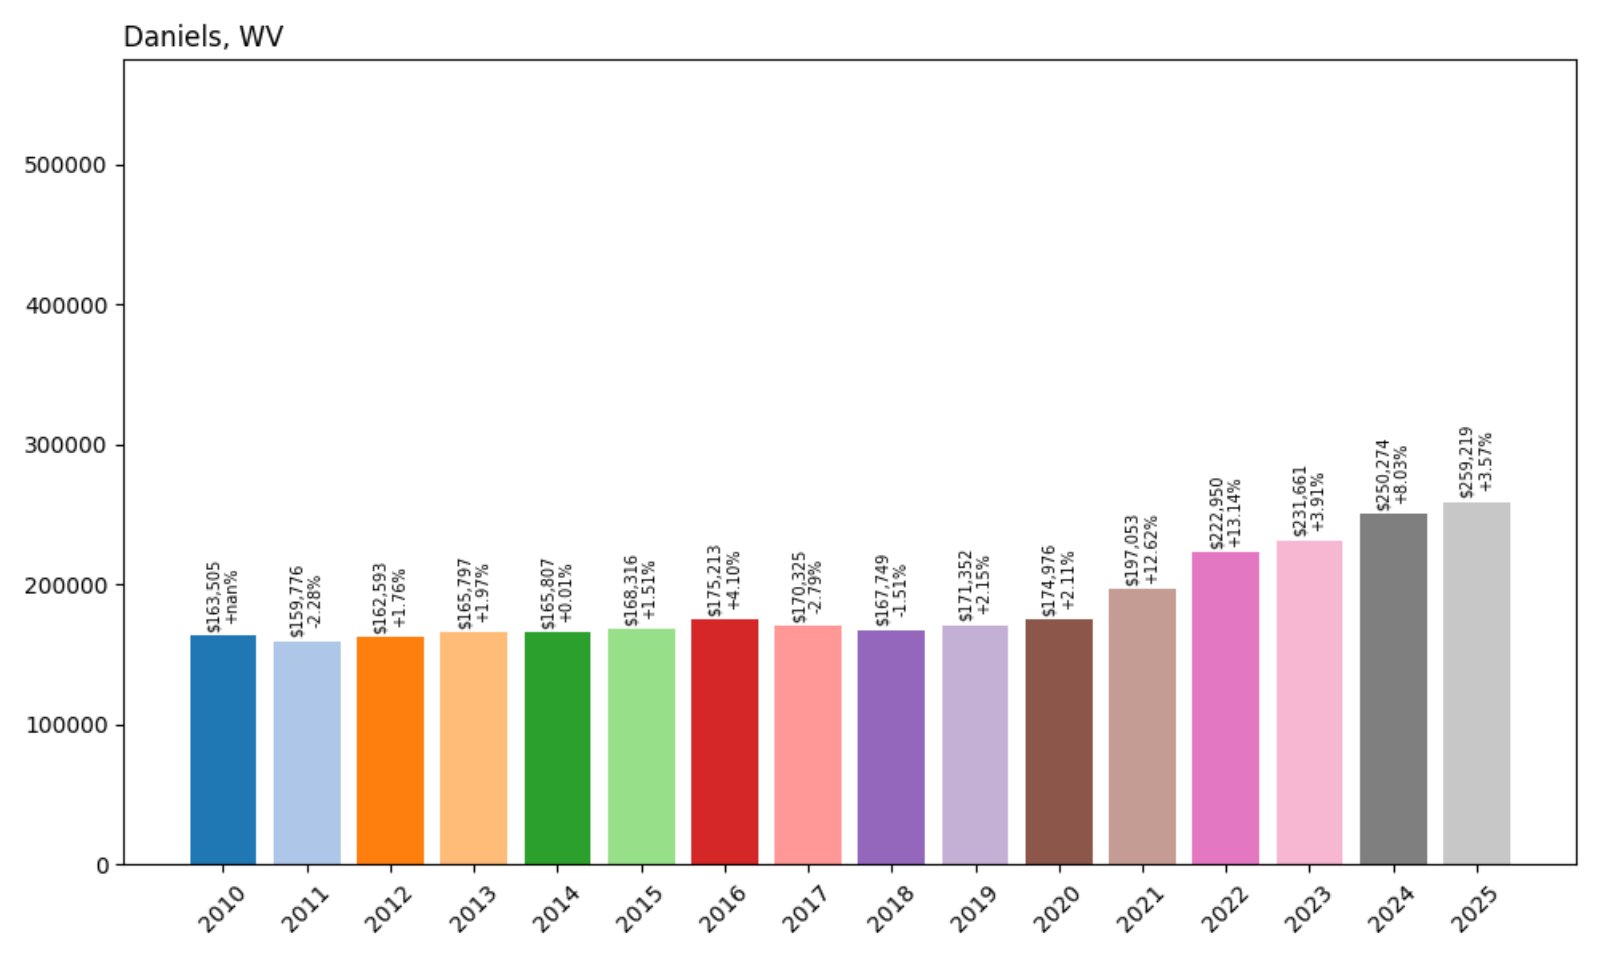
- 2010: $163,505
- 2011: $159,776 (−$3,730, −2.28% from previous year)
- 2012: $162,593 (+$2,818, +1.76% from previous year)
- 2013: $165,797 (+$3,204, +1.97% from previous year)
- 2014: $165,807 (+$10, +0.01% from previous year)
- 2015: $168,316 (+$2,508, +1.51% from previous year)
- 2016: $175,213 (+$6,898, +4.10% from previous year)
- 2017: $170,325 (−$4,888, −2.79% from previous year)
- 2018: $167,749 (−$2,577, −1.51% from previous year)
- 2019: $171,352 (+$3,604, +2.15% from previous year)
- 2020: $174,976 (+$3,623, +2.11% from previous year)
- 2021: $197,053 (+$22,077, +12.62% from previous year)
- 2022: $222,950 (+$25,897, +13.14% from previous year)
- 2023: $231,661 (+$8,711, +3.91% from previous year)
- 2024: $250,274 (+$18,612, +8.03% from previous year)
- 2025: $259,219 (+$8,945, +3.57% from previous year)
Home values in Daniels have grown by nearly 59% since 2010, now reaching $259,219. Growth picked up significantly in 2021 and 2022, reflecting broader market trends during that period. Despite a few dips in the late 2010s, prices have steadily climbed in recent years, cementing Daniels as one of the more valuable real estate markets in the state.
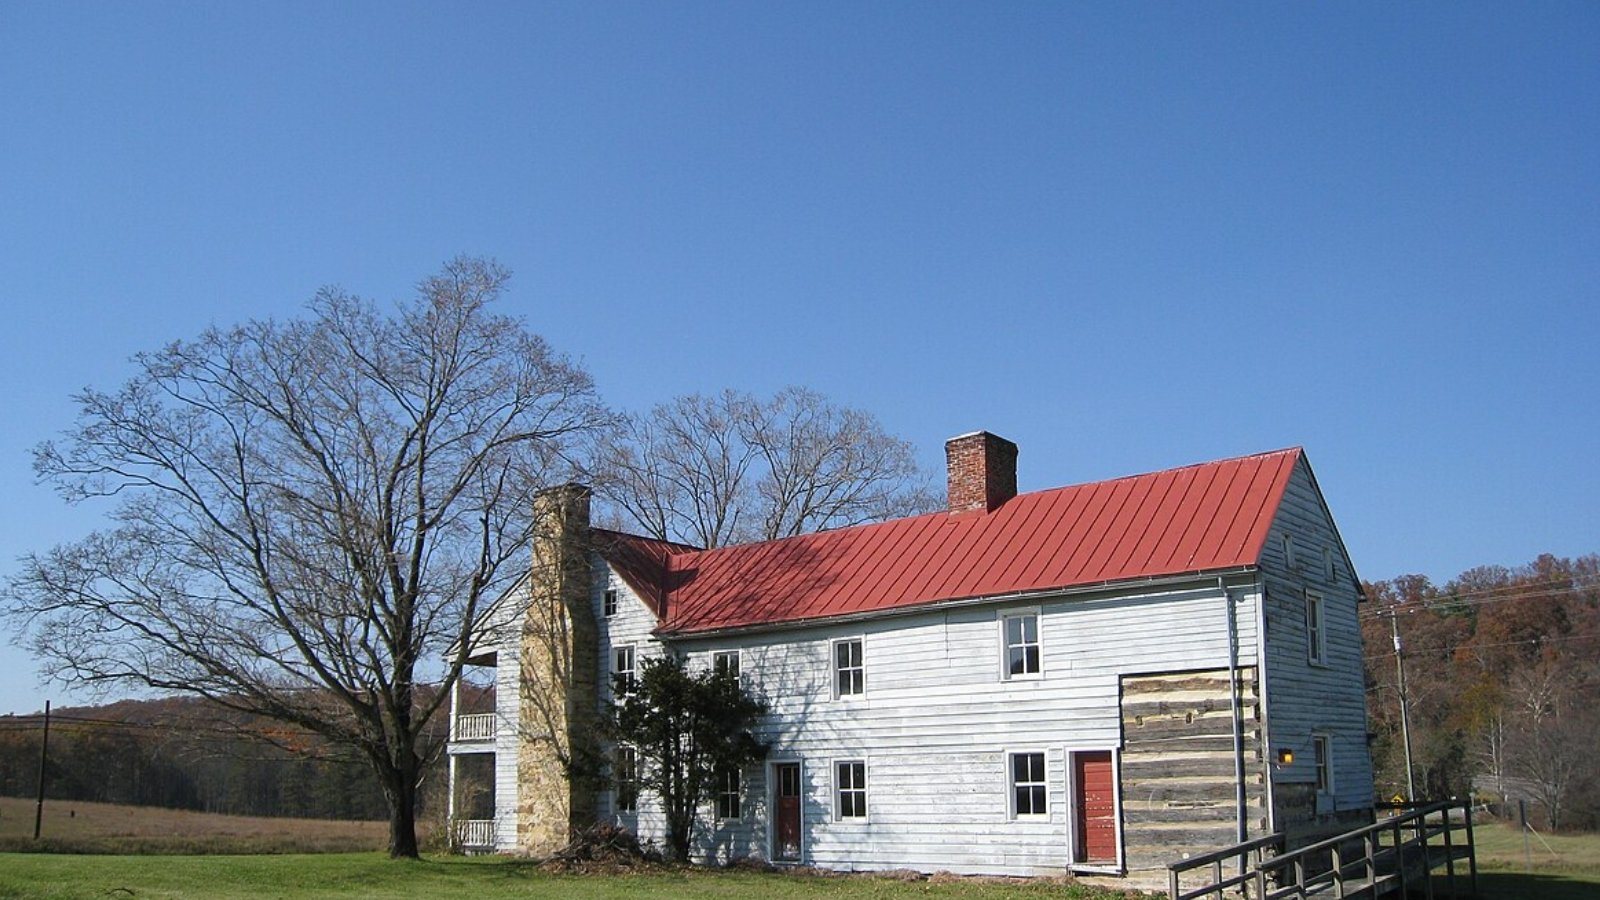
Daniels – Stable Pricing and Strong Mid-Range Market
Located in Raleigh County in southern West Virginia, Daniels is a peaceful residential area close to Beckley and home to a variety of golf resorts and mountain retreats. The town has long attracted retirees and second-home buyers, which may explain its resilient home value growth during national booms. The consistent price gains, especially after 2020, suggest a solid local demand.
With access to outdoor recreation like Little Beaver State Park and Winterplace Ski Resort, Daniels has gained attention for both its natural appeal and its relatively affordable housing by national standards. The recent uptick in home values aligns with interest from buyers seeking lifestyle-focused towns within commuting range of Beckley or Charleston.
32. Augusta – 100% Home Price Increase Since 2010
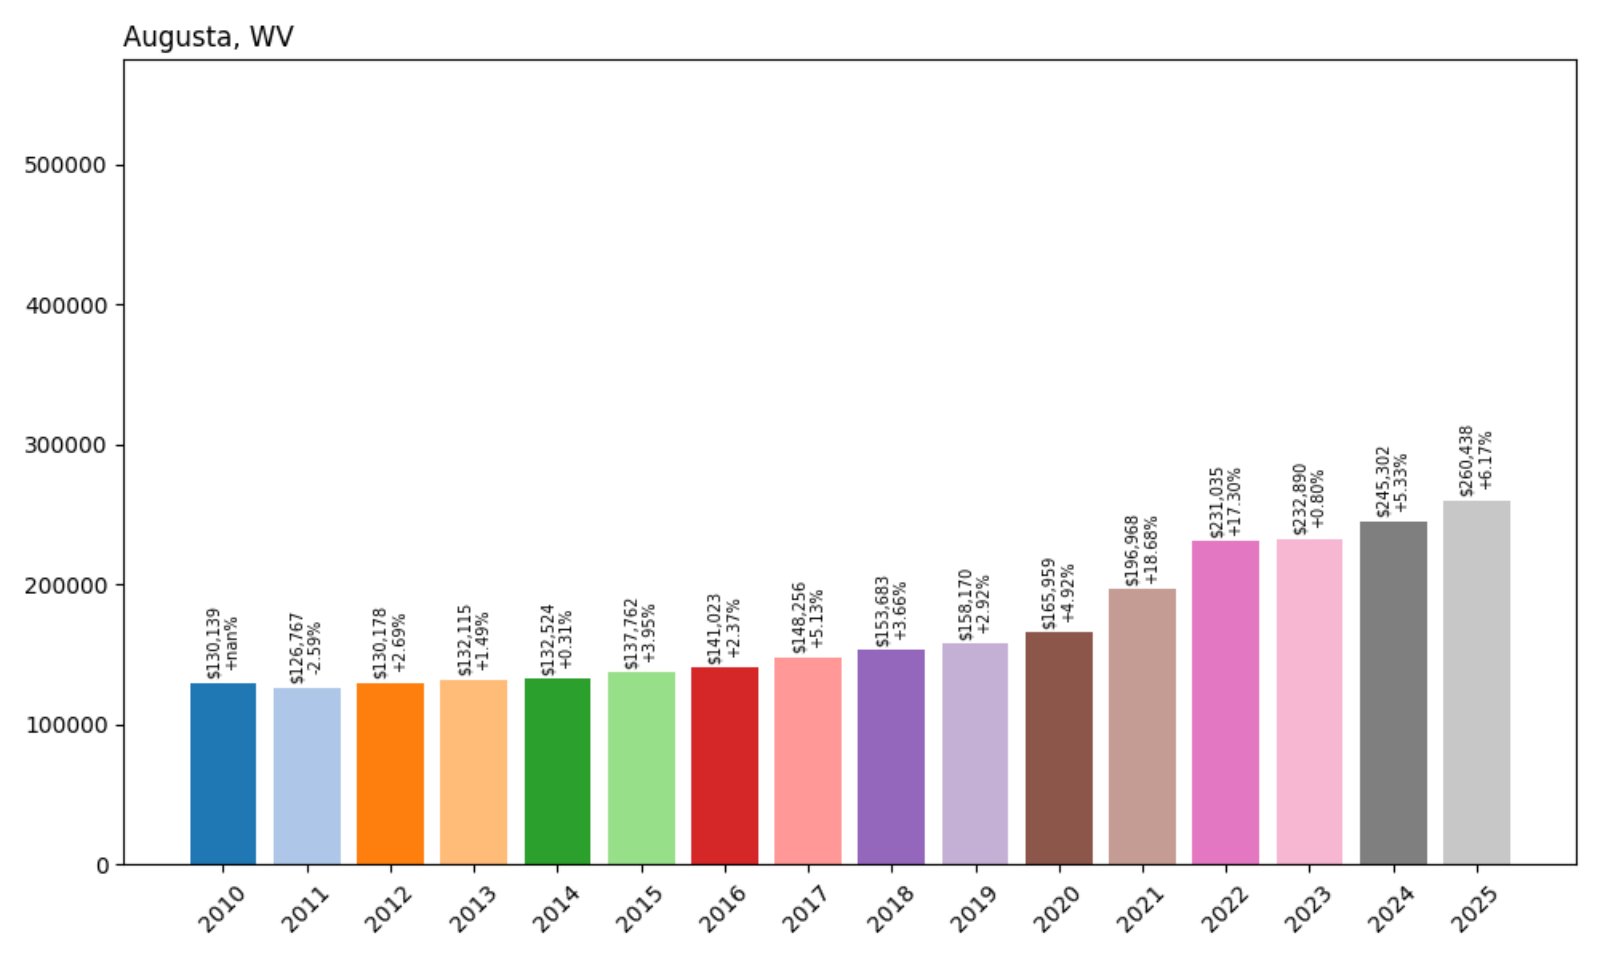
- 2010: $130,139
- 2011: $126,767 (−$3,372, −2.59% from previous year)
- 2012: $130,178 (+$3,410, +2.69% from previous year)
- 2013: $132,115 (+$1,937, +1.49% from previous year)
- 2014: $132,524 (+$409, +0.31% from previous year)
- 2015: $137,762 (+$5,239, +3.95% from previous year)
- 2016: $141,023 (+$3,260, +2.37% from previous year)
- 2017: $148,256 (+$7,234, +5.13% from previous year)
- 2018: $153,683 (+$5,426, +3.66% from previous year)
- 2019: $158,170 (+$4,488, +2.92% from previous year)
- 2020: $165,959 (+$7,789, +4.92% from previous year)
- 2021: $196,968 (+$31,009, +18.68% from previous year)
- 2022: $231,035 (+$34,067, +17.30% from previous year)
- 2023: $232,890 (+$1,855, +0.80% from previous year)
- 2024: $245,302 (+$12,412, +5.33% from previous year)
- 2025: $260,438 (+$15,136, +6.17% from previous year)
Augusta’s home values have doubled over the past 15 years, jumping from $130K to more than $260K. Much of that growth came after 2020, with sharp price spikes in 2021 and 2022. While the pace has eased slightly since then, gains have remained steady, adding to the town’s long-term appreciation story.
Augusta – Steady Appreciation in a Quiet Rural Setting
Augusta sits in Hampshire County, nestled in West Virginia’s Eastern Panhandle. With a small population and a rural character, the town has seen surprising growth in housing values since the pandemic years. Buyers looking for land, privacy, and scenic mountain views have helped push up home values.
The presence of commuter routes to northern Virginia and Maryland likely contributes to its demand. Augusta’s low base in 2010 gave it more room to grow, but the area’s attractiveness has clearly increased, especially for remote workers and retirees searching for balance between affordability and tranquility.
31. Hurricane – 51% Home Price Increase Since 2010
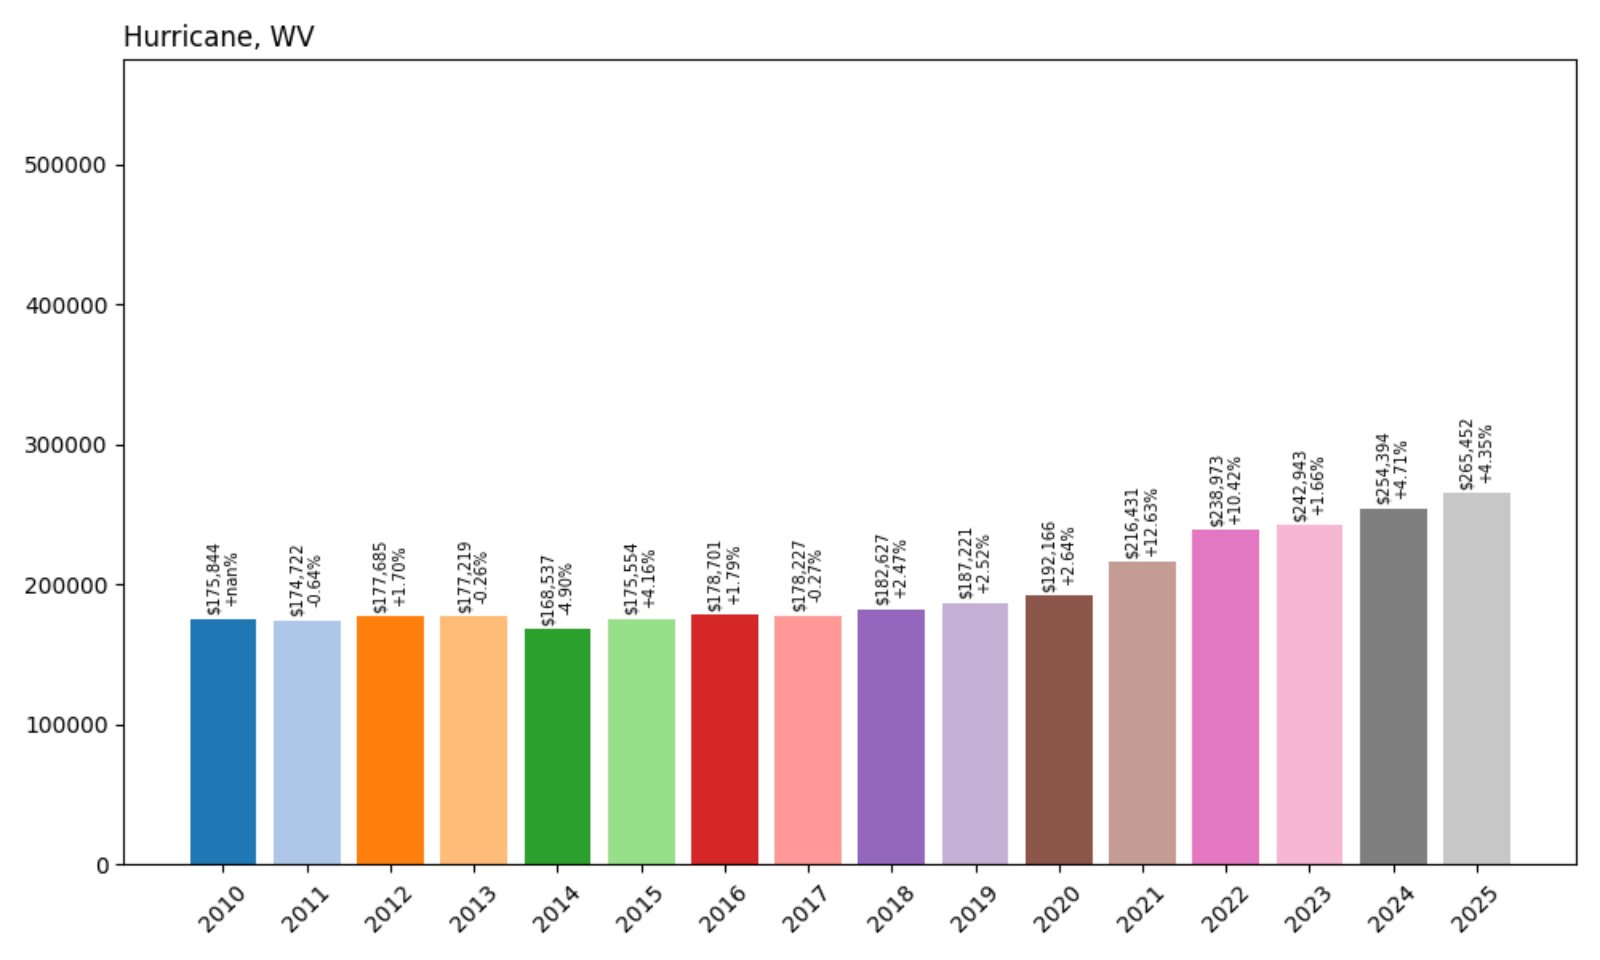
- 2010: $175,844
- 2011: $174,722 (−$1,121, −0.64% from previous year)
- 2012: $177,685 (+$2,963, +1.70% from previous year)
- 2013: $177,219 (−$466, −0.26% from previous year)
- 2014: $168,537 (−$8,682, −4.90% from previous year)
- 2015: $175,554 (+$7,017, +4.16% from previous year)
- 2016: $178,701 (+$3,147, +1.79% from previous year)
- 2017: $178,227 (−$474, −0.27% from previous year)
- 2018: $182,627 (+$4,400, +2.47% from previous year)
- 2019: $187,221 (+$4,594, +2.52% from previous year)
- 2020: $192,166 (+$4,945, +2.64% from previous year)
- 2021: $216,431 (+$24,265, +12.63% from previous year)
- 2022: $238,973 (+$22,542, +10.42% from previous year)
- 2023: $242,943 (+$3,970, +1.66% from previous year)
- 2024: $254,394 (+$11,451, +4.71% from previous year)
- 2025: $265,452 (+$11,058, +4.35% from previous year)
Hurricane’s housing market has experienced a 51% rise since 2010. The sharpest growth took place from 2020 through 2022, when values climbed over $45,000 in just two years. The trend has continued moderately, indicating ongoing stability in demand.
Hurricane – Regional Growth and Commuter Value
Located between Charleston and Huntington, Hurricane offers small-town charm with quick access to larger cities. Its position near I-64 makes it a desirable choice for commuters and families alike. This convenience likely helped fuel recent housing gains.
The town features quality public schools, a growing retail sector, and well-maintained parks. These amenities add to its appeal, particularly for households priced out of Charleston’s core neighborhoods. The data shows Hurricane is holding strong among West Virginia’s pricier housing markets.
30. Baker – 77.4% Home Price Increase Since 2015
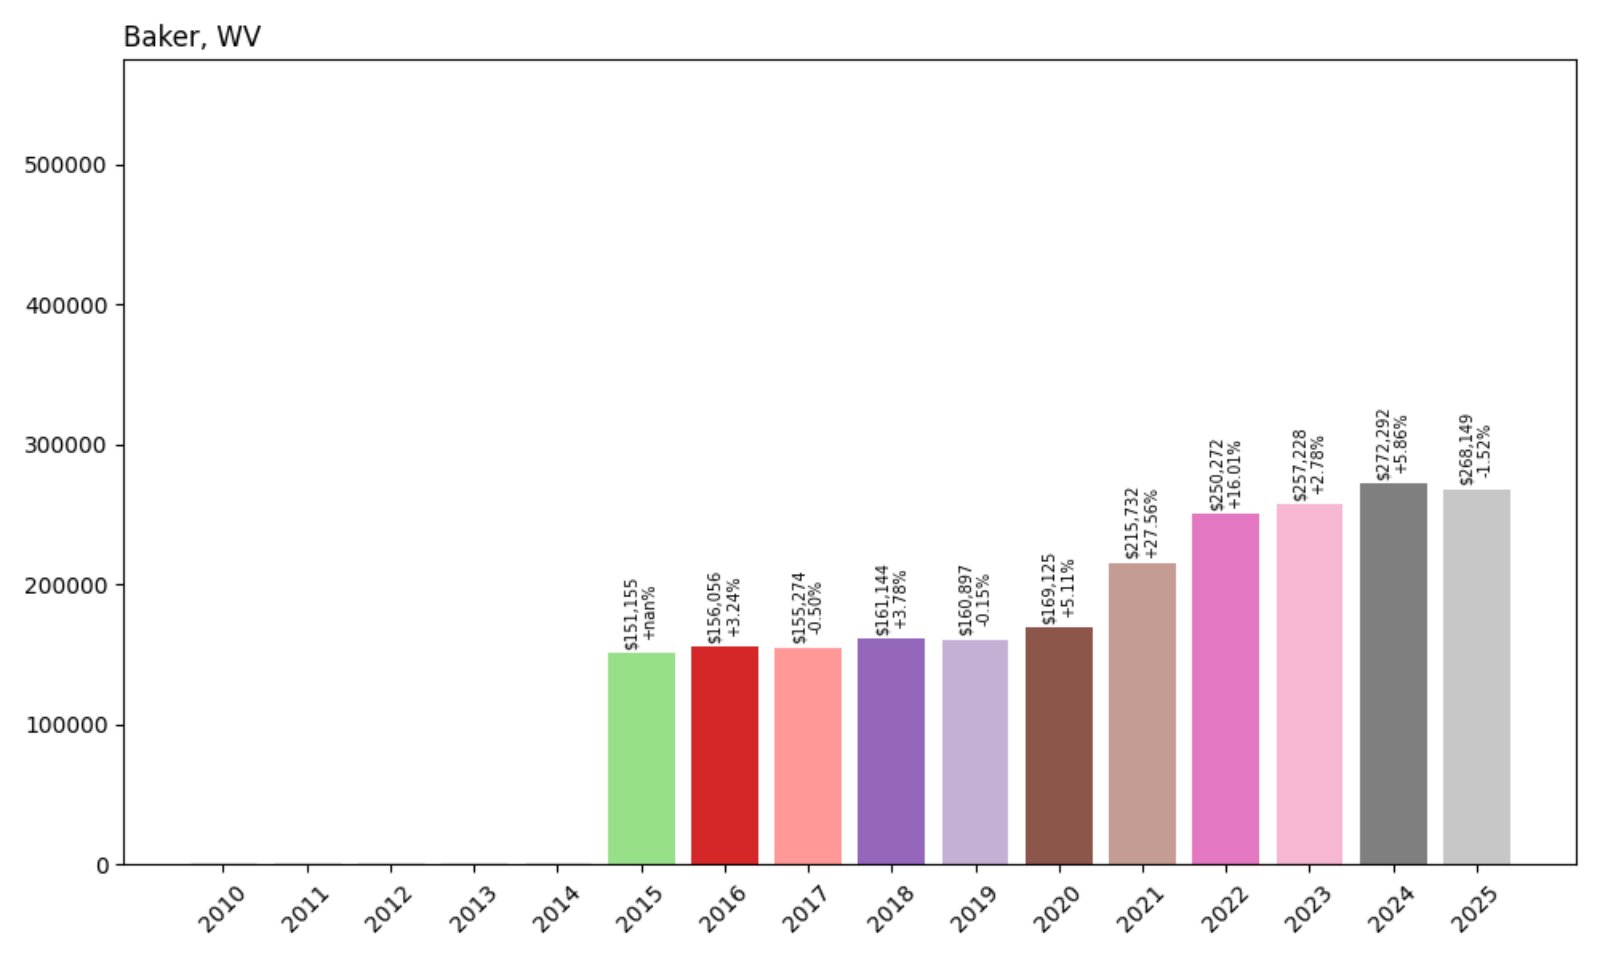
- 2015: $151,155
- 2016: $156,056 (+$4,901, +3.24% from previous year)
- 2017: $155,274 (−$782, −0.50% from previous year)
- 2018: $161,144 (+$5,870, +3.78% from previous year)
- 2019: $160,897 (−$247, −0.15% from previous year)
- 2020: $169,125 (+$8,228, +5.11% from previous year)
- 2021: $215,732 (+$46,607, +27.56% from previous year)
- 2022: $250,272 (+$34,540, +16.01% from previous year)
- 2023: $257,228 (+$6,956, +2.78% from previous year)
- 2024: $272,292 (+$15,064, +5.86% from previous year)
- 2025: $268,149 (−$4,143, −1.52% from previous year)
From $151K in 2015 to $268K in 2025, Baker’s housing market has seen significant appreciation. The steepest climb came in 2021, but gains continued through 2024 before dipping slightly this year. Despite the recent decline, the town remains one of the most expensive markets in the state’s Eastern Panhandle.
Baker – Big Swings Reflect Demand for Rural Luxury
Baker is a small town in Hardy County known for its scenic mountain setting and proximity to George Washington National Forest. Though remote, it has drawn attention for vacation cabins and second homes, especially in the wake of COVID-era relocations. Buyers seeking privacy and land helped prices soar in 2021.
The minor pullback in 2025 could signal a market correction, but overall growth remains impressive. Baker’s trajectory reflects the impact of shifting housing preferences toward rural spaces with outdoor access and seclusion.
29. Morgantown – 45.4% Home Price Increase Since 2010
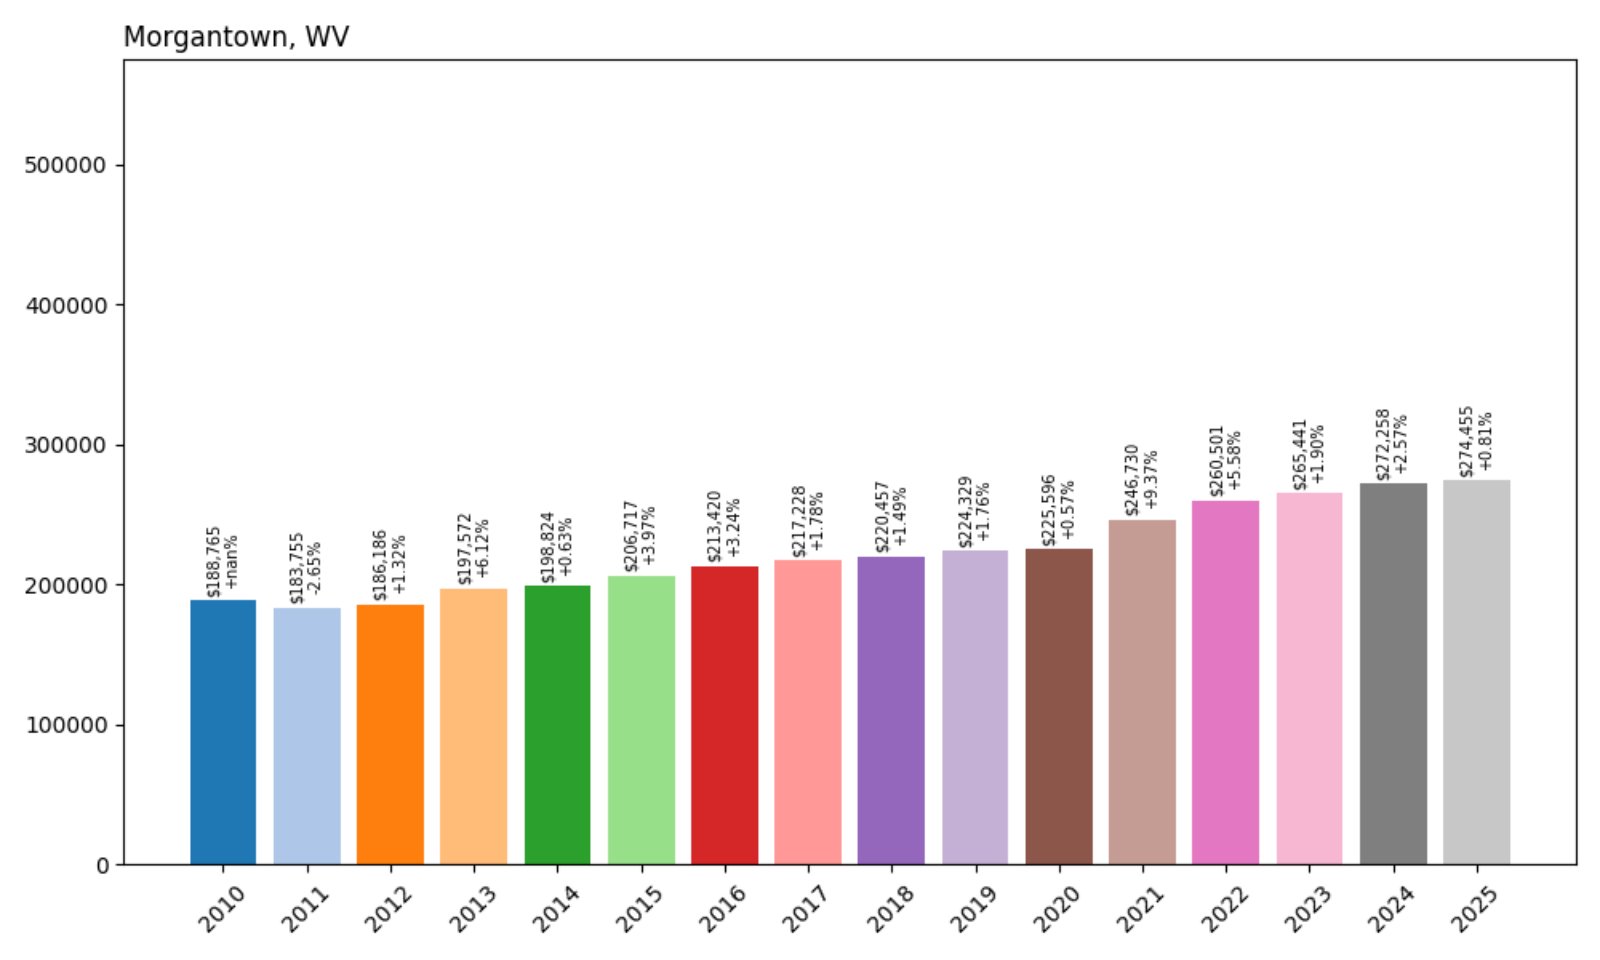
- 2010: $188,765
- 2011: $183,755 (−$5,011, −2.65% from previous year)
- 2012: $186,186 (+$2,431, +1.32% from previous year)
- 2013: $197,572 (+$11,386, +6.12% from previous year)
- 2014: $198,824 (+$1,252, +0.63% from previous year)
- 2015: $206,717 (+$7,893, +3.97% from previous year)
- 2016: $213,420 (+$6,702, +3.24% from previous year)
- 2017: $217,228 (+$3,809, +1.78% from previous year)
- 2018: $220,457 (+$3,229, +1.49% from previous year)
- 2019: $224,329 (+$3,871, +1.76% from previous year)
- 2020: $225,596 (+$1,267, +0.57% from previous year)
- 2021: $246,730 (+$21,134, +9.37% from previous year)
- 2022: $260,501 (+$13,770, +5.58% from previous year)
- 2023: $265,441 (+$4,940, +1.90% from previous year)
- 2024: $272,258 (+$6,817, +2.57% from previous year)
- 2025: $274,455 (+$2,197, +0.81% from previous year)
Morgantown’s home values have grown nearly 45% since 2010, fueled by steady year-over-year increases. While price acceleration peaked in 2021, growth has continued more modestly, reflecting a strong but stabilizing market in one of the state’s most well-known towns.
Morgantown – Consistent Growth in a College Town
Home to West Virginia University, Morgantown is a major economic and cultural hub. Its robust rental market, driven by student demand, anchors property values, while the city’s hospitals, tech sector, and recreation opportunities draw year-round residents. This stability has kept the local real estate market resilient even during national slowdowns.
The moderate but ongoing gains in recent years suggest Morgantown remains one of the most reliably strong markets in the state, especially for those looking to buy in an area with predictable demand and low vacancy risk.
28. Points – 97.8% Home Price Increase Since 2010
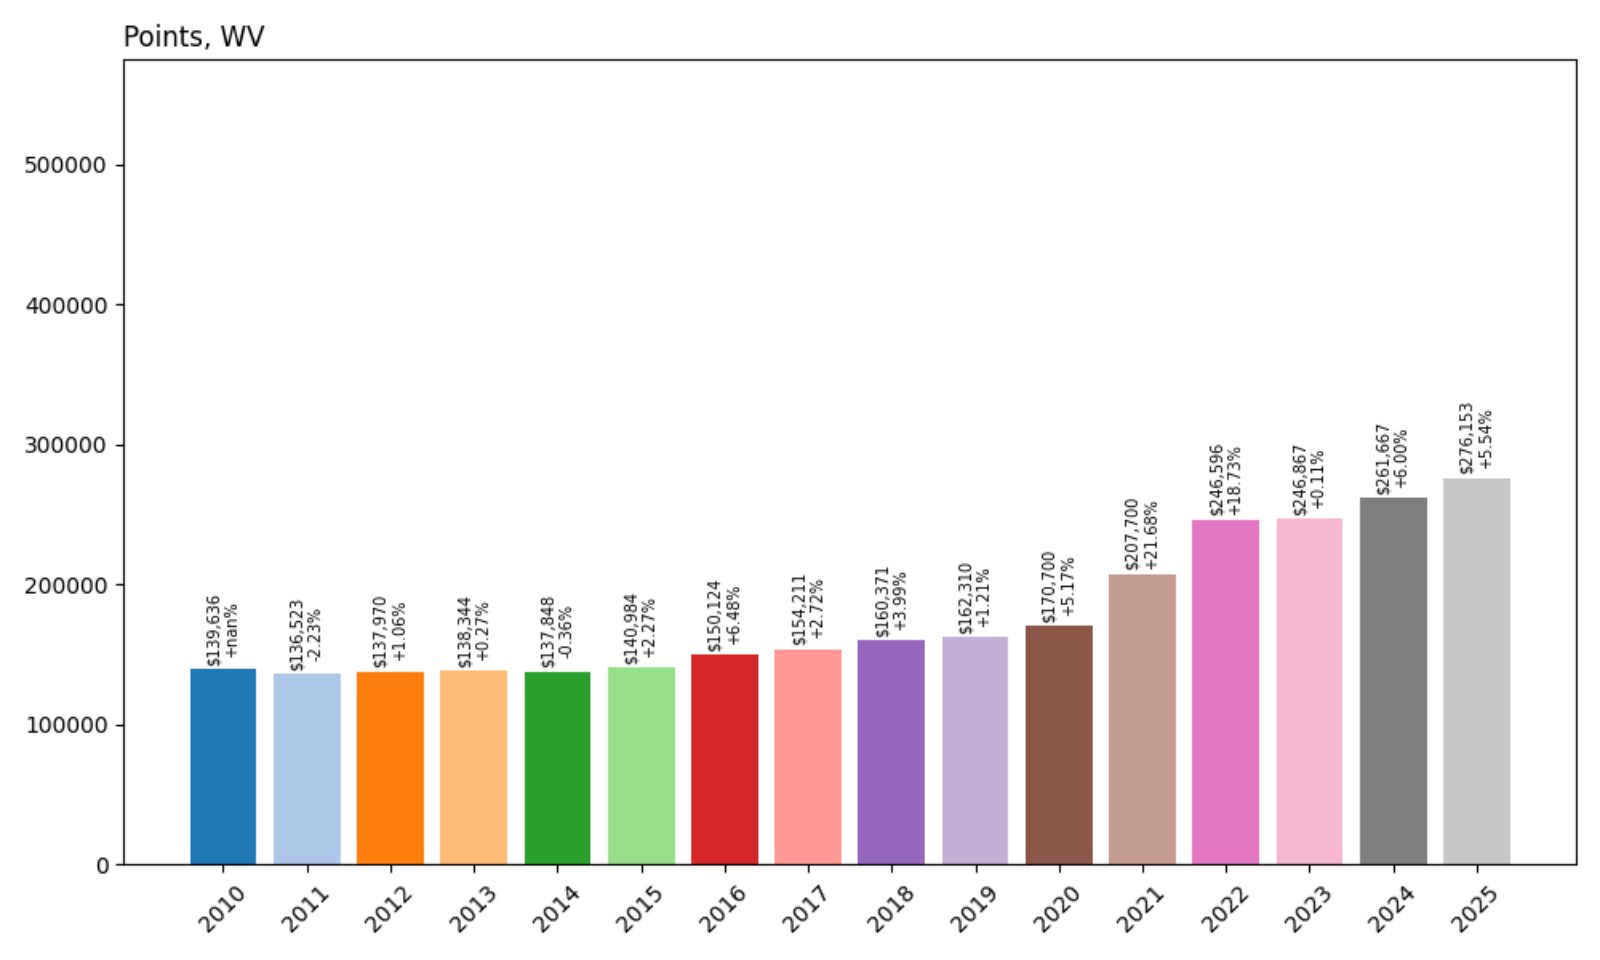
- 2010: $139,636
- 2011: $136,523 (−$3,113, −2.23% from previous year)
- 2012: $137,970 (+$1,447, +1.06% from previous year)
- 2013: $138,344 (+$375, +0.27% from previous year)
- 2014: $137,848 (−$496, −0.36% from previous year)
- 2015: $140,984 (+$3,135, +2.27% from previous year)
- 2016: $150,124 (+$9,141, +6.48% from previous year)
- 2017: $154,211 (+$4,086, +2.72% from previous year)
- 2018: $160,371 (+$6,160, +3.99% from previous year)
- 2019: $162,310 (+$1,940, +1.21% from previous year)
- 2020: $170,700 (+$8,390, +5.17% from previous year)
- 2021: $207,700 (+$37,000, +21.68% from previous year)
- 2022: $246,596 (+$38,896, +18.73% from previous year)
- 2023: $246,867 (+$271, +0.11% from previous year)
- 2024: $261,667 (+$14,801, +6.00% from previous year)
- 2025: $276,153 (+$14,486, +5.54% from previous year)
Points has seen a near doubling of home values since 2010, with a standout leap occurring from 2020 to 2022. That surge has slowed, but prices remain strong and have continued to rise steadily, reaching $276,153 this year.
Points – Price Spike Driven by Pandemic-Era Demand
Points, a small unincorporated community in Hampshire County, offers a rural setting with a reasonable drive to Winchester, VA and the DC metro. The huge jump in 2021 and 2022 reflects broader trends where buyers sought refuge in rural America with larger lots and more privacy.
The affordability and remote setting likely attracted telecommuters, especially when compared to neighboring states. That demand has kept home values rising post-2022, albeit at a more measured pace. Points is now firmly in the top third of West Virginia’s most expensive markets.
27. High View – 85.1% Home Price Increase Since 2010
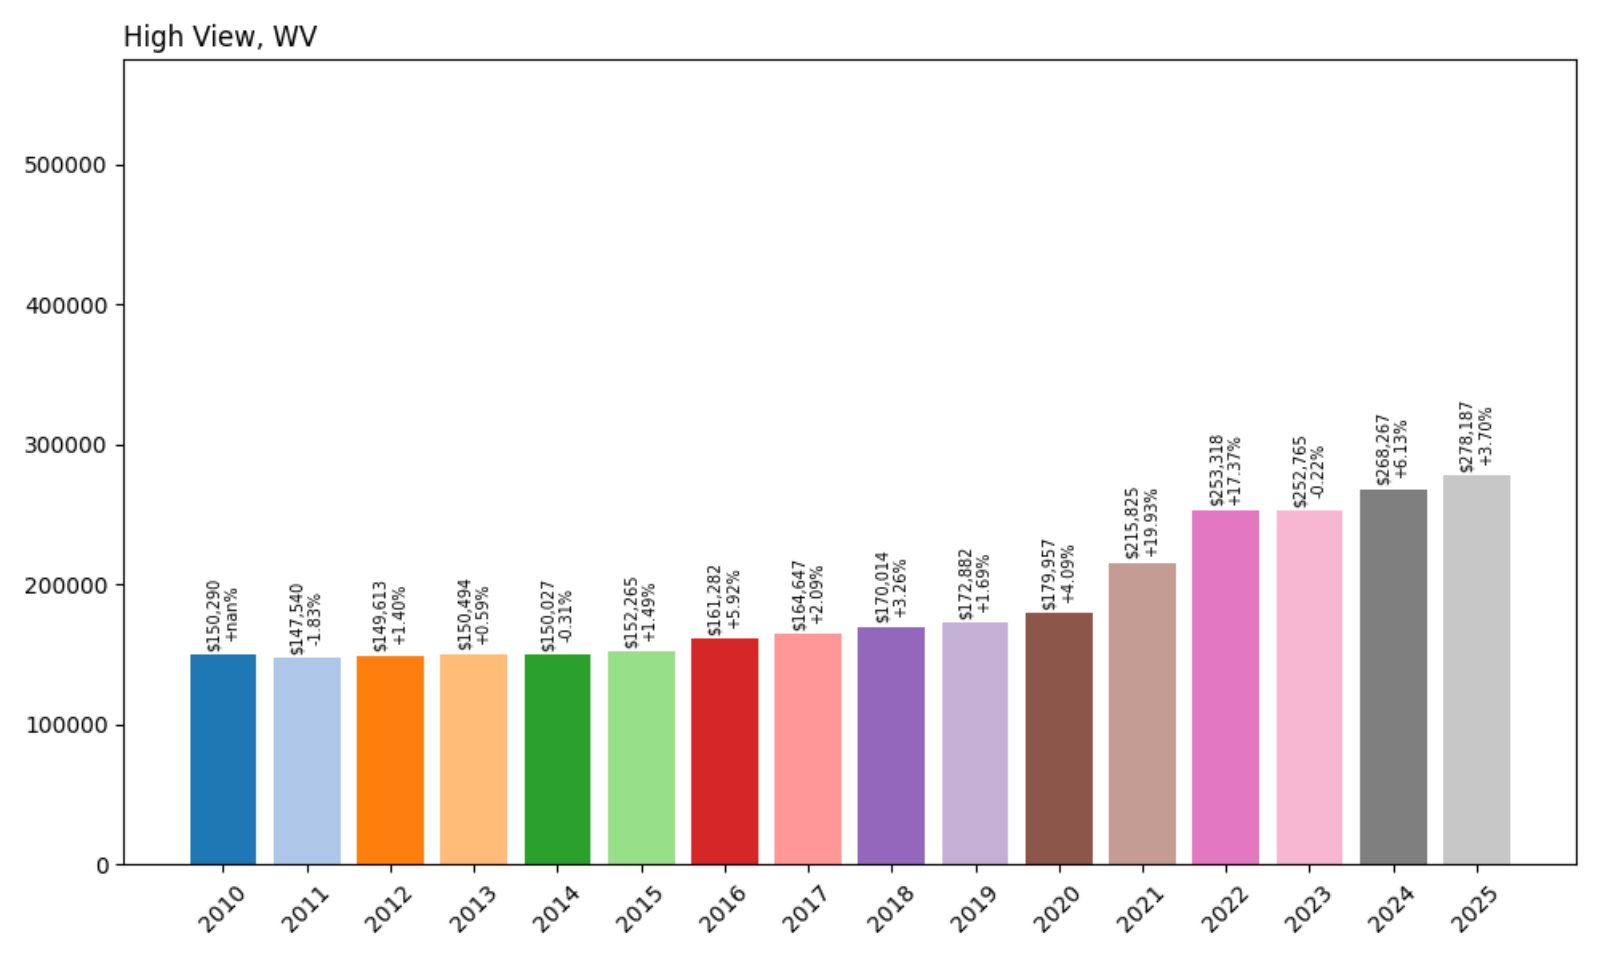
- 2010: $150,290
- 2011: $147,540 (−$2,750, −1.83% from previous year)
- 2012: $149,613 (+$2,073, +1.40% from previous year)
- 2013: $150,494 (+$882, +0.59% from previous year)
- 2014: $150,027 (−$467, −0.31% from previous year)
- 2015: $152,265 (+$2,237, +1.49% from previous year)
- 2016: $161,282 (+$9,017, +5.92% from previous year)
- 2017: $164,647 (+$3,365, +2.09% from previous year)
- 2018: $170,014 (+$5,367, +3.26% from previous year)
- 2019: $172,882 (+$2,869, +1.69% from previous year)
- 2020: $179,957 (+$7,075, +4.09% from previous year)
- 2021: $215,825 (+$35,868, +19.93% from previous year)
- 2022: $253,318 (+$37,492, +17.37% from previous year)
- 2023: $252,765 (−$553, −0.22% from previous year)
- 2024: $268,267 (+$15,503, +6.13% from previous year)
- 2025: $278,187 (+$9,920, +3.70% from previous year)
High View’s home values have grown from $150K in 2010 to just over $278K in 2025, with explosive growth after 2020. Though it experienced a minor dip in 2023, prices quickly resumed their upward trend.
High View – Remote Appeal With Surging Post-2020 Growth
Sitting at the edge of Hampshire County near the Virginia border, High View is quiet and remote but increasingly attractive to buyers seeking solitude. Its proximity to both forests and major highways has helped boost desirability over the last few years.
The huge gains in 2021 and 2022 reflect broader market forces as urban residents sought rural homes. This boost has pushed High View near the top quartile of expensive towns statewide, despite a population that remains tiny.
26. Lost City – 76% Home Price Increase Since 2010
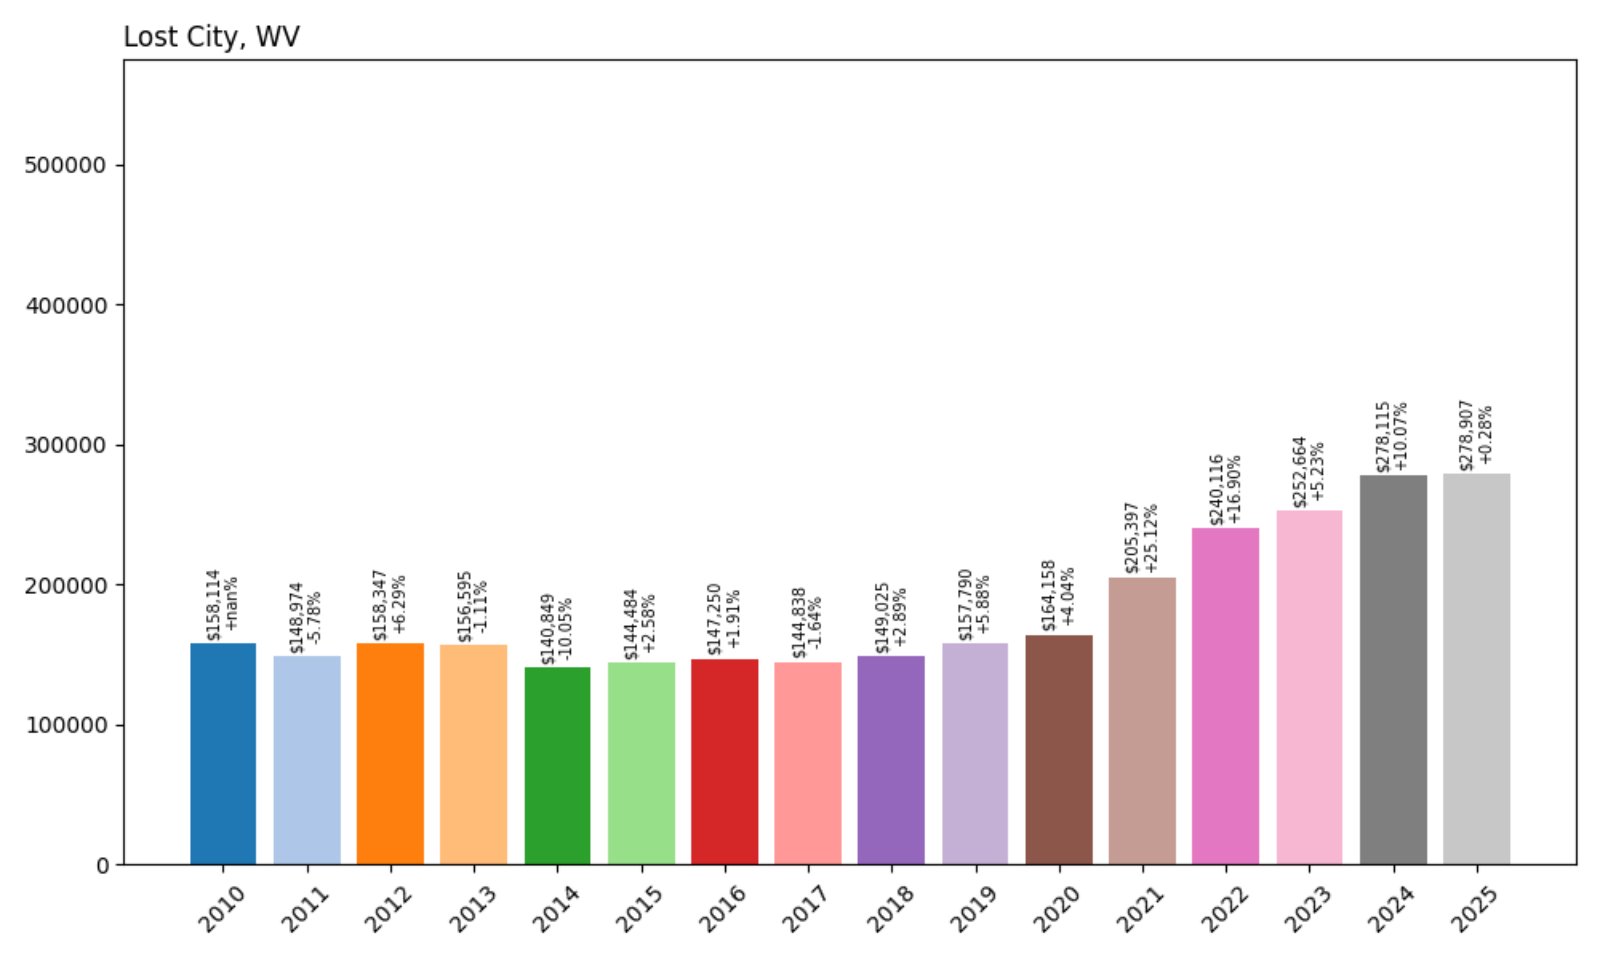
- 2010: $158,114
- 2011: $148,974 (−$9,140, −5.78% from previous year)
- 2012: $158,347 (+$9,372, +6.29% from previous year)
- 2013: $156,595 (−$1,752, −1.11% from previous year)
- 2014: $140,849 (−$15,746, −10.05% from previous year)
- 2015: $144,484 (+$3,634, +2.58% from previous year)
- 2016: $147,250 (+$2,767, +1.91% from previous year)
- 2017: $144,838 (−$2,413, −1.64% from previous year)
- 2018: $149,025 (+$4,187, +2.89% from previous year)
- 2019: $157,790 (+$8,766, +5.88% from previous year)
- 2020: $164,158 (+$6,368, +4.04% from previous year)
- 2021: $205,397 (+$41,239, +25.12% from previous year)
- 2022: $240,116 (+$34,719, +16.90% from previous year)
- 2023: $252,664 (+$12,548, +5.23% from previous year)
- 2024: $278,115 (+$25,451, +10.07% from previous year)
- 2025: $278,907 (+$792, +0.28% from previous year)
Lost City’s home values have grown steadily over time, even after bouncing back from losses in the early 2010s. The town saw extraordinary growth between 2020 and 2024, gaining more than $100,000 in value in that span alone.
Lost City – Outdoor Amenities and Price Surges
Located in Hardy County, Lost City is a remote and forested community with access to Trout Pond and hiking trails in George Washington National Forest. Buyers interested in recreation and mountain escapes helped fuel a housing boom in the past five years.
The leveling off in 2025 may reflect market saturation, but prices remain much higher than their pre-pandemic levels. Its relative seclusion and strong growth make Lost City a noteworthy market for land-rich real estate.
25. Ghent – 81.5% Home Price Increase Since 2010

- 2010: $156,485
- 2011: $145,151 (−$11,334, −7.24% from previous year)
- 2012: $150,114 (+$4,963, +3.42% from previous year)
- 2013: $151,305 (+$1,191, +0.79% from previous year)
- 2014: $152,640 (+$1,335, +0.88% from previous year)
- 2015: $160,893 (+$8,254, +5.41% from previous year)
- 2016: $172,025 (+$11,132, +6.92% from previous year)
- 2017: $168,995 (−$3,030, −1.76% from previous year)
- 2018: $169,575 (+$580, +0.34% from previous year)
- 2019: $170,979 (+$1,404, +0.83% from previous year)
- 2020: $177,418 (+$6,439, +3.77% from previous year)
- 2021: $206,498 (+$29,080, +16.39% from previous year)
- 2022: $237,380 (+$30,883, +14.96% from previous year)
- 2023: $249,988 (+$12,607, +5.31% from previous year)
- 2024: $274,910 (+$24,922, +9.97% from previous year)
- 2025: $284,009 (+$9,100, +3.31% from previous year)
Ghent’s home values rose from $156K in 2010 to over $284K in 2025. Most of that increase has occurred since 2020, with double-digit yearly gains during the pandemic housing boom.
Ghent – Year-Round Recreation Drives Demand
Ghent, located in Raleigh County, is well-known for being home to Winterplace Ski Resort. The town’s appeal as a winter destination and weekend getaway has grown, boosting demand for cabins and vacation rentals.
With tourism, skiing, and mountain lodging fueling the housing market, Ghent’s prices have climbed quickly. Its combination of seasonal tourism and full-time residential appeal have made it one of the fastest-rising towns in southern West Virginia.
24. Scott Depot – 61.6% Home Price Increase Since 2010
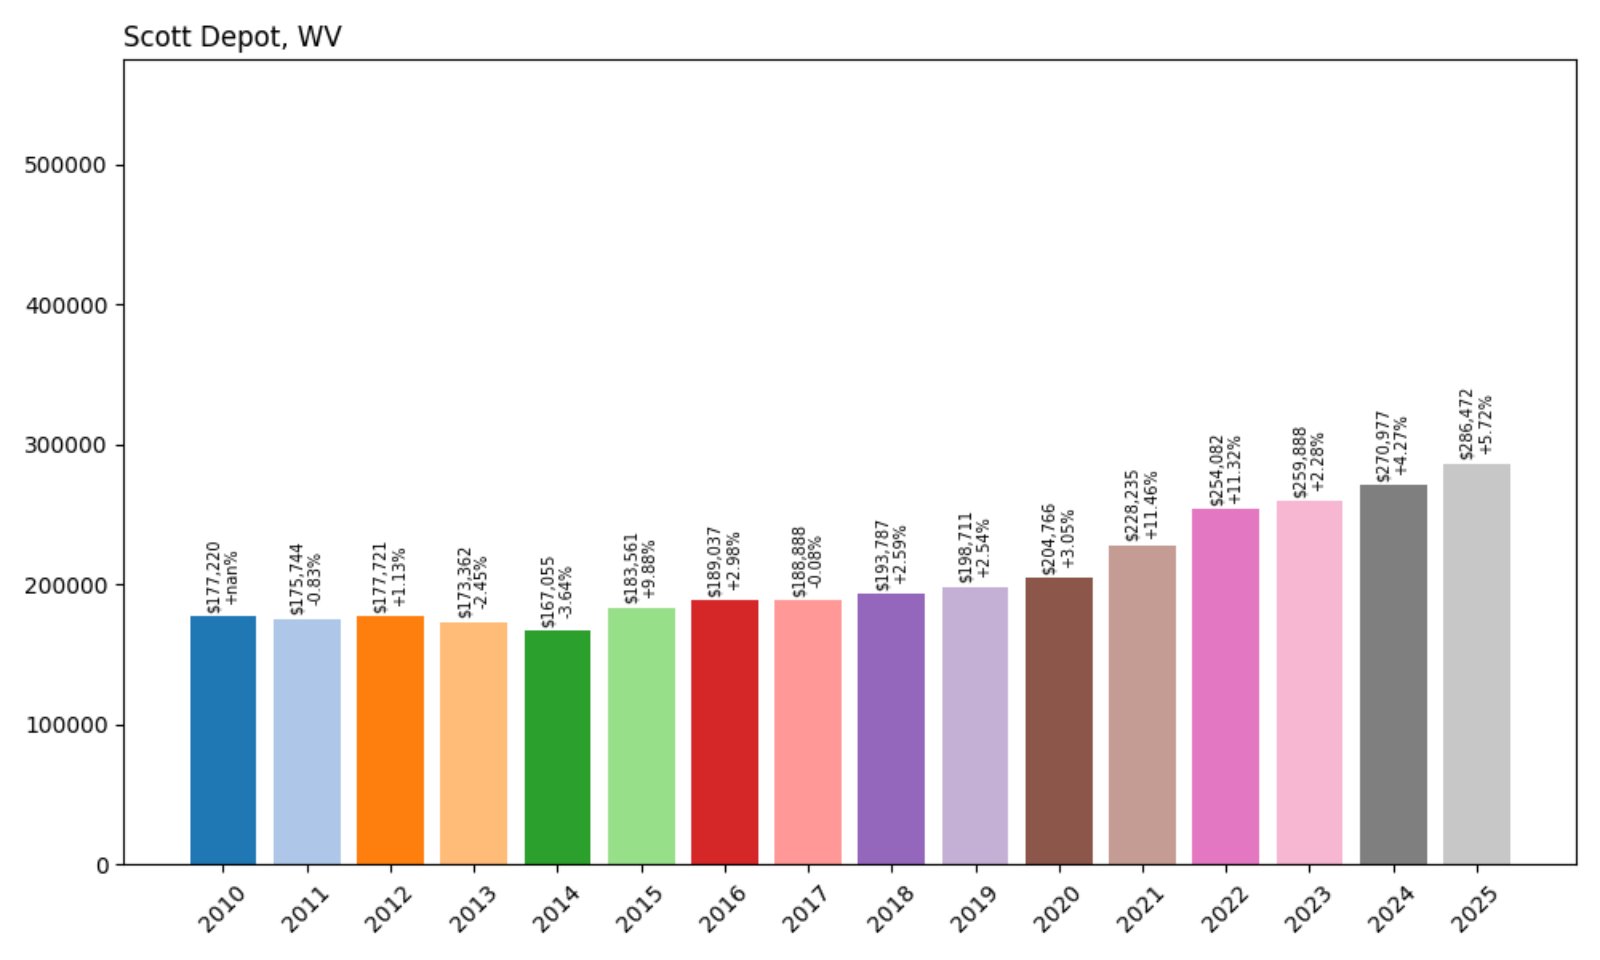
- 2010: $177,220
- 2011: $175,744 (−$1,477, −0.83% from previous year)
- 2012: $177,721 (+$1,978, +1.13% from previous year)
- 2013: $173,362 (−$4,359, −2.45% from previous year)
- 2014: $167,055 (−$6,308, −3.64% from previous year)
- 2015: $183,561 (+$16,507, +9.88% from previous year)
- 2016: $189,037 (+$5,476, +2.98% from previous year)
- 2017: $188,888 (−$149, −0.08% from previous year)
- 2018: $193,787 (+$4,899, +2.59% from previous year)
- 2019: $198,711 (+$4,924, +2.54% from previous year)
- 2020: $204,766 (+$6,055, +3.05% from previous year)
- 2021: $228,235 (+$23,470, +11.46% from previous year)
- 2022: $254,082 (+$25,847, +11.32% from previous year)
- 2023: $259,888 (+$5,806, +2.28% from previous year)
- 2024: $270,977 (+$11,089, +4.27% from previous year)
- 2025: $286,472 (+$15,495, +5.72% from previous year)
Home prices in Scott Depot have climbed by over 60% since 2010, reaching $286,472 in 2025. The most notable acceleration came between 2020 and 2022, and values have continued to grow in the years since, albeit more gradually.
Scott Depot – Suburban Growth Along the I-64 Corridor
Located in Putnam County between Charleston and Huntington, Scott Depot is a convenient suburb that appeals to commuters, families, and professionals alike. The area’s access to major highways and good schools has made it a reliable choice for buyers.
The town’s growth reflects a larger trend of suburban expansion, with increased demand for single-family homes in well-located, mid-sized markets. With consistent appreciation and strong recent performance, Scott Depot remains one of the more expensive towns in the state.
23. Ranson – 129.1% Home Price Increase Since 2010
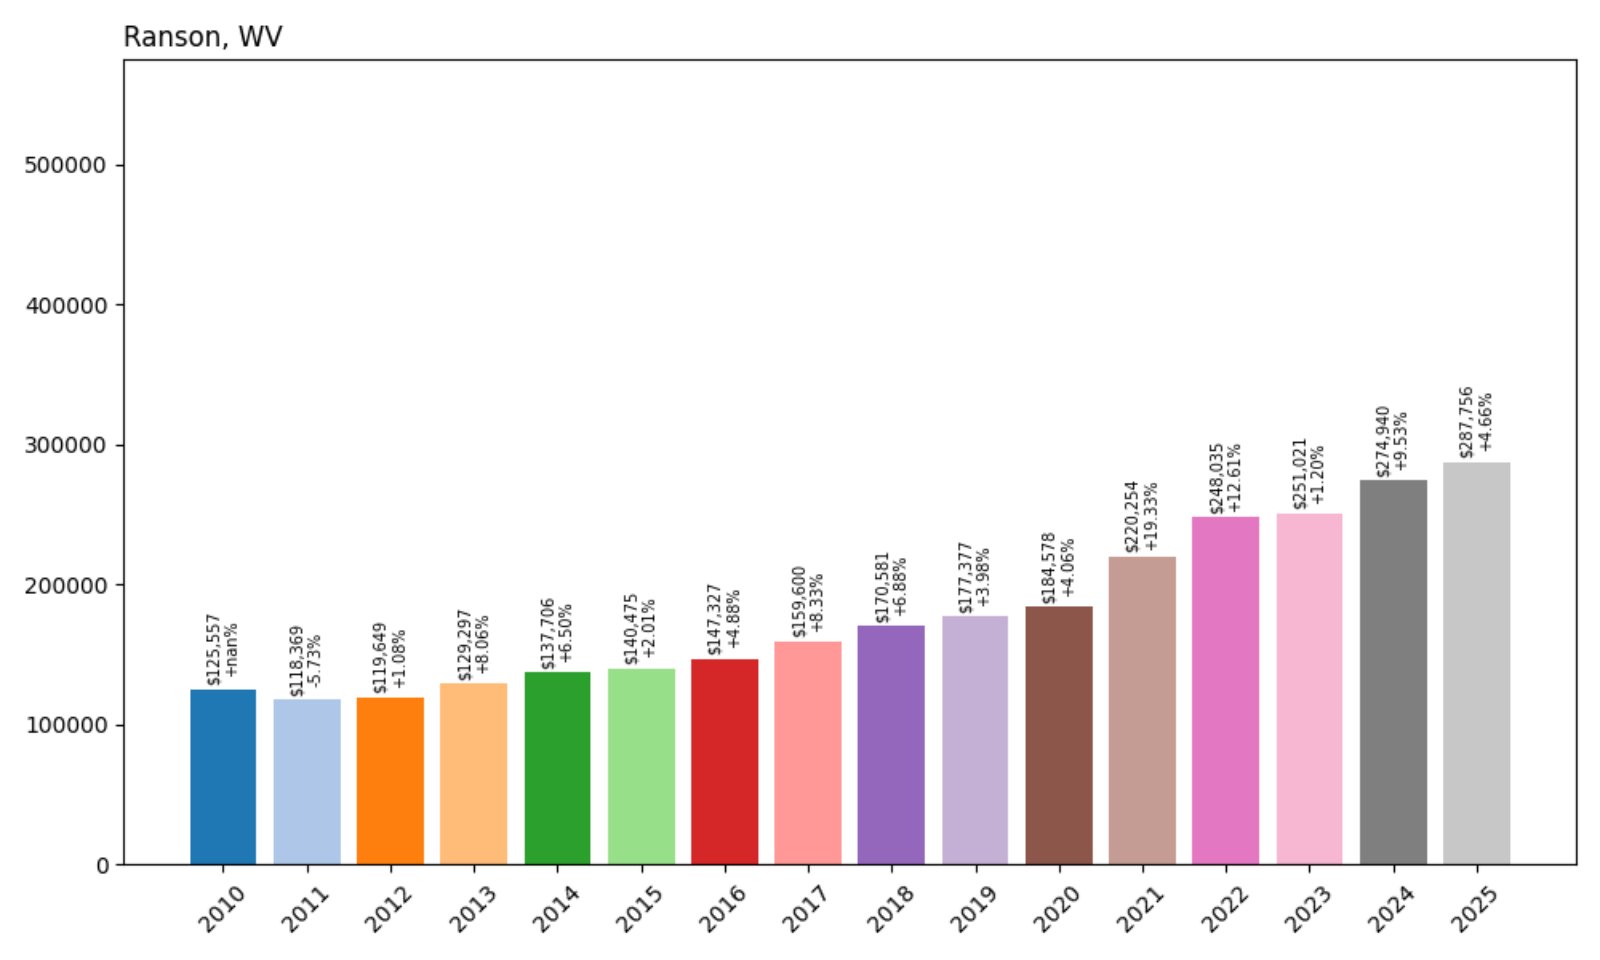
- 2010: $125,557
- 2011: $118,369 (−$7,188, −5.73% from previous year)
- 2012: $119,649 (+$1,280, +1.08% from previous year)
- 2013: $129,297 (+$9,648, +8.06% from previous year)
- 2014: $137,706 (+$8,409, +6.50% from previous year)
- 2015: $140,475 (+$2,769, +2.01% from previous year)
- 2016: $147,327 (+$6,853, +4.88% from previous year)
- 2017: $159,600 (+$12,273, +8.33% from previous year)
- 2018: $170,581 (+$10,981, +6.88% from previous year)
- 2019: $177,377 (+$6,796, +3.98% from previous year)
- 2020: $184,578 (+$7,201, +4.06% from previous year)
- 2021: $220,254 (+$35,676, +19.33% from previous year)
- 2022: $248,035 (+$27,781, +12.61% from previous year)
- 2023: $251,021 (+$2,986, +1.20% from previous year)
- 2024: $274,940 (+$23,919, +9.53% from previous year)
- 2025: $287,756 (+$12,816, +4.66% from previous year)
Ranson’s home values have more than doubled since 2010, with sharp increases particularly after 2020. The town’s proximity to the Washington, D.C. metro area likely contributes to this sustained demand.
Ranson – Eastern Panhandle Growth Continues
Ranson sits just west of Charles Town in Jefferson County and benefits from the same proximity to Northern Virginia and D.C. This area has seen population growth as more people relocate in search of lower-cost housing while staying connected to urban job centers.
The explosive growth during 2021–2022 tracks closely with regional housing trends and the increasing appeal of the Eastern Panhandle. Despite smaller size and less name recognition, Ranson’s market is now among the top 25 most expensive in the state.
22. Bloomery – 77.6% Home Price Increase Since 2010
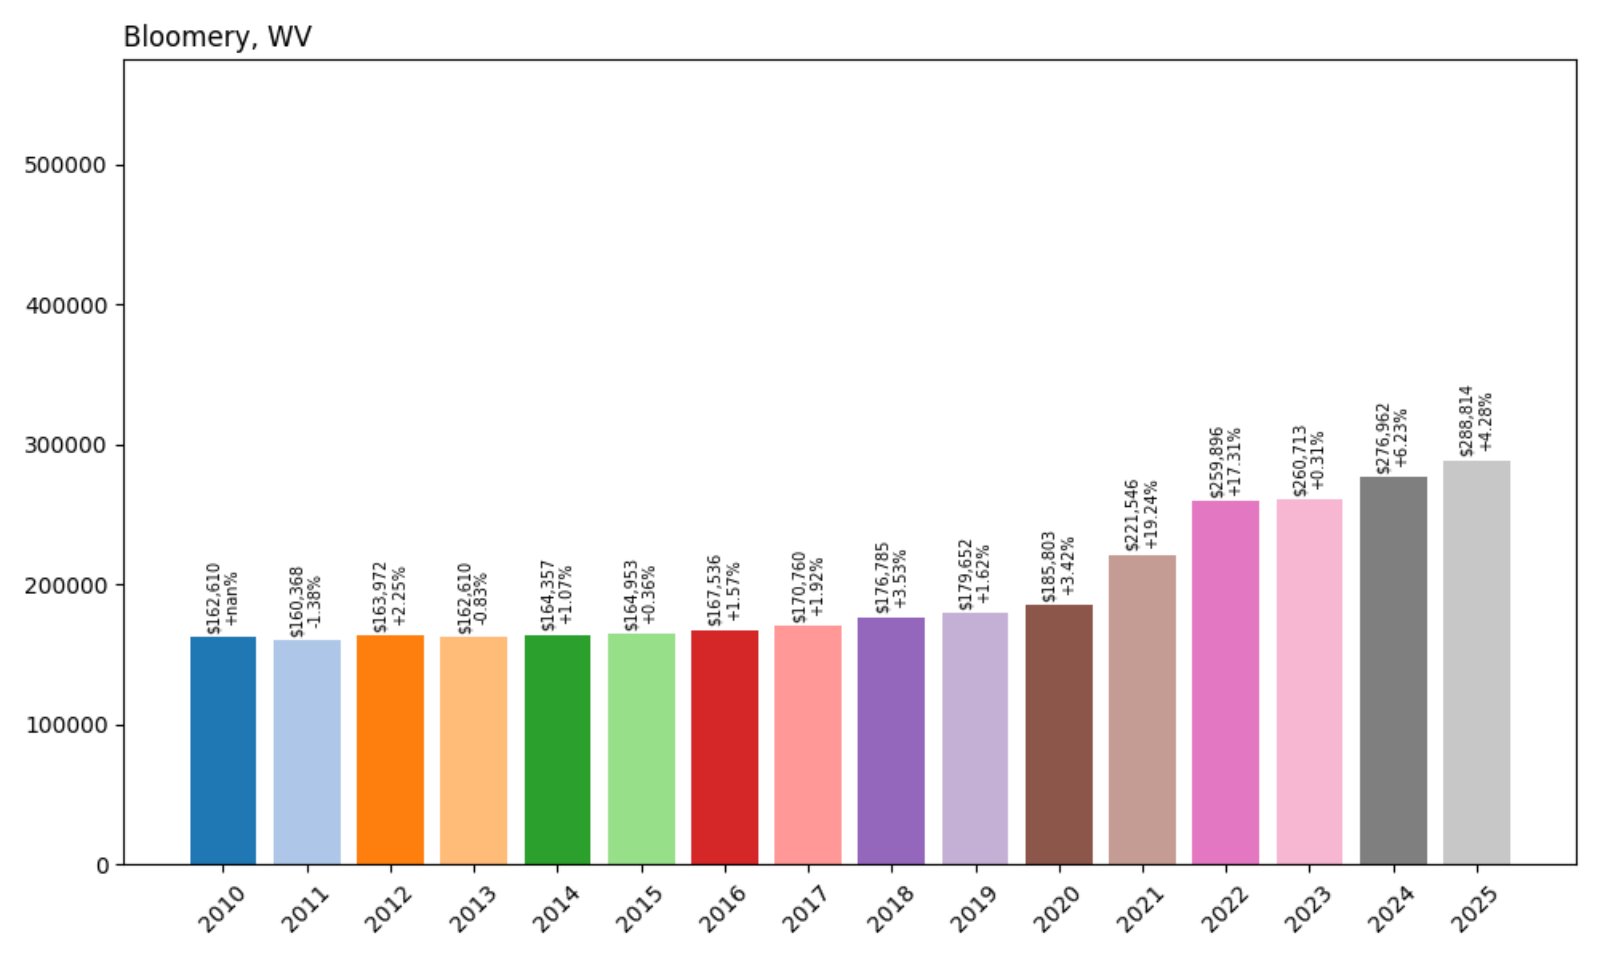
- 2010: $162,610
- 2011: $160,368 (−$2,242, −1.38% from previous year)
- 2012: $163,972 (+$3,604, +2.25% from previous year)
- 2013: $162,610 (−$1,363, −0.83% from previous year)
- 2014: $164,357 (+$1,747, +1.07% from previous year)
- 2015: $164,953 (+$596, +0.36% from previous year)
- 2016: $167,536 (+$2,583, +1.57% from previous year)
- 2017: $170,760 (+$3,224, +1.92% from previous year)
- 2018: $176,785 (+$6,025, +3.53% from previous year)
- 2019: $179,652 (+$2,867, +1.62% from previous year)
- 2020: $185,803 (+$6,152, +3.42% from previous year)
- 2021: $221,546 (+$35,743, +19.24% from previous year)
- 2022: $259,896 (+$38,350, +17.31% from previous year)
- 2023: $260,713 (+$816, +0.31% from previous year)
- 2024: $276,962 (+$16,249, +6.23% from previous year)
- 2025: $288,814 (+$11,852, +4.28% from previous year)
Bloomery’s growth was modest until the 2020s, when values jumped by nearly $100,000 in just two years. Prices have continued upward since then, helping it secure a spot among the state’s more expensive housing markets.
Bloomery – From Sleepy to Surging
Bloomery is a quiet spot in Hampshire County near the Shenandoah Valley. Like many other rural towns, it benefited from post-2020 buyer interest in remote, spacious areas. The sharp increases in 2021 and 2022 were especially dramatic.
The market has cooled slightly since, but steady gains suggest ongoing demand. With relatively low population density and scenic landscapes, Bloomery continues to appeal to those looking for peaceful, semi-rural living with modern value appreciation.
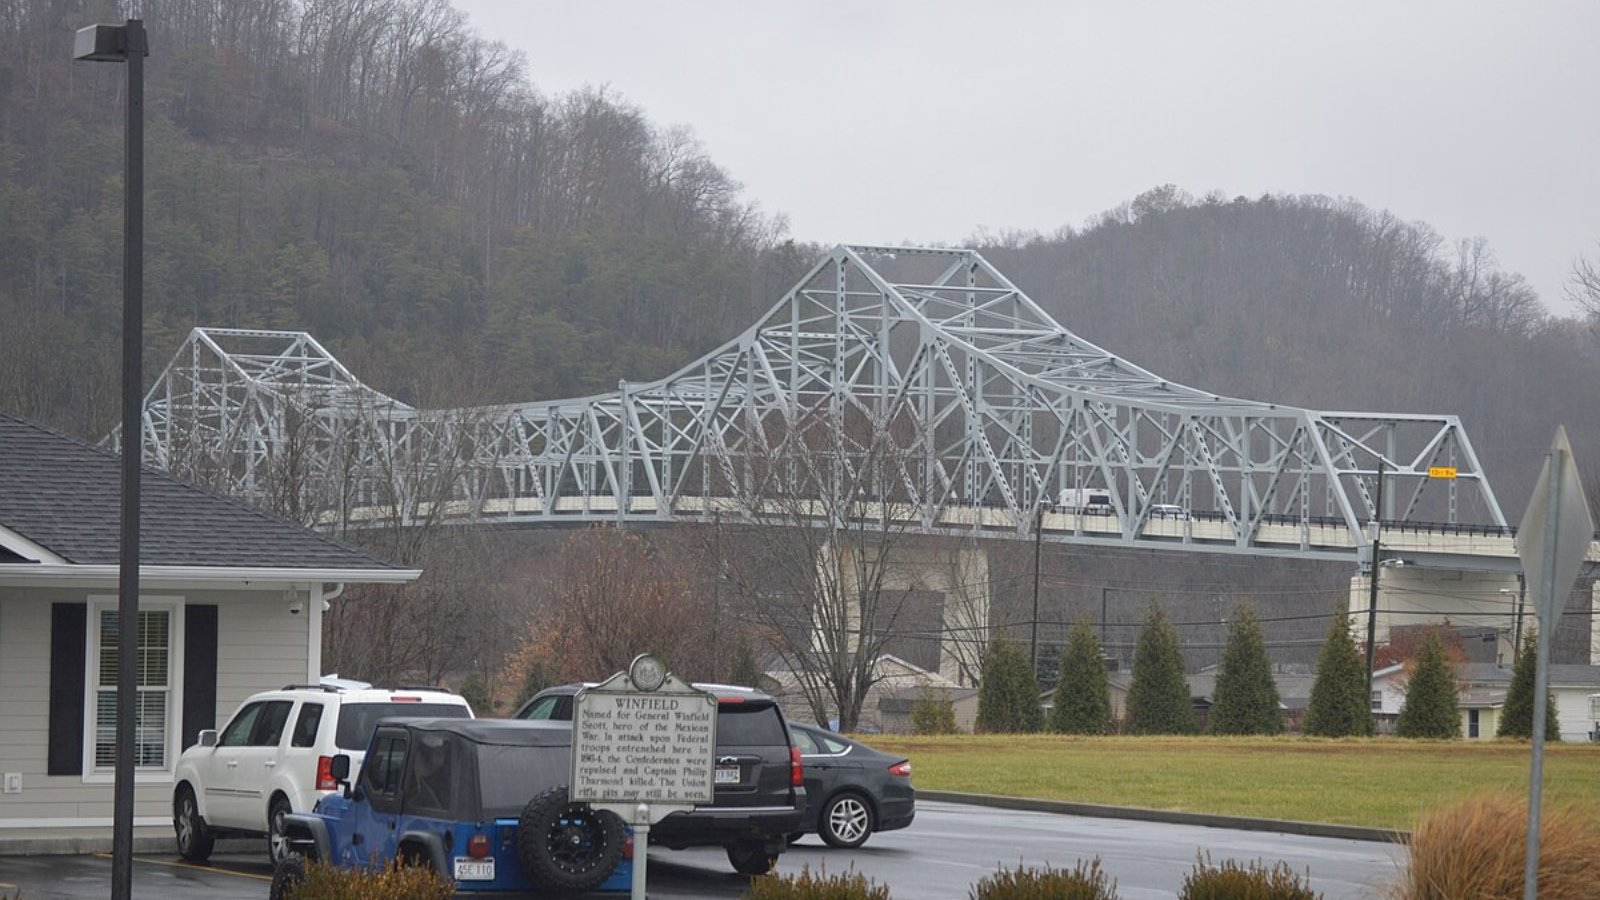
21. Winfield – 59.3% Home Price Increase Since 2010
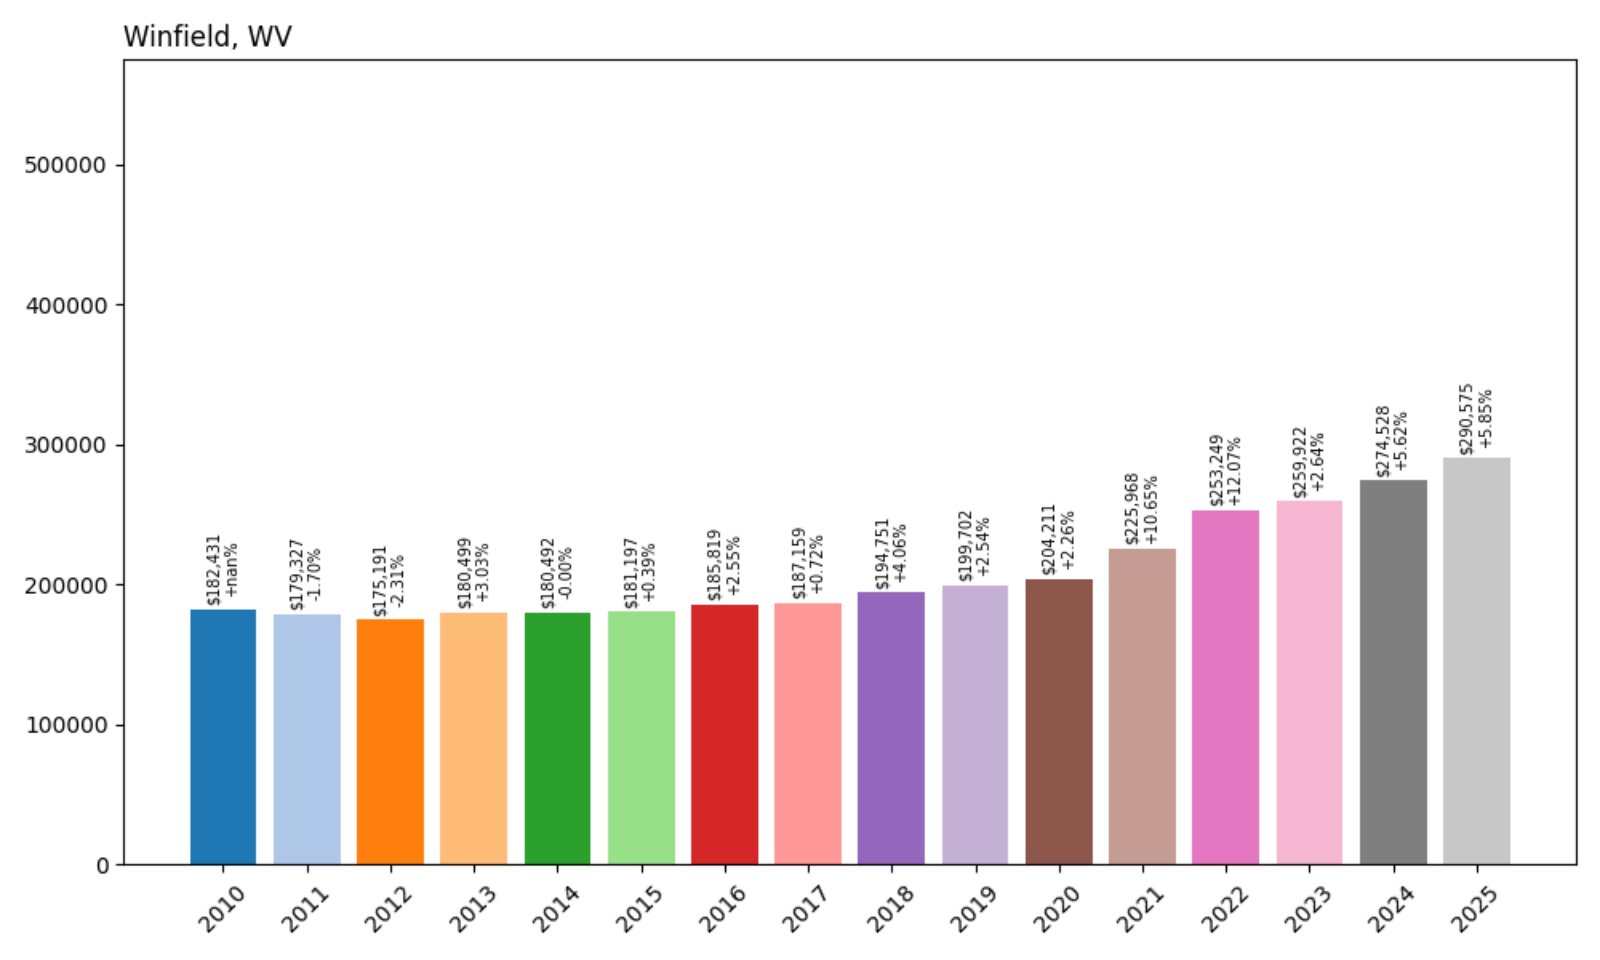
- 2010: $182,431
- 2011: $179,327 (−$3,104, −1.70% from previous year)
- 2012: $175,191 (−$4,136, −2.31% from previous year)
- 2013: $180,499 (+$5,308, +3.03% from previous year)
- 2014: $180,492 (−$7, −0.00% from previous year)
- 2015: $181,197 (+$705, +0.39% from previous year)
- 2016: $185,819 (+$4,622, +2.55% from previous year)
- 2017: $187,159 (+$1,340, +0.72% from previous year)
- 2018: $194,751 (+$7,592, +4.06% from previous year)
- 2019: $199,702 (+$4,951, +2.54% from previous year)
- 2020: $204,211 (+$4,509, +2.26% from previous year)
- 2021: $225,968 (+$21,757, +10.65% from previous year)
- 2022: $253,249 (+$27,281, +12.07% from previous year)
- 2023: $259,922 (+$6,674, +2.64% from previous year)
- 2024: $274,528 (+$14,606, +5.62% from previous year)
- 2025: $290,575 (+$16,047, +5.85% from previous year)
Home prices in Winfield have risen steadily over 15 years, with a notable surge since 2020. The 2025 value of $290,575 is a 59% jump from 2010, driven largely by recent market activity.
Winfield – A Strong Performer in Central West Virginia
Winfield, the county seat of Putnam County, is a sought-after residential area thanks to good schools and a quiet, family-friendly atmosphere. Located near Hurricane and Scott Depot, it shares many of the same advantages of I-64 access and regional amenities.
The market’s solid growth in the 2020s reflects rising interest in suburban-lifestyle towns within reach of Charleston. Winfield has successfully retained buyers looking for balance between accessibility, education, and green space.
20. Slanesville – 91.4% Home Price Increase Since 2010

- 2010: $153,792
- 2011: $150,743 (−$3,049, −1.98% from previous year)
- 2012: $153,477 (+$2,734, +1.81% from previous year)
- 2013: $153,764 (+$287, +0.19% from previous year)
- 2014: $155,155 (+$1,391, +0.90% from previous year)
- 2015: $159,906 (+$4,751, +3.06% from previous year)
- 2016: $169,462 (+$9,556, +5.98% from previous year)
- 2017: $173,147 (+$3,685, +2.17% from previous year)
- 2018: $177,286 (+$4,140, +2.39% from previous year)
- 2019: $177,609 (+$323, +0.18% from previous year)
- 2020: $184,232 (+$6,623, +3.73% from previous year)
- 2021: $218,494 (+$34,261, +18.60% from previous year)
- 2022: $254,284 (+$35,790, +16.38% from previous year)
- 2023: $262,436 (+$8,153, +3.21% from previous year)
- 2024: $280,094 (+$17,658, +6.73% from previous year)
- 2025: $294,317 (+$14,222, +5.08% from previous year)
Slanesville’s home values have surged by over 90% since 2010, nearly doubling in value. A massive jump occurred in 2021 and 2022, after which the growth remained steady and healthy through 2025.
Slanesville – Quiet Market With Remarkable Growth
Located in Hampshire County, Slanesville offers a remote and rural setting that has quietly become one of West Virginia’s higher-end housing markets. Its appeal lies in scenic farmland, forested surroundings, and a relaxed pace of life.
The explosive value increases during the pandemic years suggest demand from out-of-state buyers and telecommuters. With current values approaching $300,000, Slanesville continues to reflect broader trends in rural real estate appreciation.
19. Lewisburg – 41.9% Home Price Increase Since 2010
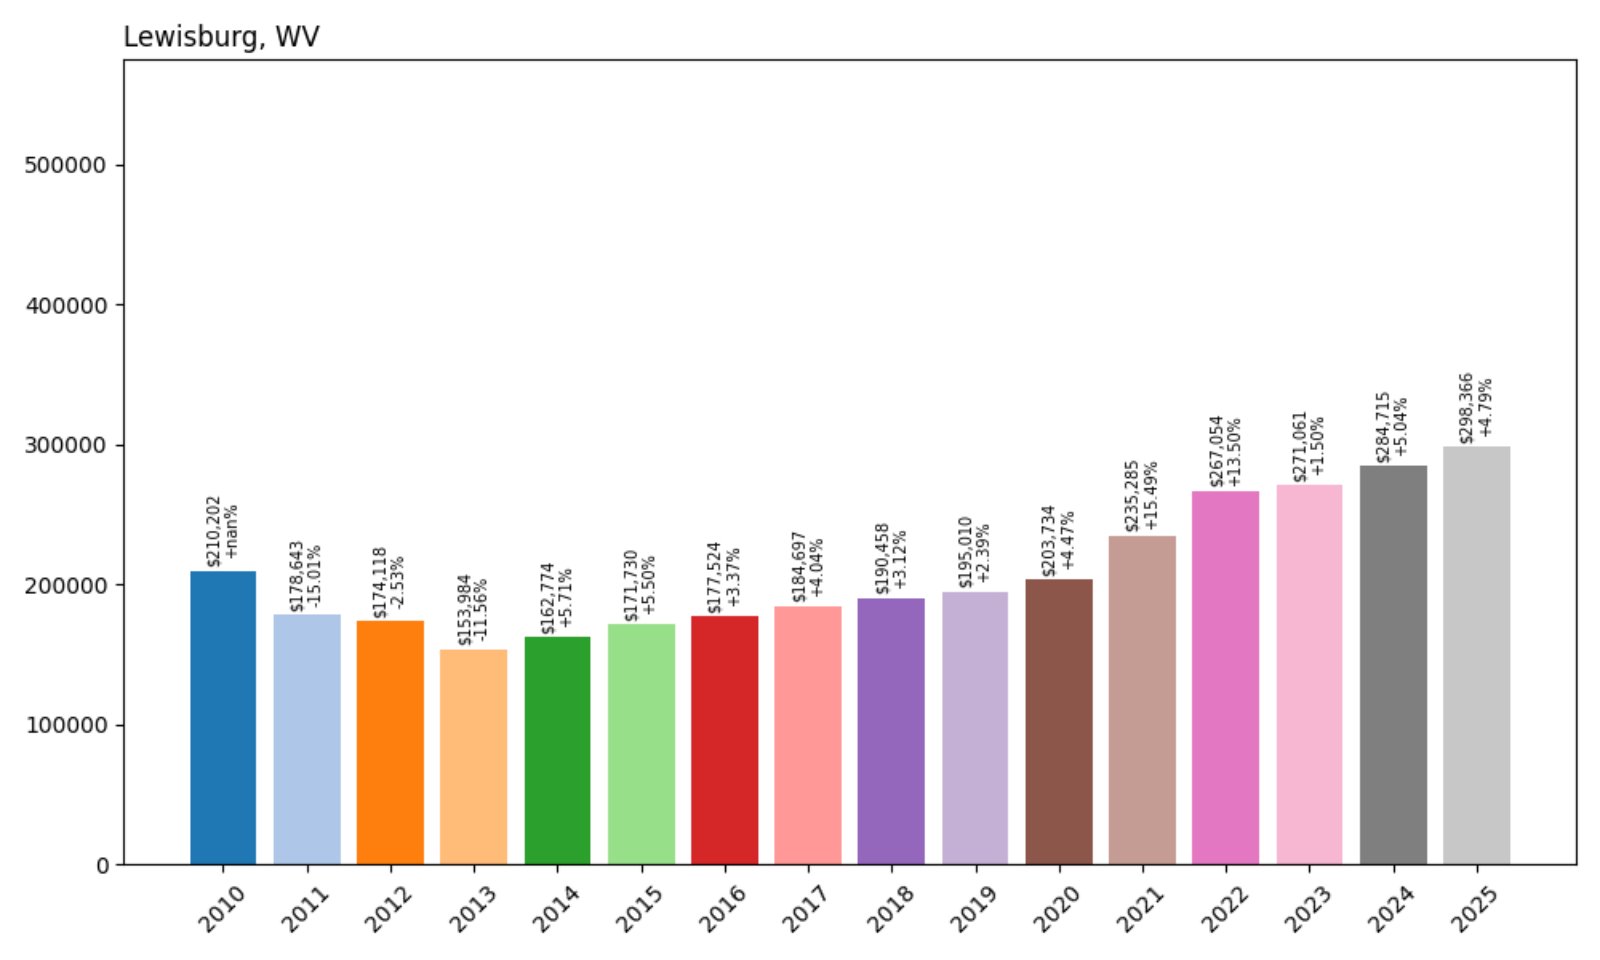
- 2010: $210,202
- 2011: $178,643 (−$31,559, −15.01% from previous year)
- 2012: $174,118 (−$4,525, −2.53% from previous year)
- 2013: $153,984 (−$20,134, −11.56% from previous year)
- 2014: $162,774 (+$8,790, +5.71% from previous year)
- 2015: $171,730 (+$8,956, +5.50% from previous year)
- 2016: $177,524 (+$5,794, +3.37% from previous year)
- 2017: $184,697 (+$7,173, +4.04% from previous year)
- 2018: $190,458 (+$5,761, +3.12% from previous year)
- 2019: $195,010 (+$4,552, +2.39% from previous year)
- 2020: $203,734 (+$8,724, +4.47% from previous year)
- 2021: $235,285 (+$31,551, +15.49% from previous year)
- 2022: $267,054 (+$31,769, +13.50% from previous year)
- 2023: $271,061 (+$4,007, +1.50% from previous year)
- 2024: $284,715 (+$13,654, +5.04% from previous year)
- 2025: $298,366 (+$13,650, +4.79% from previous year)
Lewisburg’s home prices saw a rocky start after 2010 but have since more than recovered, increasing over 41% by 2025. Most of the upward shift occurred after 2020, including strong double-digit gains in 2021 and 2022.
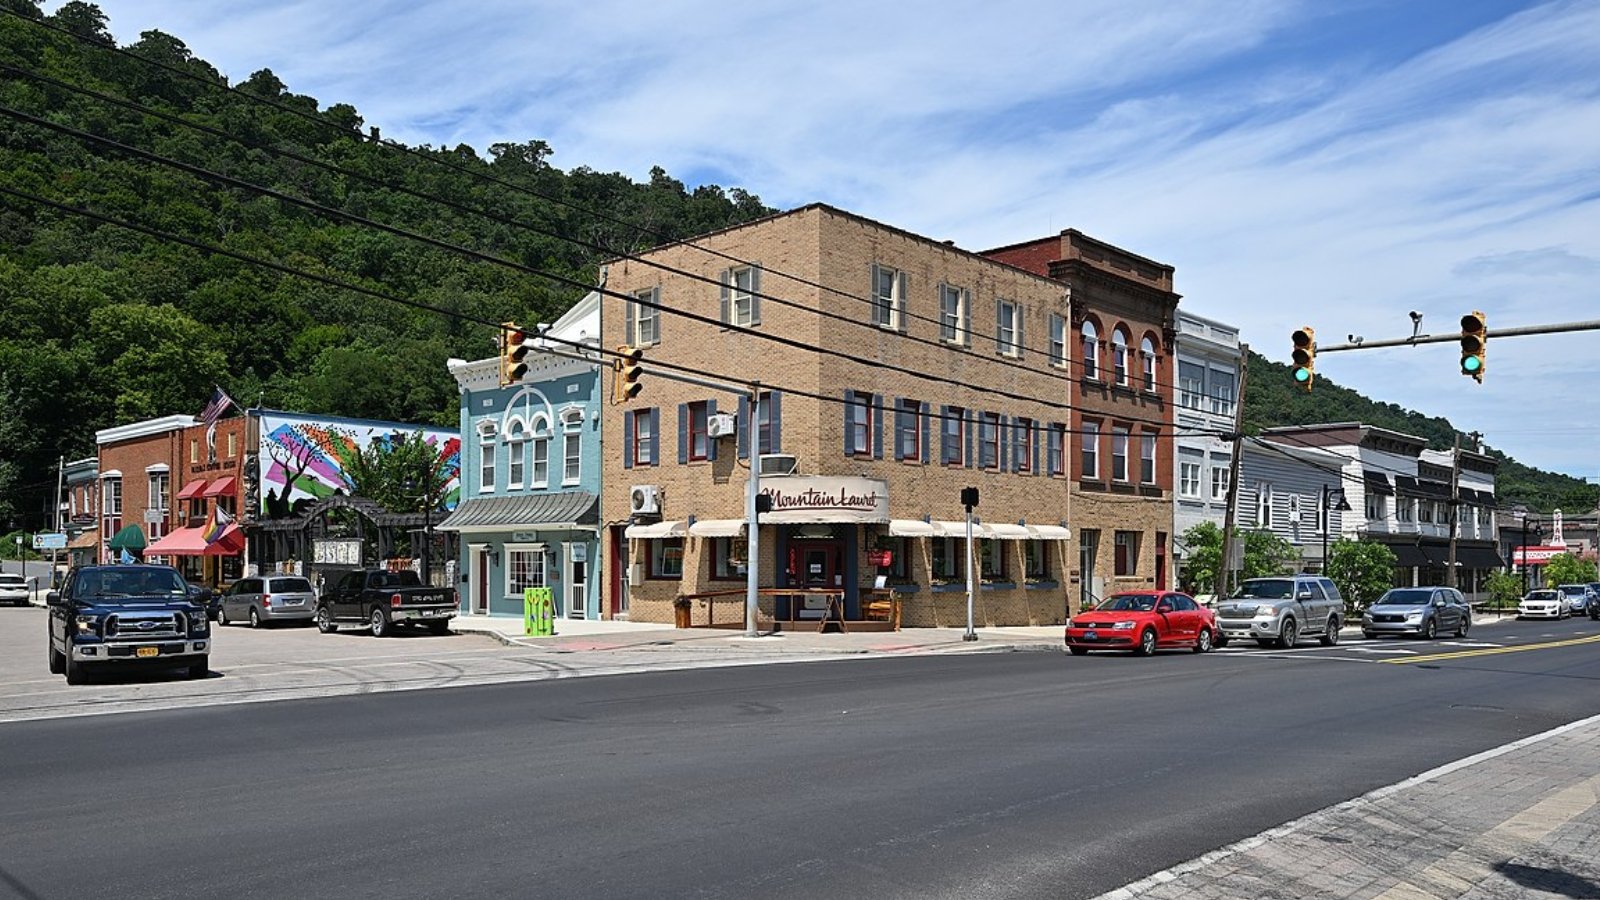
Lewisburg – Historic Charm With a Modern Price Tag
Located in Greenbrier County, Lewisburg is known for its historic downtown, thriving arts scene, and status as a cultural center in southeastern West Virginia. The town regularly appears on “best small town” lists and attracts both tourists and retirees.
Its home price rebound mirrors its growing reputation as a quality-of-life destination. With charming Victorian homes, respected local schools, and a strong sense of place, Lewisburg has earned its spot among the most valuable real estate markets in the state.
18. Bridgeport – 62.7% Home Price Increase Since 2010
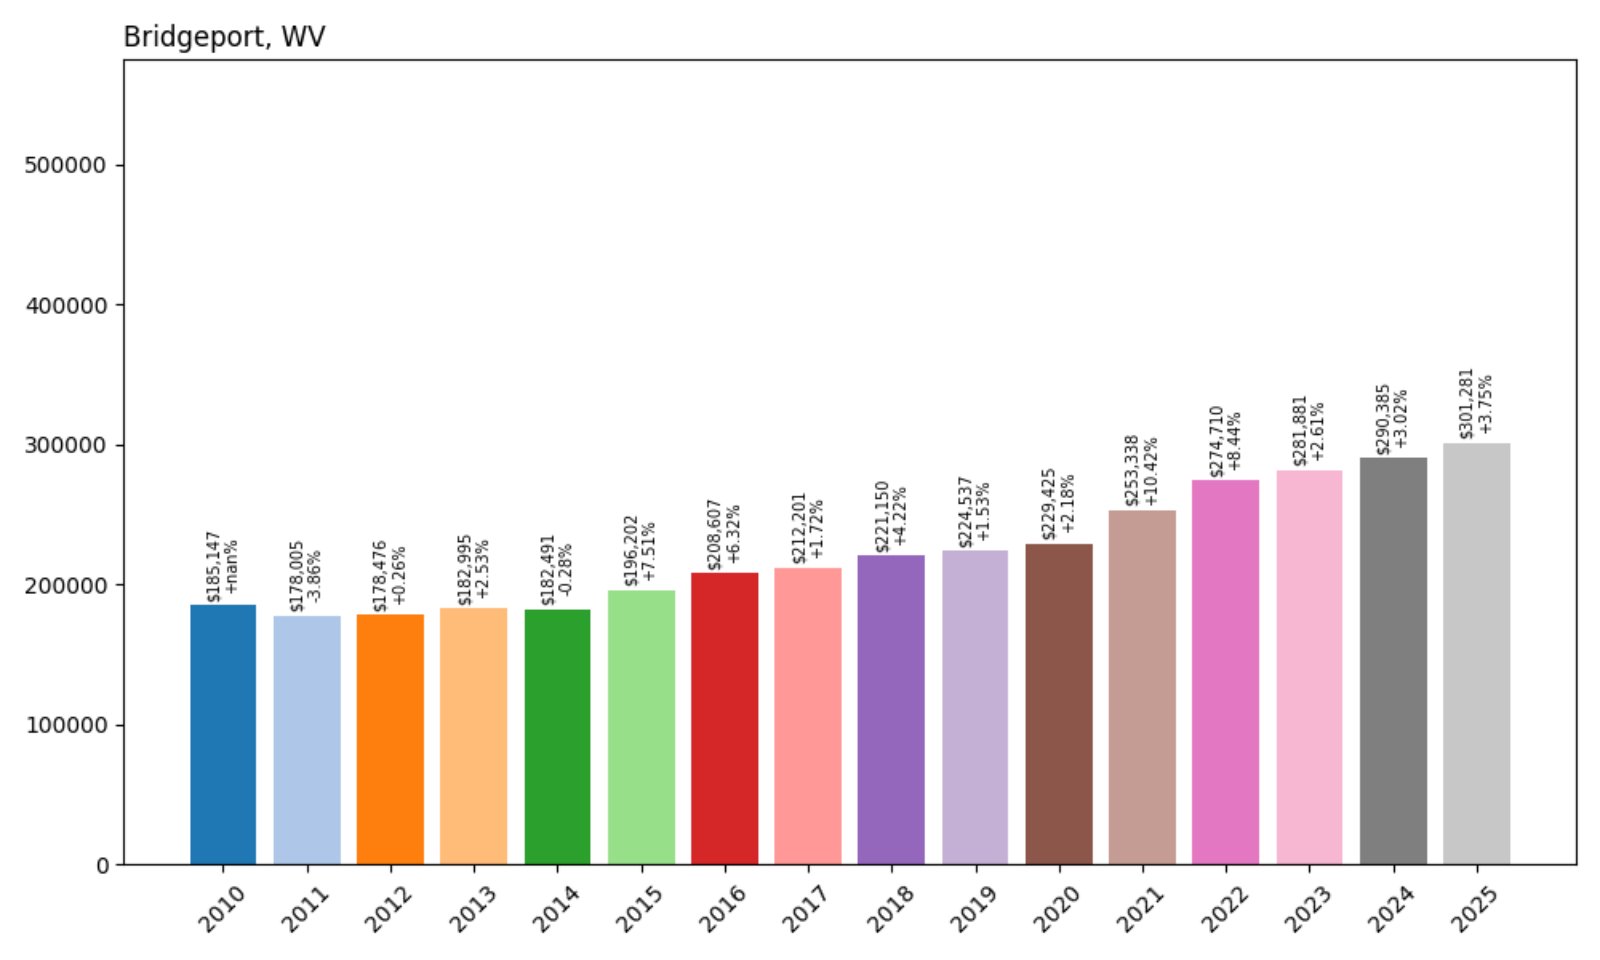
- 2010: $185,147
- 2011: $178,005 (−$7,142, −3.86% from previous year)
- 2012: $178,476 (+$471, +0.26% from previous year)
- 2013: $182,995 (+$4,519, +2.53% from previous year)
- 2014: $182,491 (−$504, −0.28% from previous year)
- 2015: $196,202 (+$13,711, +7.51% from previous year)
- 2016: $208,607 (+$12,404, +6.32% from previous year)
- 2017: $212,201 (+$3,594, +1.72% from previous year)
- 2018: $221,150 (+$8,949, +4.22% from previous year)
- 2019: $224,537 (+$3,387, +1.53% from previous year)
- 2020: $229,425 (+$4,888, +2.18% from previous year)
- 2021: $253,338 (+$23,913, +10.42% from previous year)
- 2022: $274,710 (+$21,372, +8.44% from previous year)
- 2023: $281,881 (+$7,171, +2.61% from previous year)
- 2024: $290,385 (+$8,504, +3.02% from previous year)
- 2025: $301,281 (+$10,895, +3.75% from previous year)
Bridgeport’s housing market has grown by more than 60% since 2010. While the early years showed modest gains, growth accelerated in the past five years with consistent annual increases.
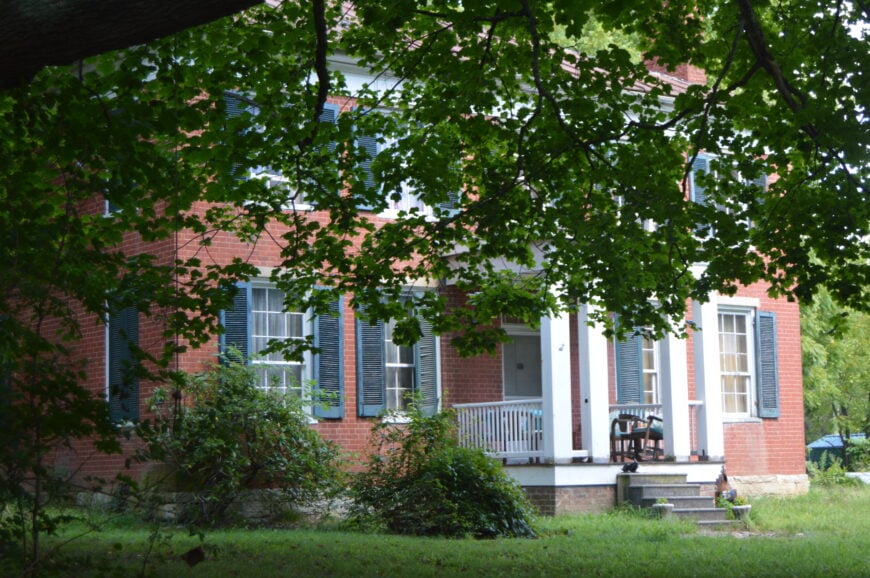
Bridgeport – A Strong Market Anchored by Infrastructure
Bridgeport, located in Harrison County, benefits from a stable local economy supported by health care, aerospace, and energy sectors. North Central West Virginia Airport and United Hospital Center bring steady employment and new residents to the area.
As a result, the town has seen reliable housing demand. Well-maintained neighborhoods, top-rated schools, and regional economic development have helped drive its climb into the upper ranks of West Virginia real estate.
17. North Hills – 87.9% Home Price Increase Since 2010
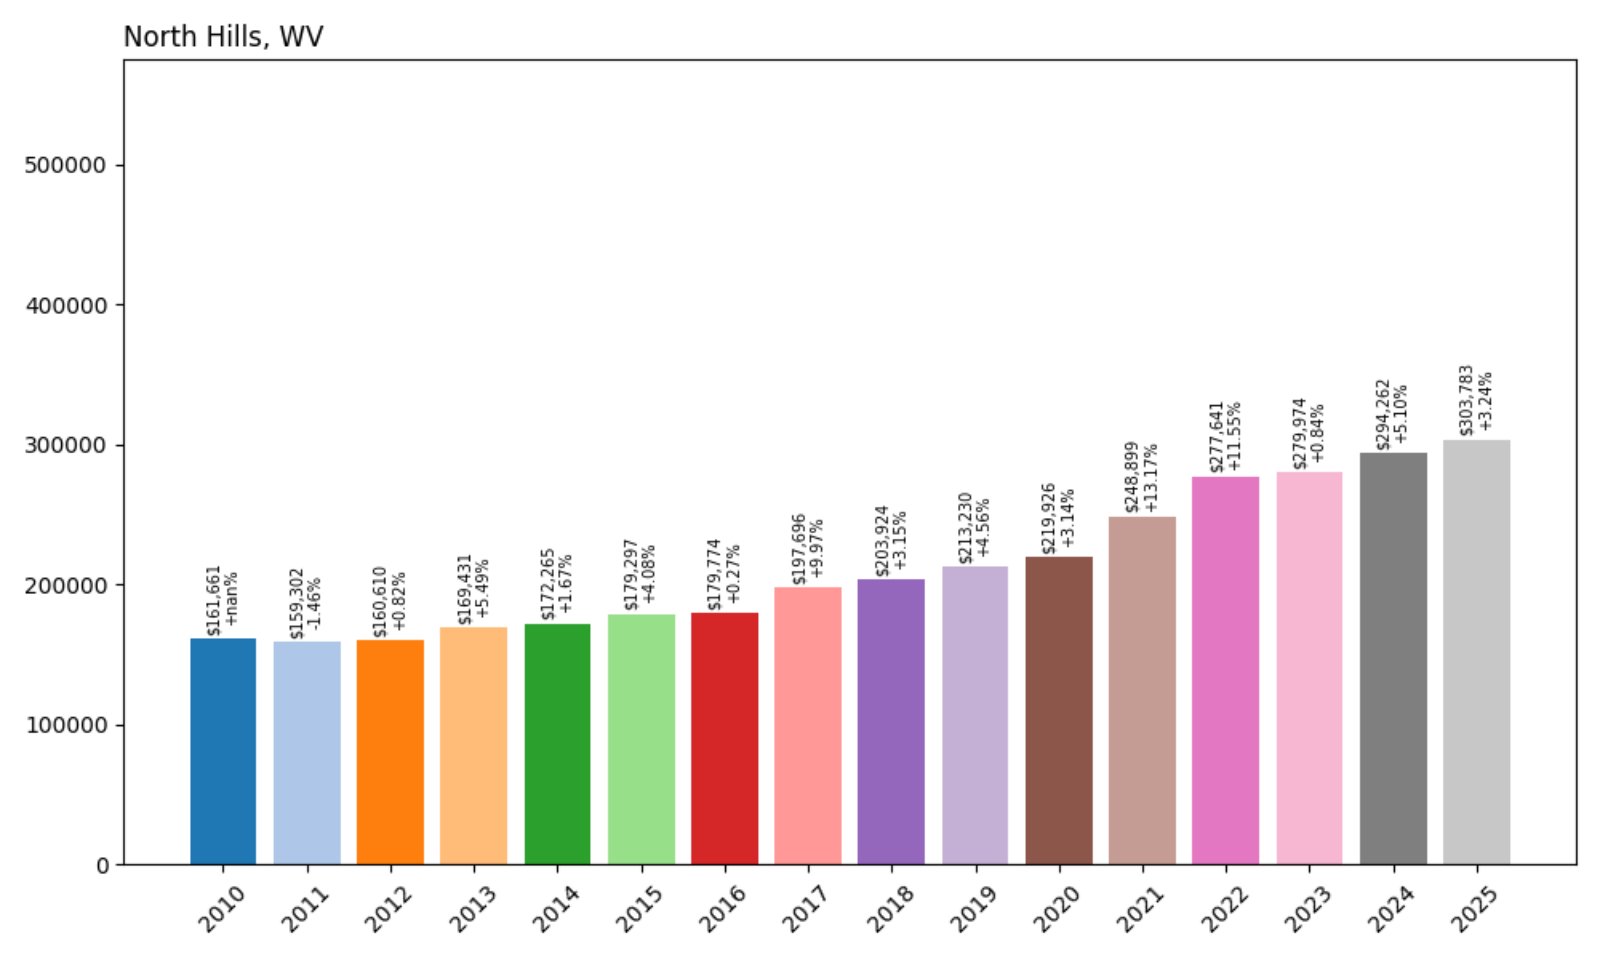
- 2010: $161,661
- 2011: $159,302 (−$2,359, −1.46% from previous year)
- 2012: $160,610 (+$1,309, +0.82% from previous year)
- 2013: $169,431 (+$8,820, +5.49% from previous year)
- 2014: $172,265 (+$2,834, +1.67% from previous year)
- 2015: $179,297 (+$7,032, +4.08% from previous year)
- 2016: $179,774 (+$478, +0.27% from previous year)
- 2017: $197,696 (+$17,922, +9.97% from previous year)
- 2018: $203,924 (+$6,228, +3.15% from previous year)
- 2019: $213,230 (+$9,305, +4.56% from previous year)
- 2020: $219,926 (+$6,696, +3.14% from previous year)
- 2021: $248,899 (+$28,973, +13.17% from previous year)
- 2022: $277,641 (+$28,742, +11.55% from previous year)
- 2023: $279,974 (+$2,332, +0.84% from previous year)
- 2024: $294,262 (+$14,288, +5.10% from previous year)
- 2025: $303,783 (+$9,521, +3.24% from previous year)
Home values in North Hills have nearly doubled since 2010. With consistent growth in nearly every year and big gains during the 2020–2022 period, the current value of $303,783 places this town among the top in the state.
North Hills – A Small Town With Big Gains
North Hills is a small residential area in Wood County near Parkersburg. Its rise in home prices reflects both proximity to employment centers and a stable supply of owner-occupied homes. Buyers looking for suburban comfort with access to city services find this area appealing.
The recent value surge is particularly notable for a town of this size, indicating strong local demand. Well-kept housing stock and quiet neighborhoods have helped maintain its momentum as one of West Virginia’s more expensive places to buy in 2025.
16. Martinsburg – 100.4% Home Price Increase Since 2014
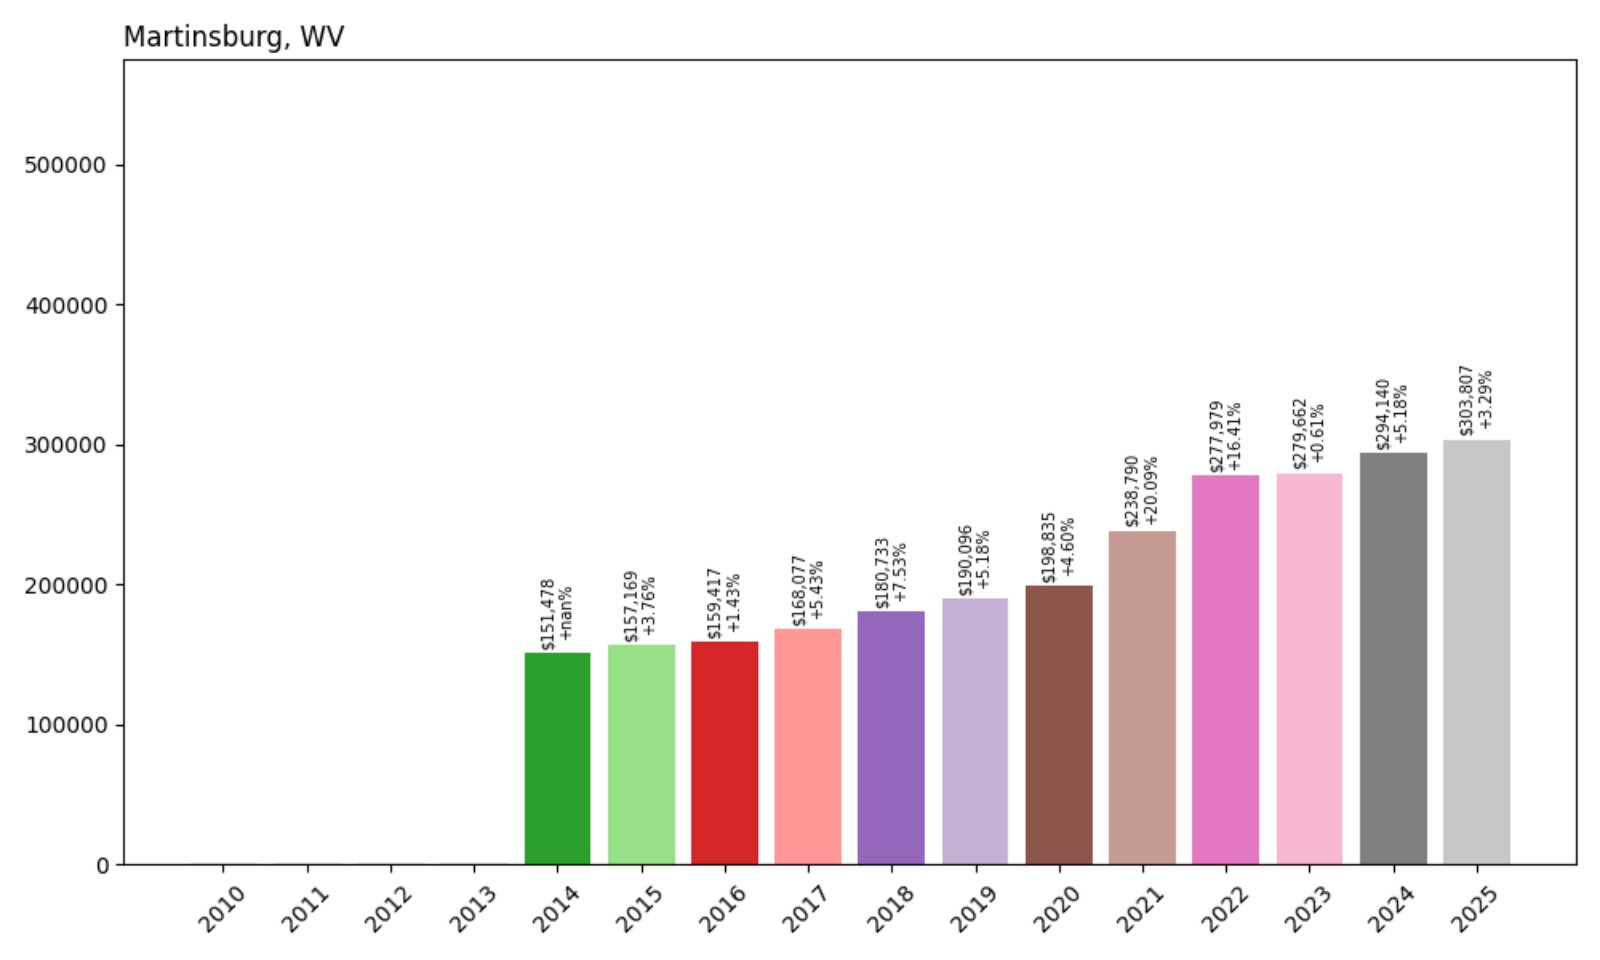
- 2014: $151,478
- 2015: $157,169 (+$5,690, +3.76% from previous year)
- 2016: $159,417 (+$2,248, +1.43% from previous year)
- 2017: $168,077 (+$8,660, +5.43% from previous year)
- 2018: $180,733 (+$12,656, +7.53% from previous year)
- 2019: $190,096 (+$9,362, +5.18% from previous year)
- 2020: $198,835 (+$8,740, +4.60% from previous year)
- 2021: $238,790 (+$39,955, +20.09% from previous year)
- 2022: $277,979 (+$39,189, +16.41% from previous year)
- 2023: $279,662 (+$1,683, +0.61% from previous year)
- 2024: $294,140 (+$14,478, +5.18% from previous year)
- 2025: $303,807 (+$9,667, +3.29% from previous year)
Martinsburg’s home values have more than doubled in the last decade. The fastest price growth came in 2021 and 2022, but prices have remained on an upward trajectory, now reaching $303,807 in 2025.
Martinsburg – A Hot Market in the Eastern Panhandle
Martinsburg, located in Berkeley County, has become one of the state’s most economically active areas, bolstered by its status as a commuter hub to both Northern Virginia and Washington, D.C. The MARC train and I-81 corridor contribute to strong regional demand.
With a mix of new construction and revitalized older neighborhoods, Martinsburg offers housing options that appeal to both first-time buyers and long-distance commuters. Its combination of access and affordability has helped push home prices higher year after year.
15. Berkeley Springs – 110.3% Home Price Increase Since 2010
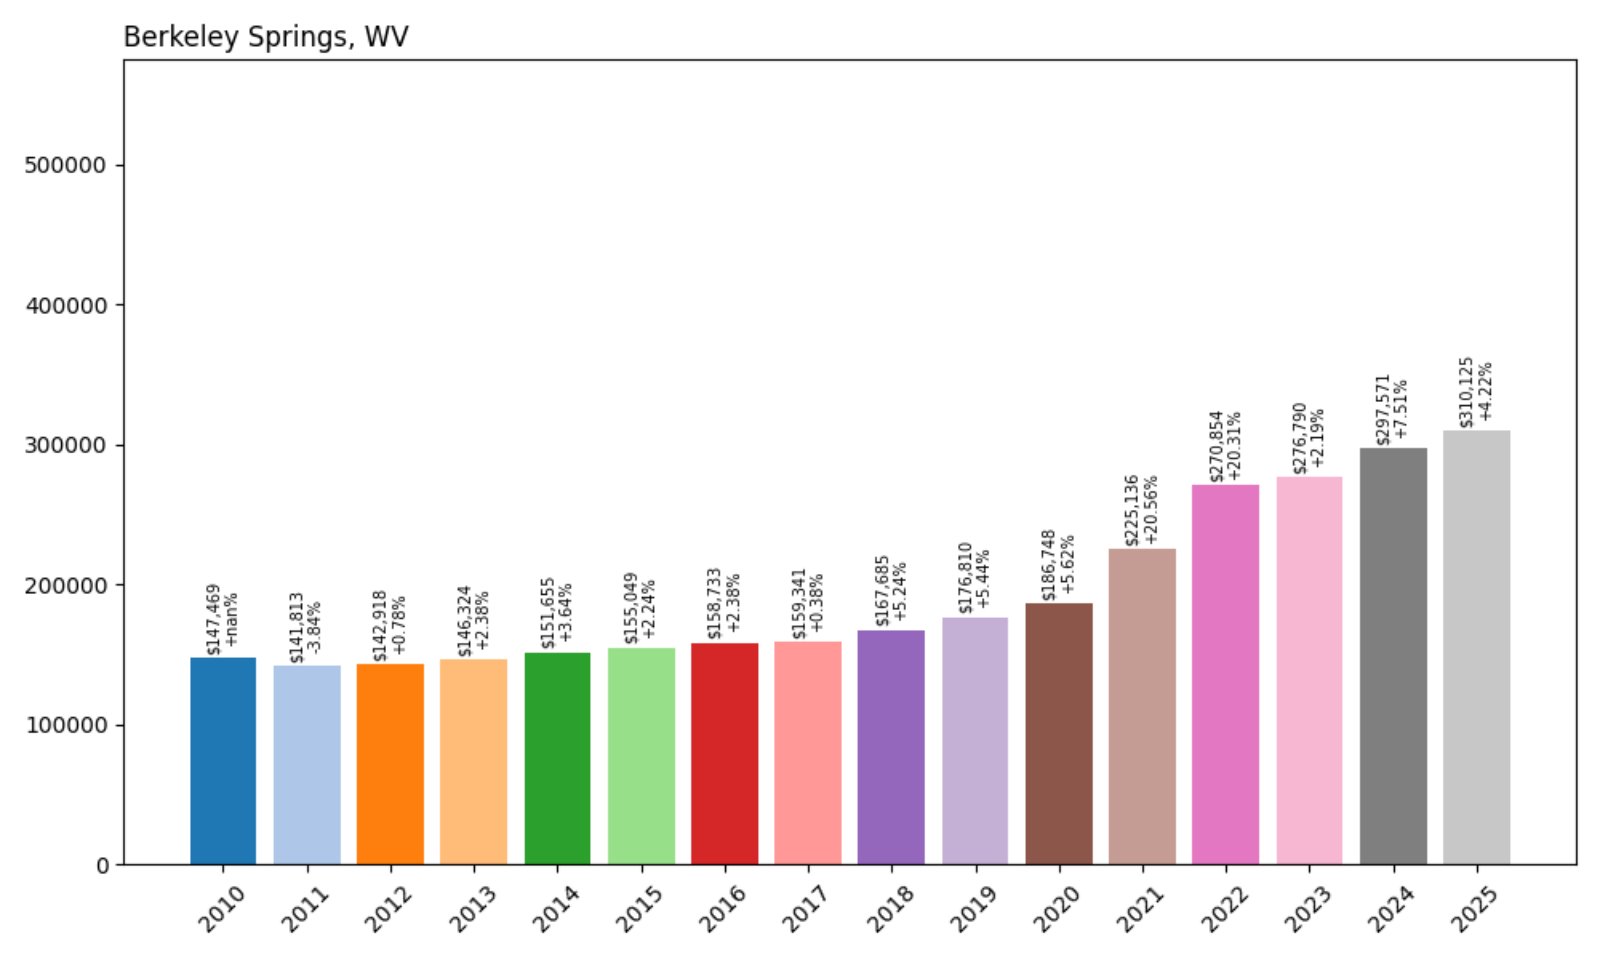
- 2010: $147,469
- 2011: $141,813 (−$5,656, −3.84% from previous year)
- 2012: $142,918 (+$1,105, +0.78% from previous year)
- 2013: $146,324 (+$3,406, +2.38% from previous year)
- 2014: $151,655 (+$5,330, +3.64% from previous year)
- 2015: $155,049 (+$3,394, +2.24% from previous year)
- 2016: $158,733 (+$3,684, +2.38% from previous year)
- 2017: $159,341 (+$607, +0.38% from previous year)
- 2018: $167,685 (+$8,345, +5.24% from previous year)
- 2019: $176,810 (+$9,124, +5.44% from previous year)
- 2020: $186,748 (+$9,939, +5.62% from previous year)
- 2021: $225,136 (+$38,387, +20.56% from previous year)
- 2022: $270,854 (+$45,719, +20.31% from previous year)
- 2023: $276,790 (+$5,936, +2.19% from previous year)
- 2024: $297,571 (+$20,780, +7.51% from previous year)
- 2025: $310,125 (+$12,554, +4.22% from previous year)
Home values in Berkeley Springs have more than doubled since 2010, with the biggest increases coming between 2020 and 2022. The market remains strong, with prices now reaching $310,125.
Berkeley Springs – Spa Town With Soaring Values
Known for its warm springs and health resorts, Berkeley Springs in Morgan County has long attracted visitors. In recent years, more of those visitors have become full-time residents or second-home owners, driving sustained price increases.
Tourism, outdoor recreation, and its growing reputation as an arts and wellness destination have elevated Berkeley Springs into one of the state’s most expensive housing markets. Real estate here now competes with some of the more traditionally affluent areas of the Eastern Panhandle.
14. Bolivar – 103.5% Home Price Increase Since 2010
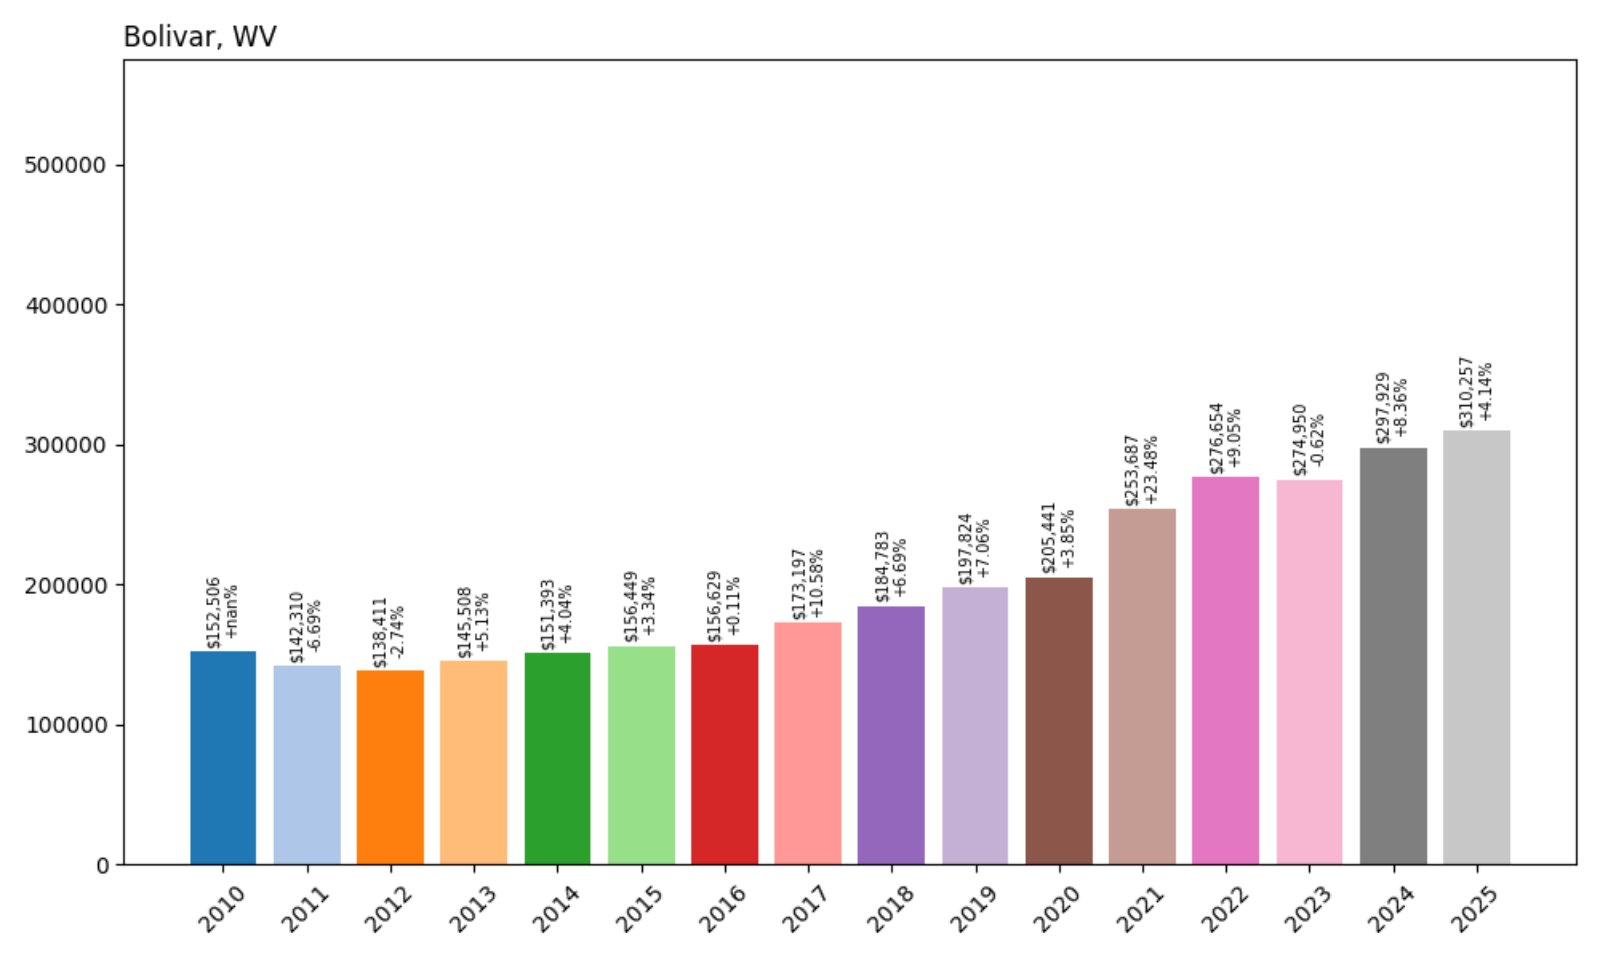
- 2010: $152,506
- 2011: $142,310 (−$10,196, −6.69% from previous year)
- 2012: $138,411 (−$3,899, −2.74% from previous year)
- 2013: $145,508 (+$7,098, +5.13% from previous year)
- 2014: $151,393 (+$5,884, +4.04% from previous year)
- 2015: $156,449 (+$5,056, +3.34% from previous year)
- 2016: $156,629 (+$180, +0.11% from previous year)
- 2017: $173,197 (+$16,568, +10.58% from previous year)
- 2018: $184,783 (+$11,587, +6.69% from previous year)
- 2019: $197,824 (+$13,041, +7.06% from previous year)
- 2020: $205,441 (+$7,617, +3.85% from previous year)
- 2021: $253,687 (+$48,246, +23.48% from previous year)
- 2022: $276,654 (+$22,967, +9.05% from previous year)
- 2023: $274,950 (−$1,704, −0.62% from previous year)
- 2024: $297,929 (+$22,979, +8.36% from previous year)
- 2025: $310,257 (+$12,328, +4.14% from previous year)
Bolivar has seen prices more than double since 2010, with rapid growth especially in 2021 and a strong rebound in 2024 after a slight dip. Prices now top $310K.
Bolivar – Scenic and Surging Near Harpers Ferry
Adjacent to Harpers Ferry, Bolivar benefits from its location at the crossroads of history, nature, and commuter access. Its proximity to hiking trails, rivers, and the MARC train line makes it attractive for weekenders and full-time residents alike.
The area’s affordability relative to Northern Virginia has made it a target for buyers in recent years, pushing up home values at a fast clip. Bolivar now sits among the most expensive real estate markets in the state.
13. Falling Waters – 79.9% Home Price Increase Since 2014
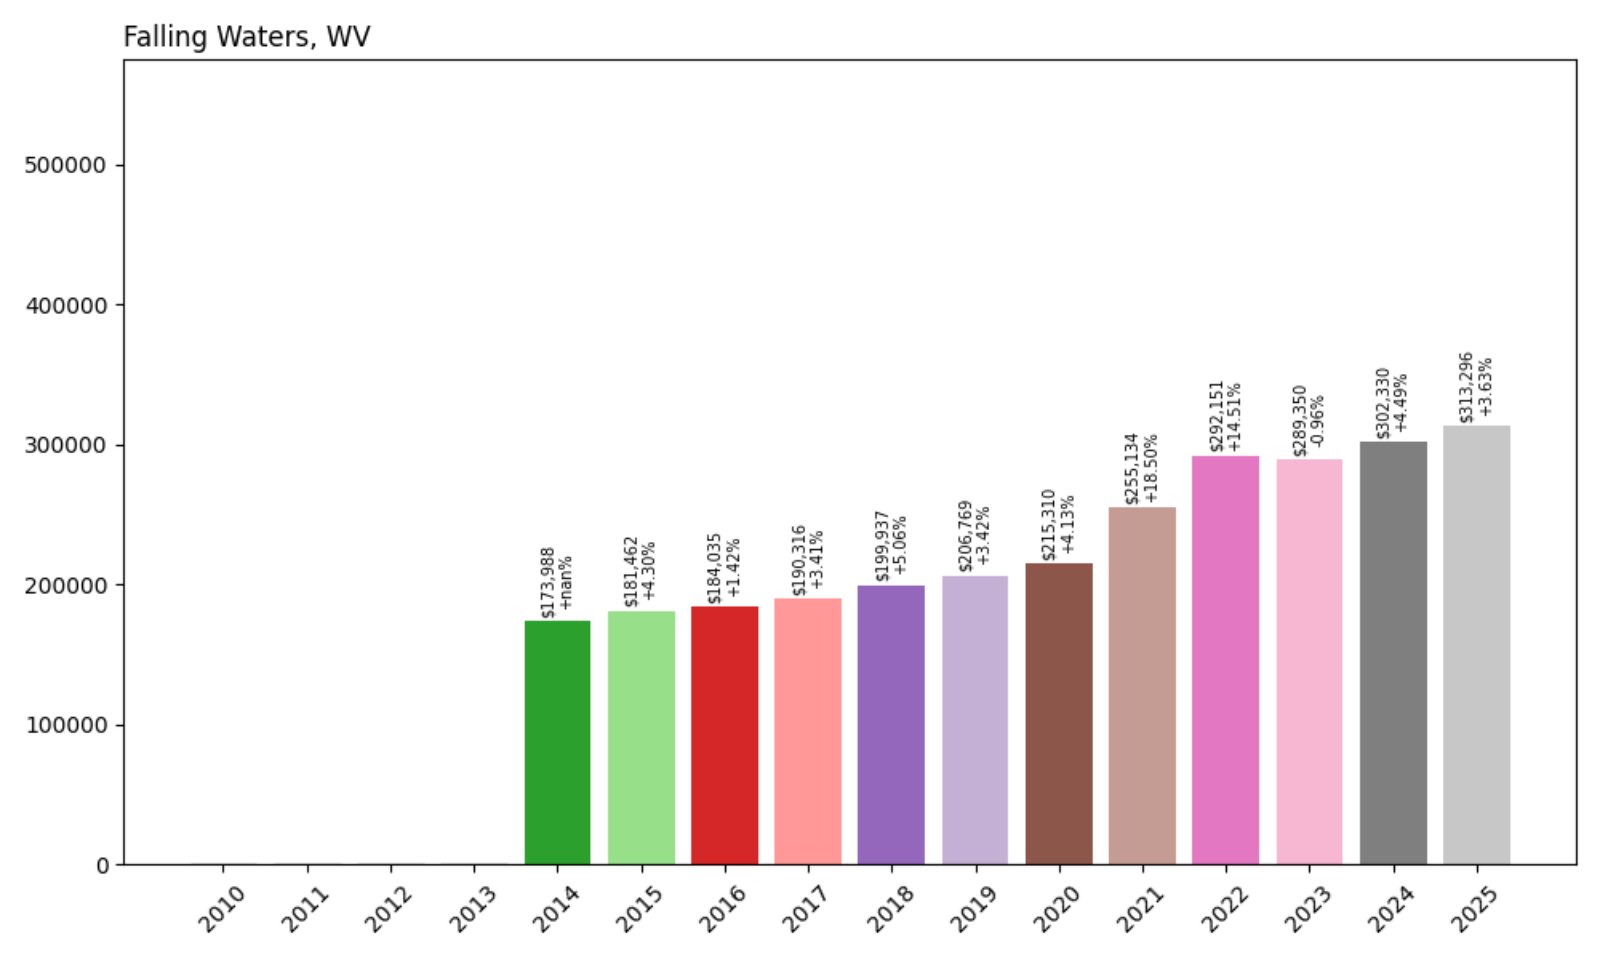
- 2014: $173,988
- 2015: $181,462 (+$7,474, +4.30% from previous year)
- 2016: $184,035 (+$2,573, +1.42% from previous year)
- 2017: $190,316 (+$6,281, +3.41% from previous year)
- 2018: $199,937 (+$9,621, +5.06% from previous year)
- 2019: $206,769 (+$6,832, +3.42% from previous year)
- 2020: $215,310 (+$8,541, +4.13% from previous year)
- 2021: $255,134 (+$39,824, +18.50% from previous year)
- 2022: $292,151 (+$37,017, +14.51% from previous year)
- 2023: $289,350 (−$2,801, −0.96% from previous year)
- 2024: $302,330 (+$12,979, +4.49% from previous year)
- 2025: $313,296 (+$10,967, +3.63% from previous year)
Falling Waters has seen prices rise nearly 80% since 2014. Even with a minor dip in 2023, growth has resumed, and the town now averages over $313,000 per home.
Falling Waters – River Views and Price Rises
Located in Berkeley County along the Potomac River, Falling Waters offers scenic vistas, easy I-81 access, and a quiet suburban feel. It’s a popular destination for commuters who work in Maryland or Northern Virginia but want West Virginia prices.
Strong gains in 2021 and 2022 reflect increased attention from out-of-state buyers. Though price growth has leveled off slightly, Falling Waters remains one of the more expensive real estate markets in the state.
12. Inwood – 107.2% Home Price Increase Since 2014

- 2014: $151,942
- 2015: $156,353 (+$4,412, +2.90% from previous year)
- 2016: $160,781 (+$4,428, +2.83% from previous year)
- 2017: $168,636 (+$7,855, +4.89% from previous year)
- 2018: $181,178 (+$12,542, +7.44% from previous year)
- 2019: $191,794 (+$10,616, +5.86% from previous year)
- 2020: $202,684 (+$10,890, +5.68% from previous year)
- 2021: $242,248 (+$39,564, +19.52% from previous year)
- 2022: $282,807 (+$40,559, +16.74% from previous year)
- 2023: $285,450 (+$2,643, +0.93% from previous year)
- 2024: $302,949 (+$17,499, +6.13% from previous year)
- 2025: $314,903 (+$11,955, +3.95% from previous year)
Inwood’s home prices have more than doubled since 2014, reaching nearly $315,000 in 2025. The biggest increases occurred during the pandemic boom, but prices have continued climbing steadily in recent years.
Inwood – Growth Fueled by Commuters and Convenience
Inwood, located in Berkeley County, is a prime commuter town thanks to its location near the I-81 corridor and easy access to Winchester, VA and Hagerstown, MD. It has become a go-to destination for buyers looking for newer homes and short drive times to jobs across the border.
Inwood’s rapid growth reflects both affordability and strong construction activity, with new subdivisions and townhomes expanding the local housing stock. The town remains a key part of West Virginia’s high-value Eastern Panhandle corridor.
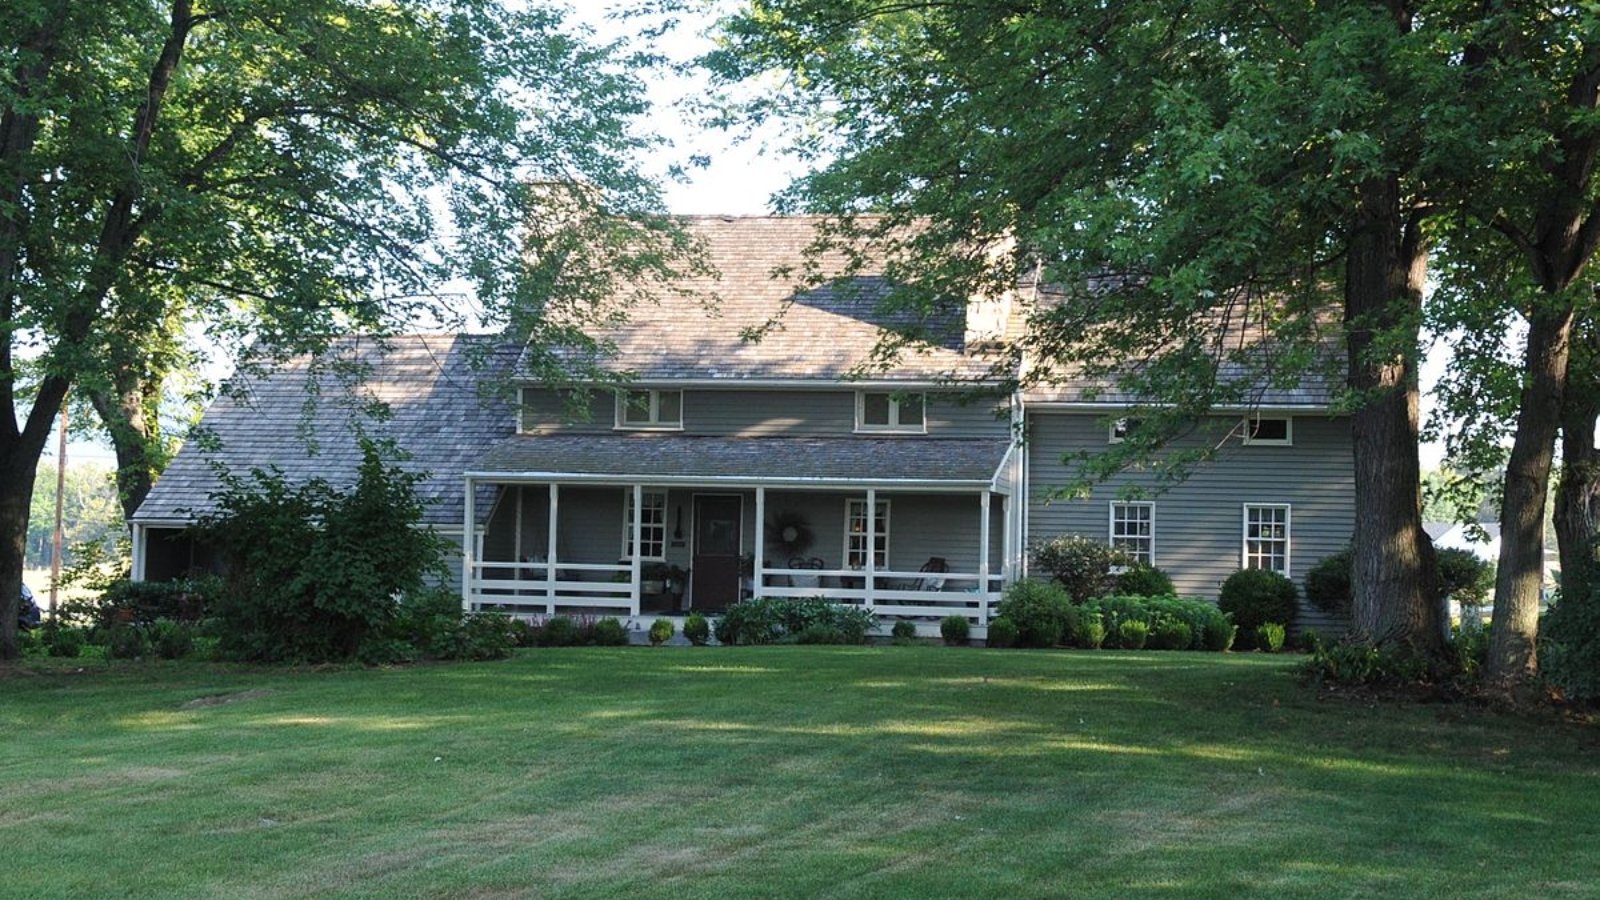
11. Capon Bridge – 86.6% Home Price Increase Since 2010
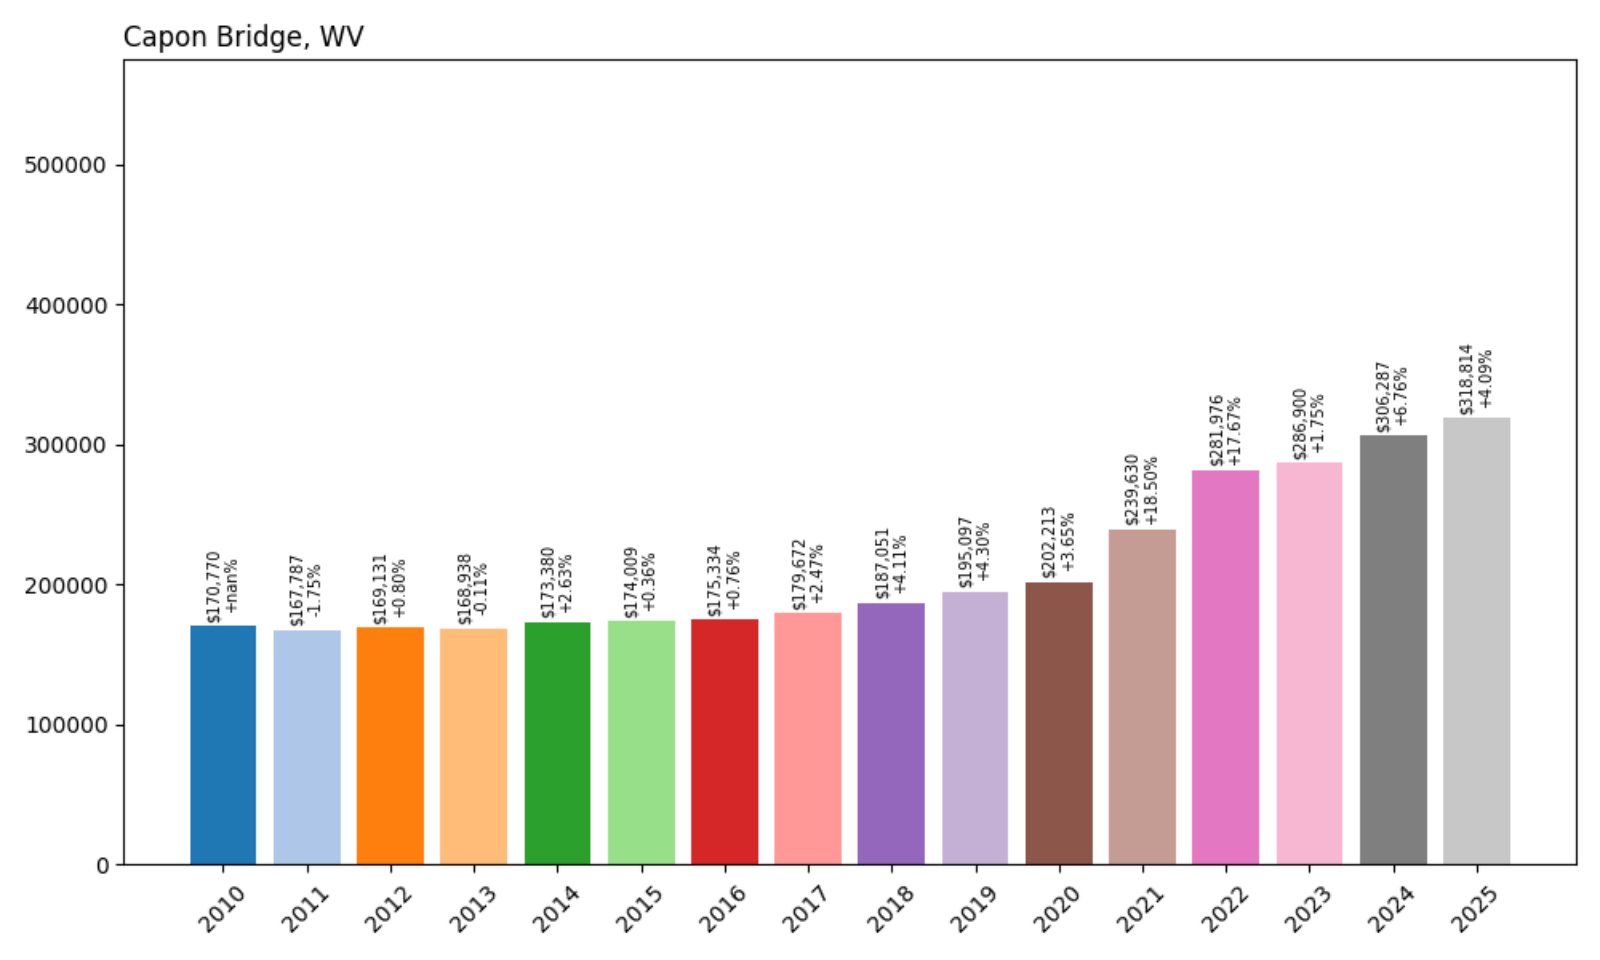
- 2010: $170,770
- 2011: $167,787 (−$2,983, −1.75% from previous year)
- 2012: $169,131 (+$1,344, +0.80% from previous year)
- 2013: $168,938 (−$193, −0.11% from previous year)
- 2014: $173,380 (+$4,442, +2.63% from previous year)
- 2015: $174,009 (+$629, +0.36% from previous year)
- 2016: $175,334 (+$1,325, +0.76% from previous year)
- 2017: $179,672 (+$4,338, +2.47% from previous year)
- 2018: $187,051 (+$7,380, +4.11% from previous year)
- 2019: $195,097 (+$8,046, +4.30% from previous year)
- 2020: $202,213 (+$7,116, +3.65% from previous year)
- 2021: $239,630 (+$37,417, +18.50% from previous year)
- 2022: $281,976 (+$42,346, +17.67% from previous year)
- 2023: $286,900 (+$4,924, +1.75% from previous year)
- 2024: $306,287 (+$19,387, +6.76% from previous year)
- 2025: $318,814 (+$12,527, +4.09% from previous year)
Capon Bridge has gained nearly $150,000 in value since 2010, more than doubling over the last 15 years. Price growth picked up sharply after 2020, with continued increases through 2025.
Capon Bridge – Mountain Living With Upscale Pricing
Situated along the Cacapon River in Hampshire County, Capon Bridge offers scenic beauty, a strong sense of community, and convenient access to Virginia. It’s become a favorite for those seeking rural calm without sacrificing access to services.
The town’s small size hasn’t prevented big real estate moves, as demand from buyers seeking seclusion and natural amenities continues to rise. With home values now nearing $320K, Capon Bridge ranks among the top-tier towns in the state by price.
10. Bunker Hill – 102.4% Home Price Increase Since 2014
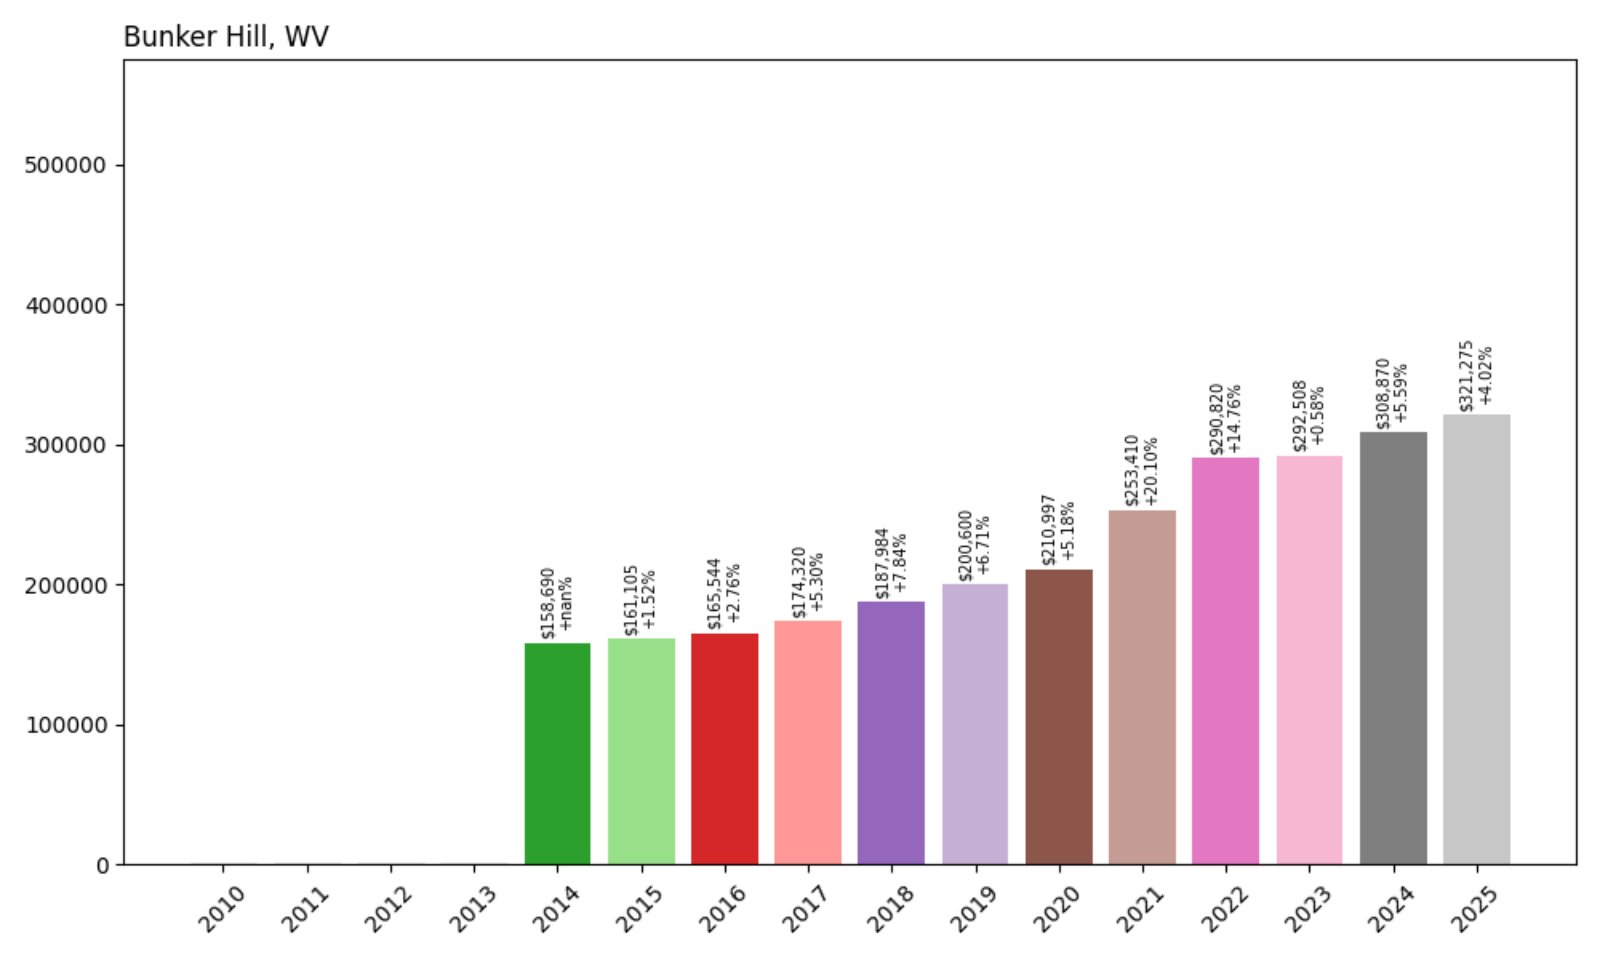
- 2014: $158,690
- 2015: $161,105 (+$2,415, +1.52% from previous year)
- 2016: $165,544 (+$4,439, +2.76% from previous year)
- 2017: $174,320 (+$8,776, +5.30% from previous year)
- 2018: $187,984 (+$13,664, +7.84% from previous year)
- 2019: $200,600 (+$12,615, +6.71% from previous year)
- 2020: $210,997 (+$10,397, +5.18% from previous year)
- 2021: $253,410 (+$42,414, +20.10% from previous year)
- 2022: $290,820 (+$37,410, +14.76% from previous year)
- 2023: $292,508 (+$1,688, +0.58% from previous year)
- 2024: $308,870 (+$16,361, +5.59% from previous year)
- 2025: $321,275 (+$12,406, +4.02% from previous year)
Home values in Bunker Hill have climbed steadily over the past decade, more than doubling since 2014. Gains were especially strong in the early 2020s and have continued through 2025.
Bunker Hill – Commuter Growth Spurs Market Climb
Bunker Hill sits at the southern end of Berkeley County and benefits from its proximity to both Winchester, VA and Martinsburg. As a popular commuter town, it has seen significant residential growth, especially during the remote work boom.
With a mix of suburban development and rural land still available, Bunker Hill offers flexibility for buyers. The result is a thriving housing market that now places the town firmly in West Virginia’s top 10 by home value.
9. Hedgesville – 153.7% Home Price Increase Since 2010
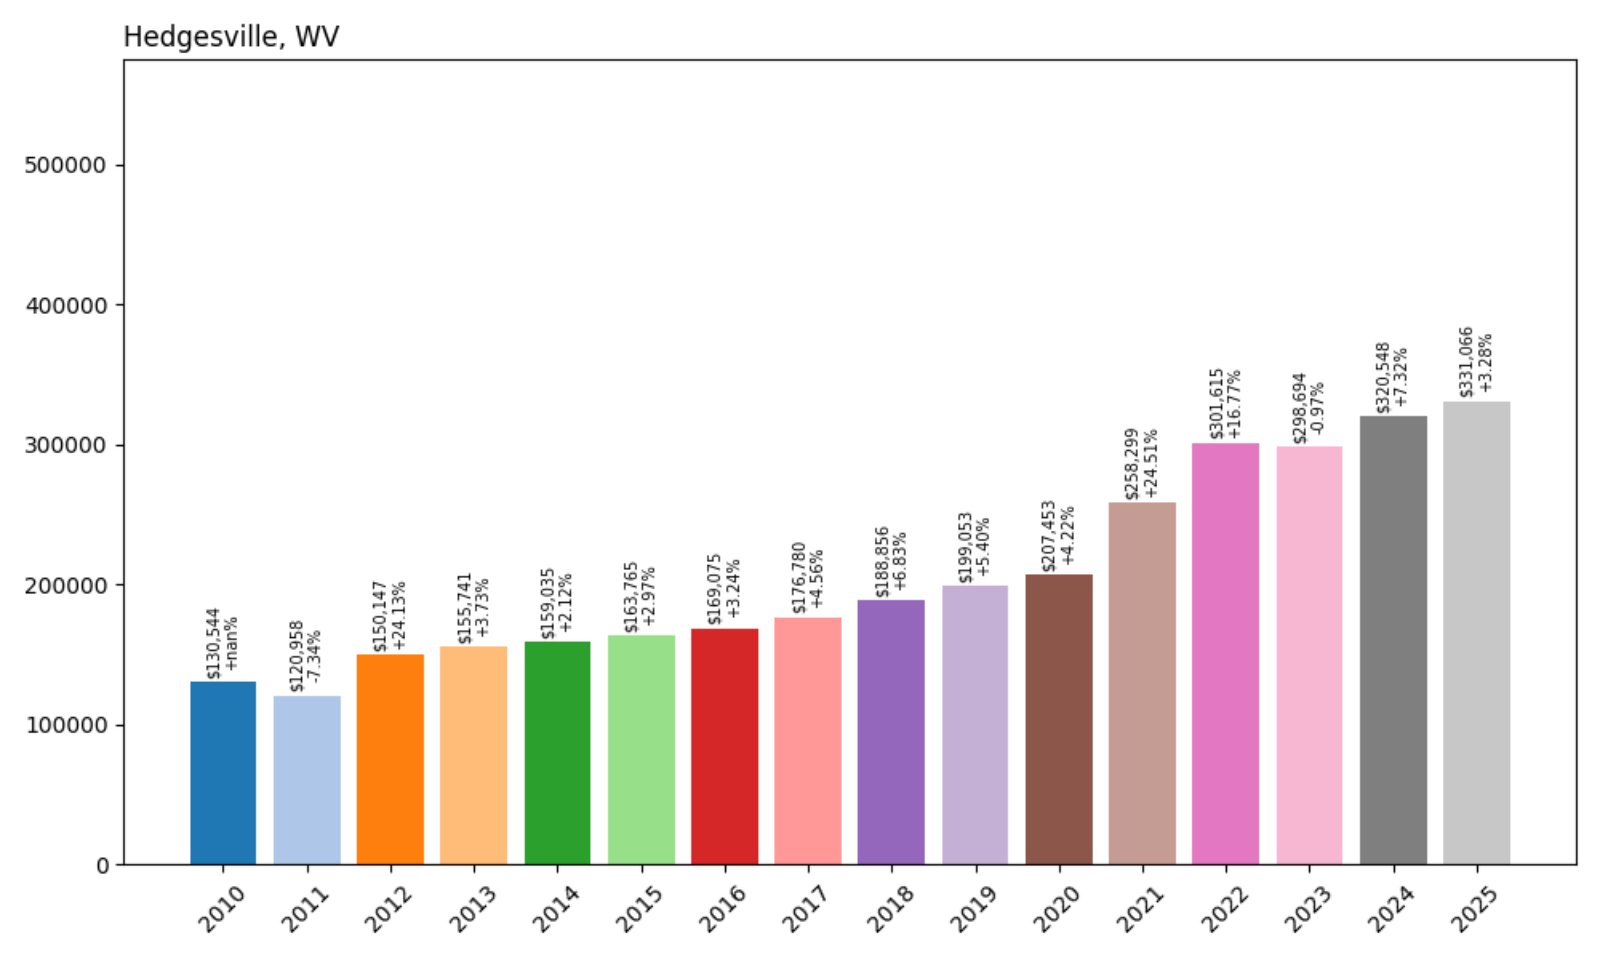
- 2010: $130,544
- 2011: $120,958 (−$9,586, −7.34% from previous year)
- 2012: $150,147 (+$29,188, +24.13% from previous year)
- 2013: $155,741 (+$5,594, +3.73% from previous year)
- 2014: $159,035 (+$3,294, +2.12% from previous year)
- 2015: $163,765 (+$4,730, +2.97% from previous year)
- 2016: $169,075 (+$5,309, +3.24% from previous year)
- 2017: $176,780 (+$7,705, +4.56% from previous year)
- 2018: $188,856 (+$12,076, +6.83% from previous year)
- 2019: $199,053 (+$10,196, +5.40% from previous year)
- 2020: $207,453 (+$8,400, +4.22% from previous year)
- 2021: $258,299 (+$50,846, +24.51% from previous year)
- 2022: $301,615 (+$43,315, +16.77% from previous year)
- 2023: $298,694 (−$2,921, −0.97% from previous year)
- 2024: $320,548 (+$21,854, +7.32% from previous year)
- 2025: $331,066 (+$10,519, +3.28% from previous year)
Hedgesville’s home values have skyrocketed over the past 15 years—more than doubling to reach $331,066 in 2025. Gains were especially sharp from 2020 through 2022, with steady growth since.
Hedgesville – A Big Jump in a Small Town
Located northwest of Martinsburg in Berkeley County, Hedgesville is a quiet town that’s seen major price appreciation thanks to its proximity to growing job markets. Its relative affordability a decade ago set the stage for big percentage gains.
While the town remains small, its price tag is anything but. With attractive rural views and access to regional employment centers, Hedgesville is a compelling case study in West Virginia’s real estate transformation.
8. Davis – 70.1% Home Price Increase Since 2010
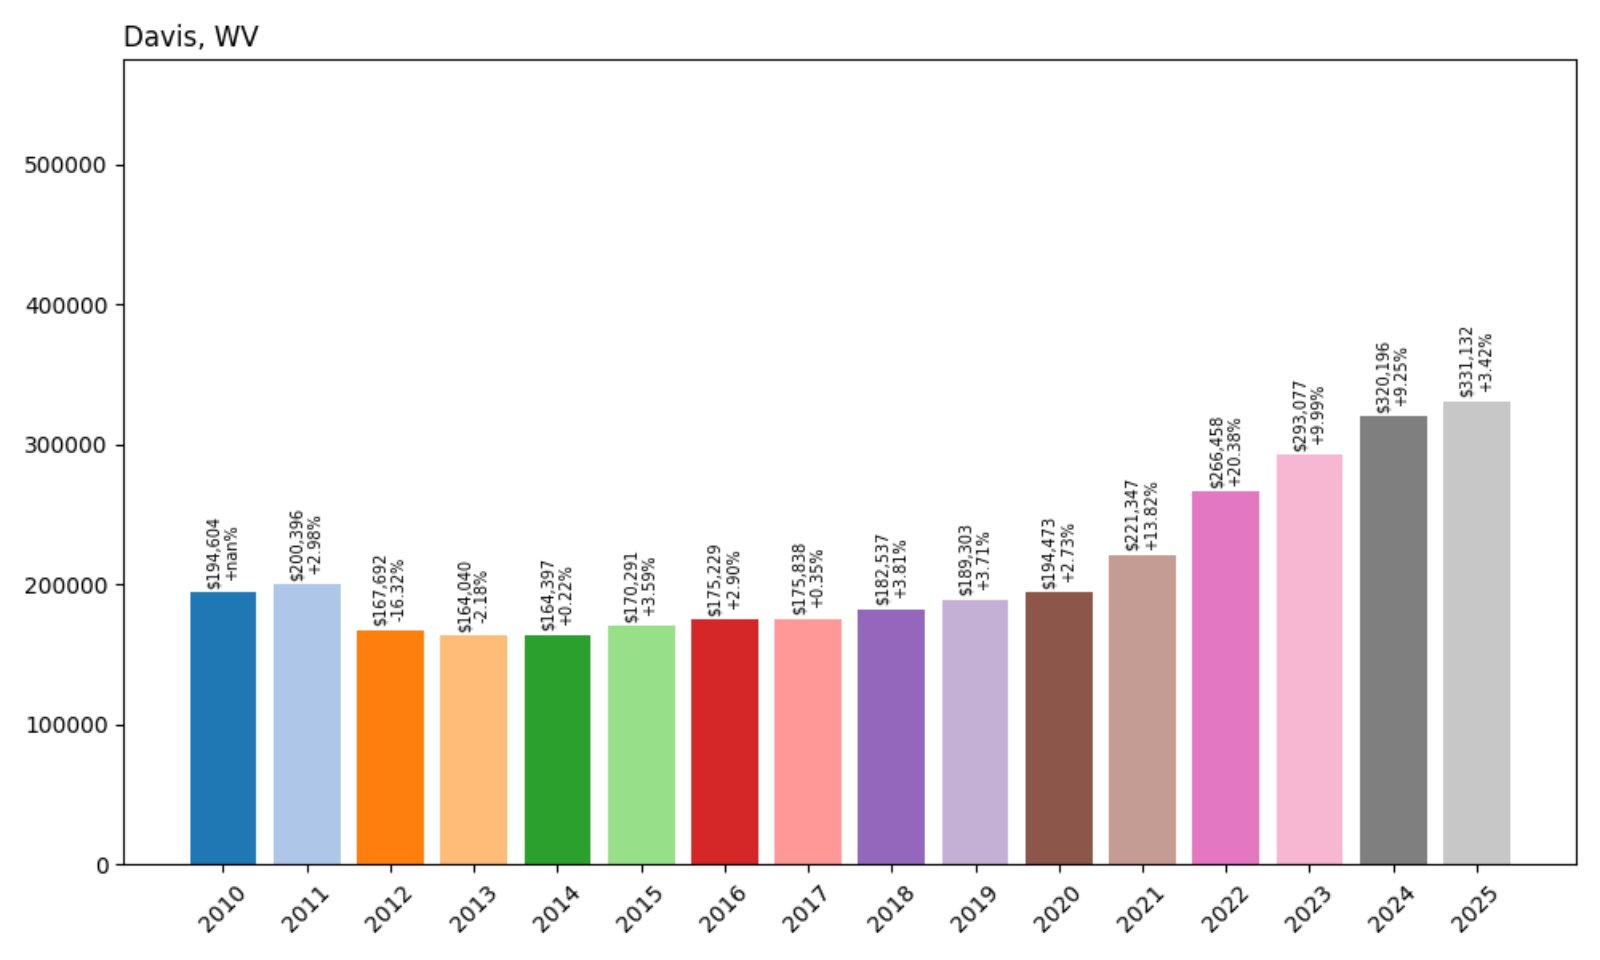
- 2010: $194,604
- 2011: $200,396 (+$5,792, +2.98% from previous year)
- 2012: $167,692 (−$32,703, −16.32% from previous year)
- 2013: $164,040 (−$3,652, −2.18% from previous year)
- 2014: $164,397 (+$357, +0.22% from previous year)
- 2015: $170,291 (+$5,894, +3.59% from previous year)
- 2016: $175,229 (+$4,938, +2.90% from previous year)
- 2017: $175,838 (+$609, +0.35% from previous year)
- 2018: $182,537 (+$6,699, +3.81% from previous year)
- 2019: $189,303 (+$6,766, +3.71% from previous year)
- 2020: $194,473 (+$5,170, +2.73% from previous year)
- 2021: $221,347 (+$26,874, +13.82% from previous year)
- 2022: $266,458 (+$45,111, +20.38% from previous year)
- 2023: $293,077 (+$26,619, +9.99% from previous year)
- 2024: $320,196 (+$27,119, +9.25% from previous year)
- 2025: $331,132 (+$10,936, +3.42% from previous year)
Davis has experienced a 70% increase in home values since 2010, with a striking run of double-digit gains between 2021 and 2024. The 2025 value of $331,132 places it firmly in the state’s top 10.
Davis – Recreation-Focused and Rapidly Rising
Set high in the Allegheny Mountains of Tucker County, Davis is a magnet for outdoor enthusiasts. With attractions like Blackwater Falls State Park and access to hiking, skiing, and biking, the town has developed into a recreational hotspot.
This rising popularity has translated into growing home values. Buyers are drawn to Davis for both vacation homes and permanent relocation, boosting its long-term market strength.
7. Gerrardstown – 114.1% Home Price Increase Since 2011
- 2011: $157,894
- 2012: $153,945 (−$3,949, −2.50% from previous year)
- 2013: $151,413 (−$2,531, −1.64% from previous year)
- 2014: $154,101 (+$2,688, +1.78% from previous year)
- 2015: $168,081 (+$13,980, +9.07% from previous year)
- 2016: $172,830 (+$4,749, +2.83% from previous year)
- 2017: $180,907 (+$8,077, +4.67% from previous year)
- 2018: $196,461 (+$15,554, +8.60% from previous year)
- 2019: $206,006 (+$9,545, +4.86% from previous year)
- 2020: $214,333 (+$8,327, +4.04% from previous year)
- 2021: $266,144 (+$51,811, +24.18% from previous year)
- 2022: $306,796 (+$40,651, +15.27% from previous year)
- 2023: $302,898 (−$3,898, −1.27% from previous year)
- 2024: $325,119 (+$22,221, +7.34% from previous year)
- 2025: $338,108 (+$12,990, +4.00% from previous year)
Gerrardstown’s home values have surged more than 114% since 2011, driven by explosive growth in 2021 and continued upward movement. While 2023 saw a slight dip, the market rebounded quickly in 2024 and 2025, reaching $338,108.
Gerrardstown – Eastern Panhandle Prices Keep Climbing
Gerrardstown, tucked in southern Berkeley County, is part of West Virginia’s increasingly sought-after Eastern Panhandle. Its popularity stems from its semi-rural appeal, proximity to Martinsburg, and access to commuter routes leading into Northern Virginia and Maryland.
Homebuyers have turned to Gerrardstown for newer housing and open space, especially during the remote work era. The area’s significant rise in values mirrors the trends in neighboring commuter communities, putting it squarely in the state’s top tier for home price appreciation.
6. Kearneysville – 114.4% Home Price Increase Since 2010
- 2010: $178,866
- 2011: $170,499 (−$8,367, −4.68% from previous year)
- 2012: $174,870 (+$4,371, +2.56% from previous year)
- 2013: $184,658 (+$9,788, +5.60% from previous year)
- 2014: $192,733 (+$8,075, +4.37% from previous year)
- 2015: $209,872 (+$17,139, +8.89% from previous year)
- 2016: $212,805 (+$2,933, +1.40% from previous year)
- 2017: $224,700 (+$11,895, +5.59% from previous year)
- 2018: $238,312 (+$13,612, +6.06% from previous year)
- 2019: $245,139 (+$6,827, +2.87% from previous year)
- 2020: $256,611 (+$11,472, +4.68% from previous year)
- 2021: $310,808 (+$54,197, +21.12% from previous year)
- 2022: $351,119 (+$40,311, +12.97% from previous year)
- 2023: $349,110 (−$2,009, −0.57% from previous year)
- 2024: $370,741 (+$21,631, +6.20% from previous year)
- 2025: $383,567 (+$12,826, +3.46% from previous year)
Home prices in Kearneysville have more than doubled since 2010, climbing steadily with a notable surge during the pandemic boom. After a small dip in 2023, prices bounced back to reach $383,567 in 2025.
Kearneysville – Commuter Convenience and Rural Appeal
Located in Jefferson County near the Maryland and Virginia borders, Kearneysville offers a unique mix of countryside living and easy access to regional job markets. Its location off Route 9 makes it a popular choice for commuters heading to Martinsburg or the D.C. metro area.
The town’s housing market has grown consistently as remote work and cross-border commuting options expanded. Kearneysville continues to attract new buyers looking for both value and location, making it one of West Virginia’s most in-demand towns by 2025.
5. Harpers Ferry – 95.3% Home Price Increase Since 2010
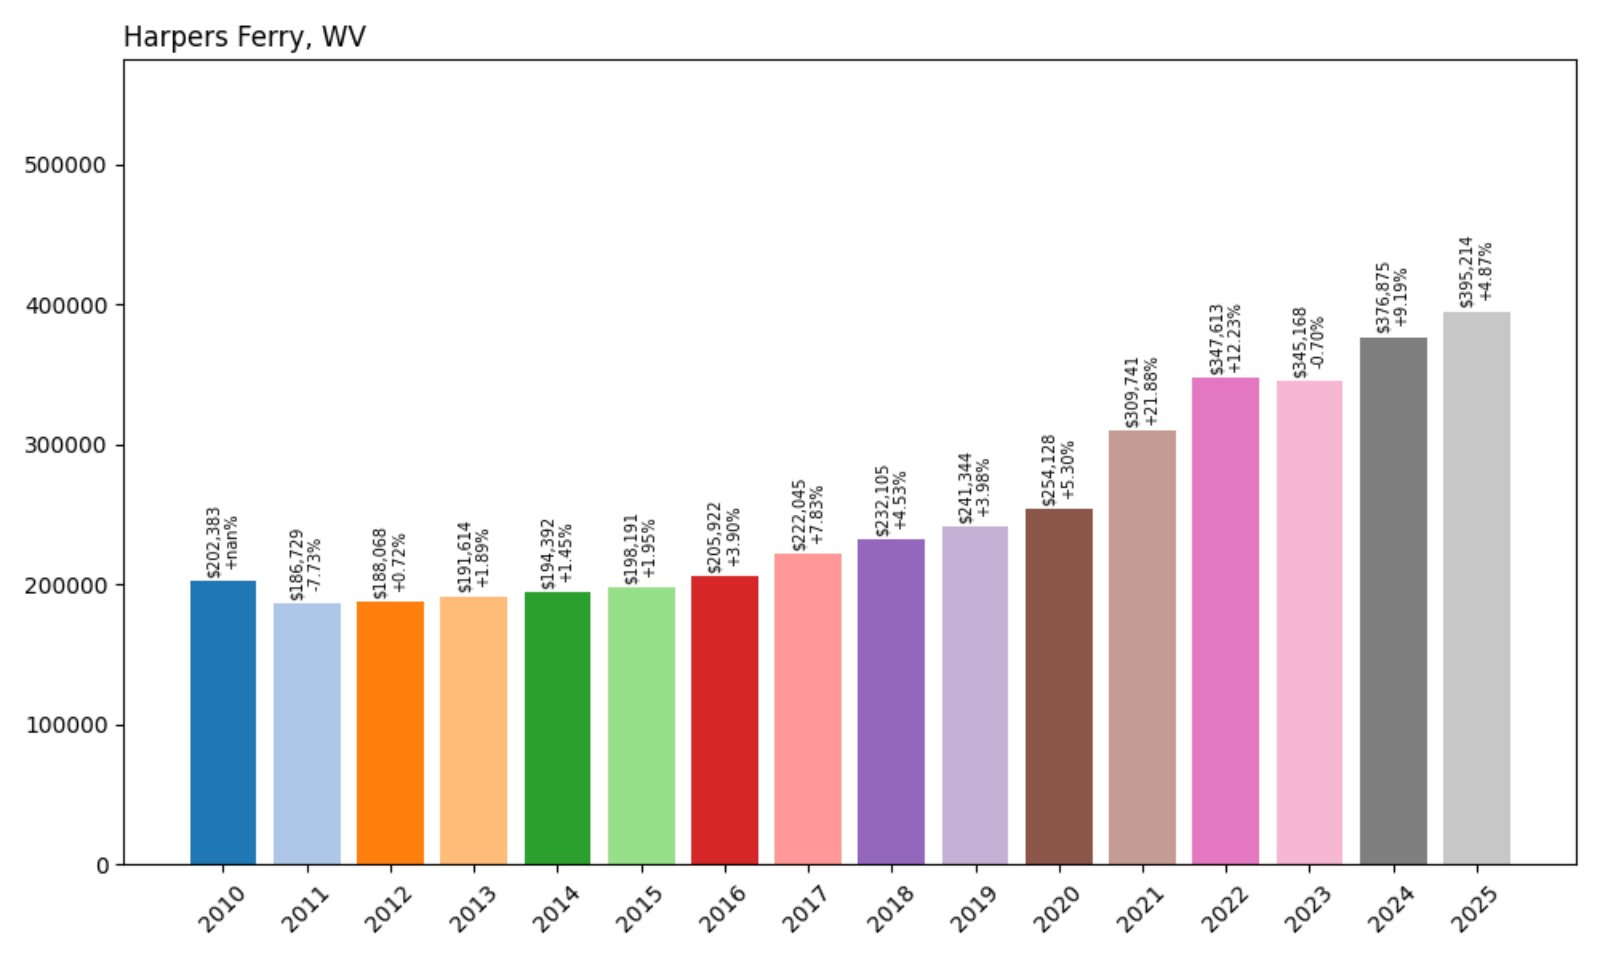
- 2010: $202,383
- 2011: $186,729 (−$15,654, −7.74% from previous year)
- 2012: $188,068 (+$1,339, +0.72% from previous year)
- 2013: $191,614 (+$3,546, +1.89% from previous year)
- 2014: $194,392 (+$2,777, +1.45% from previous year)
- 2015: $198,191 (+$3,800, +1.96% from previous year)
- 2016: $205,922 (+$7,731, +3.90% from previous year)
- 2017: $222,045 (+$16,123, +7.83% from previous year)
- 2018: $232,105 (+$10,061, +4.53% from previous year)
- 2019: $241,344 (+$9,239, +3.98% from previous year)
- 2020: $254,128 (+$12,784, +5.30% from previous year)
- 2021: $309,741 (+$55,613, +21.89% from previous year)
- 2022: $347,613 (+$37,872, +12.23% from previous year)
- 2023: $345,168 (−$2,445, −0.70% from previous year)
- 2024: $376,875 (+$31,707, +9.18% from previous year)
- 2025: $395,214 (+$18,339, +4.87% from previous year)
Harpers Ferry has seen a nearly 95% increase in home values since 2010, with strong annual growth continuing after the pandemic-era housing boom. Prices reached $395,214 by mid-2025.
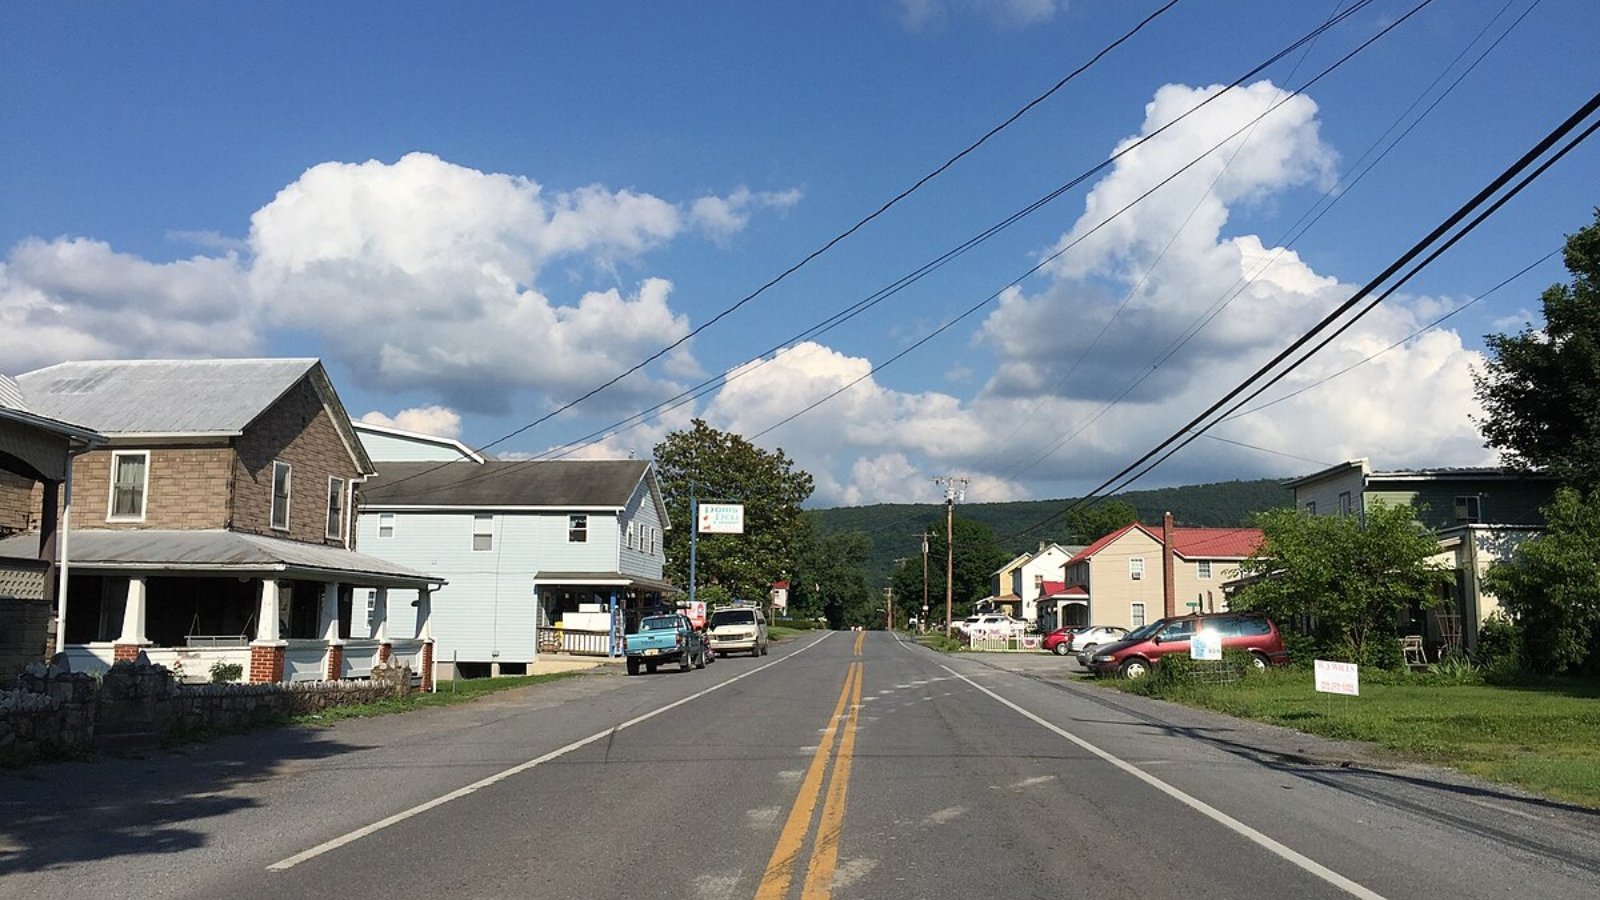
Harpers Ferry – Scenic, Historic, and Still Climbing
Famous for its Civil War history and dramatic setting at the confluence of the Potomac and Shenandoah Rivers, Harpers Ferry has evolved into one of West Virginia’s top-tier housing markets. The town’s blend of natural beauty and historic charm attracts both tourists and permanent residents.
Buyers continue to show strong interest in Harpers Ferry’s homes, pushing values steadily upward despite modest pullbacks in 2023. The town remains a regional standout thanks to its views, trails, and proximity to Northern Virginia commuters.
4. Charles Town – 93.1% Home Price Increase Since 2010
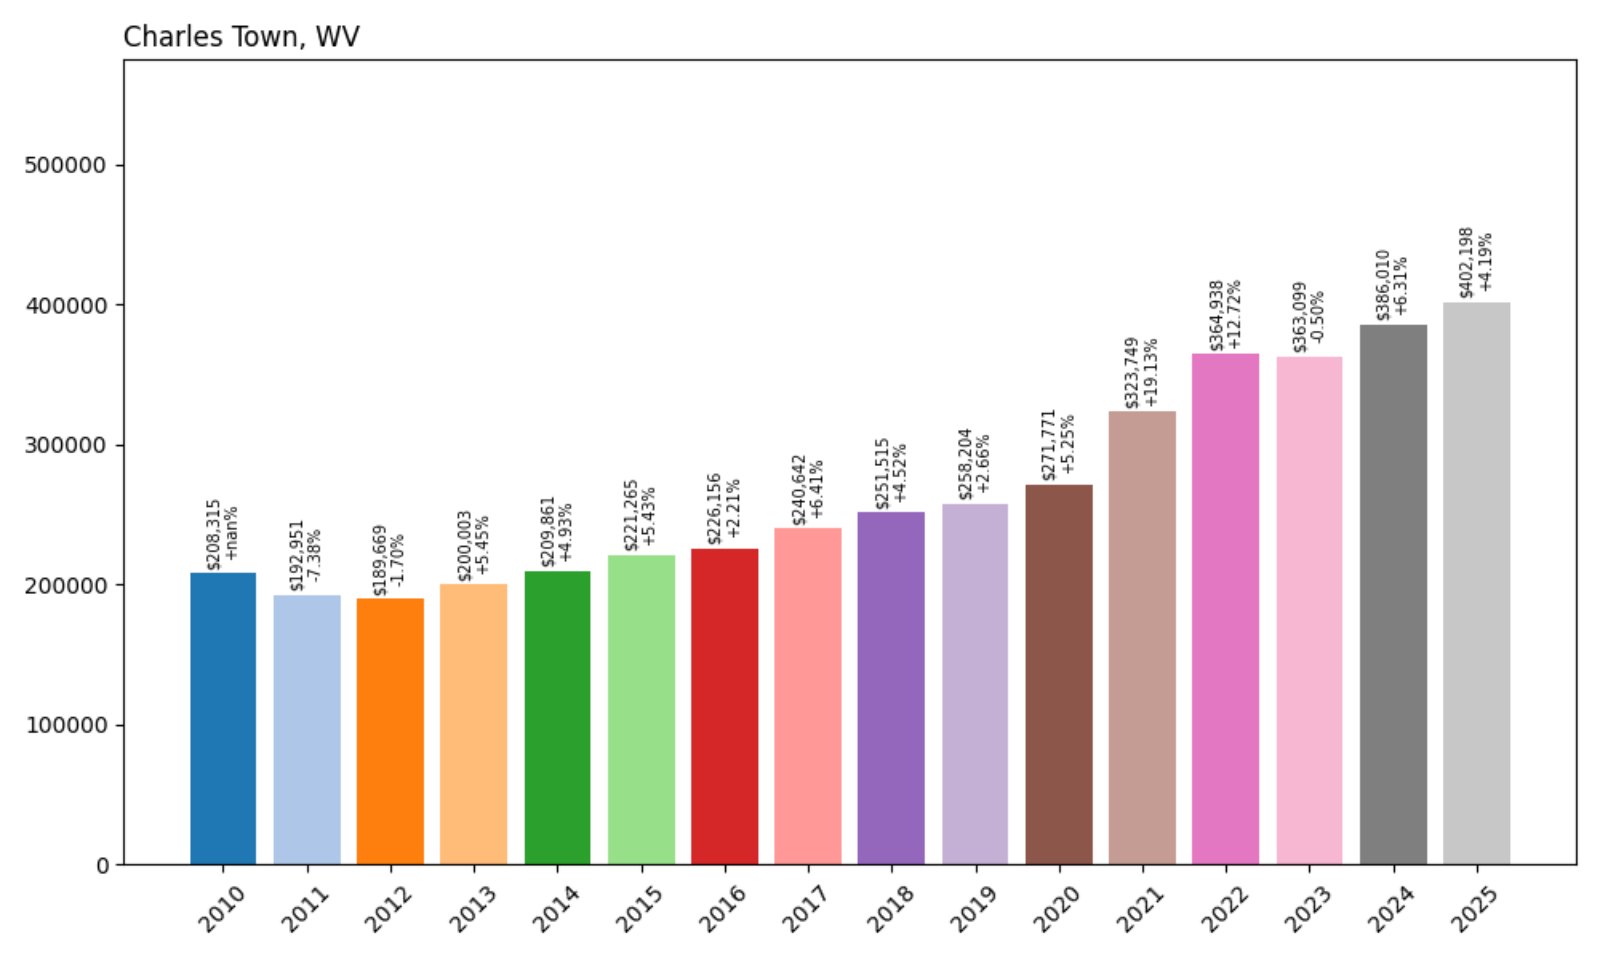
- 2010: $208,315
- 2011: $192,951 (−$15,364, −7.38% from previous year)
- 2012: $189,669 (−$3,282, −1.70% from previous year)
- 2013: $200,003 (+$10,334, +5.45% from previous year)
- 2014: $209,861 (+$9,857, +4.93% from previous year)
- 2015: $221,265 (+$11,405, +5.44% from previous year)
- 2016: $226,156 (+$4,891, +2.21% from previous year)
- 2017: $240,642 (+$14,486, +6.41% from previous year)
- 2018: $251,515 (+$10,874, +4.52% from previous year)
- 2019: $258,204 (+$6,689, +2.66% from previous year)
- 2020: $271,771 (+$13,567, +5.26% from previous year)
- 2021: $323,749 (+$51,978, +19.13% from previous year)
- 2022: $364,938 (+$41,189, +12.73% from previous year)
- 2023: $363,099 (−$1,839, −0.50% from previous year)
- 2024: $386,010 (+$22,911, +6.31% from previous year)
- 2025: $402,198 (+$16,188, +4.19% from previous year)
Charles Town has experienced a 93% increase in home values over the past 15 years, with price appreciation driven by both steady demand and its Eastern Panhandle location. The 2025 price stands at just over $402,000.
Charles Town – Historic Appeal Meets Modern Growth
As the county seat of Jefferson County, Charles Town offers a mix of colonial charm and 21st-century housing. With a walkable downtown, historic landmarks, and access to Route 9 and commuter rail, it attracts a mix of professionals and families.
Its housing growth has remained robust, with price increases even in years when nearby towns saw flattening. Charles Town’s market strength reflects a broader trend toward small cities with heritage, character, and strong regional connections.
3. Shenandoah Junction – 111.6% Home Price Increase Since 2010
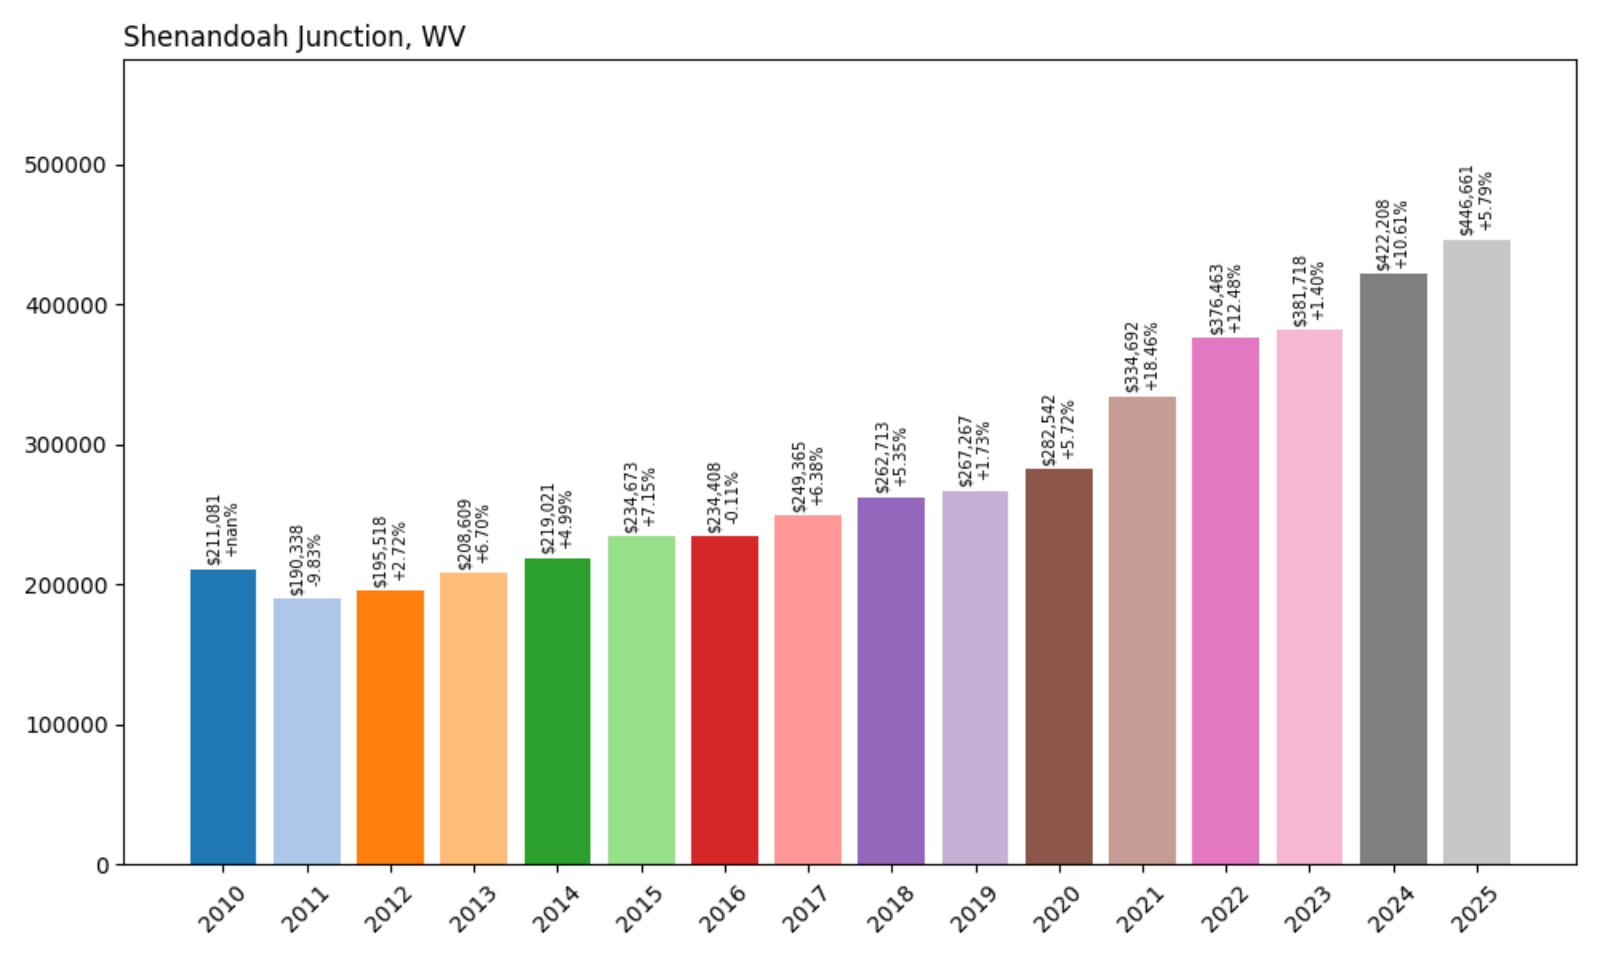
- 2010: $211,081
- 2011: $190,338 (−$20,743, −9.83% from previous year)
- 2012: $195,518 (+$5,181, +2.72% from previous year)
- 2013: $208,609 (+$13,091, +6.70% from previous year)
- 2014: $219,021 (+$10,412, +4.99% from previous year)
- 2015: $234,673 (+$15,652, +7.15% from previous year)
- 2016: $234,408 (−$265, −0.11% from previous year)
- 2017: $249,365 (+$14,957, +6.38% from previous year)
- 2018: $262,713 (+$13,348, +5.35% from previous year)
- 2019: $267,267 (+$4,554, +1.73% from previous year)
- 2020: $282,542 (+$15,275, +5.72% from previous year)
- 2021: $334,692 (+$52,150, +18.46% from previous year)
- 2022: $376,463 (+$41,771, +12.48% from previous year)
- 2023: $381,718 (+$5,255, +1.40% from previous year)
- 2024: $422,208 (+$40,490, +10.61% from previous year)
- 2025: $446,661 (+$24,453, +5.79% from previous year)
Shenandoah Junction has more than doubled in value since 2010, with home prices rising 112% over the 15-year span. Demand has surged in recent years, driving 2025 values to nearly $447,000.
Shenandoah Junction – Small Size, Big Price Tag
This quiet unincorporated community punches above its weight in the housing market. Located near Charles Town and Harpers Ferry, it benefits from rail access and rural surroundings, making it especially appealing to buyers wanting space and quiet near transit options.
Despite its small footprint, Shenandoah Junction has seen some of the fastest and steepest price growth in the state, likely due to limited housing inventory and rising interest in the Jefferson County area.
2. Summit Point – 64.6% Home Price Increase Since 2019
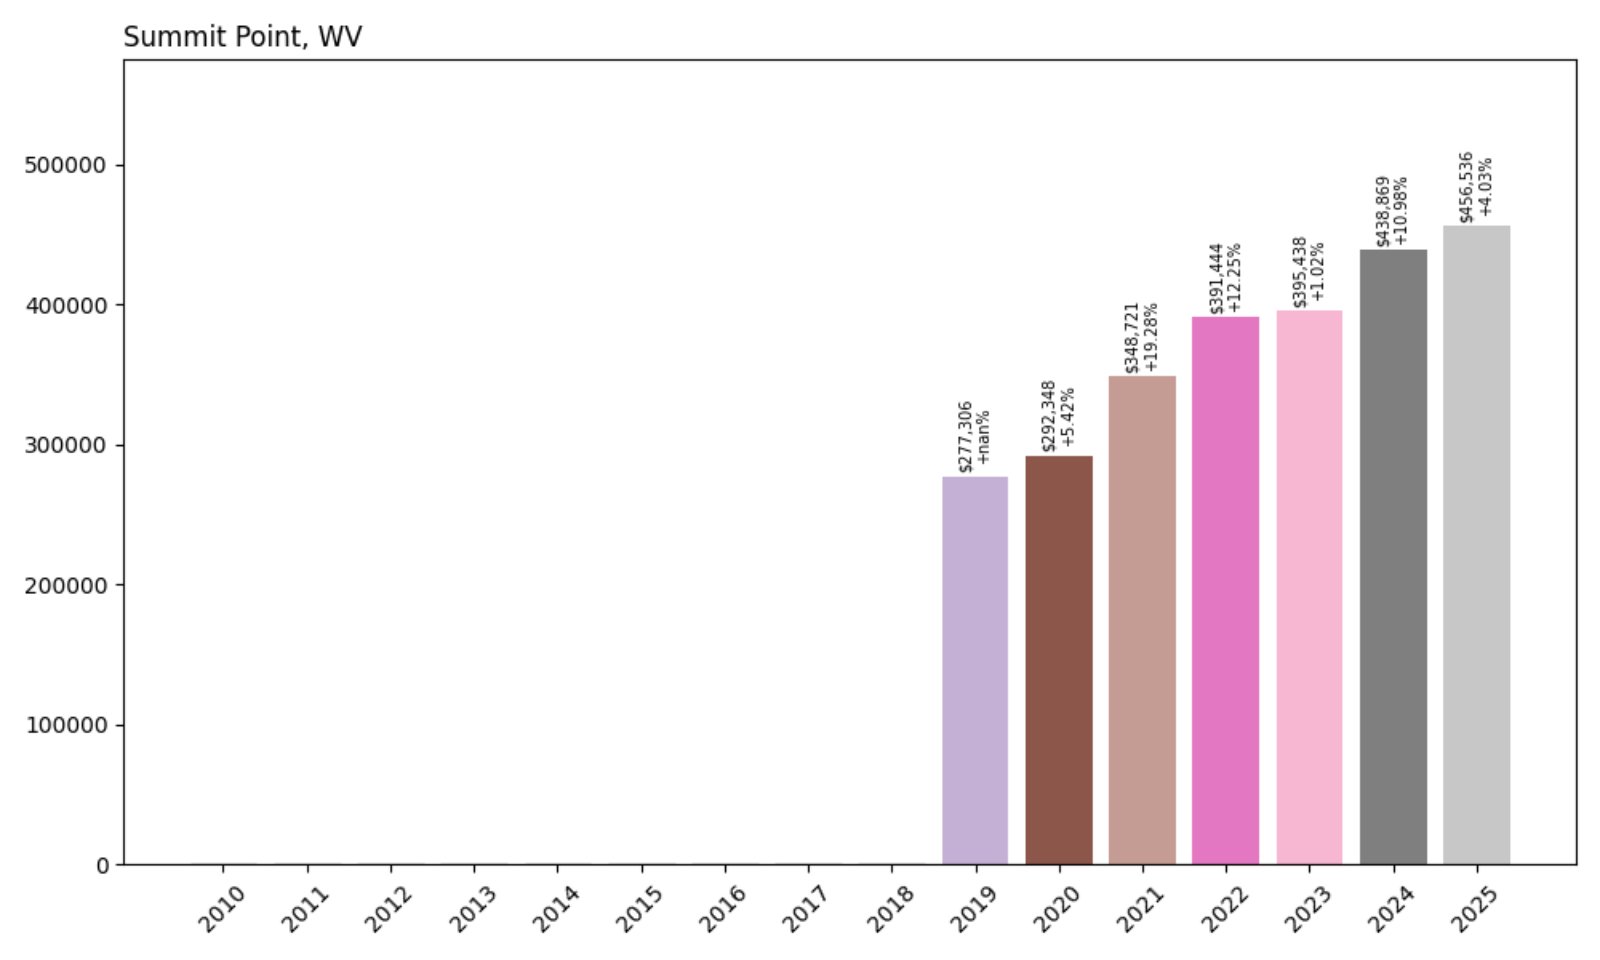
- 2019: $277,306
- 2020: $292,348 (+$15,042, +5.43% from previous year)
- 2021: $348,721 (+$56,373, +19.28% from previous year)
- 2022: $391,444 (+$42,723, +12.25% from previous year)
- 2023: $395,438 (+$3,994, +1.02% from previous year)
- 2024: $438,869 (+$43,431, +10.99% from previous year)
- 2025: $456,536 (+$17,667, +4.03% from previous year)
Summit Point’s home values have jumped 64.6% since 2019, with growth accelerating during and after the pandemic. As of 2025, the town has climbed into the #2 spot, with homes averaging $456,536.
Summit Point – A Fast Climb to the Top
Summit Point, another Jefferson County town, has seen its market skyrocket in just a few years. While data only begins in 2019, the trajectory has been sharp and steady, with large annual gains that reflect strong buyer interest and limited supply.
Its strategic location near commuter routes and expanding nearby markets has turned Summit Point into a high-demand area. Though unincorporated, it commands some of the state’s highest real estate prices, drawing attention for its price growth and investment appeal.
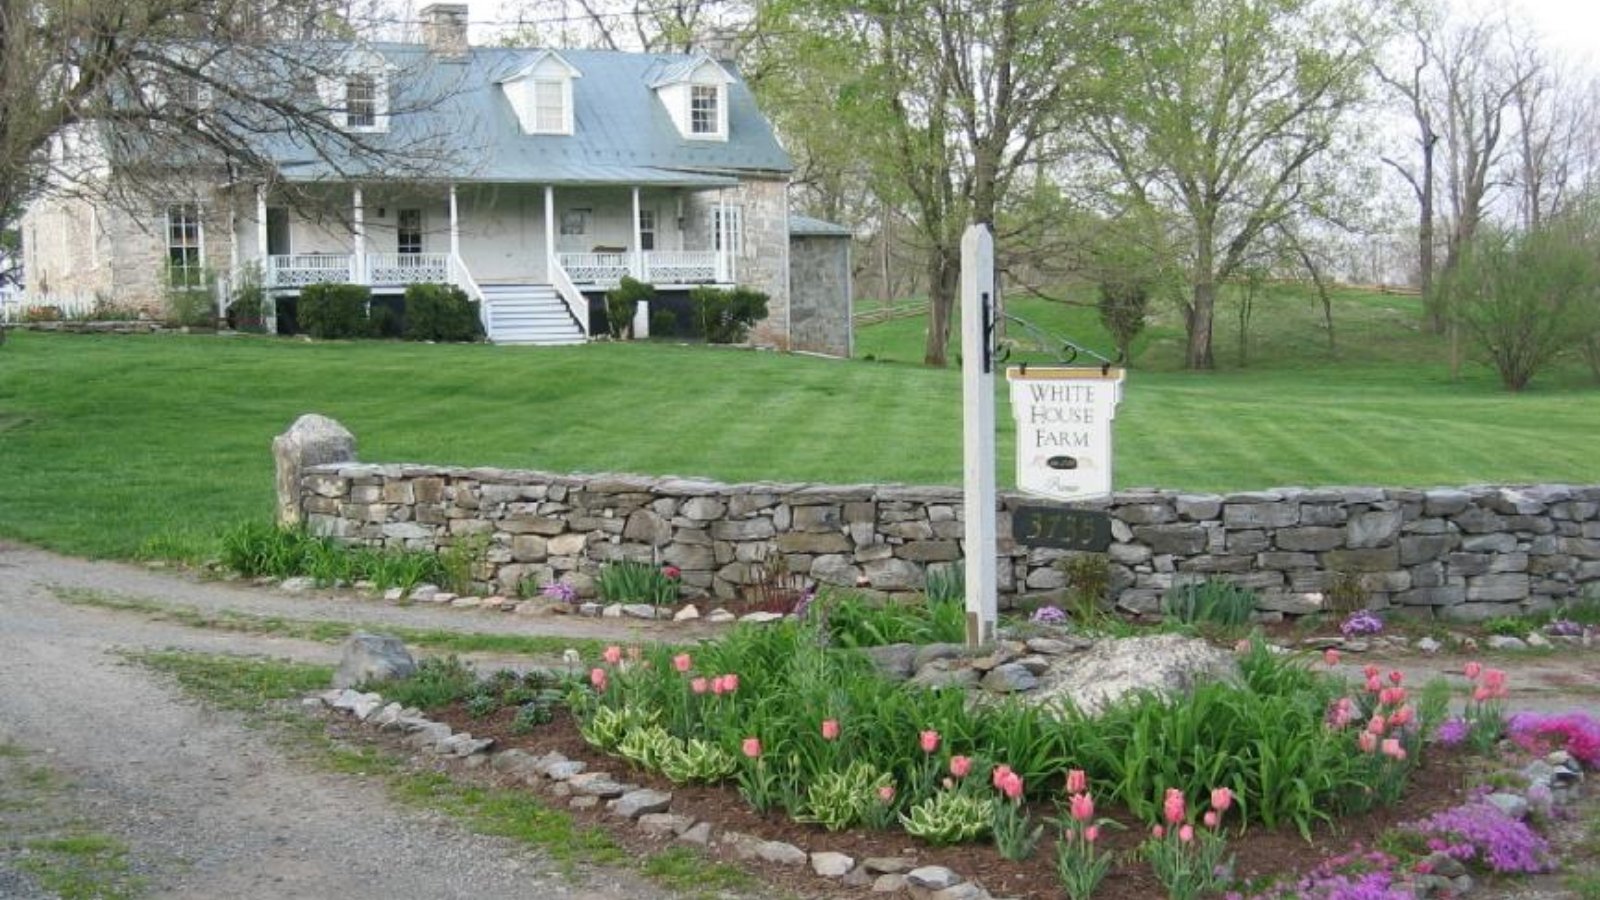
1. Shepherdstown – 84.9% Home Price Increase Since 2010
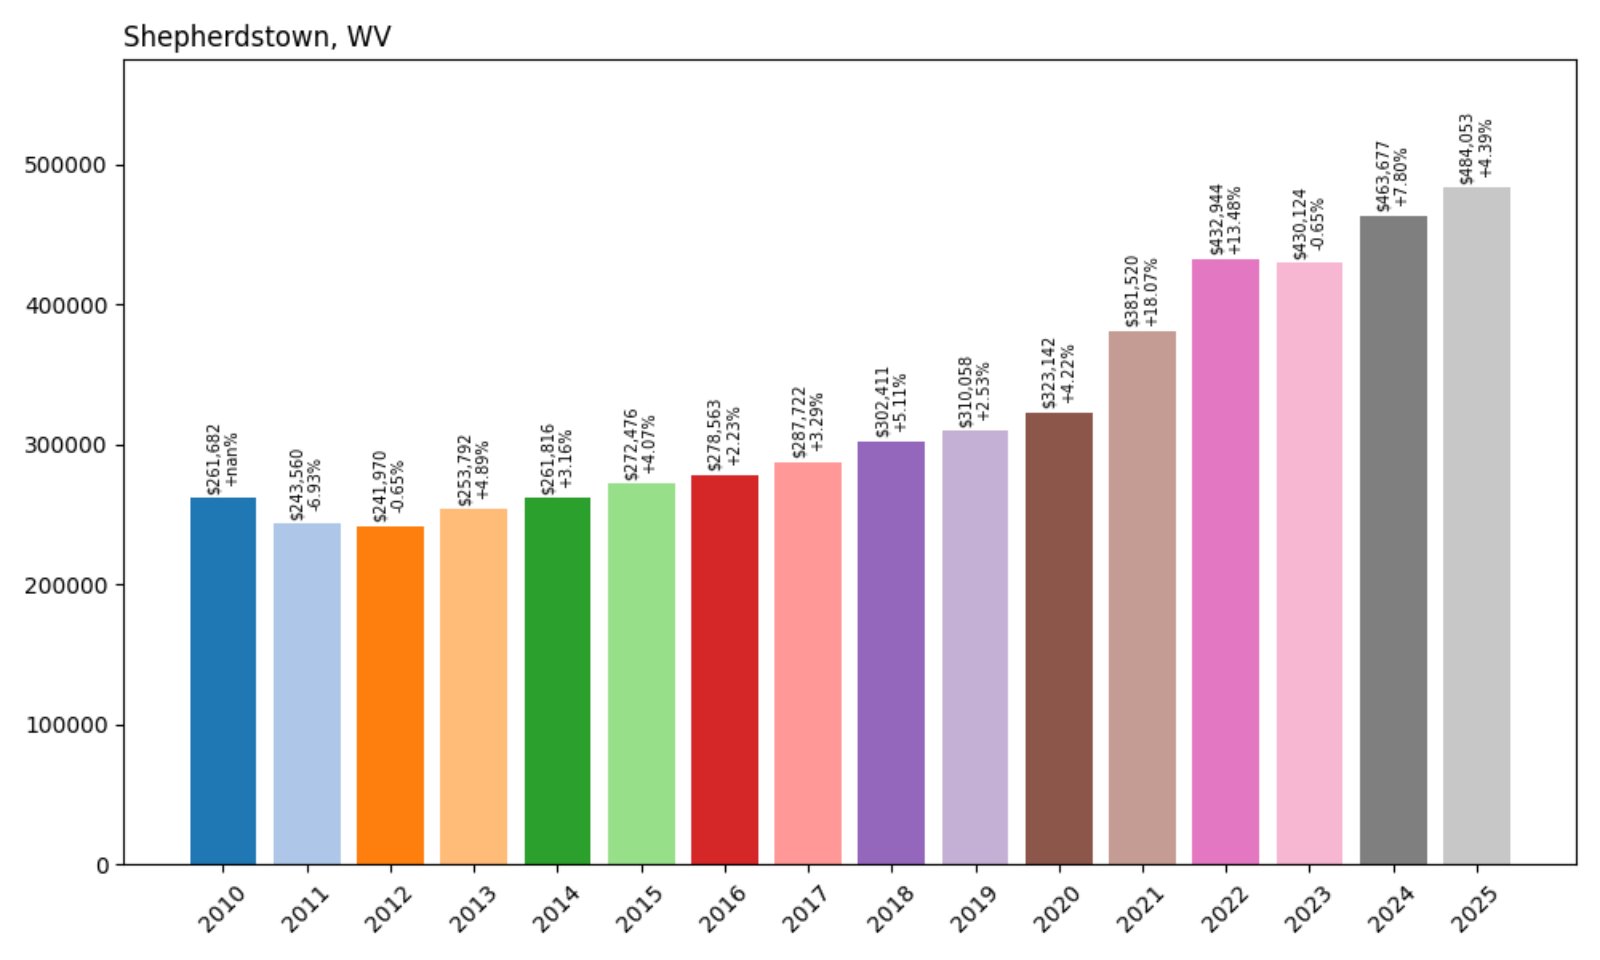
- 2010: $261,682
- 2011: $243,560 (−$18,122, −6.93% from previous year)
- 2012: $241,970 (−$1,591, −0.65% from previous year)
- 2013: $253,792 (+$11,822, +4.89% from previous year)
- 2014: $261,816 (+$8,024, +3.16% from previous year)
- 2015: $272,476 (+$10,660, +4.07% from previous year)
- 2016: $278,563 (+$6,088, +2.23% from previous year)
- 2017: $287,722 (+$9,158, +3.29% from previous year)
- 2018: $302,411 (+$14,689, +5.10% from previous year)
- 2019: $310,058 (+$7,646, +2.53% from previous year)
- 2020: $323,142 (+$13,085, +4.22% from previous year)
- 2021: $381,520 (+$58,378, +18.07% from previous year)
- 2022: $432,944 (+$51,423, +13.47% from previous year)
- 2023: $430,124 (−$2,820, −0.65% from previous year)
- 2024: $463,677 (+$33,553, +7.80% from previous year)
- 2025: $484,053 (+$20,376, +4.39% from previous year)
Shepherdstown has seen an 84.9% rise in home values since 2010, earning the top spot as the most expensive town in West Virginia in 2025. With a current average price of $484,053, it leads the state by a clear margin.
Shepherdstown – West Virginia’s Most Expensive Market
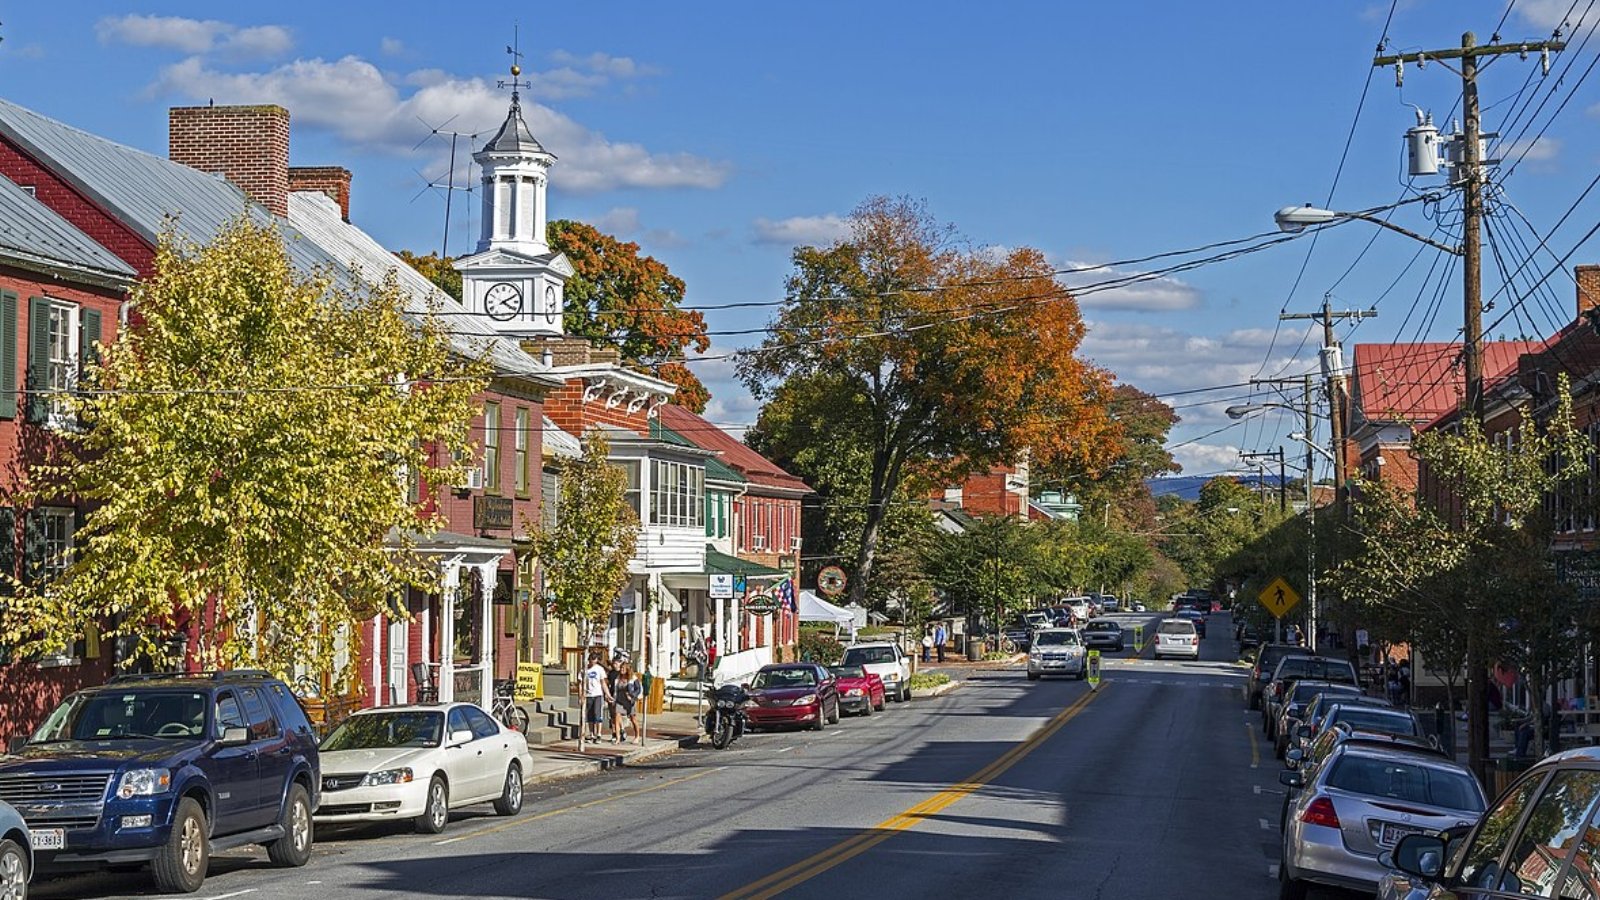
Located along the Potomac River, Shepherdstown is a historic college town with a thriving cultural scene. Home to Shepherd University and a vibrant arts community, the town blends academic energy with small-town charm, attracting buyers seeking lifestyle as much as location.
Its real estate market has consistently climbed, particularly over the past five years. With proximity to D.C. and a walkable downtown filled with shops and cafes, Shepherdstown tops the list in 2025 as West Virginia’s priciest town for homebuyers.


