
🔥 Would you like to save this?
According to the Zillow Home Value Index, South Carolina has seen home prices skyrocket in a number of its towns over the past 15 years. From beachside communities to inland retreats, some areas have become significantly more expensive, reflecting broader market shifts and regional desirability. This roundup explores the 21 towns in South Carolina with the highest home values in 2025, based on long-term trends and recent surges in price. While some towns have experienced relatively steady growth, others have seen dramatic leaps—especially in recent years.
Each town’s section breaks down its price evolution over time and highlights what makes it notable today. Whether you’re a homeowner, potential buyer, or simply curious, these insights help shed light on where South Carolina’s real estate market is heading.
In order to come up with the very specific design ideas, we create most designs with the assistance of state-of-the-art AI interior design software. Also, assume links that take you off the site are affiliate links such as links to Amazon. this means we may earn a commission if you buy something.
21. Ravenel – 171% Home Price Increase Since 2012

- 2010: $186,021
- 2011: $176,359 (-$9,662, -5.19% from previous year)
- 2012: $168,351 (-$8,008, -4.54% from previous year)
- 2013: $175,547 (+$7,196, +4.27% from previous year)
- 2014: $199,010 (+$23,462, +13.37% from previous year)
- 2015: $216,434 (+$17,424, +8.76% from previous year)
- 2016: $244,852 (+$28,418, +13.13% from previous year)
- 2017: $262,306 (+$17,454, +7.13% from previous year)
- 2018: $275,899 (+$13,592, +5.18% from previous year)
- 2019: $283,278 (+$7,379, +2.67% from previous year)
- 2020: N/A
- 2021: $362,109
- 2022: $428,983 (+$66,874, +18.47% from previous year)
- 2023: $459,872 (+$30,889, +7.20% from previous year)
- 2024: $480,761 (+$20,889, +4.54% from previous year)
- 2025: $503,599 (+$22,838, +4.75% from previous year)
Home prices in Ravenel have risen substantially since 2012, increasing by over 171% to reach $503,599 in 2025. After a dip in the early 2010s, the town’s housing market rebounded with consistent yearly growth. Notably, the largest surge occurred between 2020 and 2022, where prices jumped from under $300,000 to over $360,000, with momentum continuing in the following years.
Ravenel – Small Town Charm with Big Growth

Located just southwest of Charleston, Ravenel is a small town that has experienced significant development in recent years. It appeals to homebuyers seeking more space and privacy while still staying within commuting distance of the city. The area’s blend of rural landscapes and accessibility to coastal amenities may explain the increasing demand.
Ravenel’s rising property values reflect wider growth patterns in Lowcountry real estate. While still more affordable than some nearby locations, its steady upward trajectory signals investor and buyer interest. The town’s proximity to marshlands and highways likely contributes to its growing appeal, offering a mix of tranquility and convenience.
20. Bluffton – 131% Home Price Increase Since 2012

- 2010: $219,977
- 2011: $202,846 (-$17,131, -7.79% from previous year)
- 2012: $193,302 (-$9,544, -4.70% from previous year)
- 2013: $204,654 (+$11,352, +5.87% from previous year)
- 2014: $224,064 (+$19,410, +9.48% from previous year)
- 2015: $249,341 (+$25,277, +11.28% from previous year)
- 2016: $283,516 (+$34,175, +13.71% from previous year)
- 2017: $316,049 (+$32,533, +11.47% from previous year)
- 2018: $345,623 (+$29,574, +9.36% from previous year)
- 2019: $370,442 (+$24,819, +7.18% from previous year)
- 2020: N/A
- 2021: $424,166
- 2022: $471,733 (+$47,567, +11.21% from previous year)
- 2023: $494,188 (+$22,455, +4.76% from previous year)
- 2024: $503,020 (+$8,832, +1.79% from previous year)
- 2025: $508,698 (+$5,678, +1.13% from previous year)
Bluffton has seen prices more than double since 2012, climbing from just under $200,000 to over $500,000. Rapid gains occurred between 2015 and 2017, where the town added nearly $100,000 to its average home value. Price growth has slowed somewhat in recent years, but overall trends show strong appreciation.
Bluffton – Coastal Living Meets Rapid Development

Bluffton sits just inland from Hilton Head Island, making it a sought-after destination for those wanting coastal access without the island premium. It has become a magnet for retirees and remote workers, with many drawn to its scenic riverside setting and rich Southern charm.
Increased investment in infrastructure and residential development has supported the town’s growth. The vibrant downtown and access to outdoor recreation—like kayaking on the May River—make Bluffton a standout. Its balance of affordability and proximity to both nature and amenities has made it one of South Carolina’s real estate success stories.
19. Hollywood – 209% Home Price Increase Since 2012

- 2010: $201,133
- 2011: $181,885 (-$19,248, -9.57% from previous year)
- 2012: $170,397 (-$11,488, -6.32% from previous year)
- 2013: $189,406 (+$19,009, +11.16% from previous year)
- 2014: $211,893 (+$22,487, +11.87% from previous year)
- 2015: $237,616 (+$25,723, +12.14% from previous year)
- 2016: $272,537 (+$34,921, +14.70% from previous year)
- 2017: $302,628 (+$30,091, +11.04% from previous year)
- 2018: $331,549 (+$28,921, +9.56% from previous year)
- 2019: $353,810 (+$22,261, +6.71% from previous year)
- 2020: N/A
- 2021: $404,582
- 2022: $479,128 (+$74,546, +18.43% from previous year)
- 2023: $502,987 (+$23,859, +4.98% from previous year)
- 2024: $515,574 (+$12,587, +2.50% from previous year)
- 2025: $525,727 (+$10,153, +1.97% from previous year)
Hollywood’s property market has made remarkable gains since 2012, climbing over 200% in value. Most of the acceleration happened between 2013 and 2016, with double-digit annual increases. Though recent growth has leveled, the 2025 value of $525,727 still places it among South Carolina’s more expensive towns.
Hollywood – Growth on Charleston’s Quiet Fringe

Hollywood, South Carolina is a serene town nestled along the Stono River, just outside Charleston. It offers a slower pace of life, with horse farms, waterways, and spacious lots attracting residents looking for both space and proximity to the city.
With limited commercial sprawl and abundant green space, Hollywood’s desirability has increased as nearby urban areas grow. New builds and modern amenities have supported its upward trend, even as it retains a rural feel. These elements have fueled long-term demand, pushing property values steadily upward.
18. Fort Mill – 137% Home Price Increase Since 2012

- 2010: $238,420
- 2011: $228,457 (-$9,963, -4.18% from previous year)
- 2012: $226,473 (-$1,983, -0.87% from previous year)
- 2013: $240,809 (+$14,336, +6.33% from previous year)
- 2014: $263,176 (+$22,367, +9.29% from previous year)
- 2015: $277,454 (+$14,278, +5.43% from previous year)
- 2016: $296,631 (+$19,177, +6.91% from previous year)
- 2017: $306,951 (+$10,320, +3.48% from previous year)
- 2018: $327,624 (+$20,673, +6.74% from previous year)
- 2019: $350,889 (+$23,265, +7.10% from previous year)
- 2020: N/A
- 2021: $408,701
- 2022: $476,774 (+$68,073, +16.66% from previous year)
- 2023: $506,639 (+$29,865, +6.26% from previous year)
- 2024: $524,468 (+$17,829, +3.52% from previous year)
- 2025: $538,658 (+$14,190, +2.70% from previous year)
Fort Mill has seen a consistent climb in values since 2012, when prices hovered just above $226,000. With a 2025 value of over $538,000, this Charlotte-area suburb has become one of South Carolina’s most expensive housing markets. Strong year-over-year gains were especially noticeable from 2020 onward.
Fort Mill – A Charlotte Suburb on the Rise

Positioned just over the border from North Carolina, Fort Mill is a favorite among commuters to Charlotte. The town has invested heavily in its infrastructure and school systems, earning high rankings in regional quality-of-life indexes.
Its combination of small-town charm, suburban amenities, and job access has made it a magnet for families and professionals alike. Fort Mill’s steady appreciation underscores the impact of metro expansion on surrounding communities, and its upward trajectory appears far from over.
17. Salem – 169% Home Price Increase Since 2012

- 2010: $200,177
- 2011: $199,809 (-$368, -0.18% from previous year)
- 2012: $200,485 (+$676, +0.34% from previous year)
- 2013: $207,467 (+$6,982, +3.48% from previous year)
- 2014: $208,824 (+$1,357, +0.65% from previous year)
- 2015: $209,100 (+$276, +0.13% from previous year)
- 2016: $209,565 (+$465, +0.22% from previous year)
- 2017: $216,516 (+$6,951, +3.32% from previous year)
- 2018: $227,860 (+$11,344, +5.24% from previous year)
- 2019: $239,769 (+$11,909, +5.23% from previous year)
- 2020: N/A
- 2021: $274,480
- 2022: $305,589 (+$31,109, +11.33% from previous year)
- 2023: $323,741 (+$18,152, +5.94% from previous year)
- 2024: $347,007 (+$23,266, +7.19% from previous year)
- 2025: $538,860 (+$191,853, +55.28% from previous year)
Salem’s most dramatic price shift happened recently, with a massive 55% increase between 2024 and 2025 alone. After years of modest growth, the sudden spike propelled it to over $538,000, putting it firmly on the map as one of South Carolina’s most expensive towns this year.
Salem – Quiet Lakeside Boomtown

Located in the northwestern corner of the state near Lake Keowee, Salem offers sweeping natural views, access to water activities, and a peaceful setting. The area has drawn interest from both retirees and second-home buyers.
This recent explosion in value may reflect the growing appeal of lakefront living in upstate South Carolina. New construction, lifestyle amenities, and proximity to the mountains make Salem a standout for those seeking scenic tranquility—yet the recent growth suggests it’s no longer a well-kept secret.
16. Pawleys Island – 87% Home Price Increase Since 2012

- 2010: $338,831
- 2011: $312,411 (-$26,420, -7.80% from previous year)
- 2012: $290,736 (-$21,675, -6.94% from previous year)
- 2013: $304,265 (+$13,529, +4.65% from previous year)
- 2014: $320,653 (+$16,388, +5.38% from previous year)
- 2015: $345,269 (+$24,616, +7.68% from previous year)
- 2016: $375,651 (+$30,382, +8.80% from previous year)
- 2017: $395,992 (+$20,341, +5.41% from previous year)
- 2018: $421,430 (+$25,438, +6.42% from previous year)
- 2019: $439,806 (+$18,376, +4.36% from previous year)
- 2020: N/A
- 2021: $477,459
- 2022: $513,697 (+$36,238, +7.59% from previous year)
- 2023: $534,036 (+$20,339, +3.96% from previous year)
- 2024: $540,229 (+$6,193, +1.16% from previous year)
- 2025: $543,644 (+$3,415, +0.63% from previous year)
Pawleys Island home values have nearly doubled since 2012, climbing from around $290,000 to nearly $544,000. Most of the growth occurred steadily between 2013 and 2022, though price increases have tapered off slightly in the last two years.
Pawleys Island – Historic Coastal Appeal Fuels Long-Term Growth

Pawleys Island is one of the oldest beach resorts on the East Coast, and its mix of historic homes and coastal charm continues to attract buyers. Situated just south of Myrtle Beach, it offers quiet beaches, upscale dining, and a laid-back lifestyle that has gained popularity with second-home buyers and retirees.
The area is known for its preserved marshlands and classic beachfront cottages. Recent modest growth in home prices suggests the market may be stabilizing, but its long-term trajectory points to continued desirability—particularly for those who appreciate a less commercialized coastal retreat.
15. Charleston – 146% Home Price Increase Since 2012

🔥 Would you like to save this?
- 2010: $226,894
- 2011: $211,112 (-$15,782, -6.96% from previous year)
- 2012: $206,052 (-$5,060, -2.40% from previous year)
- 2013: $228,274 (+$22,222, +10.79% from previous year)
- 2014: $247,815 (+$19,541, +8.56% from previous year)
- 2015: $267,440 (+$19,625, +7.92% from previous year)
- 2016: $296,857 (+$29,417, +11.00% from previous year)
- 2017: $315,651 (+$18,794, +6.33% from previous year)
- 2018: $335,623 (+$19,972, +6.33% from previous year)
- 2019: $342,443 (+$6,820, +2.03% from previous year)
- 2020: N/A
- 2021: $396,242
- 2022: $486,273 (+$90,031, +22.72% from previous year)
- 2023: $521,576 (+$35,303, +7.26% from previous year)
- 2024: $572,485 (+$50,909, +9.76% from previous year)
- 2025: $588,916 (+$16,431, +2.87% from previous year)
Charleston’s home values have more than doubled since 2012, reflecting the city’s rapid transformation and broad appeal. Prices shot past the half-million mark in 2023, and while growth has slowed slightly, the city remains one of the state’s hottest real estate markets.
Charleston – Historic City, Modern Boom

Charleston’s historic architecture, vibrant culture, and booming economy have turned it into a prime destination for both residents and investors. Its food scene, art galleries, and walkable downtown make it a unique Southern hub that continues to grow in popularity.
The city has seen expanded development along its waterfronts and a steady influx of remote workers and retirees. With limited land and strong demand, home prices are likely to remain high. Charleston exemplifies the type of market where historical charm meets modern growth.
14. Tega Cay – 107% Home Price Increase Since 2012

- 2010: $256,628
- 2011: $246,779 (-$9,849, -3.84% from previous year)
- 2012: $244,670 (-$2,109, -0.85% from previous year)
- 2013: $262,100 (+$17,430, +7.12% from previous year)
- 2014: $286,968 (+$24,868, +9.49% from previous year)
- 2015: $303,265 (+$16,297, +5.68% from previous year)
- 2016: $325,224 (+$21,959, +7.24% from previous year)
- 2017: $337,522 (+$12,298, +3.78% from previous year)
- 2018: $361,081 (+$23,559, +6.98% from previous year)
- 2019: $387,050 (+$25,969, +7.19% from previous year)
- 2020: N/A
- 2021: $449,895
- 2022: $524,923 (+$75,028, +16.68% from previous year)
- 2023: $557,701 (+$32,778, +6.24% from previous year)
- 2024: $583,516 (+$25,815, +4.63% from previous year)
- 2025: $605,020 (+$21,504, +3.69% from previous year)
In 2012, home values in Tega Cay hovered under $245,000. By 2025, they’ve climbed past $600,000, with some of the steepest gains occurring after 2020. The market shows consistent, healthy growth and a strong upward trend overall.
Tega Cay – Lakeside Living and High Demand

Tega Cay, which means “beautiful peninsula,” is perched on Lake Wylie in the northern part of South Carolina. Its waterfront homes, marinas, and golf courses make it a highly desirable residential community just south of Charlotte, NC.
Its strong school districts and recreational amenities continue to drive demand. As part of the larger Fort Mill area, Tega Cay has benefitted from regional job growth and a surge of new families relocating from more expensive urban areas.
13. Wadmalaw Island – 276% Home Price Increase Since 2012

- 2010: $202,399
- 2011: $182,894 (-$19,505, -9.64% from previous year)
- 2012: $174,117 (-$8,777, -4.80% from previous year)
- 2013: $194,088 (+$19,971, +11.47% from previous year)
- 2014: $217,479 (+$23,391, +12.05% from previous year)
- 2015: $244,513 (+$27,034, +12.43% from previous year)
- 2016: $280,785 (+$36,272, +14.84% from previous year)
- 2017: $312,273 (+$31,488, +11.22% from previous year)
- 2018: $342,412 (+$30,139, +9.65% from previous year)
- 2019: $366,690 (+$24,278, +7.09% from previous year)
- 2020: N/A
- 2021: $419,722
- 2022: $497,365 (+$77,643, +18.50% from previous year)
- 2023: $521,138 (+$23,773, +4.78% from previous year)
- 2024: $543,635 (+$22,497, +4.32% from previous year)
- 2025: $653,847 (+$110,212, +20.27% from previous year)
Wadmalaw Island saw an explosive price increase of over 276% since 2012, with one of the largest single-year jumps occurring between 2024 and 2025. Home values have surged past the $650,000 mark in 2025, putting this island community among the state’s most expensive.
Wadmalaw Island – Exclusive and Evolving

Wadmalaw Island, just southwest of Charleston, offers pristine natural beauty, low development, and large properties—factors that contribute to its elite reputation. Known for its tea plantation and scenic farmland, the island attracts buyers who want space, privacy, and a slower pace.
The price spike in recent years may be due to increasing scarcity and luxury developments. As Charleston grows, nearby quiet enclaves like Wadmalaw Island become more attractive to those seeking upscale rural retreats within reach of the city.
12. Meggett – 226% Home Price Increase Since 2012

- 2010: $251,030
- 2011: $232,633 (-$18,397, -7.33% from previous year)
- 2012: $221,828 (-$10,805, -4.65% from previous year)
- 2013: $246,808 (+$24,980, +11.26% from previous year)
- 2014: $276,589 (+$29,781, +12.07% from previous year)
- 2015: $310,823 (+$34,234, +12.38% from previous year)
- 2016: $356,728 (+$45,905, +14.77% from previous year)
- 2017: $396,681 (+$39,953, +11.20% from previous year)
- 2018: $435,071 (+$38,390, +9.68% from previous year)
- 2019: $466,022 (+$30,951, +7.11% from previous year)
- 2020: N/A
- 2021: $533,372
- 2022: $632,664 (+$99,292, +18.62% from previous year)
- 2023: $662,609 (+$29,945, +4.73% from previous year)
- 2024: $691,538 (+$28,929, +4.37% from previous year)
- 2025: $723,678 (+$32,140, +4.65% from previous year)
Meggett’s real estate market has flourished since 2012, with home values jumping by 226%. The largest gains came between 2013 and 2016, with another notable bump after 2020. With prices reaching over $723,000 in 2025, Meggett now ranks among South Carolina’s most expensive markets.
Meggett – Quiet, Spacious, and Increasingly Valuable

Meggett, located in Charleston County near the Wadmalaw and Stono rivers, is known for its open land, waterfront homes, and rural appeal. While it may not be a household name, buyers have taken notice of its peaceful surroundings and proximity to Charleston.
Its growth has been steady and significant, driven by demand for space and tranquility. Meggett’s appeal lies in its low density and charm—it’s a place where residents trade the bustle of the city for marsh views and open skies, all without sacrificing access to nearby amenities.
11. Edisto Beach – 150% Home Price Increase Since 2012

- 2010: $369,226
- 2011: $339,705 (-$29,521, -7.99% from previous year)
- 2012: $316,636 (-$23,069, -6.79% from previous year)
- 2013: $330,746 (+$14,110, +4.46% from previous year)
- 2014: $348,265 (+$17,519, +5.30% from previous year)
- 2015: $374,720 (+$26,455, +7.60% from previous year)
- 2016: $409,236 (+$34,516, +9.21% from previous year)
- 2017: $432,473 (+$23,237, +5.68% from previous year)
- 2018: $460,870 (+$28,397, +6.57% from previous year)
- 2019: $481,462 (+$20,592, +4.47% from previous year)
- 2020: N/A
- 2021: $521,826
- 2022: $593,435 (+$71,609, +13.73% from previous year)
- 2023: $619,646 (+$26,211, +4.42% from previous year)
- 2024: $646,439 (+$26,793, +4.32% from previous year)
- 2025: $742,838 (+$96,399, +14.91% from previous year)
Edisto Beach home prices have climbed from around $316,000 in 2012 to nearly $743,000 in 2025—an increase of 150%. The market saw consistent year-over-year growth, with especially large jumps after 2020 and a major leap between 2024 and 2025.
Edisto Beach – A Resilient and Rising Coastal Market

Edisto Beach is one of South Carolina’s quieter coastal destinations, known for its unspoiled beaches, small-town charm, and natural beauty. Unlike some more commercialized resort towns, Edisto maintains a laid-back feel with limited development—an element that continues to drive exclusivity and value.
The surge in home prices is partly a reflection of growing demand for coastal property that offers both privacy and access to nature. As beachfront property becomes more limited across the country, places like Edisto are emerging as high-value retreats that command serious attention from buyers and investors alike.
10. Hilton Head Island – 164% Home Price Increase Since 2012

- 2010: $362,094
- 2011: $333,256 (-$28,838, -7.96% from previous year)
- 2012: $310,627 (-$22,629, -6.79% from previous year)
- 2013: $324,573 (+$13,946, +4.49% from previous year)
- 2014: $341,736 (+$17,163, +5.29% from previous year)
- 2015: $367,887 (+$26,151, +7.65% from previous year)
- 2016: $401,890 (+$34,003, +9.24% from previous year)
- 2017: $424,772 (+$22,882, +5.69% from previous year)
- 2018: $452,783 (+$28,011, +6.59% from previous year)
- 2019: $472,936 (+$20,153, +4.45% from previous year)
- 2020: N/A
- 2021: $512,529
- 2022: $582,855 (+$70,326, +13.73% from previous year)
- 2023: $608,695 (+$25,840, +4.43% from previous year)
- 2024: $635,204 (+$26,509, +4.35% from previous year)
- 2025: $764,829 (+$129,625, +20.41% from previous year)
Hilton Head Island’s home prices have soared 164% since 2012, reaching over $764,000 in 2025. After steady gains through the 2010s, values surged post-2021, especially between 2024 and 2025, with a year-over-year jump of more than $129,000.
Hilton Head Island – Luxury Coastal Living with Enduring Appeal

Famous for its world-class golf, pristine beaches, and upscale resorts, Hilton Head Island has long been one of the crown jewels of South Carolina real estate. The island consistently ranks as one of the top U.S. vacation destinations, and it has also become a favored location for retirement and second homes.
Recent gains reflect growing demand for lifestyle properties. Whether it’s tennis, boating, or gourmet dining, the island delivers on high-end amenities. Limited land availability and a strong preservation ethic also help keep inventory low—pushing prices higher as demand continues to climb.
9. Awendaw – 230% Home Price Increase Since 2012

🔥 Would you like to save this?
- 2010: $271,780
- 2011: $252,003 (-$19,777, -7.28% from previous year)
- 2012: $240,458 (-$11,545, -4.58% from previous year)
- 2013: $267,520 (+$27,062, +11.25% from previous year)
- 2014: $300,012 (+$32,492, +12.15% from previous year)
- 2015: $337,275 (+$37,263, +12.42% from previous year)
- 2016: $387,276 (+$50,001, +14.83% from previous year)
- 2017: $430,503 (+$43,227, +11.16% from previous year)
- 2018: $472,426 (+$41,923, +9.74% from previous year)
- 2019: $506,227 (+$33,801, +7.15% from previous year)
- 2020: N/A
- 2021: $579,620
- 2022: $687,564 (+$107,944, +18.63% from previous year)
- 2023: $720,269 (+$32,705, +4.75% from previous year)
- 2024: $751,412 (+$31,143, +4.32% from previous year)
- 2025: $791,959 (+$40,547, +5.40% from previous year)
Awendaw has experienced a 230% rise in home prices since 2012, growing from $240,458 to nearly $792,000. The biggest jump came in 2022, when values rose by over $100,000 in a single year. Prices have continued to rise steadily since then.
Awendaw – A Peaceful Retreat Just Outside Charleston

Located north of Mount Pleasant, Awendaw combines natural beauty with proximity to the Charleston metro area. It borders the Francis Marion National Forest and offers large lots, wildlife preserves, and waterfront access that appeal to buyers looking for space and privacy.
This rural-urban fringe location is increasingly popular among those seeking both convenience and quiet. The upward trend in prices reflects increased interest from buyers priced out of Charleston or seeking a more secluded alternative to more crowded markets.
8. Mount Pleasant – 209% Home Price Increase Since 2012

- 2010: $320,825
- 2011: $297,508 (-$23,317, -7.27% from previous year)
- 2012: $283,983 (-$13,525, -4.55% from previous year)
- 2013: $316,029 (+$32,046, +11.28% from previous year)
- 2014: $354,387 (+$38,358, +12.14% from previous year)
- 2015: $398,464 (+$44,077, +12.44% from previous year)
- 2016: $457,542 (+$59,078, +14.83% from previous year)
- 2017: $508,595 (+$51,053, +11.16% from previous year)
- 2018: $558,170 (+$49,575, +9.75% from previous year)
- 2019: $598,268 (+$40,098, +7.18% from previous year)
- 2020: N/A
- 2021: $684,732
- 2022: $812,666 (+$127,934, +18.68% from previous year)
- 2023: $851,353 (+$38,687, +4.76% from previous year)
- 2024: $888,167 (+$36,814, +4.32% from previous year)
- 2025: $876,150 (-$12,017, -1.35% from previous year)
Mount Pleasant’s home prices have more than tripled since 2012, though the most recent data from 2025 shows a slight dip. The town surged past $800,000 in 2022, with strong upward movement continuing through 2024 before easing slightly this year.
Mount Pleasant – Rapid Growth with Urban Sophistication

One of the fastest-growing towns in South Carolina, Mount Pleasant offers a polished blend of suburban comfort and urban amenities. Located just across the Cooper River from Charleston, it’s known for excellent schools, planned communities, and a thriving restaurant and shopping scene.
Its real estate market has been on a tear for over a decade, reflecting the area’s strong economy and livability. While 2025 saw a minor correction, demand remains high and the long-term growth trend suggests this remains one of the most competitive housing markets in the region.
7. Seabrook Island – 113% Home Price Increase Since 2012

- 2010: $530,418
- 2011: $491,656 (-$38,762, -7.31% from previous year)
- 2012: $469,403 (-$22,253, -4.53% from previous year)
- 2013: $522,545 (+$53,142, +11.32% from previous year)
- 2014: $586,048 (+$63,503, +12.15% from previous year)
- 2015: $659,089 (+$73,041, +12.46% from previous year)
- 2016: $756,816 (+$97,727, +14.83% from previous year)
- 2017: $841,315 (+$84,499, +11.17% from previous year)
- 2018: $923,328 (+$82,013, +9.75% from previous year)
- 2019: $989,443 (+$66,115, +7.16% from previous year)
- 2020: N/A
- 2021: $1,132,213
- 2022: $1,344,222 (+$212,009, +18.72% from previous year)
- 2023: $1,408,189 (+$63,967, +4.76% from previous year)
- 2024: $1,468,972 (+$60,783, +4.32% from previous year)
- 2025: $1,000,311 (-$468,661, -31.91% from previous year)
Seabrook Island saw a significant surge in home values from 2012 to 2024, with prices increasing by over 113% during that span. However, 2025 brought a dramatic downturn, with prices falling by nearly a third. Still, the long-term gains remain substantial.
Seabrook Island – Exclusive Resort Market with a Recent Correction

Seabrook Island is a private coastal community south of Charleston, known for its golf courses, equestrian center, and beaches. It has long appealed to high-end buyers seeking exclusivity and natural surroundings, with prices soaring as more remote workers and retirees entered the market post-2020.
The 2025 dip may reflect market recalibration after years of aggressive growth. Despite this, Seabrook remains a luxury enclave with tight inventory and resort-style amenities that continue to drive long-term value. For many, it still represents one of South Carolina’s premier coastal investments.
6. Folly Beach – 182% Home Price Increase Since 2012
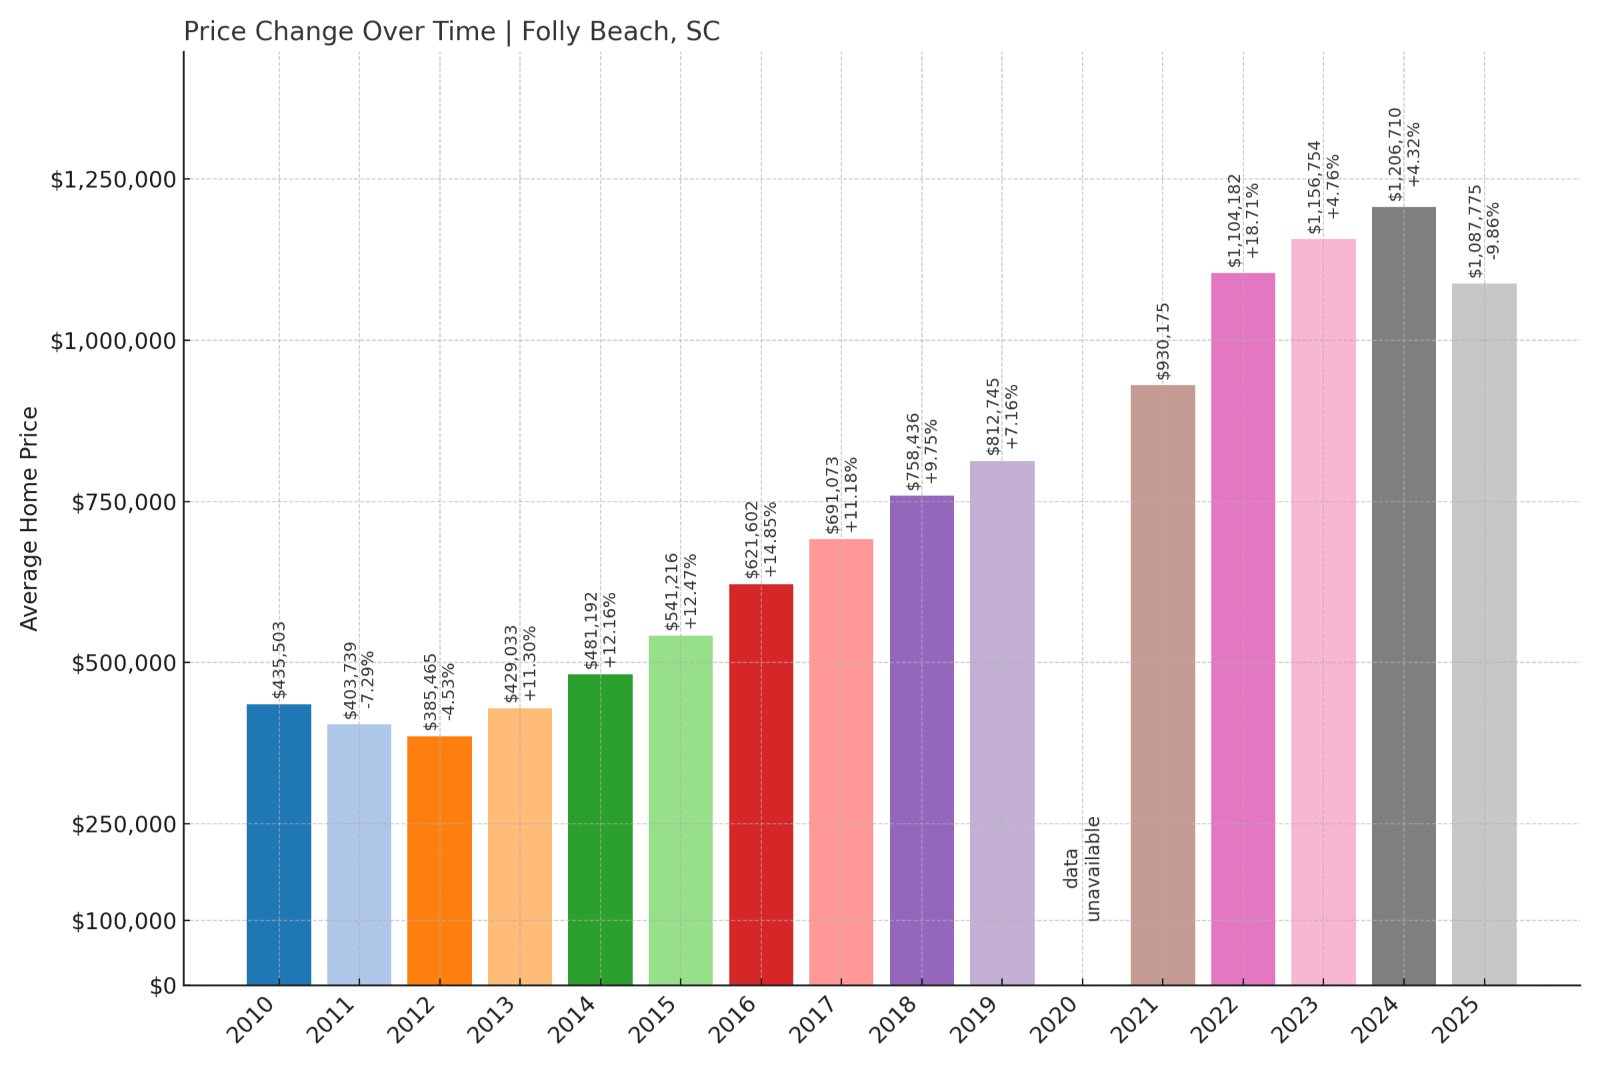
- 2010: $435,503
- 2011: $403,739 (-$31,764, -7.29% from previous year)
- 2012: $385,465 (-$18,274, -4.53% from previous year)
- 2013: $429,033 (+$43,568, +11.30% from previous year)
- 2014: $481,192 (+$52,159, +12.16% from previous year)
- 2015: $541,216 (+$60,024, +12.47% from previous year)
- 2016: $621,602 (+$80,386, +14.86% from previous year)
- 2017: $691,073 (+$69,471, +11.18% from previous year)
- 2018: $758,436 (+$67,363, +9.75% from previous year)
- 2019: $812,745 (+$54,309, +7.16% from previous year)
- 2020: N/A
- 2021: $930,175
- 2022: $1,104,182 (+$174,007, +18.70% from previous year)
- 2023: $1,156,754 (+$52,572, +4.76% from previous year)
- 2024: $1,206,710 (+$49,956, +4.32% from previous year)
- 2025: $1,087,775 (-$118,935, -9.85% from previous year)
Folly Beach home prices have grown 182% since 2012, though 2025 saw a nearly 10% dip. Despite the recent decline, long-term appreciation remains strong, with values climbing past $1.2 million at their peak in 2024.
Folly Beach – Bohemian Vibes and Big Price Moves

Folly Beach has a reputation as Charleston’s quirky, laid-back beach town, but don’t let the flip-flops fool you—real estate here is serious business. Its mix of surf culture, local charm, and close proximity to Charleston makes it a hot commodity among both vacationers and long-term residents.
Rapid appreciation in recent years was driven by limited supply and growing demand for coastal properties. The slight pullback in 2025 may create a temporary reprieve, but Folly’s long-standing popularity and strong rental market ensure it remains a valuable spot in the state’s coastal housing scene.
5. Sunset – 168% Home Price Increase Since 2012

- 2010: $544,149
- 2011: $504,514 (-$39,635, -7.28% from previous year)
- 2012: $481,669 (-$22,845, -4.53% from previous year)
- 2013: $536,094 (+$54,425, +11.30% from previous year)
- 2014: $601,314 (+$65,220, +12.17% from previous year)
- 2015: $676,301 (+$74,987, +12.47% from previous year)
- 2016: $776,897 (+$100,596, +14.88% from previous year)
- 2017: $863,719 (+$86,822, +11.18% from previous year)
- 2018: $948,013 (+$84,294, +9.76% from previous year)
- 2019: $1,015,863 (+$67,850, +7.16% from previous year)
- 2020: N/A
- 2021: $1,162,632
- 2022: $1,380,068 (+$217,436, +18.71% from previous year)
- 2023: $1,445,702 (+$65,634, +4.75% from previous year)
- 2024: $1,508,145 (+$62,443, +4.32% from previous year)
- 2025: $1,289,168 (-$218,977, -14.52% from previous year)
Sunset’s housing market has grown 168% since 2012, with major gains up through 2024. A notable drop in 2025 brought prices down by more than $218,000 in one year, though long-term growth remains among the strongest in the state.
Sunset – Mountain Views, Lake Access, and Real Estate Upswing

🔥 Would you like to save this?
Nestled in the foothills of the Blue Ridge Mountains, Sunset is a picturesque town popular with outdoor lovers, retirees, and those seeking serenity. Its proximity to Lake Keowee and premium gated communities like The Reserve have driven demand and prices.
Despite the recent downturn, Sunset’s appeal endures thanks to its scenic surroundings, recreational access, and proximity to Clemson and Greenville. The 2025 dip may reflect broader correction trends, but Sunset remains a destination with high long-term value potential.
4. Isle of Palms – 182% Home Price Increase Since 2012

- 2010: $634,006
- 2011: $587,803 (-$46,203, -7.29% from previous year)
- 2012: $561,190 (-$26,613, -4.53% from previous year)
- 2013: $624,611 (+$63,421, +11.30% from previous year)
- 2014: $700,579 (+$75,968, +12.16% from previous year)
- 2015: $787,852 (+$87,273, +12.46% from previous year)
- 2016: $904,986 (+$117,134, +14.87% from previous year)
- 2017: $1,006,145 (+$101,159, +11.18% from previous year)
- 2018: $1,104,219 (+$98,074, +9.75% from previous year)
- 2019: $1,183,290 (+$79,071, +7.16% from previous year)
- 2020: N/A
- 2021: $1,354,336
- 2022: $1,607,770 (+$253,434, +18.71% from previous year)
- 2023: $1,684,251 (+$76,481, +4.76% from previous year)
- 2024: $1,756,019 (+$71,768, +4.26% from previous year)
- 2025: $1,582,328 (-$173,691, -9.89% from previous year)
Home prices on Isle of Palms have jumped 182% since 2012. The market peaked in 2024 at over $1.75 million before experiencing a nearly 10% drop in 2025. Still, values remain among the highest in the state.
Isle of Palms – Elite Coastal Real Estate with Recent Correction

Isle of Palms, situated just north of Charleston, is known for its stunning beachfront homes, gated communities, and oceanfront resorts. The town has long been a favorite for luxury homebuyers, offering direct beach access, golf, and fine dining.
Recent price softening may reflect a cooling in ultra-high-end markets, but demand for prime coastal property in South Carolina remains strong. With limited availability and high desirability, Isle of Palms continues to represent a premier real estate destination in the Lowcountry.
3. Kiawah Island – 180% Home Price Increase Since 2012

- 2010: $808,509
- 2011: $749,624 (-$58,885, -7.28% from previous year)
- 2012: $715,661 (-$33,963, -4.53% from previous year)
- 2013: $796,584 (+$80,923, +11.31% from previous year)
- 2014: $893,376 (+$96,792, +12.15% from previous year)
- 2015: $1,004,740 (+$111,364, +12.47% from previous year)
- 2016: $1,154,052 (+$149,312, +14.86% from previous year)
- 2017: $1,282,880 (+$128,828, +11.17% from previous year)
- 2018: $1,408,165 (+$125,285, +9.77% from previous year)
- 2019: $1,509,020 (+$100,855, +7.16% from previous year)
- 2020: N/A
- 2021: $1,727,385
- 2022: $2,050,678 (+$323,293, +18.71% from previous year)
- 2023: $2,148,270 (+$97,592, +4.76% from previous year)
- 2024: $2,240,970 (+$92,700, +4.32% from previous year)
- 2025: $2,003,219 (-$237,751, -10.61% from previous year)
Kiawah Island home values surged 180% since 2012, with several years of explosive growth, especially post-2020. Prices peaked in 2024 at over $2.2 million before a notable decline in 2025. Despite the correction, the island remains one of the most valuable markets in South Carolina.
Kiawah Island – Luxury, Nature, and Soaring Prices

Kiawah Island is renowned for its blend of luxury and nature. With 10 miles of unspoiled beach, top-tier golf courses, and protected maritime forest, it appeals to affluent buyers seeking a private sanctuary. The island enforces strict development codes, adding to its exclusivity.
The recent pullback likely reflects temporary adjustments in the luxury sector. Long-term, Kiawah remains a world-class destination with limited inventory and enduring prestige—qualities that have fueled its position at the top of South Carolina’s housing market.
2. Sheldon – 167% Home Price Increase Since 2012

- 2010: $918,412
- 2011: $851,556 (-$66,856, -7.28% from previous year)
- 2012: $812,938 (-$38,618, -4.53% from previous year)
- 2013: $904,828 (+$91,890, +11.30% from previous year)
- 2014: $1,014,803 (+$109,975, +12.15% from previous year)
- 2015: $1,141,390 (+$126,587, +12.47% from previous year)
- 2016: $1,311,045 (+$169,655, +14.87% from previous year)
- 2017: $1,457,714 (+$146,669, +11.19% from previous year)
- 2018: $1,599,873 (+$142,159, +9.75% from previous year)
- 2019: $1,714,375 (+$114,502, +7.16% from previous year)
- 2020: N/A
- 2021: $1,962,038
- 2022: $2,329,044 (+$367,006, +18.71% from previous year)
- 2023: $2,439,890 (+$110,846, +4.76% from previous year)
- 2024: $2,545,340 (+$105,450, +4.32% from previous year)
- 2025: $2,174,544 (-$370,796, -14.57% from previous year)
Home values in Sheldon have risen 167% since 2012, with large increases throughout the 2010s and early 2020s. In 2025, the town saw a significant correction of nearly 15%, though the current median price still tops $2.1 million.
Sheldon – High-End Living with Room to Breathe

Sheldon is a low-density community in Beaufort County, valued for its rural charm and scenic waterfront properties. It’s home to historic churches, marshlands, and a growing number of luxury homes along riverfront and estate-sized lots.
The rise in prices over the past decade mirrors a broader trend of buyers seeking privacy, space, and natural beauty. While 2025 brought a pullback, Sheldon remains a highly desirable location for high-net-worth buyers escaping crowded cities.
1. Sullivans Island – 278% Home Price Increase Since 2012

- 2010: $1,181,035
- 2011: $1,065,826 (-$115,209, -9.75% from previous year)
- 2012: $1,052,779 (-$13,047, -1.22% from previous year)
- 2013: $1,162,681 (+$109,902, +10.44% from previous year)
- 2014: $1,258,867 (+$96,186, +8.27% from previous year)
- 2015: $1,309,257 (+$50,390, +4.00% from previous year)
- 2016: $1,410,114 (+$100,857, +7.70% from previous year)
- 2017: $1,465,906 (+$55,792, +3.95% from previous year)
- 2018: $1,569,639 (+$103,733, +7.08% from previous year)
- 2019: $1,698,142 (+$128,503, +8.19% from previous year)
- 2020: N/A
- 2021: $2,108,406
- 2022: $2,804,264 (+$695,858, +33.01% from previous year)
- 2023: $3,255,881 (+$451,617, +16.10% from previous year)
- 2024: $3,694,069 (+$438,188, +13.46% from previous year)
- 2025: $3,983,485 (+$289,416, +7.84% from previous year)
Sullivans Island has seen the largest home price increase on this list—up a staggering 278% since 2012. Prices soared especially between 2021 and 2024, and by 2025, the average home value has climbed to nearly $4 million, making it the most expensive town in South Carolina.
Sullivans Island – Prestige and Property Value on the Rise

Sullivans Island offers beachfront luxury just 10 miles from Charleston. Known for its peaceful atmosphere, historic sites, and sweeping views of the Atlantic, the island maintains strict zoning laws and limited commercial activity—enhancing its exclusivity and home values.
The surge in prices reflects a flood of interest from affluent buyers seeking both beauty and privacy. With demand high and inventory scarce, Sullivans Island remains a market leader in South Carolina real estate—where charm and value go hand in hand.


