🔥 Would you like to save this?
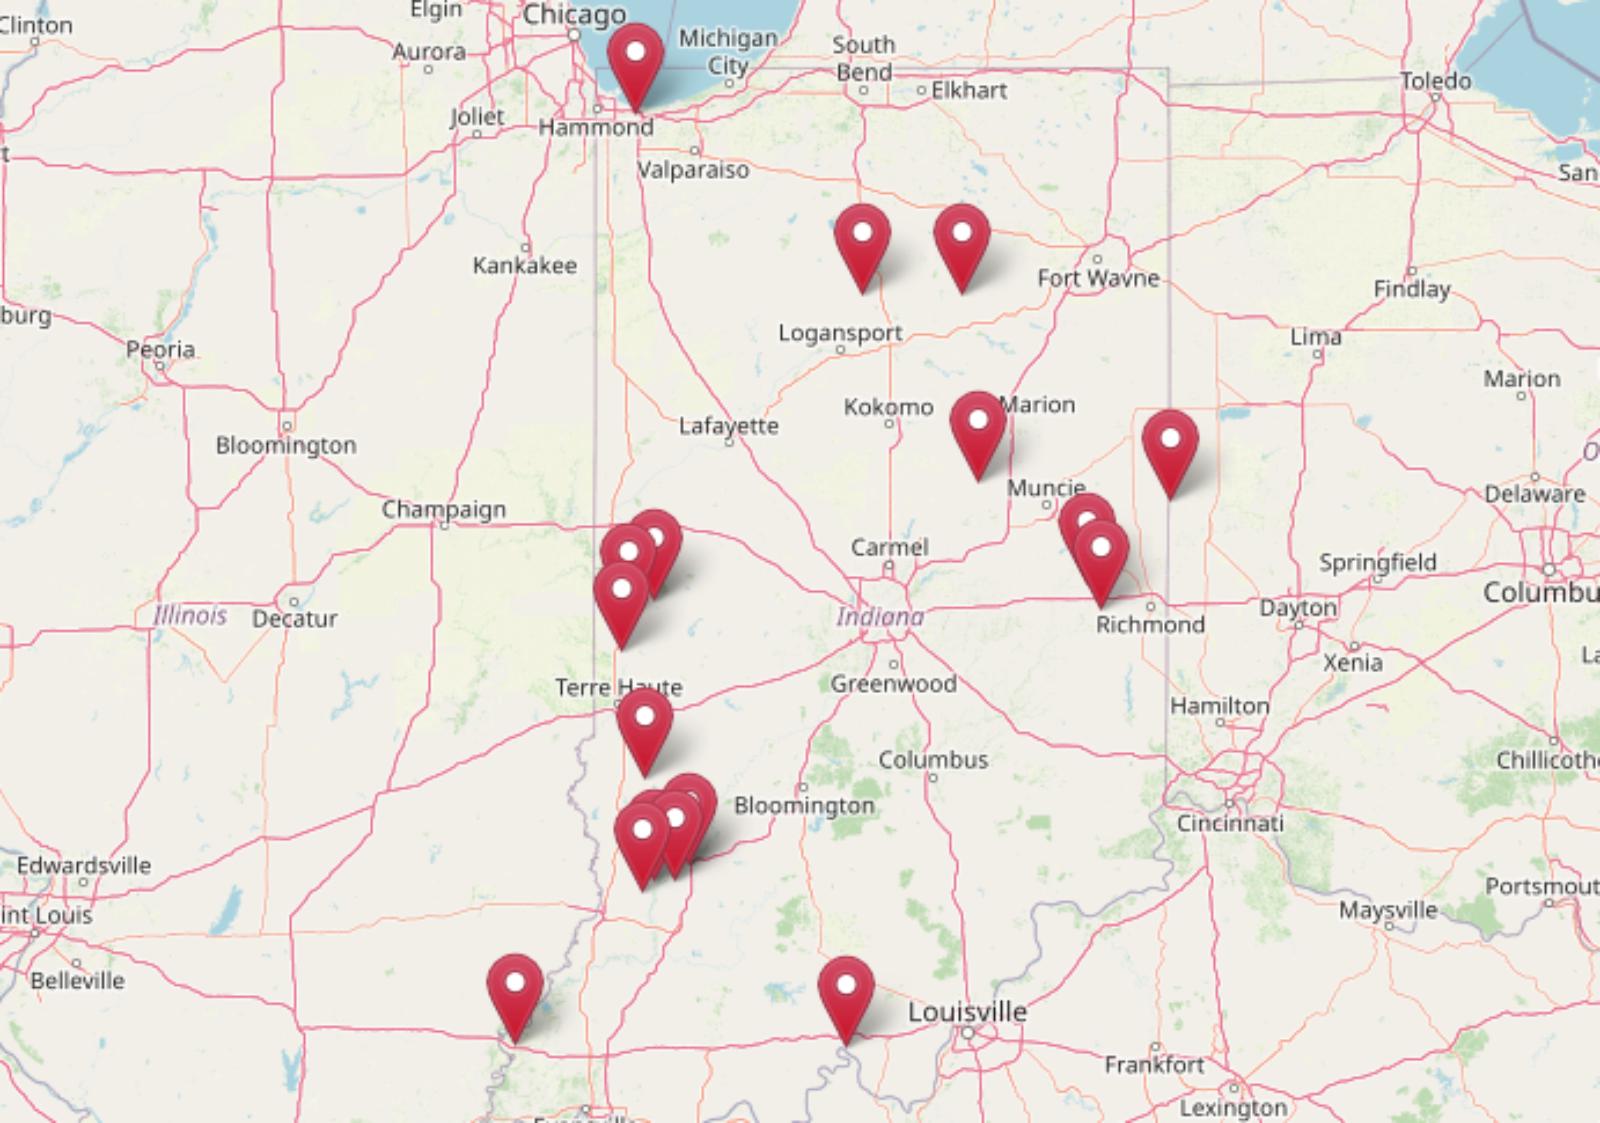
Indiana remains one of the most affordable places to buy a home in 2025. According to the latest data from the Zillow Home Value Index, these 17 towns are leading the way when it comes to low housing costs. In many, homes are still priced under $130,000, sometimes by a wide margin. From small river towns to quiet farming communities, these places offer more than just cheap real estate. They offer room to breathe, a slower pace of life, and enough stability to feel like a smart long-term investment. Whether you’re looking to downsize, relocate, or just stretch your budget, these towns prove that affordable living is still alive and well in Indiana.
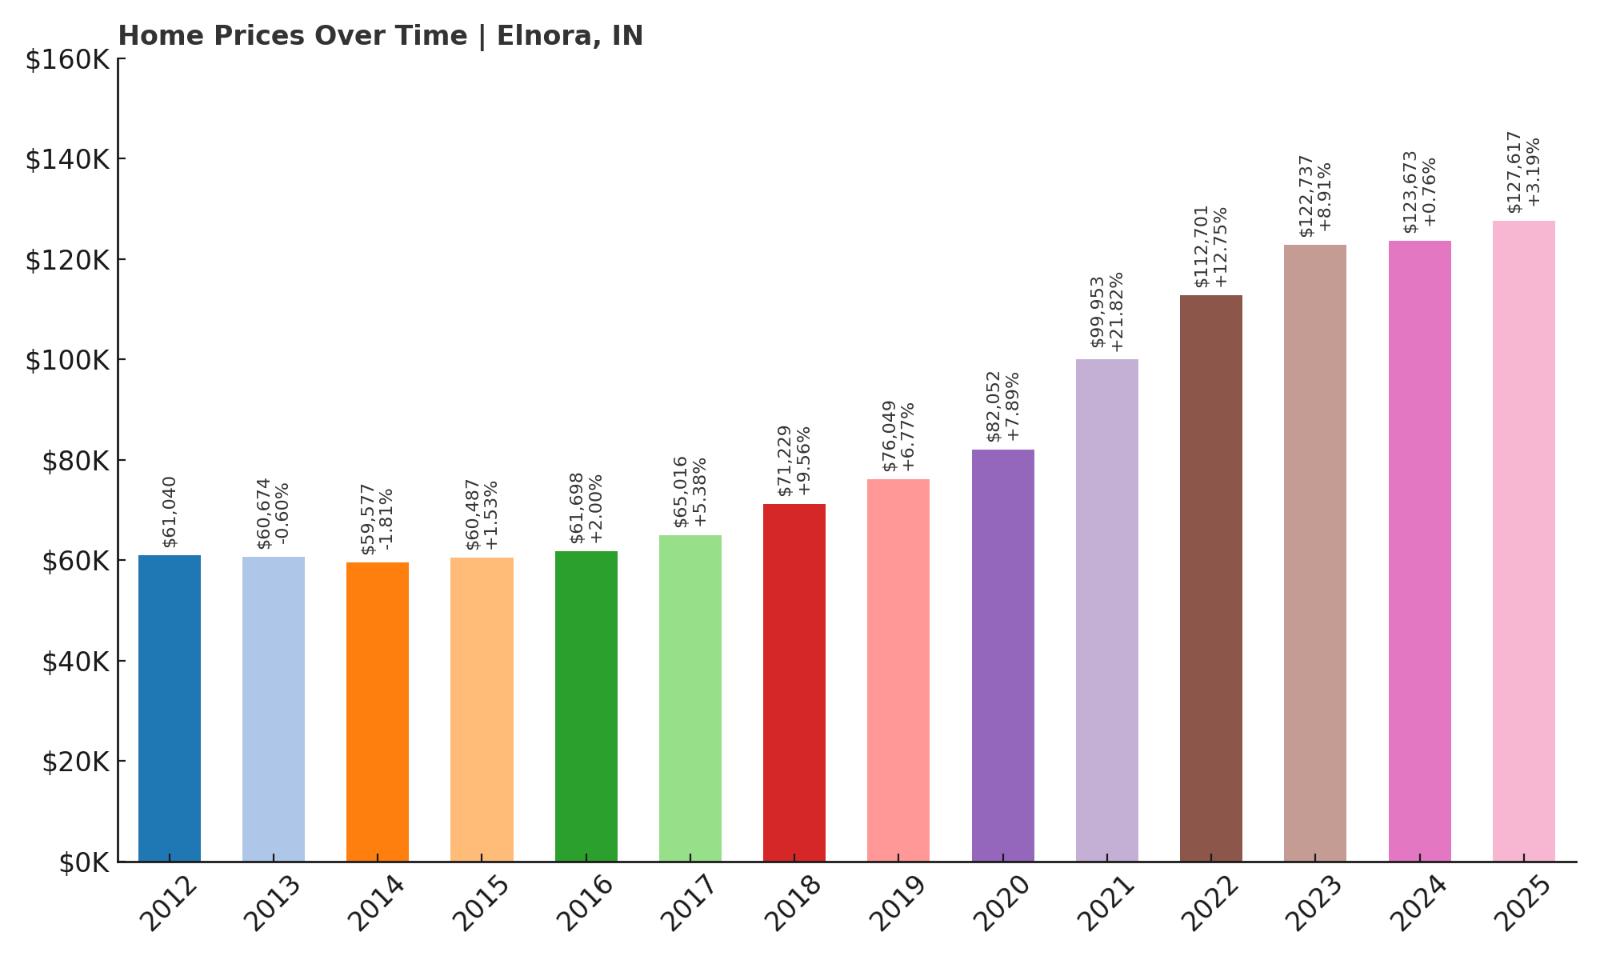
17. Elnora – 109% Home Price Increase Since 2012
- 2010: N/A
- 2011: N/A
- 2012: $61,040
- 2013: $60,674 (-$366, -0.60% from previous year)
- 2014: $59,577 (-$1,097, -1.81% from previous year)
- 2015: $60,487 (+$909, +1.53% from previous year)
- 2016: $61,698 (+$1,211, +2.00% from previous year)
- 2017: $65,016 (+$3,318, +5.38% from previous year)
- 2018: $71,229 (+$6,213, +9.56% from previous year)
- 2019: $76,049 (+$4,820, +6.77% from previous year)
- 2020: $82,052 (+$6,003, +7.89% from previous year)
- 2021: $99,953 (+$17,901, +21.82% from previous year)
- 2022: $112,701 (+$12,749, +12.75% from previous year)
- 2023: $122,737 (+$10,036, +8.91% from previous year)
- 2024: $123,673 (+$936, +0.76% from previous year)
- 2025: $127,617 (+$3,943, +3.19% from previous year)
Since 2012, Elnora’s home values have more than doubled, rising 109% from just over $61,000 to nearly $128,000. The early years showed modest, even negative growth, but starting in 2017, the town entered a period of steady appreciation. Particularly between 2020 and 2022, price jumps were steep, reflecting rising demand. While recent growth has slowed, the overall trajectory is clear: Elnora has quietly become one of Indiana’s fastest-appreciating affordable towns.
In order to come up with the very specific design ideas, we create most designs with the assistance of state-of-the-art AI interior design software. Also, assume links that take you off the site are affiliate links such as links to Amazon. this means we may earn a commission if you buy something.
Elnora – Steady Growth in a Rural Setting
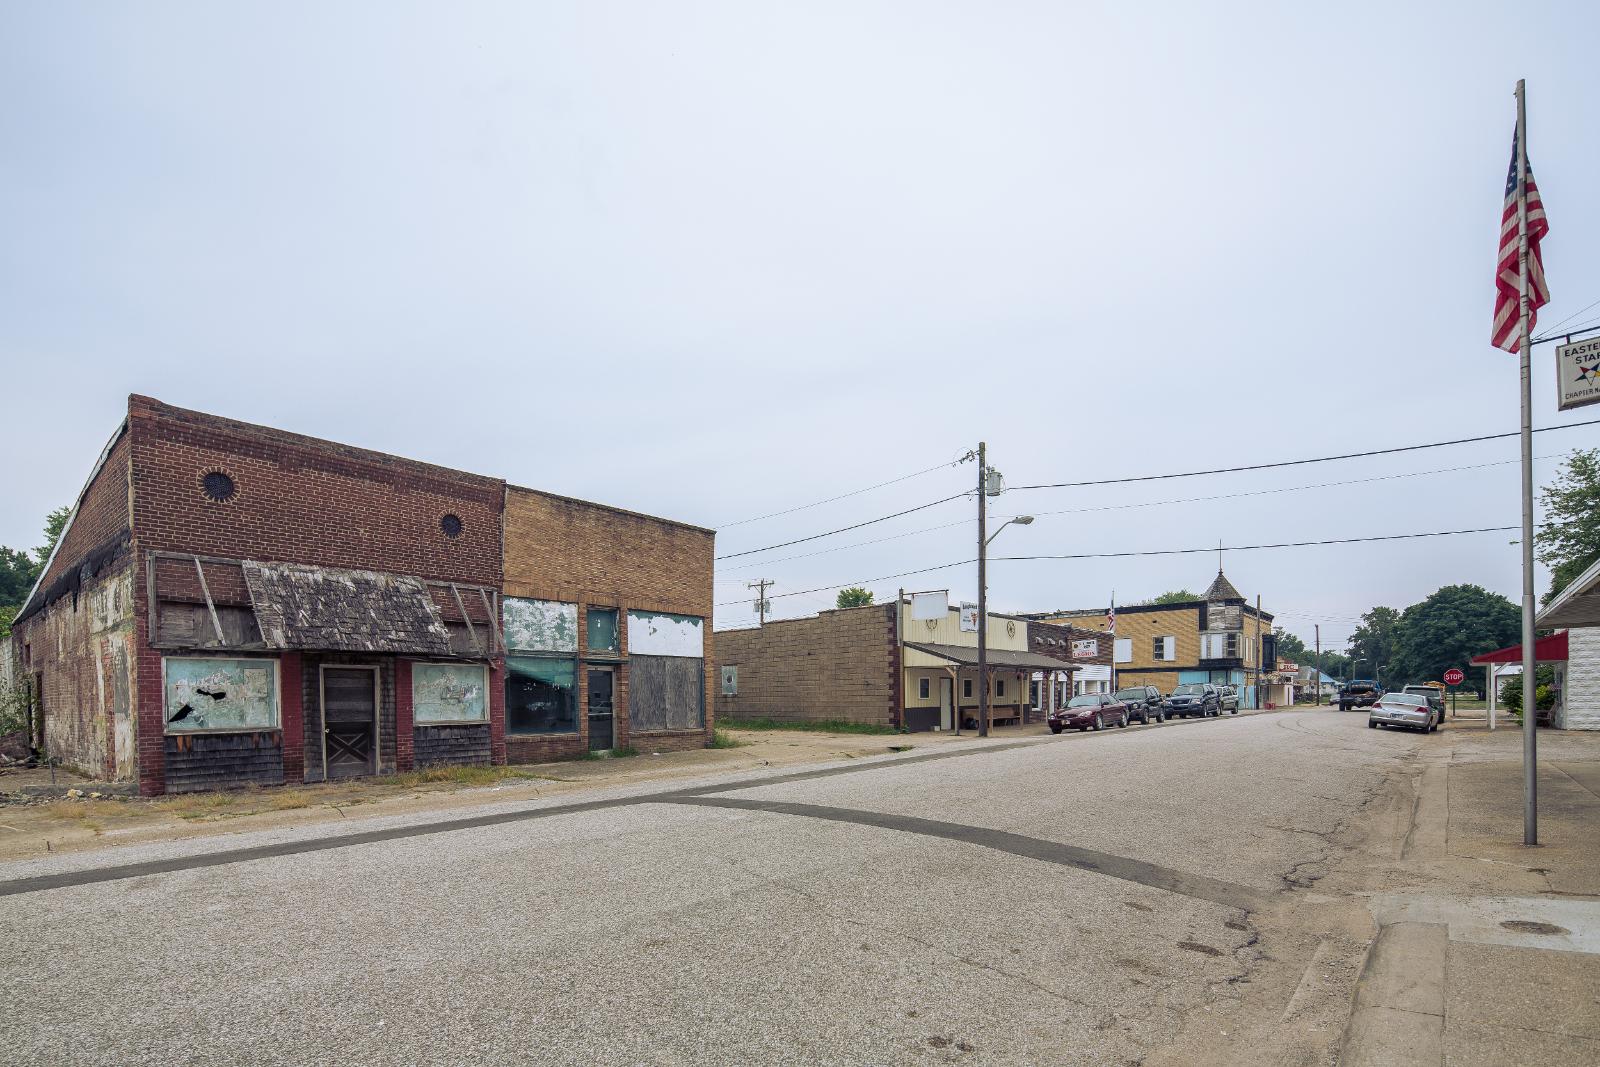
Located in Daviess County in southwestern Indiana, Elnora is a rural town with fewer than 700 residents. Its appeal lies in simplicity—open land, close community ties, and a low cost of living. It’s a place where agriculture and small-town life dominate the local economy, with few frills but plenty of stability. What Elnora lacks in commercial attractions it makes up for with peaceful surroundings and deeply rooted families. Buyers here are often seeking affordability and calm rather than convenience.
Its price growth likely reflects broader shifts seen across rural America, where remote work and high city costs have pushed buyers to explore new geographies. Though home inventory remains tight, the available properties tend to be single-family homes with ample yard space. With prices still under $130,000, Elnora remains a strong candidate for buyers who value space, privacy, and small-town values without the high price tag.
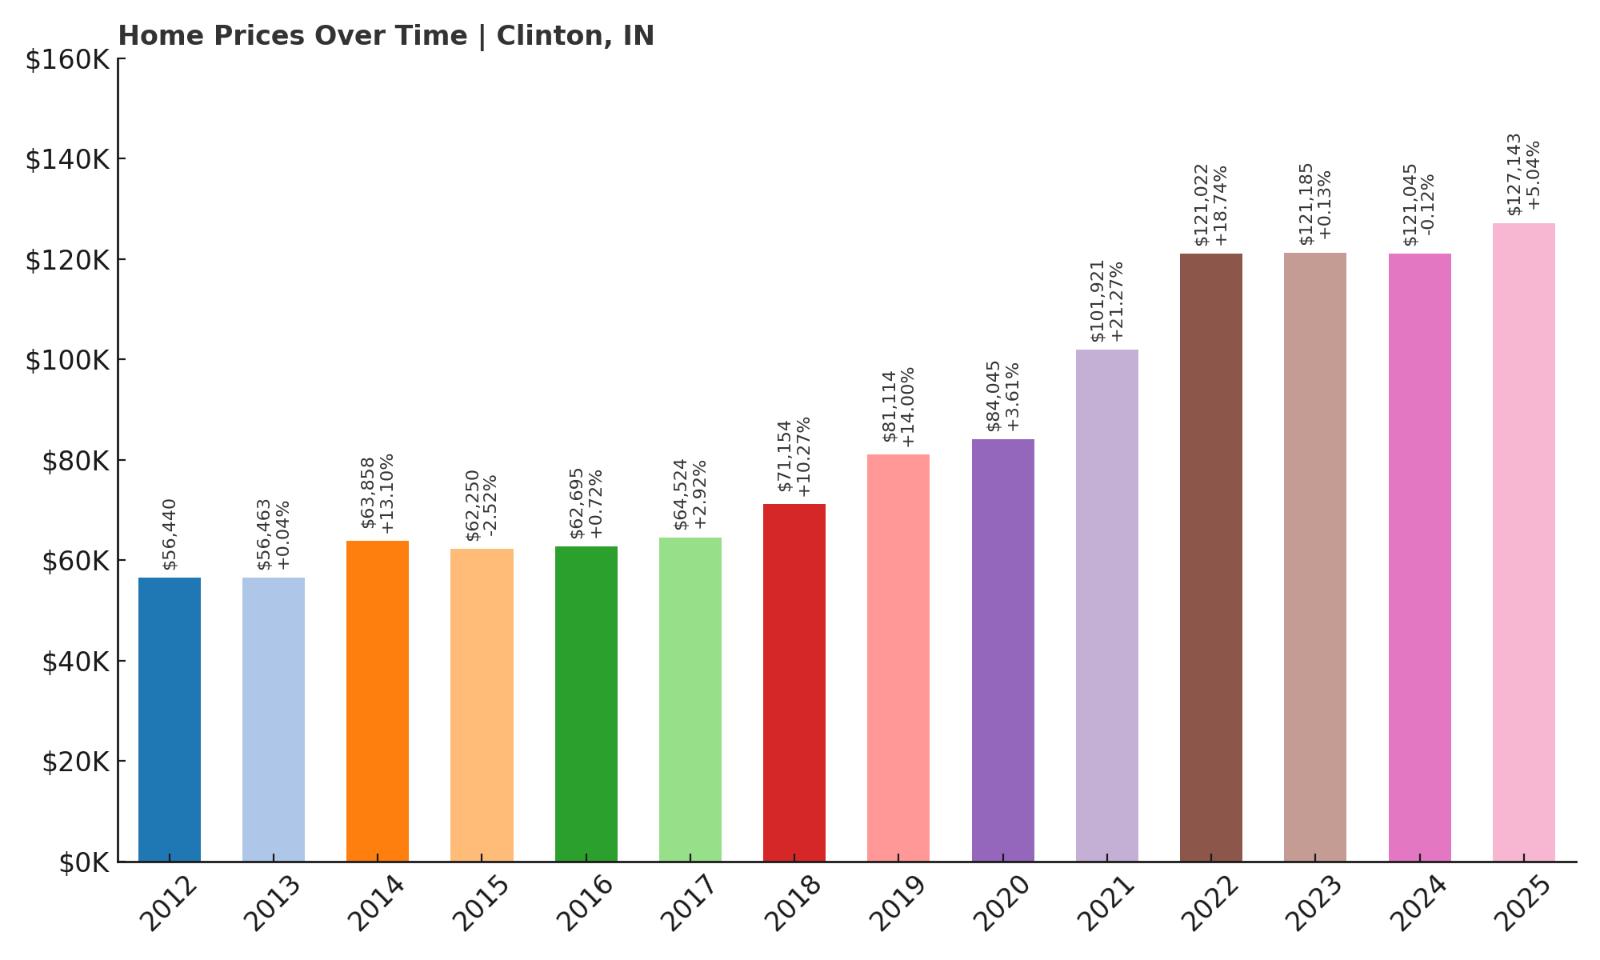
16. Clinton – 125% Home Price Increase Since 2012
- 2010: N/A
- 2011: N/A
- 2012: $56,440
- 2013: $56,463 (+$23, +0.04% from previous year)
- 2014: $63,858 (+$7,395, +13.10% from previous year)
- 2015: $62,250 (-$1,608, -2.52% from previous year)
- 2016: $62,695 (+$445, +0.72% from previous year)
- 2017: $64,524 (+$1,829, +2.92% from previous year)
- 2018: $71,154 (+$6,630, +10.27% from previous year)
- 2019: $81,114 (+$9,960, +14.00% from previous year)
- 2020: $84,045 (+$2,931, +3.61% from previous year)
- 2021: $101,921 (+$17,876, +21.27% from previous year)
- 2022: $121,022 (+$19,101, +18.74% from previous year)
- 2023: $121,185 (+$163, +0.13% from previous year)
- 2024: $121,045 (-$140, -0.12% from previous year)
- 2025: $127,143 (+$6,098, +5.04% from previous year)
Clinton’s home values have risen an impressive 125% since 2012, driven by a surge in demand over the last six years. Price growth was relatively mild during the early 2010s, but starting in 2018, the market gained serious momentum. Prices jumped more than $20,000 between 2020 and 2022 alone, and while growth slowed temporarily in 2023–2024, 2025 marked a return to upward movement. Still priced under $130,000, Clinton remains a clear standout in Indiana’s affordability landscape.
Clinton – Historic Charm Near the Wabash River
Clinton sits on the Wabash River in Vermillion County, just north of Terre Haute and near the Illinois state line. The town has a rich Italian-American heritage and is known regionally for hosting the Little Italy Festival each year. This cultural flavor is reflected in its architecture and civic pride. Clinton offers a walkable downtown, local schools, and a relatively strong infrastructure for a town of under 5,000 residents. It’s a practical choice for commuters to Terre Haute or anyone looking for small-town life with a bit of history and vibrancy.
Clinton’s housing stock includes older homes with generous lot sizes, many of which have seen modest renovations. The local economy is steady, with jobs in healthcare, education, and logistics nearby. With home prices still affordable and appreciation trending upward again, the town offers both value and momentum for those seeking an Indiana home that won’t break the bank.
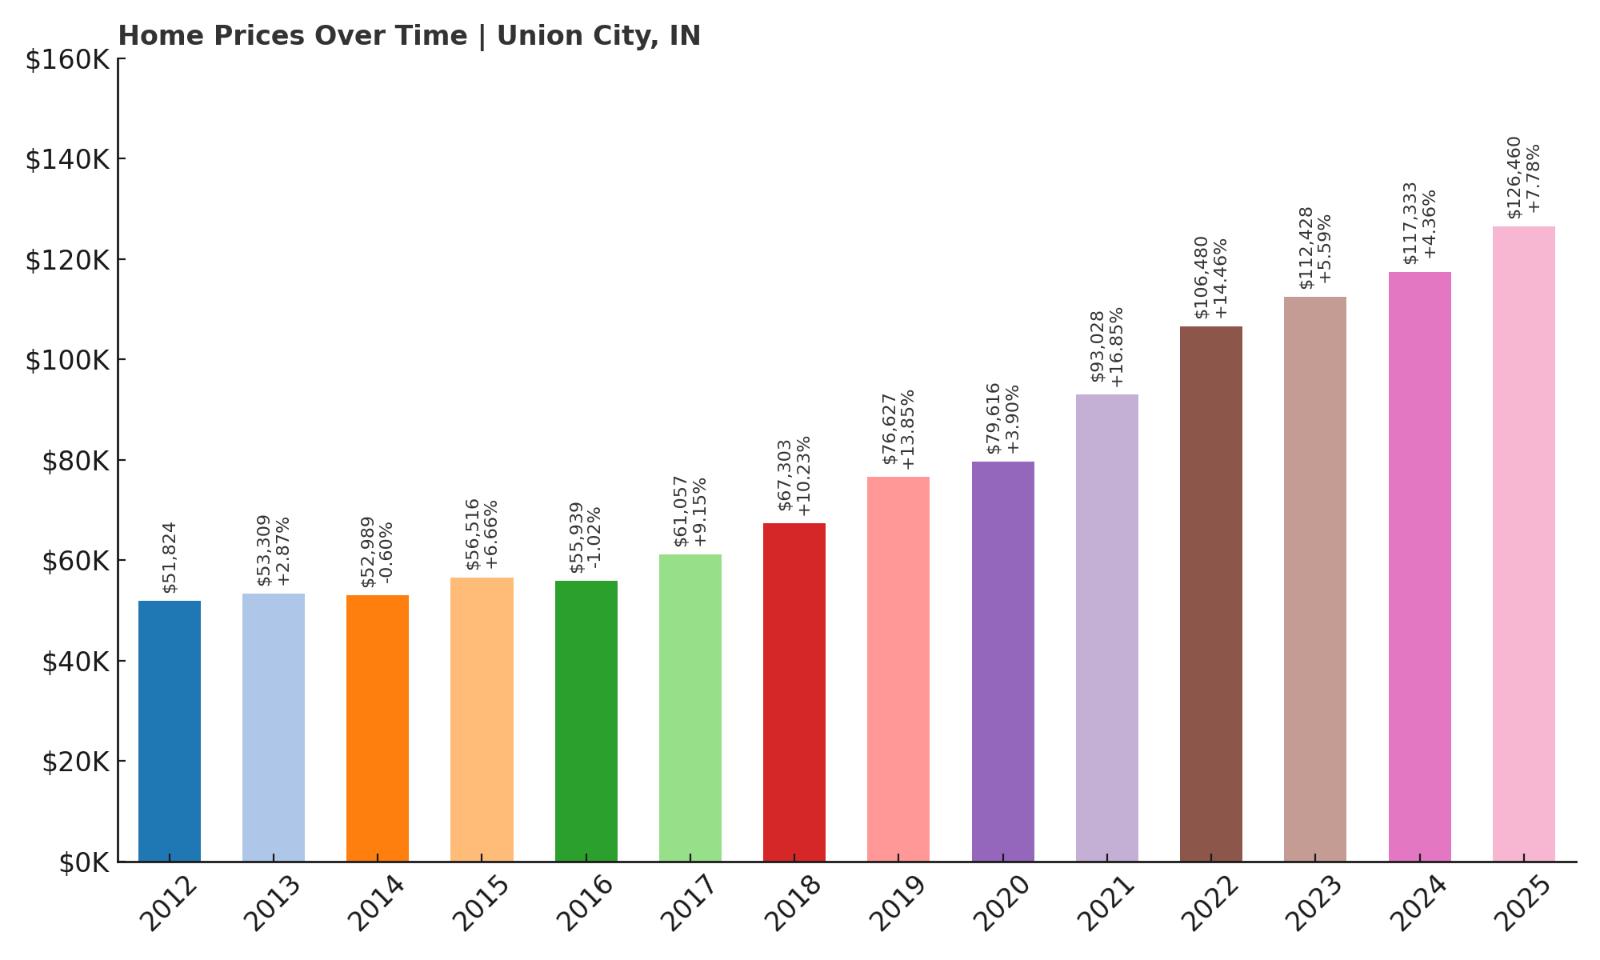
15. Union City – 144% Home Price Increase Since 2012
- 2010: N/A
- 2011: N/A
- 2012: $51,824
- 2013: $53,309 (+$1,485, +2.87% from previous year)
- 2014: $52,989 (-$320, -0.60% from previous year)
- 2015: $56,516 (+$3,527, +6.66% from previous year)
- 2016: $55,939 (-$577, -1.02% from previous year)
- 2017: $61,057 (+$5,118, +9.15% from previous year)
- 2018: $67,303 (+$6,246, +10.23% from previous year)
- 2019: $76,627 (+$9,324, +13.85% from previous year)
- 2020: $79,616 (+$2,989, +3.90% from previous year)
- 2021: $93,028 (+$13,412, +16.85% from previous year)
- 2022: $106,480 (+$13,451, +14.46% from previous year)
- 2023: $112,428 (+$5,948, +5.59% from previous year)
- 2024: $117,333 (+$4,905, +4.36% from previous year)
- 2025: $126,460 (+$9,127, +7.78% from previous year)
Union City has seen one of the sharpest rises in home values among Indiana’s affordable towns. Prices have soared 144% since 2012, moving from just over $51,000 to more than $126,000 in 2025. After a few early fluctuations, the housing market took off in 2017 and hasn’t looked back. Annual growth has consistently hovered around 5–15%, with especially strong gains in the post-2020 years. Even with that rise, homes here remain within reach for many buyers.
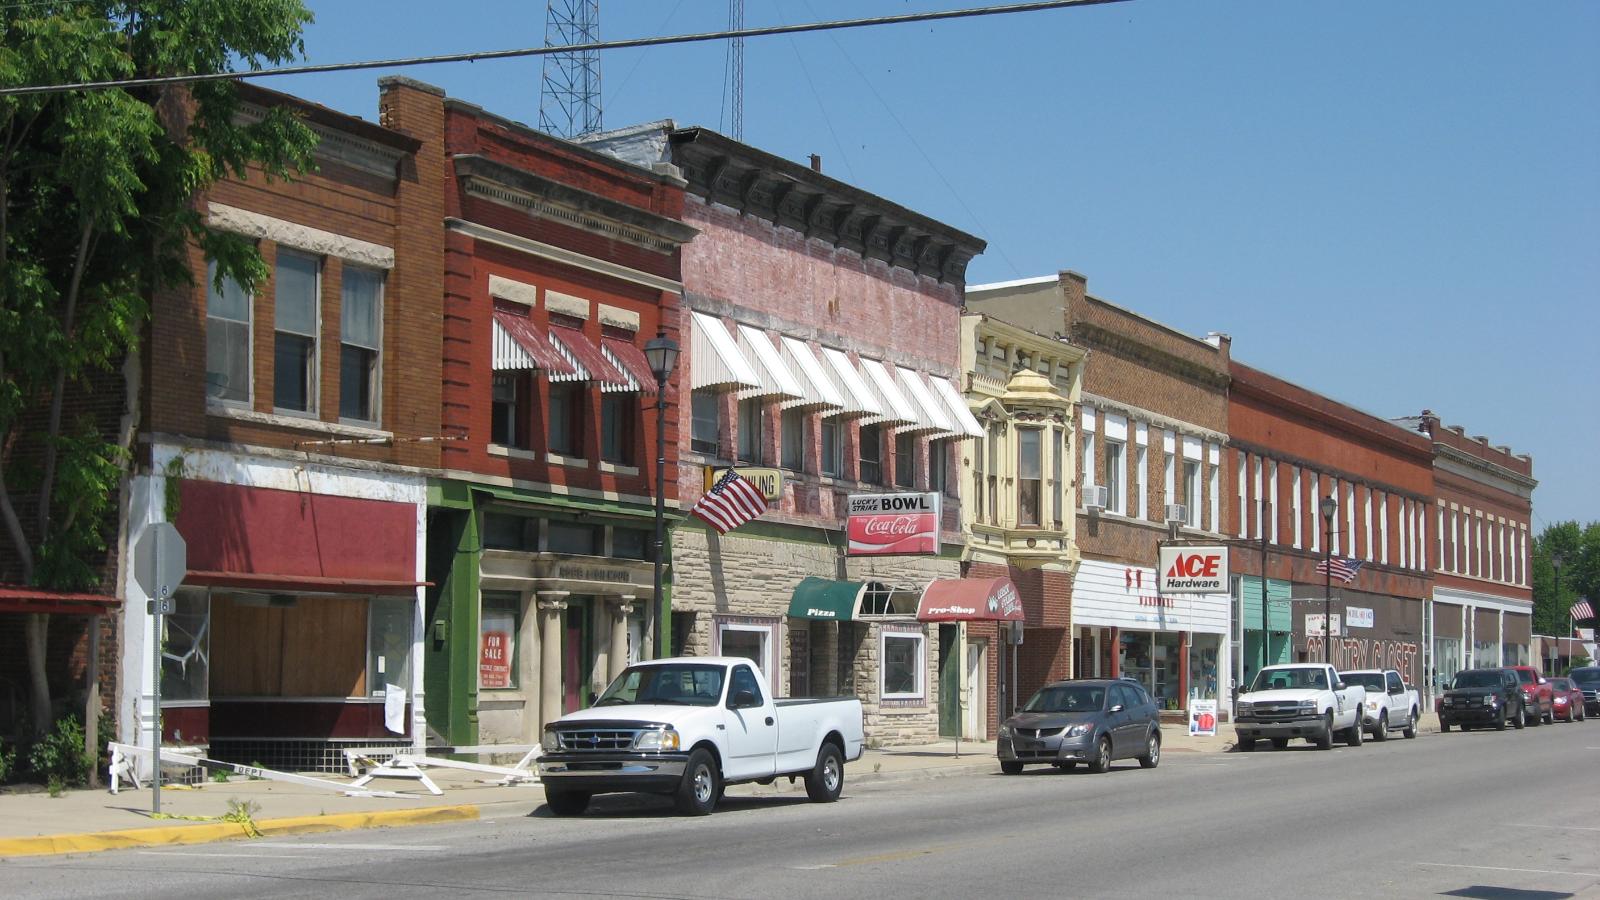
Union City – Cross-Border Value With Small-Town Convenience
Union City is uniquely positioned on the Indiana-Ohio state line, forming a twin town with its neighbor of the same name across the border. This location gives residents access to two school districts, two local governments, and dual-state amenities. Despite its relatively small size, Union City has a strong sense of community and an active arts and business scene for a rural area. It offers modest homes, quiet neighborhoods, and the conveniences of small-town living without feeling too remote.
The housing market here benefits from regional commuting patterns, with buyers often choosing Union City as a low-cost alternative to larger hubs like Richmond or Dayton. Its growing popularity is evident in the data—home values have continued climbing year after year. Still priced under $130,000, Union City remains one of the more affordable options in eastern Indiana with long-term upside for buyers seeking affordability and location flexibility.
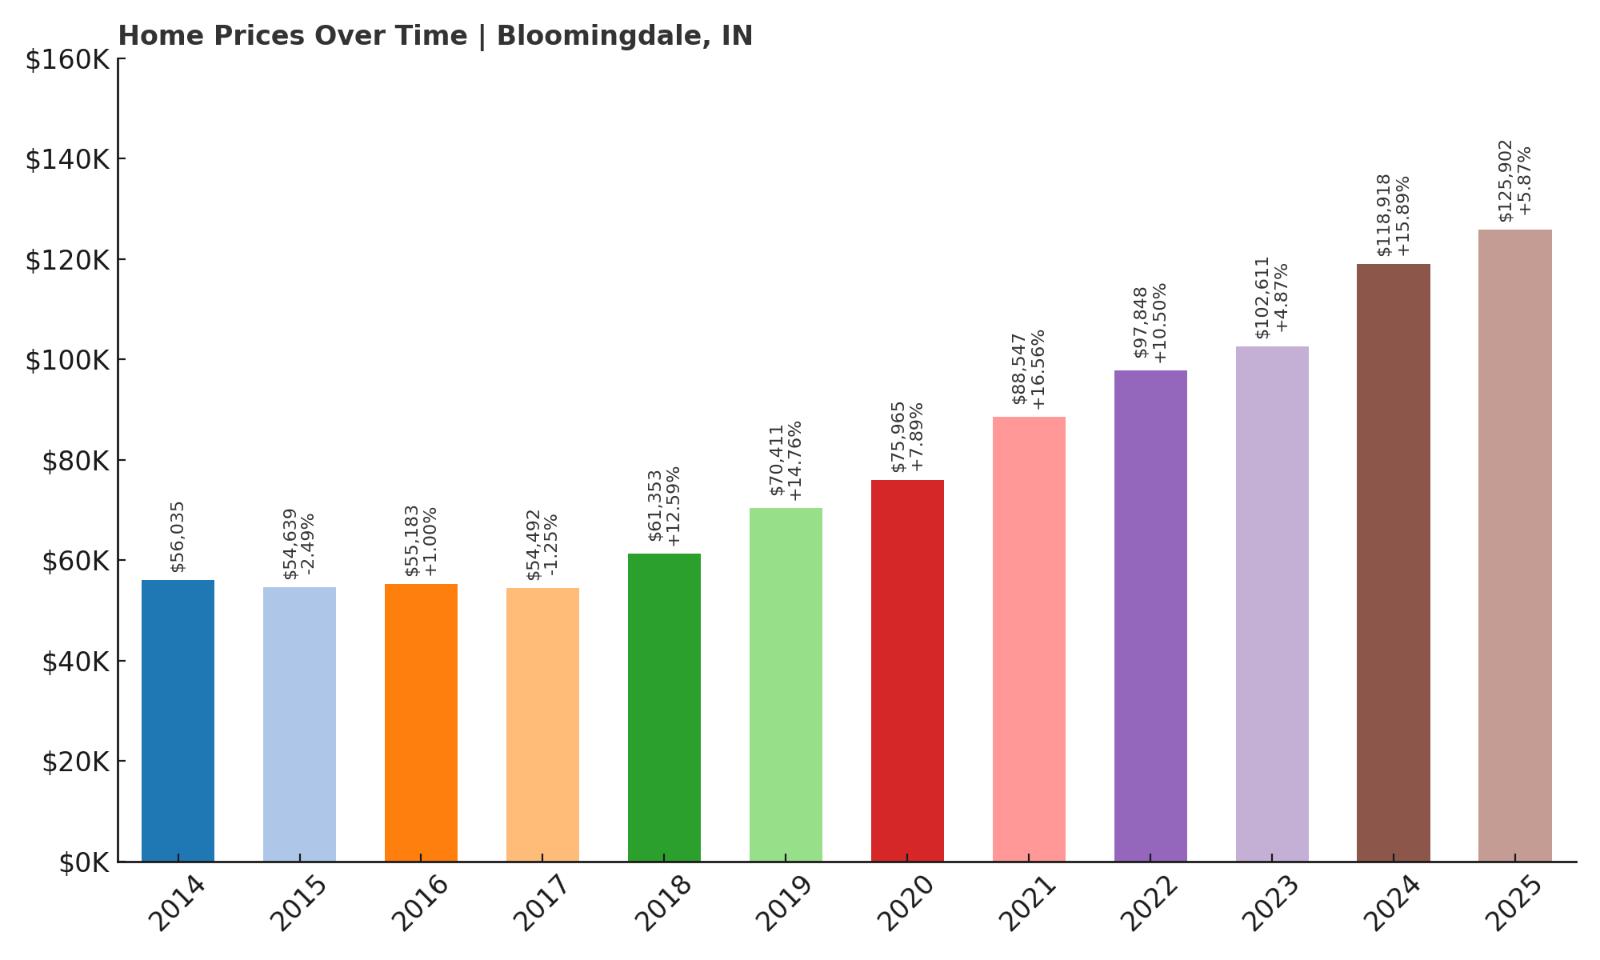
14. Bloomingdale – 125% Home Price Increase Since 2014
- 2010: N/A
- 2011: N/A
- 2012: N/A
- 2013: N/A
- 2014: $56,035
- 2015: $54,639 (-$1,396, -2.49% from previous year)
- 2016: $55,183 (+$544, +1.00% from previous year)
- 2017: $54,492 (-$691, -1.25% from previous year)
- 2018: $61,353 (+$6,861, +12.59% from previous year)
- 2019: $70,411 (+$9,058, +14.76% from previous year)
- 2020: $75,965 (+$5,554, +7.89% from previous year)
- 2021: $88,547 (+$12,581, +16.56% from previous year)
- 2022: $97,848 (+$9,301, +10.50% from previous year)
- 2023: $102,611 (+$4,763, +4.87% from previous year)
- 2024: $118,918 (+$16,307, +15.89% from previous year)
- 2025: $125,902 (+$6,983, +5.87% from previous year)
Home prices in Bloomingdale have risen dramatically since 2014, with values climbing from just over $56,000 to nearly $126,000 in 2025—a 125% increase. After a few years of flat or negative growth between 2014 and 2017, the market took off in 2018 with a double-digit jump and has maintained a steady upward trajectory since. The most significant gains came after 2020, with prices accelerating rapidly during the post-pandemic housing boom. Despite this growth, Bloomingdale remains one of the most affordable places to buy in Indiana.
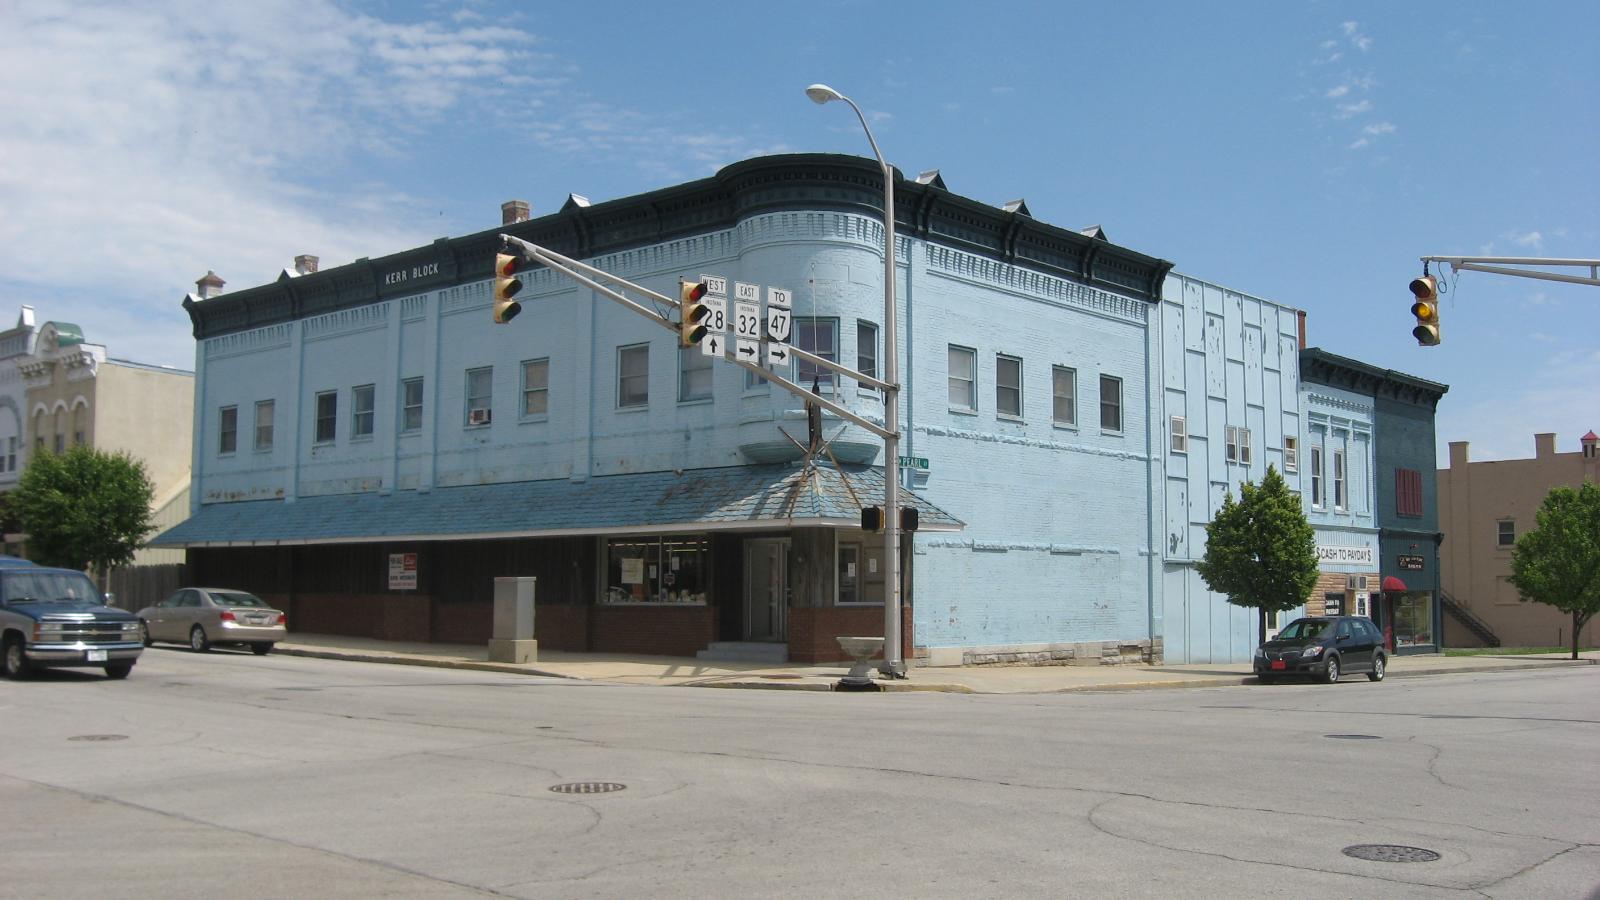
Bloomingdale – Quiet Growth in a Parke County Village

Bloomingdale is a tiny village tucked into the woodlands of Parke County in western Indiana, best known for its covered bridges and rustic countryside. With a population of less than 300 people, it offers a peaceful, nature-oriented lifestyle far from the pressures of city living. This town is surrounded by scenic trails, creeks, and state parks, including Turkey Run and Shades, making it a draw for outdoor enthusiasts and those seeking solitude. While the housing stock is small, demand has grown as buyers look beyond Indiana’s metro areas for cheaper, more relaxed alternatives.
The recent rise in home values reflects limited inventory meeting renewed interest from out-of-town buyers. Bloomingdale’s affordability, combined with its quiet charm and access to natural amenities, has made it an appealing option for remote workers, downsizers, and long-time renters hoping to transition into ownership. Even with prices nearing $126,000, it still provides far more square footage and land than urban markets at the same price. It’s a classic example of how small-town Indiana is evolving quietly—but steadily—in today’s real estate climate.
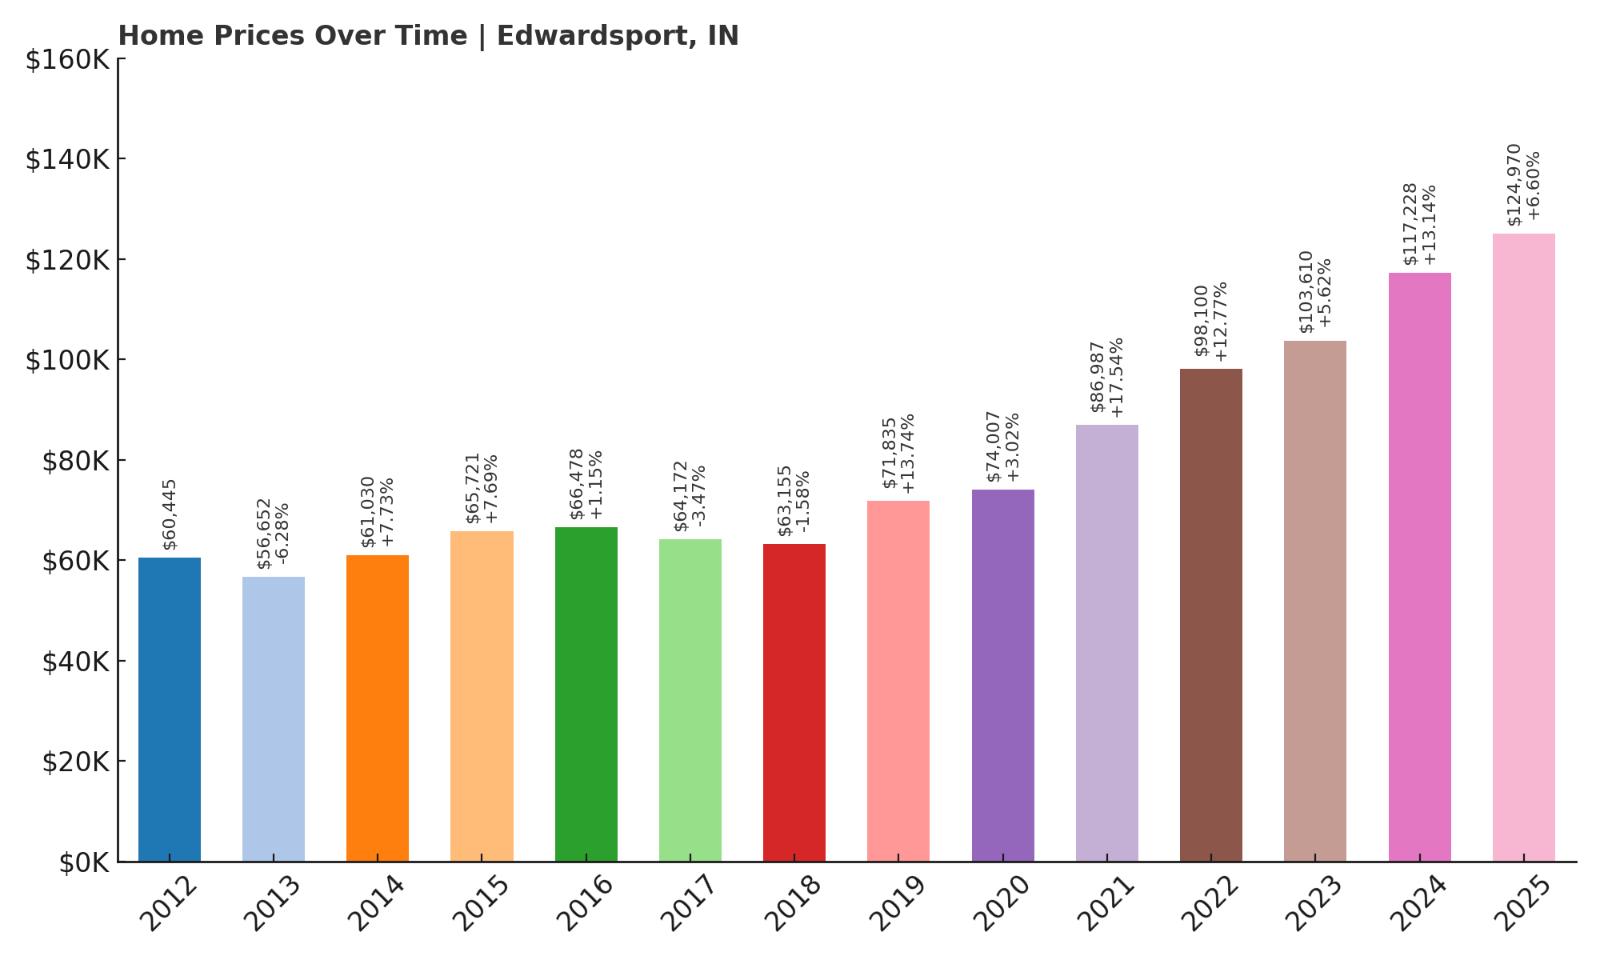
13. Edwardsport – 107% Home Price Increase Since 2012
- 2010: N/A
- 2011: N/A
- 2012: $60,445
- 2013: $56,652 (-$3,794, -6.28% from previous year)
- 2014: $61,030 (+$4,379, +7.73% from previous year)
- 2015: $65,721 (+$4,691, +7.69% from previous year)
- 2016: $66,478 (+$757, +1.15% from previous year)
- 2017: $64,172 (-$2,306, -3.47% from previous year)
- 2018: $63,155 (-$1,017, -1.58% from previous year)
- 2019: $71,835 (+$8,680, +13.74% from previous year)
- 2020: $74,007 (+$2,173, +3.02% from previous year)
- 2021: $86,987 (+$12,980, +17.54% from previous year)
- 2022: $98,100 (+$11,112, +12.77% from previous year)
- 2023: $103,610 (+$5,510, +5.62% from previous year)
- 2024: $117,228 (+$13,618, +13.14% from previous year)
- 2025: $124,970 (+$7,742, +6.60% from previous year)
Edwardsport has experienced a 107% increase in home prices since 2012, rising from just over $60,000 to nearly $125,000 in 2025. The early years saw some fluctuation, with values dipping slightly in 2013 and again in 2017–2018. But since 2019, the market has gained steady momentum, with back-to-back years of healthy appreciation. Recent gains in 2024 and 2025 underscore the continued upward trend, even as prices remain highly affordable compared to broader state and national averages.
Edwardsport – Energy Industry Legacy and Small-Town Affordability
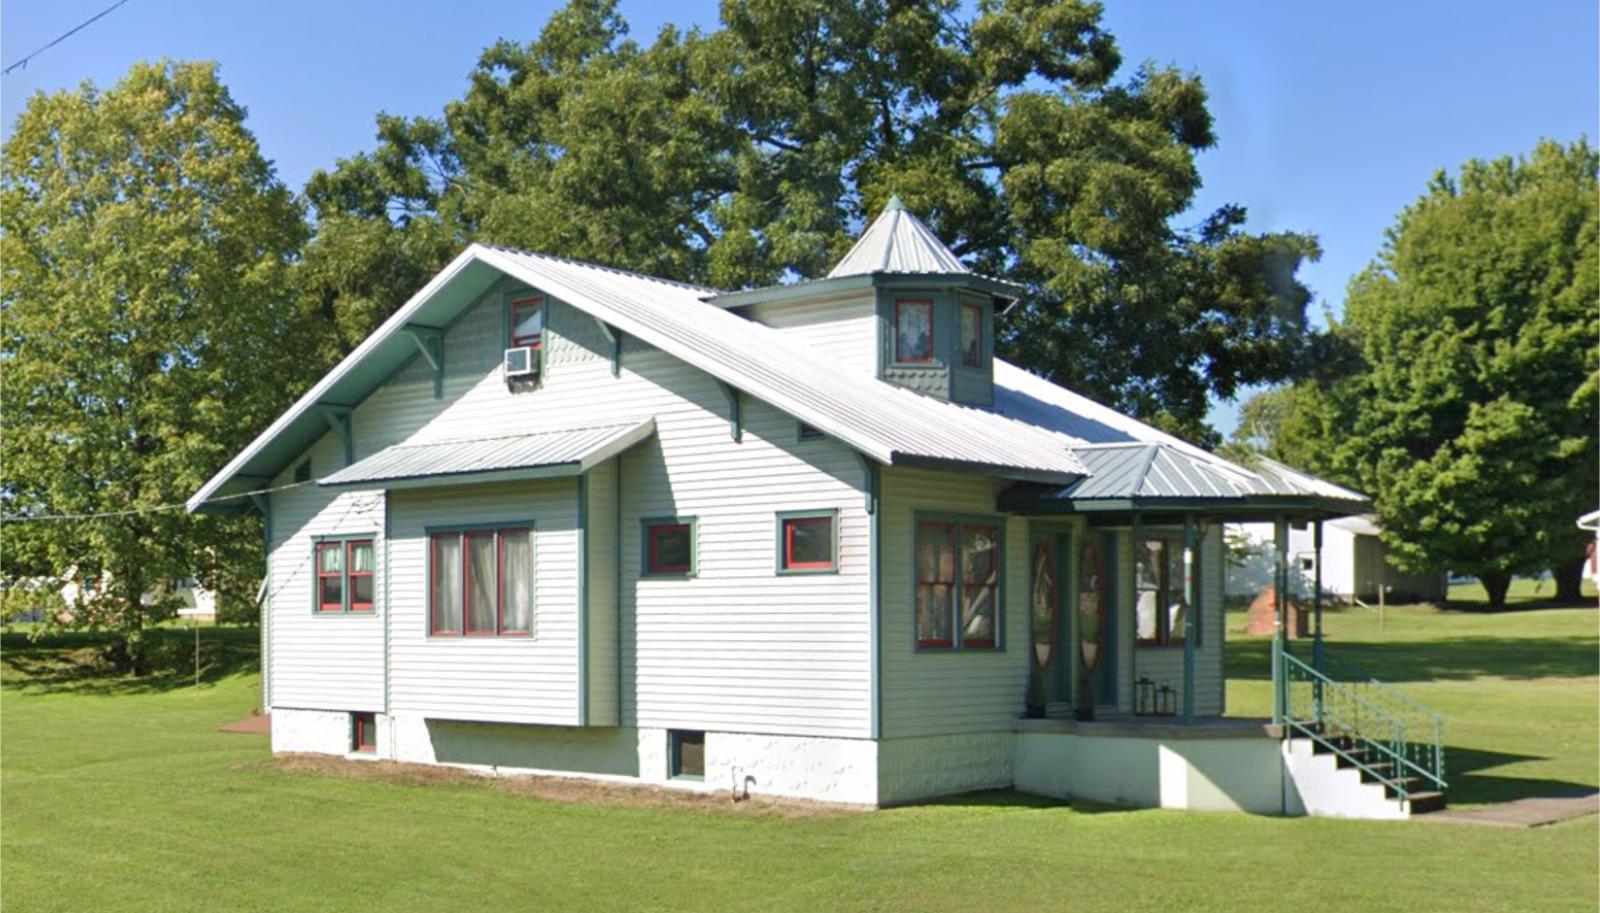
Edwardsport is a small town in Knox County, known primarily for the presence of the Edwardsport Power Station, one of the largest integrated coal gasification plants in the U.S. While that industrial footprint has shaped the local economy, the residential side of town remains quiet, modest, and affordable. With fewer than 300 residents, Edwardsport is truly a tiny place—but for those seeking space and low costs, it punches above its weight. The surrounding area offers access to rural farmland, the White River, and the nearby city of Vincennes for additional services.
The town’s real estate market likely benefits from a mix of investor interest and regional affordability pressures pushing buyers toward smaller communities. Many of the homes here are single-story ranches or early 20th-century builds on large lots. Edwardsport’s recent home price increases reflect demand from budget-conscious buyers who are willing to trade amenities for value. At just under $125,000, it remains a compelling choice for those seeking stable pricing, simple living, and proximity to regional job centers without the higher costs found elsewhere in Indiana.
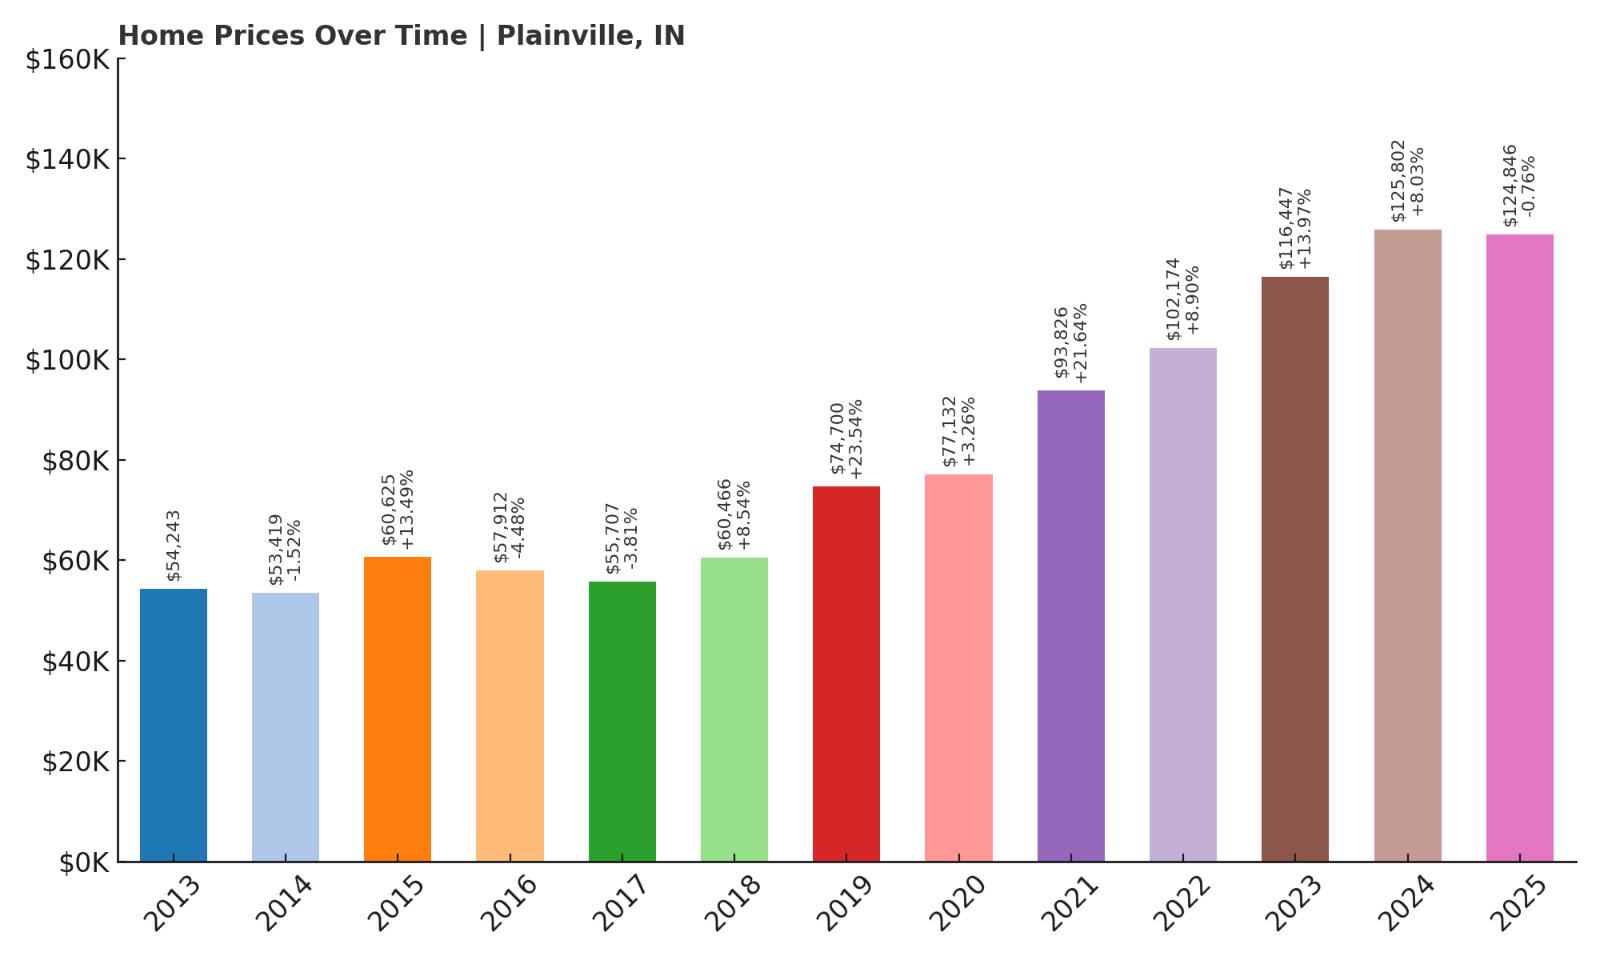
12. Plainville – 130% Home Price Increase Since 2013
- 2010: N/A
- 2011: N/A
- 2012: N/A
- 2013: $54,243
- 2014: $53,419 (-$825, -1.52% from previous year)
- 2015: $60,625 (+$7,207, +13.49% from previous year)
- 2016: $57,912 (-$2,713, -4.48% from previous year)
- 2017: $55,707 (-$2,205, -3.81% from previous year)
- 2018: $60,466 (+$4,758, +8.54% from previous year)
- 2019: $74,700 (+$14,235, +23.54% from previous year)
- 2020: $77,132 (+$2,432, +3.26% from previous year)
- 2021: $93,826 (+$16,694, +21.64% from previous year)
- 2022: $102,174 (+$8,347, +8.90% from previous year)
- 2023: $116,447 (+$14,273, +13.97% from previous year)
- 2024: $125,802 (+$9,355, +8.03% from previous year)
- 2025: $124,846 (-$956, -0.76% from previous year)
Plainville’s home prices have climbed 130% since 2013, increasing from about $54,000 to nearly $125,000 in just over a decade. The market showed some volatility in the earlier years, with dips in 2014 through 2017. But beginning in 2018, price growth picked up substantially, led by double-digit increases in 2019 and 2021. The most recent data shows a slight dip in 2025, but overall growth has been substantial and consistent in the years leading up to it.
Plainville – Quiet Growth in a Tight-Knit Community
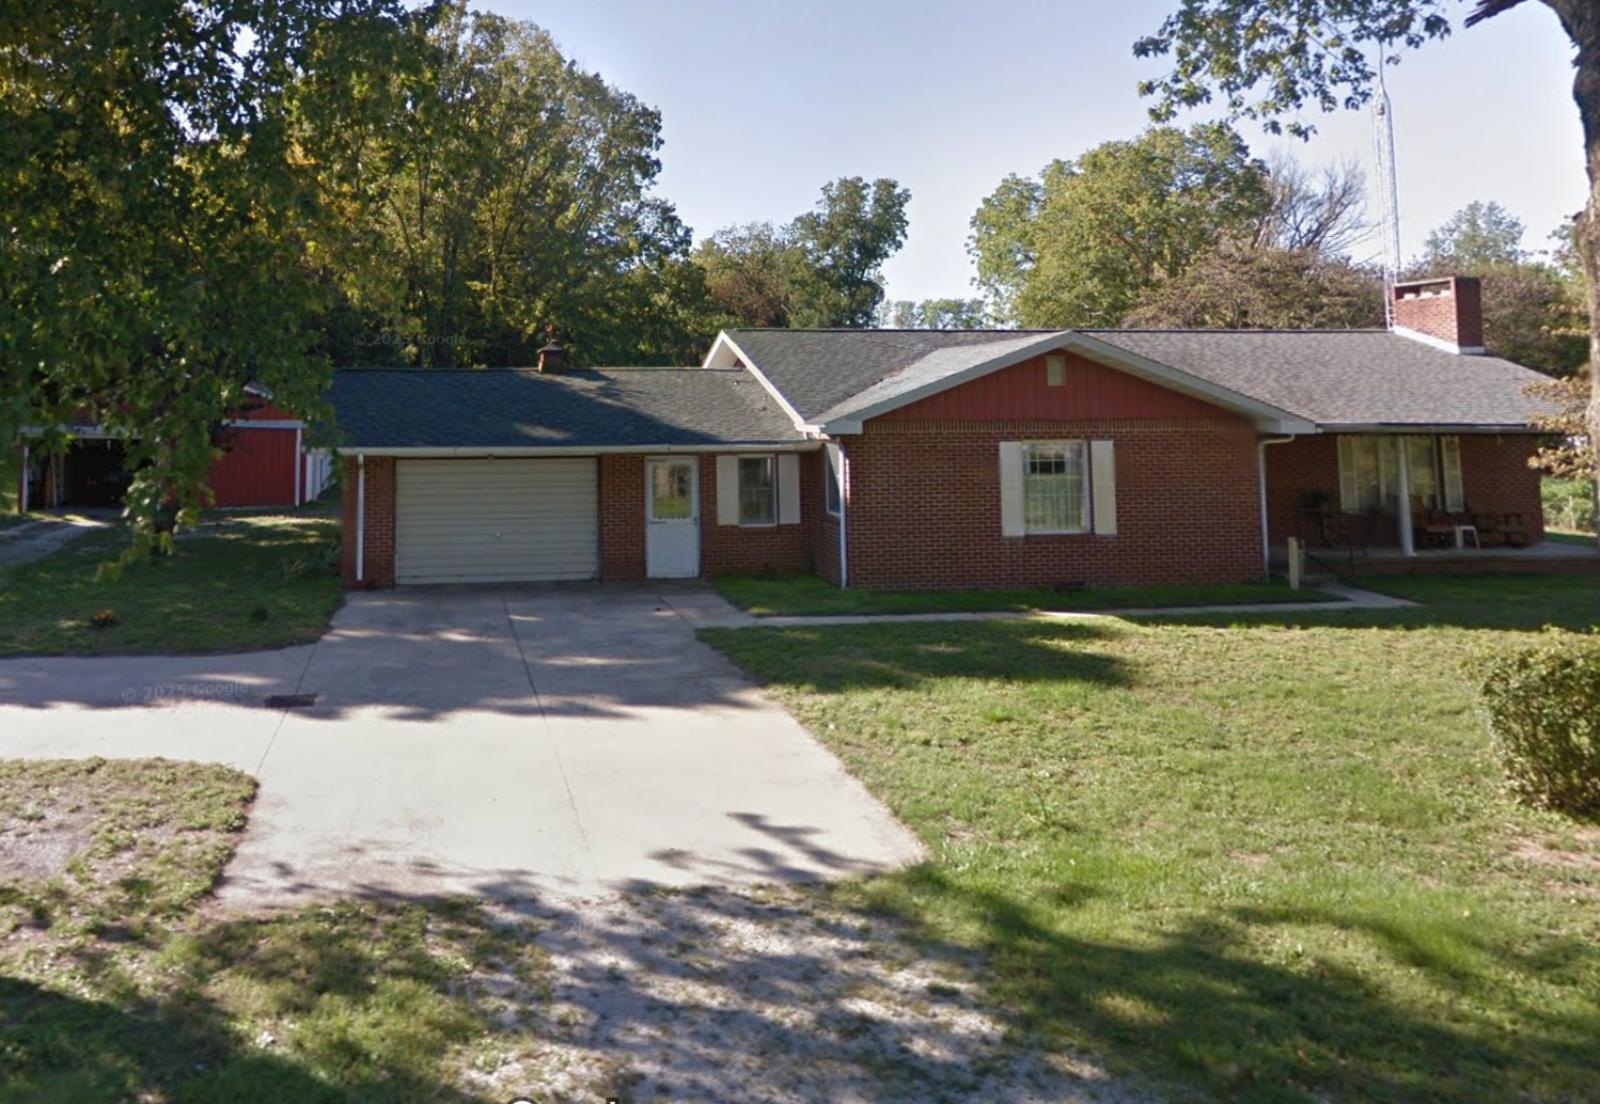
Plainville is a small town in Daviess County, southwest Indiana, located just north of Washington. Home to a few hundred residents, it’s the kind of place where people know each other and neighborhoods remain stable for years. Its modest growth in real estate prices has come without major commercial development or outside speculation. Most buyers here are locals or people moving in from nearby towns, drawn by low prices, rural peace, and proximity to regional employers in Washington and Vincennes.
While the town offers few amenities of its own, it benefits from its position just off U.S. Route 57, making it accessible while still remote. The housing stock includes a mix of older homes and more recent renovations, with plenty of space and low overhead. As prices across the state have risen, Plainville has emerged as a viable, cost-effective option for buyers who want to avoid the higher competition and tighter markets found elsewhere. Even with the small dip in 2025, home values remain strong, and the town still delivers exceptional affordability in Indiana’s evolving real estate market.
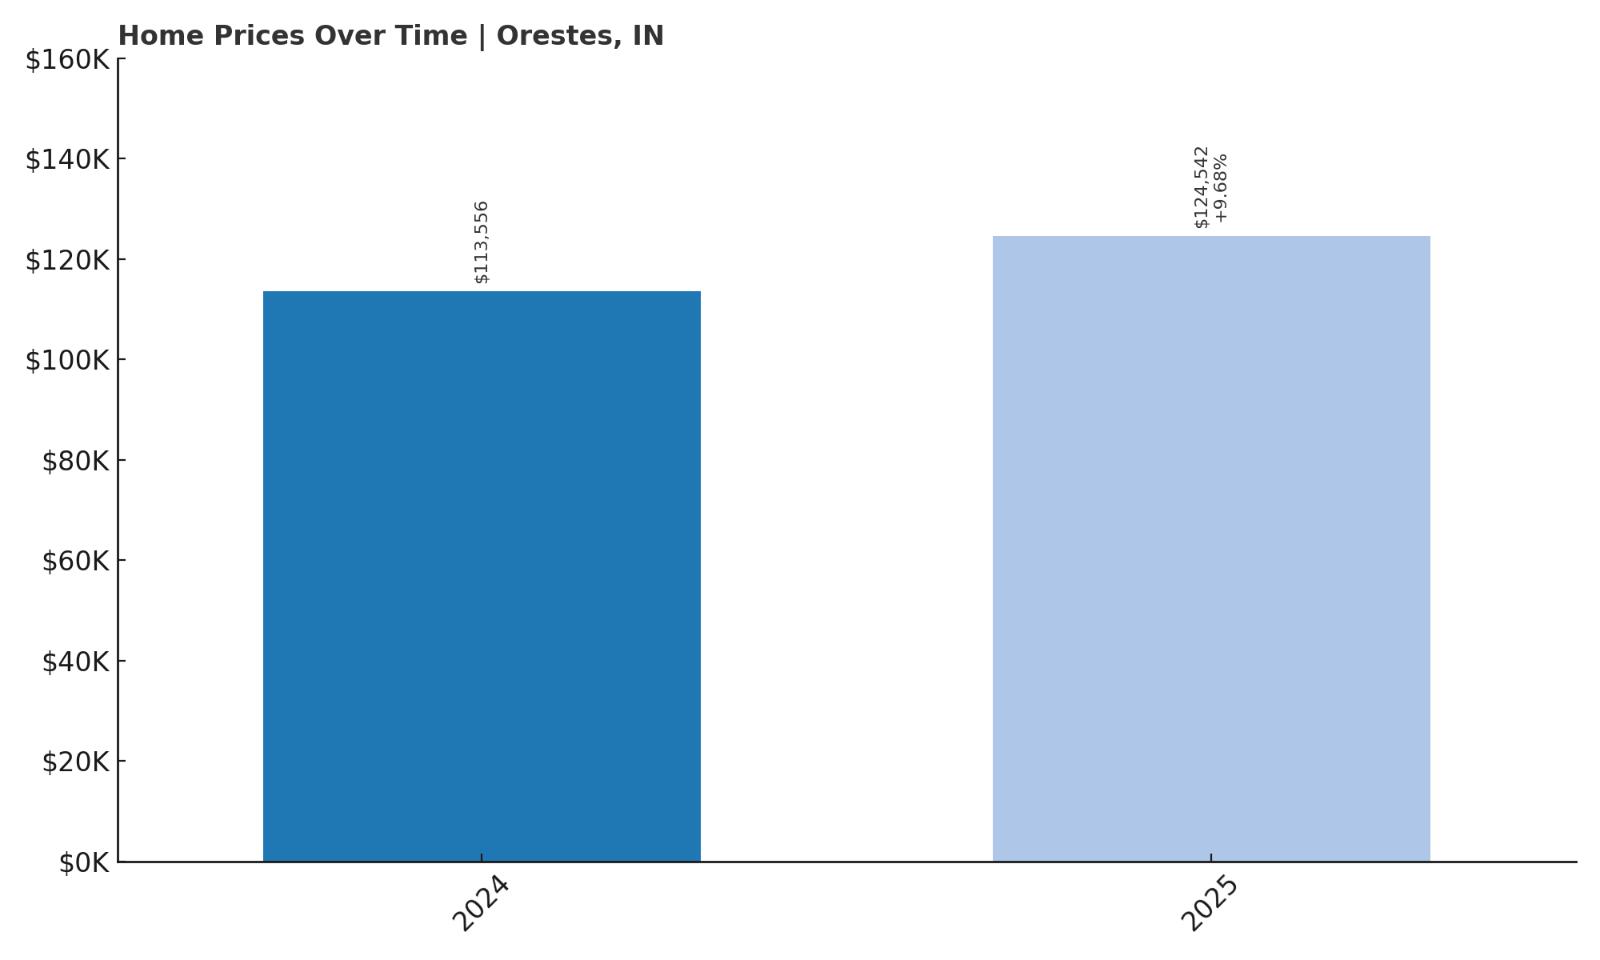
11. Orestes – 10% Home Price Increase Since 2024
🔥 Would you like to save this?
- 2010: N/A
- 2011: N/A
- 2012: N/A
- 2013: N/A
- 2014: N/A
- 2015: N/A
- 2016: N/A
- 2017: N/A
- 2018: N/A
- 2019: N/A
- 2020: N/A
- 2021: N/A
- 2022: N/A
- 2023: N/A
- 2024: $113,556
- 2025: $124,542 (+$10,987, +9.68% from previous year)
Orestes has only two years of Zillow data available, but in that short time, it has already shown a promising jump in home values. From $113,556 in 2024 to $124,542 in 2025, prices rose by nearly 10% year-over-year. That level of appreciation in a single year puts it on par with some of Indiana’s fastest-growing affordable markets. While we can’t analyze long-term trends, the recent price bump indicates rising demand and movement in this small town’s housing sector.
Orestes – A Tiny Town With Fresh Momentum
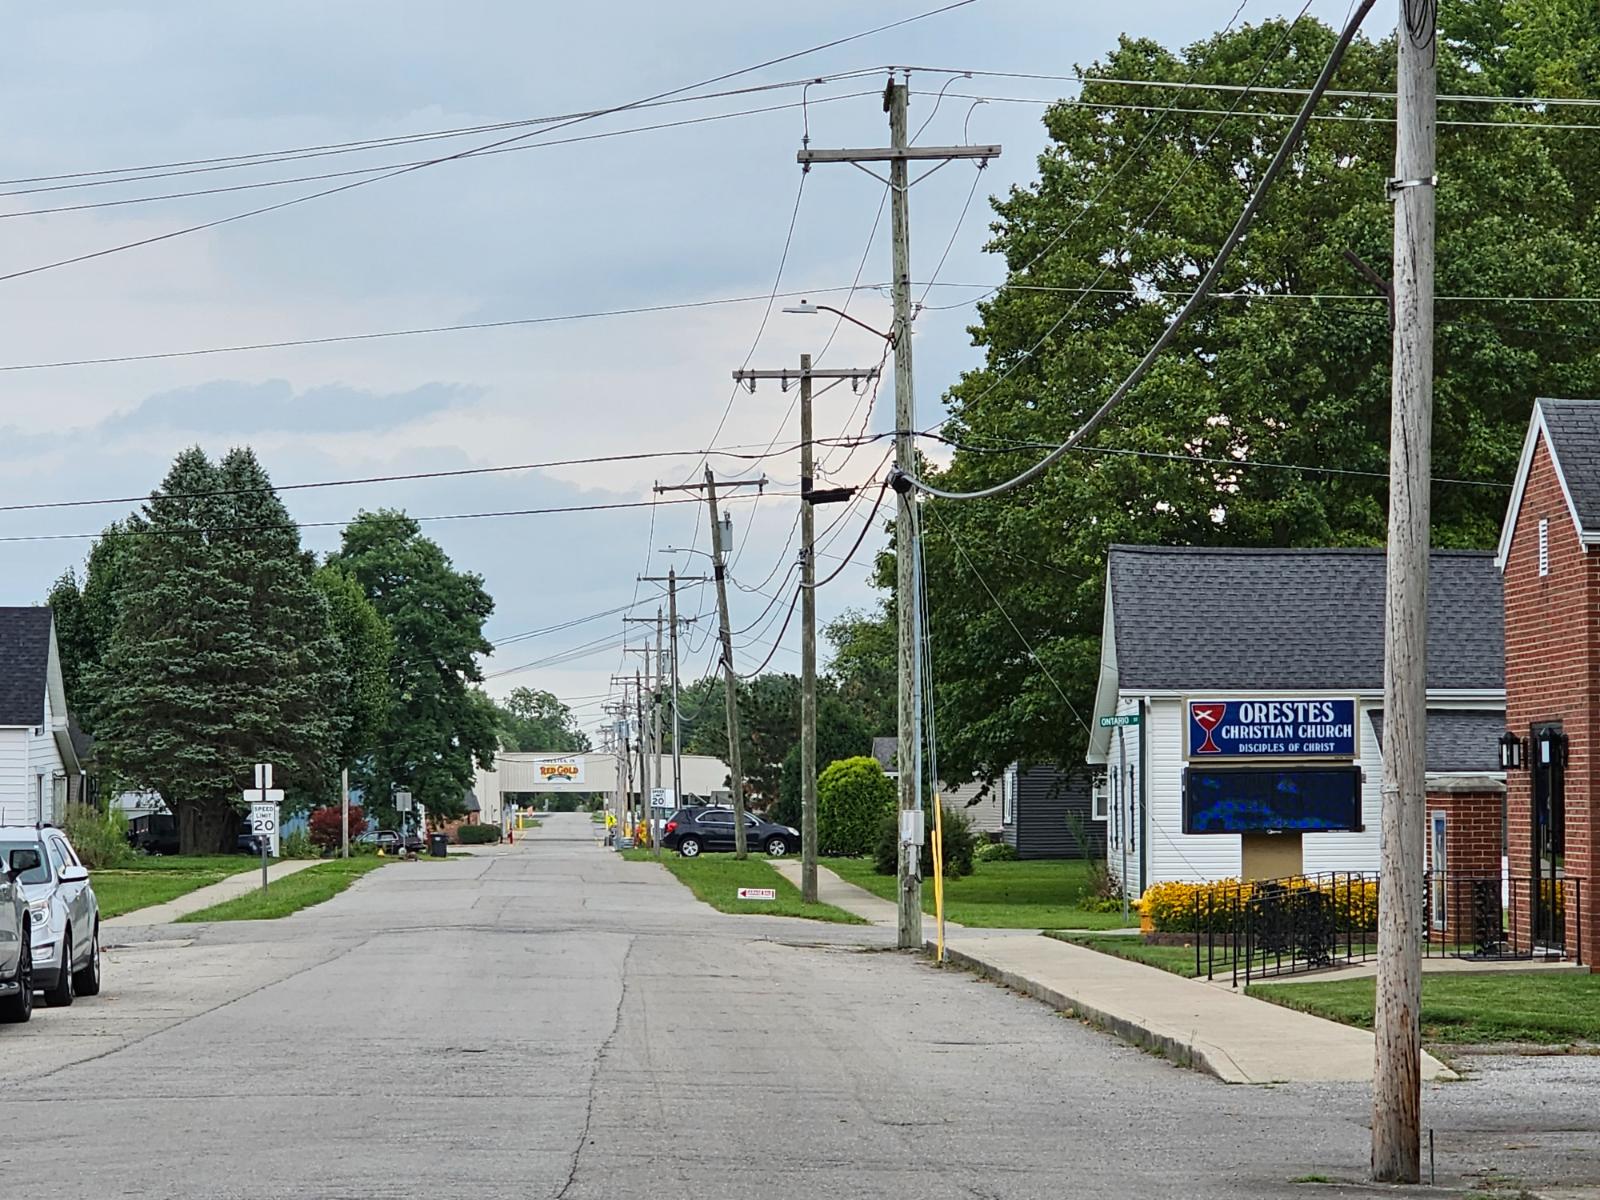
Orestes is a very small town in Madison County, located about 50 miles northeast of Indianapolis and just a short drive from the city of Anderson. With a population of under 400, it’s one of the smallest communities on this list. For decades, Orestes has flown under the radar, with very little real estate turnover or market activity. But its affordability and location near larger towns like Elwood and Alexandria have recently begun drawing attention from first-time buyers and those priced out of surrounding markets.
What makes Orestes appealing is its quiet setting combined with easy access to State Road 28 and the broader Muncie-Anderson corridor. Housing options here are extremely limited, but for those who find a property, prices are among the most competitive in central Indiana. The nearly $11,000 increase between 2024 and 2025 suggests that even towns with little market history are now catching the attention of value-seeking buyers. While there’s still too little data to call it a long-term trend, Orestes is one to watch in the years ahead.
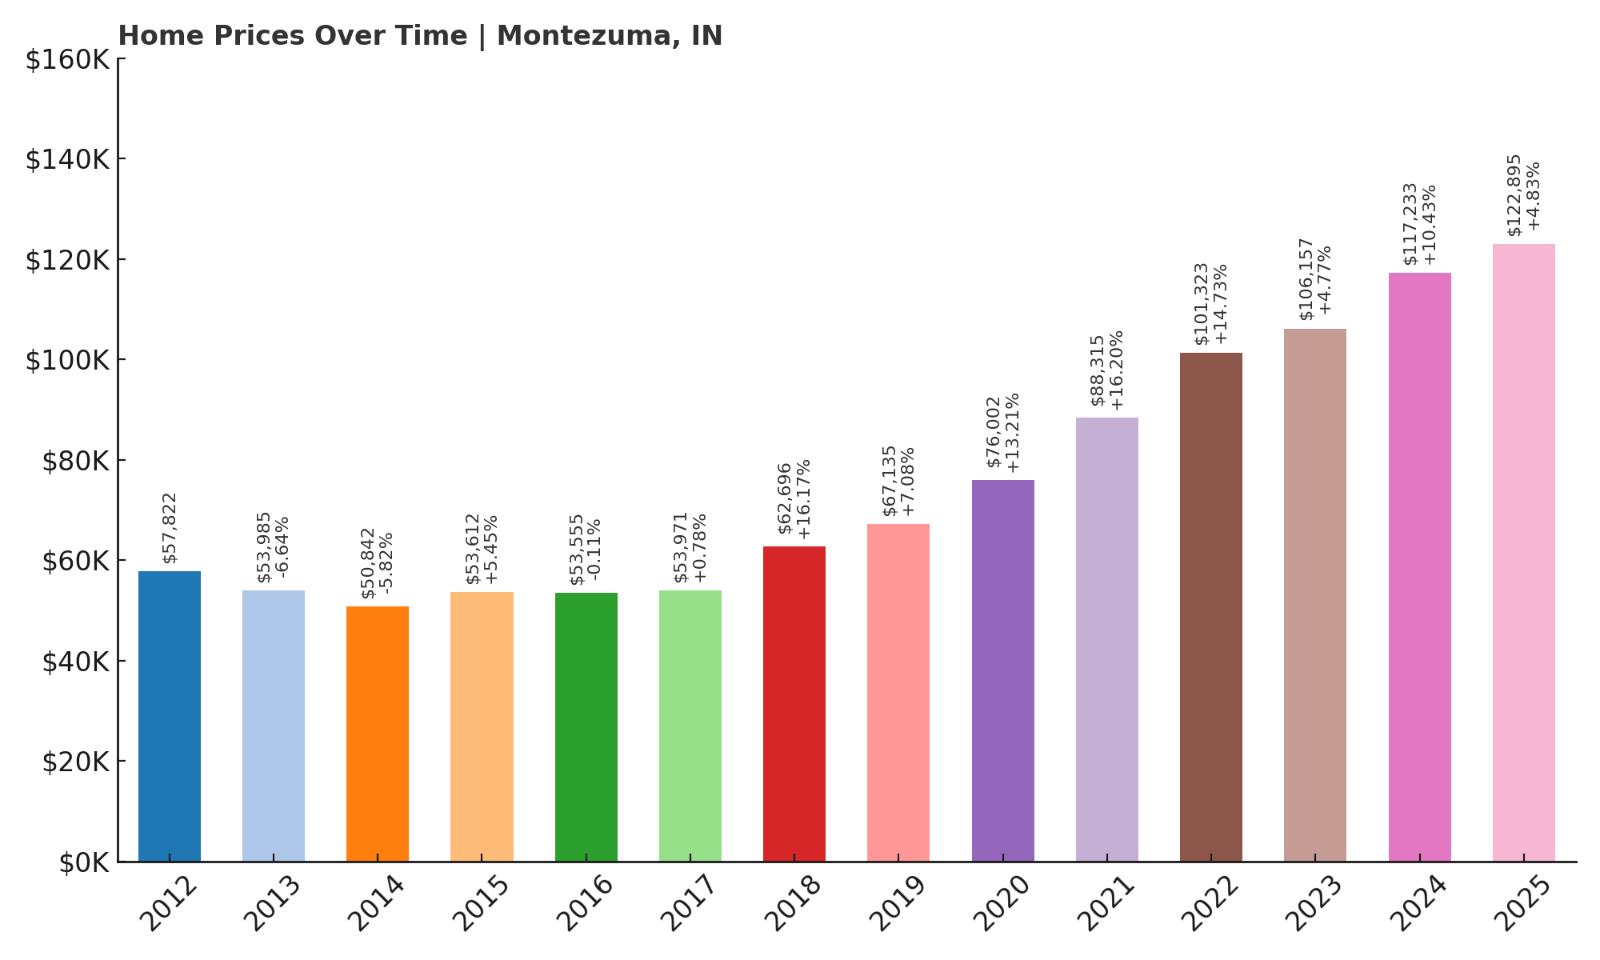
10. Montezuma – 113% Home Price Increase Since 2012
- 2010: N/A
- 2011: N/A
- 2012: $57,822
- 2013: $53,985 (-$3,836, -6.64% from previous year)
- 2014: $50,842 (-$3,143, -5.82% from previous year)
- 2015: $53,612 (+$2,770, +5.45% from previous year)
- 2016: $53,555 (-$57, -0.11% from previous year)
- 2017: $53,971 (+$416, +0.78% from previous year)
- 2018: $62,696 (+$8,725, +16.17% from previous year)
- 2019: $67,135 (+$4,438, +7.08% from previous year)
- 2020: $76,002 (+$8,867, +13.21% from previous year)
- 2021: $88,315 (+$12,313, +16.20% from previous year)
- 2022: $101,323 (+$13,008, +14.73% from previous year)
- 2023: $106,157 (+$4,834, +4.77% from previous year)
- 2024: $117,233 (+$11,075, +10.43% from previous year)
- 2025: $122,895 (+$5,662, +4.83% from previous year)
Montezuma has more than doubled its home values since 2012, climbing from just under $58,000 to nearly $123,000 in 2025—an impressive 113% increase. The town saw a brief decline in the early 2010s, but starting in 2018, appreciation picked up significantly. From 2020 onward, price growth accelerated sharply, with several double-digit gains year over year. Even as the pace has cooled slightly, Montezuma’s market remains one of the most affordable with strong upward momentum.
Montezuma – A River Town on the Rise
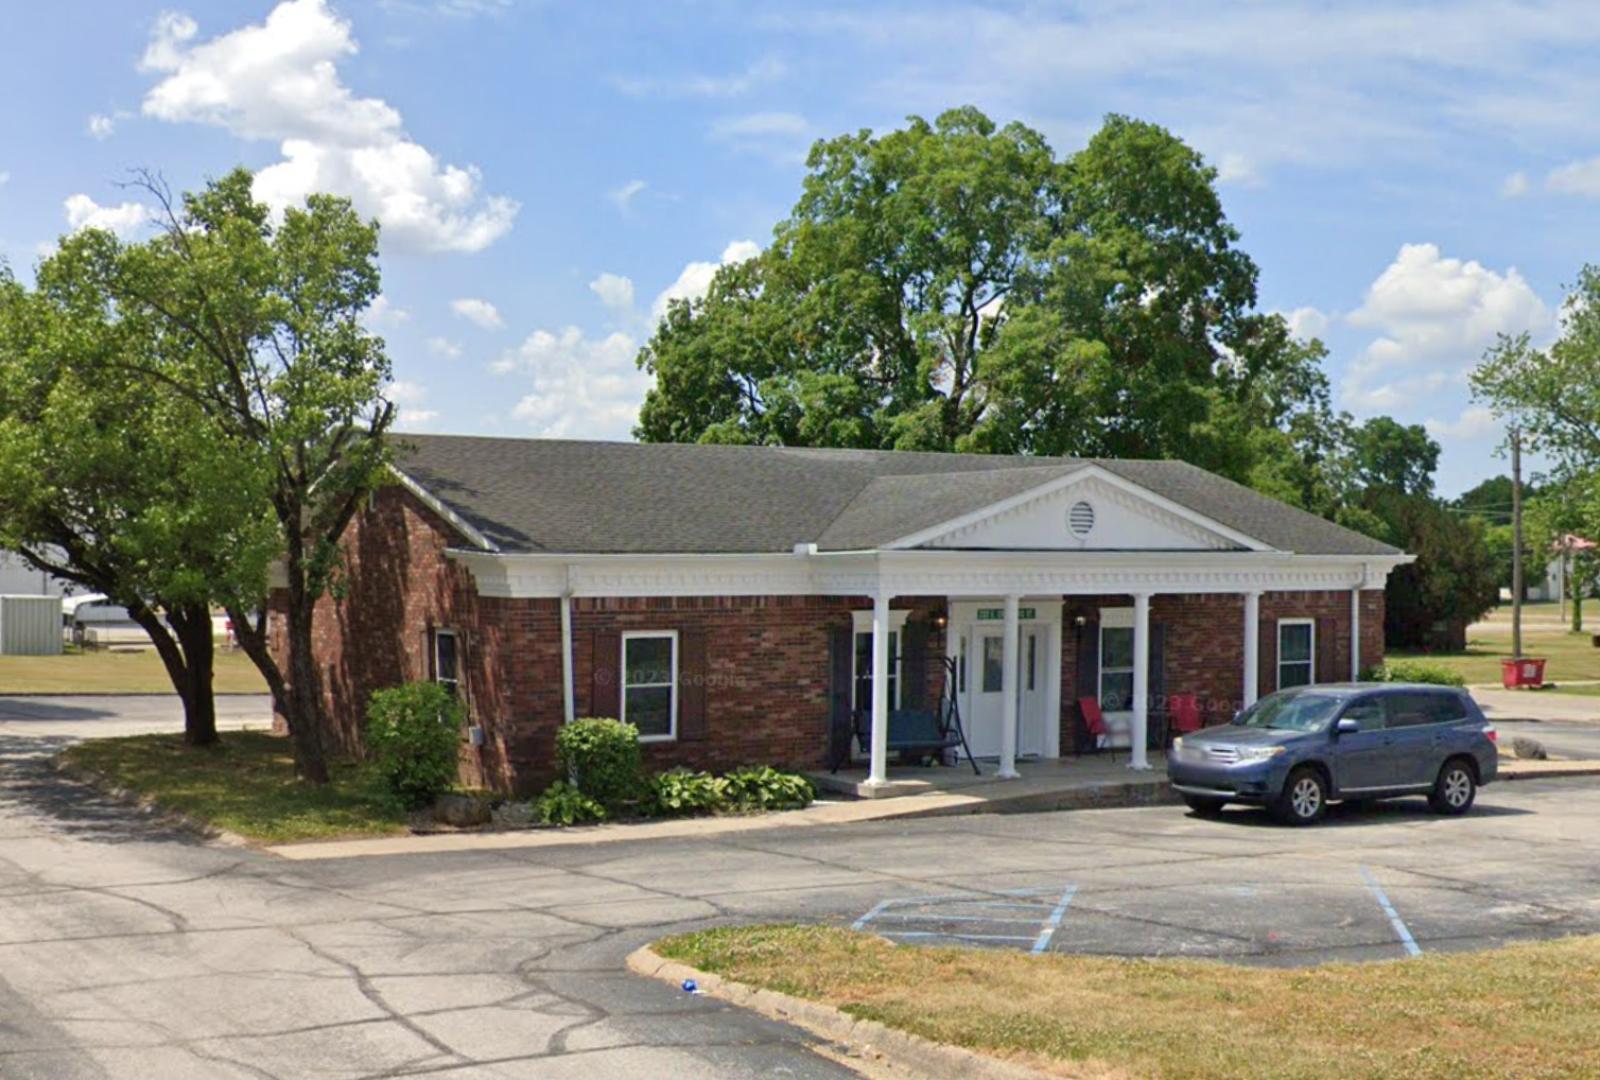
Montezuma is located in Parke County in western Indiana, along the Wabash River and just a few miles from the Illinois border. This small town, with fewer than 1,000 residents, is part of the region known for its scenic covered bridges and historic charm. While Montezuma has long been considered a quiet rural town with limited economic activity, its proximity to larger job markets like Terre Haute has made it an increasingly attractive option for cost-conscious homebuyers.
The recent surge in home prices reflects growing interest from both local and regional buyers seeking value outside metro areas. Housing options here are still limited, but they often include modest single-family homes on large lots. Residents enjoy access to outdoor recreation, including boating, fishing, and hiking along the Wabash. With home values still under $125,000, Montezuma offers affordability combined with a strong track record of appreciation—a rare combination in today’s market.
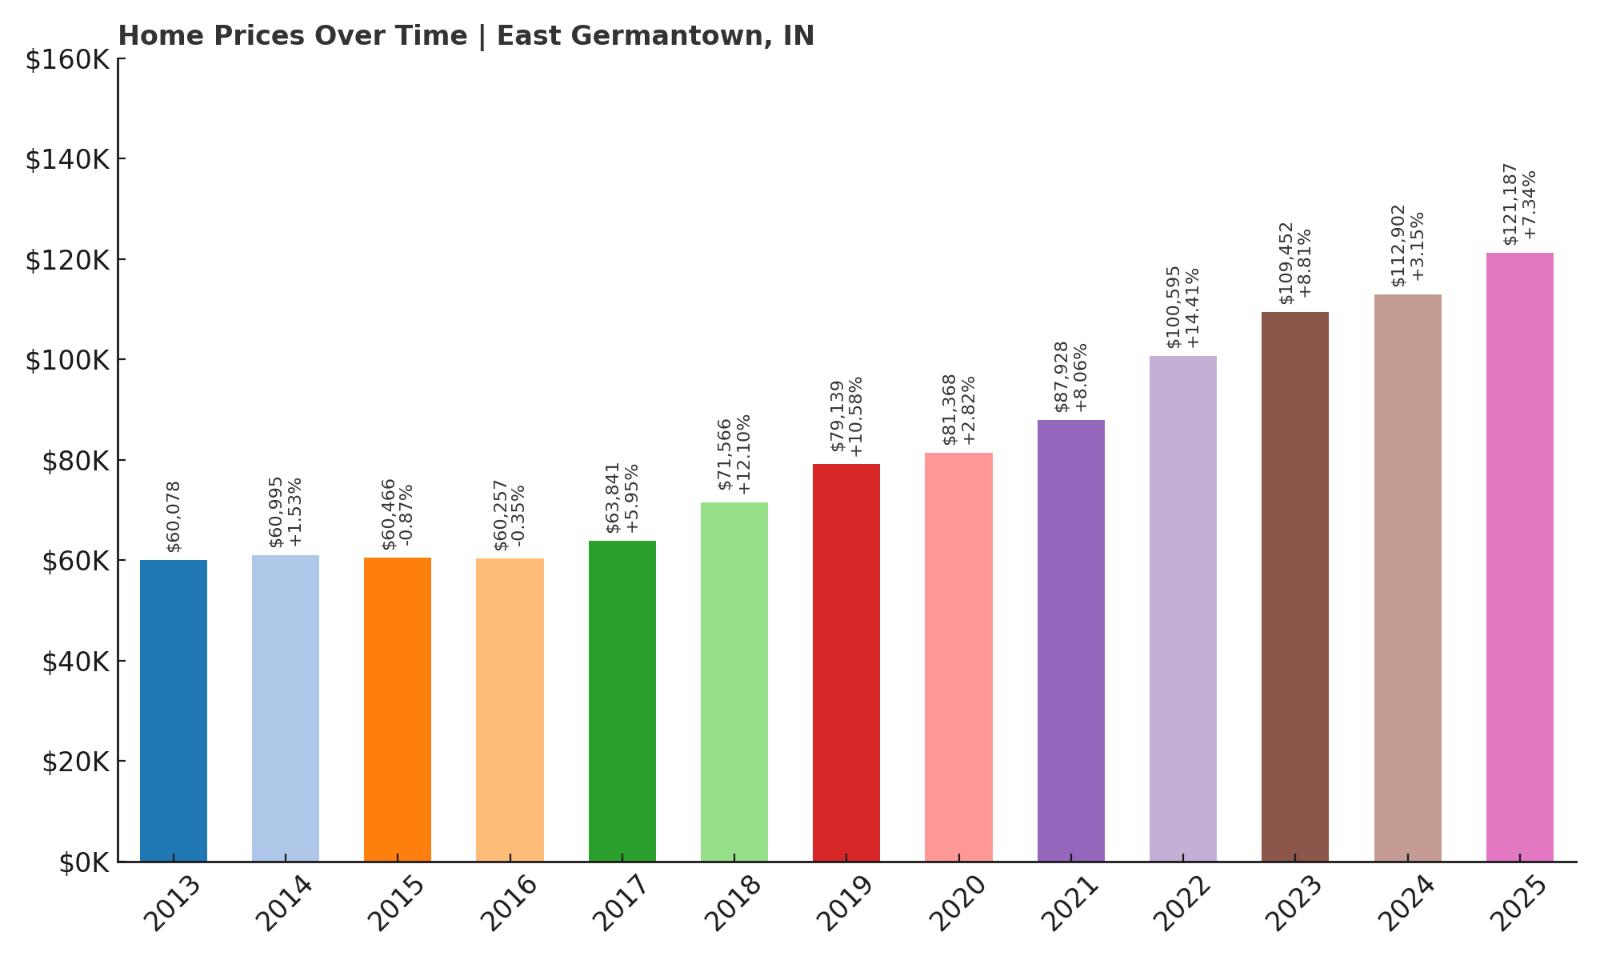
9. East Germantown – 102% Home Price Increase Since 2013
- 2010: N/A
- 2011: N/A
- 2012: N/A
- 2013: $60,078
- 2014: $60,995 (+$918, +1.53% from previous year)
- 2015: $60,466 (-$529, -0.87% from previous year)
- 2016: $60,257 (-$209, -0.35% from previous year)
- 2017: $63,841 (+$3,584, +5.95% from previous year)
- 2018: $71,566 (+$7,726, +12.10% from previous year)
- 2019: $79,139 (+$7,572, +10.58% from previous year)
- 2020: $81,368 (+$2,229, +2.82% from previous year)
- 2021: $87,928 (+$6,561, +8.06% from previous year)
- 2022: $100,595 (+$12,666, +14.41% from previous year)
- 2023: $109,452 (+$8,858, +8.81% from previous year)
- 2024: $112,902 (+$3,449, +3.15% from previous year)
- 2025: $121,187 (+$8,285, +7.34% from previous year)
East Germantown has more than doubled its home values since 2013, with prices rising from $60,078 to $121,187—a 102% increase. The market remained flat through 2016, but from 2017 onward, appreciation gained steady momentum. Double-digit growth in both 2018 and 2019 marked the beginning of a new trend, with the town continuing to post healthy annual gains through 2025. Though still highly affordable, East Germantown has clearly entered a phase of stable, long-term price growth.
East Germantown – Quiet Value in Wayne County
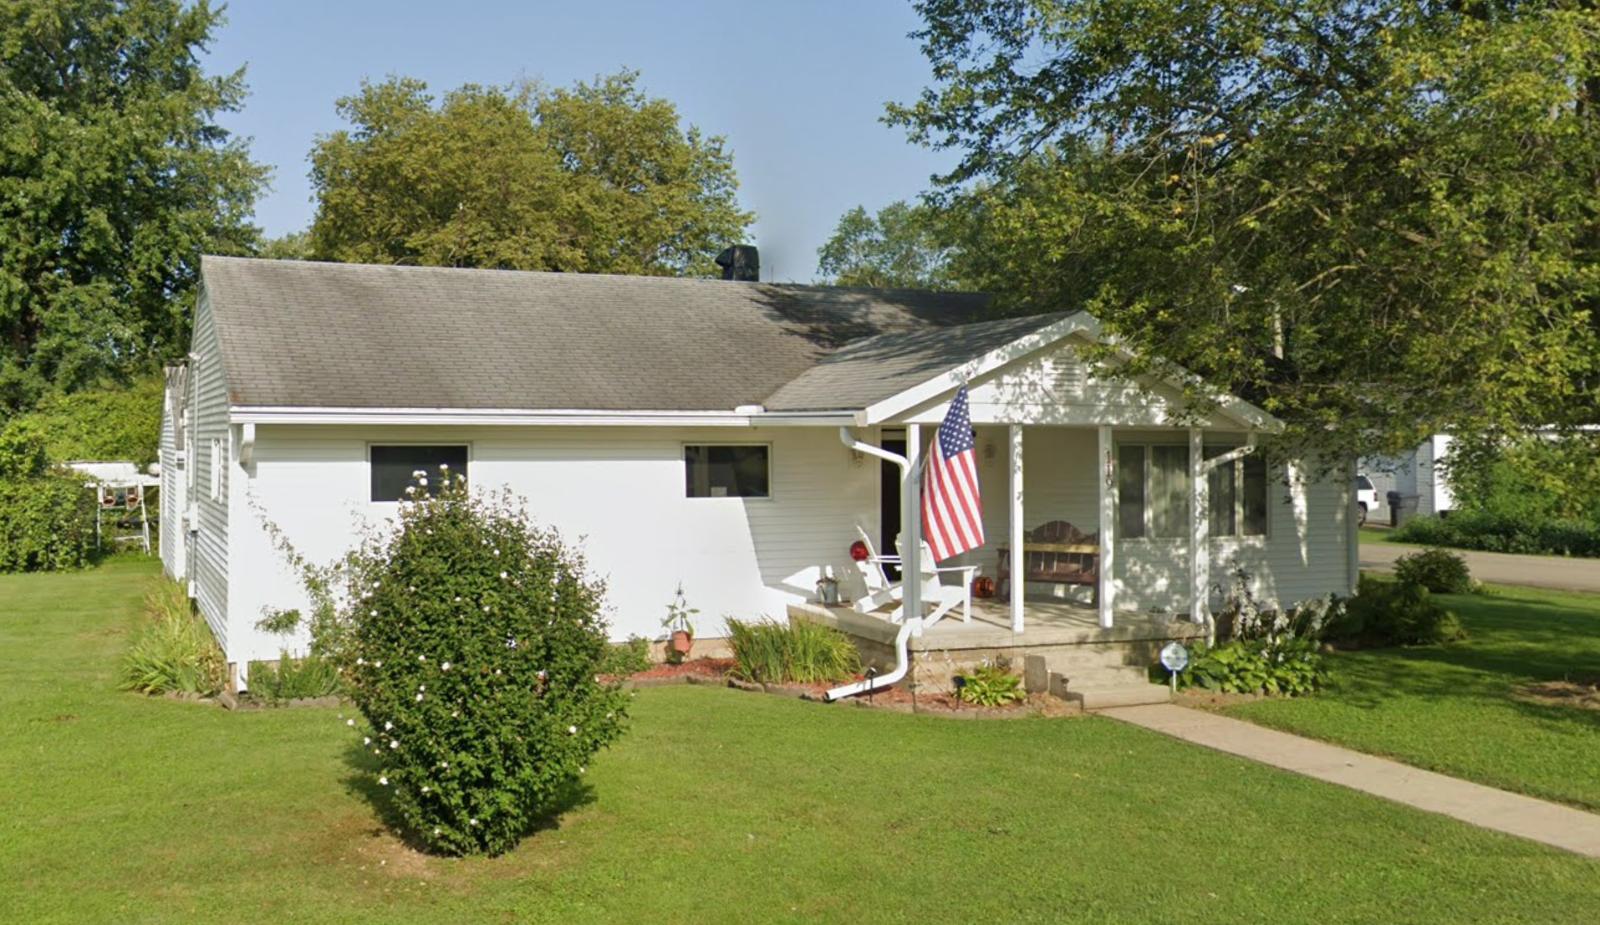
East Germantown is a small, rural community in Wayne County, located along U.S. Route 40 just west of Cambridge City. With a population under 300, it’s a tight-knit town with little commercial activity but a strong appeal to those looking for privacy, affordability, and slower living. It benefits from proximity to Richmond and New Castle, giving residents access to jobs and services while maintaining a low-key, residential character. Most of the housing stock consists of modest single-family homes on quiet streets with large lots and mature trees.
The town’s real estate market has seen steady interest from local buyers and small investors alike. Its affordability makes it attractive for first-time homeowners, retirees, or even remote workers seeking a peaceful setting. While East Germantown doesn’t offer a bustling downtown or tourist draws, its strategic location, calm environment, and recent growth in home values make it a solid pick for those wanting long-term affordability with consistent appreciation.
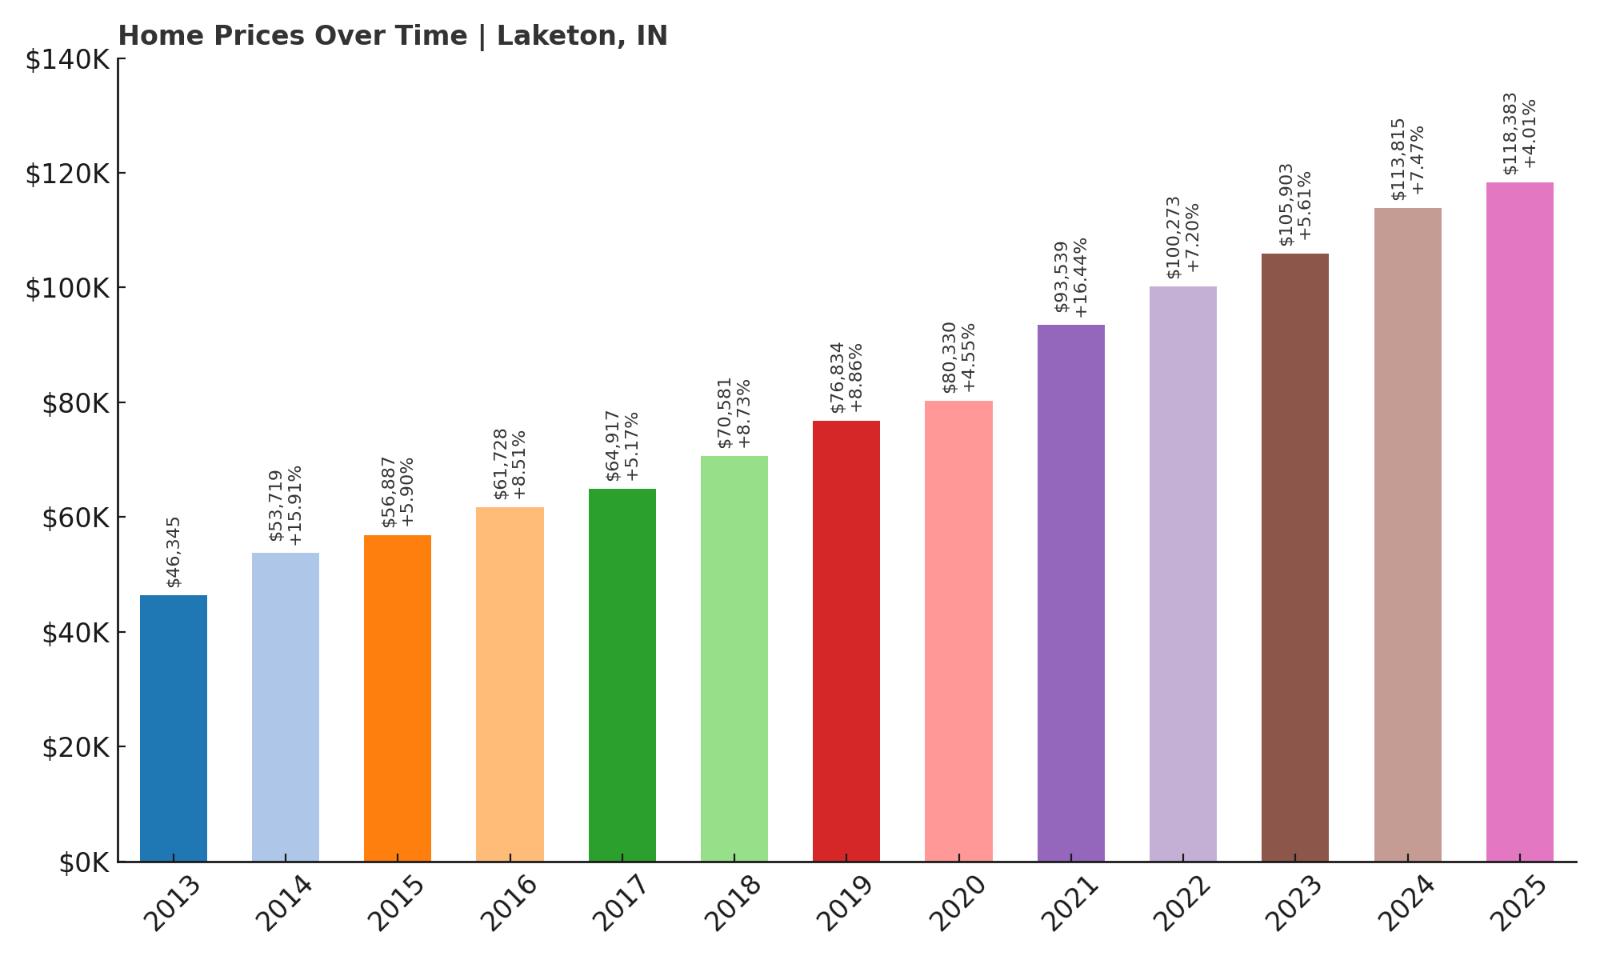
8. Laketon – 156% Home Price Increase Since 2013
- 2010: N/A
- 2011: N/A
- 2012: N/A
- 2013: $46,345
- 2014: $53,719 (+$7,374, +15.91% from previous year)
- 2015: $56,887 (+$3,168, +5.90% from previous year)
- 2016: $61,728 (+$4,840, +8.51% from previous year)
- 2017: $64,917 (+$3,189, +5.17% from previous year)
- 2018: $70,581 (+$5,664, +8.73% from previous year)
- 2019: $76,834 (+$6,253, +8.86% from previous year)
- 2020: $80,330 (+$3,496, +4.55% from previous year)
- 2021: $93,539 (+$13,209, +16.44% from previous year)
- 2022: $100,273 (+$6,734, +7.20% from previous year)
- 2023: $105,903 (+$5,630, +5.61% from previous year)
- 2024: $113,815 (+$7,912, +7.47% from previous year)
- 2025: $118,383 (+$4,568, +4.01% from previous year)
Since 2013, Laketon’s home values have soared by 156%, rising from just over $46,000 to more than $118,000 in 2025. The growth has been remarkably consistent, with year-over-year gains nearly every year and no major dips. Between 2020 and 2022 alone, prices increased by over $20,000, and even in the more recent years, appreciation has held steady. This strong performance makes Laketon one of Indiana’s most impressive examples of long-term affordable growth.
Laketon – Lakeside Affordability in Northern Indiana
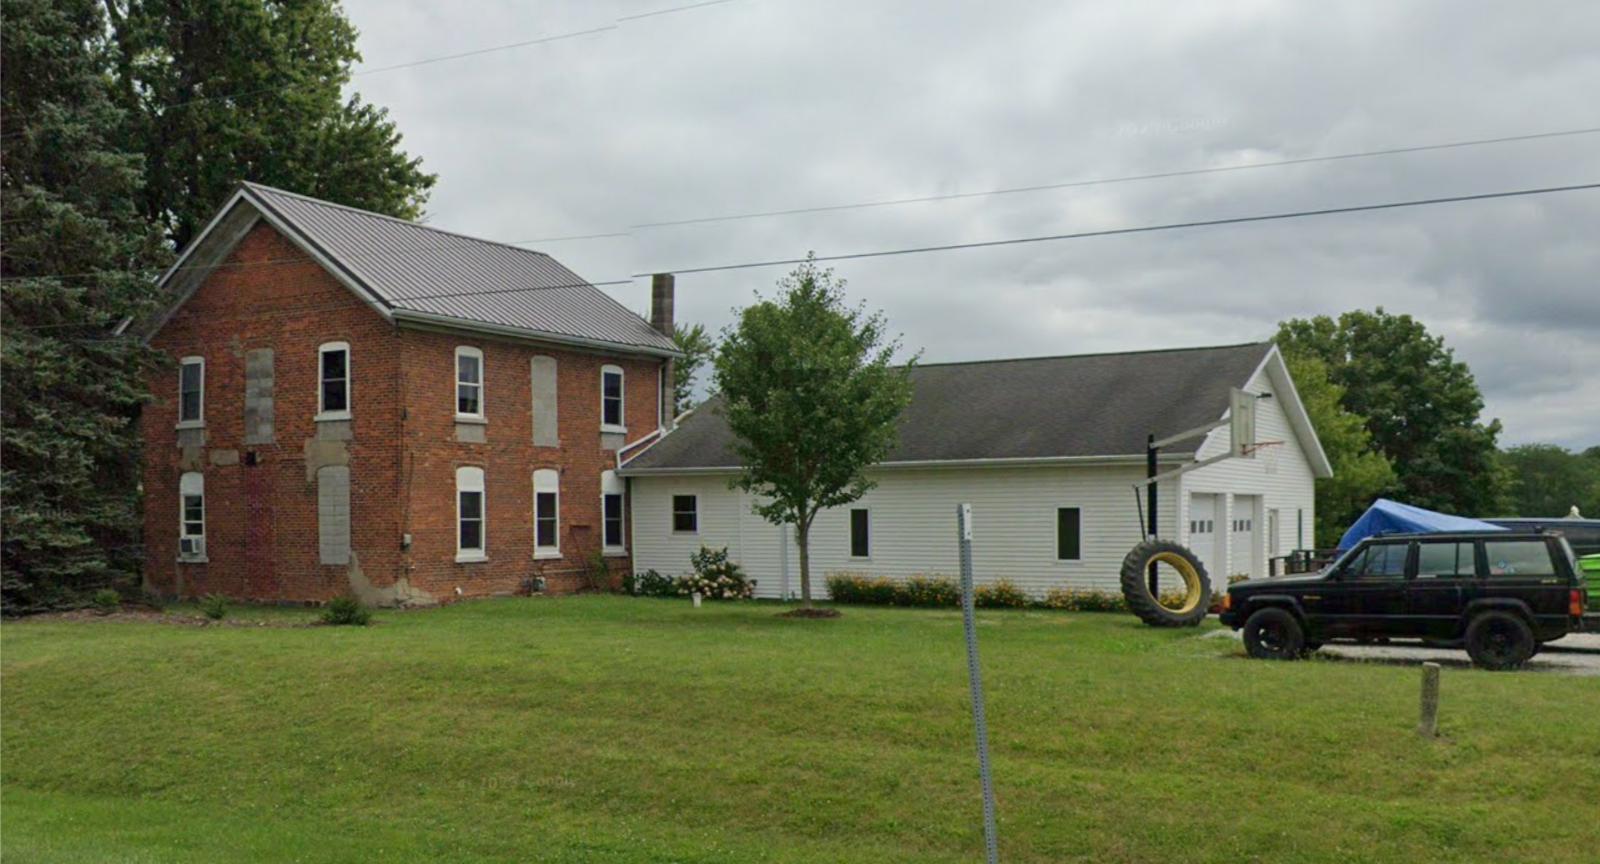
Laketon is a small unincorporated community in Wabash County, nestled near the shores of Pleasant Lake in north-central Indiana. While it’s far from major cities, its quiet lakeside charm, low housing density, and surrounding natural beauty make it a magnet for buyers seeking a peaceful retreat. Many homes here are close to water or set among wooded areas, making the area popular with retirees, remote workers, and those drawn to nature.
Though small, Laketon has benefited from rising demand for second homes and low-cost living options in scenic rural areas. Proximity to North Manchester and Warsaw provides access to schools, medical care, and grocery stores while preserving the slower pace of life. With prices still hovering around $118,000, Laketon delivers outstanding value for buyers looking to escape crowded suburbs or inflated metro prices without giving up long-term appreciation potential.
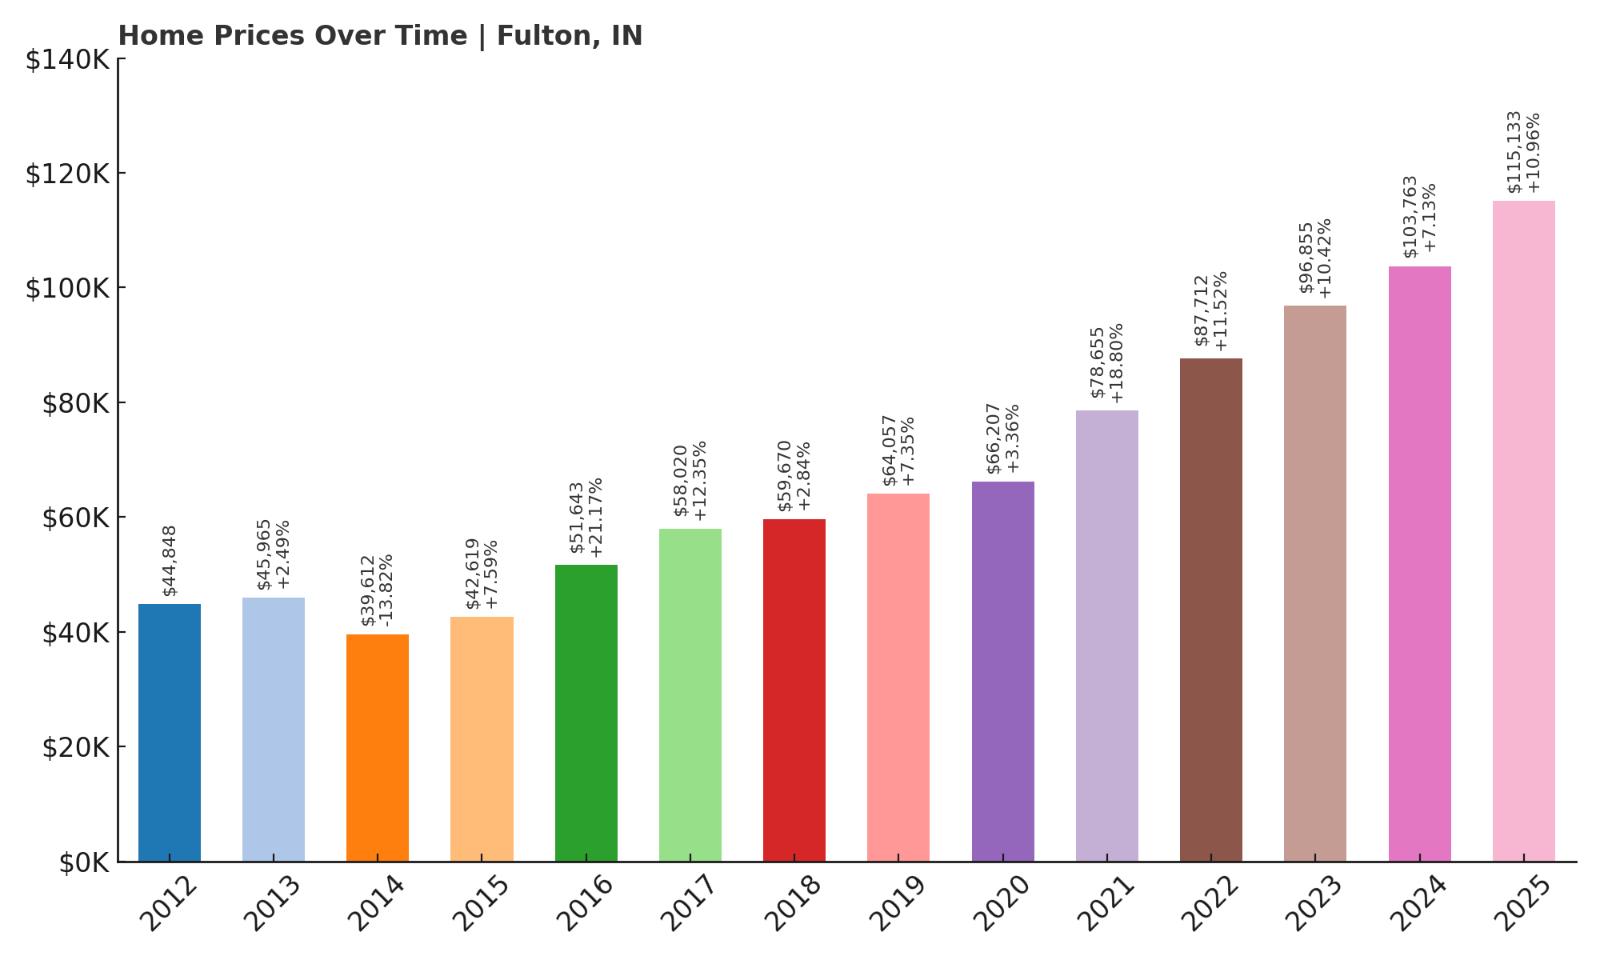
7. Fulton – 157% Home Price Increase Since 2012
- 2010: N/A
- 2011: N/A
- 2012: $44,848
- 2013: $45,965 (+$1,117, +2.49% from previous year)
- 2014: $39,612 (-$6,353, -13.82% from previous year)
- 2015: $42,619 (+$3,007, +7.59% from previous year)
- 2016: $51,643 (+$9,024, +21.17% from previous year)
- 2017: $58,020 (+$6,378, +12.35% from previous year)
- 2018: $59,670 (+$1,650, +2.84% from previous year)
- 2019: $64,057 (+$4,386, +7.35% from previous year)
- 2020: $66,207 (+$2,150, +3.36% from previous year)
- 2021: $78,655 (+$12,448, +18.80% from previous year)
- 2022: $87,712 (+$9,057, +11.52% from previous year)
- 2023: $96,855 (+$9,143, +10.42% from previous year)
- 2024: $103,763 (+$6,908, +7.13% from previous year)
- 2025: $115,133 (+$11,371, +10.96% from previous year)
Fulton has seen home values surge by 157% since 2012, with prices rising from $44,848 to $115,133 in 2025. After a sharp drop in 2014, the town rebounded quickly, with massive gains starting in 2016. From that point forward, growth remained steady, including some especially strong years between 2020 and 2023. Prices continued climbing in 2024 and 2025, cementing Fulton as one of the state’s strongest-performing affordable towns in terms of price appreciation.
Fulton – Small-Town Living With Big Value Growth
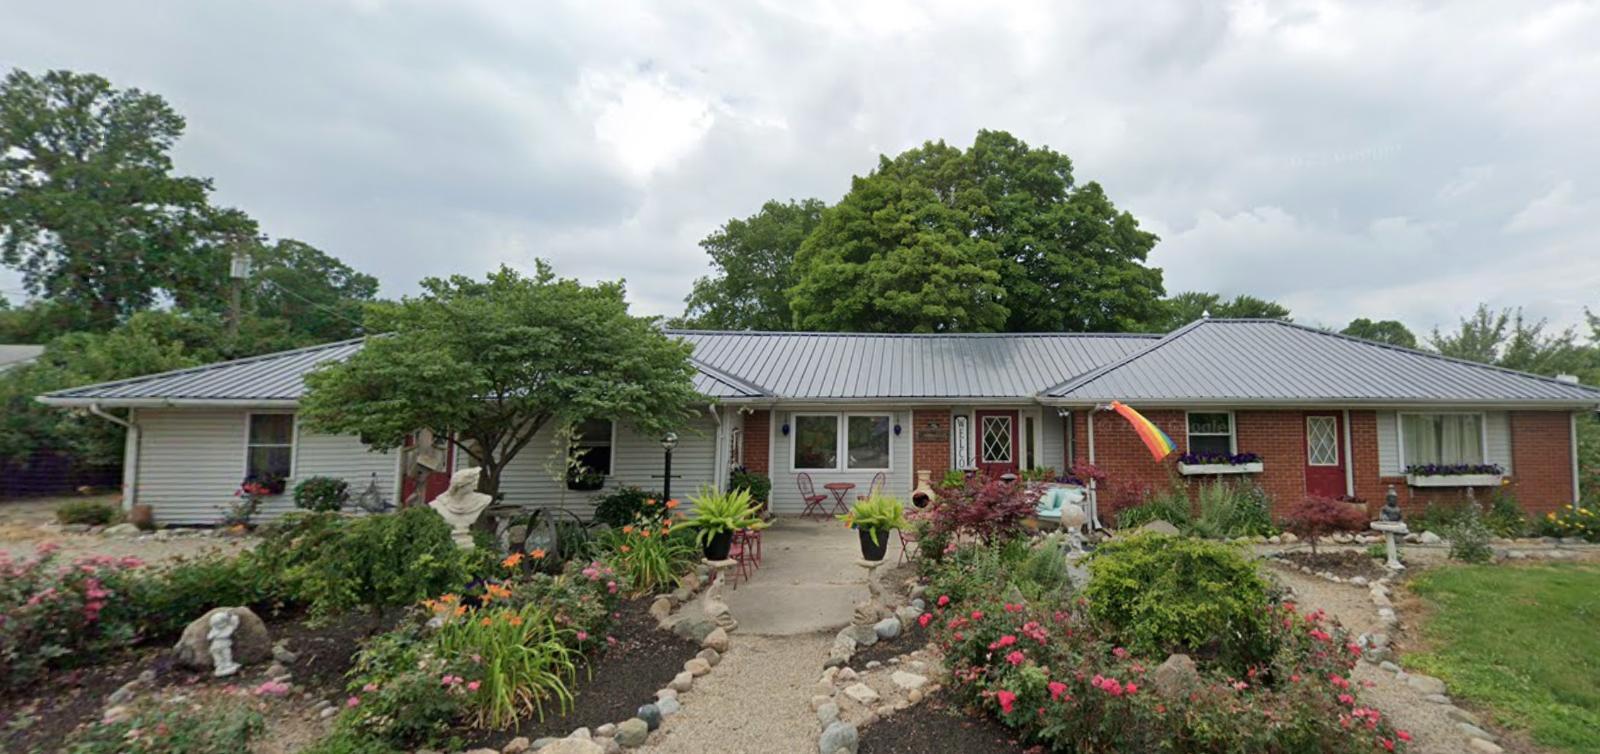
Located in Fulton County in north-central Indiana, the town of Fulton is home to just a few hundred residents and surrounded by farmland in nearly every direction. It’s about a 30-minute drive from Logansport or Rochester, making it accessible for commuters while retaining a distinctly rural character. The town is anchored by family-owned businesses, a post office, a small park, and a K-12 school system nearby. For those seeking simplicity, space, and a low cost of living, Fulton delivers on all fronts.
The growth in home prices over the last decade likely reflects a combination of renewed interest in rural areas and the extremely low baseline values of earlier years. While inventory remains limited, what’s available tends to be detached single-family homes with sizable lots—an attractive proposition for families and retirees alike. With home values still under $120,000 and rising steadily, Fulton offers both immediate affordability and longer-term upside that stands out in Indiana’s housing market.
6. Leavenworth – 91% Home Price Increase Since 2010
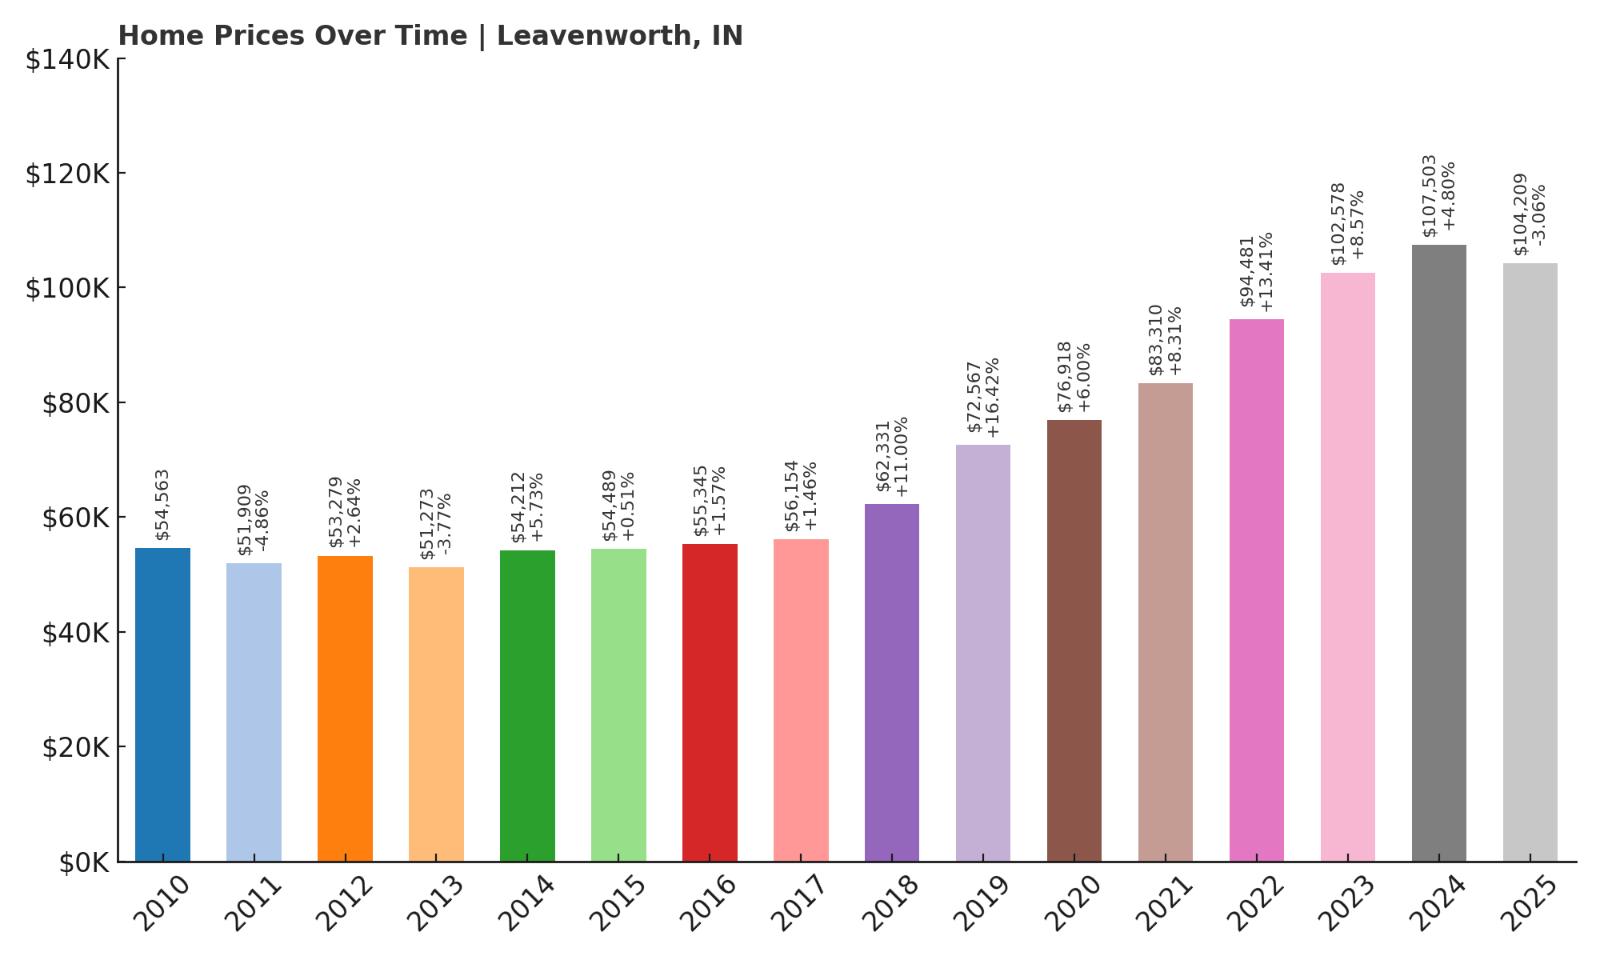
- 2010: $54,563
- 2011: $51,909 (-$2,654, -4.86% from previous year)
- 2012: $53,279 (+$1,370, +2.64% from previous year)
- 2013: $51,273 (-$2,006, -3.77% from previous year)
- 2014: $54,212 (+$2,939, +5.73% from previous year)
- 2015: $54,489 (+$277, +0.51% from previous year)
- 2016: $55,345 (+$857, +1.57% from previous year)
- 2017: $56,154 (+$809, +1.46% from previous year)
- 2018: $62,331 (+$6,177, +11.00% from previous year)
- 2019: $72,567 (+$10,236, +16.42% from previous year)
- 2020: $76,918 (+$4,351, +6.00% from previous year)
- 2021: $83,310 (+$6,392, +8.31% from previous year)
- 2022: $94,481 (+$11,171, +13.41% from previous year)
- 2023: $102,578 (+$8,097, +8.57% from previous year)
- 2024: $107,503 (+$4,924, +4.80% from previous year)
- 2025: $104,209 (-$3,293, -3.06% from previous year)
Leavenworth’s home prices have climbed 91% since 2010, rising from $54,563 to $104,209 in 2025. The market moved slowly through the early part of the decade, but growth accelerated significantly starting in 2018, with major year-over-year gains into 2023. While the most recent year shows a small decline, the long-term trend remains firmly upward. Even with a slight drop in 2025, the town remains highly affordable with a strong track record of price appreciation.
Leavenworth – Bluff Views and Affordable Housing on the Ohio River
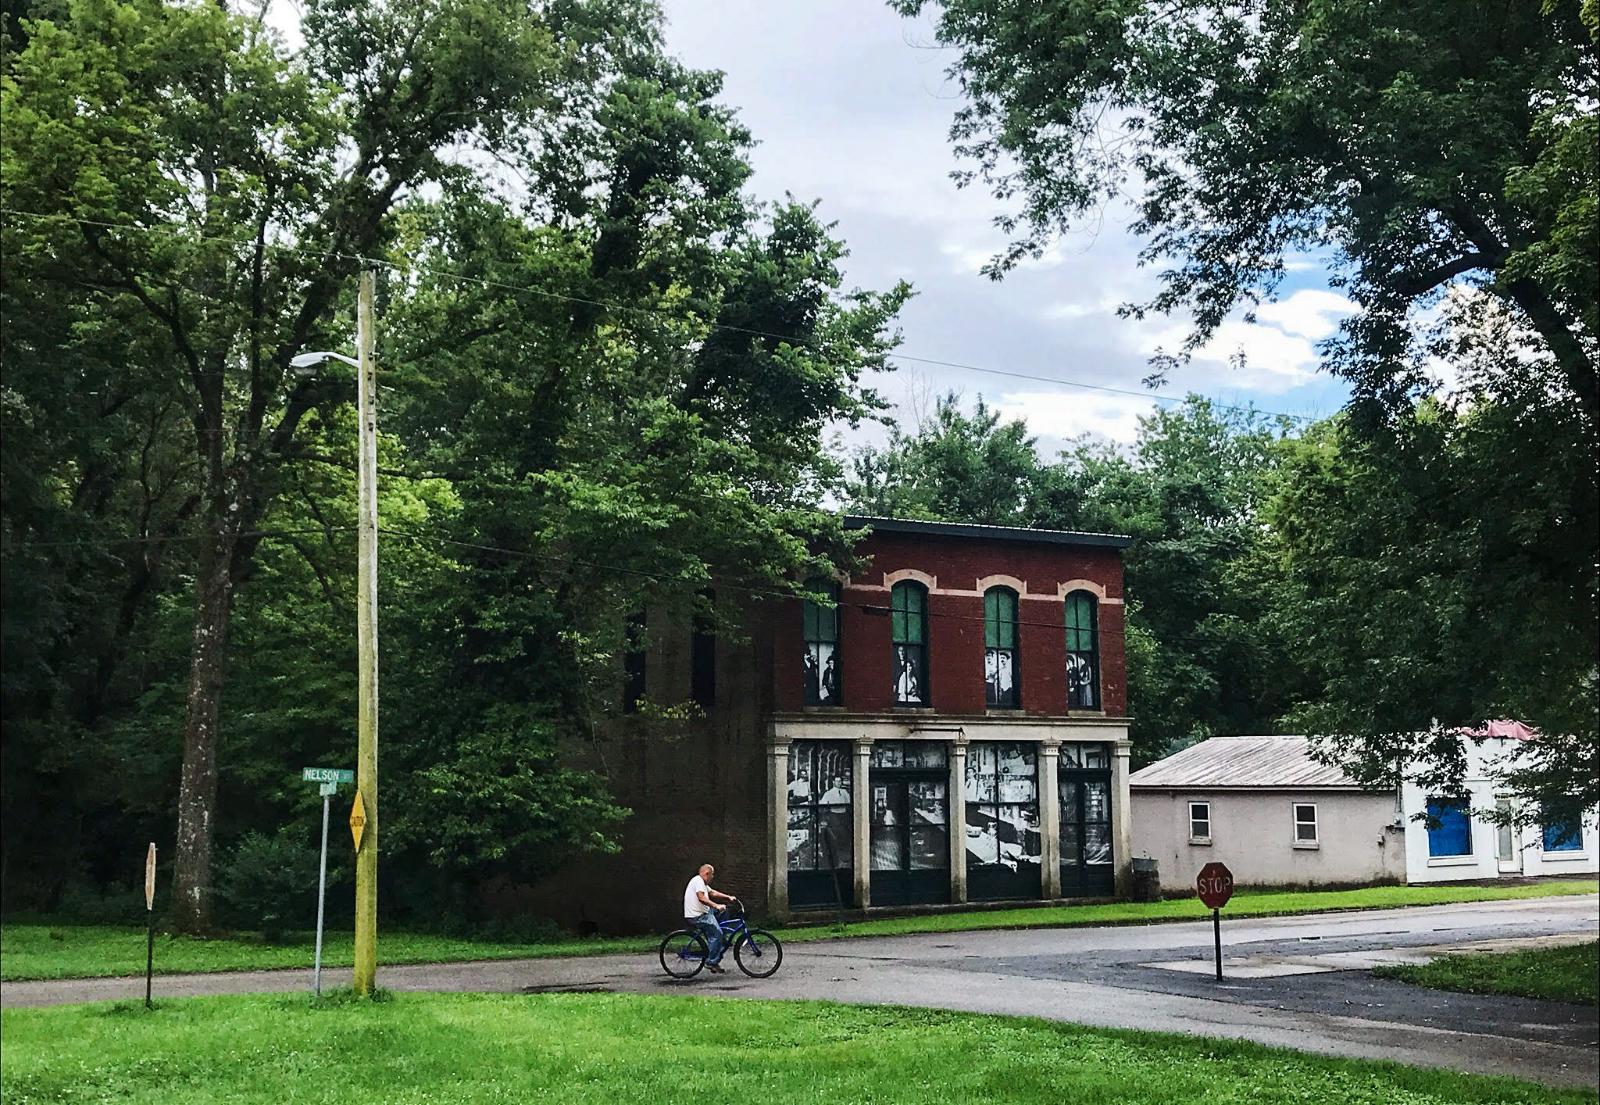
Leavenworth is perched high above the Ohio River in Crawford County, offering some of the most scenic vistas in southern Indiana. With a population of around 300, it’s a quiet and picturesque town best known for its riverfront views and small-town hospitality. Visitors often pass through for the natural beauty, but some choose to stay for the peace, low cost of living, and proximity to river recreation. It’s a unique location where bluff-top homes and quiet wooded lots offer real value.
The town has benefitted in recent years from rising interest in rural river towns, especially as larger cities become increasingly unaffordable. While its economy is limited and commercial development minimal, Leavenworth’s appeal lies in its simplicity. Affordable homes, natural beauty, and a deep sense of quiet make it attractive to retirees, artists, and remote workers. At just over $100,000, the typical home price here offers access to scenic living at a fraction of what you’d pay in riverfront areas elsewhere.
5. Griffin – 103% Home Price Increase Since 2013

🔥 Would you like to save this?
- 2010: N/A
- 2011: N/A
- 2012: N/A
- 2013: $50,875
- 2014: $55,774 (+$4,900, +9.63% from previous year)
- 2015: $62,086 (+$6,312, +11.32% from previous year)
- 2016: $62,060 (-$26, -0.04% from previous year)
- 2017: $65,197 (+$3,137, +5.05% from previous year)
- 2018: $68,120 (+$2,923, +4.48% from previous year)
- 2019: $70,268 (+$2,148, +3.15% from previous year)
- 2020: $72,722 (+$2,454, +3.49% from previous year)
- 2021: $87,275 (+$14,553, +20.01% from previous year)
- 2022: $93,246 (+$5,971, +6.84% from previous year)
- 2023: $93,308 (+$62, +0.07% from previous year)
- 2024: $102,828 (+$9,520, +10.20% from previous year)
- 2025: $103,164 (+$336, +0.33% from previous year)
Griffin’s home prices have risen 103% since 2013, more than doubling in just over a decade. After strong double-digit gains in 2014 and 2015, the market held steady for several years before surging again between 2020 and 2022. While appreciation slowed considerably in 2023 and 2025, the long-term upward trend remains solid. Homes in Griffin now average just over $103,000, marking it as one of the most affordable towns in Indiana despite years of steady value growth.
Griffin – Small Size, Strong Performance in Southwest Indiana
Griffin is a very small town in Posey County, located near the southwestern corner of Indiana and just a few miles from the Illinois border. With a population of under 200 residents, it ranks as one of the smallest communities on this list. But despite its tiny size, Griffin has posted an impressive rise in home values, suggesting it’s a place people are starting to notice. Its location near U.S. Route 50 and Interstate 64 makes it more connected than it might appear at first glance, giving residents access to nearby towns like Mount Vernon and Evansville.
Griffin doesn’t have much in the way of retail or commercial development, but for buyers seeking peace, affordability, and a tight-knit environment, it’s a strong candidate. Many of the homes are modest single-family properties, often on large lots. Given the market’s recent history of appreciation and its position near growing regional corridors, Griffin offers a compelling value for those willing to look beyond larger population centers. At just over $100,000, it’s a town where budget-conscious buyers can still get a foothold in a rising market.
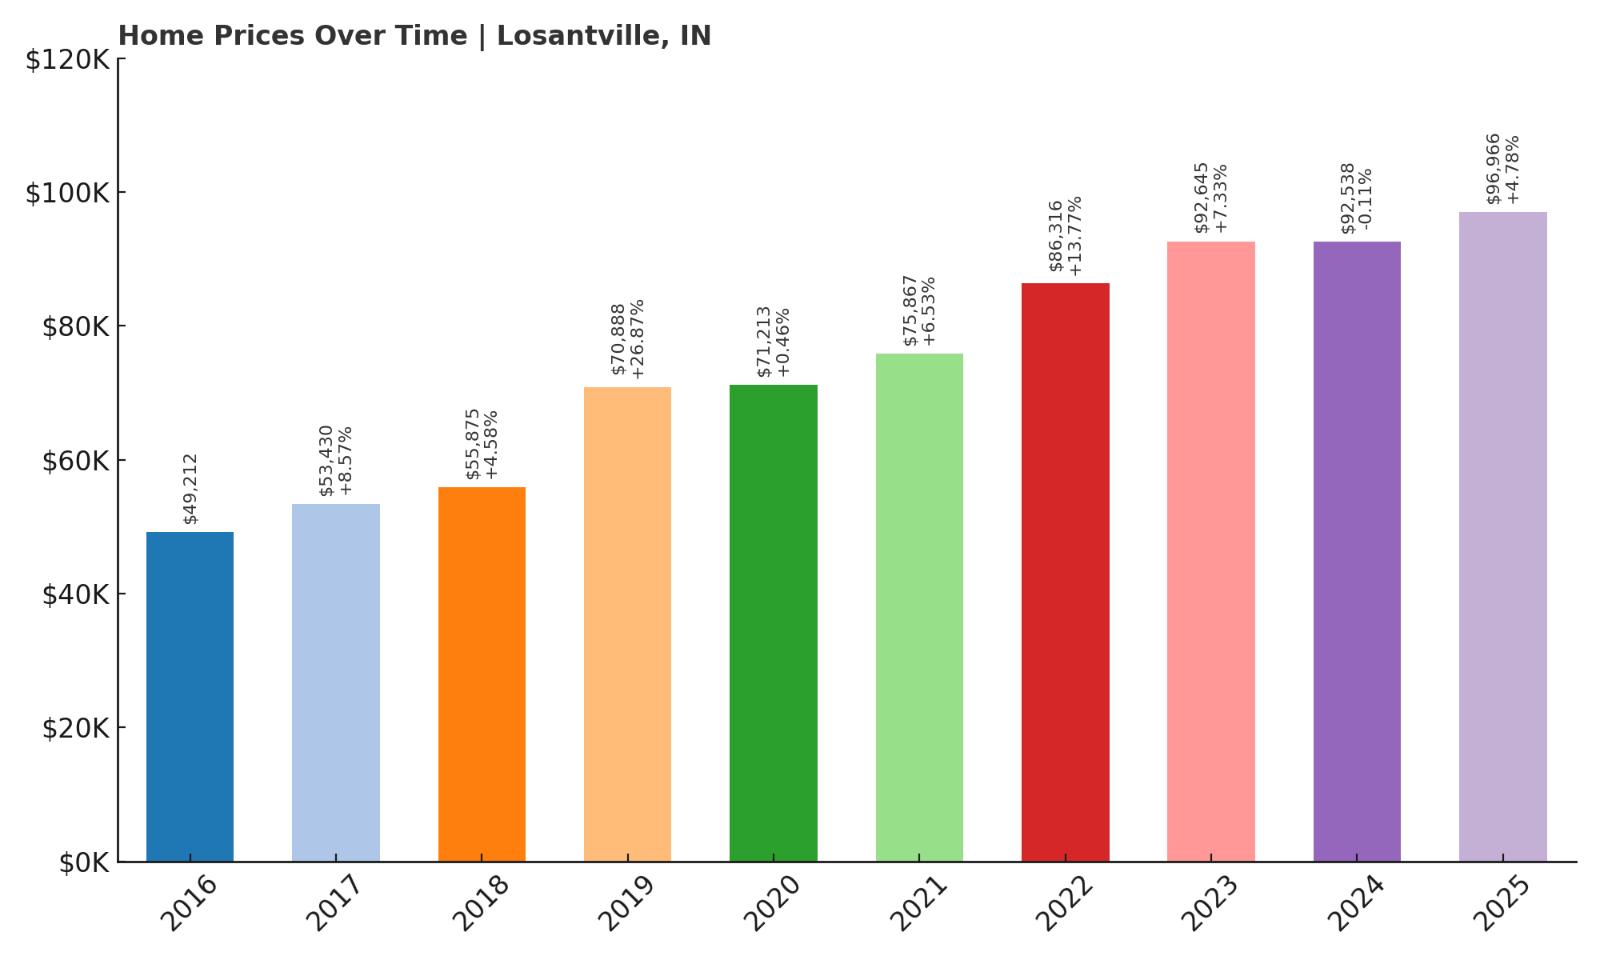
4. Losantville – 97% Home Price Increase Since 2016
- 2010: N/A
- 2011: N/A
- 2012: N/A
- 2013: N/A
- 2014: N/A
- 2015: N/A
- 2016: $49,212
- 2017: $53,430 (+$4,218, +8.57% from previous year)
- 2018: $55,875 (+$2,445, +4.58% from previous year)
- 2019: $70,888 (+$15,013, +26.87% from previous year)
- 2020: $71,213 (+$326, +0.46% from previous year)
- 2021: $75,867 (+$4,653, +6.53% from previous year)
- 2022: $86,316 (+$10,450, +13.77% from previous year)
- 2023: $92,645 (+$6,328, +7.33% from previous year)
- 2024: $92,538 (-$106, -0.11% from previous year)
- 2025: $96,966 (+$4,427, +4.78% from previous year)
Losantville’s home prices have climbed 97% since 2016, rising from just over $49,000 to nearly $97,000 in 2025. The town’s market saw especially sharp growth in 2019, when prices jumped more than 26% in a single year. While growth has varied since then, prices have generally continued to move upward, with a slight dip in 2024 followed by a rebound in 2025. Despite the ups and downs, Losantville remains one of the most affordable towns in the state with a solid track record of appreciation.
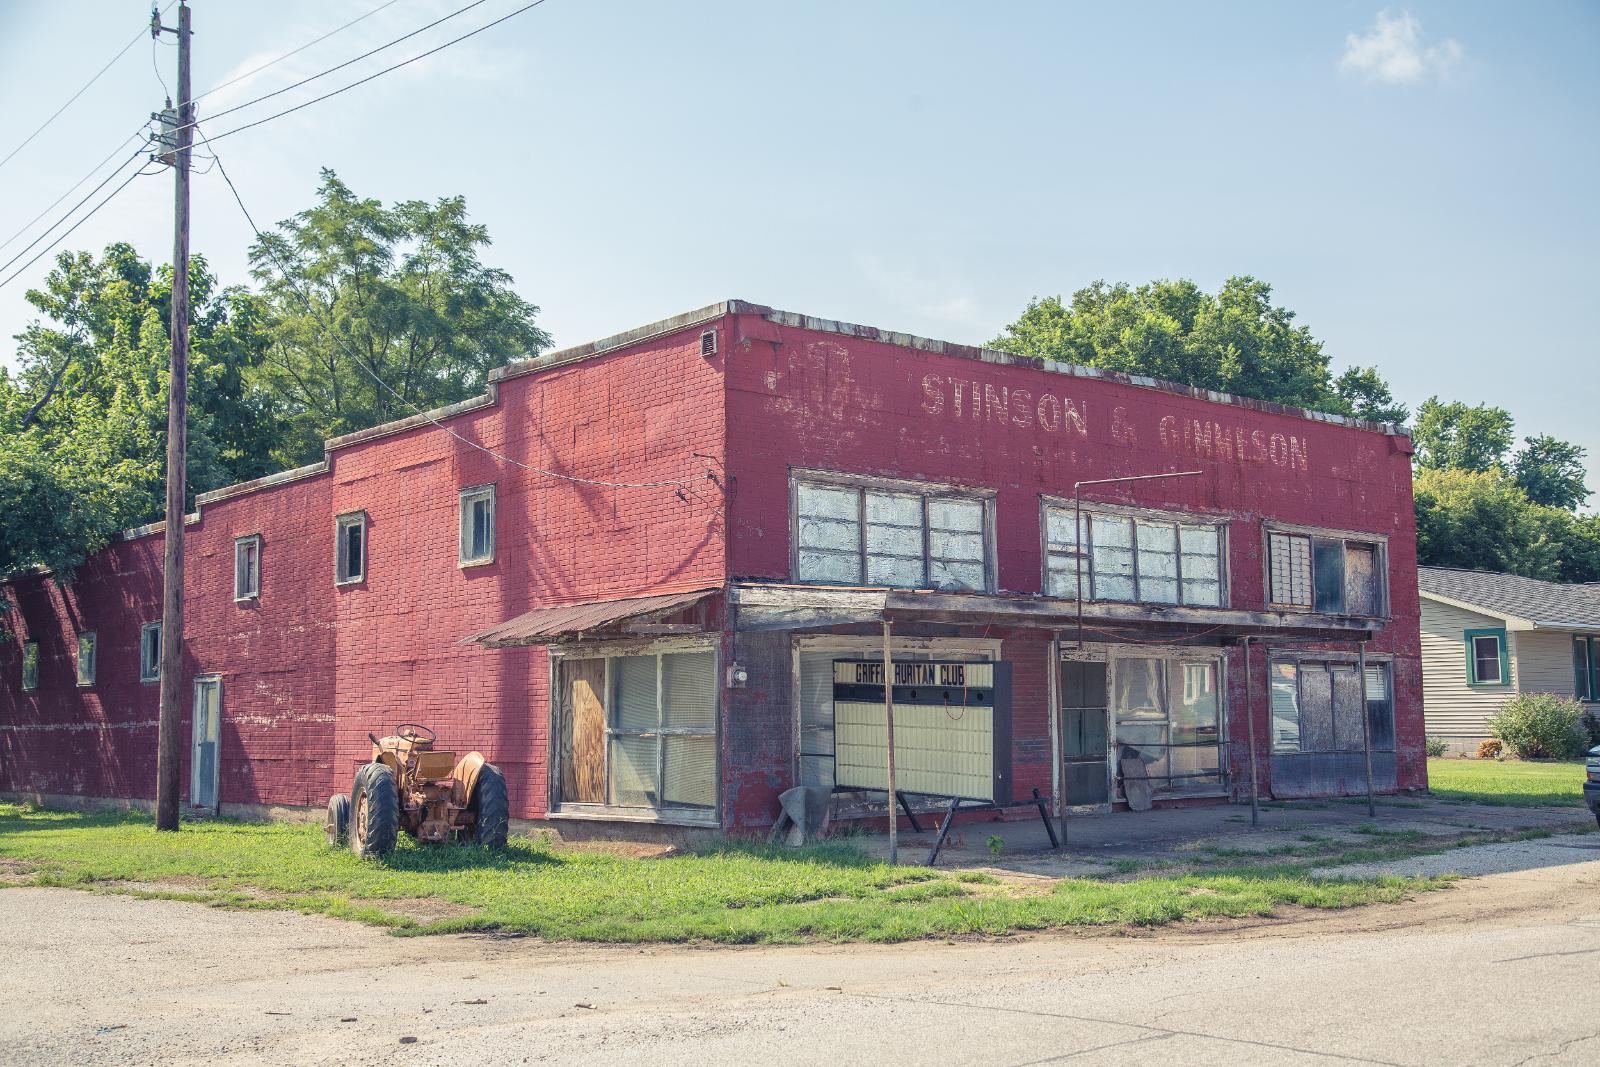
Losantville – Quiet Growth in a Well-Located Rural Hub
Losantville is a small town in Randolph County, located in eastern Indiana about halfway between Muncie and New Castle. It sits at the junction of State Roads 1 and 36, giving it surprising accessibility for such a rural community. With a population of fewer than 300 people, Losantville is the kind of town where everyone knows their neighbors, and change happens slowly—but the real estate data suggests it’s gaining more attention. Its location along well-traveled commuter routes makes it a practical option for buyers seeking rural life with regional access.
Housing in Losantville is primarily made up of older, single-family homes, many of which sit on larger lots than you’d find in suburban areas. There’s little commercial development, but residents enjoy proximity to nearby towns for essentials. The strong price jump in 2019 likely reflects a combination of low inventory and increased buyer demand from outside markets. At under $100,000, homes in Losantville still represent excellent value, especially for first-time buyers or retirees who want stability, space, and affordability in a peaceful setting.
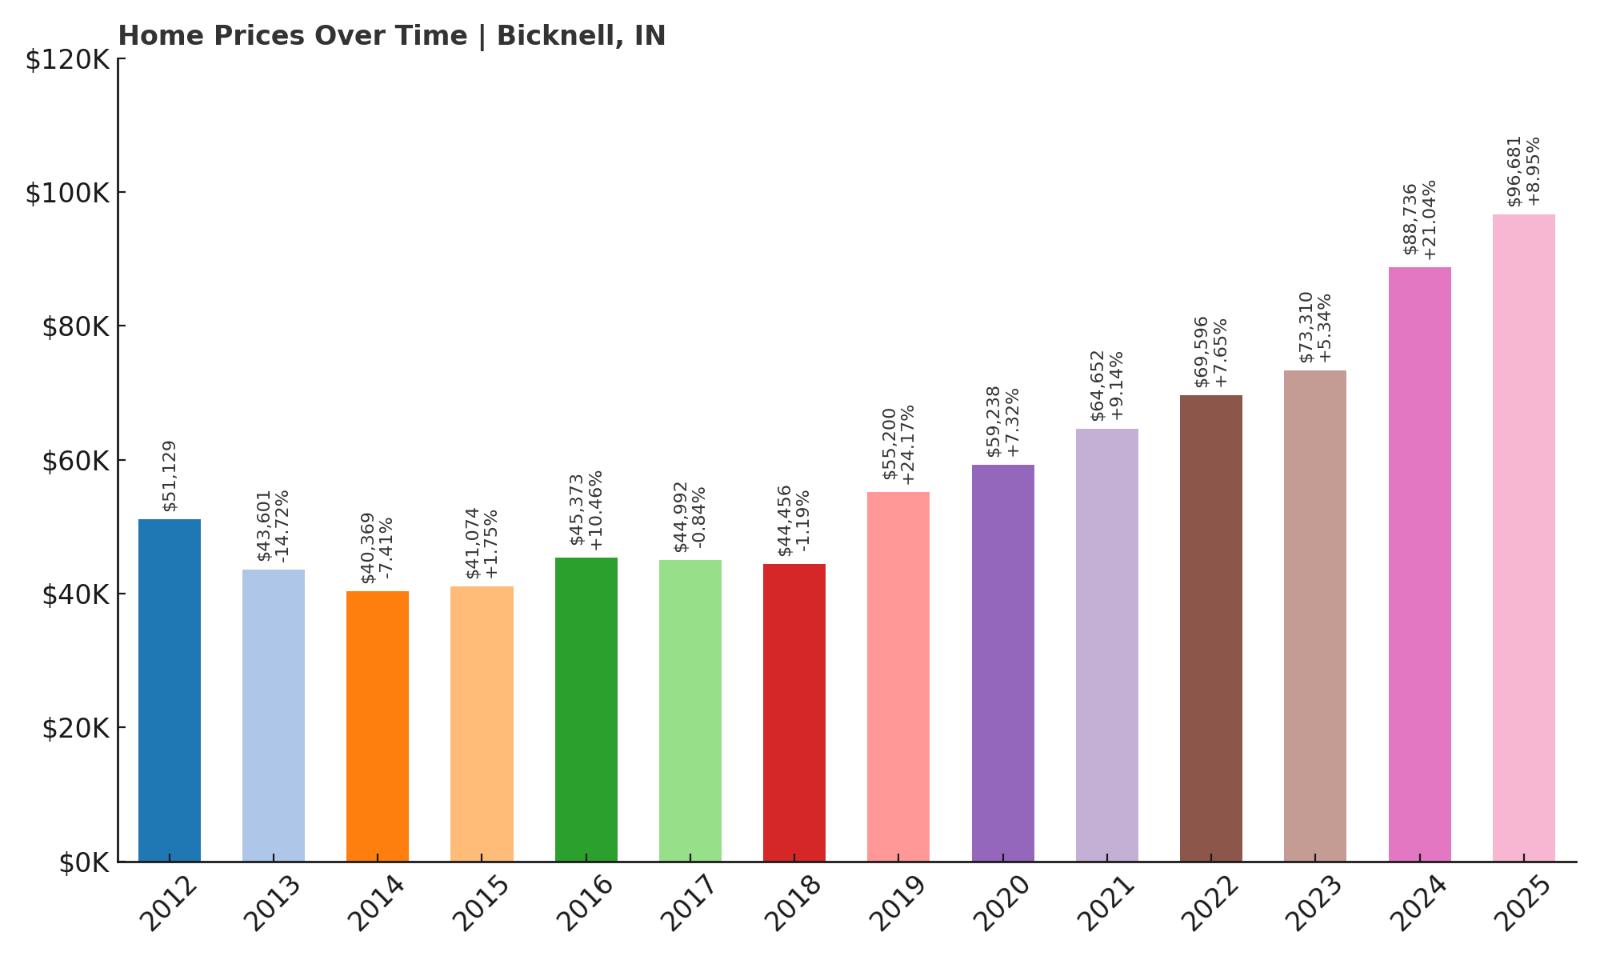
3. Bicknell – 89% Home Price Increase Since 2012
- 2010: N/A
- 2011: N/A
- 2012: $51,129
- 2013: $43,601 (-$7,528, -14.72% from previous year)
- 2014: $40,369 (-$3,231, -7.41% from previous year)
- 2015: $41,074 (+$705, +1.75% from previous year)
- 2016: $45,373 (+$4,298, +10.46% from previous year)
- 2017: $44,992 (-$380, -0.84% from previous year)
- 2018: $44,456 (-$537, -1.19% from previous year)
- 2019: $55,200 (+$10,744, +24.17% from previous year)
- 2020: $59,238 (+$4,038, +7.32% from previous year)
- 2021: $64,652 (+$5,414, +9.14% from previous year)
- 2022: $69,596 (+$4,944, +7.65% from previous year)
- 2023: $73,310 (+$3,714, +5.34% from previous year)
- 2024: $88,736 (+$15,426, +21.04% from previous year)
- 2025: $96,681 (+$7,945, +8.95% from previous year)
Bicknell’s home prices have climbed 89% since 2012, rising from just over $51,000 to nearly $97,000 in 2025. The market saw early declines through 2014, followed by a slow recovery and then a major jump in 2019. That single year marked a 24% price increase, which helped shift momentum for the town’s market. Gains continued steadily through 2025, with especially strong growth in 2024. Despite the recent appreciation, Bicknell remains among the most affordable markets in Indiana.
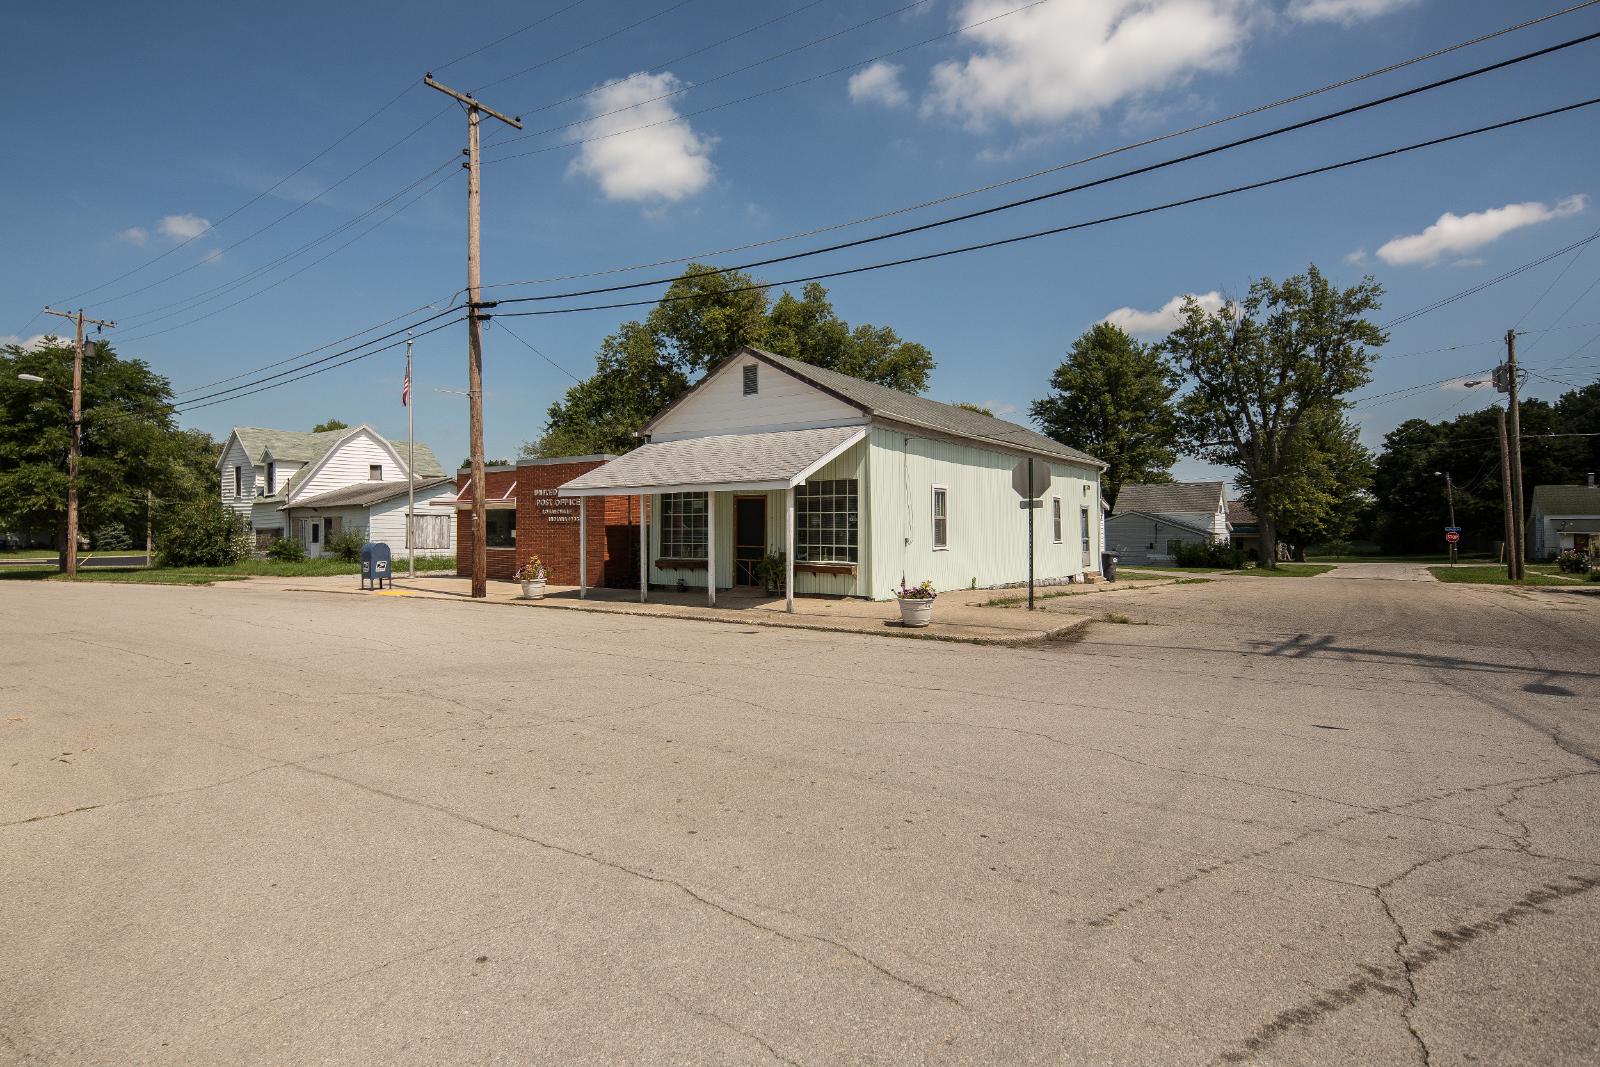
Bicknell – Rebounding Affordability in Southwestern Indiana
Bicknell is located in Knox County in southwestern Indiana, not far from the city of Vincennes. With a population of around 2,800, it’s larger than many towns on this list, yet still offers an extremely affordable cost of living. Once a thriving coal town, Bicknell has faced economic challenges over the past few decades. However, recent investment in surrounding areas and a growing interest in smaller, less expensive towns have helped shift the housing market in a more positive direction.
The housing stock in Bicknell includes early 20th-century homes, small ranches, and fixer-uppers that are popular with budget-conscious buyers. Investors have also shown interest here, especially as prices began rising after 2019. Bicknell’s proximity to Vincennes University, healthcare facilities, and regional employers adds practicality to its affordability. With home values still under $100,000 and trending upward, it’s becoming an increasingly viable option for buyers looking for long-term value in an often-overlooked pocket of Indiana.
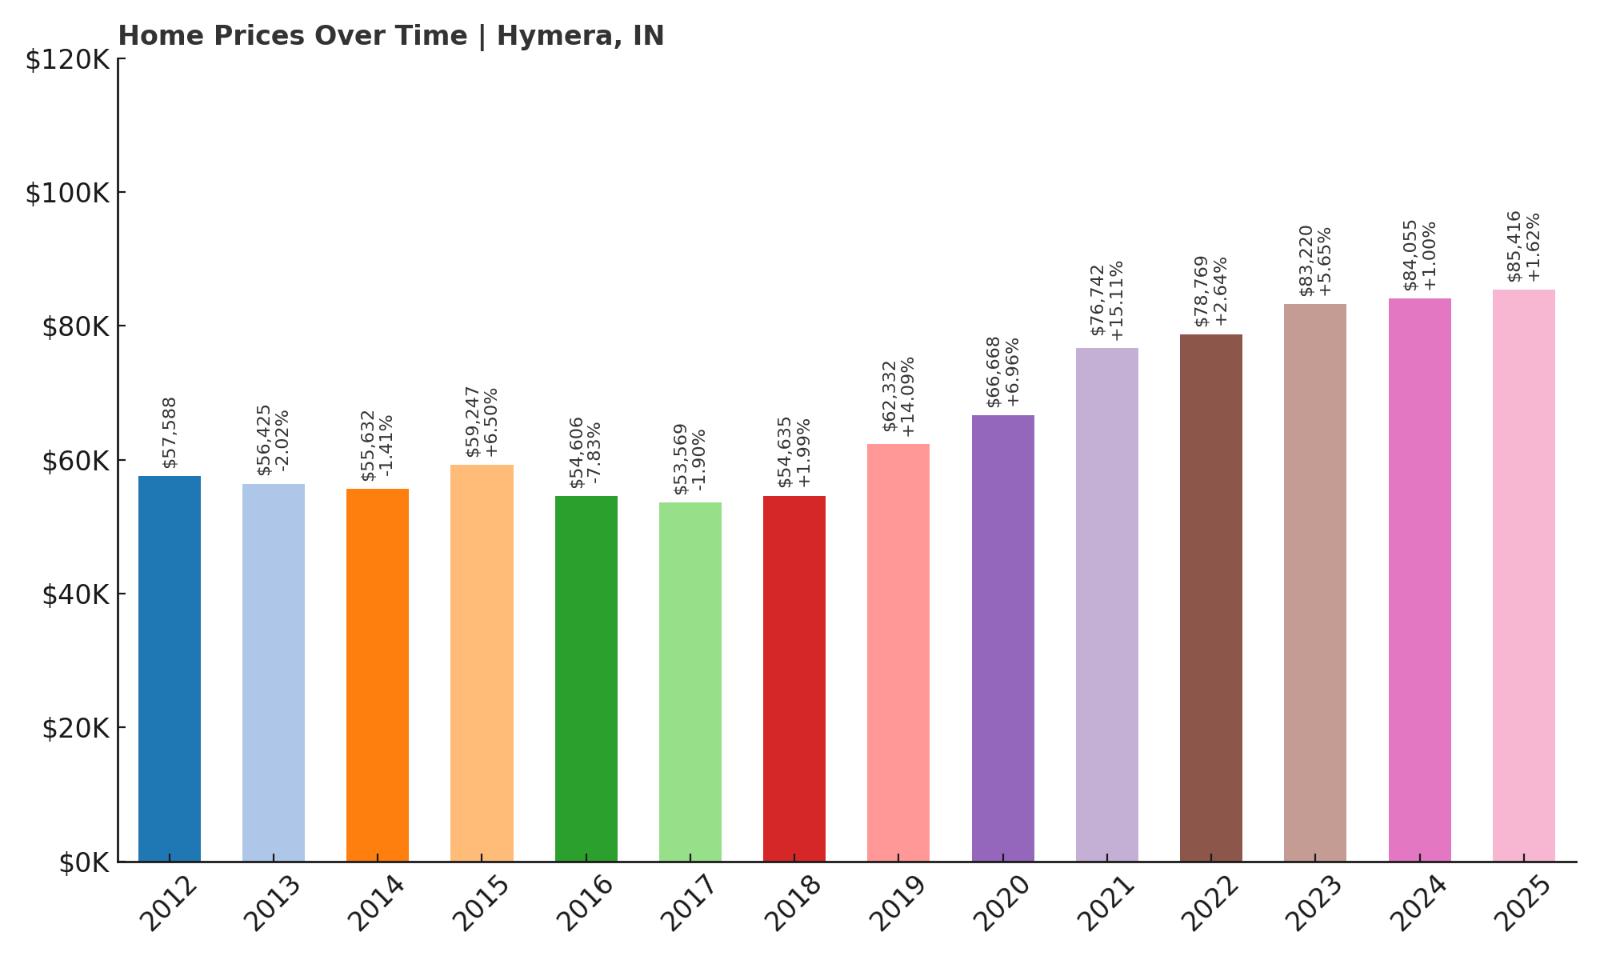
2. Hymera – 48% Home Price Increase Since 2012
- 2010: N/A
- 2011: N/A
- 2012: $57,588
- 2013: $56,425 (-$1,163, -2.02% from previous year)
- 2014: $55,632 (-$793, -1.41% from previous year)
- 2015: $59,247 (+$3,615, +6.50% from previous year)
- 2016: $54,606 (-$4,641, -7.83% from previous year)
- 2017: $53,569 (-$1,037, -1.90% from previous year)
- 2018: $54,635 (+$1,066, +1.99% from previous year)
- 2019: $62,332 (+$7,697, +14.09% from previous year)
- 2020: $66,668 (+$4,336, +6.96% from previous year)
- 2021: $76,742 (+$10,074, +15.11% from previous year)
- 2022: $78,769 (+$2,026, +2.64% from previous year)
- 2023: $83,220 (+$4,451, +5.65% from previous year)
- 2024: $84,055 (+$835, +1.00% from previous year)
- 2025: $85,416 (+$1,361, +1.62% from previous year)
Home prices in Hymera have grown by 48% since 2012, increasing from $57,588 to $85,416 in 2025. The growth pattern has been inconsistent—marked by a few early declines followed by more consistent gains from 2019 onward. The biggest jump occurred between 2020 and 2021, when home values rose more than $10,000 in a single year. While the pace of appreciation has slowed since then, prices have continued to rise gently, keeping Hymera affordable but trending upward.
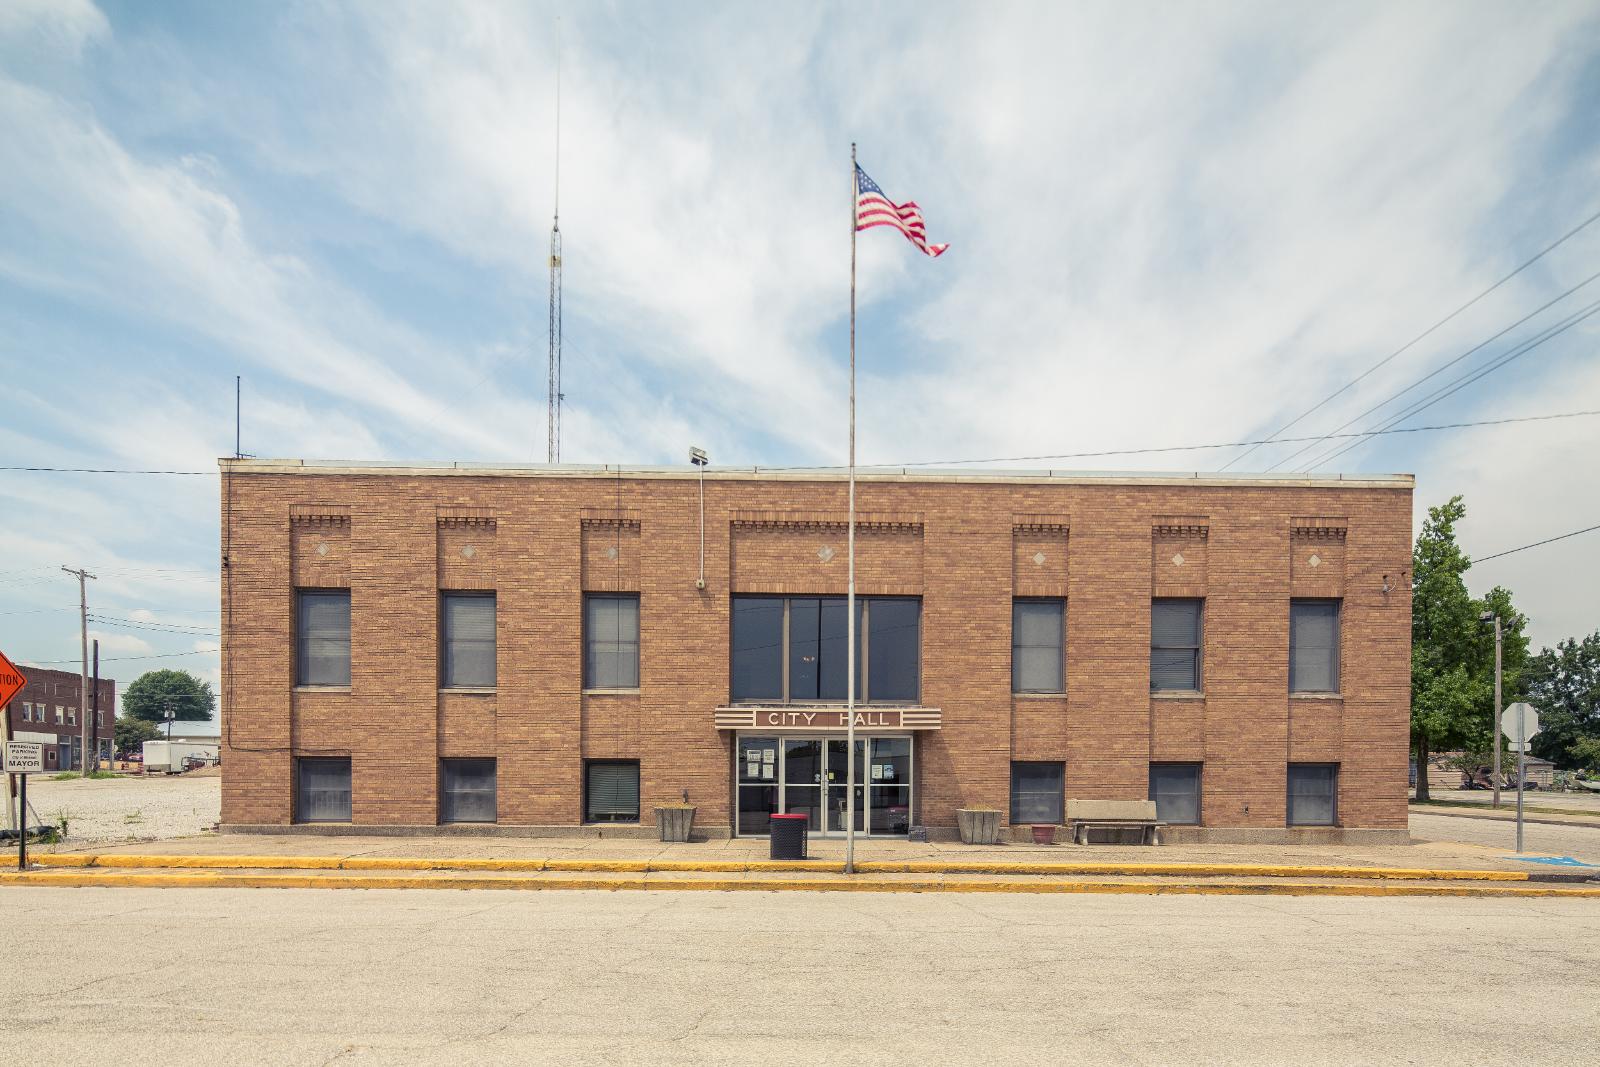
Hymera – Gradual Growth in a Former Mining Town
Hymera is located in Sullivan County in southwestern Indiana, a small town that was once a coal mining hub. Today, it’s a quiet residential community with fewer than 700 residents and a handful of local businesses. The town offers a peaceful, small-town lifestyle and remains largely off the radar for most homebuyers, which has helped preserve its affordability. Hymera is surrounded by farmland and sits within reach of larger towns like Sullivan and Terre Haute, providing access to jobs, healthcare, and shopping without the cost of living associated with bigger markets.
The housing stock here is modest and largely made up of older homes, but that’s exactly what makes it attractive to buyers who want a home they can afford and improve over time. Home values have risen steadily, especially in the past five years, but remain low enough to make Hymera one of the most affordable towns in Indiana. For those seeking budget-friendly ownership, some space, and the comfort of a tight-knit community, Hymera stands out as a place with both history and untapped potential.
1. Gary – 122% Home Price Increase Since 2010
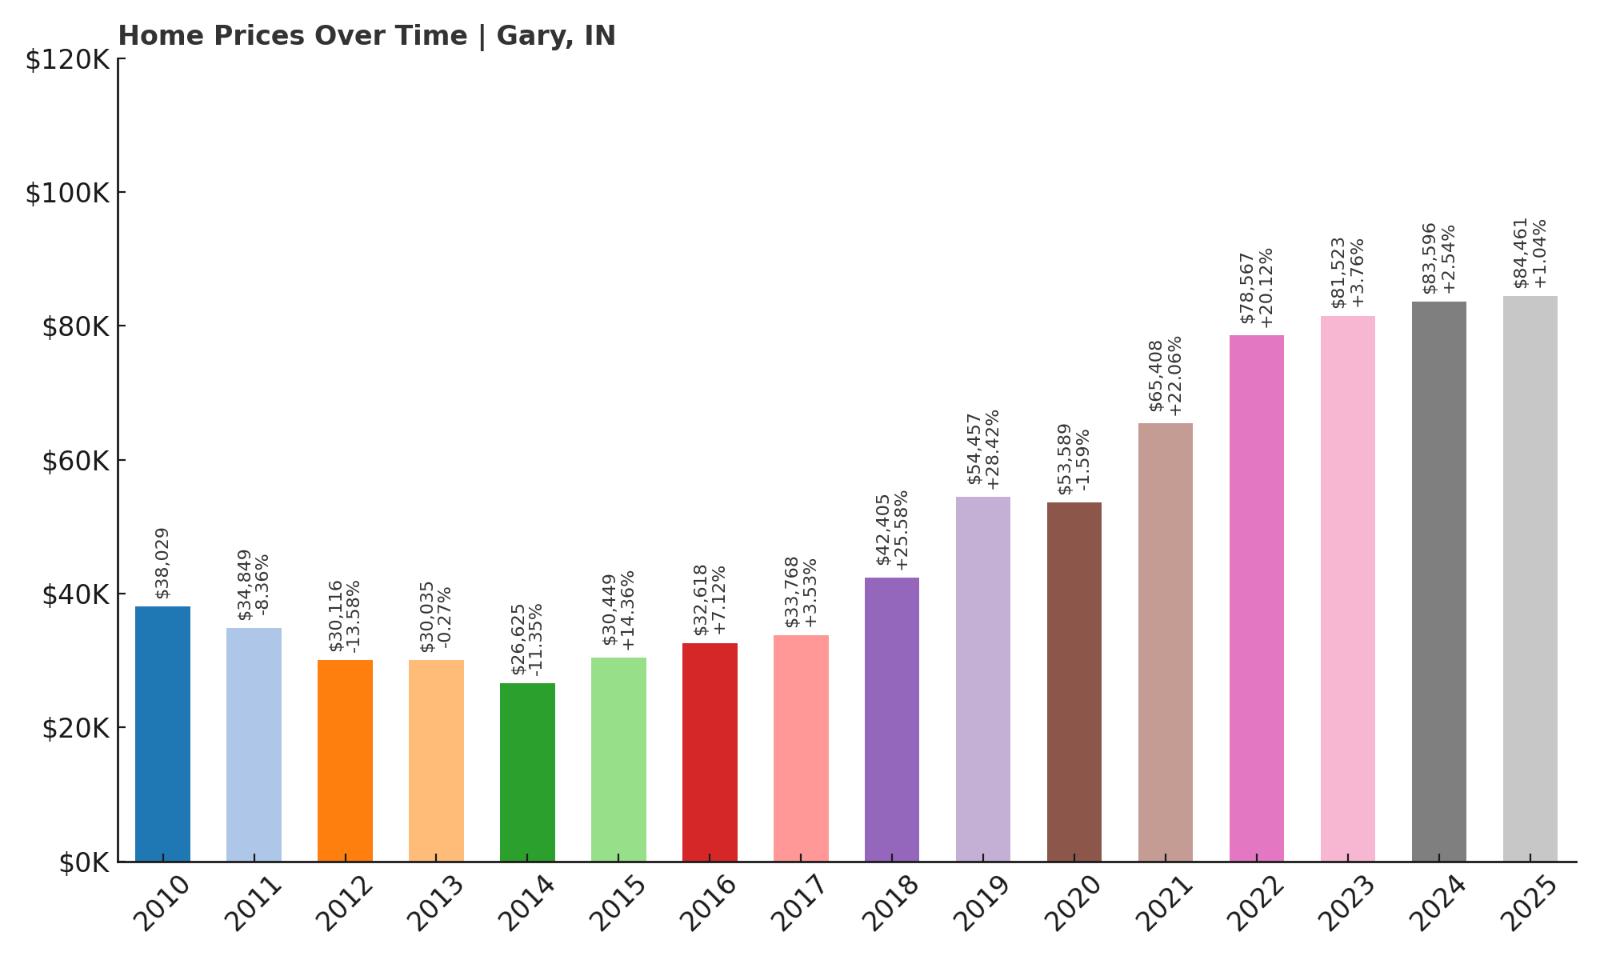
- 2010: $38,029
- 2011: $34,849 (-$3,180, -8.36% from previous year)
- 2012: $30,116 (-$4,733, -13.58% from previous year)
- 2013: $30,035 (-$81, -0.27% from previous year)
- 2014: $26,625 (-$3,410, -11.35% from previous year)
- 2015: $30,449 (+$3,824, +14.36% from previous year)
- 2016: $32,618 (+$2,169, +7.12% from previous year)
- 2017: $33,768 (+$1,150, +3.53% from previous year)
- 2018: $42,405 (+$8,638, +25.58% from previous year)
- 2019: $54,457 (+$12,052, +28.42% from previous year)
- 2020: $53,589 (-$869, -1.59% from previous year)
- 2021: $65,408 (+$11,819, +22.06% from previous year)
- 2022: $78,567 (+$13,159, +20.12% from previous year)
- 2023: $81,523 (+$2,956, +3.76% from previous year)
- 2024: $83,596 (+$2,073, +2.54% from previous year)
- 2025: $84,461 (+$866, +1.04% from previous year)
Gary’s home prices have increased 122% since 2010, rising from $38,029 to $84,461 in 2025. The town saw steep declines in the early part of the last decade, hitting a low point in 2014. Since then, however, prices have rebounded sharply—especially from 2018 through 2022, when values nearly doubled. Growth has slowed in recent years, but the overall trajectory remains positive. Gary continues to offer some of the lowest housing prices in Indiana despite years of steady appreciation.
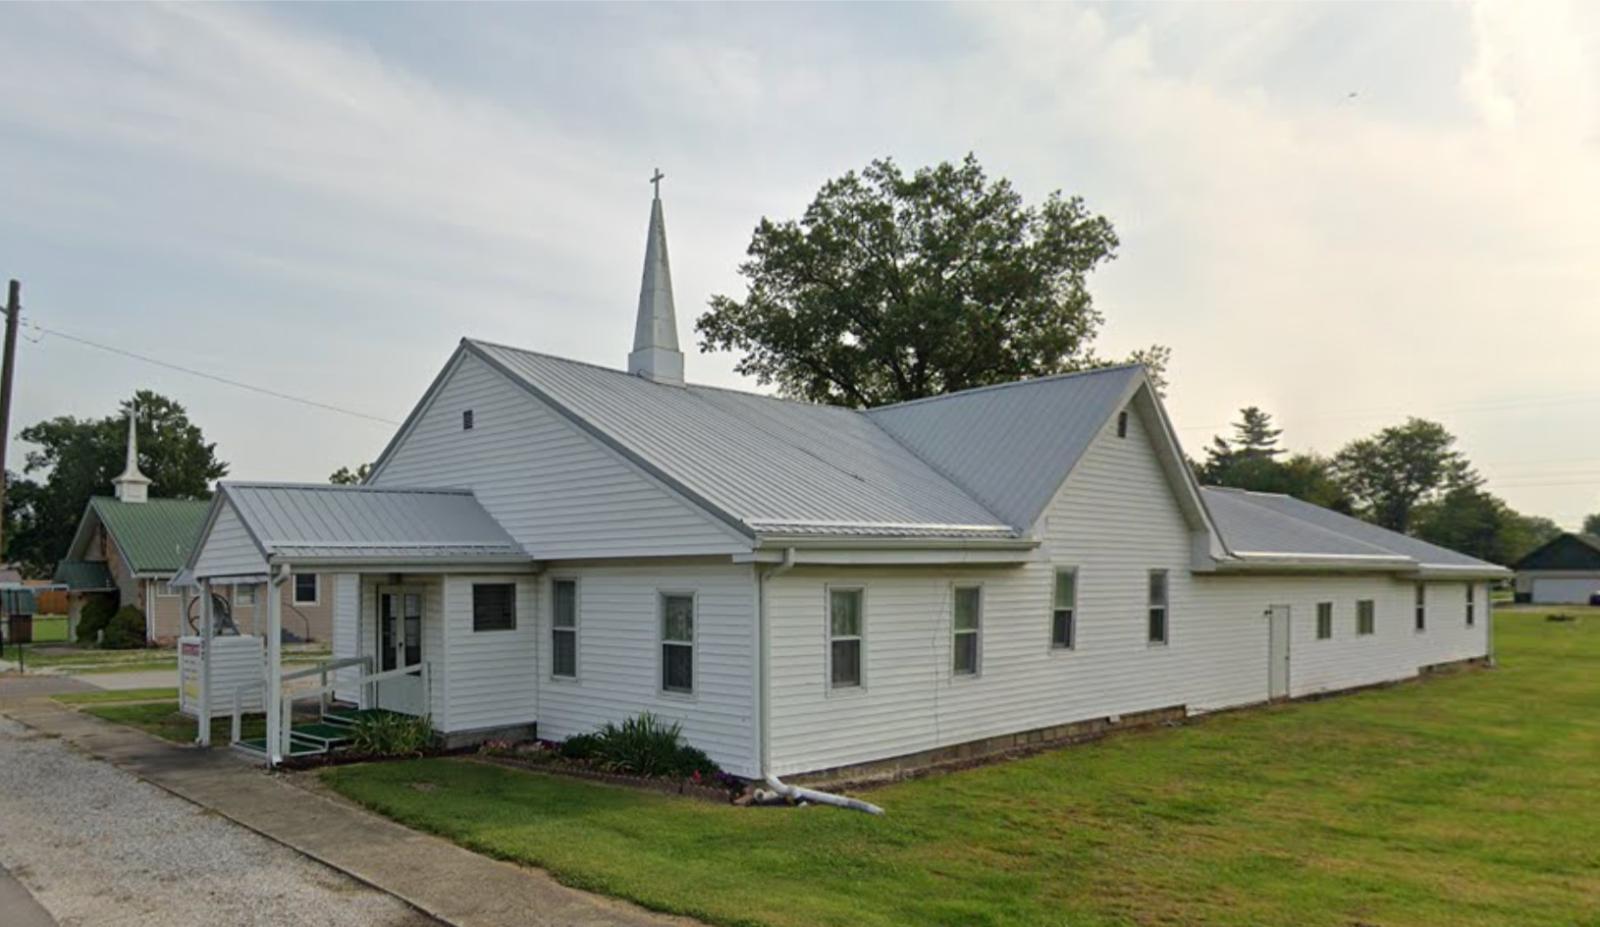
Gary – Rock-Bottom Prices in a City Rebuilding Itself
🔥 Would you like to save this?
Located on the southern shore of Lake Michigan in northwest Indiana, Gary is the largest city on this list by far. Once a booming steel town, Gary experienced decades of economic decline, job loss, and population shrinkage. However, in recent years, there’s been renewed interest in the city’s incredibly affordable real estate market. Investors, first-time buyers, and Chicago commuters alike have begun to take a second look at Gary, attracted by prices that are still far below the state and national averages.
Much of the housing stock is older and in need of repair, but that’s part of the opportunity. With a major interstate, commuter rail access to downtown Chicago, and plans for downtown redevelopment, Gary’s affordability is paired with long-term upside. The city is also home to beaches, parks, and access to the Indiana Dunes National Park. While challenges remain, the data tells a clear story—Gary is no longer declining. It’s stabilizing and slowly gaining value, making it a compelling option for buyers who want affordability now and potential returns in the future.


