
🔥 Would you like to save this?
According to the Zillow Home Value Index, Connecticut’s housing market has shown fascinating patterns of decline, recovery, and growth over the past fifteen years. You’ll discover that while these towns represent the most affordable options in the state, they’ve still experienced remarkable appreciation, especially since 2020.
You might be surprised to learn that several of these affordable communities have seen their home values more than double over the 15-year period from 2010 to 2025, with Waterbury and New Britain leading the pack at 106.64% and 135.73% growth respectively. This dramatic appreciation demonstrates how even the state’s most budget-friendly markets have been transformed by post-pandemic housing demand.
In order to come up with the very specific design ideas, we create most designs with the assistance of state-of-the-art AI interior design software. Also, assume links that take you off the site are affiliate links such as links to Amazon. this means we may earn a commission if you buy something.
As you explore these 25 Connecticut towns, you’ll notice a consistent pattern: most experienced value declines from 2010-2015, modest recovery by 2020, and then explosive growth in the 2020-2025 period. This acceleration suggests that Connecticut’s traditionally affordable communities are rapidly becoming more expensive, potentially limiting future entry opportunities for budget-conscious homebuyers.
25. Montville
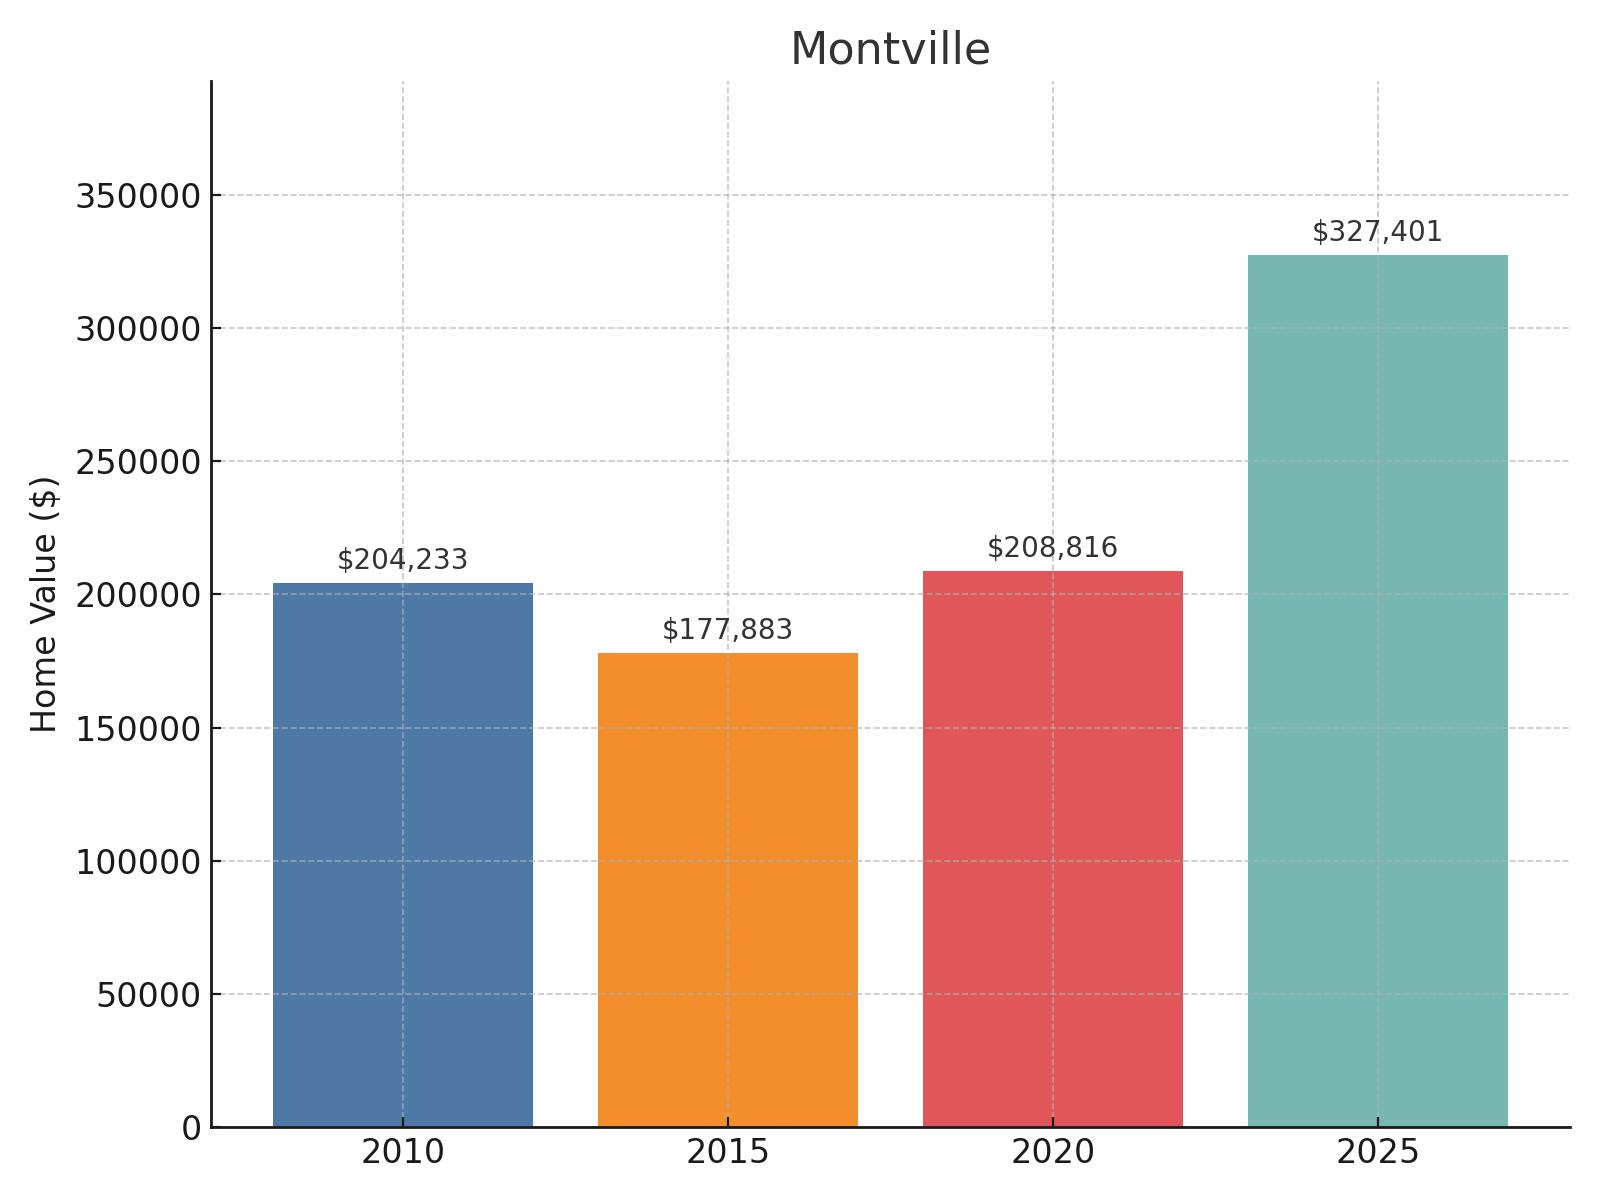
- 2025 Home Value: $327,401
- 2020 Home Value: $208,816
- 2015 Home Value: $177,883
- 2010 Home Value: $204,233
- Change 2020-2025: 56.79%
- Change 2015-2025: 84.05%
- Change 2010-2025: 60.31%
Located in southeastern Connecticut between Norwich and New London, Montville tops our list with its intriguing market dynamics. You’ll notice that home values experienced significant fluctuation, declining from $204,233 in 2010 to $177,883 in 2015, a 12.9% drop during the extended housing slump. By 2020, the market had recovered to $208,816, finally surpassing 2010 levels. The past five years have seen strong growth of 56.79%, bringing values to $327,401 in 2025. This represents a 60.31% increase over the full 15-year period, with most of that growth occurring since 2015.
24. Derby
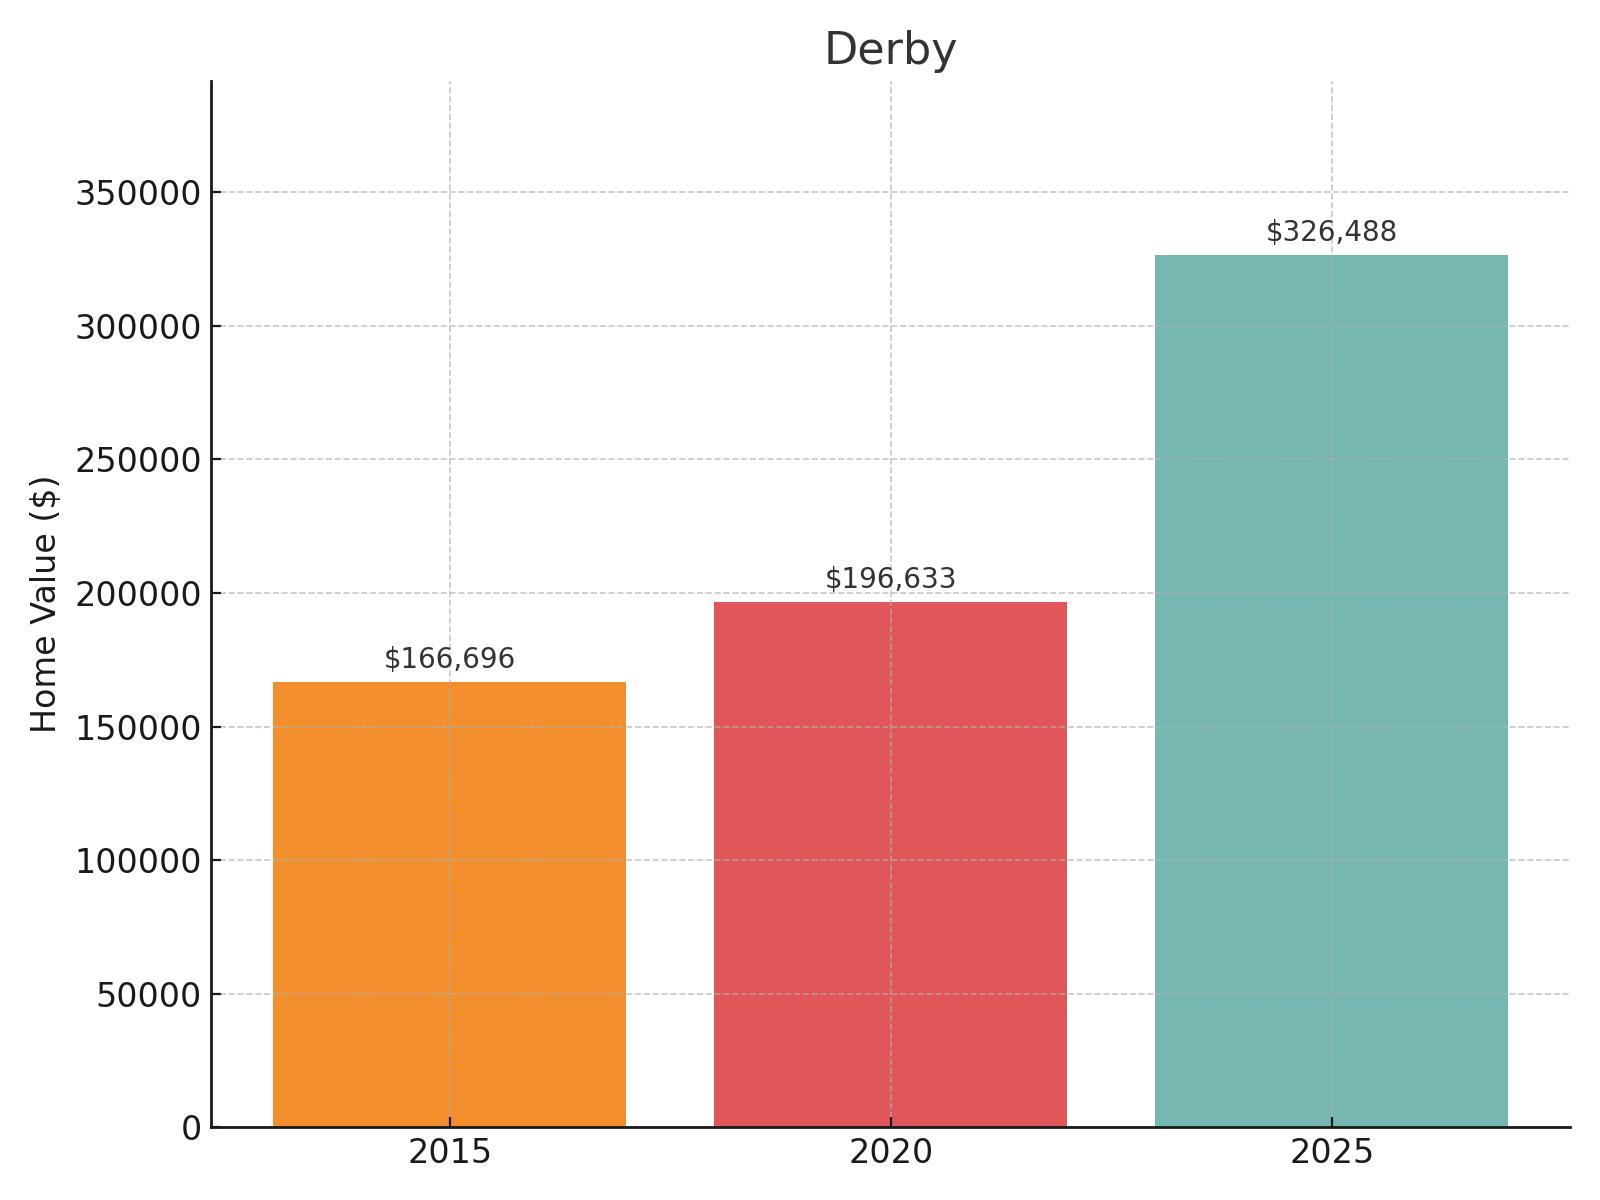
- 2025 Home Value: $326,488
- 2020 Home Value: $196,633
- 2015 Home Value: $166,696
- 2010 Home Value: Data unavailable
- Change 2020-2025: 66.04%
- Change 2015-2025: 95.86%
- Change 2010-2025: Data unavailable
Positioned in southwestern Connecticut at the confluence of the Housatonic and Naugatuck Rivers, Derby has experienced robust growth in its housing market over the past decade. While data for 2010 is unavailable, you’ll discover that home values increased from $166,696 in 2015 to $196,633 by 2020, representing an 18% growth during that period. The market then accelerated significantly with a 66.04% surge over the next five years, bringing values to $326,488 by 2025. This represents a 95.86% increase over the decade from 2015 to 2025, nearly doubling property values in this small industrial city.
23. Plainfield
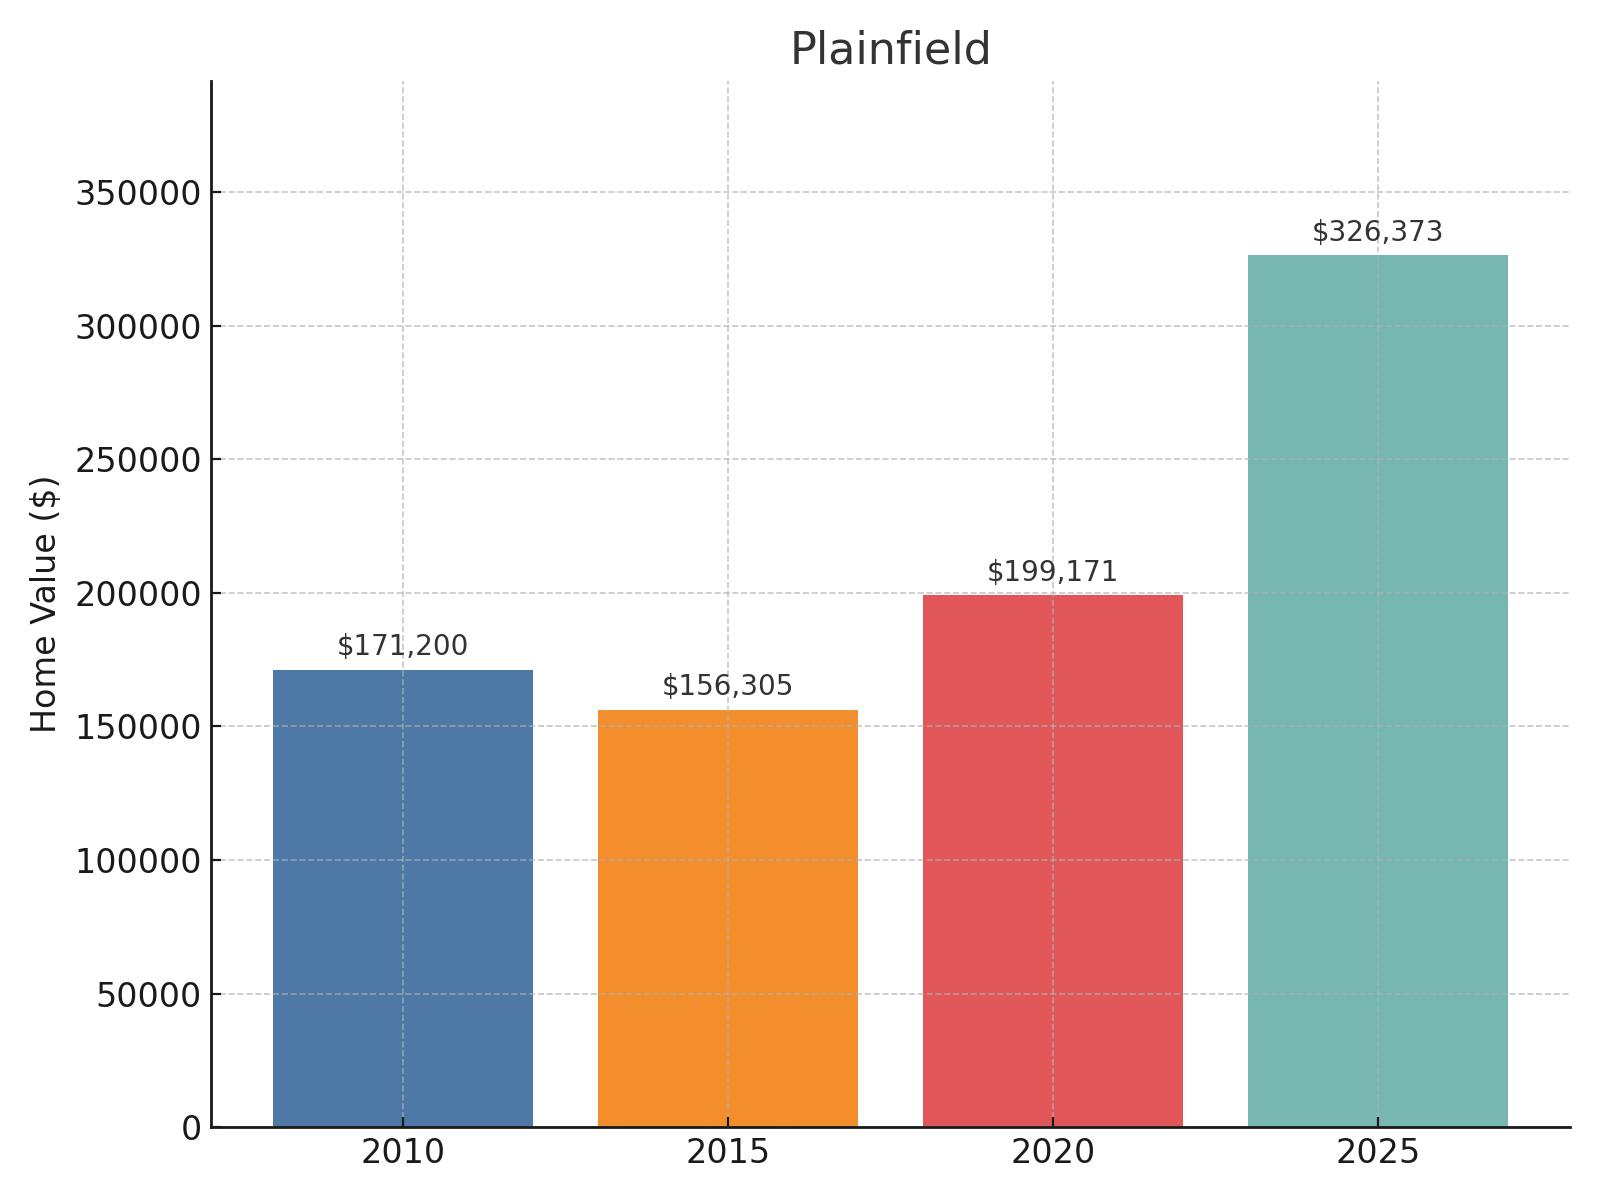
- 2025 Home Value: $326,373
- 2020 Home Value: $199,171
- 2015 Home Value: $156,305
- 2010 Home Value: $171,200
- Change 2020-2025: 63.87%
- Change 2015-2025: 108.81%
- Change 2010-2025: 90.64%
Sprawling across the scenic countryside of eastern Connecticut, Plainfield demonstrates the dramatic recovery possible in rural communities. You’ll be interested to learn that home values initially declined from $171,200 in 2010 to $156,305 in 2015, showing how the housing crisis continued to affect smaller towns well after the recession officially ended. The market began recovering by 2020, reaching $199,171 and finally surpassing 2010 levels. The last five years have seen substantial growth of 63.87%, bringing values to $326,373 in 2025. This represents a 90.64% increase over the 15-year period, with property values more than doubling from their 2015 low point.
22. Vernon Rockville
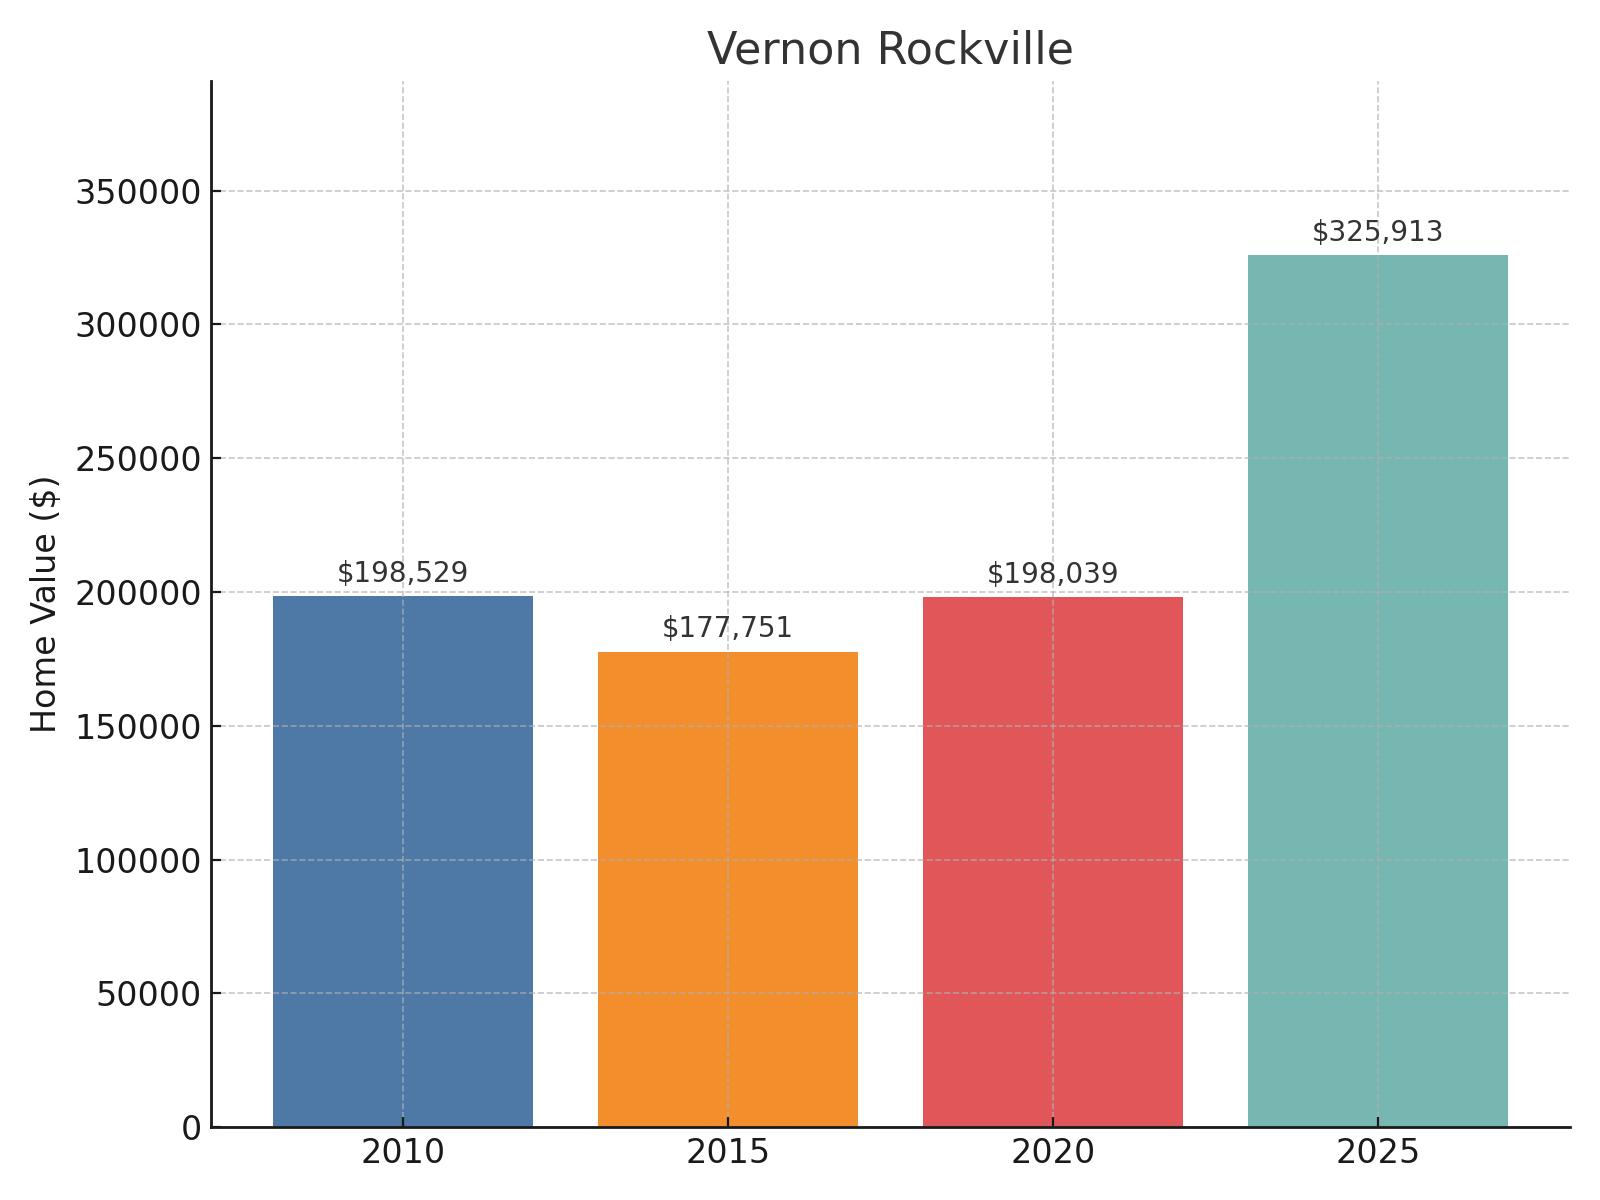
- 2025 Home Value: $325,913
- 2020 Home Value: $198,039
- 2015 Home Value: $177,751
- 2010 Home Value: $198,529
- Change 2020-2025: 64.57%
- Change 2015-2025: 83.35%
- Change 2010-2025: 64.16%
Located in northeastern Connecticut about 15 miles from Hartford, Vernon Rockville presents a classic example of the prolonged recovery many New England communities have experienced. You’ll observe that home values actually declined from $198,529 in 2010 to $177,751 in 2015, a 10.5% drop during the extended housing slump. By 2020, values had essentially recovered to $198,039, nearly matching 2010 levels. The past five years have witnessed significant acceleration with a 64.57% growth rate, bringing values to $325,913 in 2025. This represents a 64.16% increase over the full 15-year period, with almost all of that growth occurring since 2020.
21. Bristol
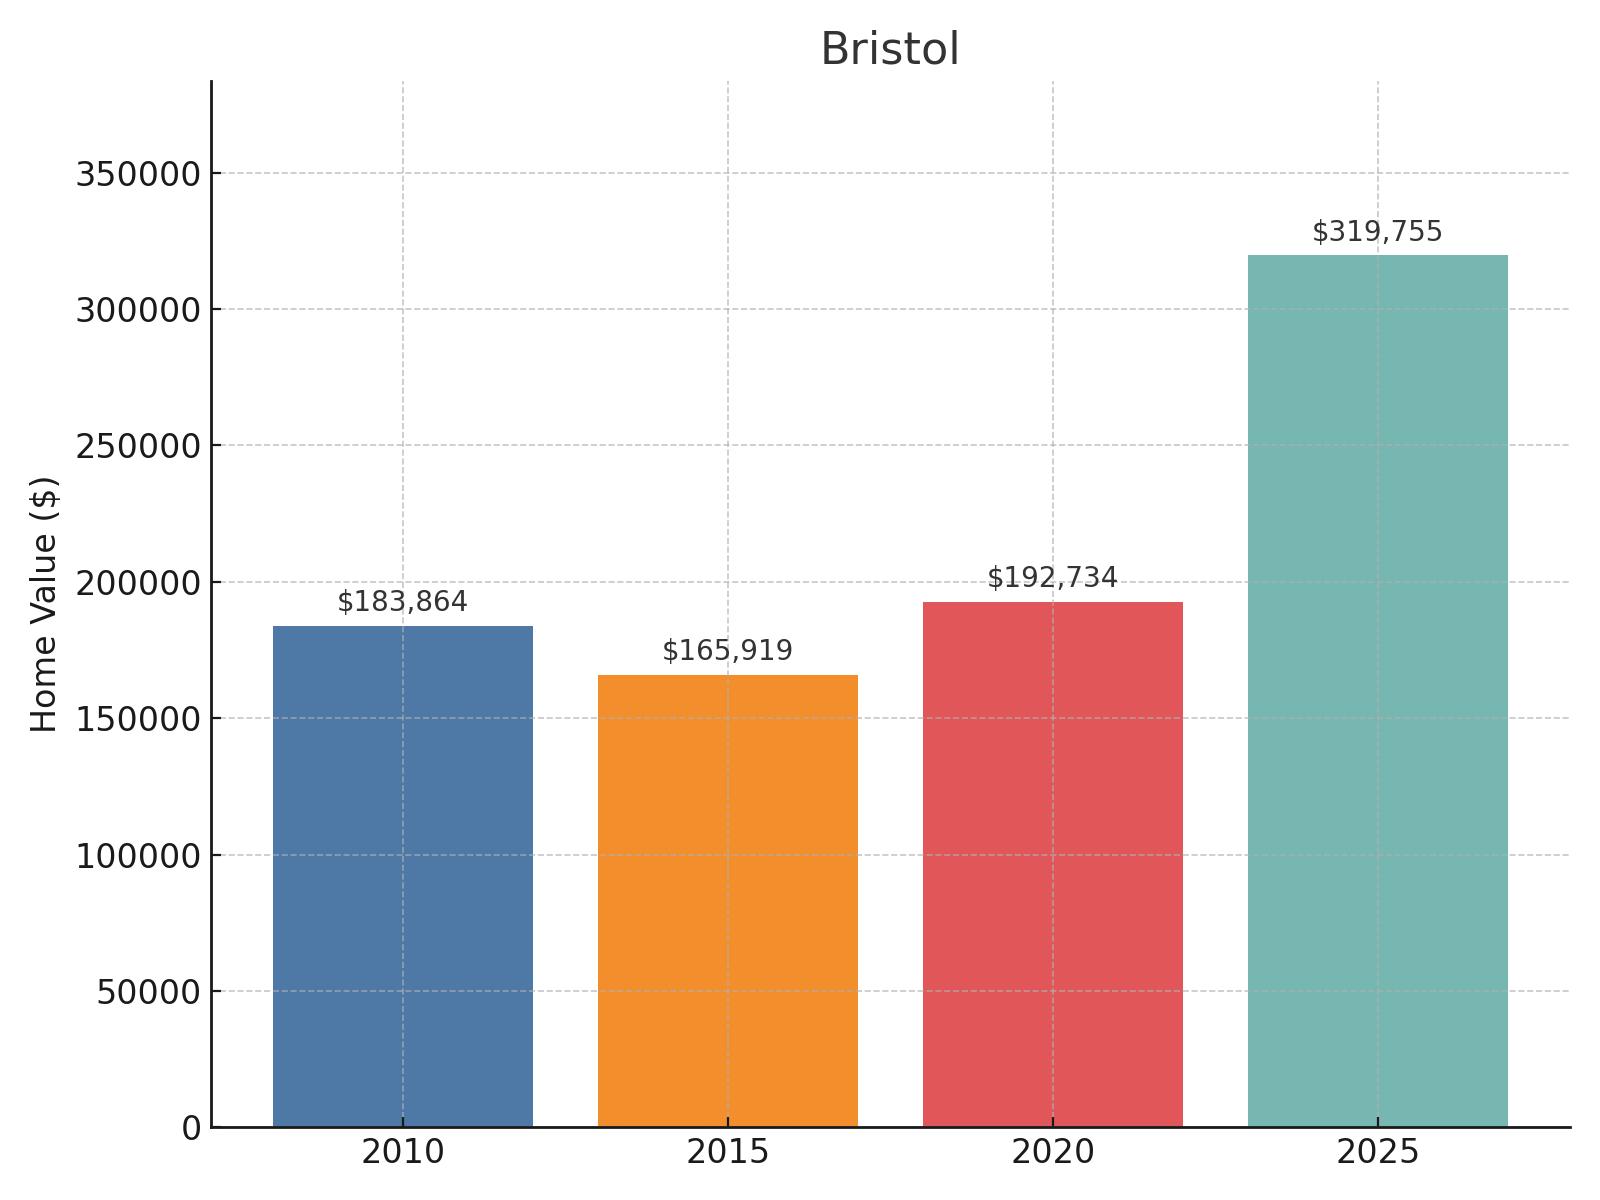
- 2025 Home Value: $319,755
- 2020 Home Value: $192,734
- 2015 Home Value: $165,919
- 2010 Home Value: $183,864
- Change 2020-2025: 65.90%
- Change 2015-2025: 92.72%
- Change 2010-2025: 73.91%
Nestled in central Connecticut west of Hartford, Bristol illustrates the uneven recovery experienced by many former manufacturing centers. You’ll find that home values initially declined from $183,864 in 2010 to $165,919 in 2015, showing the lingering effects of the recession in this industrial city. The market began to recover by 2020, reaching $192,734 and finally surpassing 2010 levels. The past five years have seen remarkable growth of 65.90%, with values climbing to $319,755 in 2025. This represents a 73.91% increase over the 15-year period, with property values nearly doubling from their 2015 low point.
20. Enfield
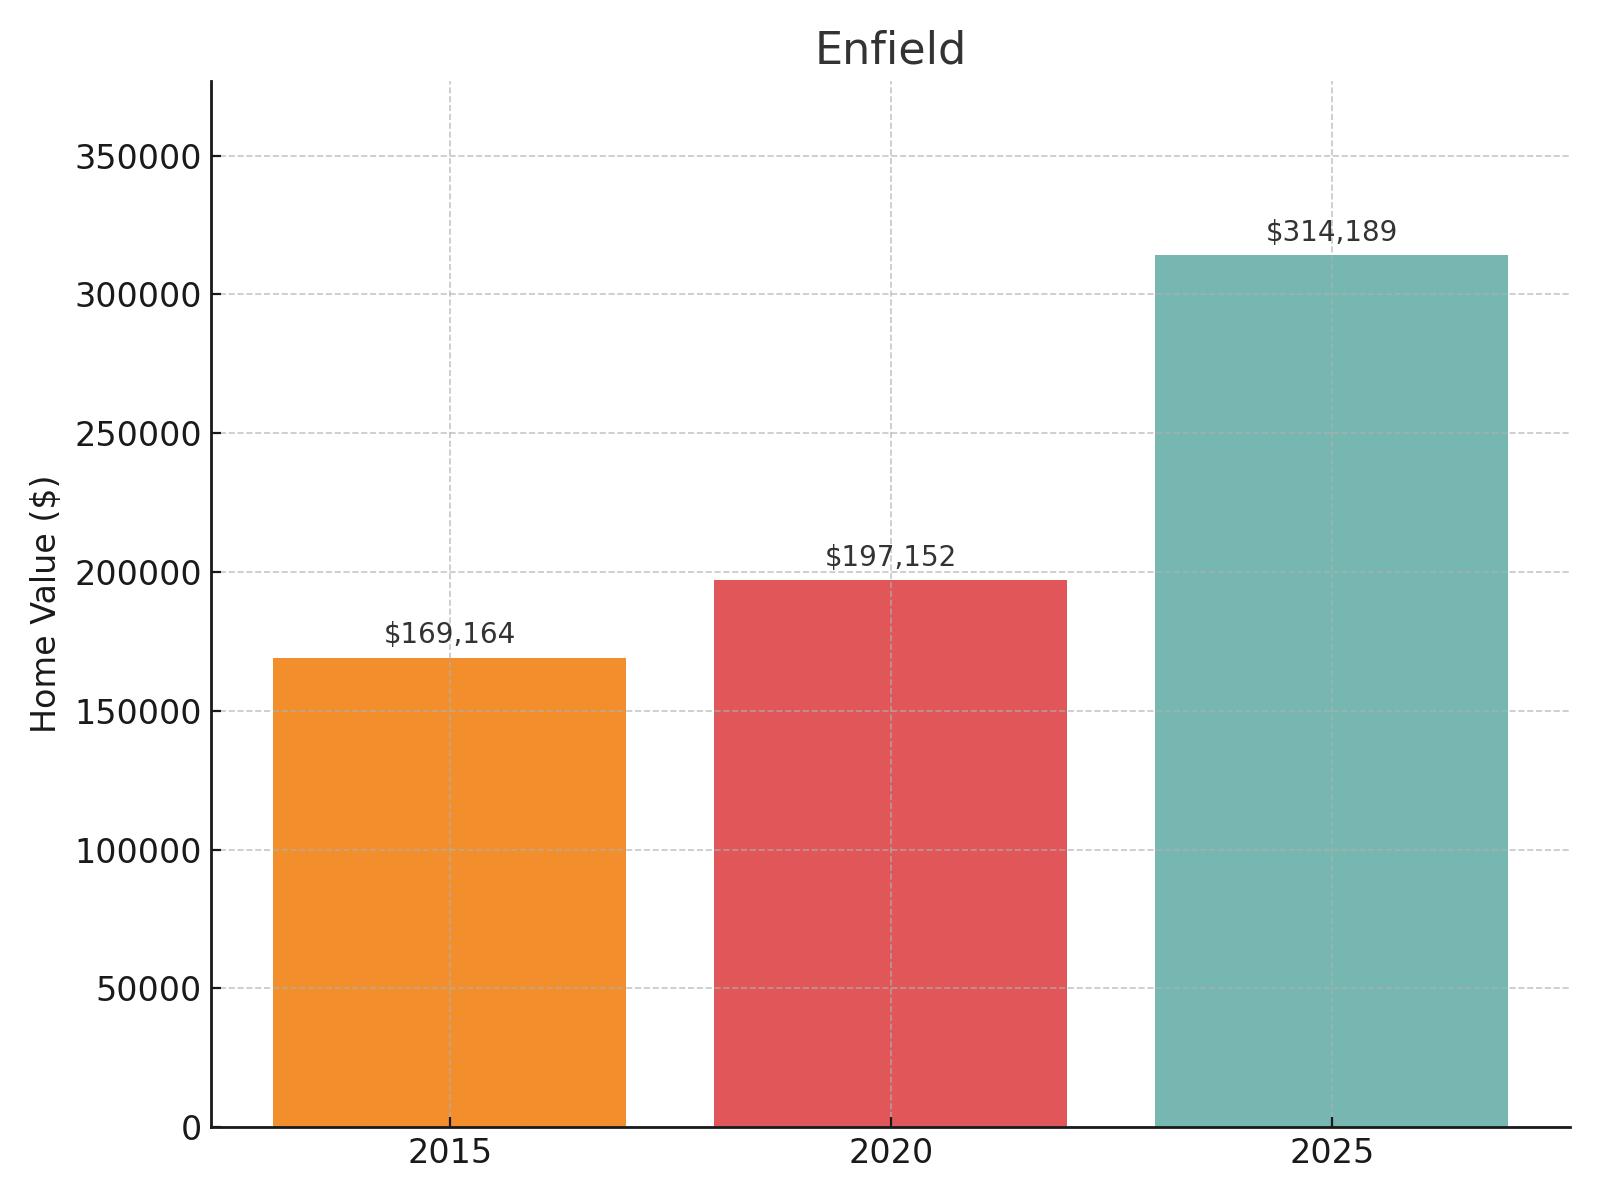
- 2025 Home Value: $314,189
- 2020 Home Value: $197,152
- 2015 Home Value: $169,164
- 2010 Home Value: Data unavailable
- Change 2020-2025: 59.36%
- Change 2015-2025: 85.73%
- Change 2010-2025: Data unavailable
Situated in north-central Connecticut along the Massachusetts border, Enfield has seen steady and accelerating growth in its housing market over the past decade. While data for 2010 is unavailable, you’ll discover that home values increased from $169,164 in 2015 to $197,152 by 2020, representing a modest 16.5% growth during that five-year period. The market then experienced a substantial boost with a 59.36% increase over the next five years, bringing values to $314,189 by 2025. This represents an 85.73% increase over the decade from 2015 to 2025.
19. Stafford Springs
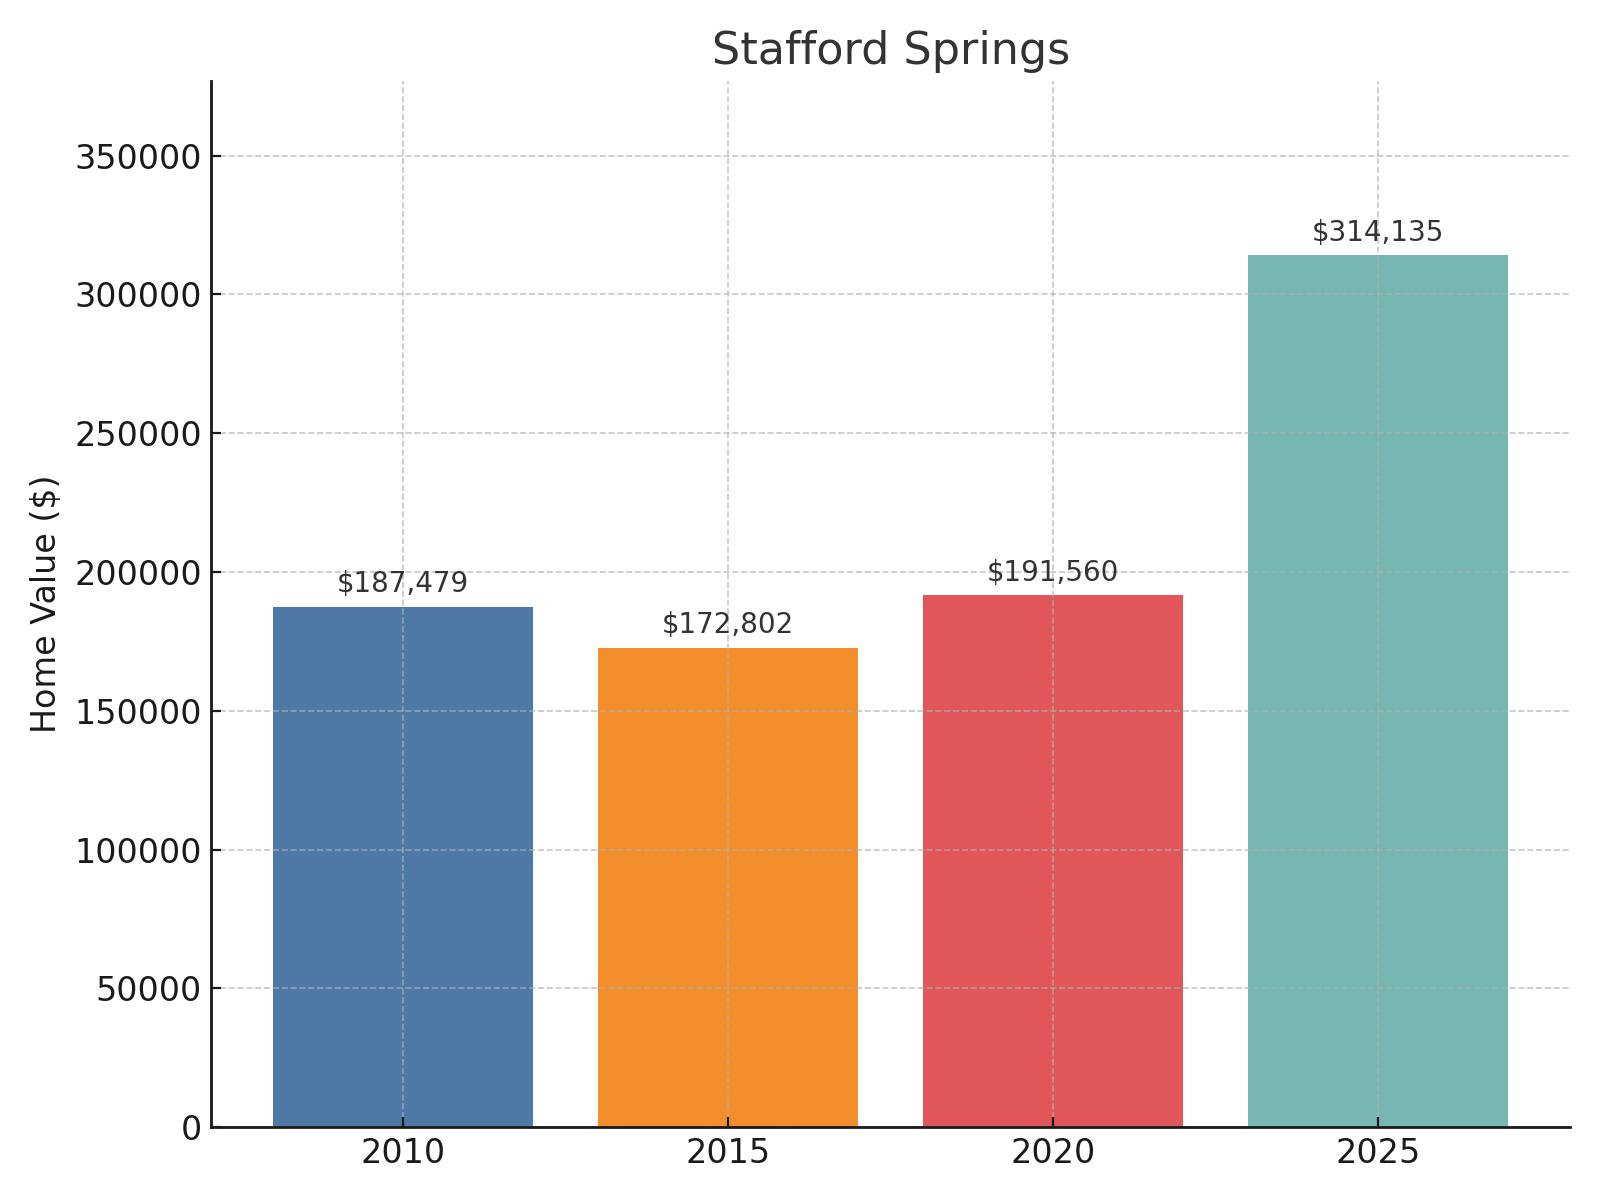
- 2025 Home Value: $314,135
- 2020 Home Value: $191,560
- 2015 Home Value: $172,802
- 2010 Home Value: $187,479
- Change 2020-2025: 63.99%
- Change 2015-2025: 81.79%
- Change 2010-2025: 67.56%
Tucked away in northeastern Connecticut near the Massachusetts border, Stafford Springs shows the cyclical patterns common in rural New England communities. You’ll notice that home values actually declined from $187,479 in 2010 to $172,802 in 2015, reflecting the extended impact of the recession in more remote areas. By 2020, the market had recovered to $191,560, slightly surpassing 2010 levels. The past five years have witnessed impressive growth of 63.99%, bringing values to $314,135 in 2025. This represents a 67.56% increase over the 15-year period, with most of that growth concentrated in the last five years.
18. Plainville
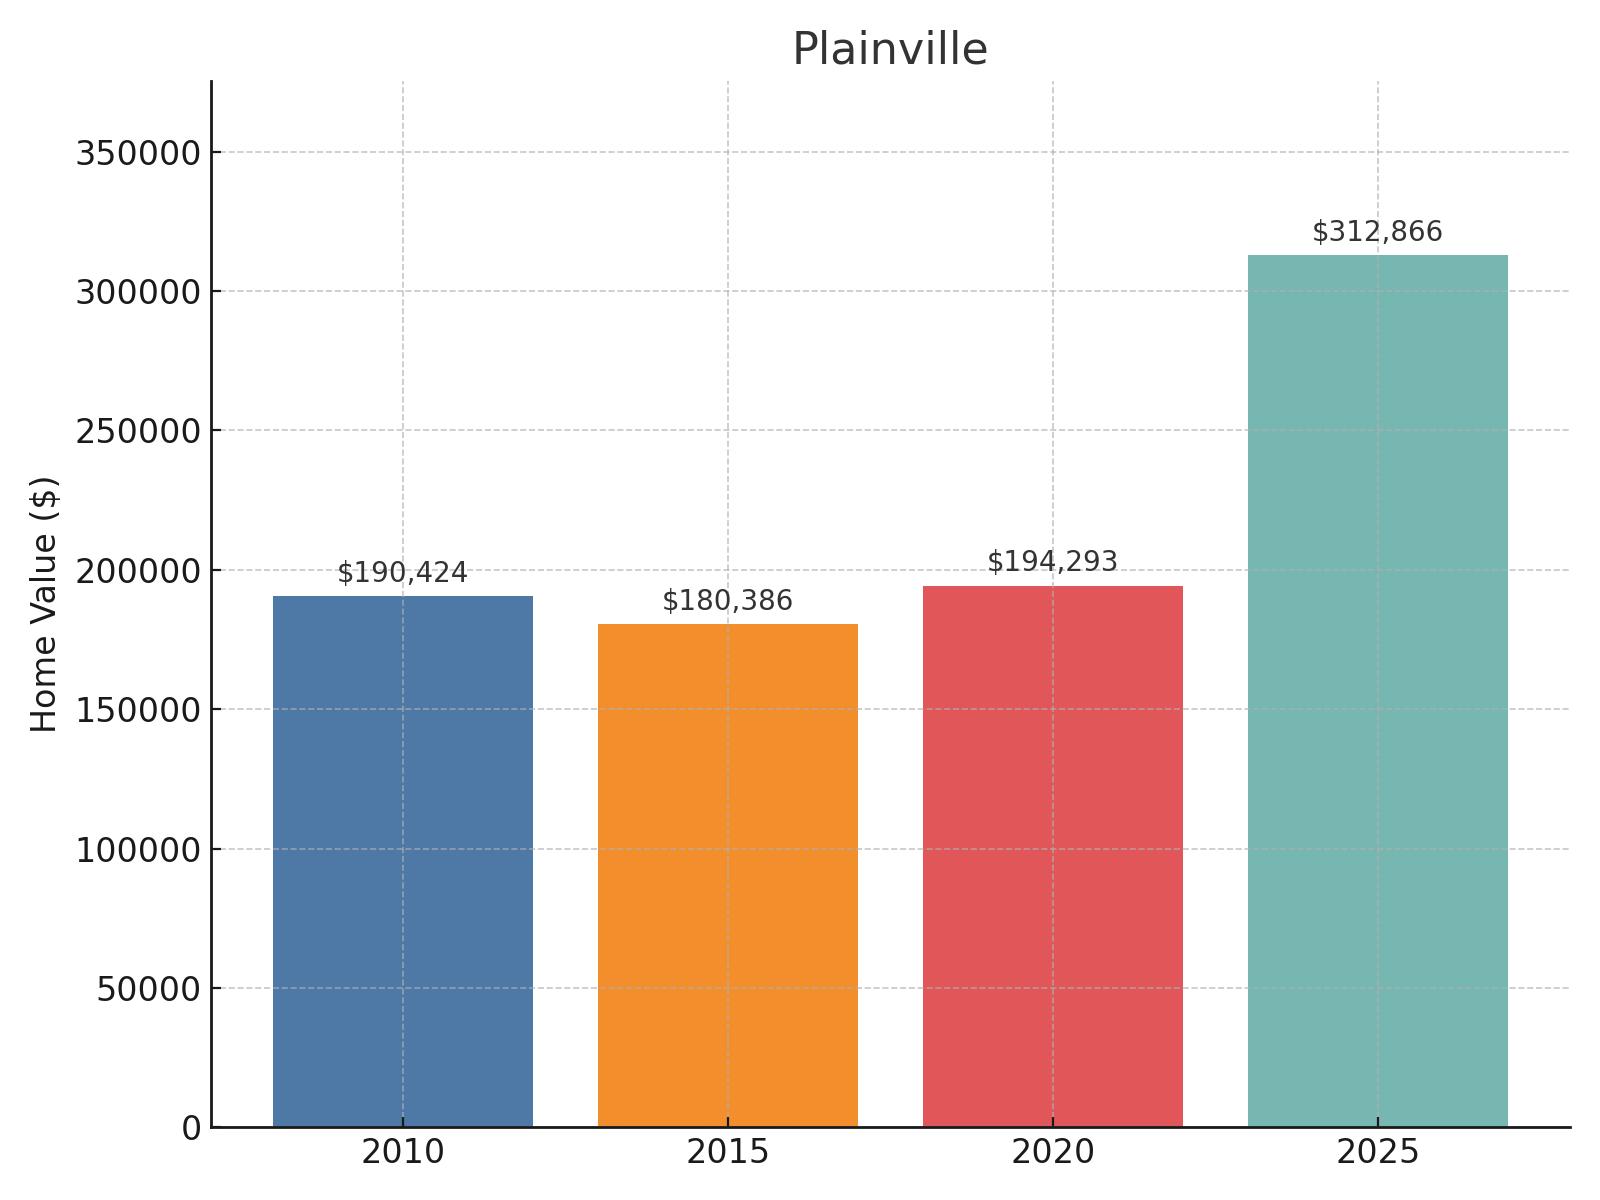
- 2025 Home Value: $312,866
- 2020 Home Value: $194,293
- 2015 Home Value: $180,386
- 2010 Home Value: $190,424
- Change 2020-2025: 61.03%
- Change 2015-2025: 73.44%
- Change 2010-2025: 64.30%
Positioned in central Connecticut between Hartford and Waterbury, Plainville demonstrates a more stable housing market trajectory than many of its neighbors. You’ll observe that home values experienced only minimal fluctuation from 2010 to 2015, with values actually declining slightly from $190,424 to $180,386 during that period. By 2020, the market had recovered to $194,293, slightly above 2010 levels. The last five years have witnessed accelerated growth of 61.03%, bringing values to $312,866 in 2025. This represents a 64.30% increase over the full 15-year period, with most of that growth concentrated in the most recent five years.
17. Manchester

- 2025 Home Value: $311,022
- 2020 Home Value: $192,535
- 2015 Home Value: $168,642
- 2010 Home Value: Data unavailable
- Change 2020-2025: 61.54%
- Change 2015-2025: 84.43%
- Change 2010-2025: Data unavailable
Located in central Connecticut just east of Hartford, Manchester has shown steady and accelerating growth in its housing market over the past decade. While data for 2010 is unavailable, you’ll notice that home values increased from $168,642 in 2015 to $192,535 by 2020, a modest 14.2% growth over that five-year period. The market then experienced a dramatic surge of 61.54% over the next five years, with values reaching $311,022 by 2025. This represents an 84.43% increase over the decade from 2015 to 2025.
16. New Haven
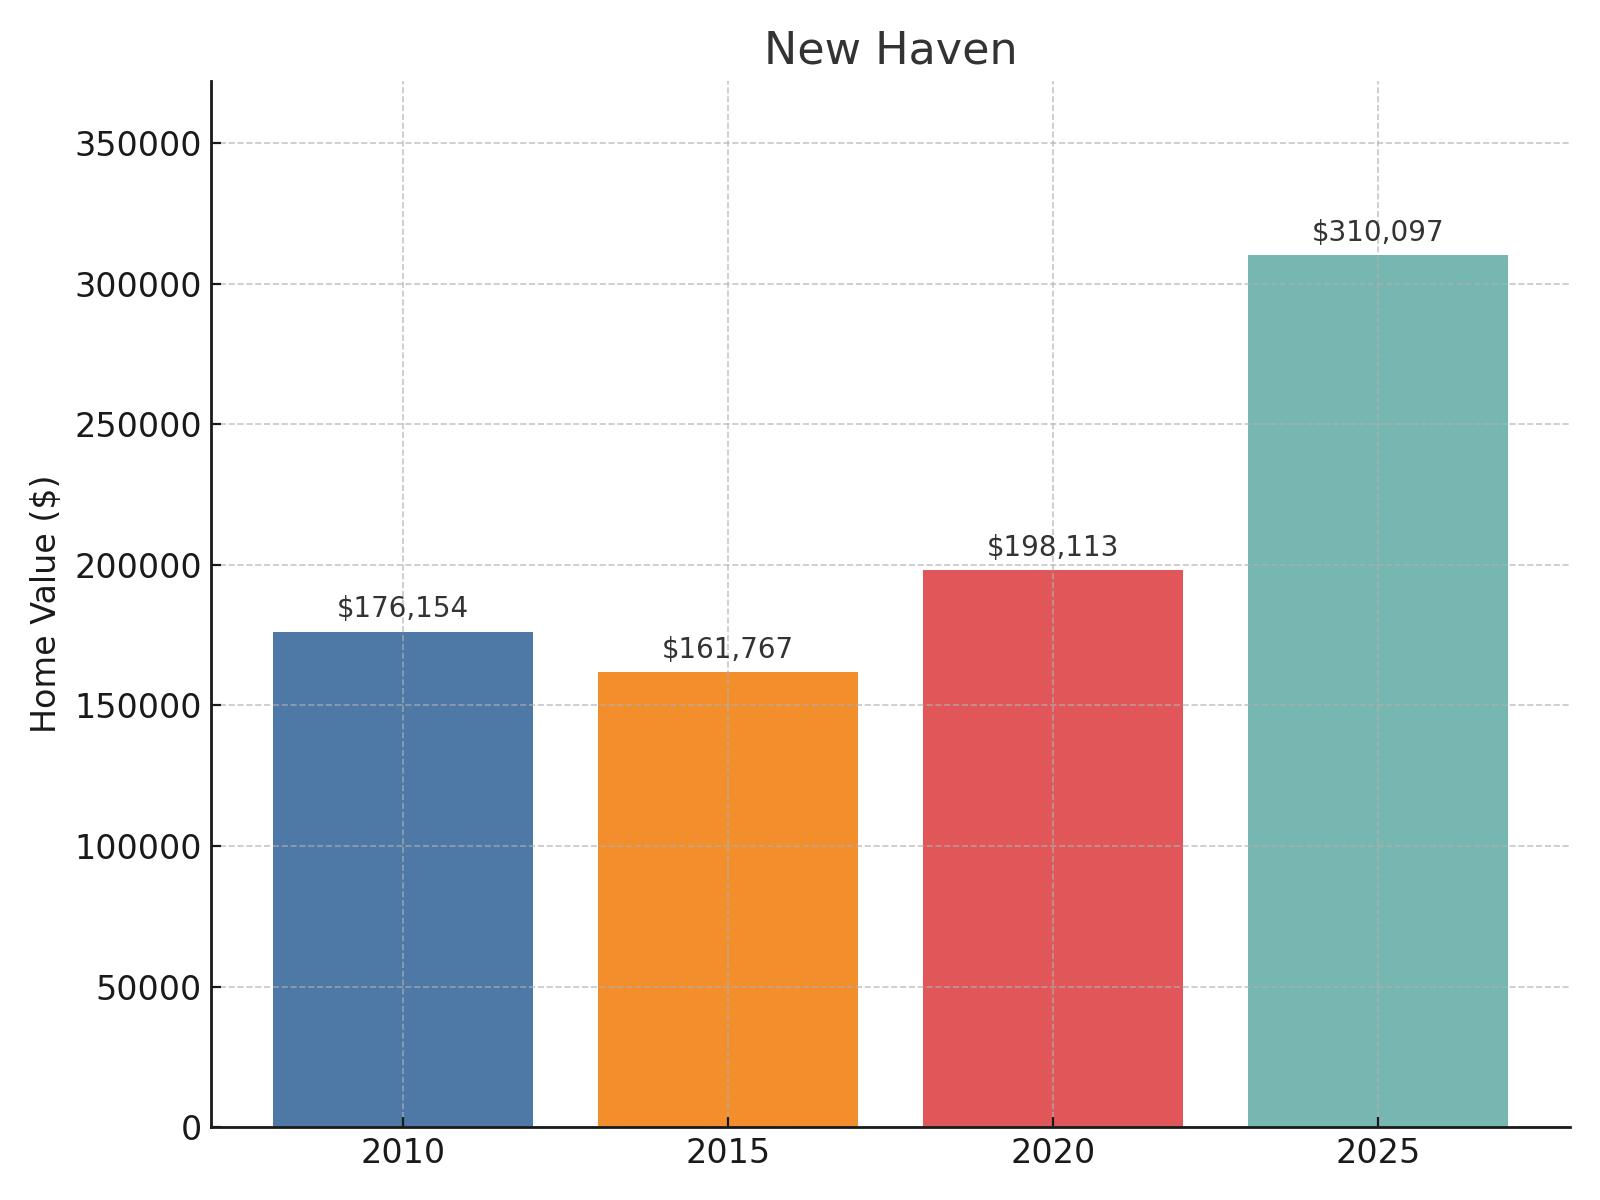
- 2025 Home Value: $310,097
- 2020 Home Value: $198,113
- 2015 Home Value: $161,767
- 2010 Home Value: $176,154
- Change 2020-2025: 56.53%
- Change 2015-2025: 91.69%
- Change 2010-2025: 76.04%
Home to Yale University in southern Connecticut, New Haven illustrates the complex recovery trajectory many larger cities have experienced. You’ll find that home values initially declined from $176,154 in 2010 to $161,767 in 2015, reflecting continued housing market challenges in urban areas. By 2020, the market had recovered and surpassed its previous high, reaching $198,113. The last five years have witnessed remarkable growth of 56.53%, bringing values to $310,097 in 2025. This represents a 76.04% increase over the full 15-year period, with property values nearly doubling from their 2015 low point.
15. Plymouth
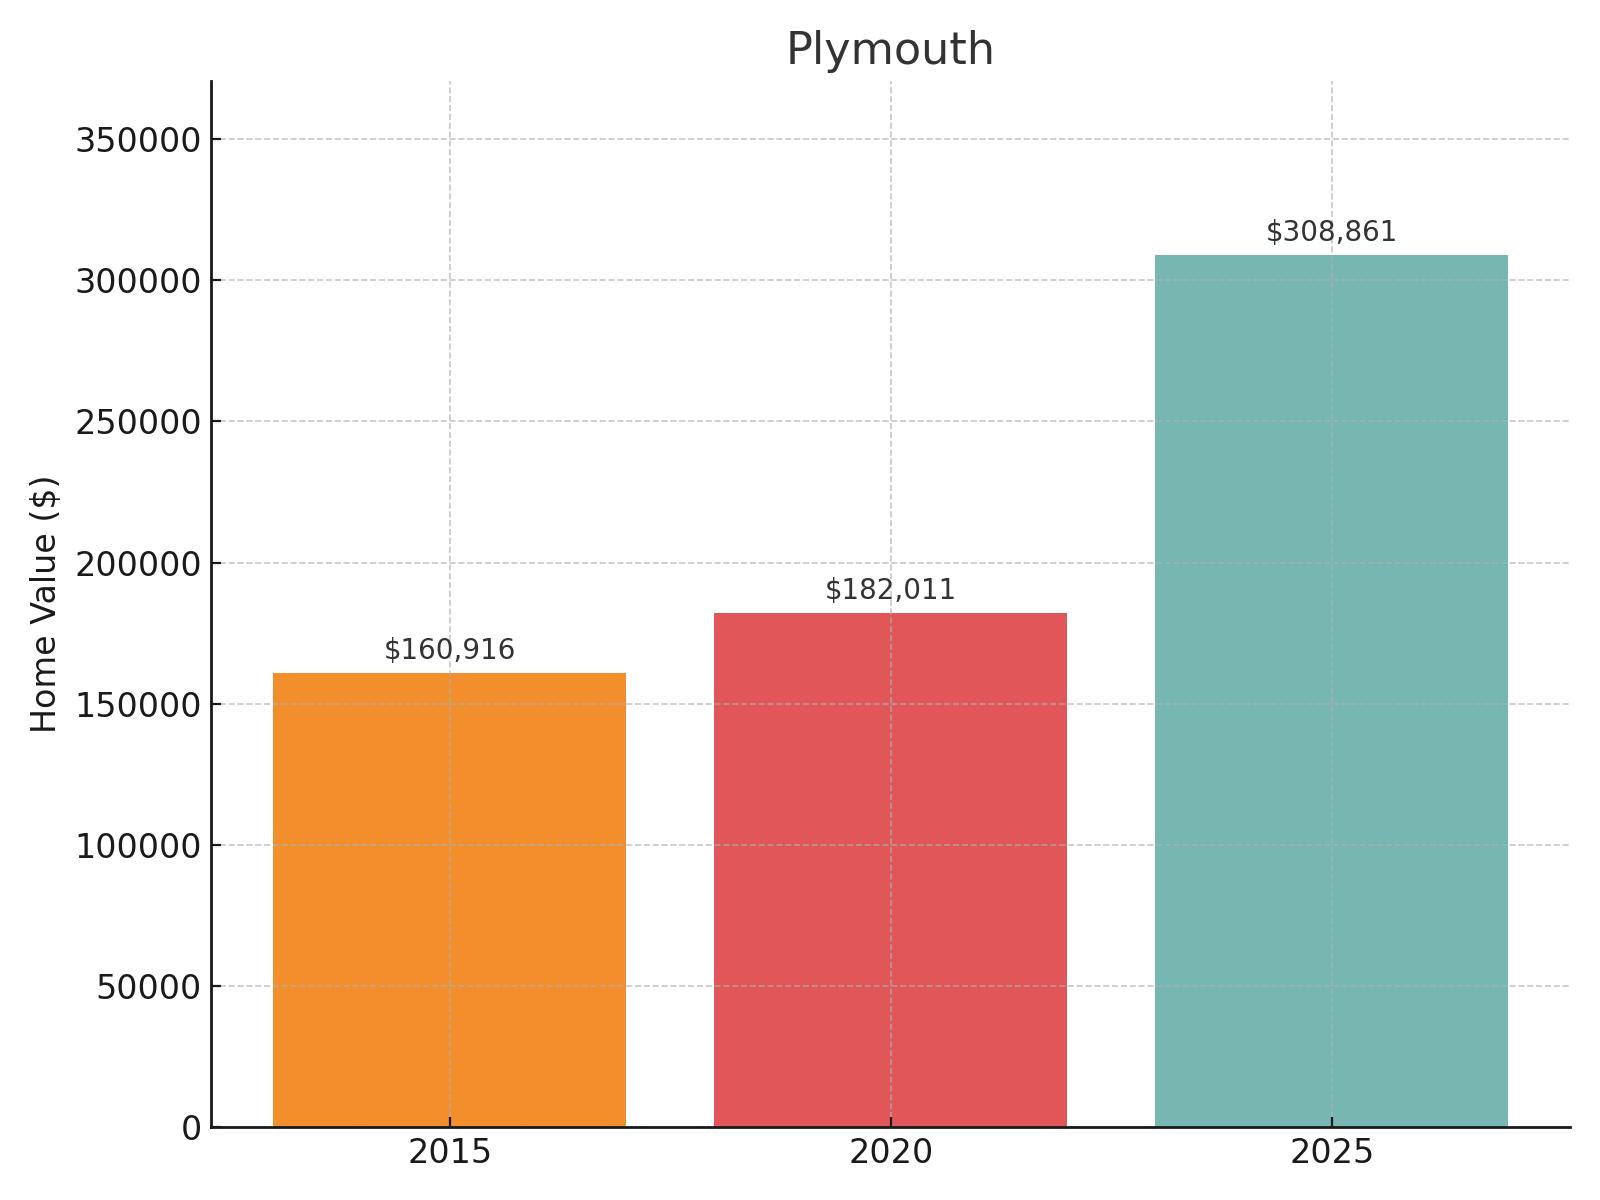
- 2025 Home Value: $308,861
- 2020 Home Value: $182,011
- 2015 Home Value: $160,916
- 2010 Home Value: Data unavailable
- Change 2020-2025: 69.69%
- Change 2015-2025: 91.94%
- Change 2010-2025: Data unavailable
Situated in the scenic hills of central Connecticut, Plymouth has experienced steady growth in its housing market over the past decade. While data for 2010 is unavailable, you’ll observe that home values rose modestly from $160,916 in 2015 to $182,011 by 2020, a 13.1% increase during that period. The market then accelerated dramatically with a 69.69% surge over the next five years, bringing values to $308,861 by 2025. This represents a 91.94% increase over the ten-year period from 2015 to 2025.
14. Windham
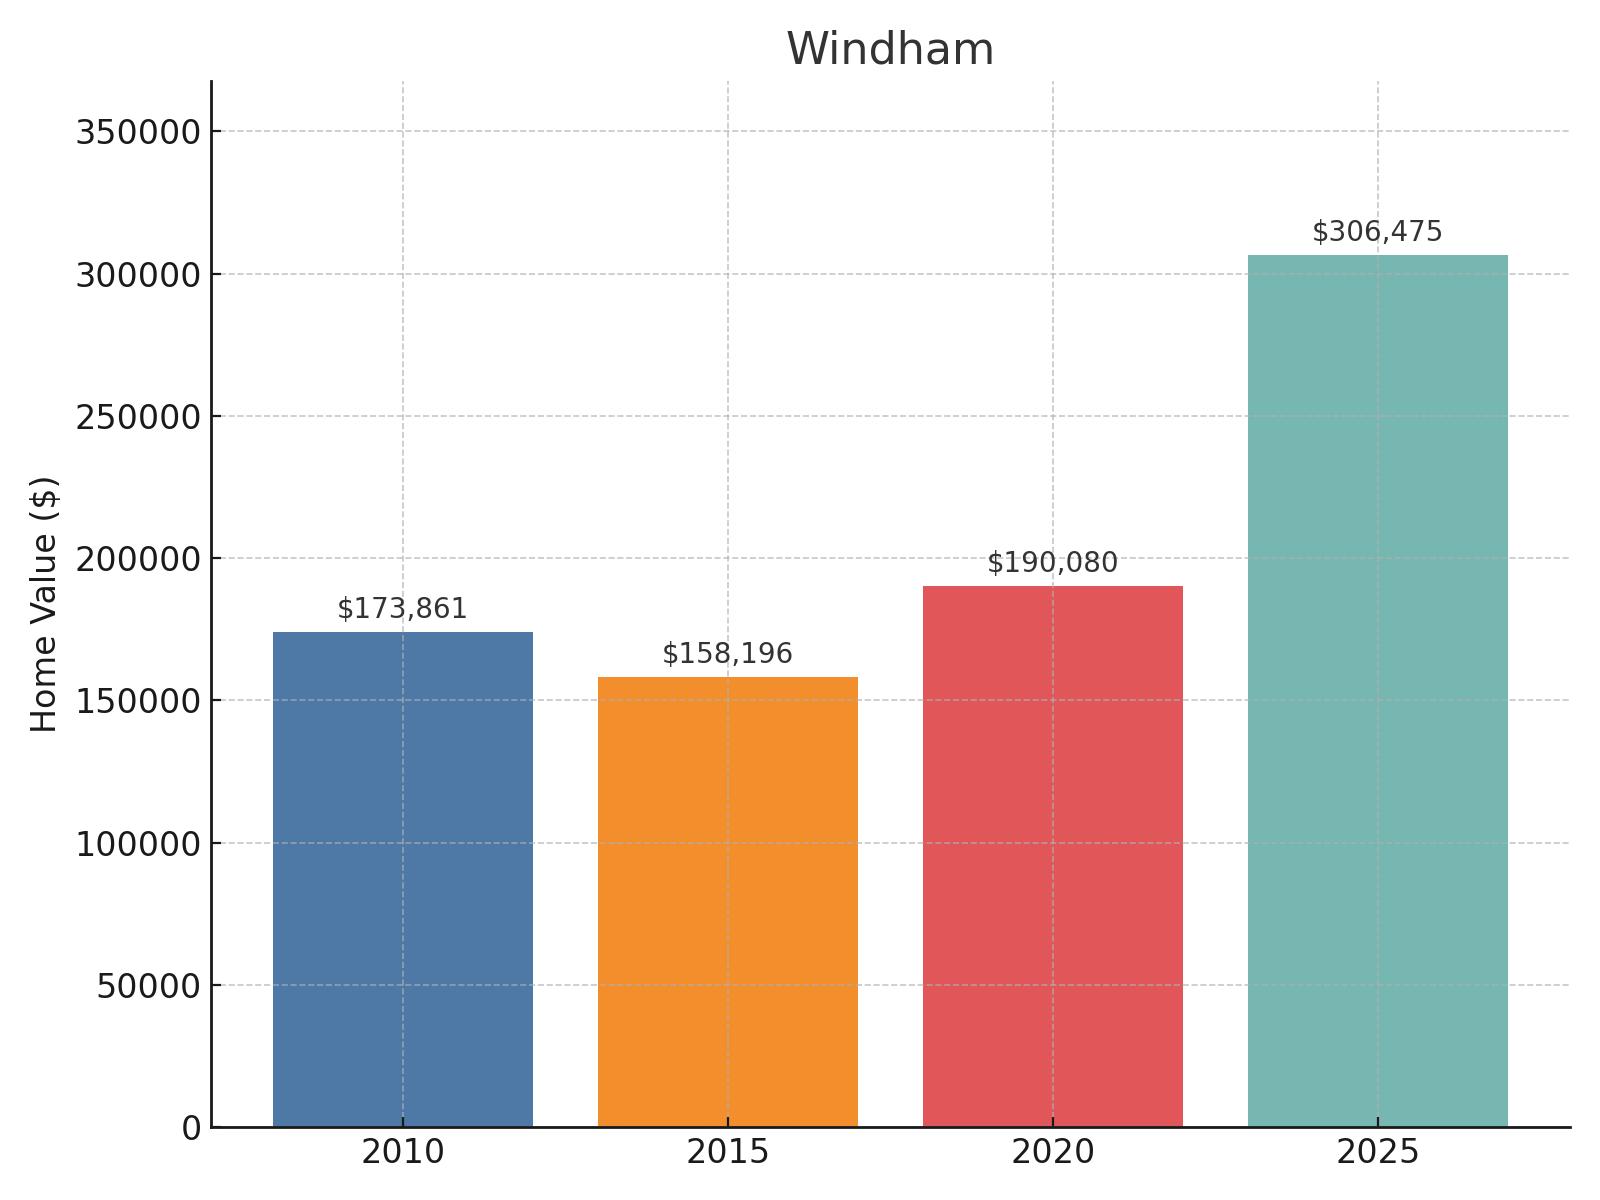
- 2025 Home Value: $306,475
- 2020 Home Value: $190,080
- 2015 Home Value: $158,196
- 2010 Home Value: $173,861
- Change 2020-2025: 61.23%
- Change 2015-2025: 93.73%
- Change 2010-2025: 76.28%
Located in eastern Connecticut, Windham demonstrates the varied recovery patterns seen in many small New England communities. You’ll notice that home values declined from $173,861 in 2010 to $158,196 in 2015, showing the lingering effects of the recession. The market began to recover by 2020, reaching $190,080 and finally surpassing 2010 levels. Over the next five years, values accelerated sharply with a 61.23% growth rate to reach $306,475 by 2025. This represents a 76.28% increase over the 15-year period, with almost all of that growth occurring since 2015.
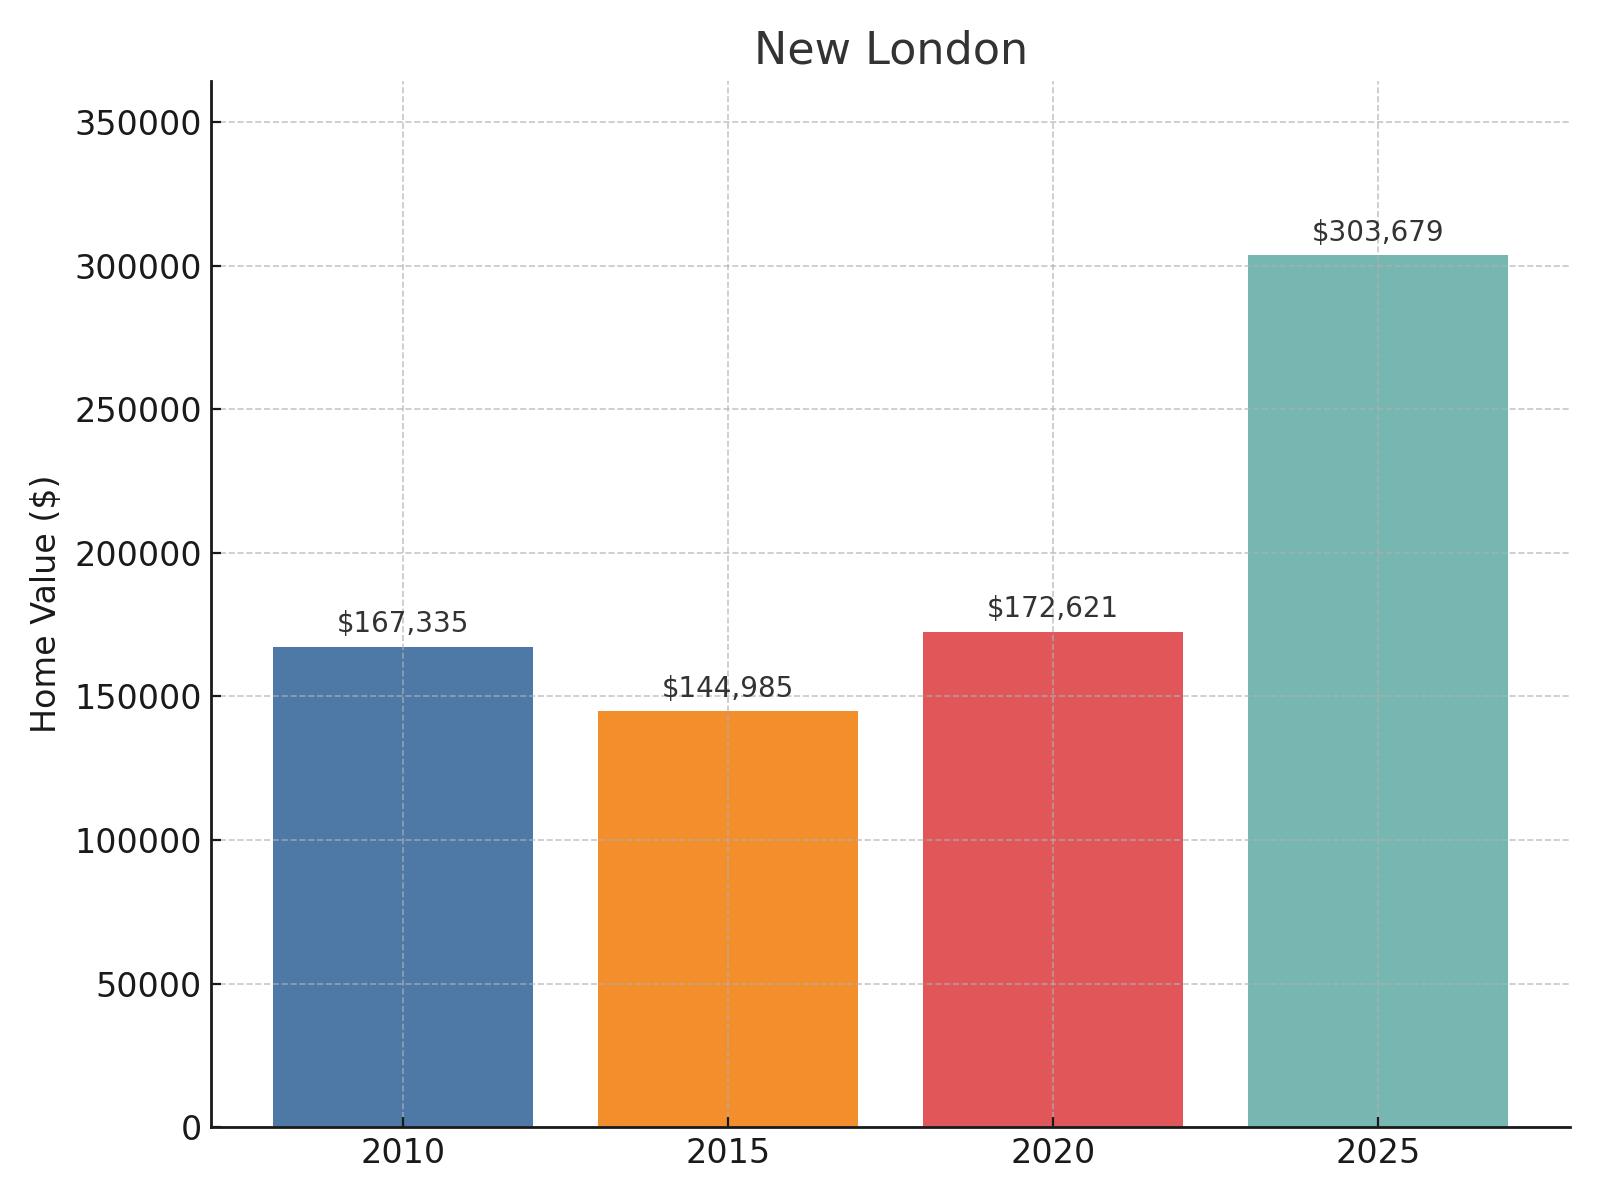
13. New London
🔥 Would you like to save this?
- 2025 Home Value: $303,679
- 2020 Home Value: $172,621
- 2015 Home Value: $144,985
- 2010 Home Value: $167,335
- Change 2020-2025: 75.92%
- Change 2015-2025: 109.45%
- Change 2010-2025: 81.48%
Perched on the shores of southeastern Connecticut, New London showcases the resilience of coastal communities despite economic challenges. You’ll discover that home values declined from $167,335 in 2010 to $144,985 in 2015, a 13.4% drop during an extended post-recession slump. The market began recovering by 2020, reaching $172,621 and finally surpassing 2010 levels. The last five years have seen dramatic acceleration with a 75.92% growth rate, bringing values to $303,679 in 2025. This represents an 81.48% increase over the 15-year period, with values more than doubling from their 2015 low point.
12. Meriden
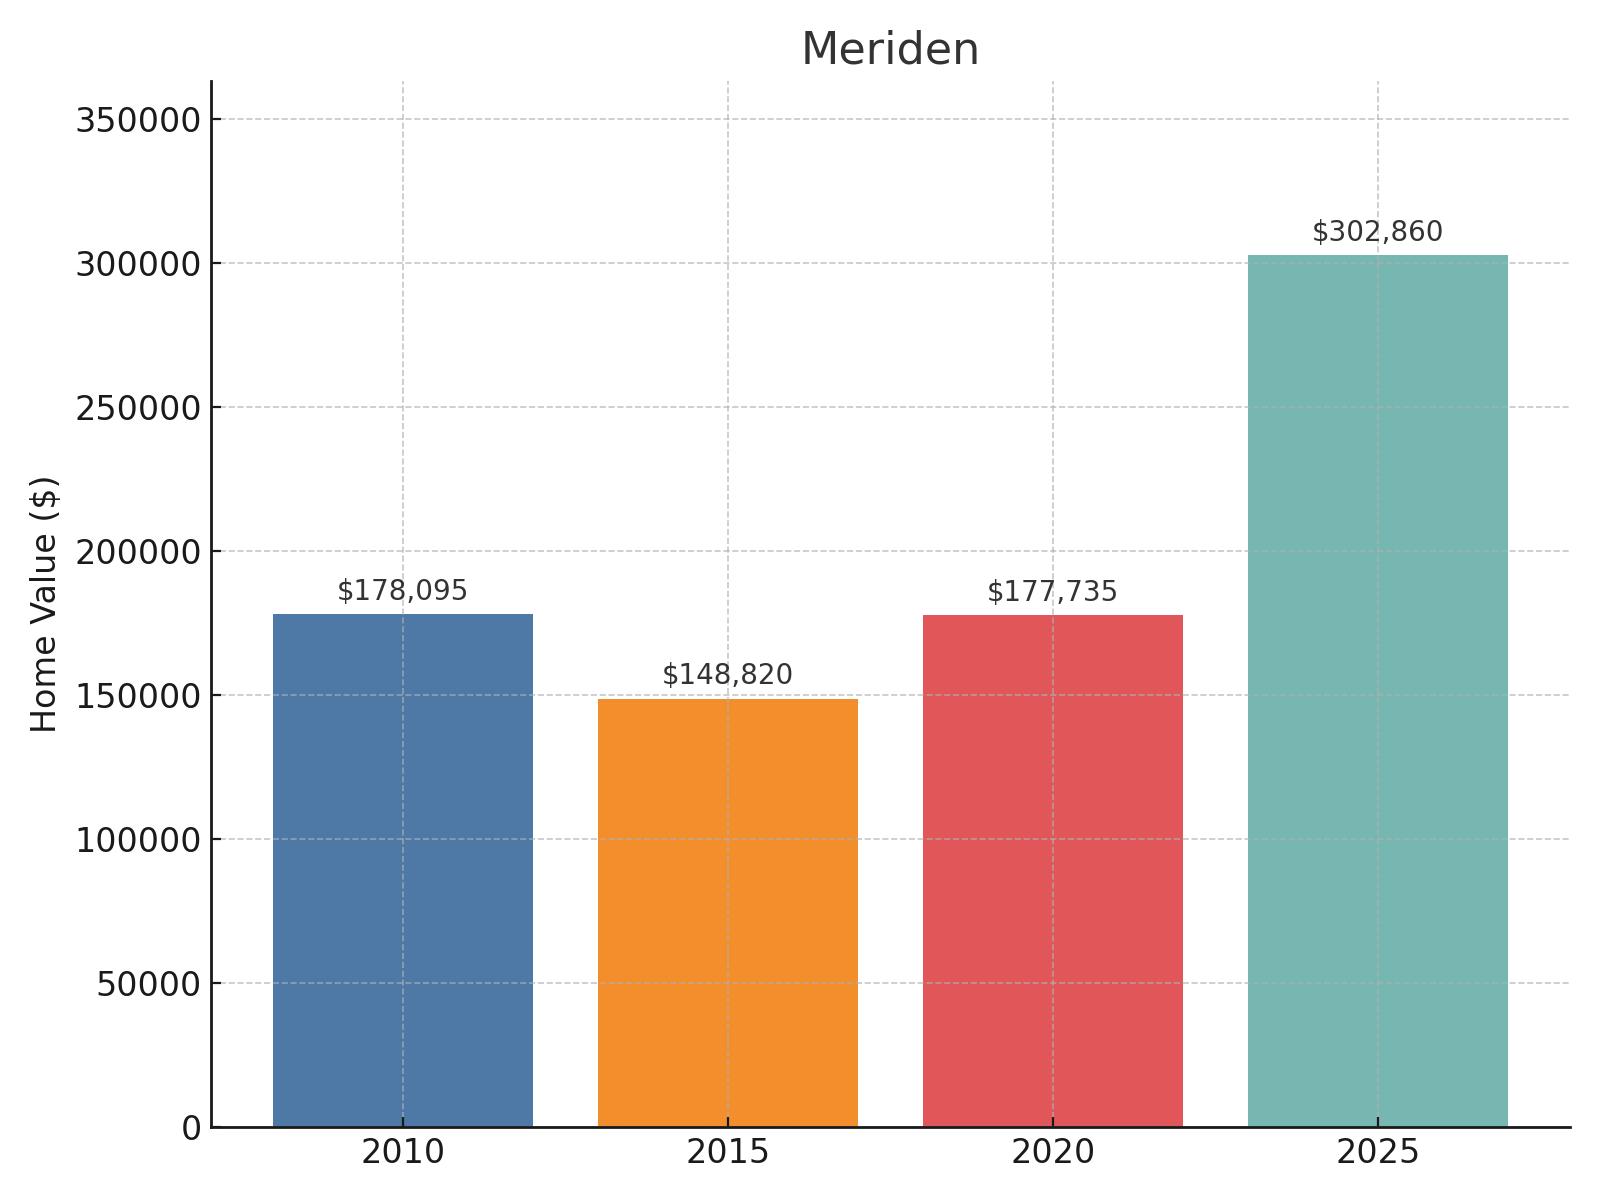
- 2025 Home Value: $302,860
- 2020 Home Value: $177,735
- 2015 Home Value: $148,820
- 2010 Home Value: $178,095
- Change 2020-2025: 70.40%
- Change 2015-2025: 103.51%
- Change 2010-2025: 70.05%
Nestled in central Connecticut between Hartford and New Haven, Meriden illustrates the challenging and uneven recovery many mid-sized cities have experienced. You’ll note that home values actually declined from $178,095 in 2010 to $148,820 in 2015, a 16.4% drop that reflects the lingering impact of the recession. By 2020, values had essentially recovered to $177,735, almost matching 2010 levels. The past five years have witnessed tremendous growth of 70.40%, bringing home values to $302,860 in 2025. This represents a significant 70.05% increase over the full 15-year period, with values more than doubling from their 2015 low point.
11. East Windsor

- 2025 Home Value: $301,242
- 2020 Home Value: $179,774
- 2015 Home Value: $162,576
- 2010 Home Value: Data unavailable
- Change 2020-2025: 67.57%
- Change 2015-2025: 85.29%
- Change 2010-2025: Data unavailable
Situated in north-central Connecticut along the eastern bank of the Connecticut River, East Windsor has experienced accelerating growth in its housing market over the past decade. Though data for 2010 is unavailable, you’ll find that home values grew modestly from $162,576 in 2015 to $179,774 by 2020, representing about a 10.5% increase during that period. However, the market then surged by 67.57% over the next five years, with values reaching $301,242 by 2025. This significant acceleration resulted in an 85.29% increase over the full decade from 2015 to 2025, highlighting the town’s growing appeal as a combination of rural charm with convenient access to employment centers.
10. Windsor Locks
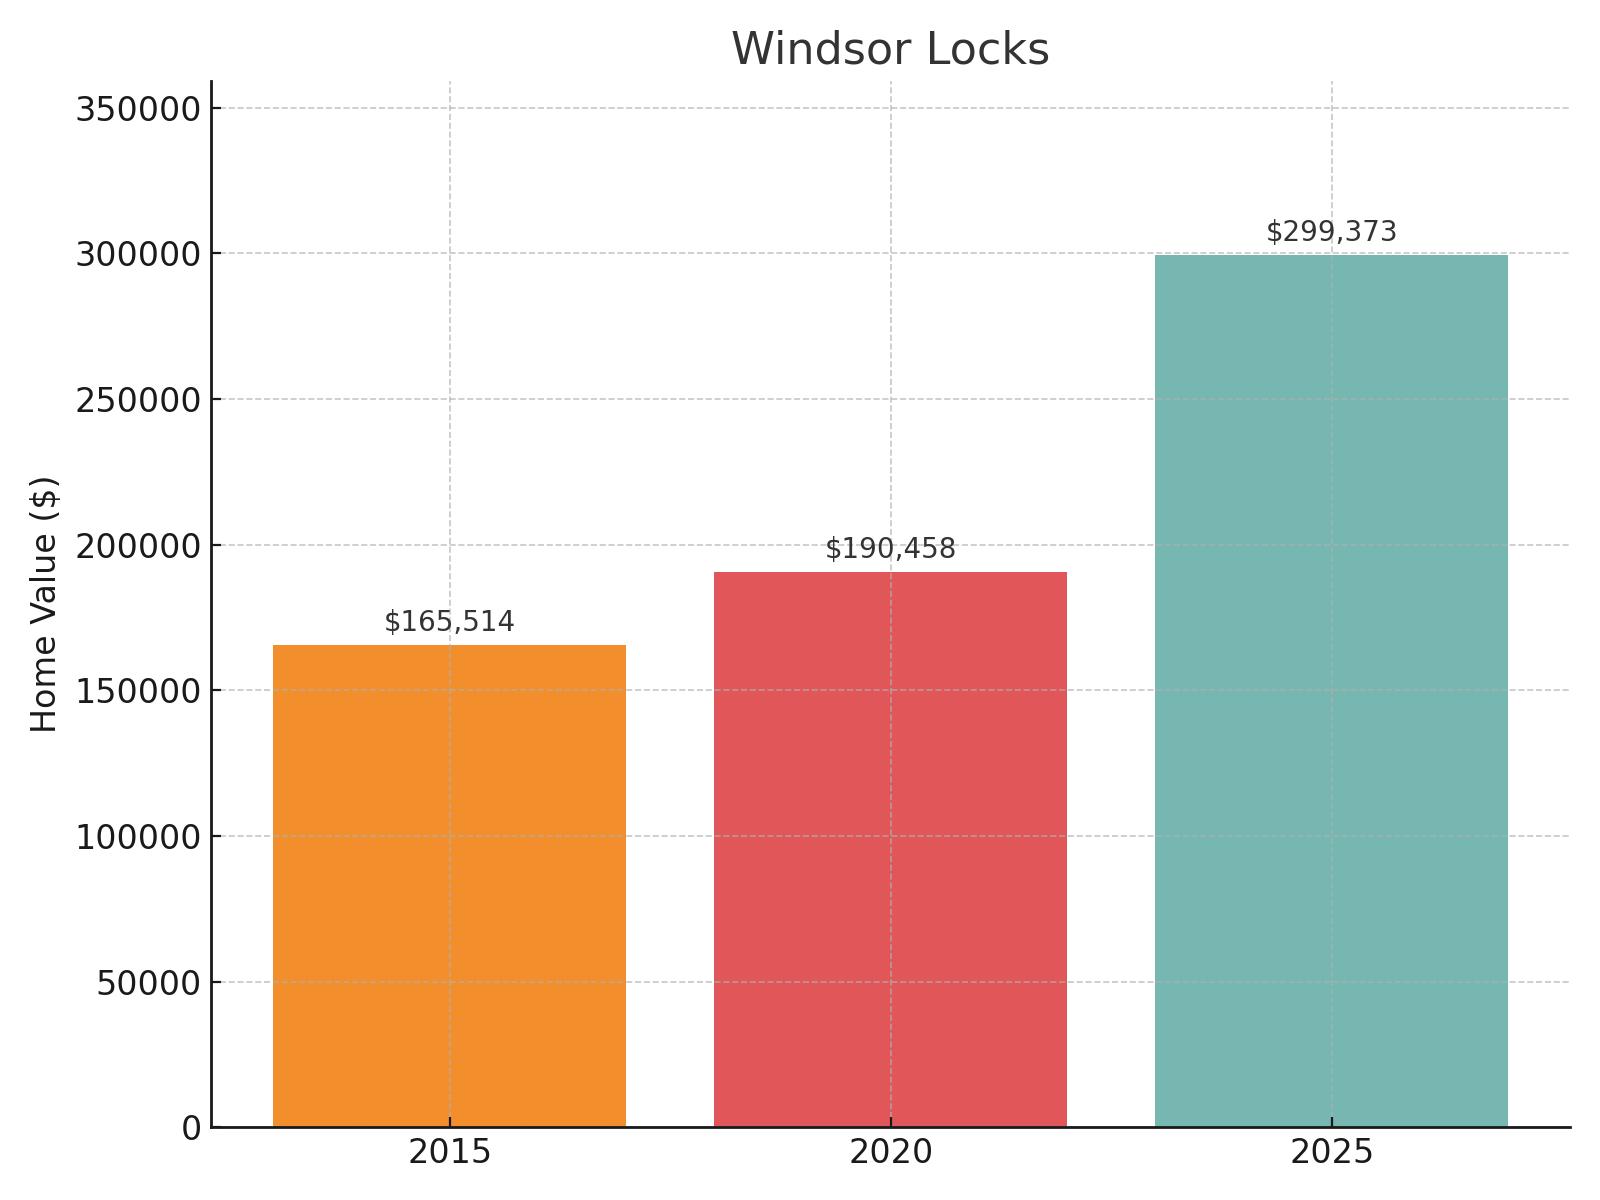
- 2025 Home Value: $299,373
- 2020 Home Value: $190,458
- 2015 Home Value: $165,514
- 2010 Home Value: Data unavailable
- Change 2020-2025: 57.19%
- Change 2015-2025: 80.87%
- Change 2010-2025: Data unavailable
Located in north-central Connecticut and home to Bradley International Airport, Windsor Locks has witnessed steady growth in its housing market over the past decade. While 2010 data is unavailable, you’ll note that home values increased from $165,514 in 2015 to $190,458 by 2020, a modest 15% growth during that five-year period. However, the market then accelerated significantly, with values rising 57.19% to reach $299,373 by 2025. This represents an 80.87% increase over the ten-year period from 2015 to 2025.
9. East Hartford
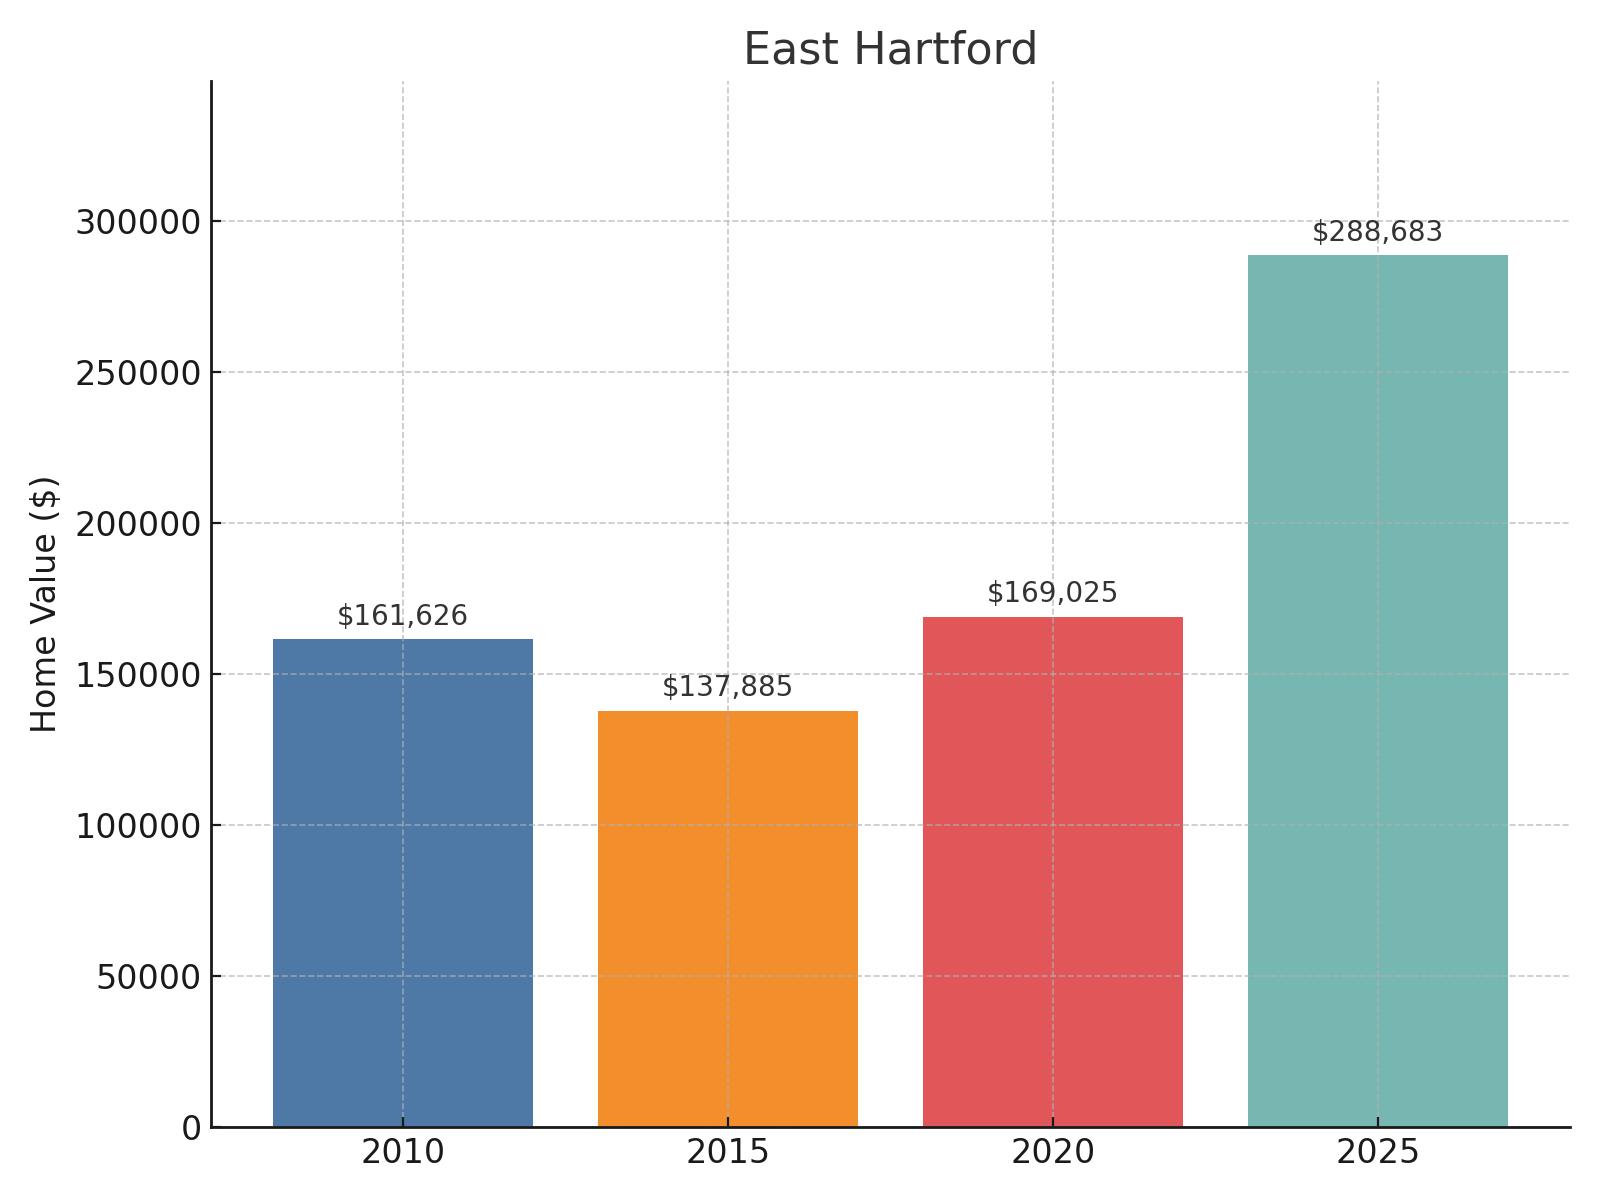
- 2025 Home Value: $288,683
- 2020 Home Value: $169,025
- 2015 Home Value: $137,885
- 2010 Home Value: $161,626
- Change 2020-2025: 70.79%
- Change 2015-2025: 109.36%
- Change 2010-2025: 78.61%
Positioned just across the Connecticut River from the state capital, East Hartford demonstrates the varied recovery patterns seen throughout the state. You’ll observe that home values initially dropped from $161,626 in 2010 to $137,885 in 2015, reflecting the extended impact of the recession in this working-class community. Values then began climbing again, reaching $169,025 by 2020 (surpassing pre-recession levels) before accelerating dramatically with a 70.79% increase to reach $288,683 in 2025. This represents a 78.61% growth over the 15-year period, with property values more than doubling from their 2015 low point.
8. New Britain
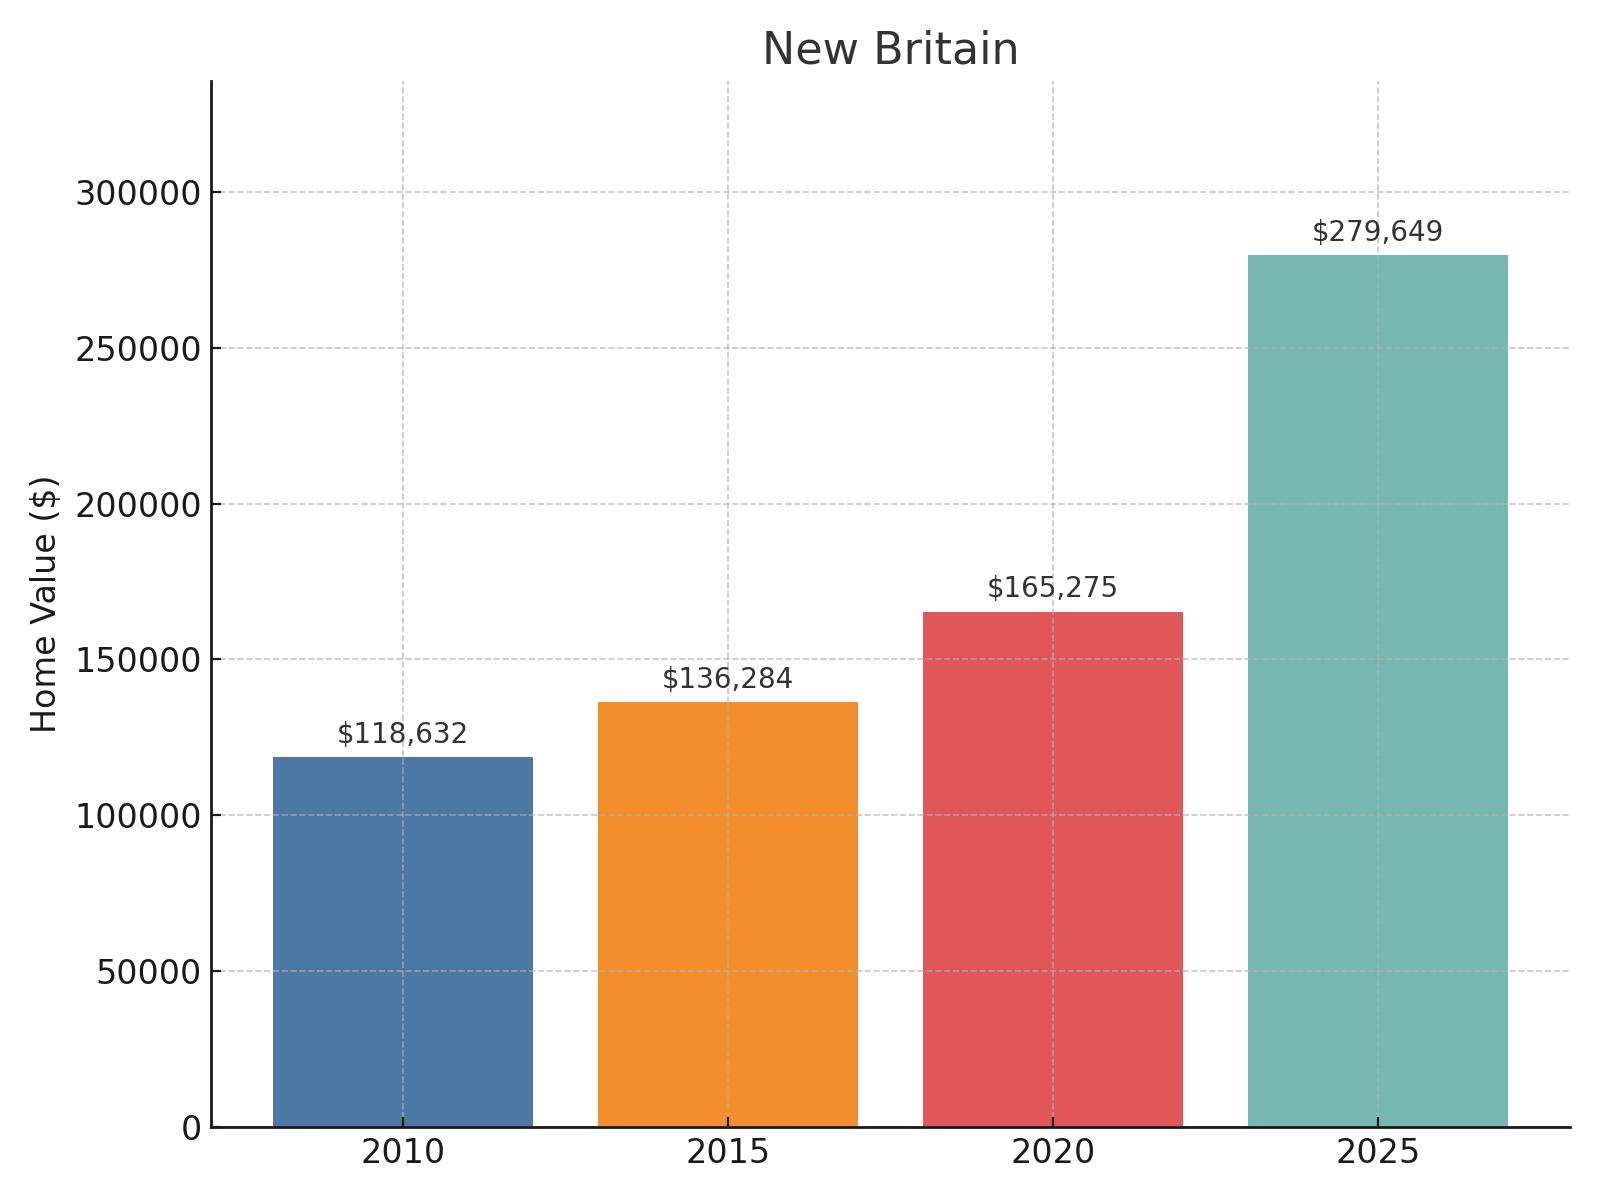
- 2025 Home Value: $279,649
- 2020 Home Value: $165,275
- 2015 Home Value: $136,284
- 2010 Home Value: $118,632
- Change 2020-2025: 69.20%
- Change 2015-2025: 105.20%
- Change 2010-2025: 135.73%
Centrally located in Hartford County, New Britain boasts the most impressive long-term growth story among Connecticut’s affordable towns. You’ll be amazed to learn that home values have steadily climbed from $118,632 in 2010 to $136,284 in 2015, then to $165,275 in 2020, before surging to $279,649 by 2025. This remarkable trajectory represents a 135.73% increase over the 15-year period, the highest growth rate among all towns on this list.
7. Norwich
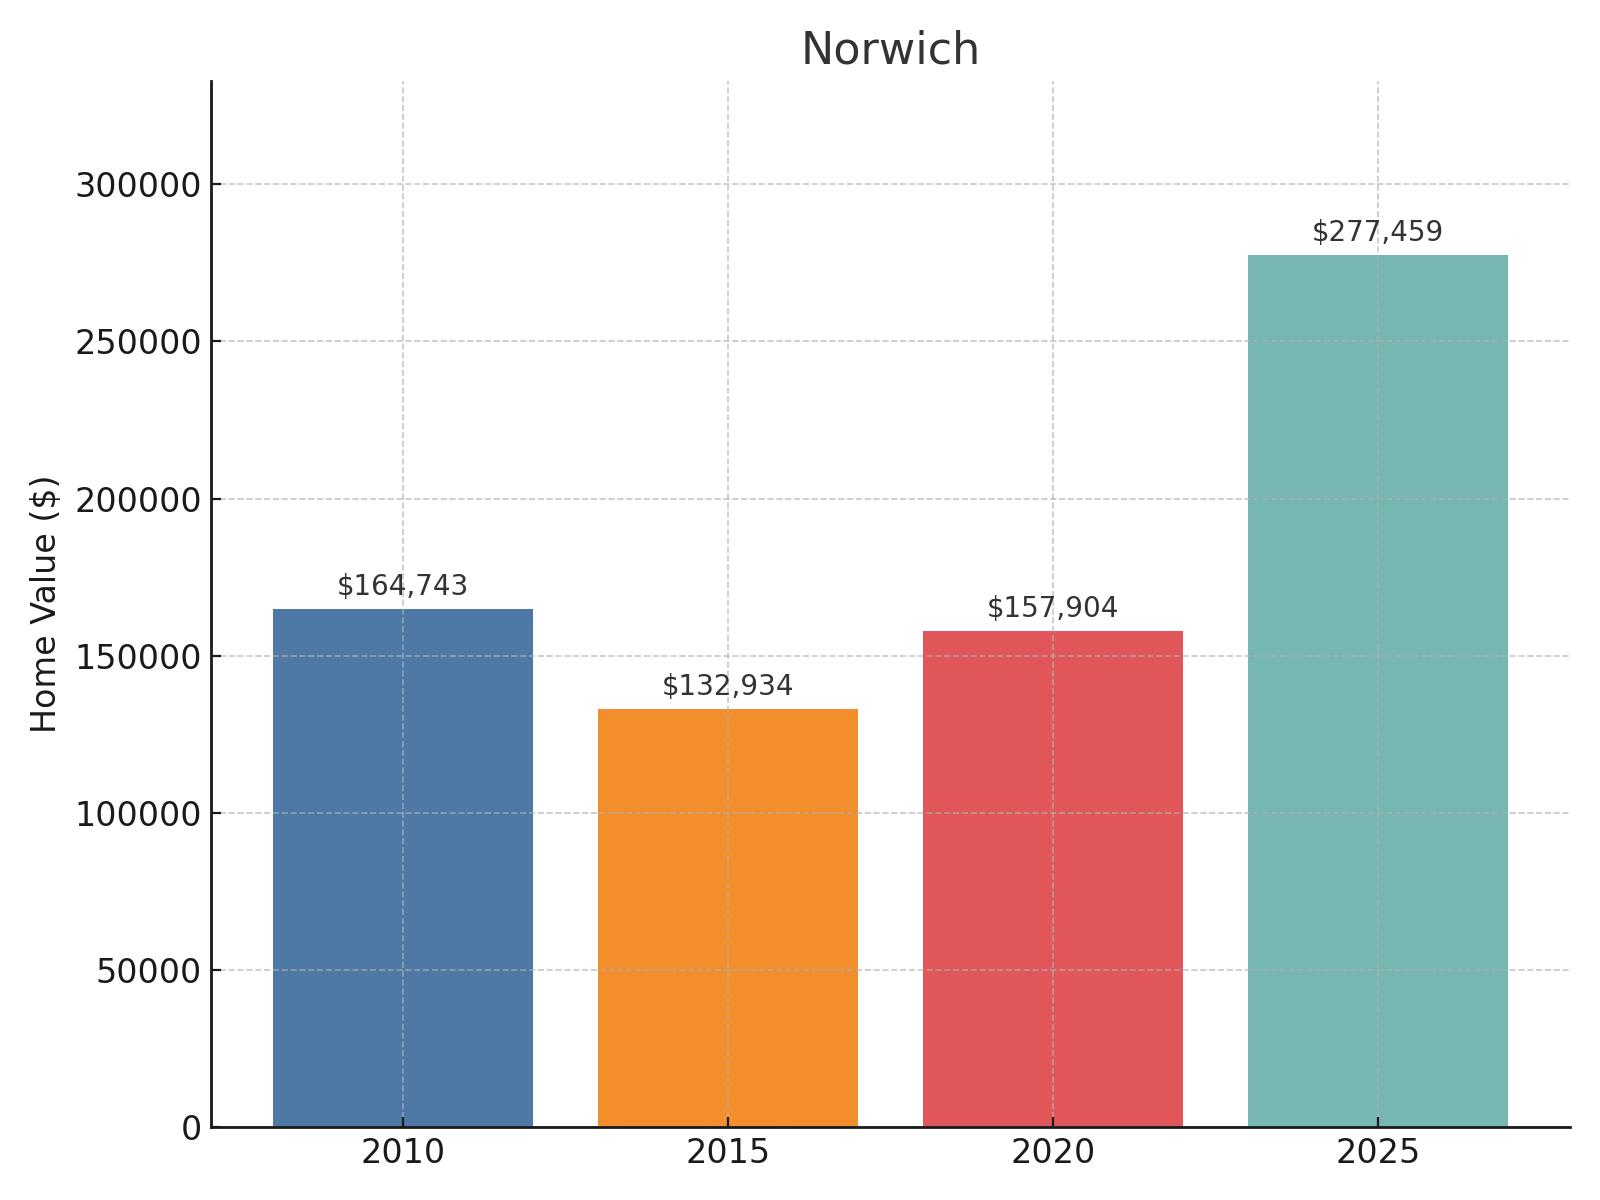
- 2025 Home Value: $277,459
- 2020 Home Value: $157,904
- 2015 Home Value: $132,934
- 2010 Home Value: $164,743
- Change 2020-2025: 75.71%
- Change 2015-2025: 108.72%
- Change 2010-2025: 68.42%
Situated at the confluence of three rivers in eastern Connecticut, Norwich illustrates the bumpy road to recovery many New England towns have experienced. You’ll see that home values fell substantially from $164,743 in 2010 to $132,934 in 2015, a decline of nearly 20% that shows how deeply the recession affected this historic city. The market began a slow recovery by 2020, reaching $157,904, still below the 2010 peak. However, the last five years have seen remarkable growth of 75.71%, bringing values to $277,459 in 2025. This represents a 68.42% increase over the 15-year period, with property values more than doubling from their 2015 low point.
6. Torrington
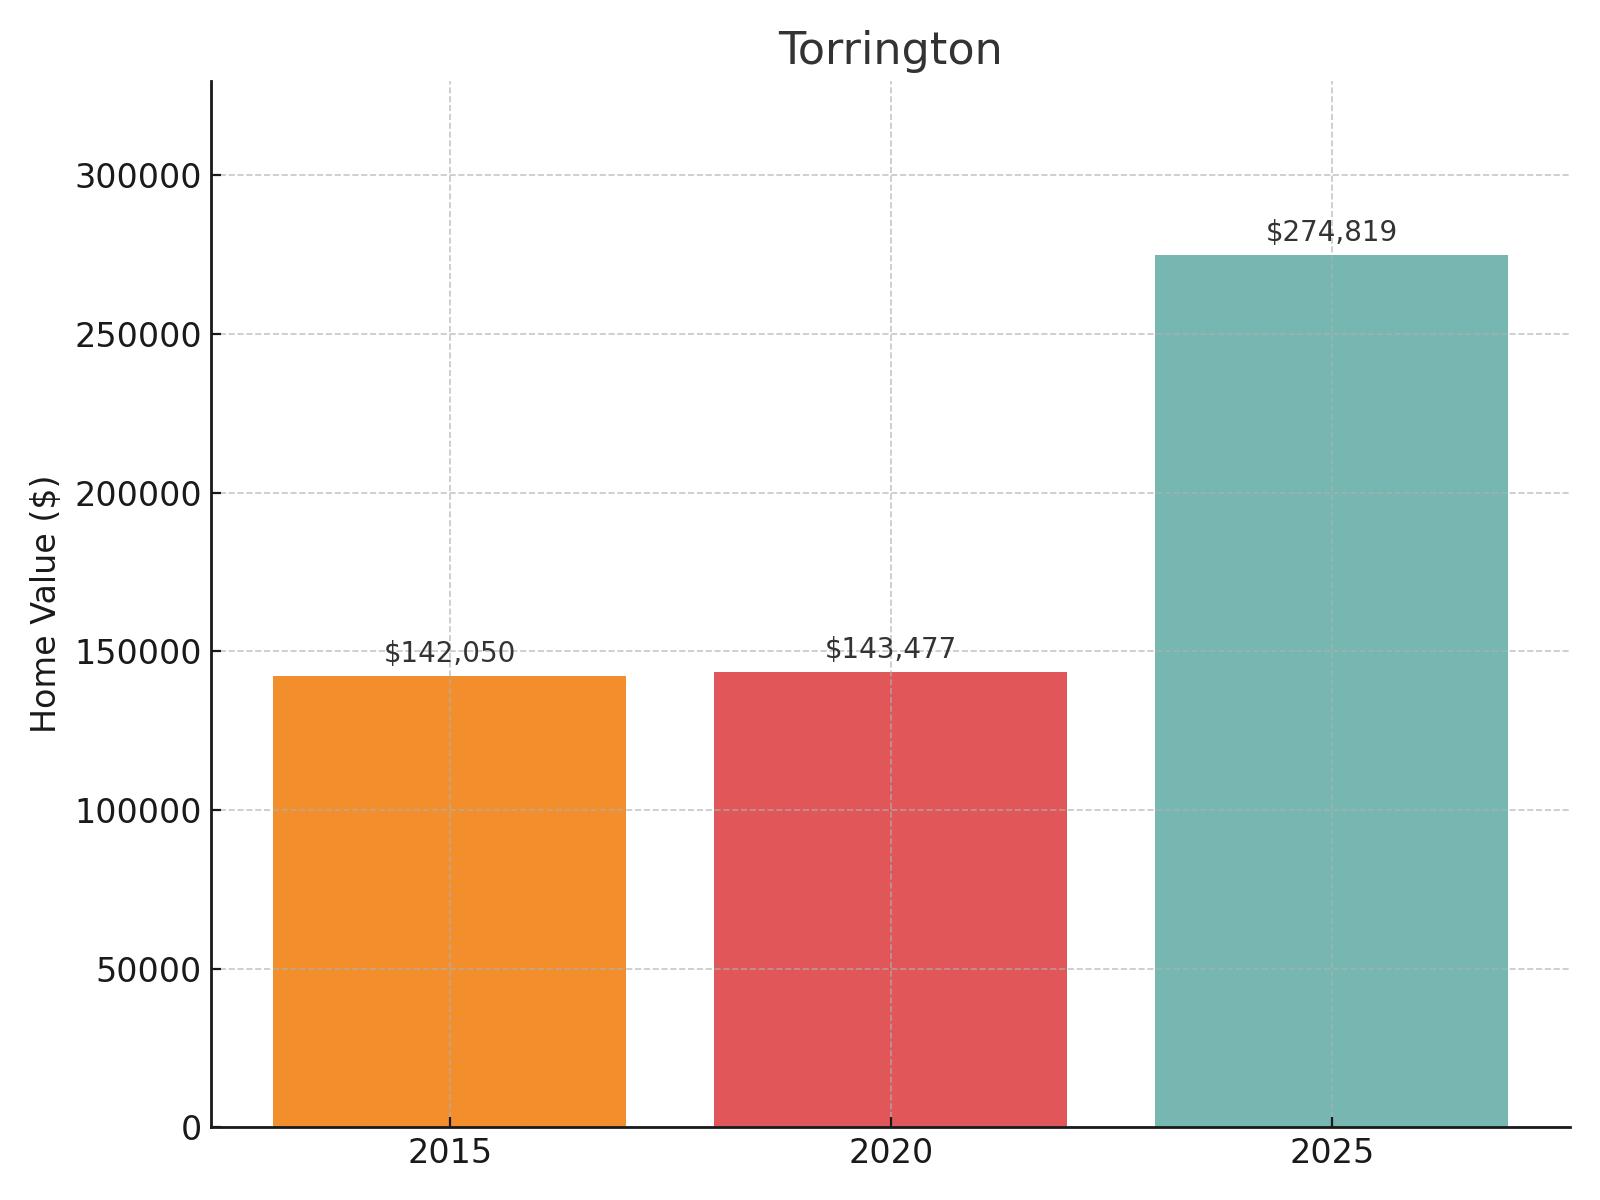
- 2025 Home Value: $274,819
- 2020 Home Value: $143,477
- 2015 Home Value: $142,050
- 2010 Home Value: Data unavailable
- Change 2020-2025: 91.54%
- Change 2015-2025: 93.47%
- Change 2010-2025: Data unavailable
Settled in the Litchfield Hills of northwestern Connecticut, Torrington has shown remarkable stability followed by explosive growth in its housing market. While data for 2010 is unavailable, you’ll notice that home values remained nearly static from 2015 to 2020, with only a minimal increase from $142,050 to $143,477. However, the market then experienced a dramatic surge of 91.54% over the next five years, with values climbing to $274,819 by 2025.
5. South Windham
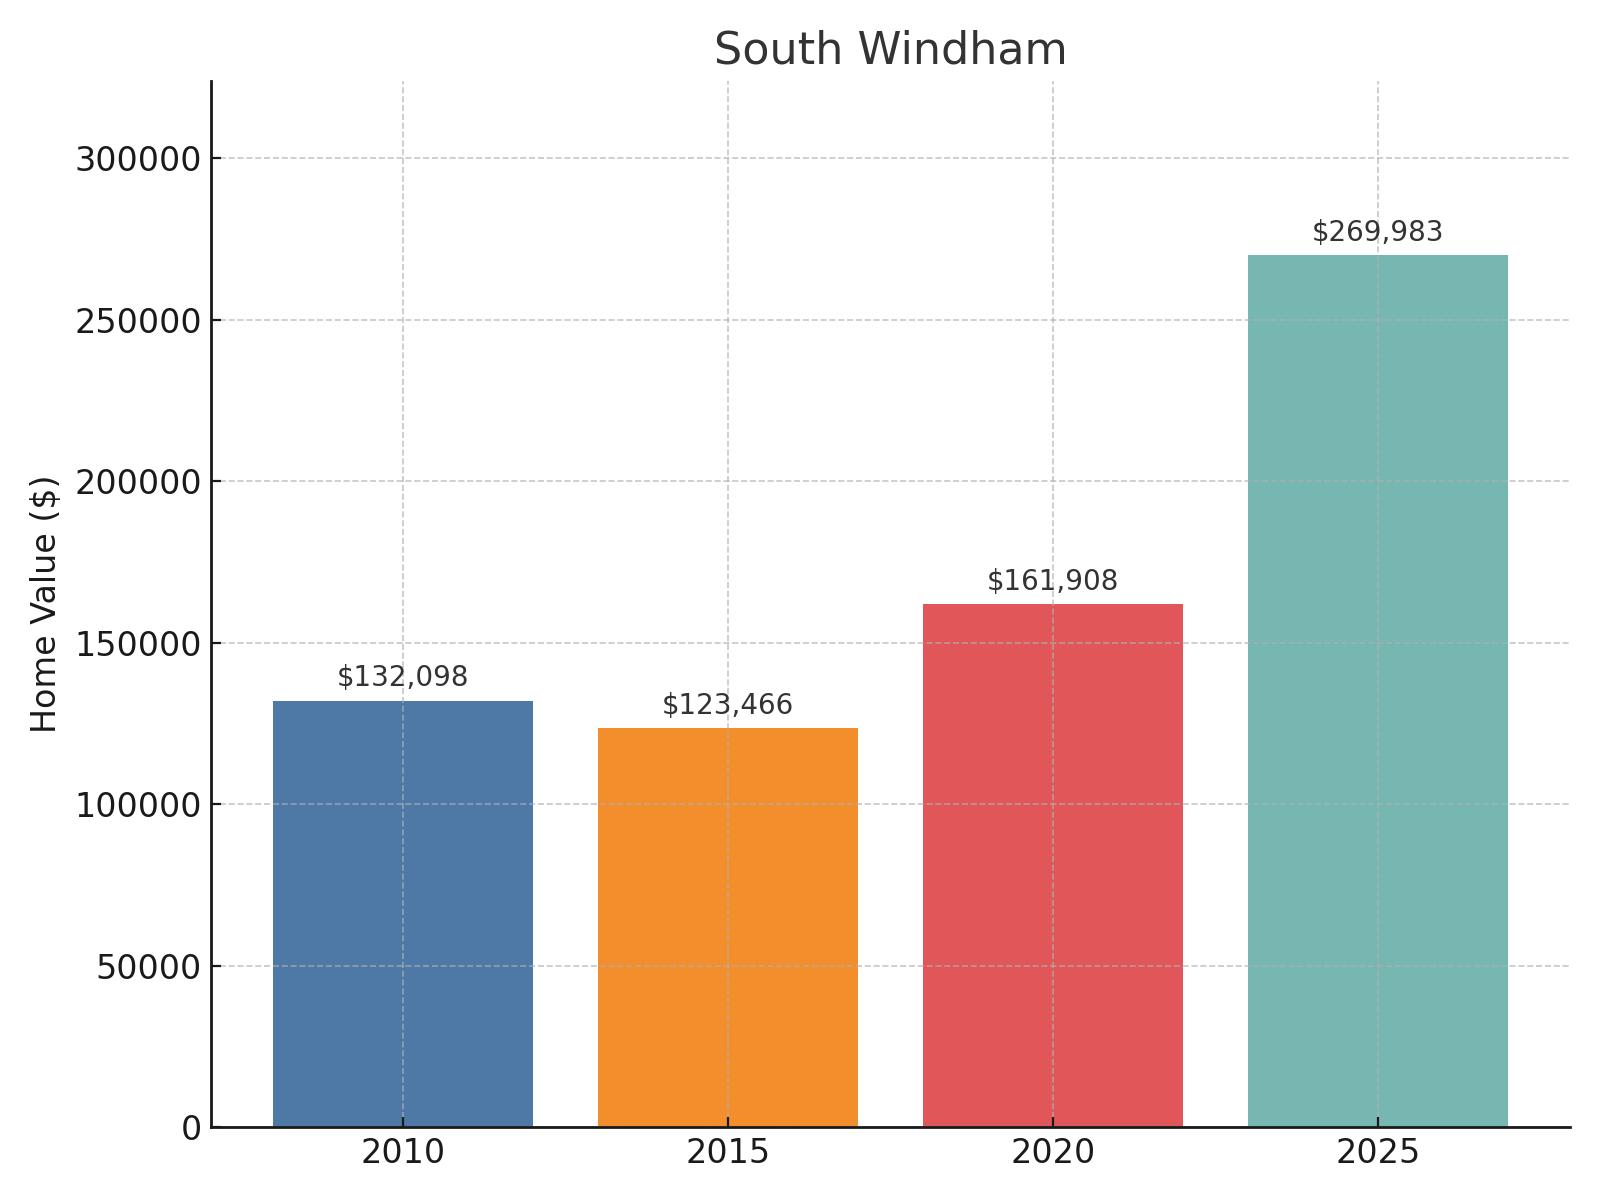
- 2025 Home Value: $269,983
- 2020 Home Value: $161,908
- 2015 Home Value: $123,466
- 2010 Home Value: $132,098
- Change 2020-2025: 66.75%
- Change 2015-2025: 118.67%
- Change 2010-2025: 104.38%
Positioned in the eastern part of Connecticut, South Windham exemplifies the dramatic turnaround seen in many small Connecticut communities. You’ll find that home values actually dropped from $132,098 in 2010 to $123,466 in 2015, reflecting the extended impact of the housing crisis in rural areas. However, the market has since recovered impressively, with values rising to $161,908 by 2020 and then surging by 66.75% to reach $269,983 in 2025. This represents more than a doubling of home values over the 15-year period, with an exceptional 104.38% growth rate that highlights the increasing appeal of this quiet community.
4. Winsted
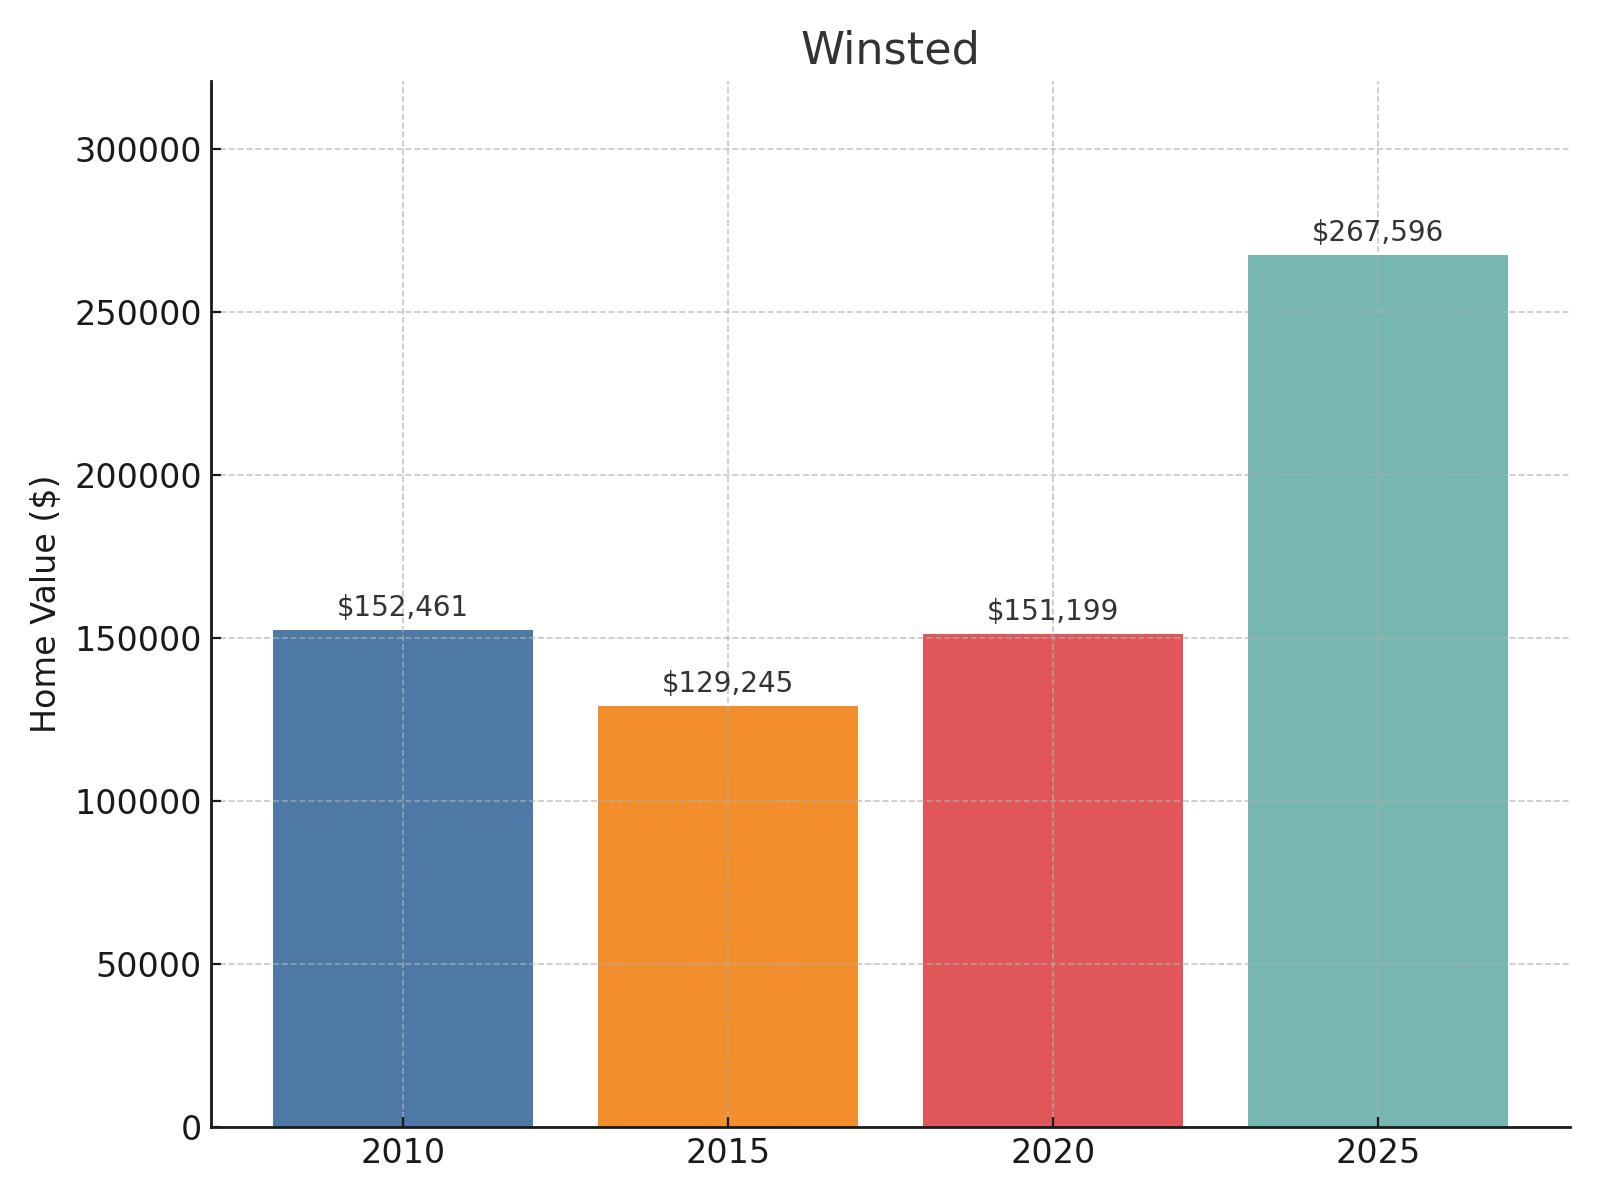
- 2025 Home Value: $267,596
- 2020 Home Value: $151,199
- 2015 Home Value: $129,245
- 2010 Home Value: $152,461
- Change 2020-2025: 76.98%
- Change 2015-2025: 107.05%
- Change 2010-2025: 75.52%
Tucked into the scenic hills of northwestern Connecticut, Winsted demonstrates the cyclical nature of small-town real estate markets. You’ll observe that home values actually declined from $152,461 in 2010 to $129,245 in 2015, reflecting the lingering impacts of the recession in more rural communities. Since then, values have steadily increased to $151,199 by 2020, nearly recovering to their 2010 levels, before surging an impressive 76.98% to reach $267,596 in 2025. This picturesque former mill town has shown remarkable resilience, with property values more than doubling (107.05%) from their 2015 low point to 2025.
3. Waterbury
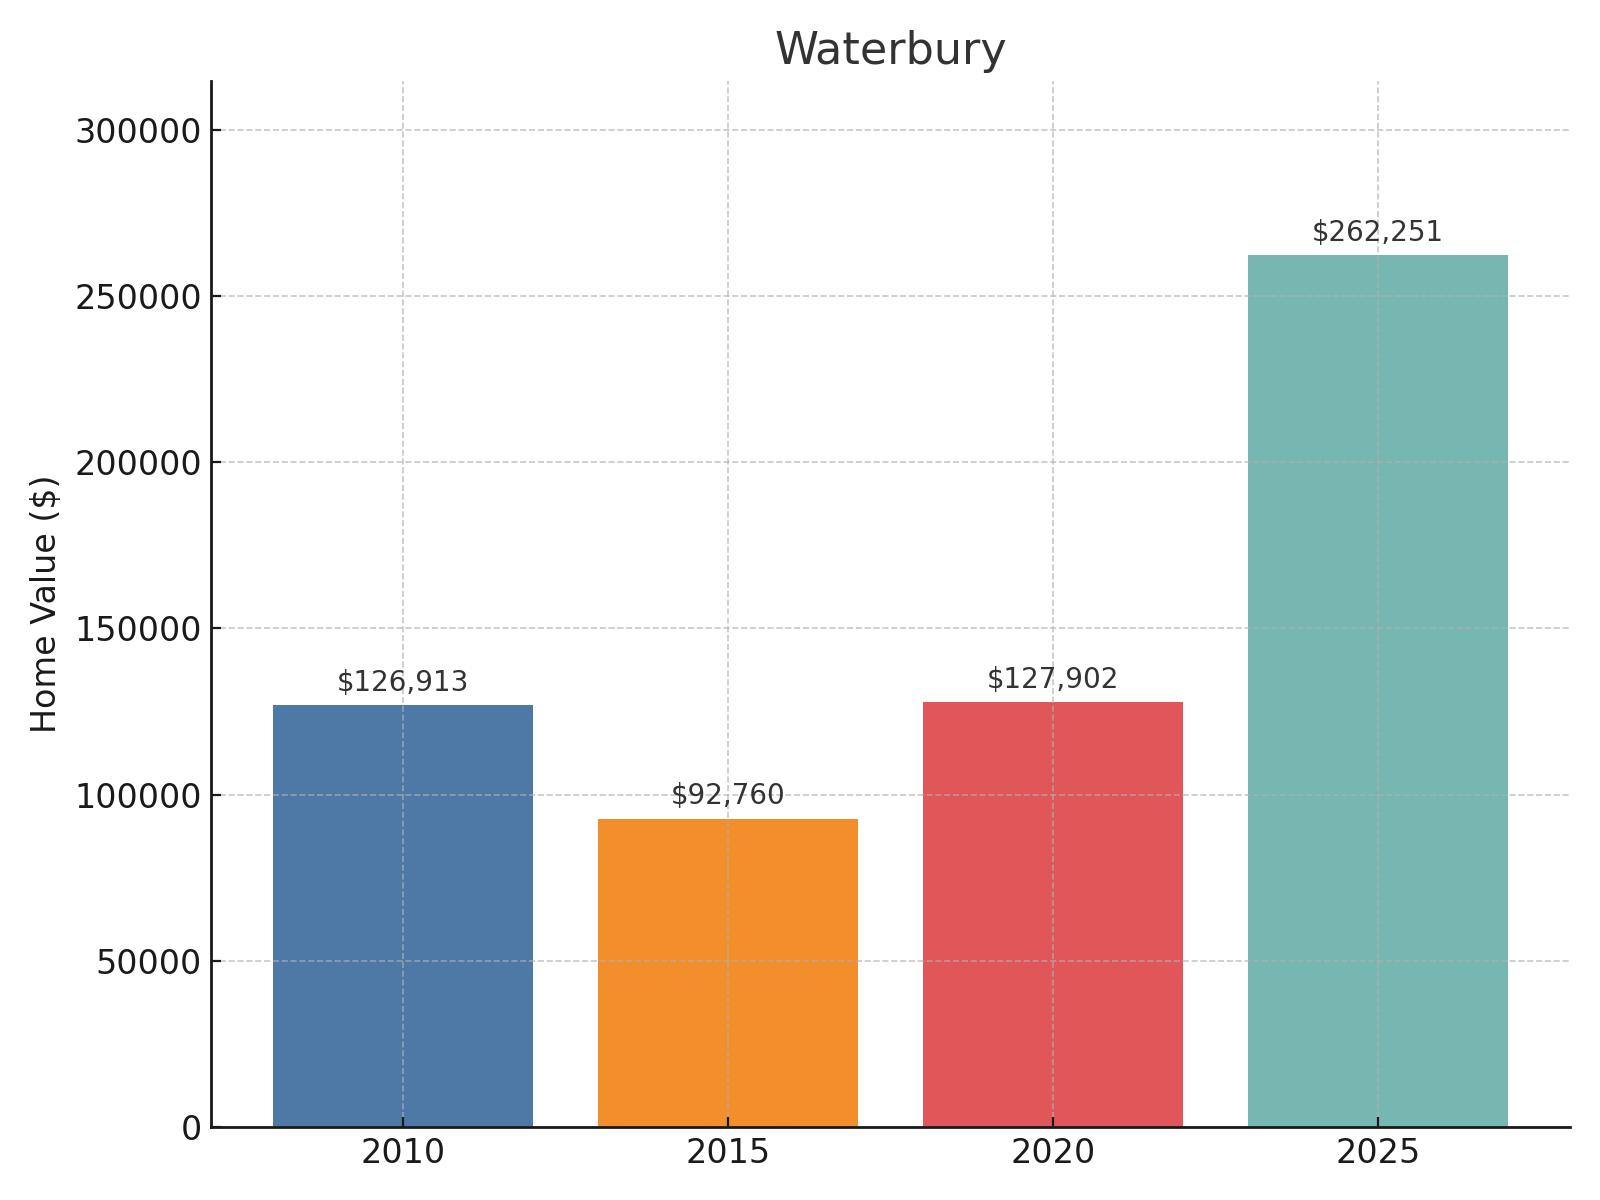
- 2025 Home Value: $262,251
- 2020 Home Value: $127,902
- 2015 Home Value: $92,760
- 2010 Home Value: $126,913
- Change 2020-2025: 105.04%
- Change 2015-2025: 182.72%
- Change 2010-2025: 106.64%
Situated in western Connecticut along the Naugatuck River, Waterbury shows one of the most dramatic growth stories in the entire state. You’ll be intrigued to see that home values actually declined substantially from $126,913 in 2010 to just $92,760 in 2015, representing one of the toughest post-recession recoveries in the region. However, the city has since experienced a remarkable turnaround with values climbing to $127,902 by 2020 and then more than doubling to $262,251 in 2025. This extraordinary 105.04% five-year growth rate and 182.72% ten-year growth rate reflects significant revitalization efforts and changing perceptions of this historic brass manufacturing center.
2. Willimantic
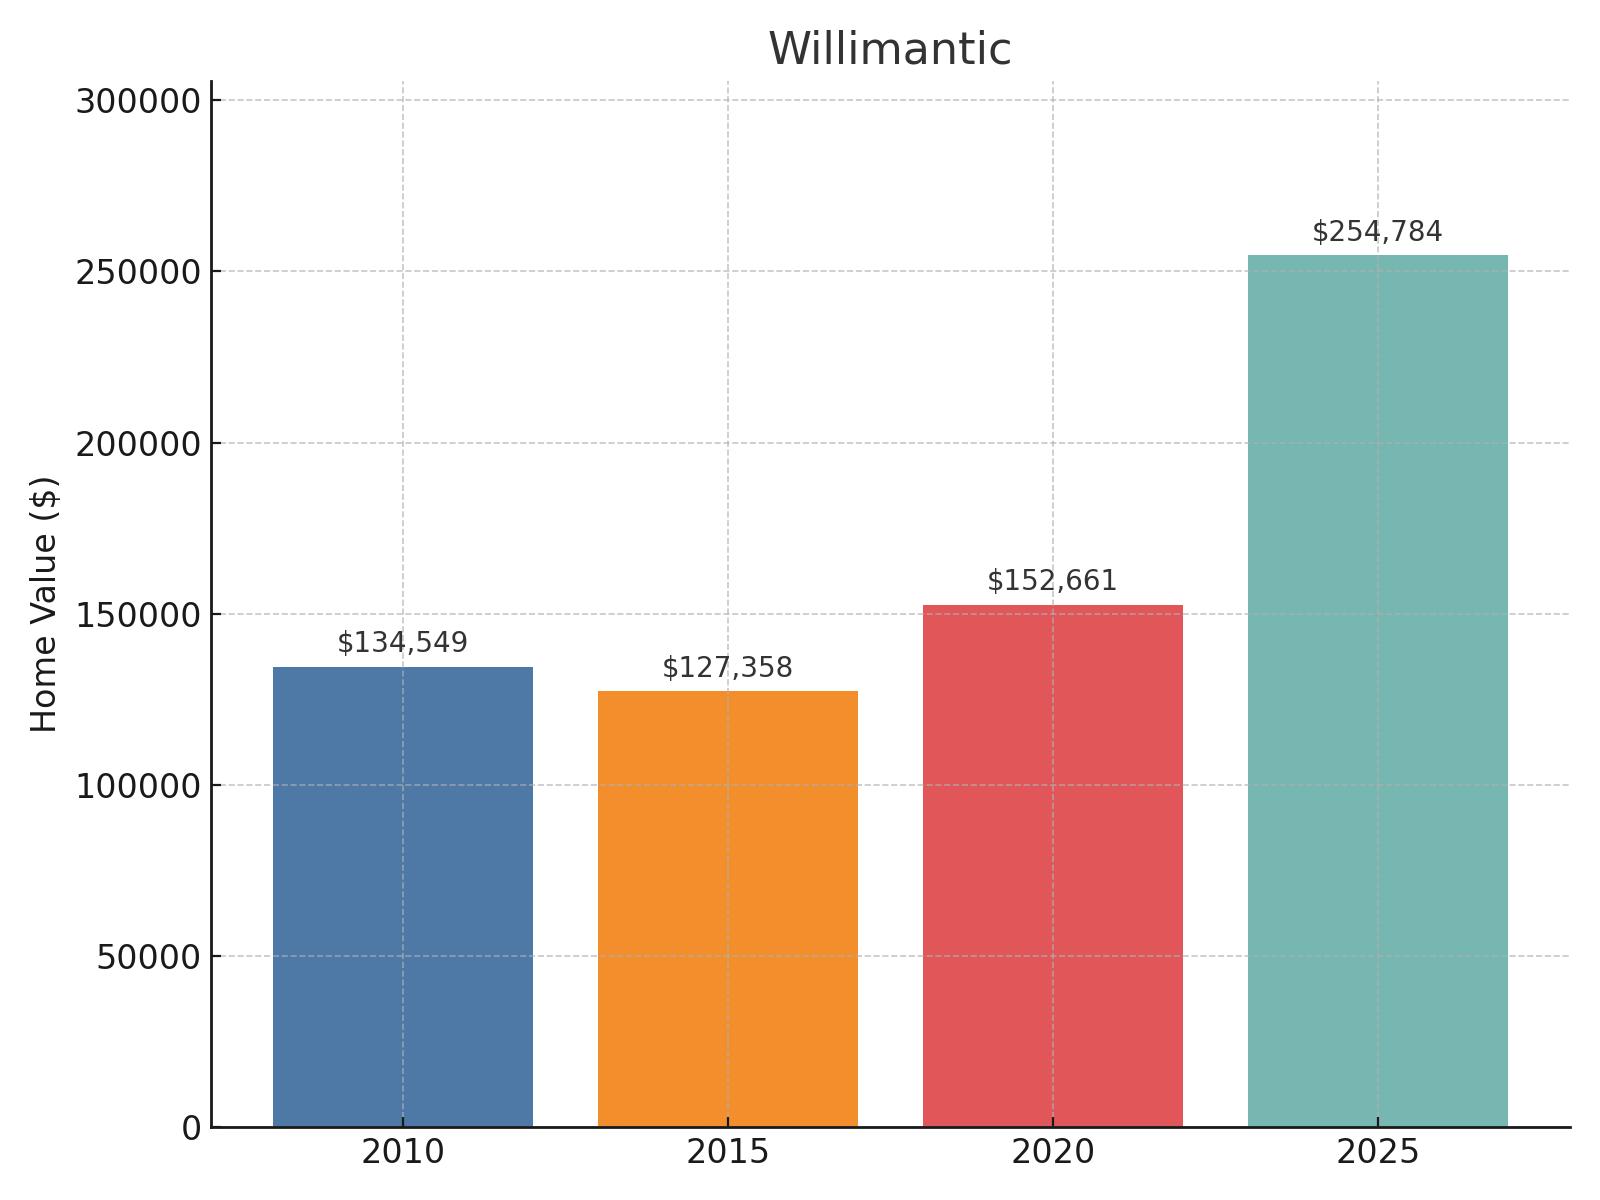
- 2025 Home Value: $254,784
- 2020 Home Value: $152,661
- 2015 Home Value: $127,358
- 2010 Home Value: $134,549
- Change 2020-2025: 66.90%
- Change 2015-2025: 100.05%
- Change 2010-2025: 89.36%
Nestled in eastern Connecticut, Willimantic has experienced remarkable growth in its real estate market over the past decade and a half. You’ll notice that home values actually decreased slightly from $134,549 in 2010 to $127,358 in 2015, but have since rebounded dramatically. The town saw a jump to $152,661 by 2020, followed by an explosive 66.90% growth to reach $254,784 in 2025. What’s particularly noteworthy is that property values have exactly doubled (100.05% increase) in the decade from 2015 to 2025, making this former mill town an increasingly attractive place for homebuyers seeking value.
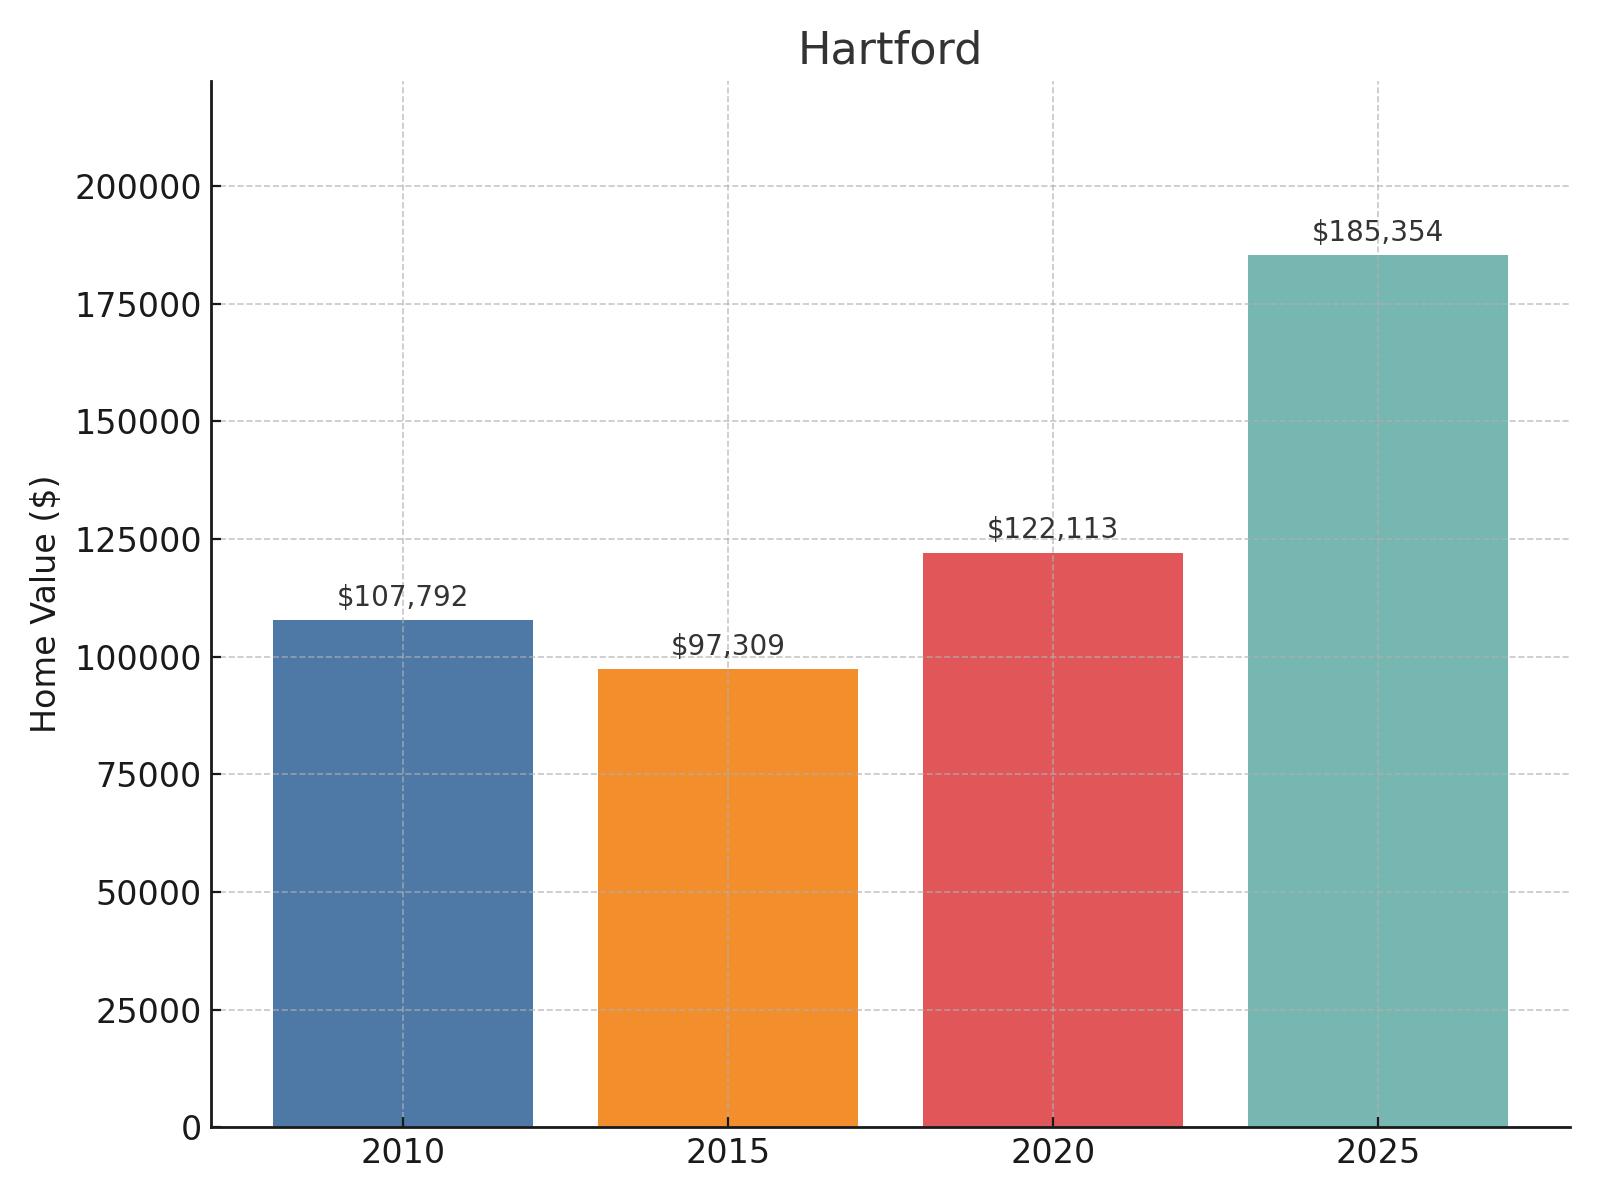
1. Hartford
🔥 Would you like to save this?
- 2025 Home Value: $185,354
- 2020 Home Value: $122,113
- 2015 Home Value: $97,309
- 2010 Home Value: $107,792
- Change 2020-2025: 51.79%
- Change 2015-2025: 90.48%
- Change 2010-2025: 71.96%
Located in the center of Connecticut as the state capital, Hartford rounds out our list as the most affordable town in the state. You’ll find that Hartford’s home values dipped from $107,792 in 2010 to $97,309 in 2015, likely reflecting lingering effects of the recession. However, the city has staged an impressive comeback with values rising to $122,113 in 2020 and continuing to $185,354 by 2025. This represents a dramatic 71.96% increase over the 15-year period, with particularly strong growth of 51.79% just in the last five years.


