🔥 Would you like to save this?
Forget the old stereotypes—Louisiana’s most expensive towns aren’t just luxury retreats for the rich. The Zillow Home Value Index shows how real property prices have surged across riverside towns, suburban communities, and once-overlooked corners of the state. Buyers aren’t just paying for charm anymore—they’re paying premium rates just to get a foot in the door. Whether you’re hunting for a home or just curious where budgets break fastest, these 35 towns reveal where Louisiana’s real estate market is demanding serious money in 2025.
35. Saint Gabriel – 53% Home Price Increase Since 2012
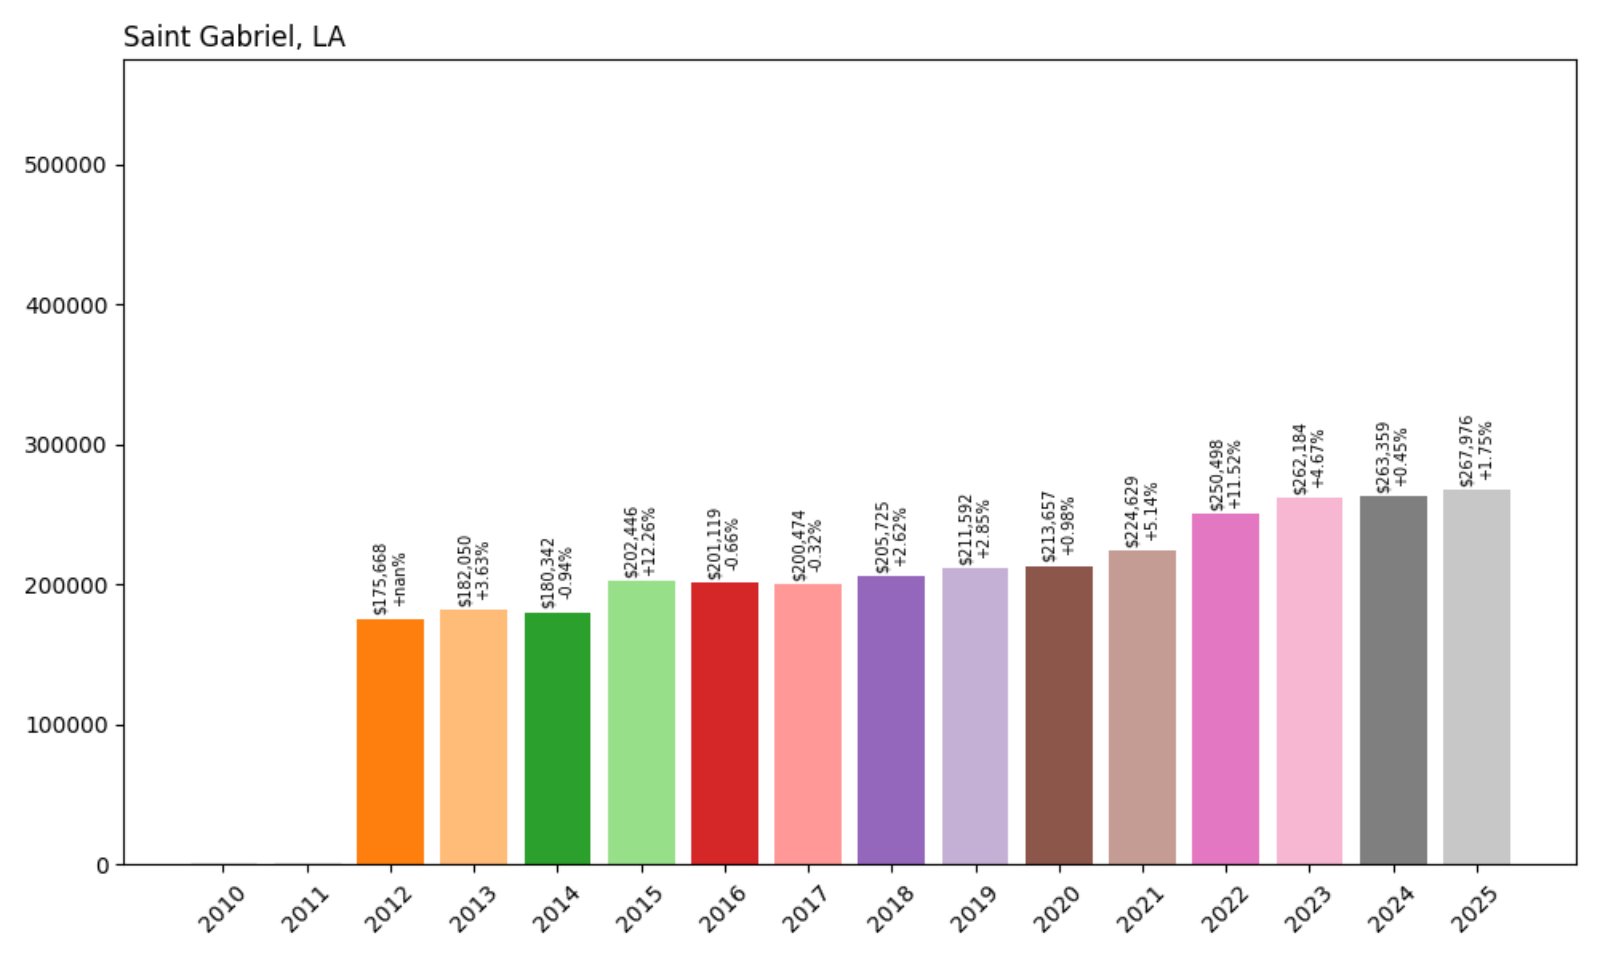
- 2012: $175,668
- 2013: $182,050 (+$6,382, +3.63% from previous year)
- 2014: $180,342 (−$1,708, −0.94% from previous year)
- 2015: $202,446 (+$22,104, +12.26% from previous year)
- 2016: $201,119 (−$1,327, −0.66% from previous year)
- 2017: $200,474 (−$645, −0.32% from previous year)
- 2018: $205,725 (+$5,251, +2.62% from previous year)
- 2019: $211,592 (+$5,867, +2.85% from previous year)
- 2020: $213,657 (+$2,066, +0.98% from previous year)
- 2021: $224,629 (+$10,972, +5.14% from previous year)
- 2022: $250,498 (+$25,868, +11.52% from previous year)
- 2023: $262,184 (+$11,687, +4.67% from previous year)
- 2024: $263,359 (+$1,174, +0.45% from previous year)
- 2025: $267,976 (+$4,617, +1.75% from previous year)
Saint Gabriel’s home values have climbed from $175,668 in 2012 to $267,976 in 2025 — a 53% increase over 13 years. While some years showed flat or declining prices, the town saw notable jumps in 2015 and again between 2021 and 2023. Overall, it’s been a steady if modestly paced rise into the top 35.
In order to come up with the very specific design ideas, we create most designs with the assistance of state-of-the-art AI interior design software.
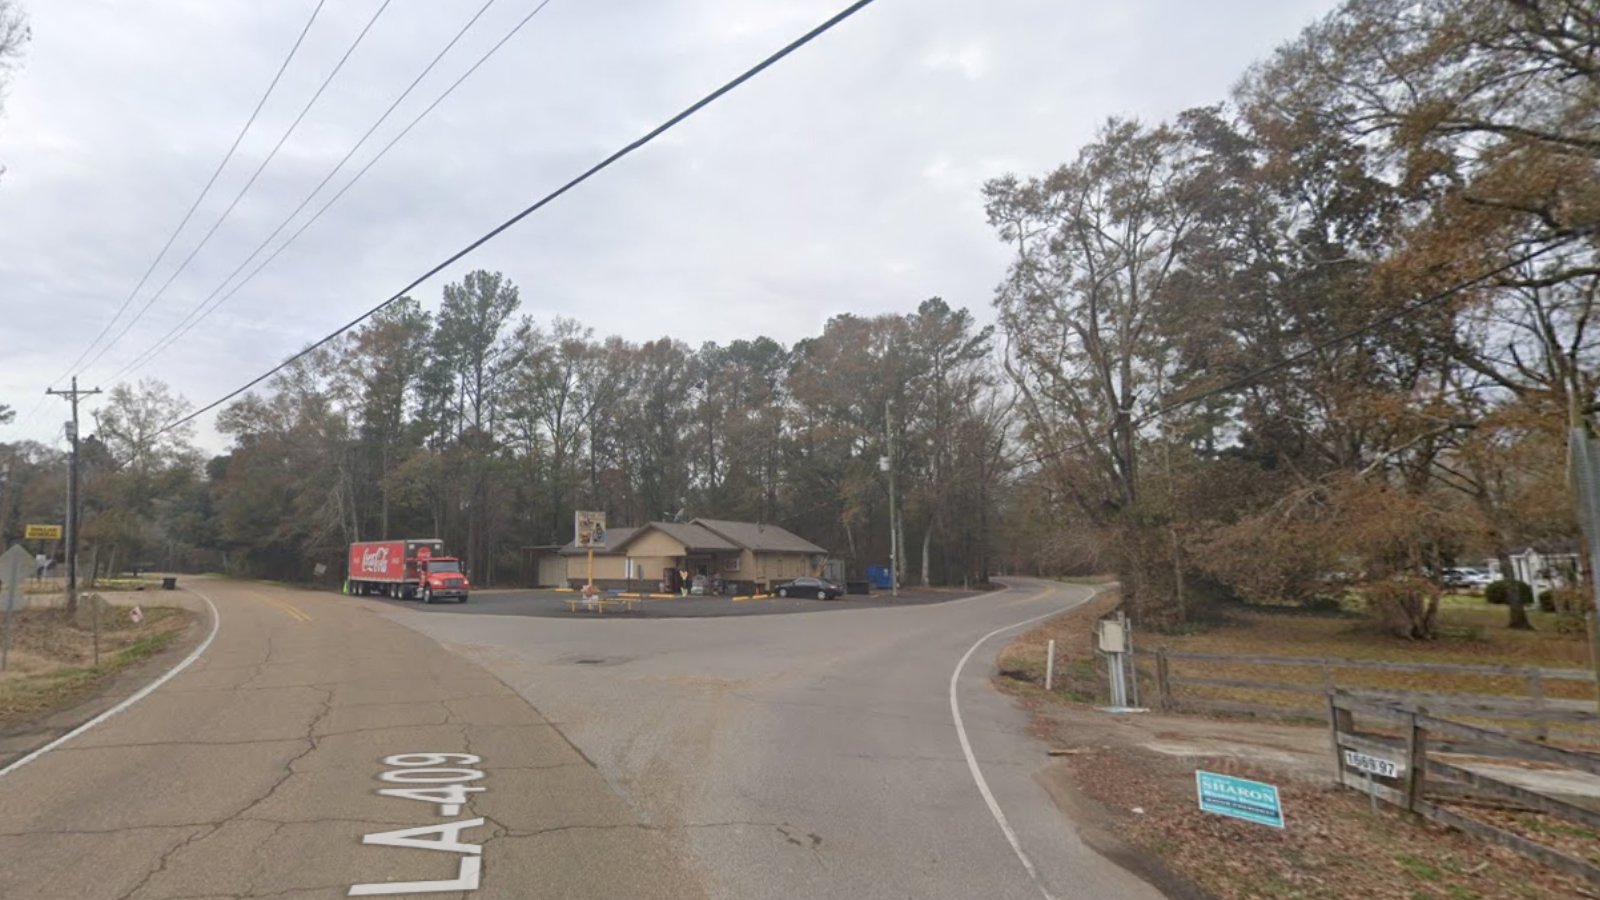
Saint Gabriel – Growth Driven by Stability and Space
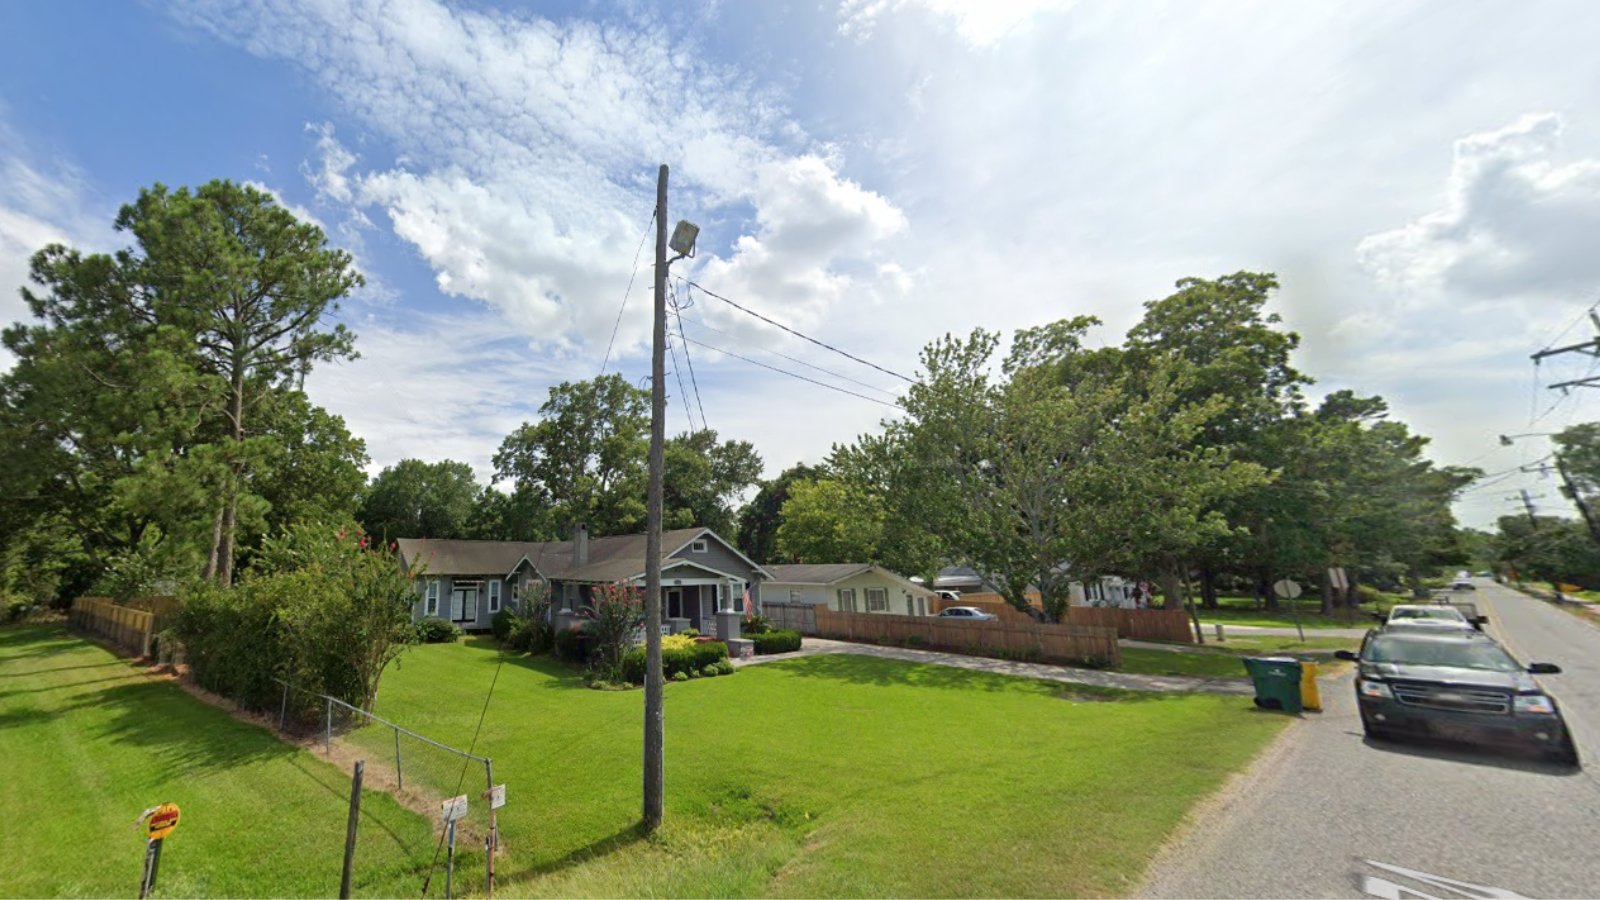
Located in Iberville Parish along the Mississippi River, Saint Gabriel offers a quieter alternative to Baton Rouge, just 15 miles north. Its affordability relative to nearby urban centers has made it attractive to buyers seeking more land and lower density. While price growth slowed in 2016–2017, values surged again in the early 2020s, particularly after 2021, when demand for homes in suburban and rural settings increased.
The area features a mix of newer subdivisions and rural properties, and proximity to the booming Baton Rouge metro area has kept prices rising. Saint Gabriel’s relatively low baseline in 2012 helped contribute to its large percentage gains over the years, even if absolute prices remain on the lower end of this list.
34. Pride – 38% Home Price Increase Since 2010

- 2010: $194,739
- 2011: $174,944 (−$19,795, −10.16% from previous year)
- 2012: $176,602 (+$1,658, +0.95% from previous year)
- 2013: $178,323 (+$1,721, +0.97% from previous year)
- 2014: $170,060 (−$8,263, −4.63% from previous year)
- 2015: $190,710 (+$20,650, +12.14% from previous year)
- 2016: $189,132 (−$1,578, −0.83% from previous year)
- 2017: $189,060 (−$73, −0.04% from previous year)
- 2018: $203,021 (+$13,962, +7.38% from previous year)
- 2019: $217,701 (+$14,680, +7.23% from previous year)
- 2020: $226,936 (+$9,235, +4.24% from previous year)
- 2021: $236,839 (+$9,903, +4.36% from previous year)
- 2022: $260,520 (+$23,681, +10.00% from previous year)
- 2023: $265,648 (+$5,128, +1.97% from previous year)
- 2024: $263,104 (−$2,544, −0.96% from previous year)
- 2025: $269,792 (+$6,688, +2.54% from previous year)
Pride’s home values grew from $194,739 in 2010 to $269,792 in 2025, despite some bumps along the way. After dips in the early 2010s, the market rebounded strongly, particularly from 2018 through 2022, with a 28% gain in just five years. Price growth cooled a bit in 2023–2024 but remains on the upswing.
Pride – Rural Living With a Steady Climb in Values
Pride is an unincorporated community in East Baton Rouge Parish, known for its open land and quiet pace of life. Its appeal lies in large lot sizes, minimal commercial development, and proximity to nature — while still being within commuting range of Baton Rouge. Homes here tend to be single-family on large lots, drawing in buyers looking for privacy and space.
The town’s price growth from 2015 onward reflects increasing interest in exurban living, especially during the pandemic years. Limited inventory helped support value even when sales slowed elsewhere in the region. While it may not offer urban amenities, Pride provides a stable and appealing market for buyers prioritizing space and long-term value.
33. Zachary – 29% Home Price Increase Since 2010

- 2010: $209,553
- 2011: $194,270 (−$15,283, −7.29% from previous year)
- 2012: $192,707 (−$1,564, −0.80% from previous year)
- 2013: $191,944 (−$763, −0.40% from previous year)
- 2014: $191,053 (−$891, −0.46% from previous year)
- 2015: $200,745 (+$9,693, +5.07% from previous year)
- 2016: $202,993 (+$2,248, +1.12% from previous year)
- 2017: $201,114 (−$1,879, −0.93% from previous year)
- 2018: $210,696 (+$9,582, +4.76% from previous year)
- 2019: $218,900 (+$8,204, +3.89% from previous year)
- 2020: $221,720 (+$2,820, +1.29% from previous year)
- 2021: $233,322 (+$11,603, +5.23% from previous year)
- 2022: $263,063 (+$29,741, +12.75% from previous year)
- 2023: $269,974 (+$6,911, +2.63% from previous year)
- 2024: $269,305 (−$669, −0.25% from previous year)
- 2025: $270,282 (+$977, +0.36% from previous year)
Home values in Zachary rose from $209,553 in 2010 to $270,282 in 2025. After stagnating early in the decade, the market picked up momentum around 2015. A sharp increase between 2020 and 2022 helped push the town into the top third of Louisiana’s most expensive places.
Zachary – School District Drives Strong Demand
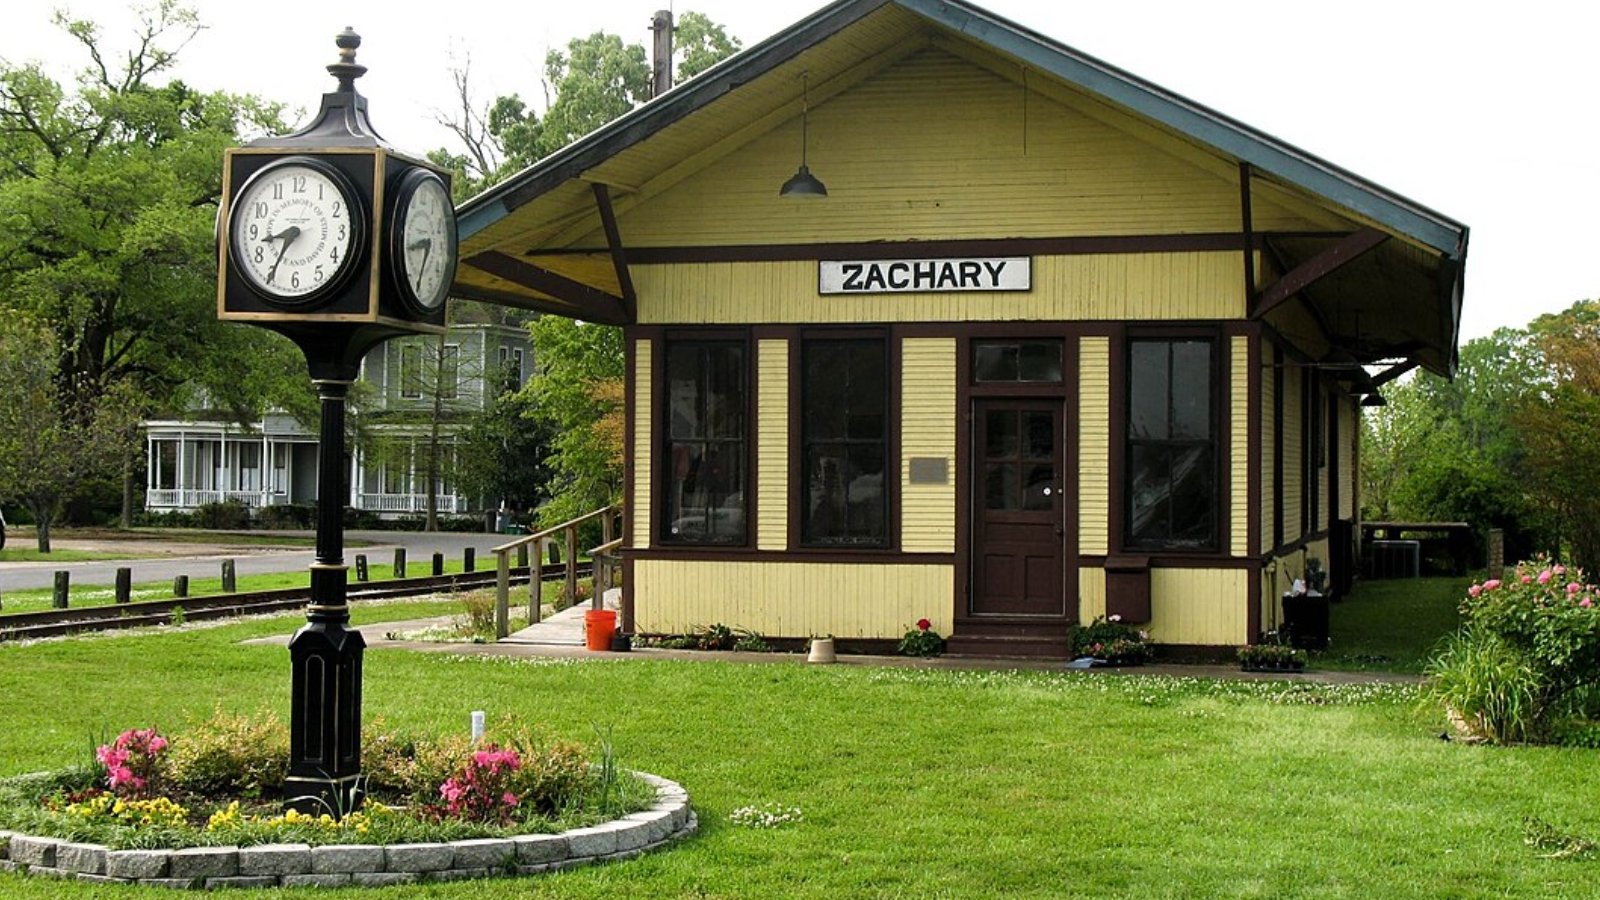
Zachary is widely known for its top-rated school district, a major factor in attracting families and keeping demand high. Located just north of Baton Rouge, it offers a balance of small-town charm and suburban convenience. This combination has made it a preferred choice for professionals and families alike.
Prices in Zachary remained fairly flat during the early 2010s but gained strength mid-decade. The sharp rise in 2021 and 2022 reflected broader pandemic-era trends, but unlike some towns, Zachary has retained its value gains thanks to strong fundamentals and continued new construction.
32. Bush – 98% Home Price Increase Since 2010
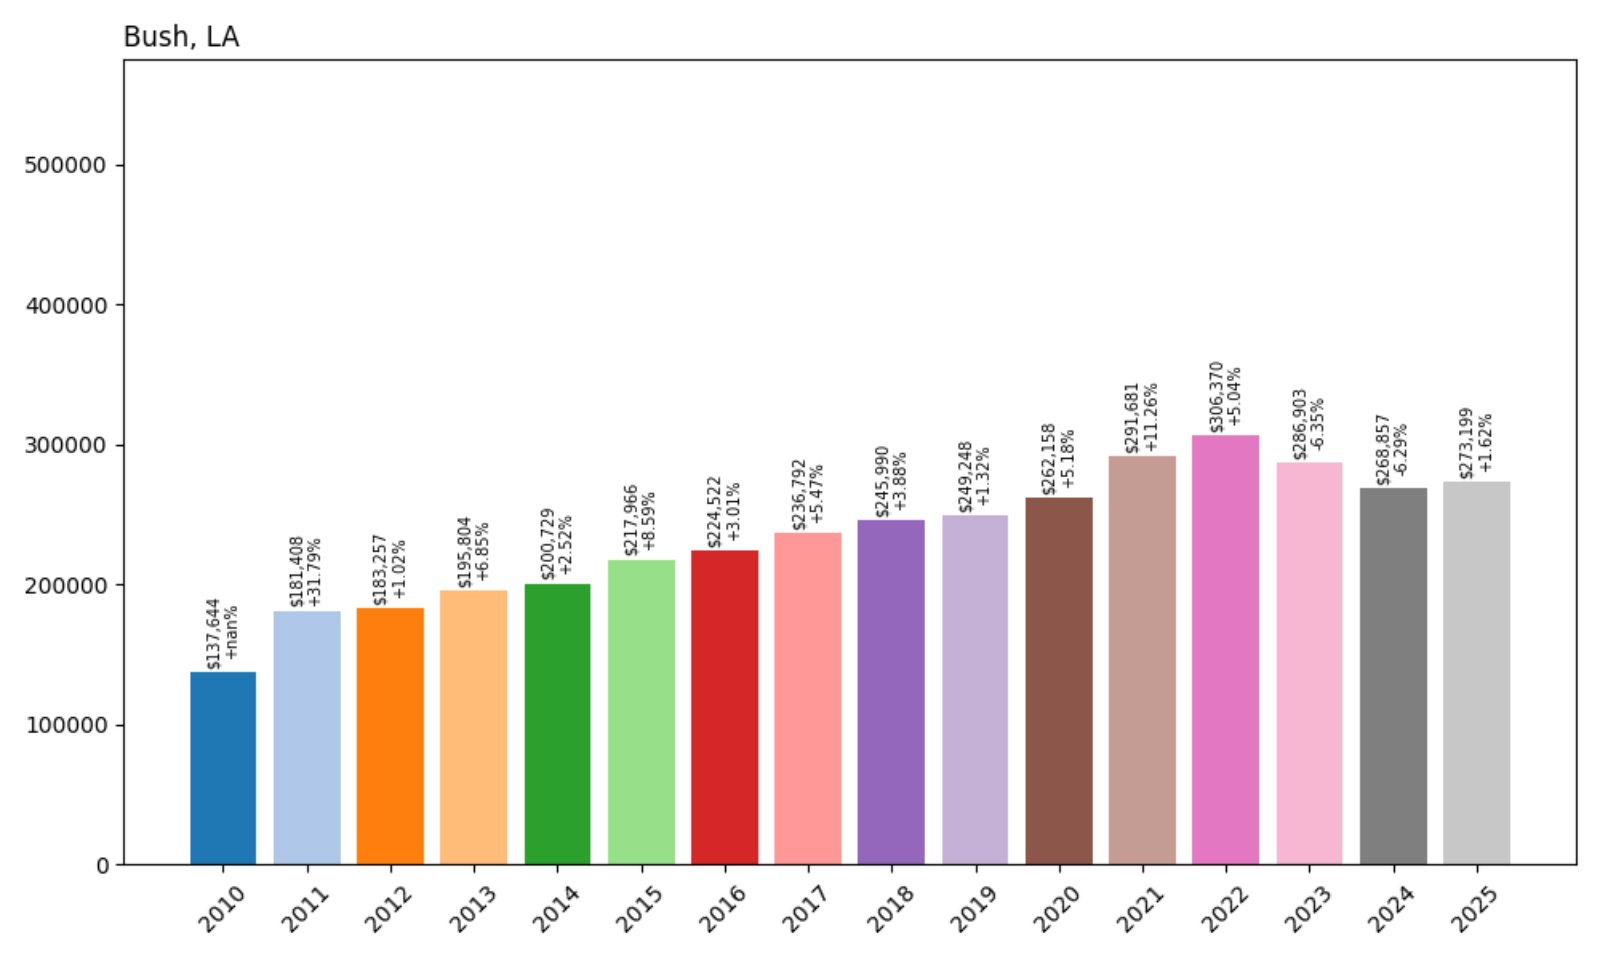
- 2010: $137,644
- 2011: $181,408 (+$43,764, +31.79% from previous year)
- 2012: $183,257 (+$1,849, +1.02% from previous year)
- 2013: $195,804 (+$12,547, +6.85% from previous year)
- 2014: $200,729 (+$4,925, +2.52% from previous year)
- 2015: $217,966 (+$17,238, +8.59% from previous year)
- 2016: $224,522 (+$6,555, +3.01% from previous year)
- 2017: $236,792 (+$12,270, +5.47% from previous year)
- 2018: $245,990 (+$9,198, +3.88% from previous year)
- 2019: $249,248 (+$3,258, +1.32% from previous year)
- 2020: $262,158 (+$12,910, +5.18% from previous year)
- 2021: $291,681 (+$29,523, +11.26% from previous year)
- 2022: $306,370 (+$14,690, +5.04% from previous year)
- 2023: $286,903 (−$19,467, −6.35% from previous year)
- 2024: $268,857 (−$18,046, −6.29% from previous year)
- 2025: $273,199 (+$4,343, +1.62% from previous year)
Bush’s home values soared from $137,644 in 2010 to $273,199 in 2025 — a near doubling. Prices surged early and remained strong through 2022. While the market corrected in 2023–2024, it regained momentum by 2025.
Bush – Big Gains in a Wooded, Rural Setting
Bush is a small, heavily wooded community in St. Tammany Parish. Known for its quiet roads and scenic acreage, it has become increasingly desirable for buyers seeking privacy and larger lots. Its location northeast of Covington and close to natural preserves adds to the appeal.
The strong growth between 2010 and 2022 pushed Bush into this elite ranking. The recent dips are part of broader regional corrections, but the long-term trend remains upward. For buyers seeking value in a quiet setting, Bush has proven to be a strong performer.
31. Saint Amant – 37% Home Price Increase Since 2010
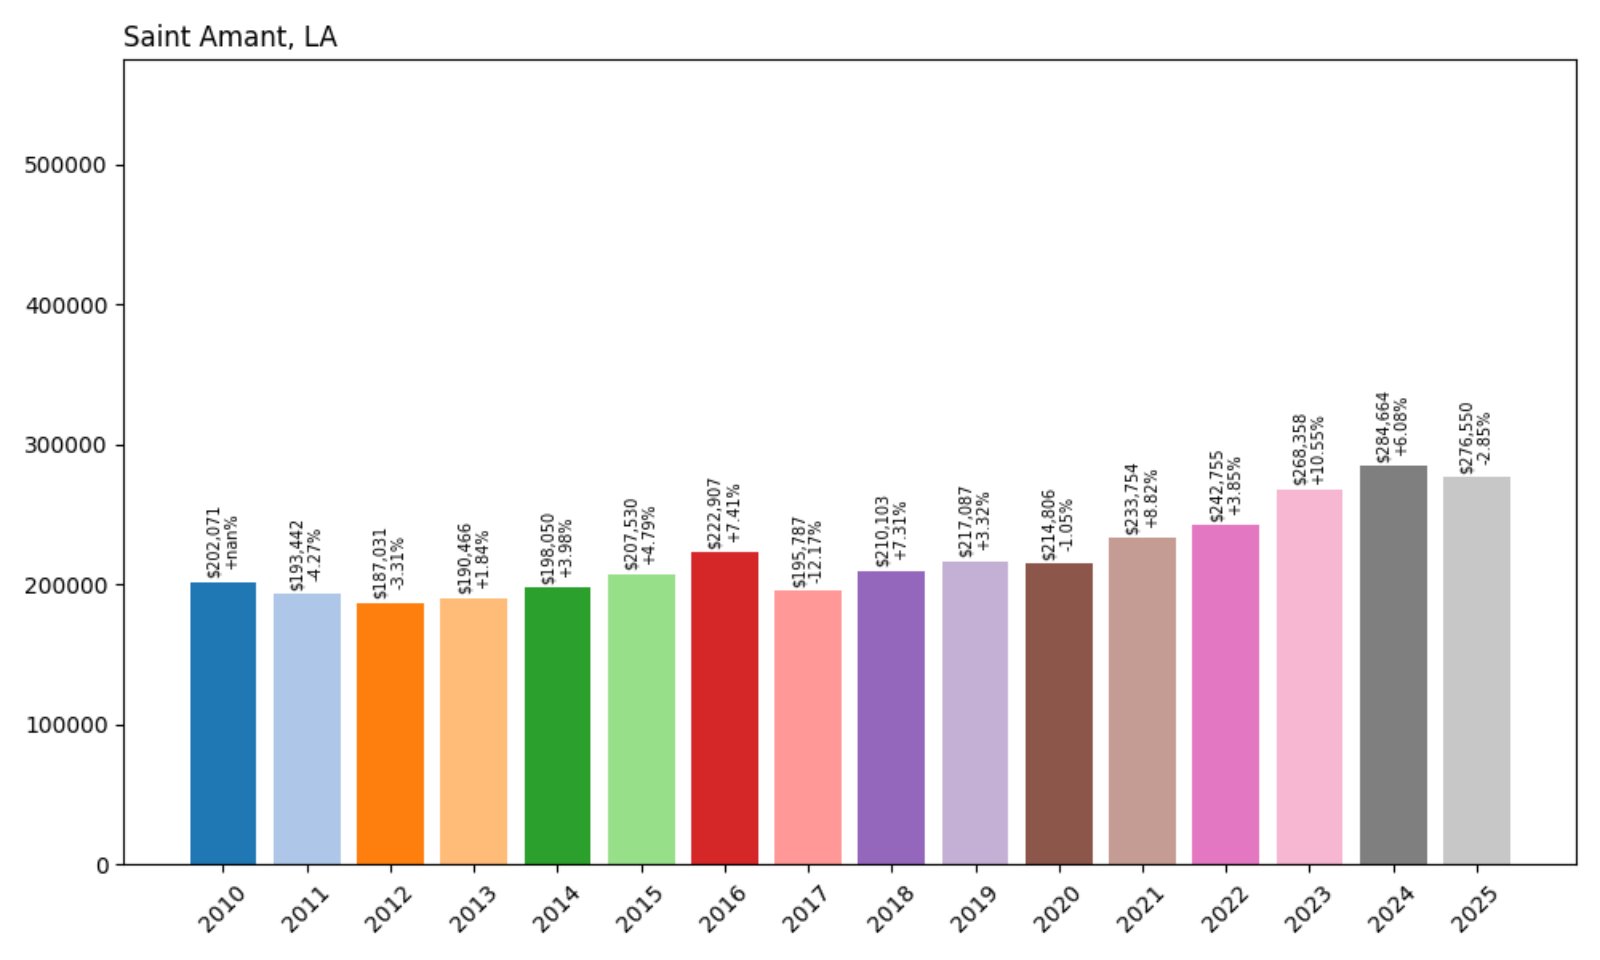
- 2010: $202,071
- 2011: $193,442 (−$8,629, −4.27% from previous year)
- 2012: $187,031 (−$6,412, −3.31% from previous year)
- 2013: $190,466 (+$3,436, +1.84% from previous year)
- 2014: $198,050 (+$7,583, +3.98% from previous year)
- 2015: $207,530 (+$9,480, +4.79% from previous year)
- 2016: $222,907 (+$15,378, +7.41% from previous year)
- 2017: $195,787 (−$27,121, −12.17% from previous year)
- 2018: $210,103 (+$14,317, +7.31% from previous year)
- 2019: $217,087 (+$6,984, +3.32% from previous year)
- 2020: $214,806 (−$2,282, −1.05% from previous year)
- 2021: $233,754 (+$18,949, +8.82% from previous year)
- 2022: $242,755 (+$9,000, +3.85% from previous year)
- 2023: $268,358 (+$25,604, +10.55% from previous year)
- 2024: $284,664 (+$16,305, +6.08% from previous year)
- 2025: $276,550 (−$8,114, −2.85% from previous year)
Saint Amant’s home prices rose from $202,071 in 2010 to $276,550 in 2025. After some volatility mid-decade, the town rebounded and surged between 2021 and 2024. A small pullback in 2025 followed.
Saint Amant – Rebuilding and Rising
Located in Ascension Parish, Saint Amant is a semi-rural community with deep ties to fishing, agriculture, and family land. It faced challenges in 2016 due to flooding, which may explain the sharp price drop that year. But the recovery was strong, and recent years have shown double-digit price gains.
With increasing suburban spillover from Baton Rouge and Gonzales, Saint Amant has attracted attention for its relatively affordable properties and spacious lots. Continued infrastructure upgrades and school improvements have also helped boost its desirability.
30. Brusly – 52% Home Price Increase Since 2010
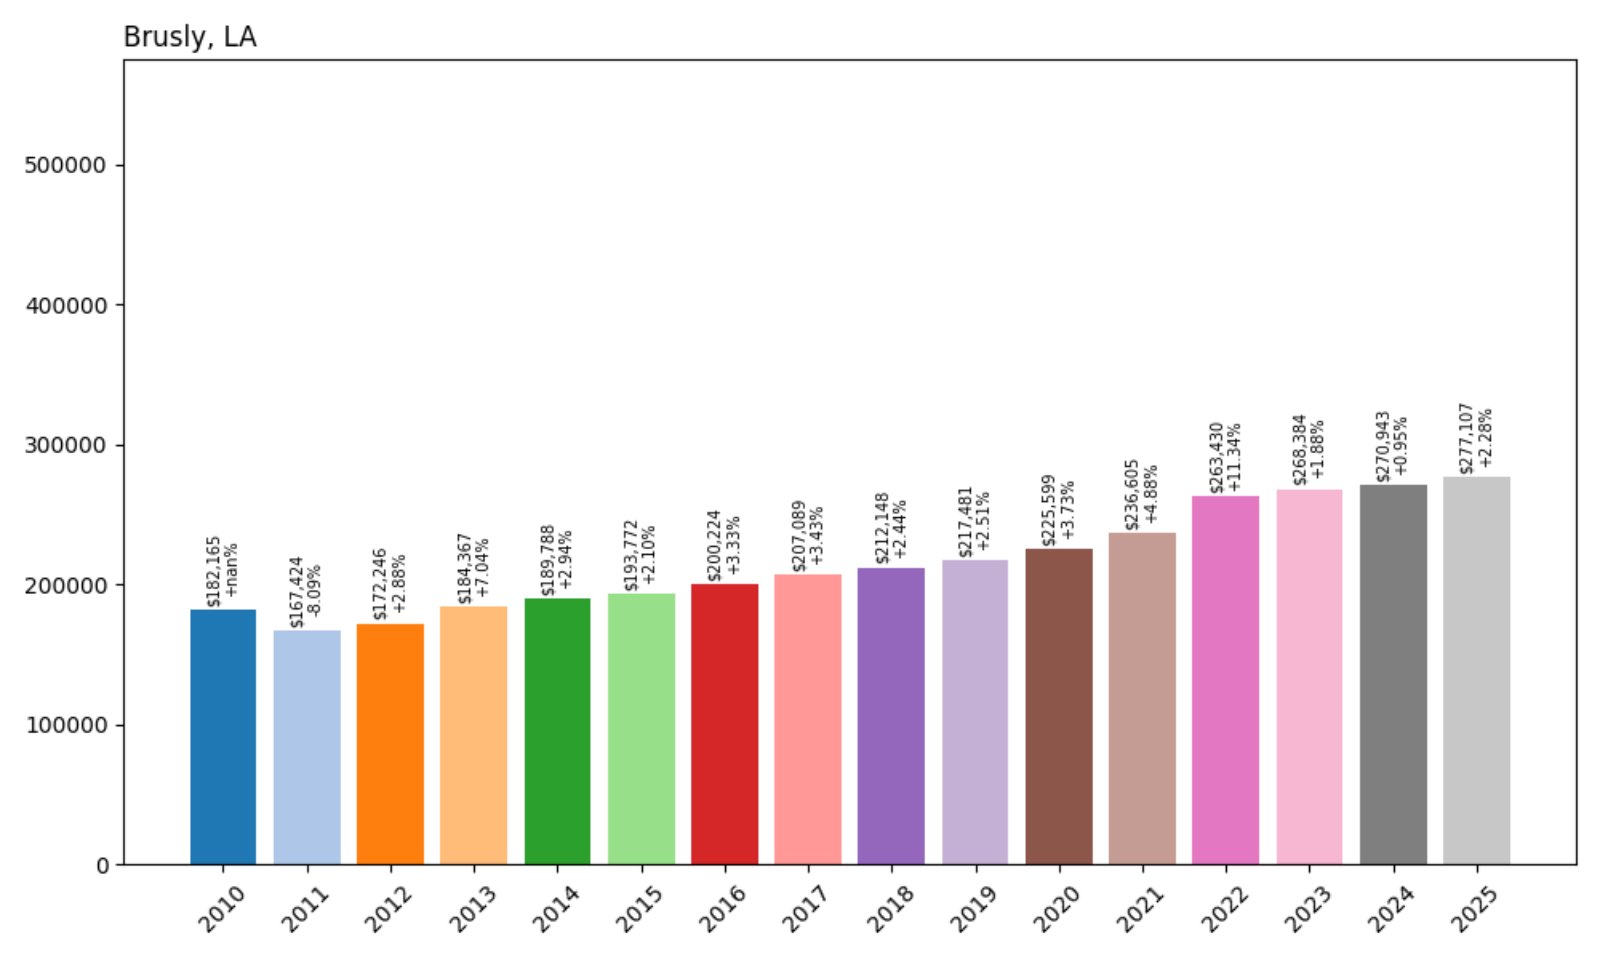
- 2010: $182,165
- 2011: $167,424 (−$14,740, −8.09% from previous year)
- 2012: $172,246 (+$4,821, +2.88% from previous year)
- 2013: $184,367 (+$12,121, +7.04% from previous year)
- 2014: $189,788 (+$5,421, +2.94% from previous year)
- 2015: $193,772 (+$3,984, +2.10% from previous year)
- 2016: $200,224 (+$6,451, +3.33% from previous year)
- 2017: $207,089 (+$6,866, +3.43% from previous year)
- 2018: $212,148 (+$5,059, +2.44% from previous year)
- 2019: $217,481 (+$5,333, +2.51% from previous year)
- 2020: $225,599 (+$8,118, +3.73% from previous year)
- 2021: $236,605 (+$11,006, +4.88% from previous year)
- 2022: $263,430 (+$26,824, +11.34% from previous year)
- 2023: $268,384 (+$4,955, +1.88% from previous year)
- 2024: $270,943 (+$2,558, +0.95% from previous year)
- 2025: $277,107 (+$6,164, +2.28% from previous year)
Brusly’s home values climbed steadily from $182,165 in 2010 to $277,107 in 2025, marking a 52% increase. The growth has been consistent, with no major market drops over the 15-year period. The pace picked up sharply between 2020 and 2022, reflecting broader statewide trends.
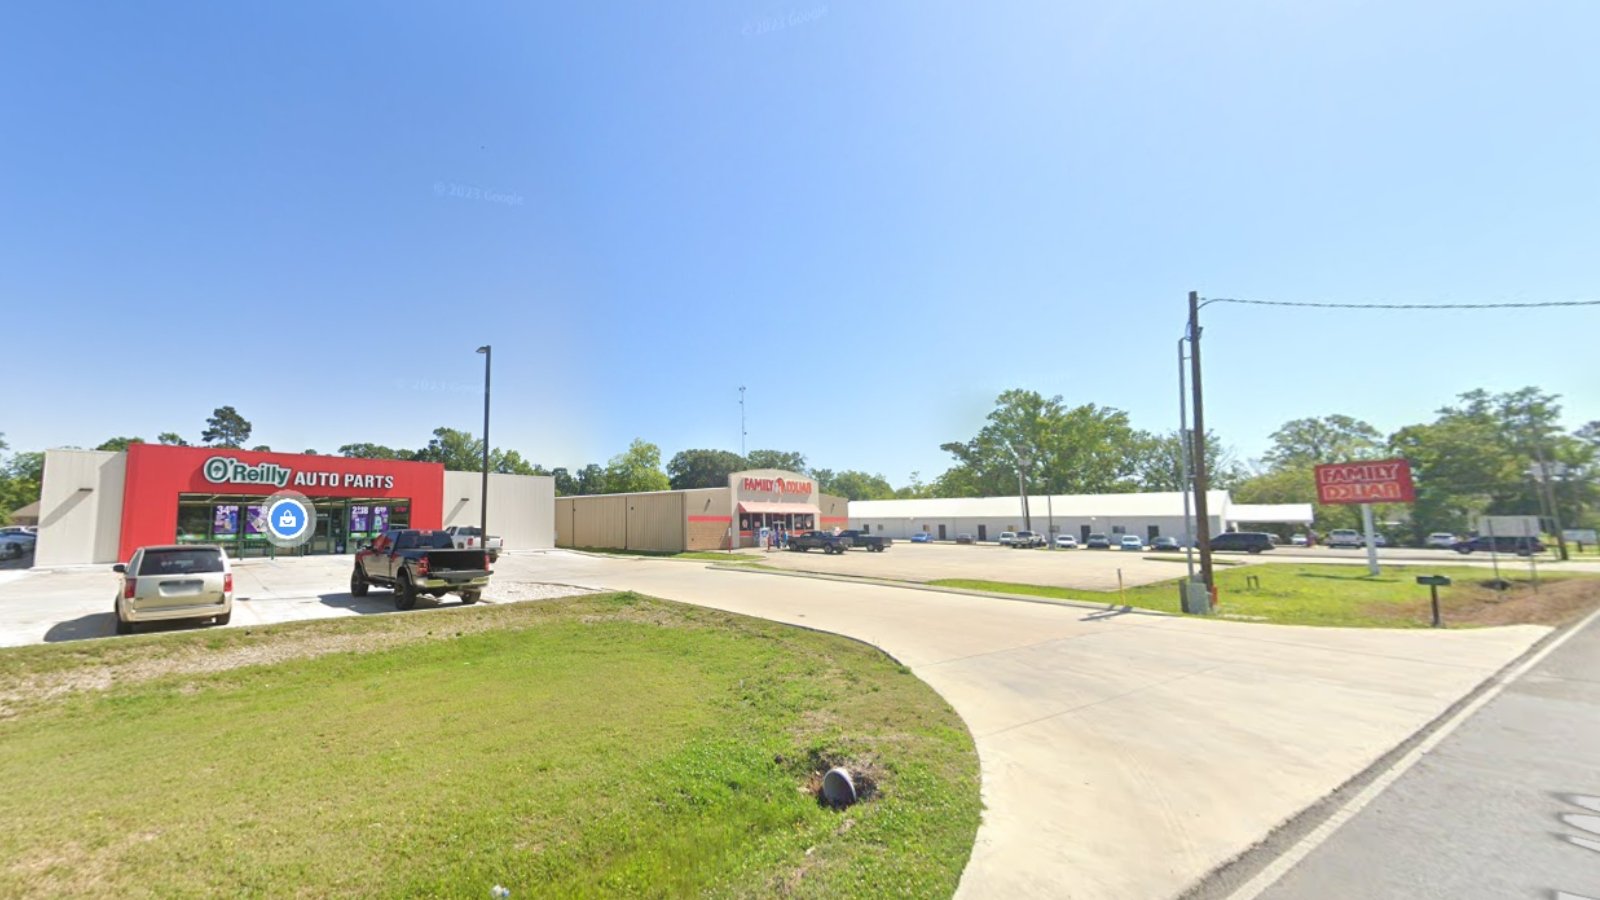
Brusly – Steady Growth Near Baton Rouge Industry
Brusly sits just across the Mississippi River from Baton Rouge in West Baton Rouge Parish. Its location offers easy access to chemical industry jobs and regional employers, while the town itself remains quiet and residential. That balance has kept home demand high for over a decade.
With good schools, community parks, and a small-town atmosphere, Brusly appeals to families and professionals alike. Its housing stock ranges from modest mid-century homes to newer subdivisions. The long-term stability of this market reflects both economic resilience and consistent buyer interest.
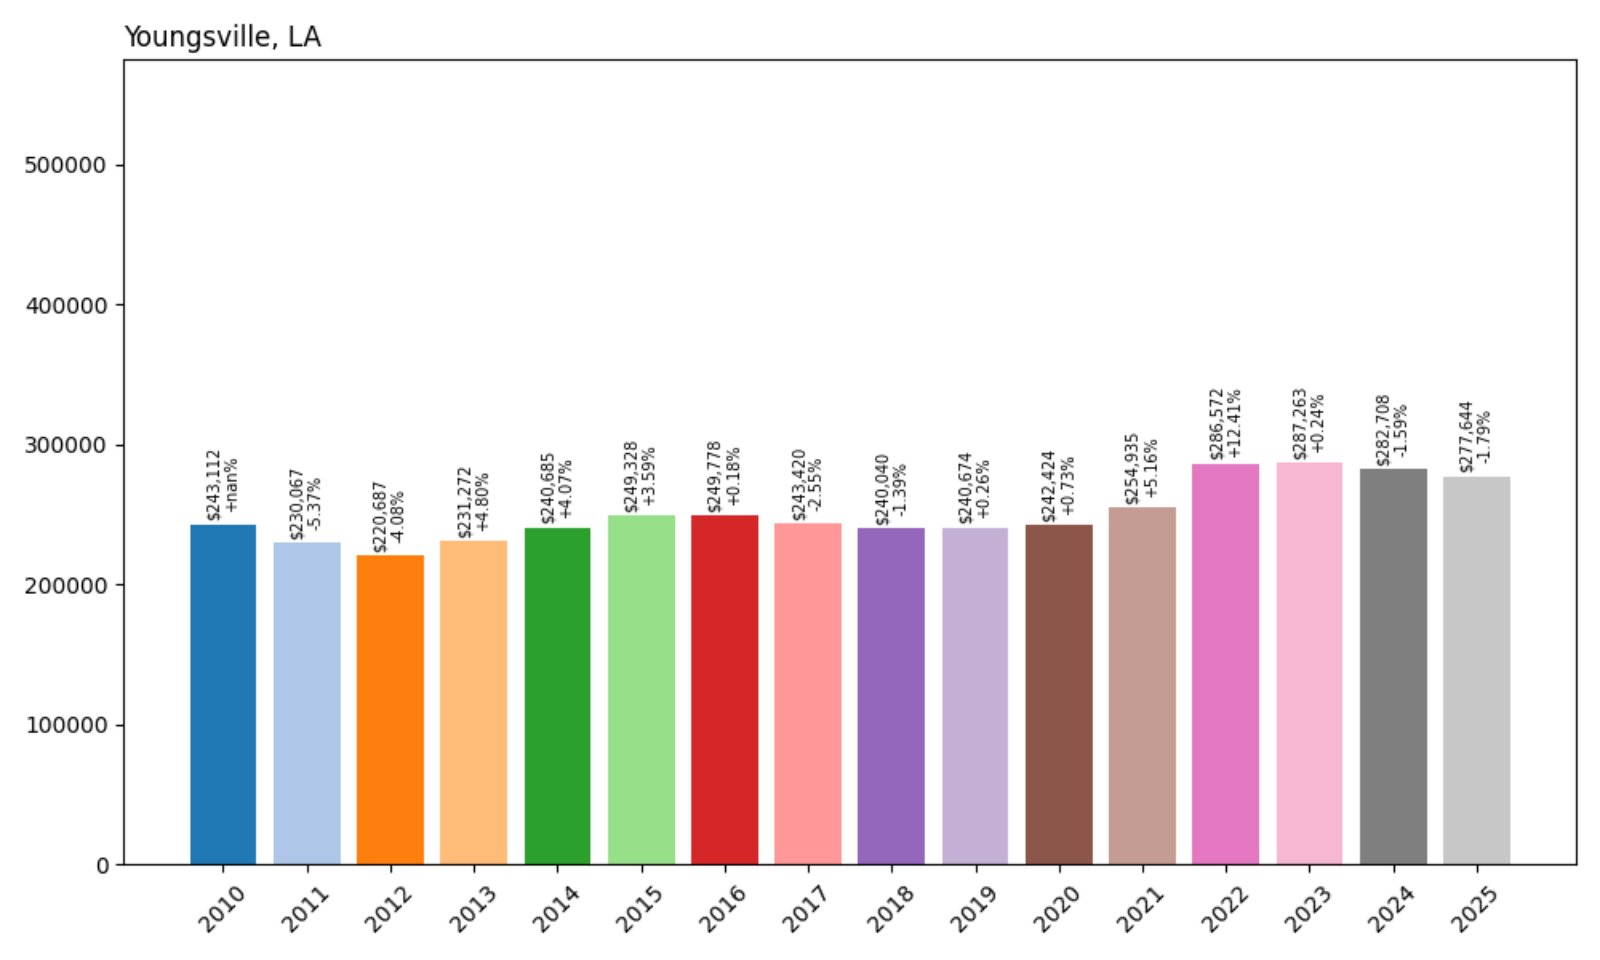
29. Youngsville – 14% Home Price Increase Since 2010
🔥 Would you like to save this?
- 2010: $243,112
- 2011: $230,067 (−$13,045, −5.37% from previous year)
- 2012: $220,687 (−$9,380, −4.08% from previous year)
- 2013: $231,272 (+$10,585, +4.80% from previous year)
- 2014: $240,685 (+$9,413, +4.07% from previous year)
- 2015: $249,328 (+$8,643, +3.59% from previous year)
- 2016: $249,778 (+$450, +0.18% from previous year)
- 2017: $243,420 (−$6,358, −2.55% from previous year)
- 2018: $240,040 (−$3,380, −1.39% from previous year)
- 2019: $240,674 (+$634, +0.26% from previous year)
- 2020: $242,424 (+$1,750, +0.73% from previous year)
- 2021: $254,935 (+$12,511, +5.16% from previous year)
- 2022: $286,572 (+$31,638, +12.41% from previous year)
- 2023: $287,263 (+$691, +0.24% from previous year)
- 2024: $282,708 (−$4,555, −1.59% from previous year)
- 2025: $277,644 (−$5,064, −1.79% from previous year)
Youngsville’s prices increased from $243,112 in 2010 to $277,644 in 2025 — a 14% gain. The market experienced some volatility, with declines in the mid-2010s and again in 2024–2025. Still, demand held firm during boom years, particularly in 2021 and 2022.
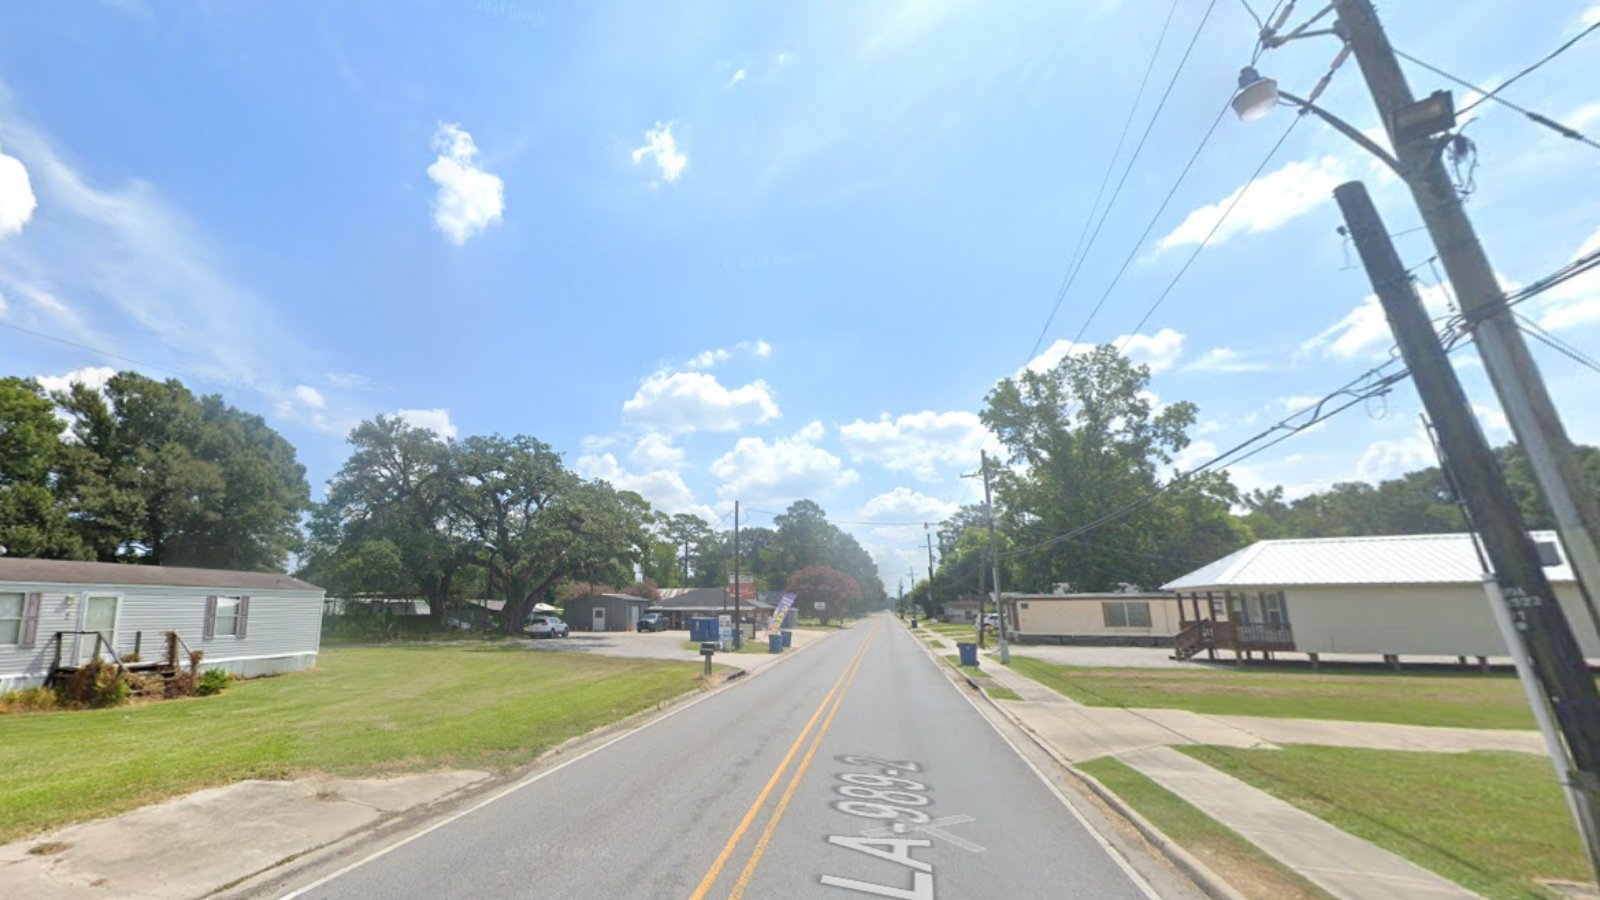
Youngsville – A Suburban Growth Story with a Pause
One of the fastest-growing cities in Louisiana, Youngsville is located just south of Lafayette and has transformed from rural farmland to a bustling suburb. The population has boomed, supported by master-planned communities and new retail centers.
However, that rapid development may have contributed to recent pricing softness. After major increases in the early 2020s, a small correction followed. Even so, the long-term outlook remains solid thanks to strong infrastructure, schools, and a proactive city government.
28. Broussard – 27% Home Price Increase Since 2010
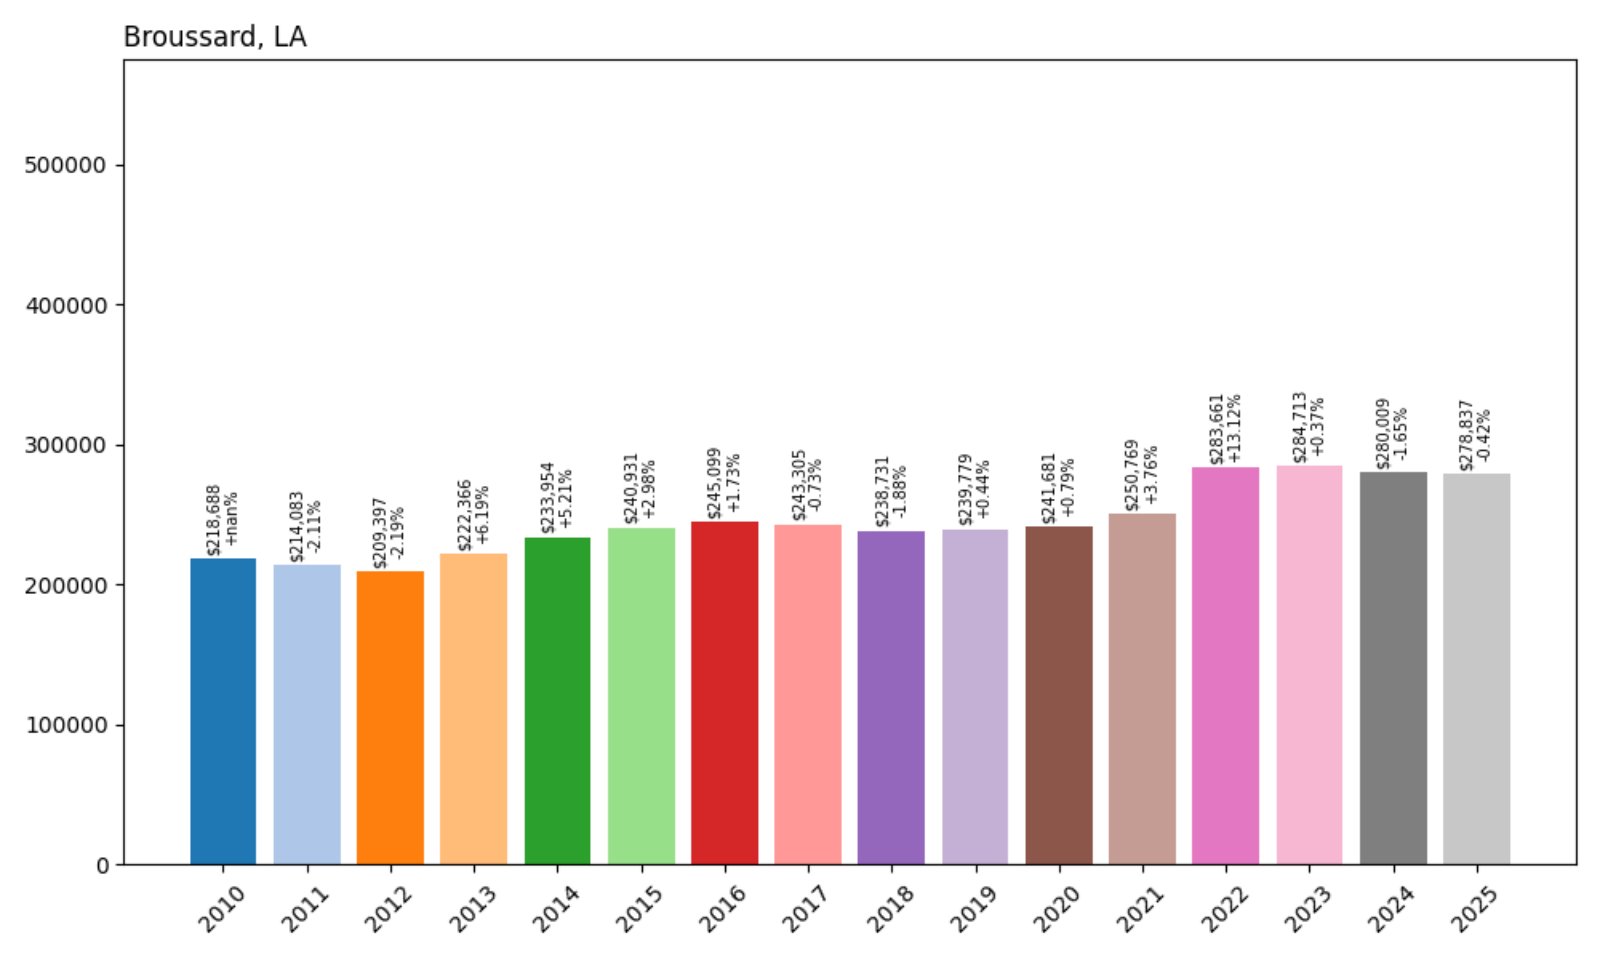
- 2010: $218,688
- 2011: $214,083 (−$4,605, −2.11% from previous year)
- 2012: $209,397 (−$4,686, −2.19% from previous year)
- 2013: $222,366 (+$12,969, +6.19% from previous year)
- 2014: $233,954 (+$11,588, +5.21% from previous year)
- 2015: $240,931 (+$6,977, +2.98% from previous year)
- 2016: $245,099 (+$4,168, +1.73% from previous year)
- 2017: $243,305 (−$1,795, −0.73% from previous year)
- 2018: $238,731 (−$4,574, −1.88% from previous year)
- 2019: $239,779 (+$1,048, +0.44% from previous year)
- 2020: $241,681 (+$1,902, +0.79% from previous year)
- 2021: $250,769 (+$9,089, +3.76% from previous year)
- 2022: $283,661 (+$32,891, +13.12% from previous year)
- 2023: $284,713 (+$1,052, +0.37% from previous year)
- 2024: $280,009 (−$4,704, −1.65% from previous year)
- 2025: $278,837 (−$1,172, −0.42% from previous year)
Broussard saw home values rise from $218,688 in 2010 to $278,837 in 2025. The town weathered some mid-decade softness before making large gains in 2021 and 2022. It’s a story of rebound and realignment, now stabilizing after a rapid run-up.
Broussard – Industry and Infrastructure Boosted the Market
Part of the Lafayette metro, Broussard is known for a strong local economy tied to oilfield services, manufacturing, and logistics. Several corporate campuses and industrial parks call it home, contributing to job growth and housing demand.
Large infrastructure investments and an expanding retail base added appeal in recent years. While 2023–2025 saw a slight cooling, the broader trend remains positive, thanks to a solid foundation of jobs, schools, and steady demand from new residents.
27. Greenwell Springs – 39% Home Price Increase Since 2010
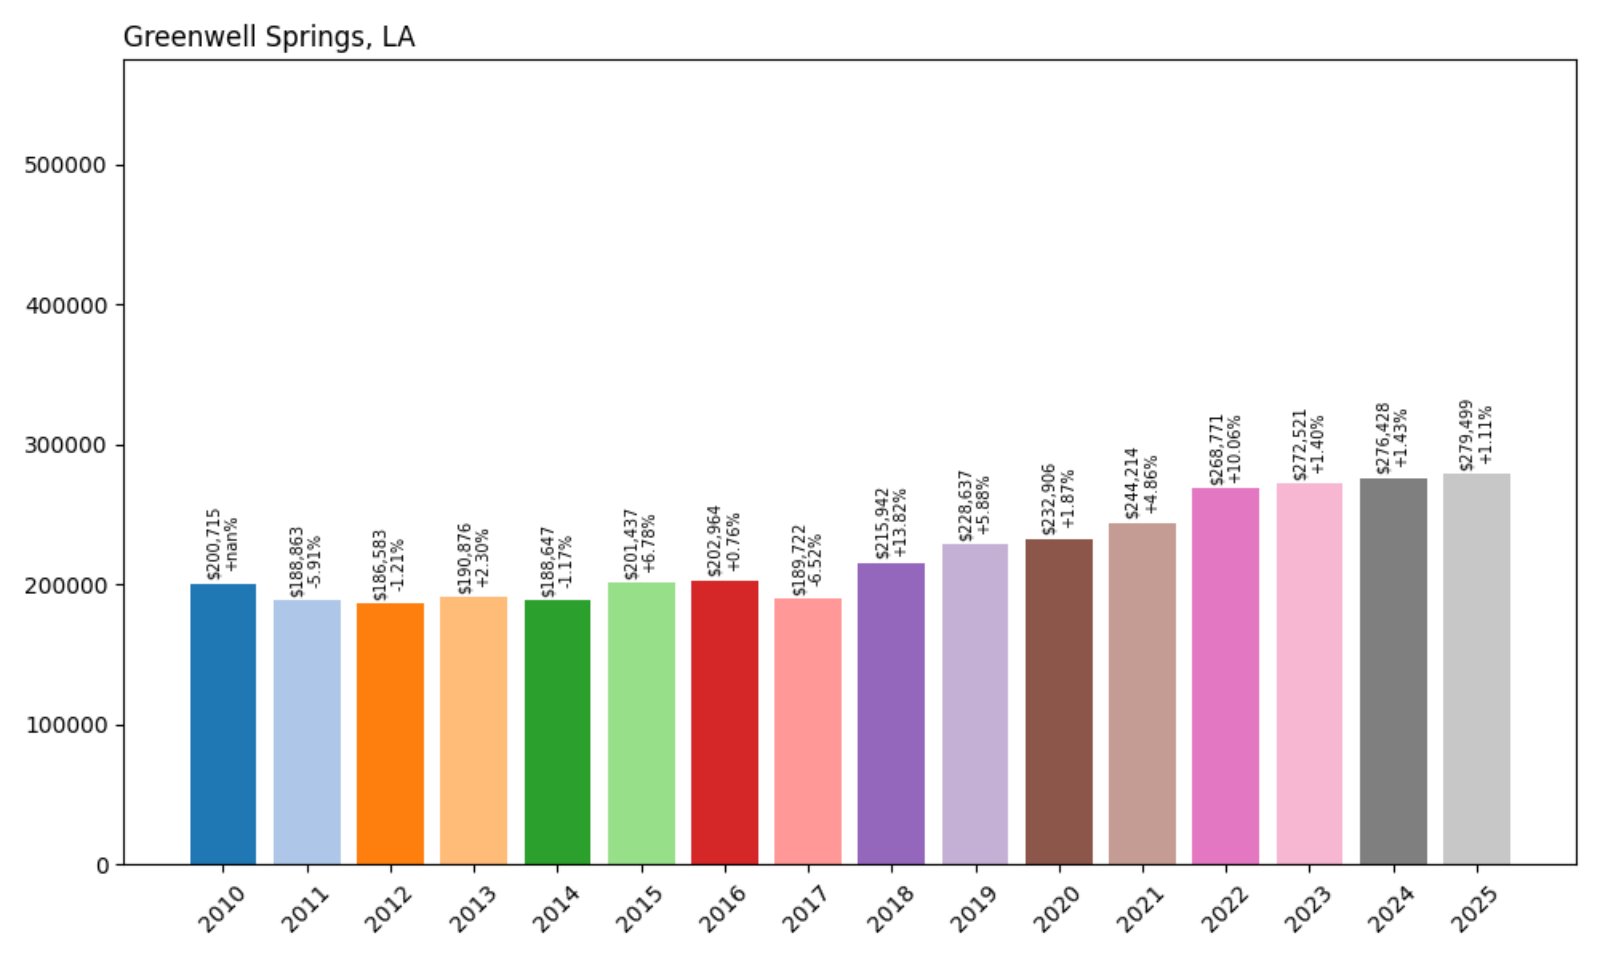
- 2010: $200,715
- 2011: $188,863 (−$11,853, −5.91% from previous year)
- 2012: $186,583 (−$2,279, −1.21% from previous year)
- 2013: $190,876 (+$4,293, +2.30% from previous year)
- 2014: $188,647 (−$2,229, −1.17% from previous year)
- 2015: $201,437 (+$12,791, +6.78% from previous year)
- 2016: $202,964 (+$1,527, +0.76% from previous year)
- 2017: $189,722 (−$13,242, −6.52% from previous year)
- 2018: $215,942 (+$26,219, +13.82% from previous year)
- 2019: $228,637 (+$12,695, +5.88% from previous year)
- 2020: $232,906 (+$4,270, +1.87% from previous year)
- 2021: $244,214 (+$11,308, +4.86% from previous year)
- 2022: $268,771 (+$24,557, +10.06% from previous year)
- 2023: $272,521 (+$3,750, +1.40% from previous year)
- 2024: $276,428 (+$3,907, +1.43% from previous year)
- 2025: $279,499 (+$3,071, +1.11% from previous year)
Greenwell Springs’ home values rose from $200,715 in 2010 to $279,499 in 2025 — an increase of 39%. Prices jumped sharply in 2018 and again in 2022, with modest but steady growth continuing through 2025.
Greenwell Springs – Quiet Growth on Baton Rouge’s Edge
Greenwell Springs is a suburban community in East Baton Rouge Parish known for its wooded lots, country charm, and access to nearby city amenities. It’s popular among families looking for space without sacrificing proximity to Baton Rouge jobs and schools.
While it saw a dip in 2017, prices rebounded strongly the following year and have climbed steadily since. New home construction and interest in semi-rural neighborhoods have supported demand, particularly post-2020. It remains a sought-after area for buyers looking outside the core metro.
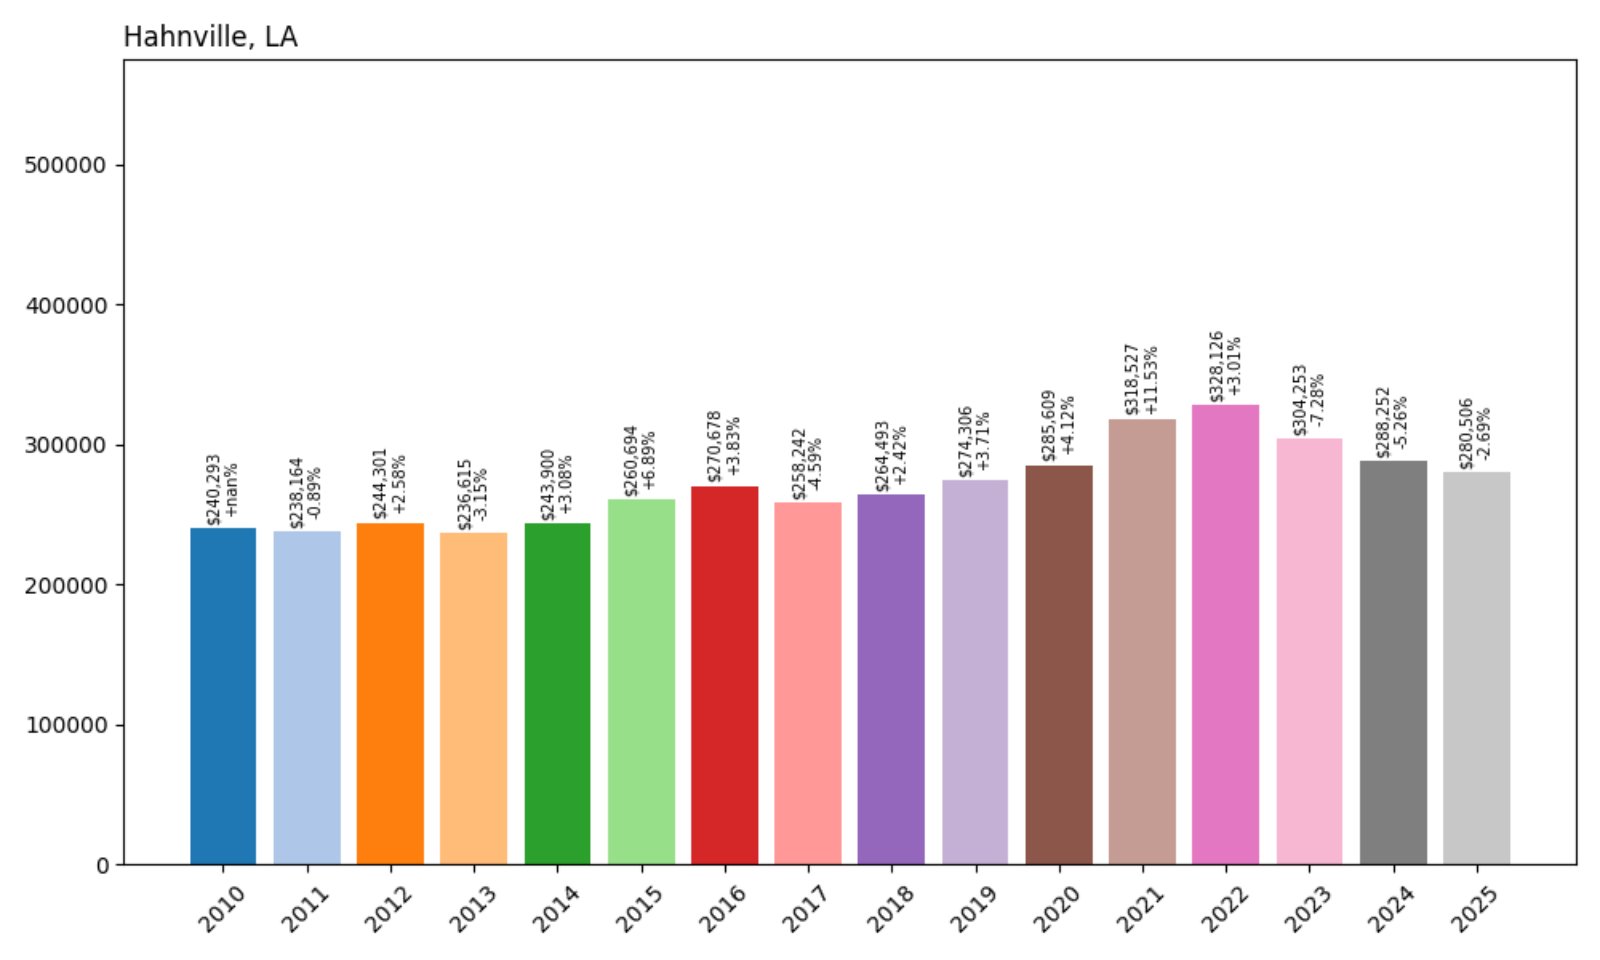
26. Hahnville – 17% Home Price Increase Since 2010
- 2010: $240,293
- 2011: $238,164 (−$2,129, −0.89% from previous year)
- 2012: $244,301 (+$6,137, +2.58% from previous year)
- 2013: $236,615 (−$7,686, −3.15% from previous year)
- 2014: $243,900 (+$7,285, +3.08% from previous year)
- 2015: $260,694 (+$16,794, +6.89% from previous year)
- 2016: $270,678 (+$9,984, +3.83% from previous year)
- 2017: $258,242 (−$12,437, −4.59% from previous year)
- 2018: $264,493 (+$6,251, +2.42% from previous year)
- 2019: $274,306 (+$9,813, +3.71% from previous year)
- 2020: $285,609 (+$11,303, +4.12% from previous year)
- 2021: $318,527 (+$32,918, +11.53% from previous year)
- 2022: $328,126 (+$9,599, +3.01% from previous year)
- 2023: $304,253 (−$23,873, −7.28% from previous year)
- 2024: $288,252 (−$16,002, −5.26% from previous year)
- 2025: $280,506 (−$7,746, −2.69% from previous year)
Hahnville’s home prices rose from $240,293 in 2010 to $280,506 in 2025 — an increase of 17%. The town saw a peak in 2021, followed by three consecutive years of value declines, reflecting some market cooling after sharp gains.
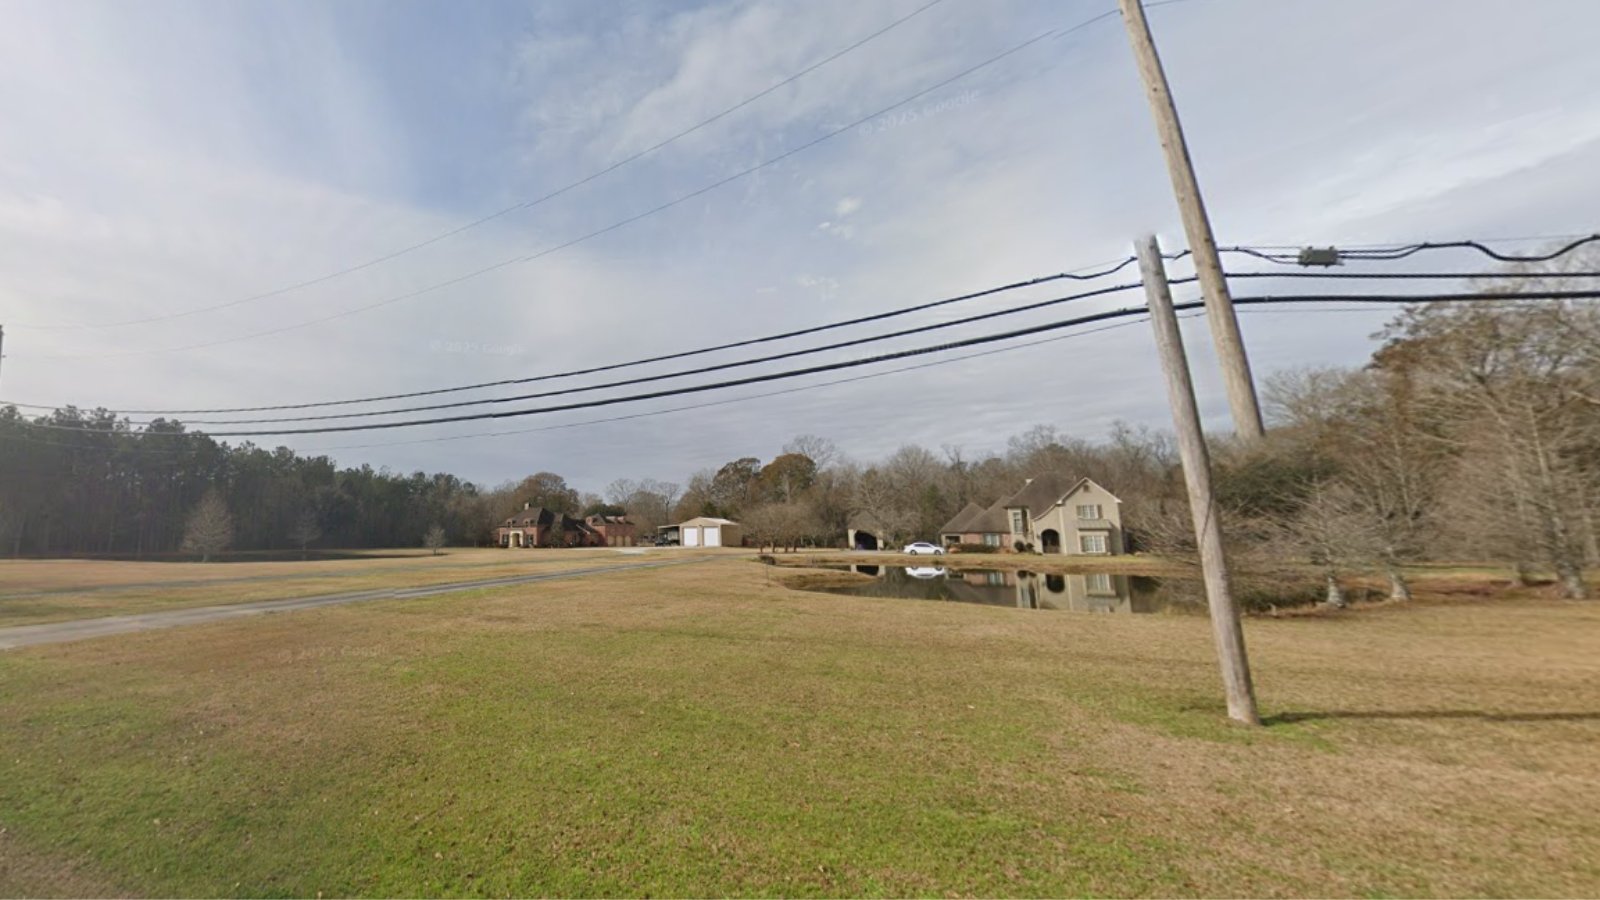
Hahnville – River Views and Market Corrections
Located on the west bank of the Mississippi River in St. Charles Parish, Hahnville blends scenic waterfront living with access to regional employers. It’s home to the parish government and benefits from proximity to industrial corridors and major highways.
The market peaked in 2021 during a wave of housing demand, but prices have softened since. Still, long-term growth remains positive, with more than $40,000 added in value since 2010. Its balance of space, river views, and location keeps it on buyers’ radar despite short-term corrections.
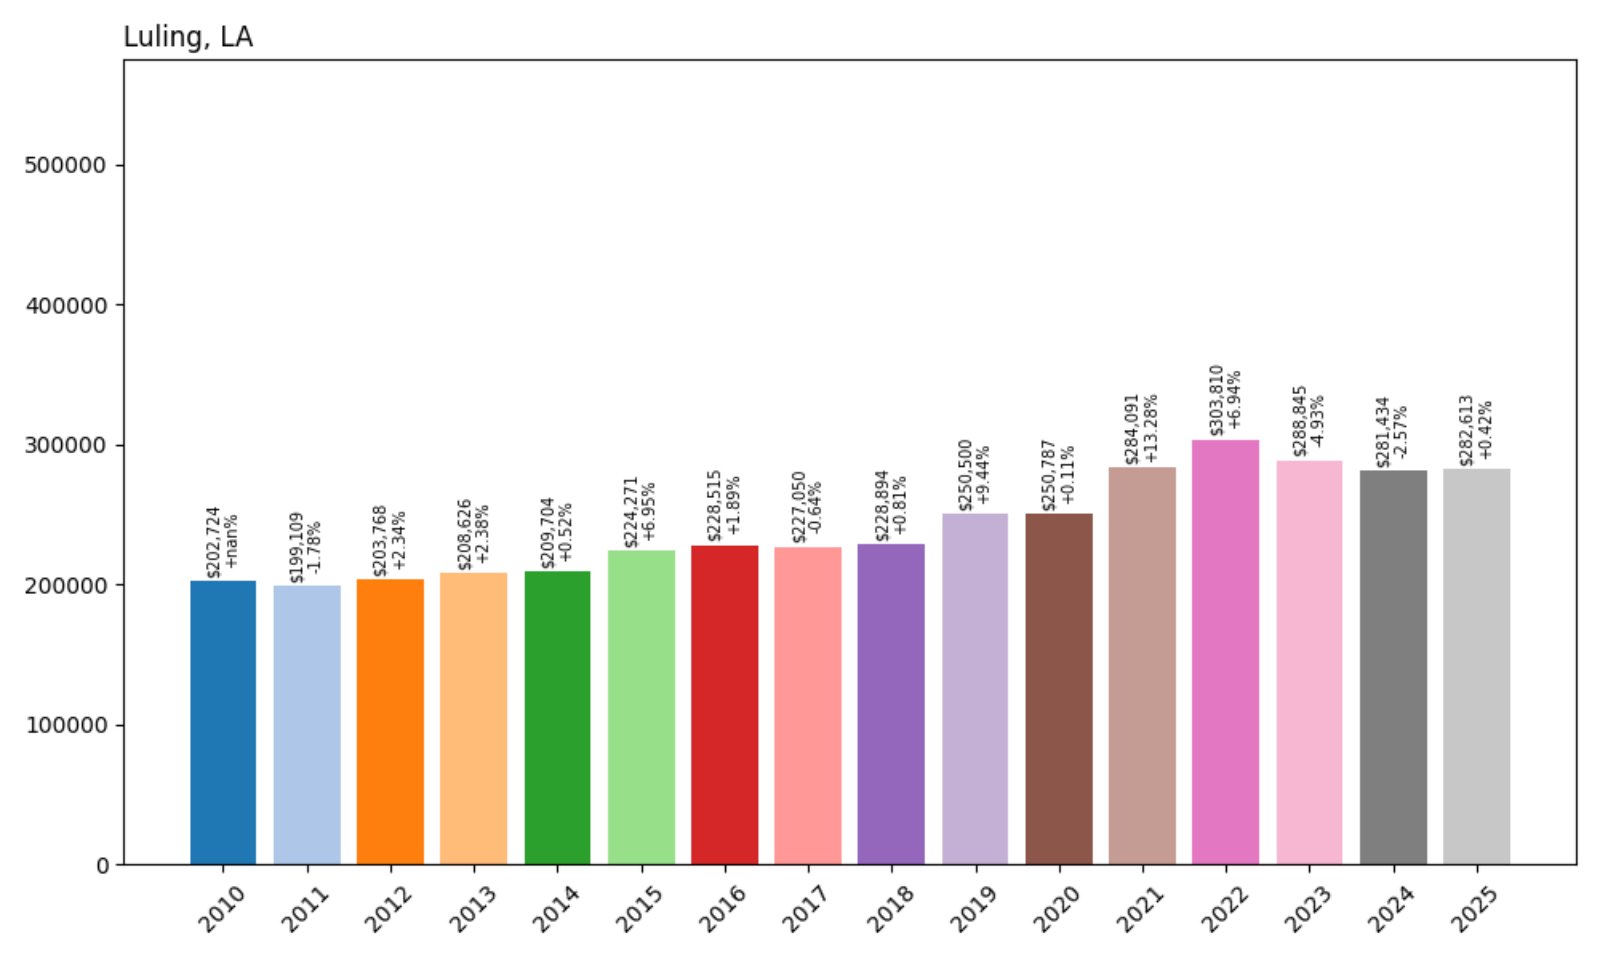
25. Luling – 39% Home Price Increase Since 2010
- 2010: $202,724
- 2011: $199,109 (−$3,615, −1.78% from previous year)
- 2012: $203,768 (+$4,658, +2.34% from previous year)
- 2013: $208,626 (+$4,859, +2.38% from previous year)
- 2014: $209,704 (+$1,078, +0.52% from previous year)
- 2015: $224,271 (+$14,567, +6.95% from previous year)
- 2016: $228,515 (+$4,244, +1.89% from previous year)
- 2017: $227,050 (−$1,464, −0.64% from previous year)
- 2018: $228,894 (+$1,844, +0.81% from previous year)
- 2019: $250,500 (+$21,606, +9.44% from previous year)
- 2020: $250,787 (+$287, +0.11% from previous year)
- 2021: $284,091 (+$33,305, +13.28% from previous year)
- 2022: $303,810 (+$19,719, +6.94% from previous year)
- 2023: $288,845 (−$14,965, −4.93% from previous year)
- 2024: $281,434 (−$7,412, −2.57% from previous year)
- 2025: $282,613 (+$1,179, +0.42% from previous year)
Luling’s home values rose from $202,724 in 2010 to $282,613 in 2025. After steady growth for a decade, values peaked in 2022 before cooling slightly over the past three years. Still, the long-term trajectory remains upward.
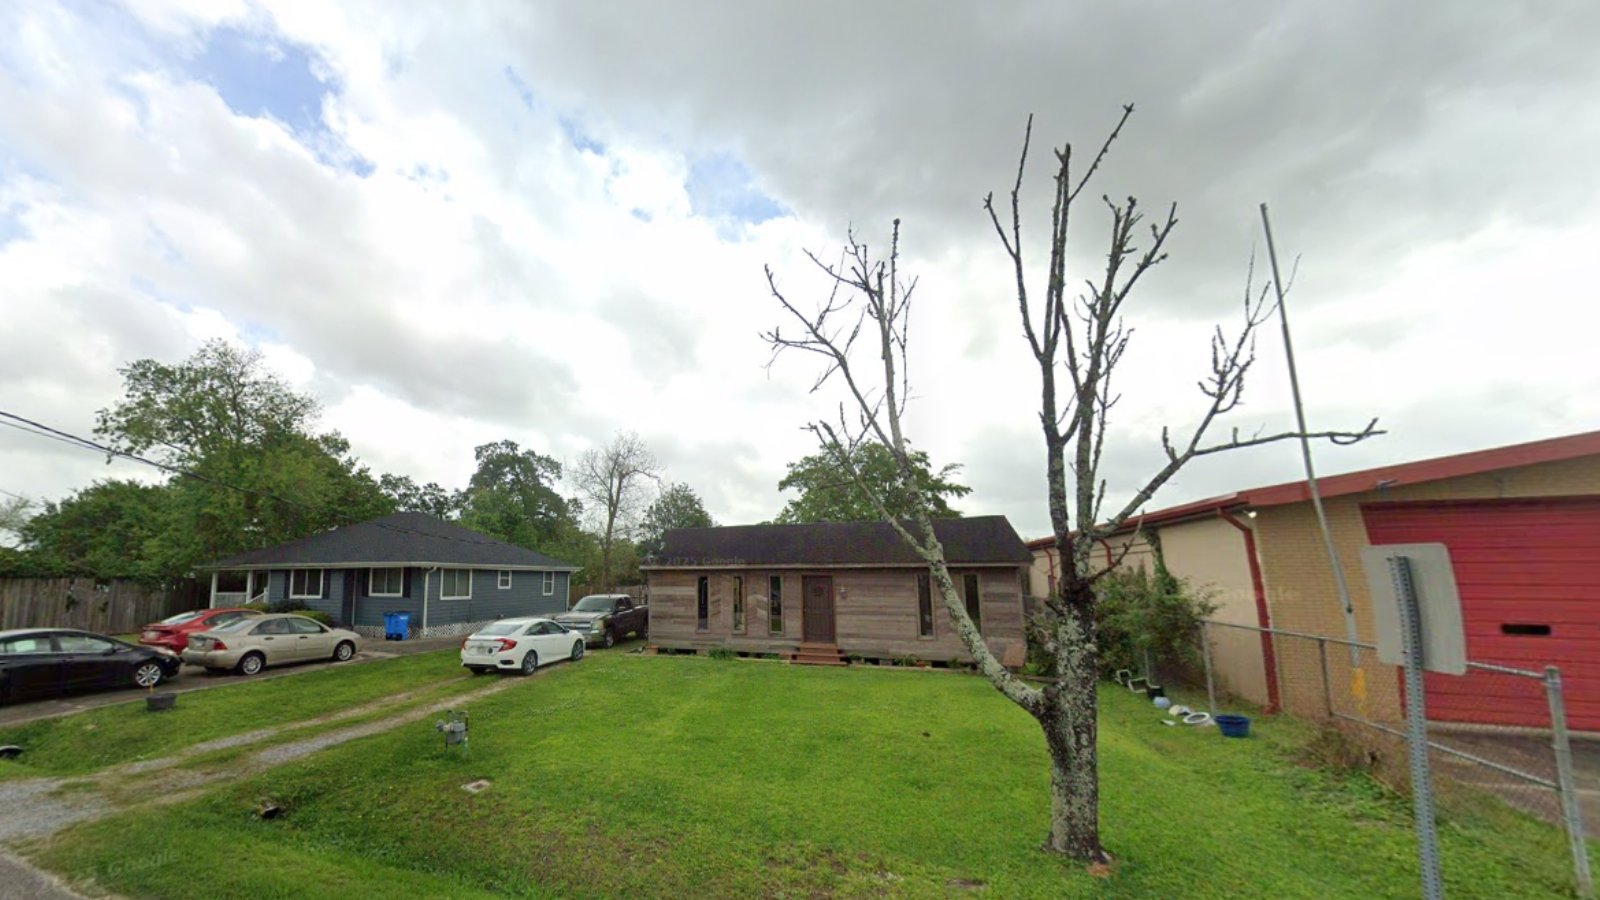
Luling – Accessibility and Strong Local Demand
Luling lies in St. Charles Parish, just west of New Orleans, with quick access to I-310 and the Hale Boggs Bridge. This convenient location has made it a reliable housing choice for regional commuters, especially those working in aviation, logistics, and the petrochemical industry.
The sharp appreciation in 2020–2022 coincided with suburban growth and pandemic-driven shifts. While the price retreat since then may worry some buyers, it’s part of a broader stabilization across the state. Luling’s infrastructure, schools, and access keep demand resilient.
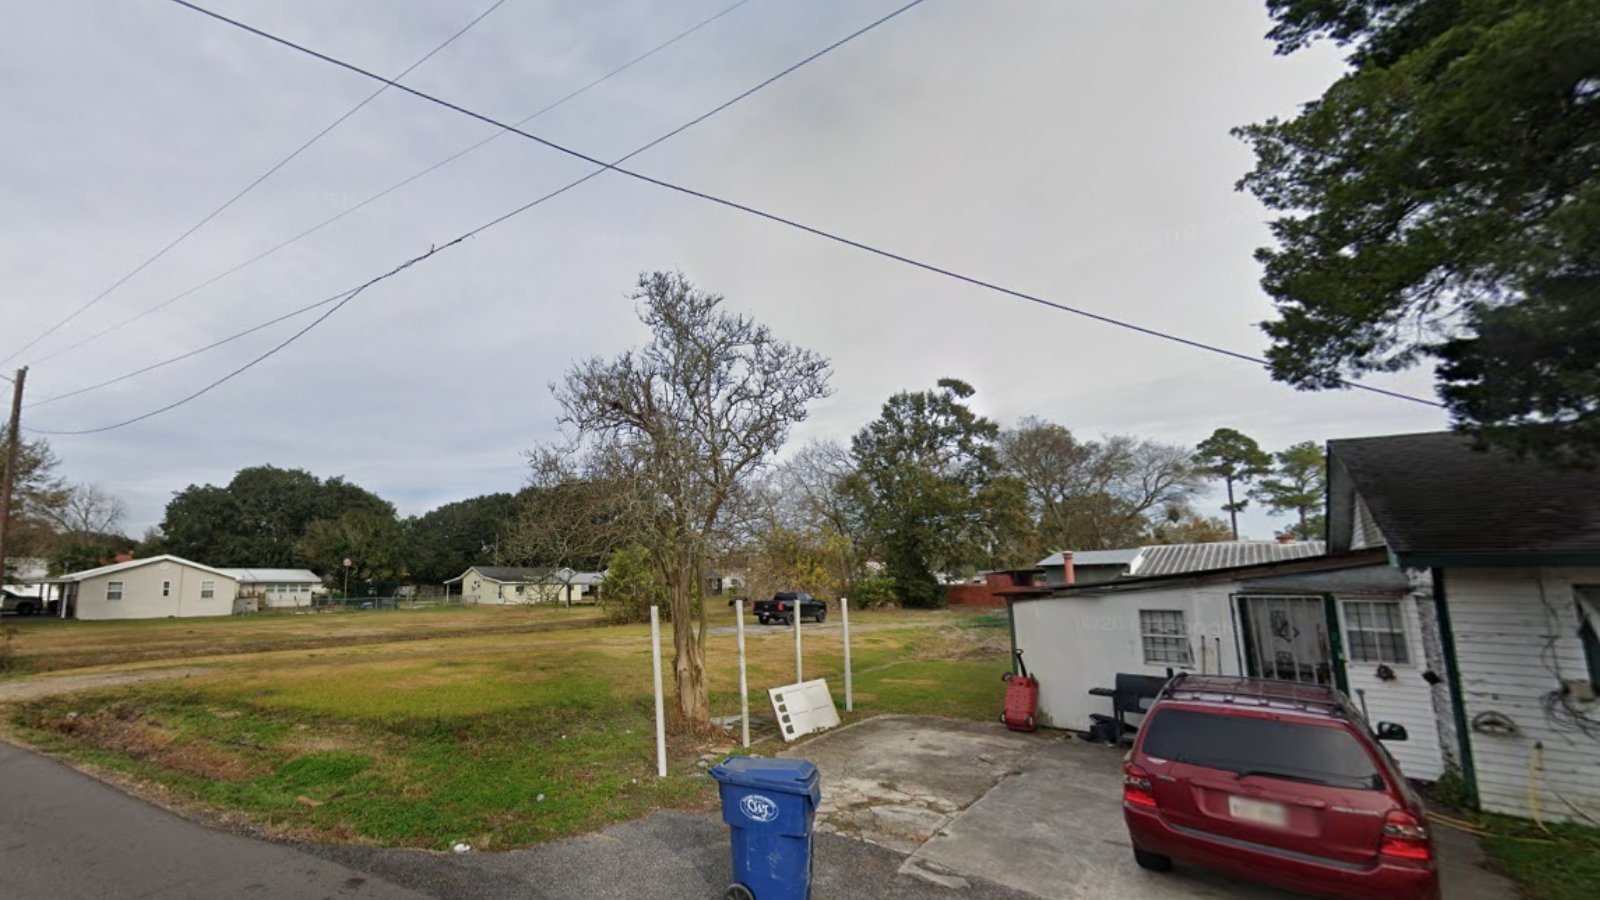
24. Ventress – 55% Home Price Increase Since 2012
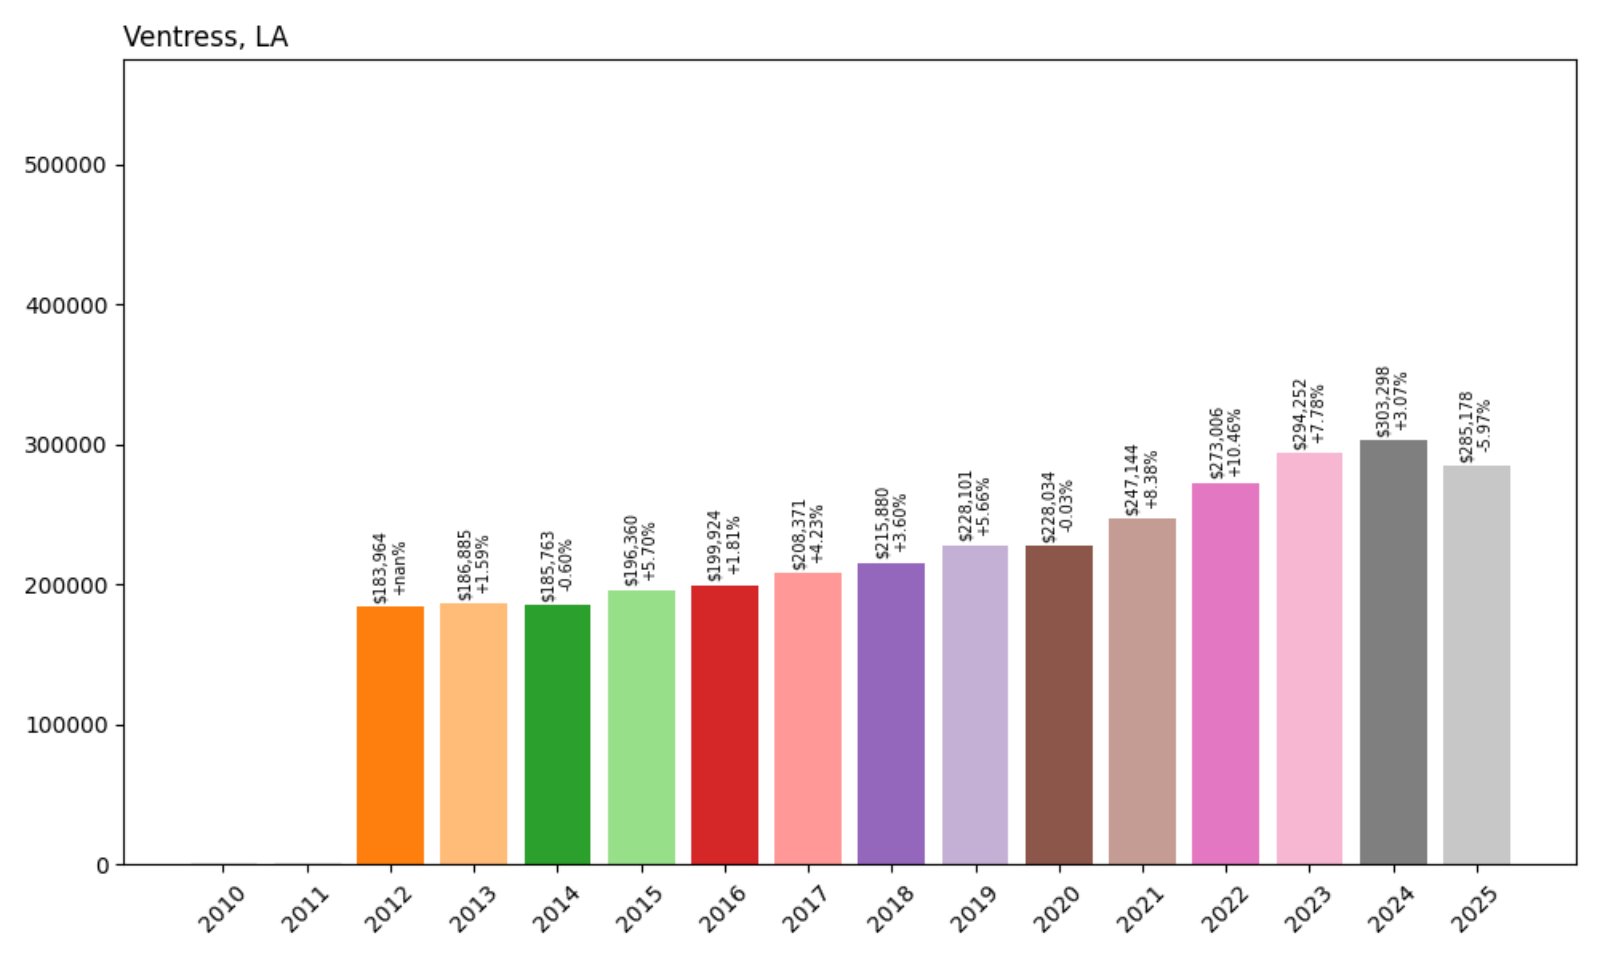
- 2012: $183,964
- 2013: $186,885 (+$2,922, +1.59% from previous year)
- 2014: $185,763 (−$1,122, −0.60% from previous year)
- 2015: $196,360 (+$10,597, +5.70% from previous year)
- 2016: $199,924 (+$3,563, +1.81% from previous year)
- 2017: $208,371 (+$8,447, +4.23% from previous year)
- 2018: $215,880 (+$7,509, +3.60% from previous year)
- 2019: $228,101 (+$12,221, +5.66% from previous year)
- 2020: $228,034 (−$67, −0.03% from previous year)
- 2021: $247,144 (+$19,111, +8.38% from previous year)
- 2022: $273,006 (+$25,862, +10.46% from previous year)
- 2023: $294,252 (+$21,246, +7.78% from previous year)
- 2024: $303,298 (+$9,046, +3.07% from previous year)
- 2025: $285,178 (−$18,120, −5.97% from previous year)
Ventress home prices jumped from $183,964 in 2012 to $285,178 in 2025 — a 55% increase. Strong growth through the early 2020s was followed by a pullback in 2025, likely tied to broader market corrections.
Ventress – Lake Views and Surging Prices
Ventress is a small lakeside community on the western banks of False River in Pointe Coupee Parish. Its waterfront homes and recreational appeal have made it popular among second-home buyers and retirees, which helped drive prices upward.
The biggest increases came between 2020 and 2023, when lakeside and rural properties saw a surge in demand. Though prices cooled in 2025, the area’s natural beauty and unique inventory continue to support long-term value appreciation.
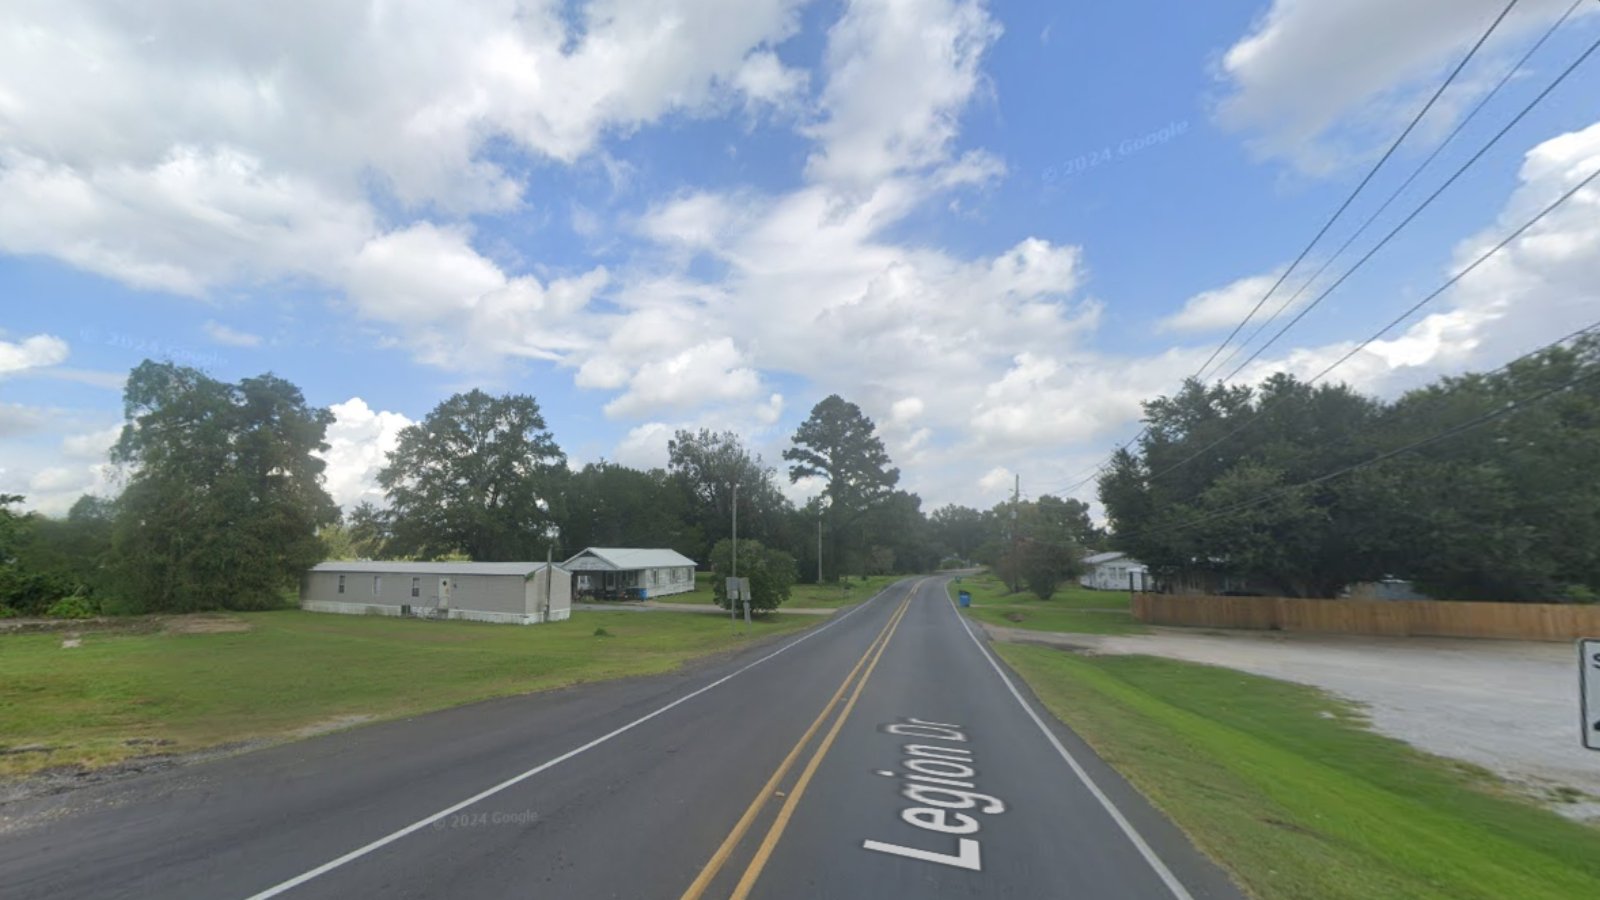
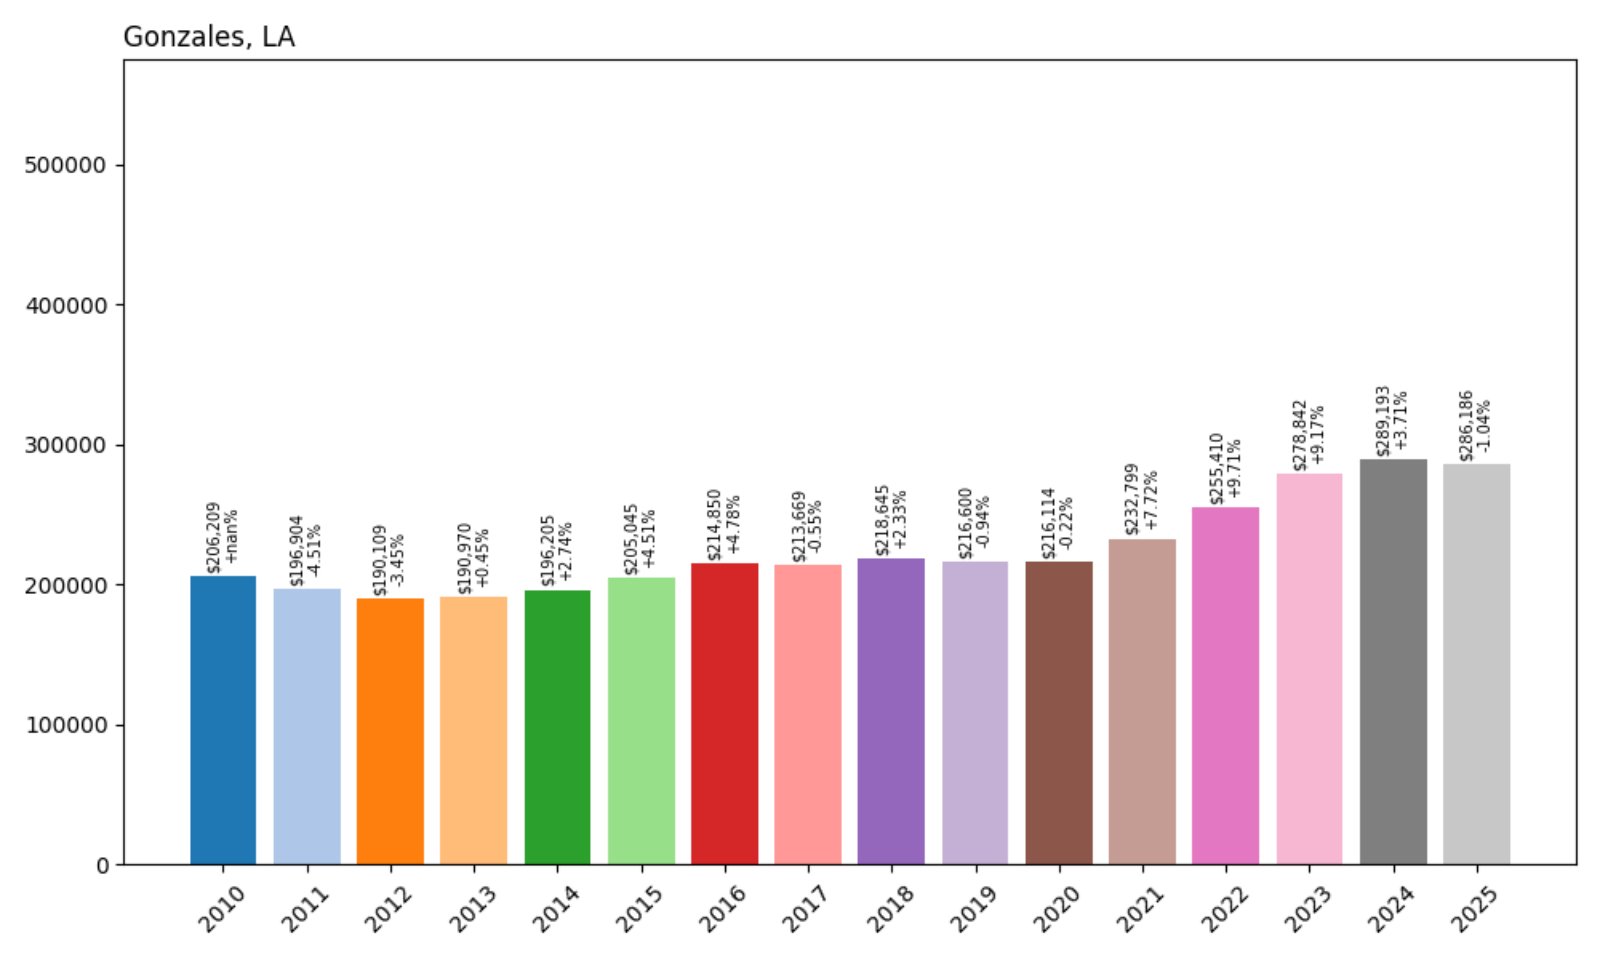
23. Gonzales – 39% Home Price Increase Since 2010
🔥 Would you like to save this?
- 2010: $206,209
- 2011: $196,904 (−$9,305, −4.51% from previous year)
- 2012: $190,109 (−$6,795, −3.45% from previous year)
- 2013: $190,970 (+$861, +0.45% from previous year)
- 2014: $196,205 (+$5,234, +2.74% from previous year)
- 2015: $205,045 (+$8,840, +4.51% from previous year)
- 2016: $214,850 (+$9,805, +4.78% from previous year)
- 2017: $213,669 (−$1,181, −0.55% from previous year)
- 2018: $218,645 (+$4,977, +2.33% from previous year)
- 2019: $216,600 (−$2,045, −0.94% from previous year)
- 2020: $216,114 (−$486, −0.22% from previous year)
- 2021: $232,799 (+$16,685, +7.72% from previous year)
- 2022: $255,410 (+$22,612, +9.71% from previous year)
- 2023: $278,842 (+$23,432, +9.17% from previous year)
- 2024: $289,193 (+$10,351, +3.71% from previous year)
- 2025: $286,186 (−$3,007, −1.04% from previous year)
Gonzales home prices have climbed from $206,209 in 2010 to $286,186 in 2025 — a 39% increase. Recent years saw especially strong gains, although 2025 marked a slight dip after a long period of steady growth.
Gonzales – Retail Hub with Steady Value
Known as the “Jambalaya Capital of the World,” Gonzales also serves as a commercial hub in Ascension Parish. Located between Baton Rouge and New Orleans, it boasts strong retail development, including Tanger Outlets and regional shopping centers.
That commercial activity supports housing demand year-round. Residential growth has followed infrastructure improvements and a thriving local economy. Even with the modest decrease in 2025, Gonzales remains one of Louisiana’s most economically dynamic towns.
22. Abita Springs – 39% Home Price Increase Since 2010
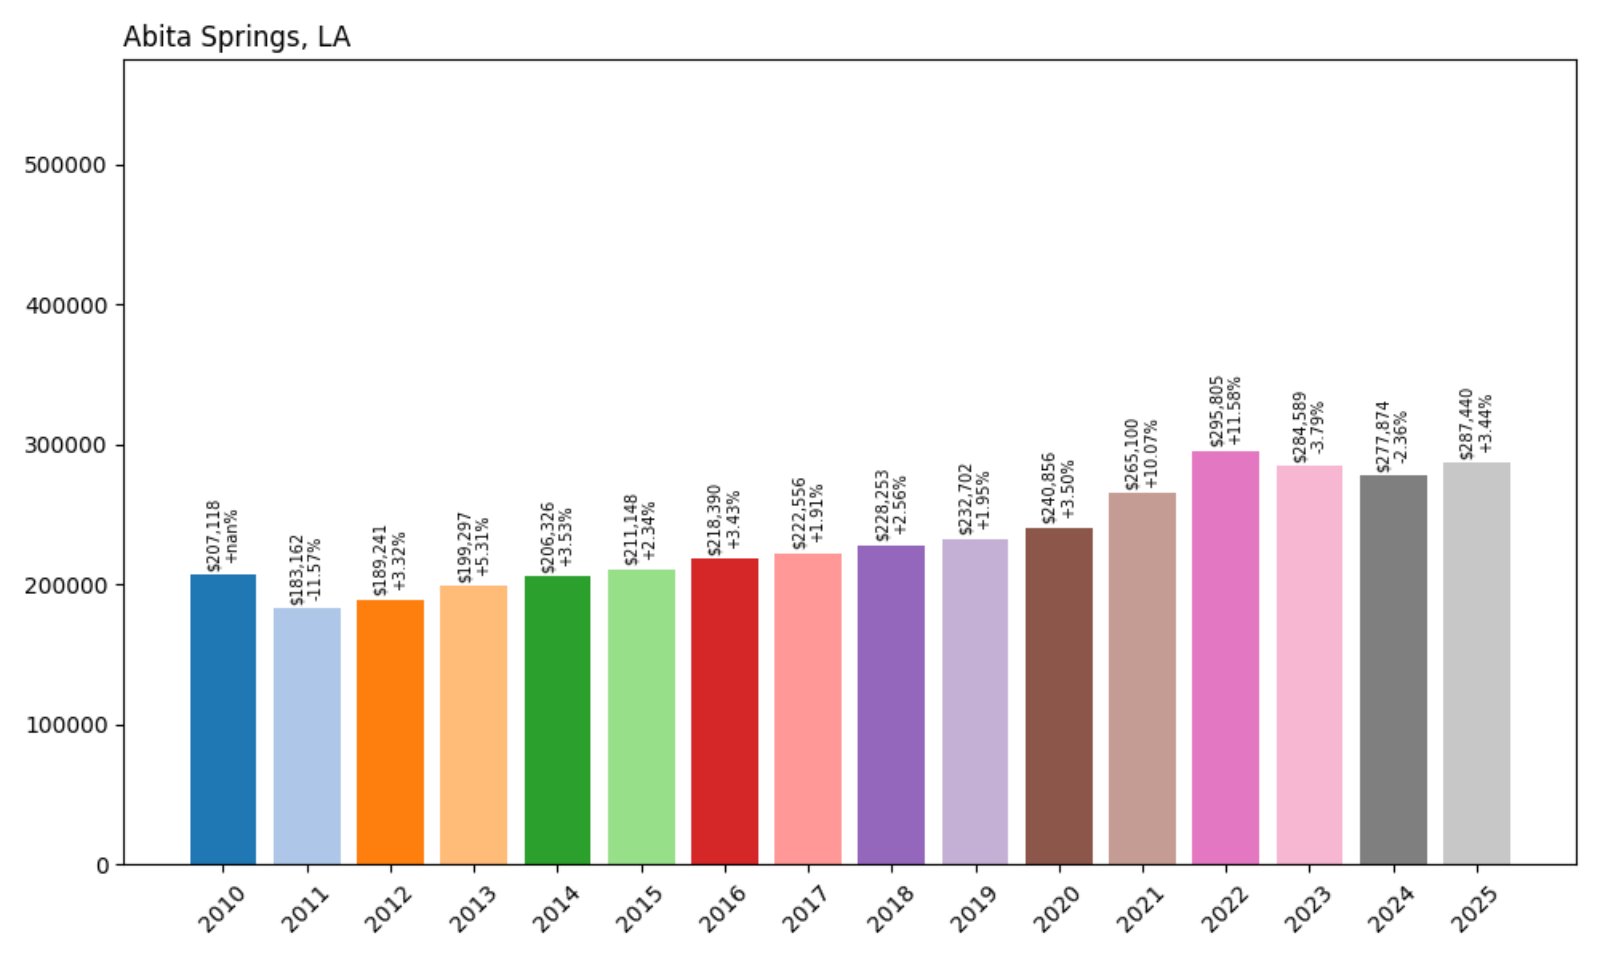
- 2010: $207,118
- 2011: $183,162 (−$23,956, −11.57% from previous year)
- 2012: $189,241 (+$6,079, +3.32% from previous year)
- 2013: $199,297 (+$10,056, +5.31% from previous year)
- 2014: $206,326 (+$7,029, +3.53% from previous year)
- 2015: $211,148 (+$4,822, +2.34% from previous year)
- 2016: $218,390 (+$7,242, +3.43% from previous year)
- 2017: $222,556 (+$4,166, +1.91% from previous year)
- 2018: $228,253 (+$5,697, +2.56% from previous year)
- 2019: $232,702 (+$4,450, +1.95% from previous year)
- 2020: $240,856 (+$8,154, +3.50% from previous year)
- 2021: $265,100 (+$24,244, +10.07% from previous year)
- 2022: $295,805 (+$30,704, +11.58% from previous year)
- 2023: $284,589 (−$11,215, −3.79% from previous year)
- 2024: $277,874 (−$6,716, −2.36% from previous year)
- 2025: $287,440 (+$9,566, +3.44% from previous year)
Abita Springs has seen its home values grow from $207,118 in 2010 to $287,440 in 2025 — a 39% increase. The town saw especially sharp appreciation during the 2020–2022 boom, followed by modest corrections and a rebound in 2025.
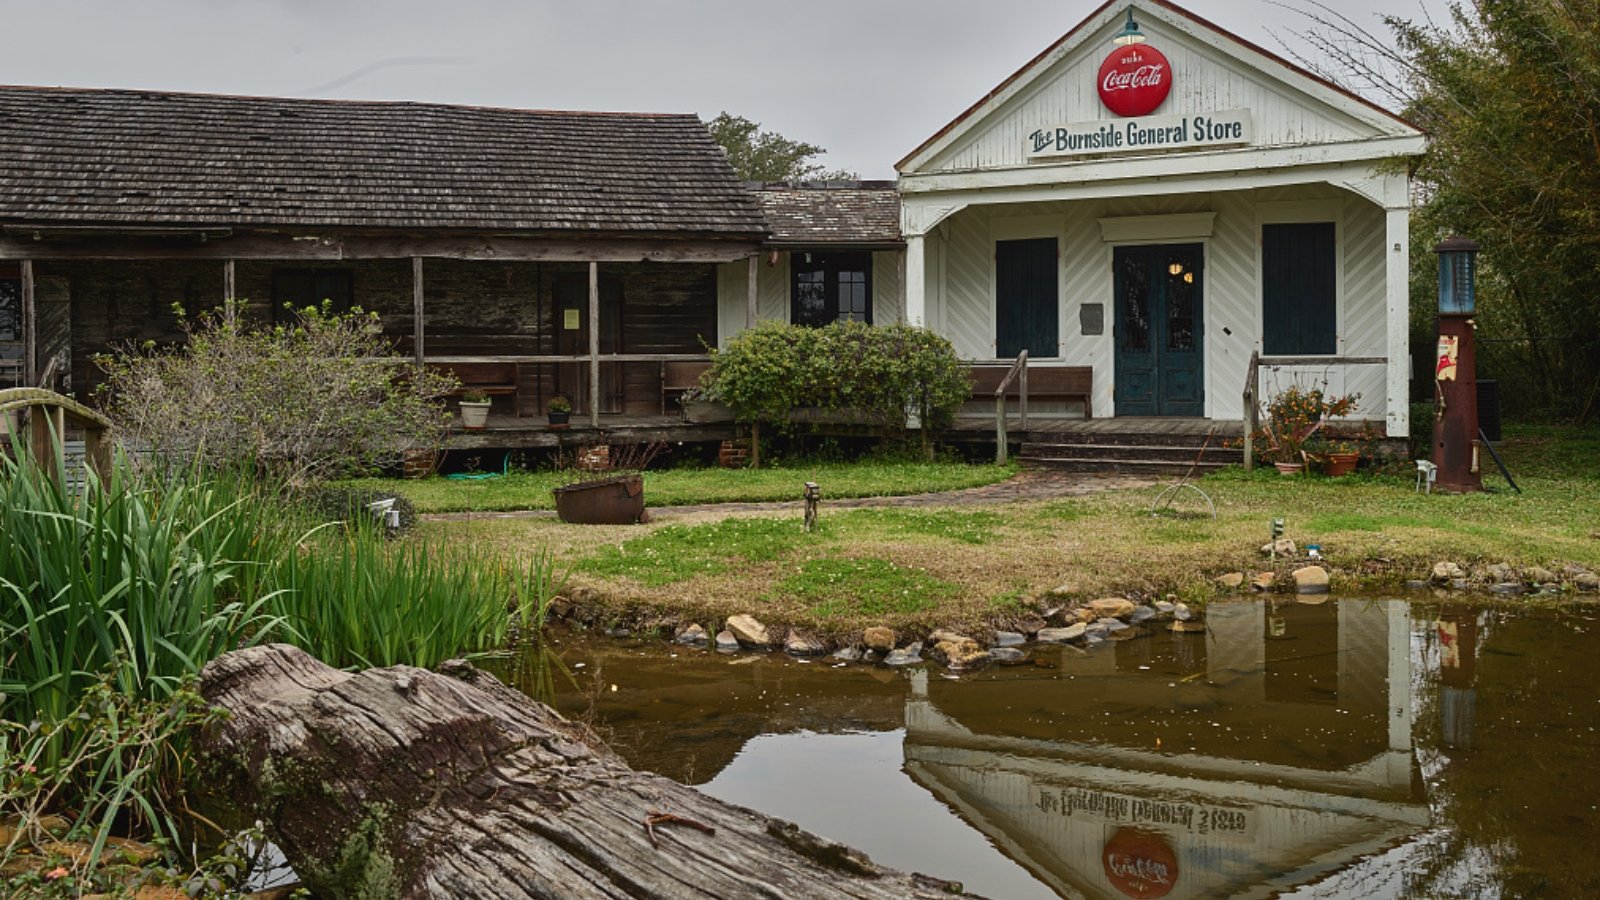
Abita Springs – Artsy Vibes Meet Solid Returns
This small town on the Northshore of Lake Pontchartrain is beloved for its artistic culture, local brewery, and weekly farmers market. Abita Springs offers walkability, charm, and access to Tammany Trace, making it a popular destination for homebuyers seeking lifestyle alongside value.
Its mid-2020s price dip was common across the region but was followed by a solid bounce in 2025. Demand remains strong among retirees and young families alike, helping maintain its position in the top tier of Louisiana’s real estate markets.
21. Destrehan – 62% Home Price Increase Since 2010
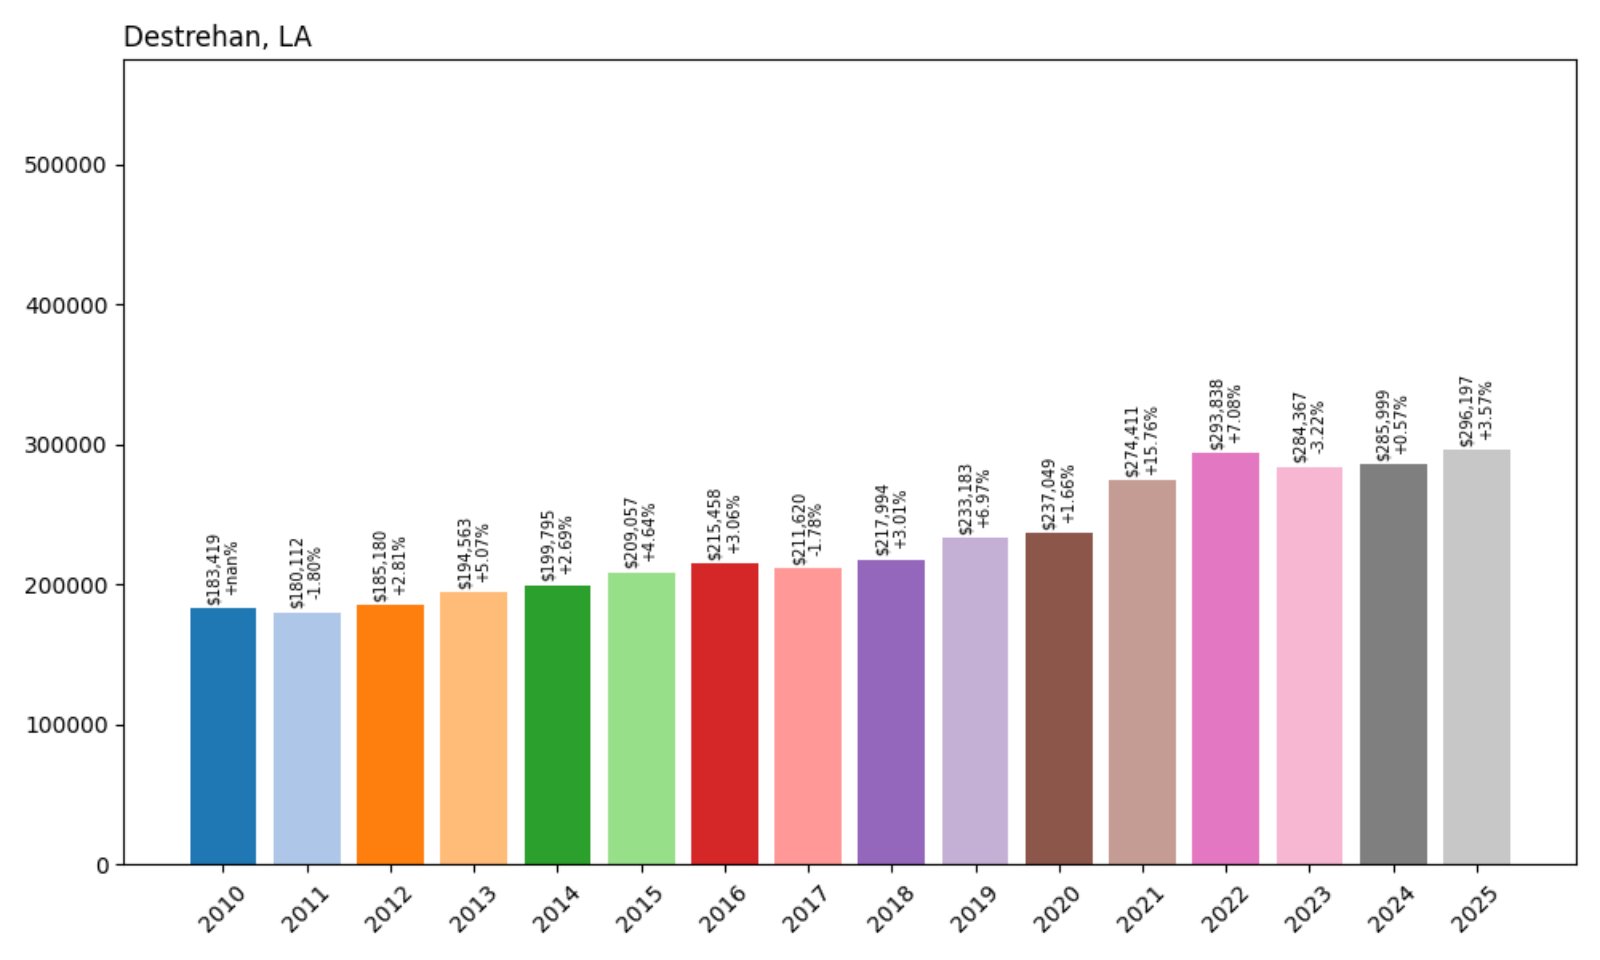
- 2010: $183,419
- 2011: $180,112 (−$3,307, −1.80% from previous year)
- 2012: $185,180 (+$5,068, +2.81% from previous year)
- 2013: $194,563 (+$9,383, +5.07% from previous year)
- 2014: $199,795 (+$5,231, +2.69% from previous year)
- 2015: $209,057 (+$9,262, +4.64% from previous year)
- 2016: $215,458 (+$6,401, +3.06% from previous year)
- 2017: $211,620 (−$3,837, −1.78% from previous year)
- 2018: $217,994 (+$6,373, +3.01% from previous year)
- 2019: $233,183 (+$15,189, +6.97% from previous year)
- 2020: $237,049 (+$3,866, +1.66% from previous year)
- 2021: $274,411 (+$37,363, +15.76% from previous year)
- 2022: $293,838 (+$19,427, +7.08% from previous year)
- 2023: $284,367 (−$9,471, −3.22% from previous year)
- 2024: $285,999 (+$1,632, +0.57% from previous year)
- 2025: $296,197 (+$10,198, +3.57% from previous year)
Destrehan’s home values grew from $183,419 in 2010 to $296,197 in 2025 — a substantial 62% increase. After a steep gain in 2021, the market cooled briefly but has begun climbing again.
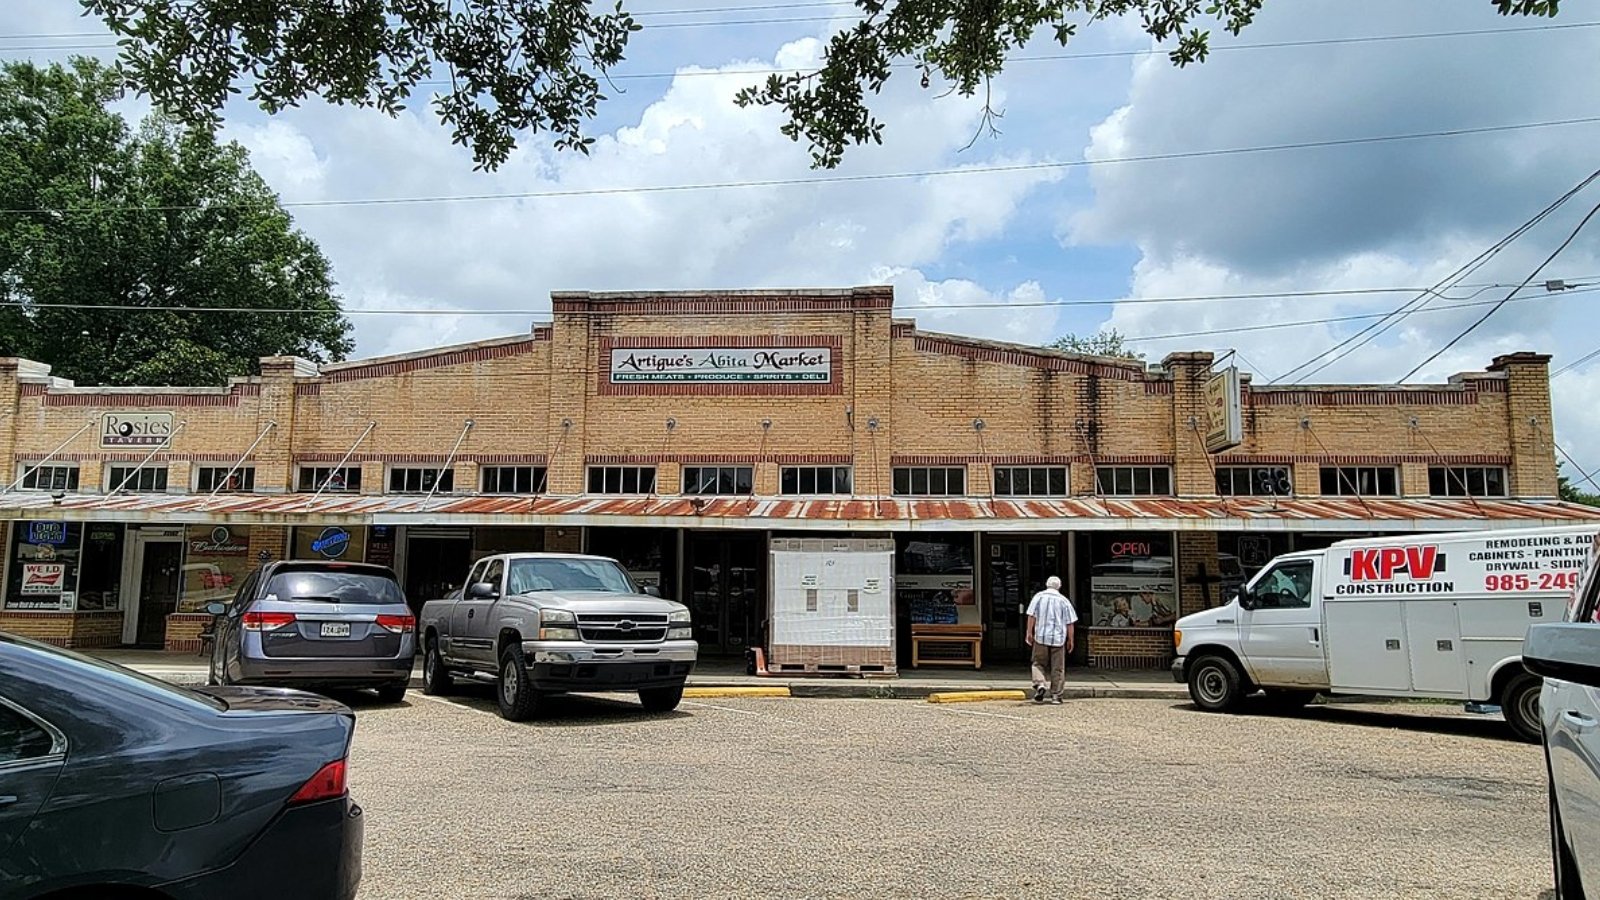
Destrehan – River Suburb With Rising Demand
Located in St. Charles Parish, Destrehan is a bedroom community along the Mississippi River, just 20 miles west of New Orleans. Known for excellent public schools and low crime rates, it consistently attracts families looking for stability and a suburban feel.
The housing market surged in 2021, with values jumping more than 15%. While prices dipped slightly in 2023, they rebounded in the two years since. Its proximity to job hubs and steady infrastructure improvements have helped keep Destrehan high on the list of desirable places to live in Southeast Louisiana.
20. Oscar – 34% Home Price Increase Since 2017
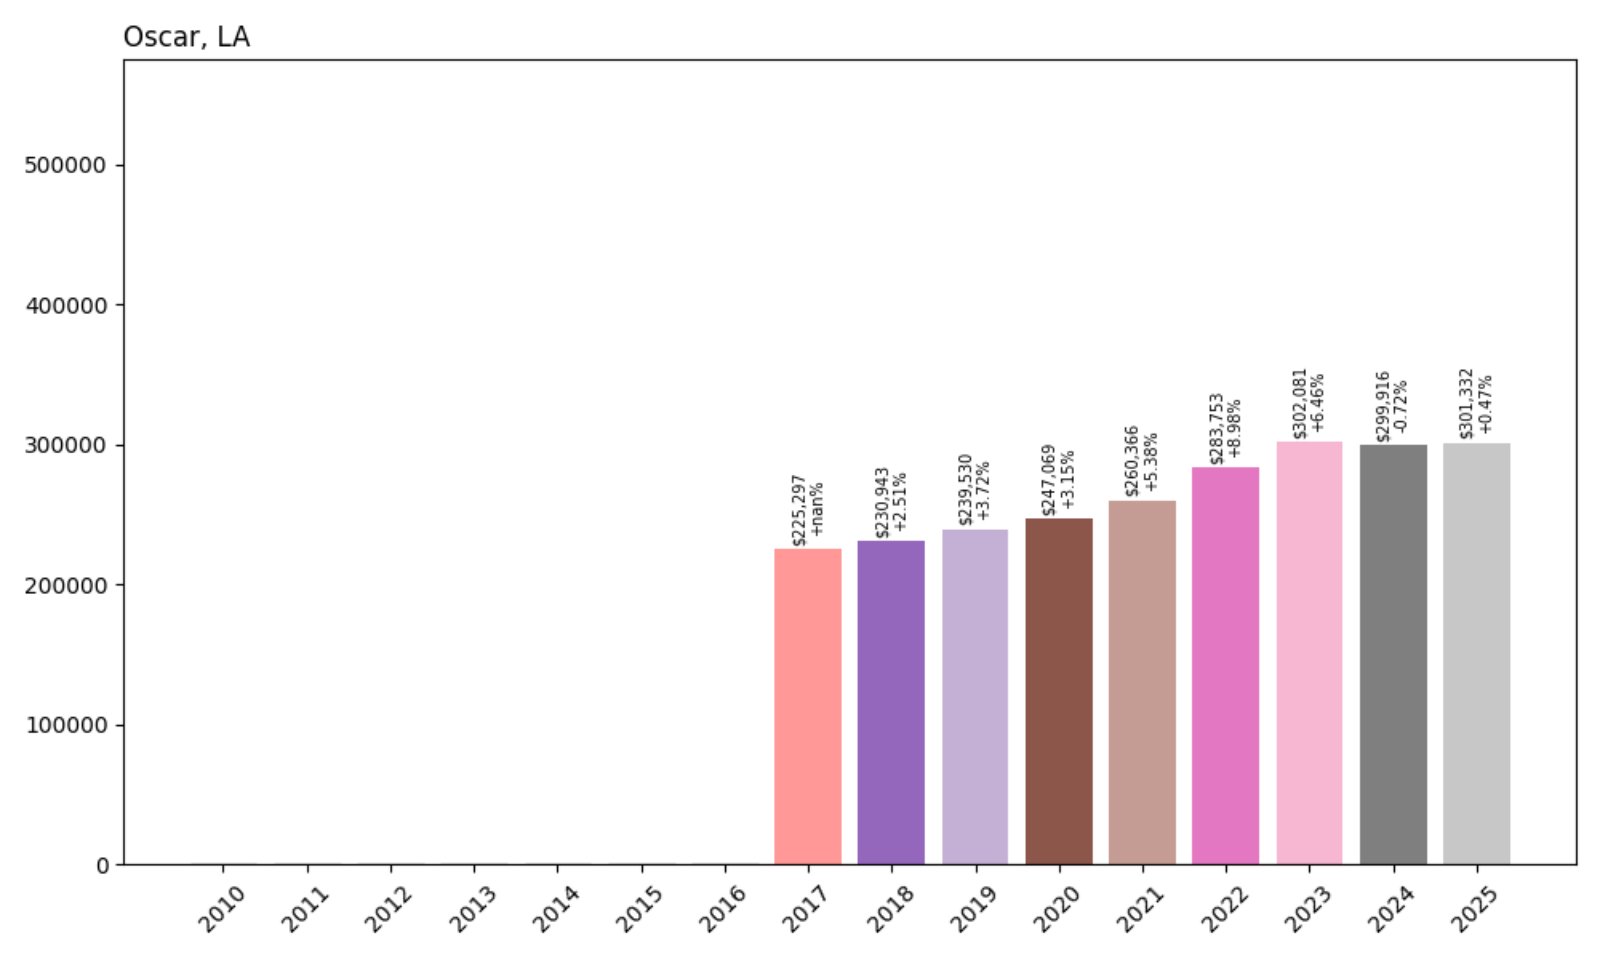
- 2017: $225,297
- 2018: $230,943 (+$5,646, +2.51% from previous year)
- 2019: $239,530 (+$8,587, +3.72% from previous year)
- 2020: $247,069 (+$7,539, +3.15% from previous year)
- 2021: $260,366 (+$13,297, +5.38% from previous year)
- 2022: $283,753 (+$23,387, +8.98% from previous year)
- 2023: $302,081 (+$18,328, +6.46% from previous year)
- 2024: $299,916 (−$2,164, −0.72% from previous year)
- 2025: $301,332 (+$1,416, +0.47% from previous year)
Oscar’s home prices rose from $225,297 in 2017 to $301,332 in 2025, a 34% gain in just eight years. The town experienced consistent growth from 2017 through 2023, with a slight dip in 2024 and a modest recovery in 2025.
Oscar – Quiet Lake Living With Strong Upside
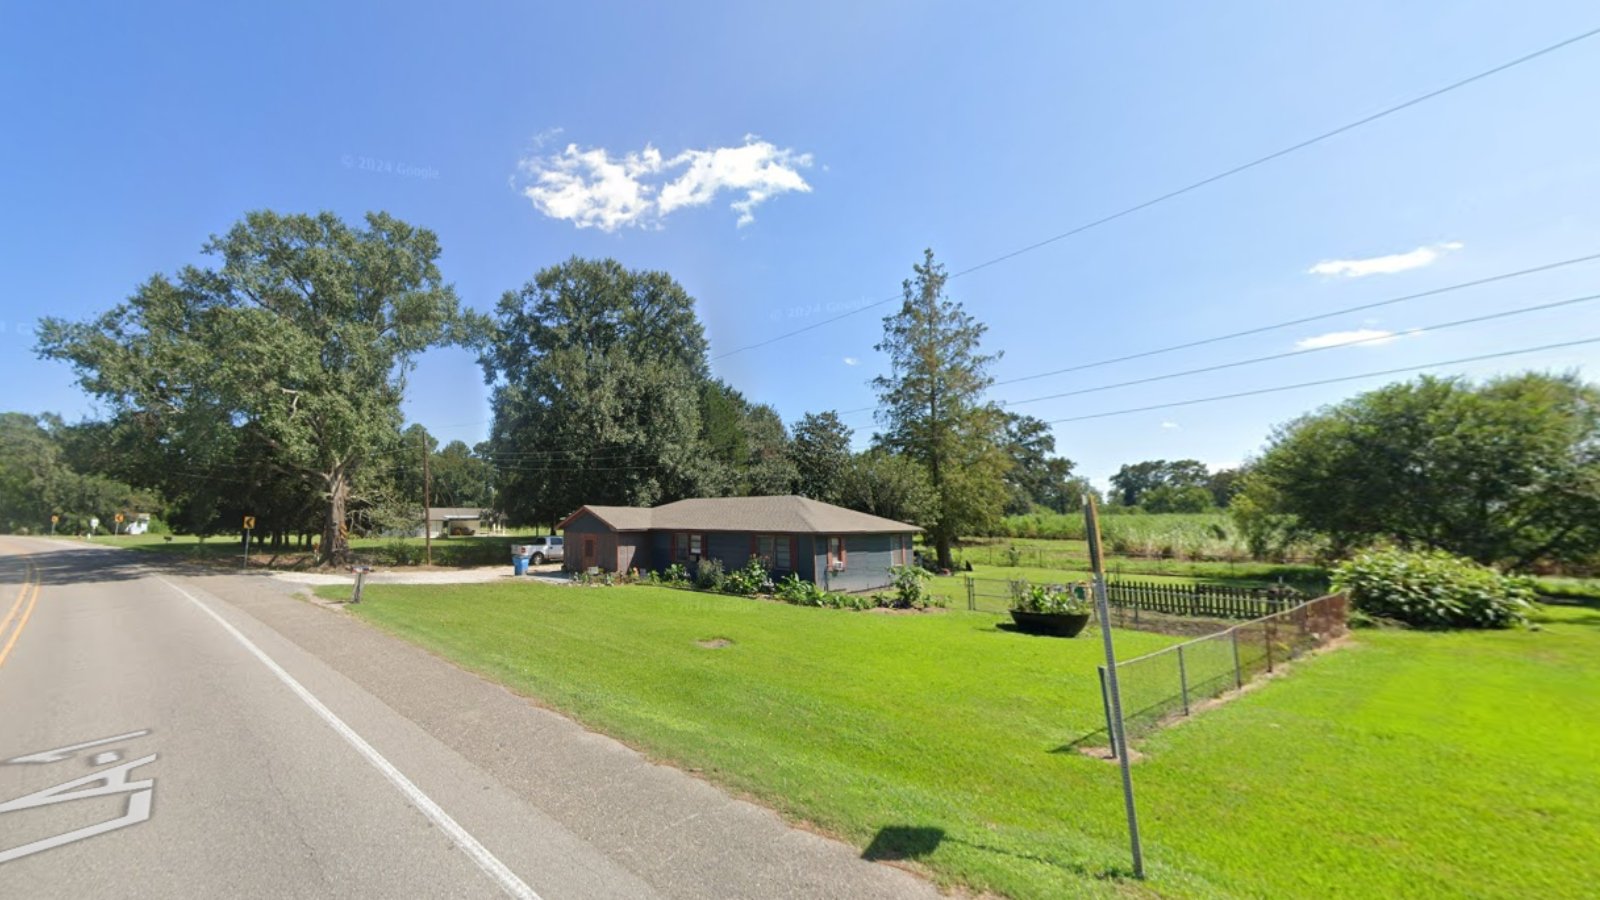
Oscar is a lakeside community in Pointe Coupee Parish, offering residents peaceful living near False River. The area appeals to both year-round residents and second-home buyers who value waterfront access and a slower pace of life.
Oscar’s rise in value over the past decade reflects increased demand for rural properties with lifestyle appeal. While the market has cooled slightly in recent years, the overall trajectory remains upward thanks to its location and unique housing stock.
19. Paulina – 15% Home Price Increase Since 2020
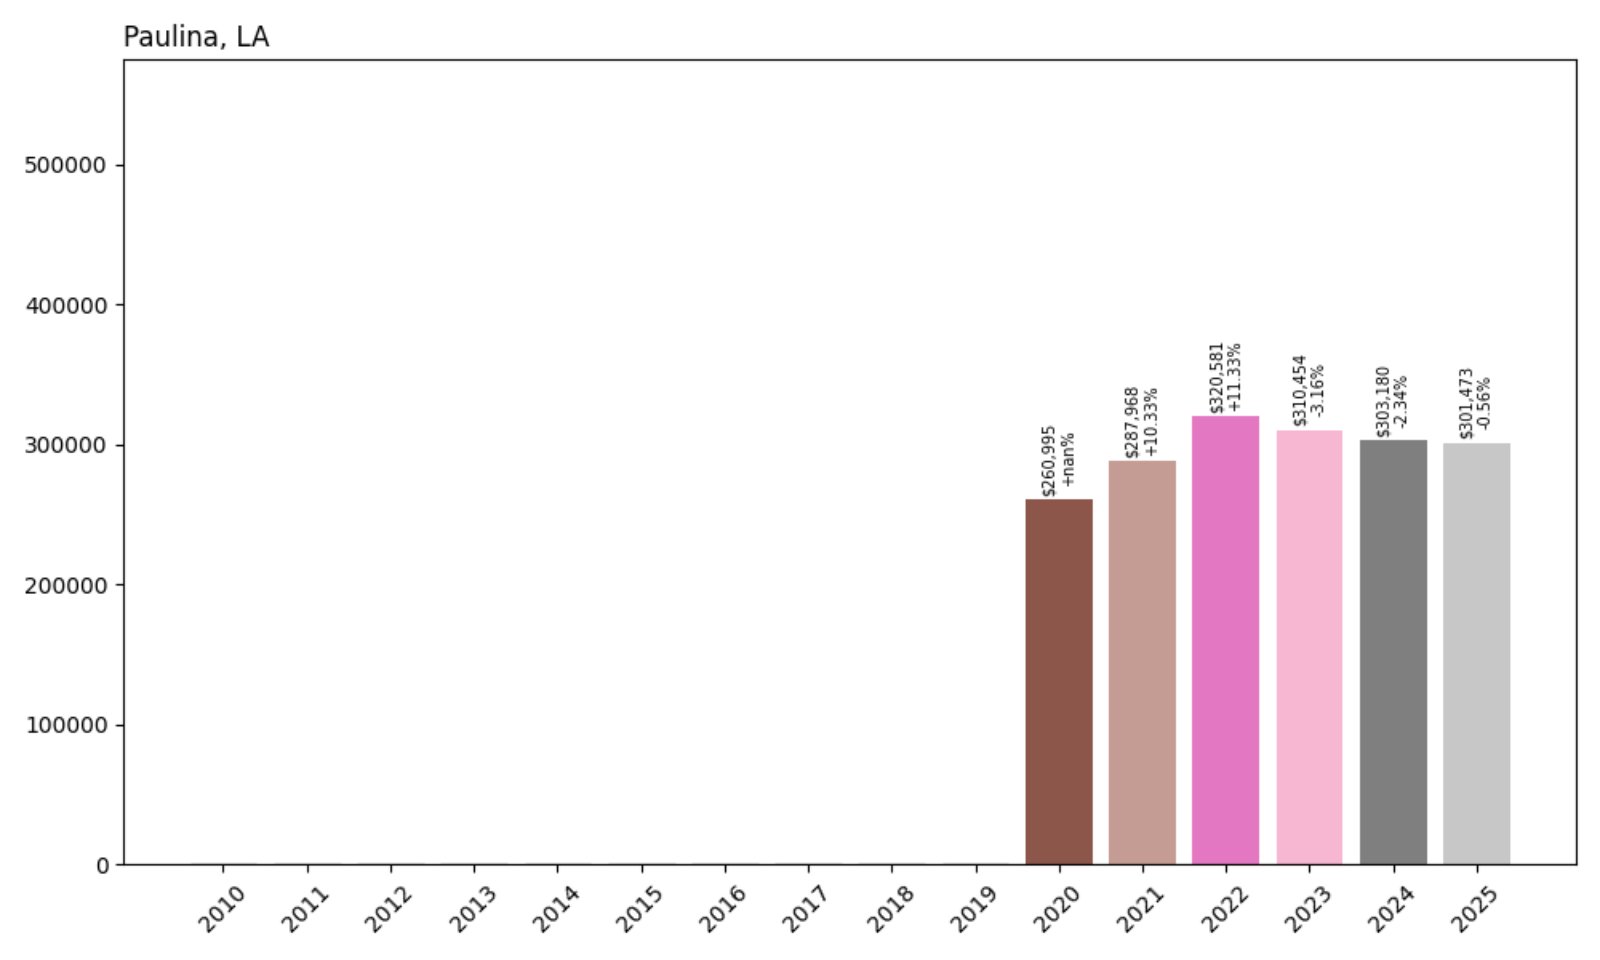
- 2020: $260,995
- 2021: $287,968 (+$26,972, +10.33% from previous year)
- 2022: $320,581 (+$32,613, +11.33% from previous year)
- 2023: $310,454 (−$10,127, −3.16% from previous year)
- 2024: $303,180 (−$7,273, −2.34% from previous year)
- 2025: $301,473 (−$1,707, −0.56% from previous year)
Paulina’s home values increased from $260,995 in 2020 to $301,473 in 2025 — a 15% rise. After a surge through 2022, the market dipped in the following three years but remains above pre-pandemic levels.
Paulina – Strong Pandemic-Era Gains Hold Ground
🔥 Would you like to save this?
Nestled along the east bank of the Mississippi River in St. James Parish, Paulina offers quiet streets and a rural setting. The community benefits from its central location between Baton Rouge and New Orleans, drawing commuters and long-time locals alike.
Though prices have cooled since their 2022 peak, Paulina’s housing market still sits significantly higher than it did in 2020. Many homes offer larger lots and river proximity, which have helped maintain buyer interest even amid recent corrections.
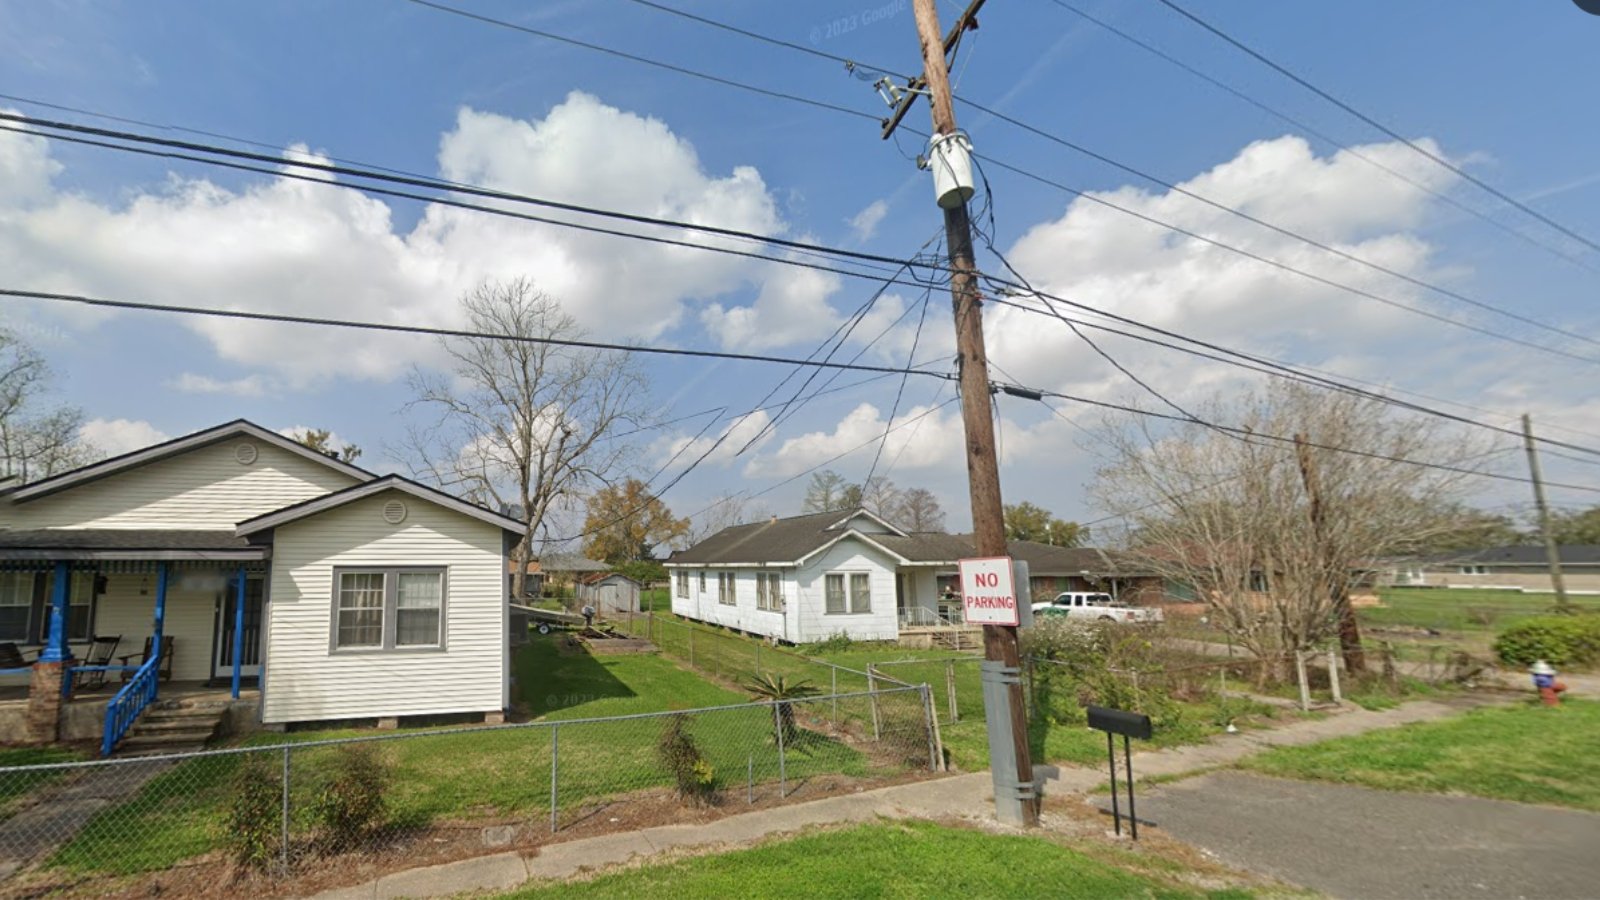
18. Folsom – 24% Home Price Increase Since 2010
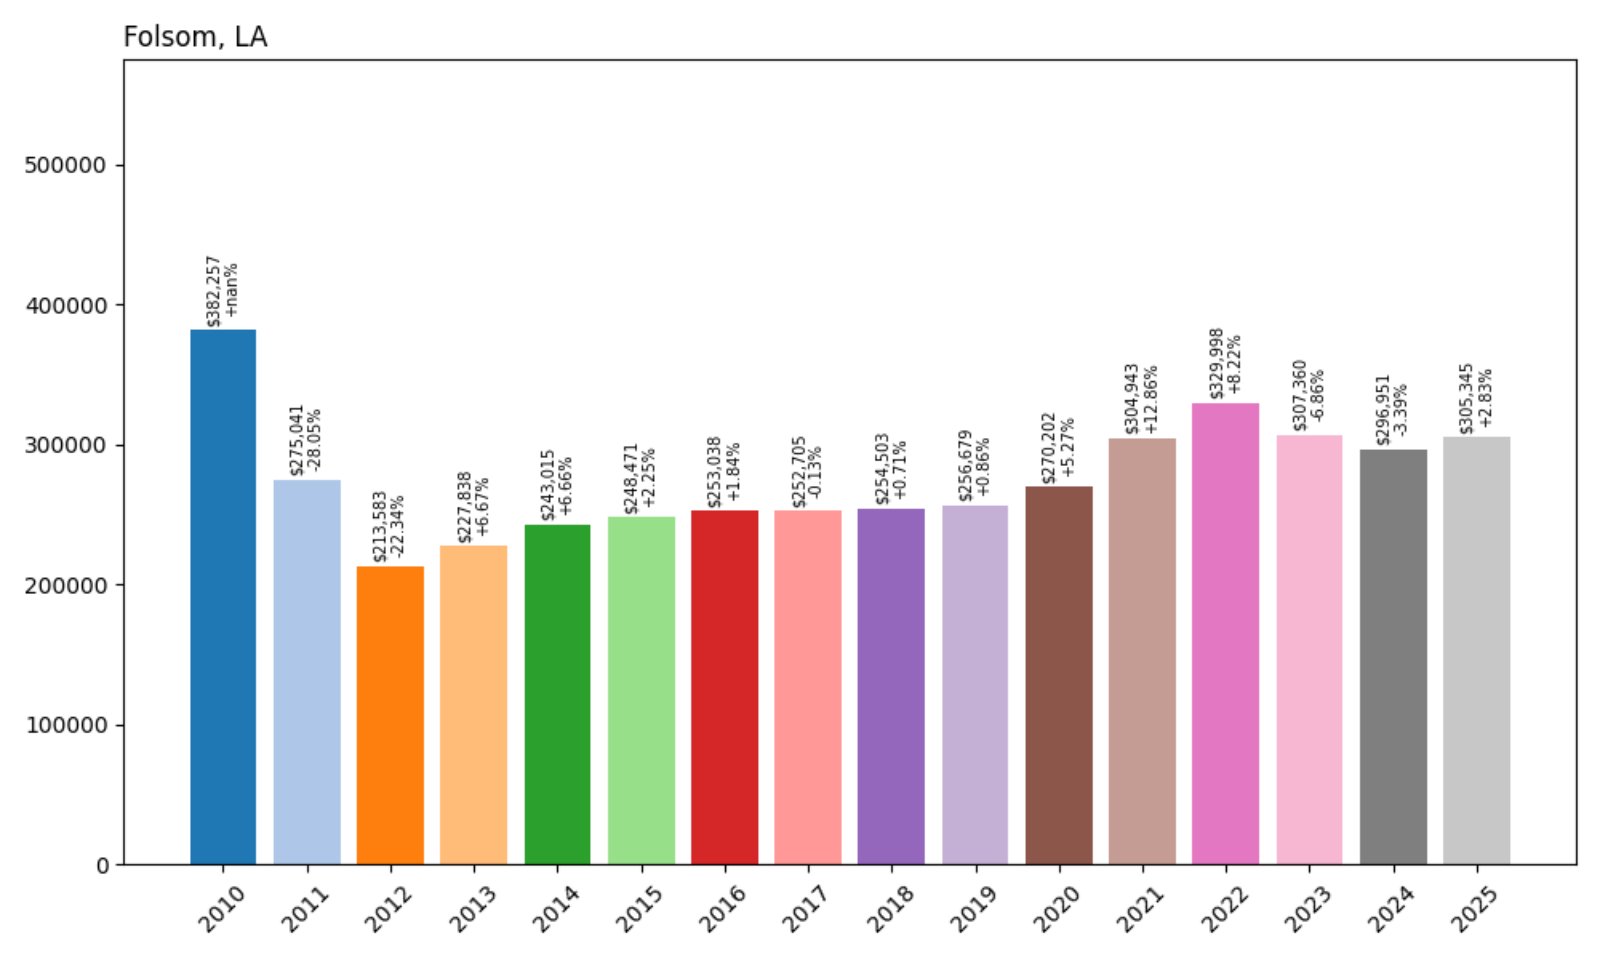
- 2010: $382,257
- 2011: $275,041 (−$107,215, −28.05% from previous year)
- 2012: $213,583 (−$61,458, −22.34% from previous year)
- 2013: $227,838 (+$14,255, +6.67% from previous year)
- 2014: $243,015 (+$15,177, +6.66% from previous year)
- 2015: $248,471 (+$5,456, +2.25% from previous year)
- 2016: $253,038 (+$4,567, +1.84% from previous year)
- 2017: $252,705 (−$332, −0.13% from previous year)
- 2018: $254,503 (+$1,797, +0.71% from previous year)
- 2019: $256,679 (+$2,177, +0.86% from previous year)
- 2020: $270,202 (+$13,523, +5.27% from previous year)
- 2021: $304,943 (+$34,740, +12.86% from previous year)
- 2022: $329,998 (+$25,056, +8.22% from previous year)
- 2023: $307,360 (−$22,638, −6.86% from previous year)
- 2024: $296,951 (−$10,409, −3.39% from previous year)
- 2025: $305,345 (+$8,394, +2.83% from previous year)
Folsom’s values fell sharply in the early 2010s, dropping from $382,257 in 2010 to $213,583 in 2012. Since then, the town has rebounded steadily, ending 2025 at $305,345 — a 24% gain over 15 years.
Folsom – A Recovery Story in the Pines
Folsom, located in northern St. Tammany Parish, is a small town known for its rolling hills, equestrian culture, and proximity to nature preserves. After a dramatic market correction in the early 2010s, the town has made a gradual but determined comeback.
Recent growth peaked in 2021–2022, followed by two years of market softening. Still, the town’s rural charm and appeal to hobby farmers, artists, and retirees have helped prices recover significantly from their lows. It remains one of the most distinctive rural housing markets in the state.
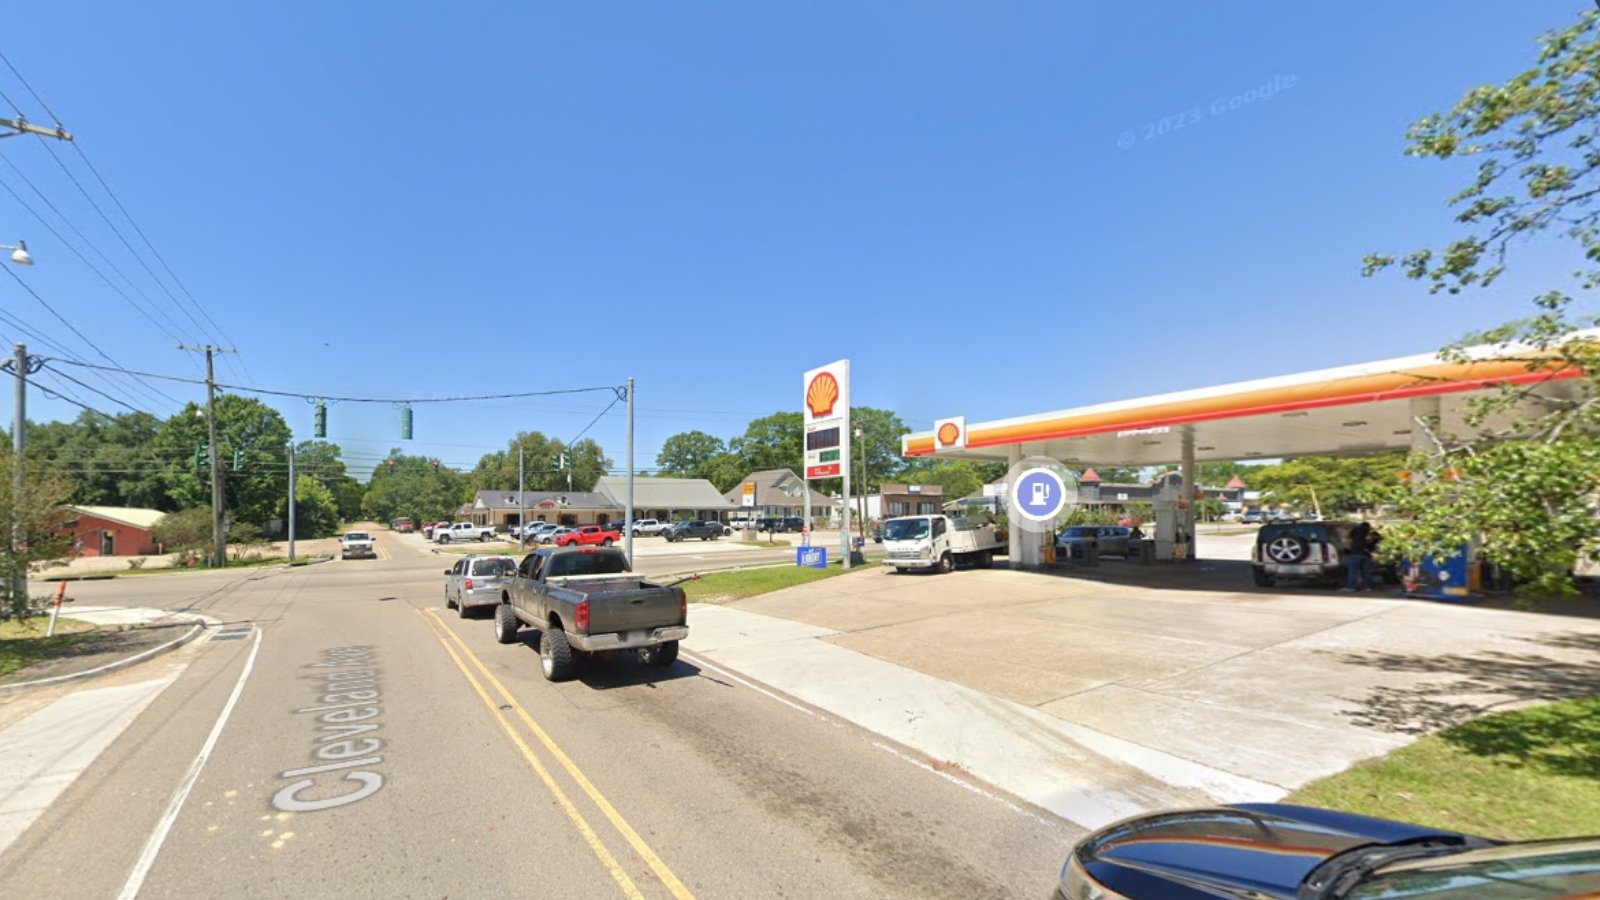
17. Harahan – 16% Home Price Increase Since 2010
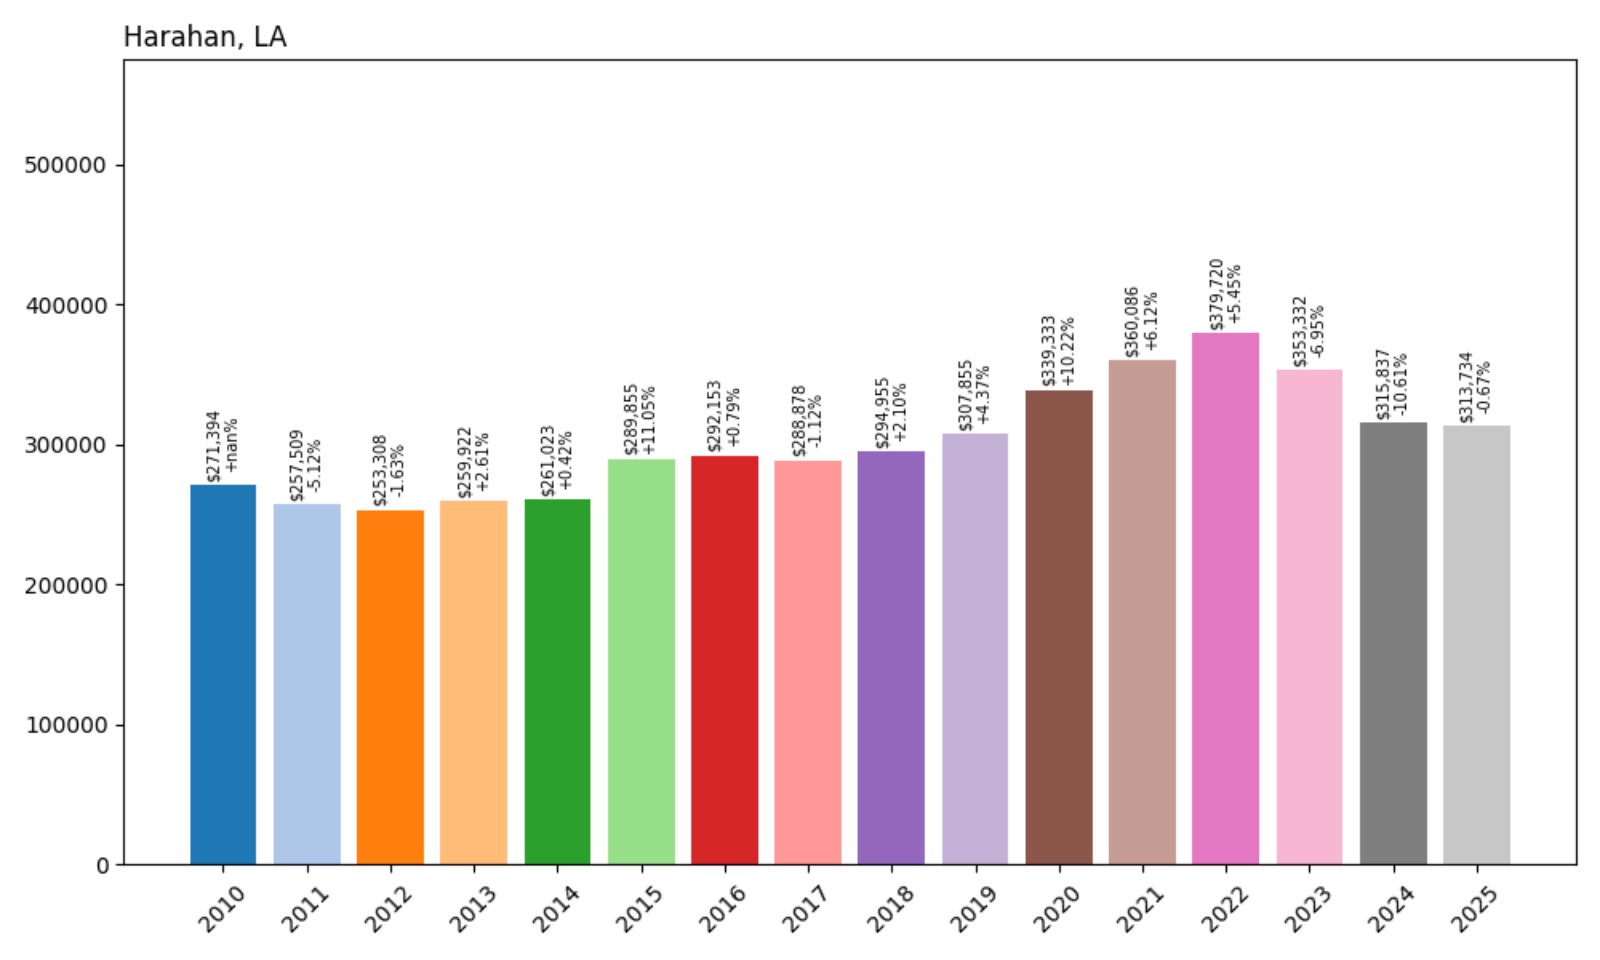
- 2010: $271,394
- 2011: $257,509 (−$13,884, −5.12% from previous year)
- 2012: $253,308 (−$4,201, −1.63% from previous year)
- 2013: $259,922 (+$6,614, +2.61% from previous year)
- 2014: $261,023 (+$1,102, +0.42% from previous year)
- 2015: $289,855 (+$28,832, +11.05% from previous year)
- 2016: $292,153 (+$2,298, +0.79% from previous year)
- 2017: $288,878 (−$3,275, −1.12% from previous year)
- 2018: $294,955 (+$6,077, +2.10% from previous year)
- 2019: $307,855 (+$12,900, +4.37% from previous year)
- 2020: $339,333 (+$31,478, +10.22% from previous year)
- 2021: $360,086 (+$20,753, +6.12% from previous year)
- 2022: $379,720 (+$19,634, +5.45% from previous year)
- 2023: $353,332 (−$26,388, −6.95% from previous year)
- 2024: $315,837 (−$37,495, −10.61% from previous year)
- 2025: $313,734 (−$2,103, −0.67% from previous year)
Harahan’s home prices grew from $271,394 in 2010 to $313,734 in 2025 — a modest 16% increase. Values peaked in 2022 before declining for three straight years, placing the town in a transitional phase.
Harahan – Proximity to New Orleans, With Price Pressures
Harahan is a small city in Jefferson Parish just outside New Orleans, offering residents a suburban lifestyle within minutes of the city core. With access to major thoroughfares and shopping centers, it has long been a solid choice for commuters.
Though values increased significantly between 2020 and 2022, the sharp decline in 2023 and 2024 indicates a cooling market. Rising insurance costs and flood zone concerns may be affecting price trends here, even as demand remains steady.
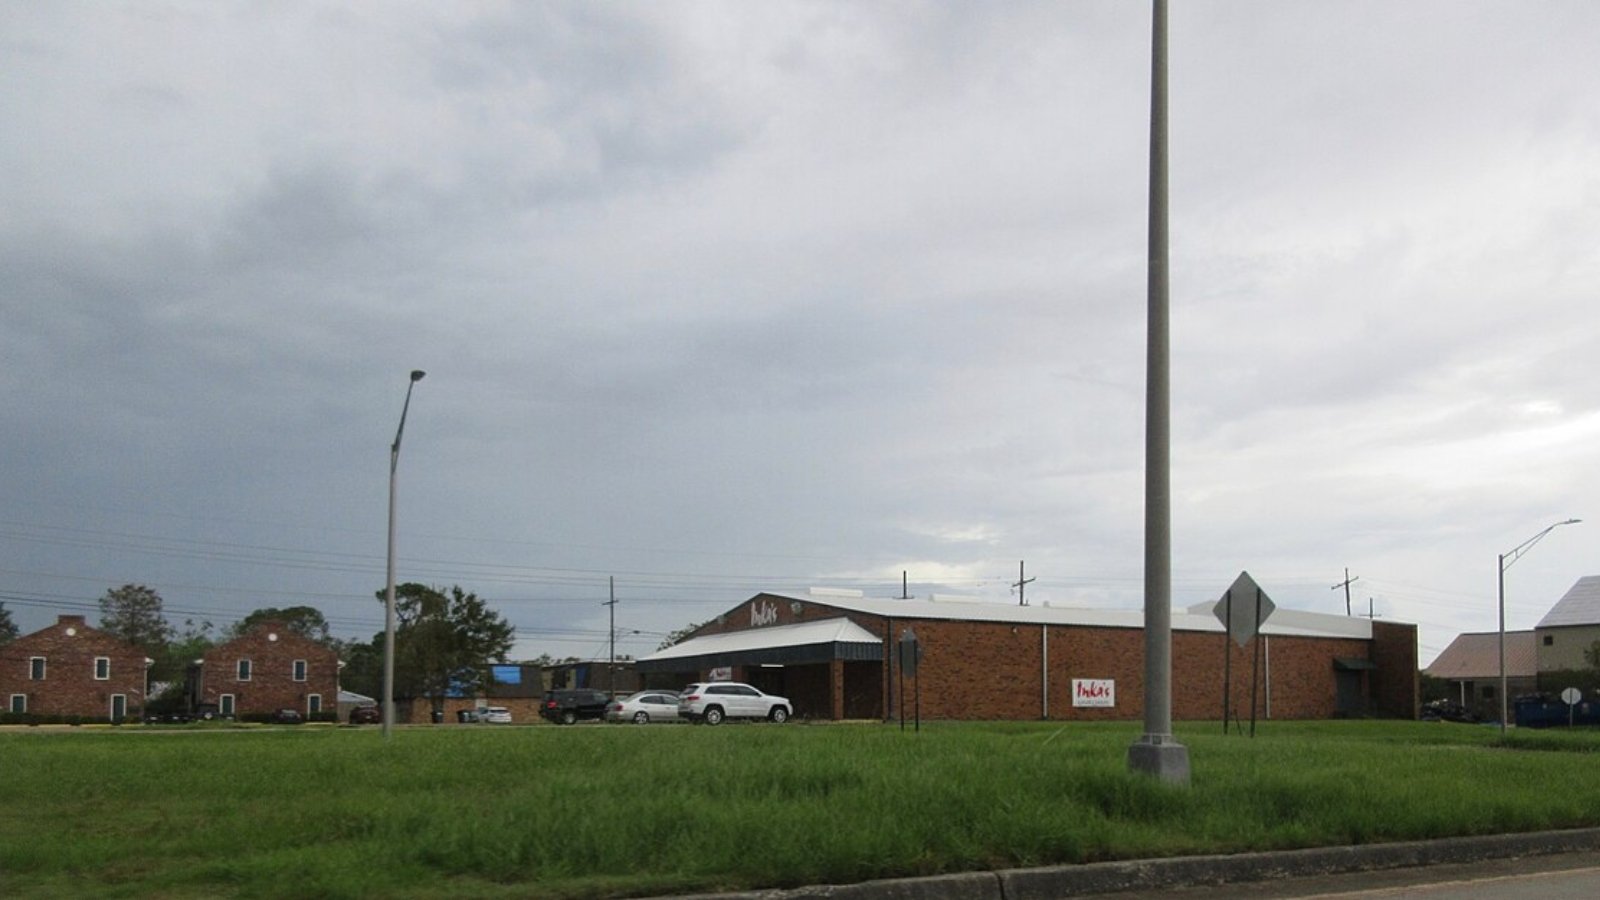
16. Sorrento – 47% Home Price Increase Since 2010
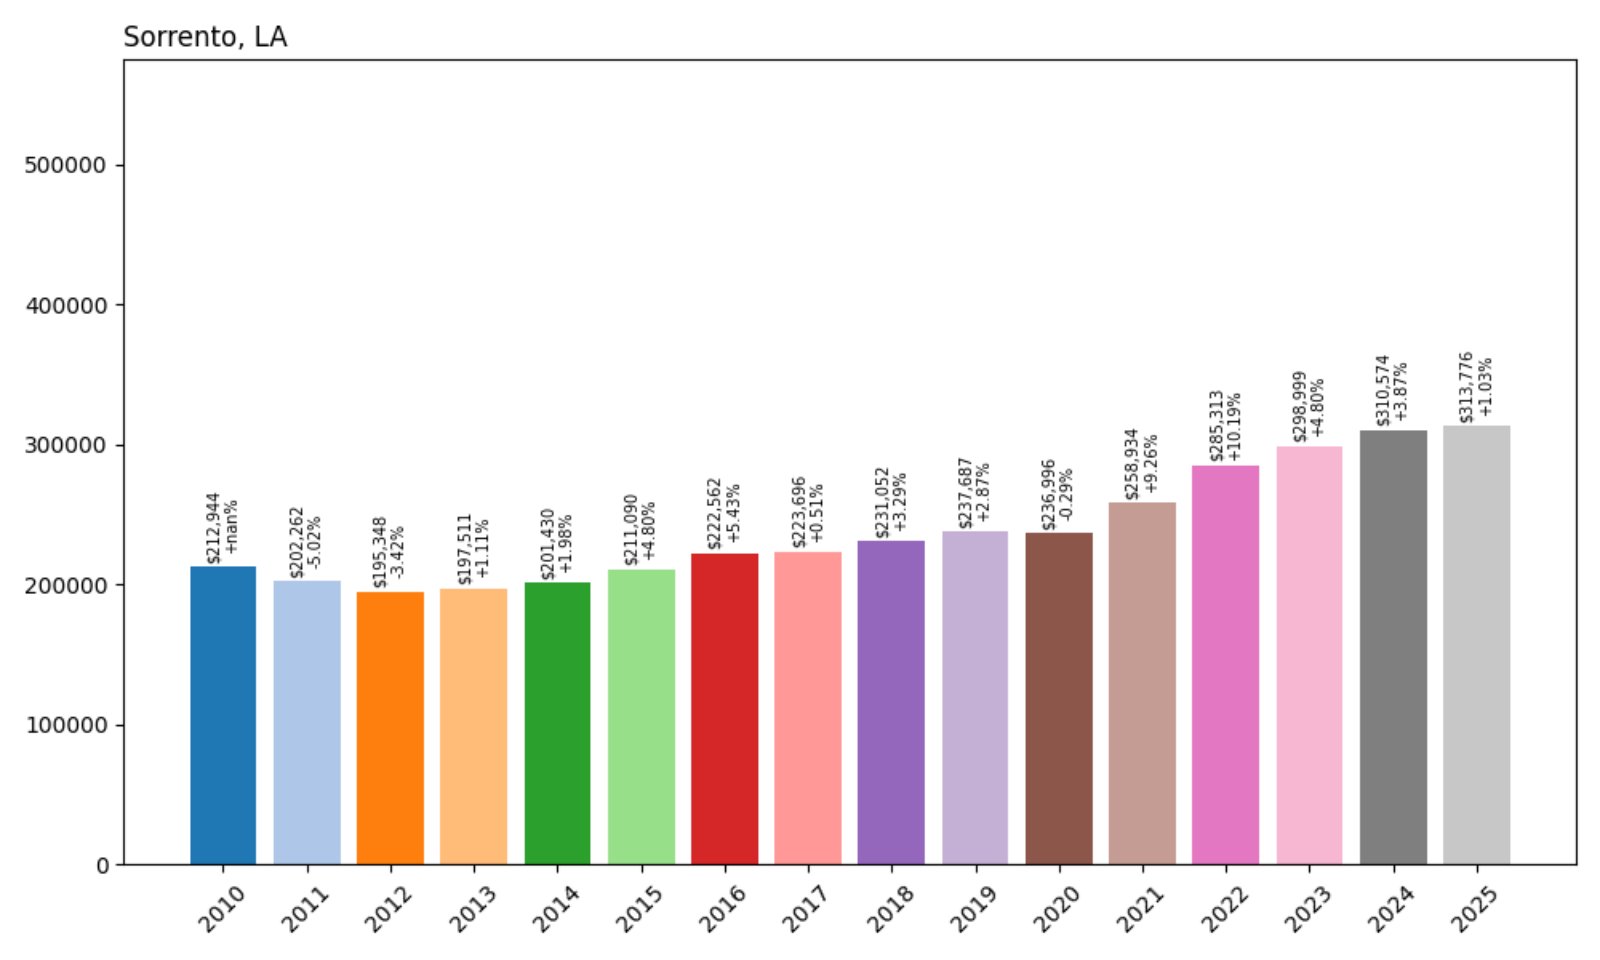
- 2010: $212,944
- 2011: $202,262 (−$10,683, −5.02% from previous year)
- 2012: $195,348 (−$6,914, −3.42% from previous year)
- 2013: $197,511 (+$2,163, +1.11% from previous year)
- 2014: $201,430 (+$3,919, +1.98% from previous year)
- 2015: $211,090 (+$9,659, +4.80% from previous year)
- 2016: $222,562 (+$11,473, +5.43% from previous year)
- 2017: $223,696 (+$1,133, +0.51% from previous year)
- 2018: $231,052 (+$7,357, +3.29% from previous year)
- 2019: $237,687 (+$6,635, +2.87% from previous year)
- 2020: $236,996 (−$691, −0.29% from previous year)
- 2021: $258,934 (+$21,938, +9.26% from previous year)
- 2022: $285,313 (+$26,379, +10.19% from previous year)
- 2023: $298,999 (+$13,687, +4.80% from previous year)
- 2024: $310,574 (+$11,574, +3.87% from previous year)
- 2025: $313,776 (+$3,202, +1.03% from previous year)
Sorrento’s home prices rose from $212,944 in 2010 to $313,776 in 2025 — a 47% increase. Growth accelerated notably after 2020, with prices gaining momentum and continuing upward through 2025.
Sorrento – Quiet and Growing in Ascension Parish
Sorrento is a small town in Ascension Parish that sits between Gonzales and Baton Rouge. With easy access to I-10, it’s well-situated for commuters but maintains a rural, low-key character that appeals to many buyers seeking space and affordability.
Recent years have brought steady growth to the area, especially as surrounding towns have become more expensive. With newer subdivisions and proximity to growing employment centers, Sorrento has benefitted from spillover demand without losing its small-town appeal.
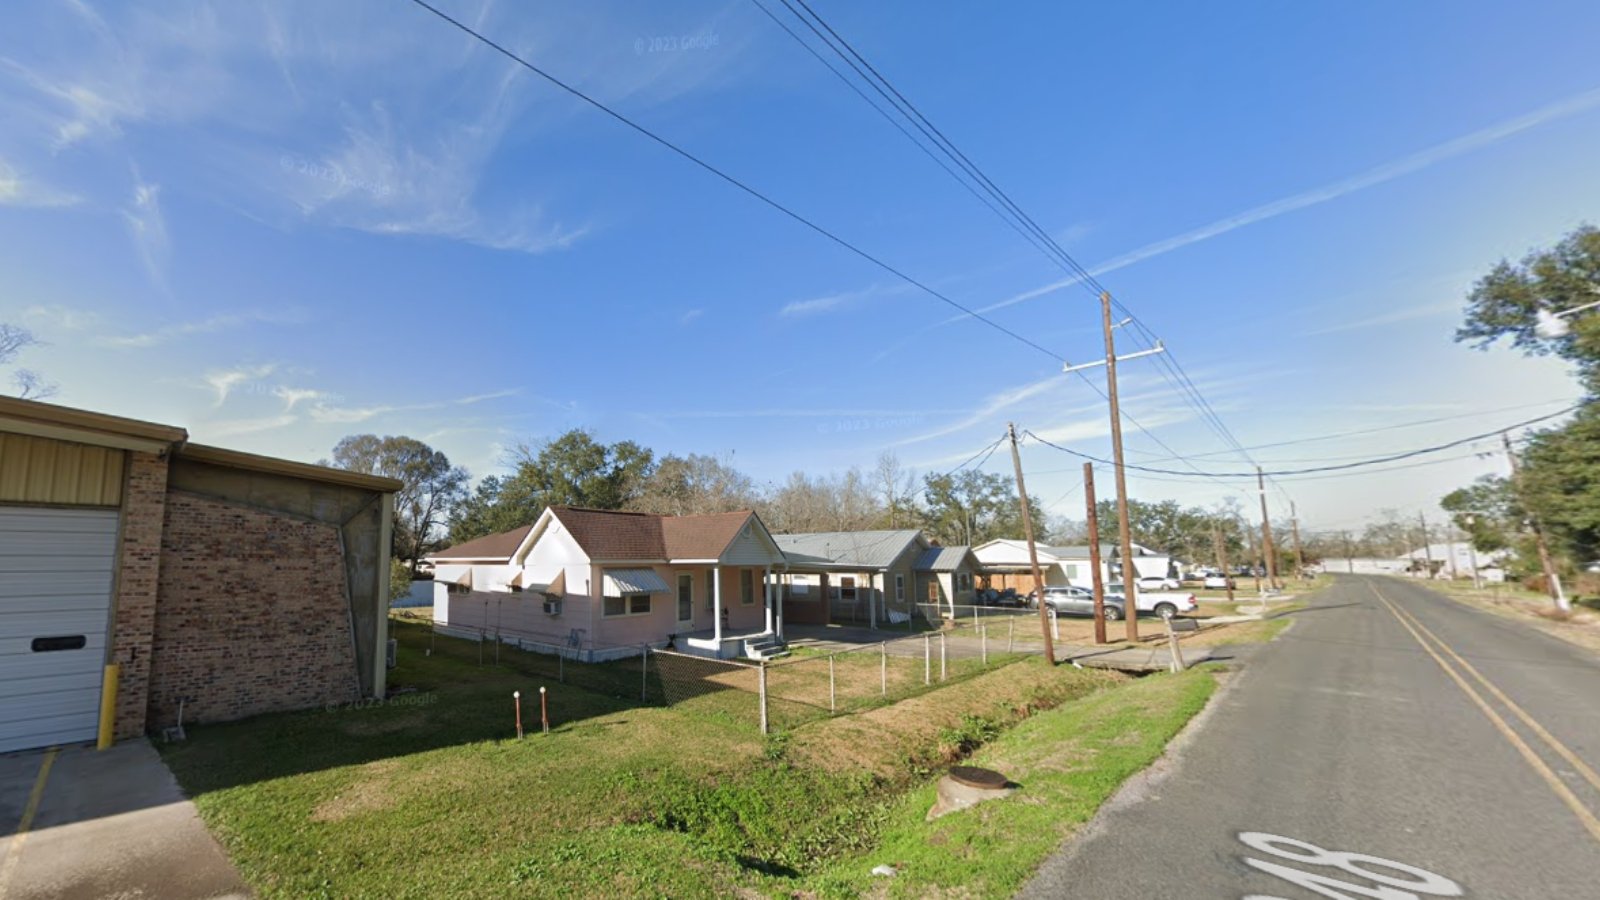
15. Metairie – 29% Home Price Increase Since 2010
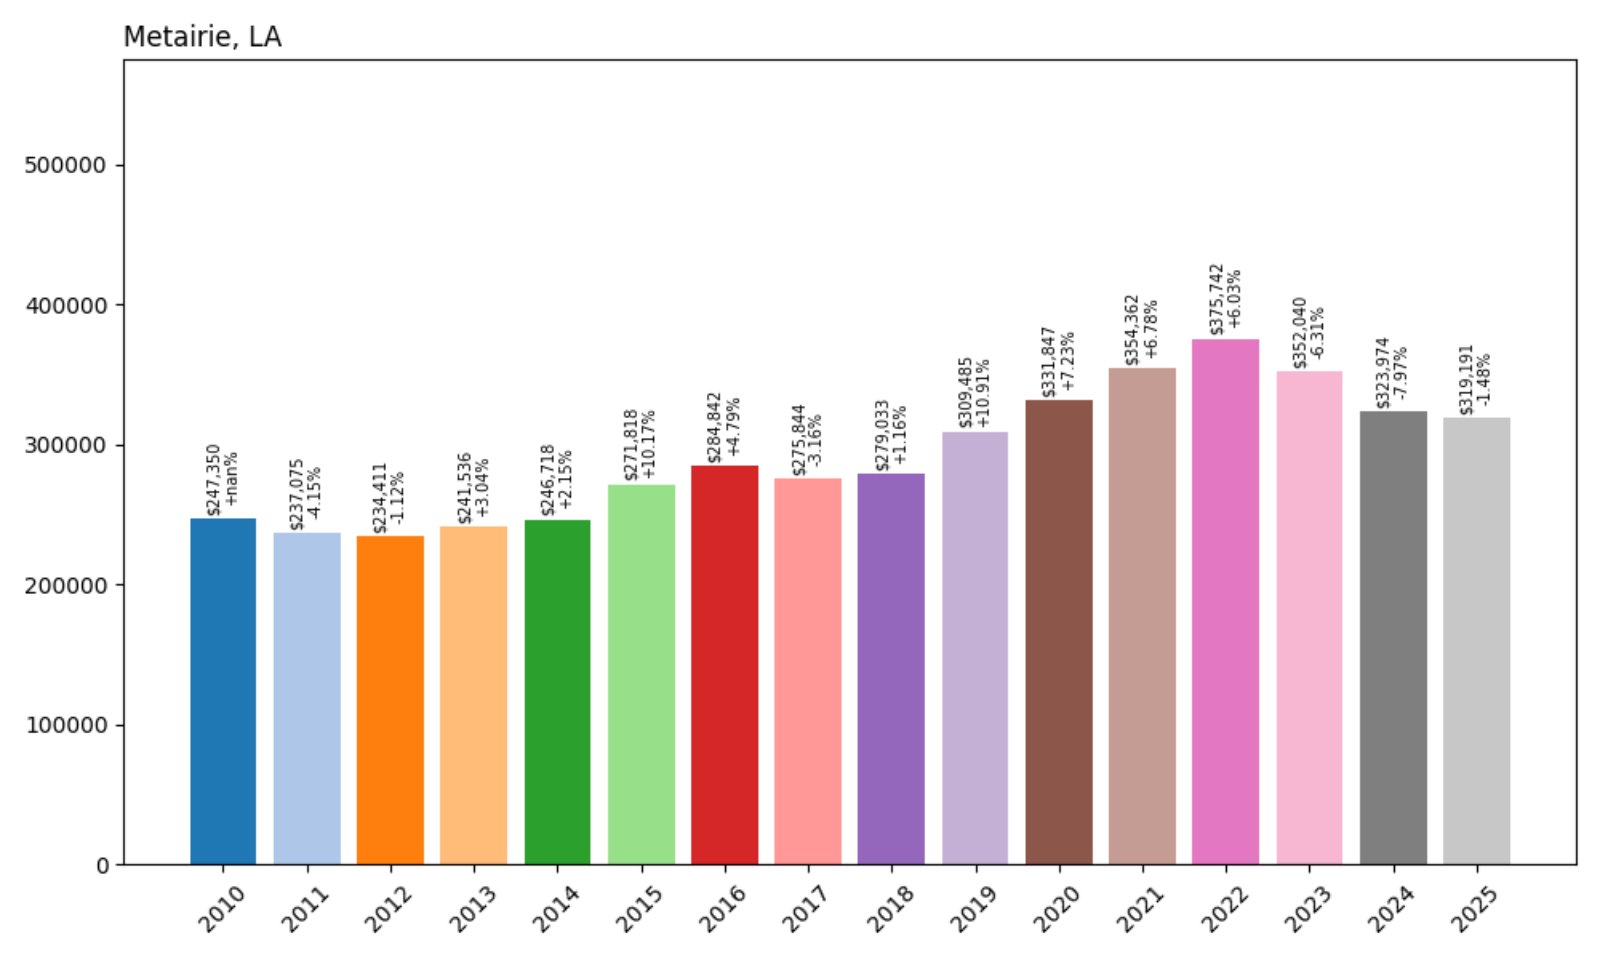
- 2010: $247,350
- 2011: $237,075 (−$10,275, −4.15% from previous year)
- 2012: $234,411 (−$2,664, −1.12% from previous year)
- 2013: $241,536 (+$7,125, +3.04% from previous year)
- 2014: $246,718 (+$5,183, +2.15% from previous year)
- 2015: $271,818 (+$25,099, +10.17% from previous year)
- 2016: $284,842 (+$13,024, +4.79% from previous year)
- 2017: $275,844 (−$8,998, −3.16% from previous year)
- 2018: $279,033 (+$3,189, +1.16% from previous year)
- 2019: $309,485 (+$30,452, +10.91% from previous year)
- 2020: $331,847 (+$22,362, +7.23% from previous year)
- 2021: $354,362 (+$22,516, +6.78% from previous year)
- 2022: $375,742 (+$21,379, +6.03% from previous year)
- 2023: $352,040 (−$23,701, −6.31% from previous year)
- 2024: $323,974 (−$28,066, −7.97% from previous year)
- 2025: $319,191 (−$4,783, −1.48% from previous year)
Metairie’s prices climbed from $247,350 in 2010 to $319,191 in 2025 — a 29% gain. Prices peaked in 2022, then declined over the next three years, echoing trends in many high-demand metro areas.
Metairie – One of the State’s Largest Suburban Markets
As one of the largest and most recognizable suburbs of New Orleans, Metairie has long been a residential center for professionals, families, and retirees. It’s home to major hospitals, shopping districts, and a dense mix of housing styles.
The early 2020s brought strong value growth, but rising insurance costs, storm concerns, and shifting demand have caused a pullback. Even so, it remains one of the most expensive and resilient markets in Jefferson Parish.
14. Woodworth – 69% Home Price Increase Since 2010
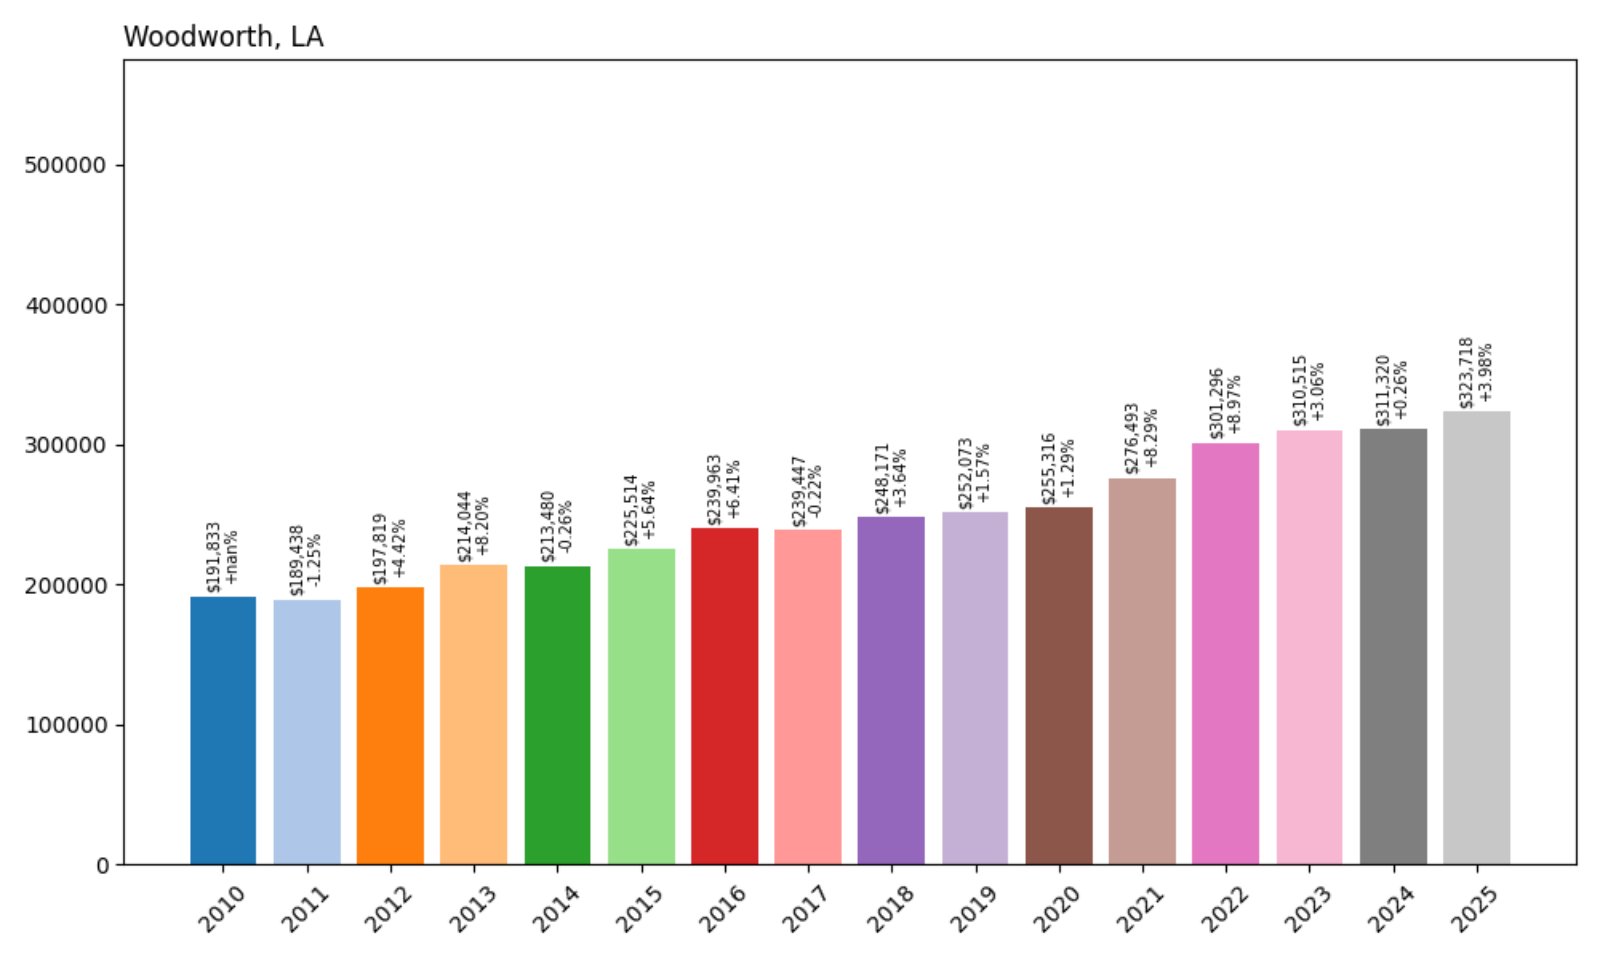
- 2010: $191,833
- 2011: $189,438 (−$2,396, −1.25% from previous year)
- 2012: $197,819 (+$8,381, +4.42% from previous year)
- 2013: $214,044 (+$16,225, +8.20% from previous year)
- 2014: $213,480 (−$564, −0.26% from previous year)
- 2015: $225,514 (+$12,034, +5.64% from previous year)
- 2016: $239,963 (+$14,449, +6.41% from previous year)
- 2017: $239,447 (−$516, −0.22% from previous year)
- 2018: $248,171 (+$8,724, +3.64% from previous year)
- 2019: $252,073 (+$3,902, +1.57% from previous year)
- 2020: $255,316 (+$3,244, +1.29% from previous year)
- 2021: $276,493 (+$21,177, +8.29% from previous year)
- 2022: $301,296 (+$24,803, +8.97% from previous year)
- 2023: $310,515 (+$9,219, +3.06% from previous year)
- 2024: $311,320 (+$805, +0.26% from previous year)
- 2025: $323,718 (+$12,399, +3.98% from previous year)
Woodworth’s home values rose from $191,833 in 2010 to $323,718 in 2025 — a 69% increase. Price growth has been impressively steady, with only a few years of stagnation or slight decline.
Woodworth – Steady Growth in Central Louisiana
Woodworth is a small but growing town in Rapides Parish just south of Alexandria. Known for its forested surroundings, proximity to Kisatchie National Forest, and low population density, it has become increasingly popular among professionals and retirees.
Home price appreciation has been driven by limited inventory, strong local demand, and quality of life offerings. Its resilience through various market cycles shows the strength of its long-term appeal.
13. Covington – 41% Home Price Increase Since 2010
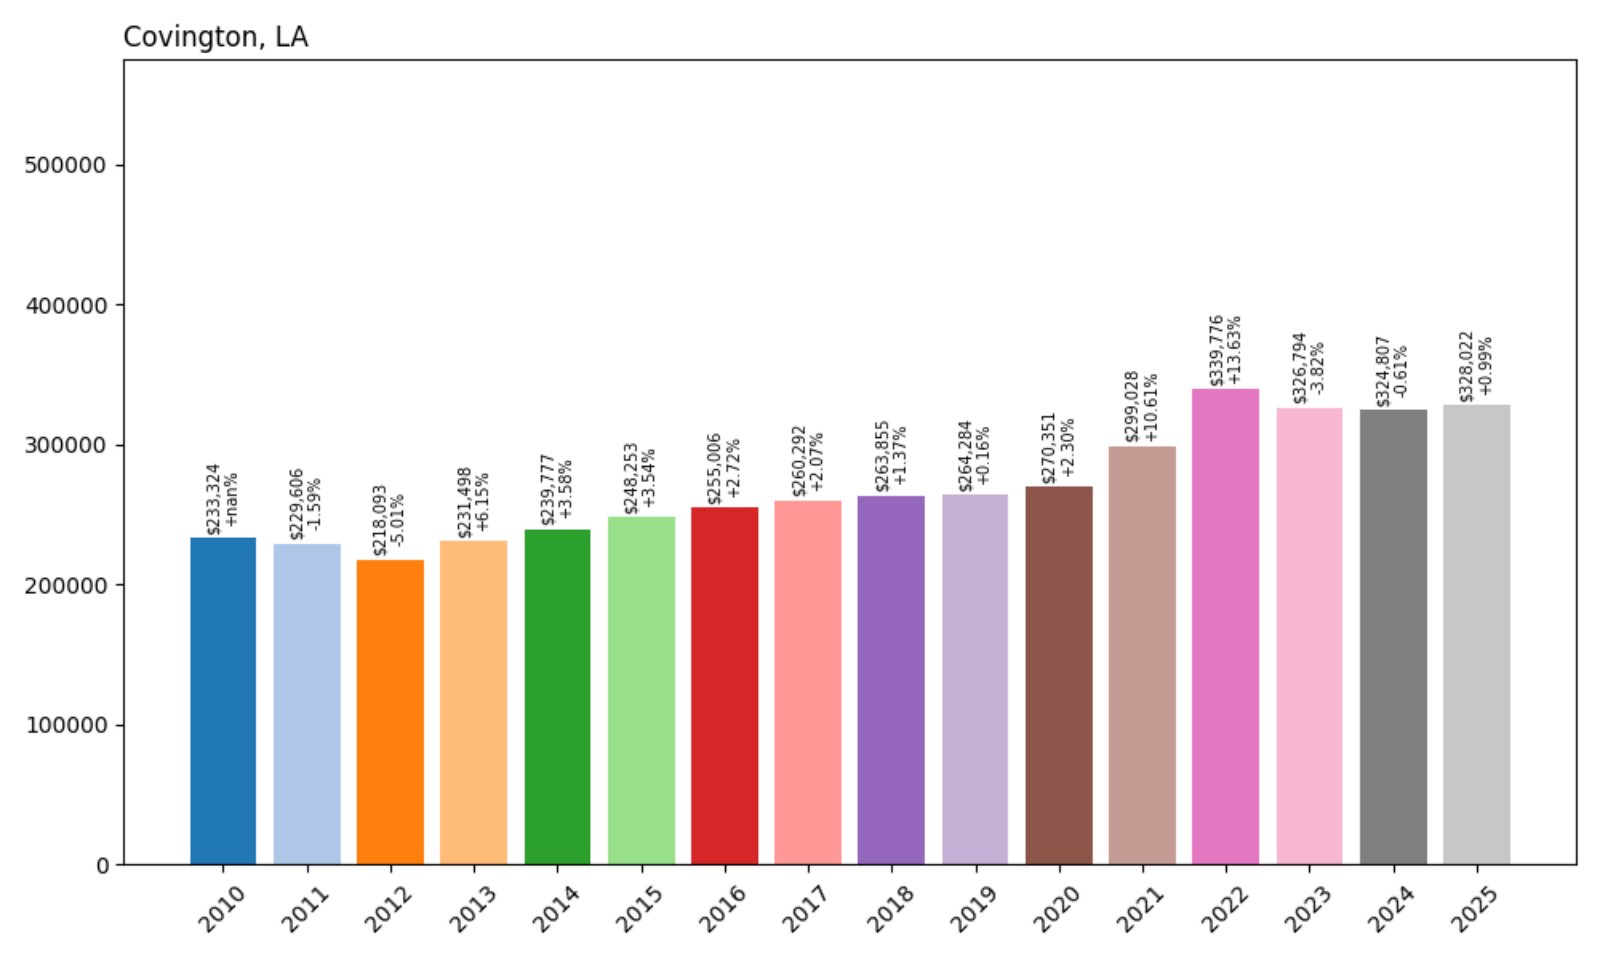
- 2010: $233,324
- 2011: $229,606 (−$3,719, −1.59% from previous year)
- 2012: $218,093 (−$11,512, −5.01% from previous year)
- 2013: $231,498 (+$13,405, +6.15% from previous year)
- 2014: $239,777 (+$8,278, +3.58% from previous year)
- 2015: $248,253 (+$8,476, +3.54% from previous year)
- 2016: $255,006 (+$6,753, +2.72% from previous year)
- 2017: $260,292 (+$5,285, +2.07% from previous year)
- 2018: $263,855 (+$3,564, +1.37% from previous year)
- 2019: $264,284 (+$428, +0.16% from previous year)
- 2020: $270,351 (+$6,067, +2.30% from previous year)
- 2021: $299,028 (+$28,677, +10.61% from previous year)
- 2022: $339,776 (+$40,748, +13.63% from previous year)
- 2023: $326,794 (−$12,981, −3.82% from previous year)
- 2024: $324,807 (−$1,987, −0.61% from previous year)
- 2025: $328,022 (+$3,215, +0.99% from previous year)
Covington’s home values climbed from $233,324 in 2010 to $328,022 in 2025 — a 41% increase. After large gains in 2021 and 2022, the market has stabilized, holding steady in recent years.
Covington – Historic Core Meets Modern Appeal
Located on the Northshore of Lake Pontchartrain in St. Tammany Parish, Covington blends historic charm with modern development. A walkable downtown, art galleries, music events, and trail access make it a highly livable town for families and retirees alike.
Despite softening slightly in 2023 and 2024, values remain strong, thanks to high demand and ongoing investments in infrastructure and amenities. Covington continues to draw both locals and transplants seeking a vibrant yet relaxed atmosphere.
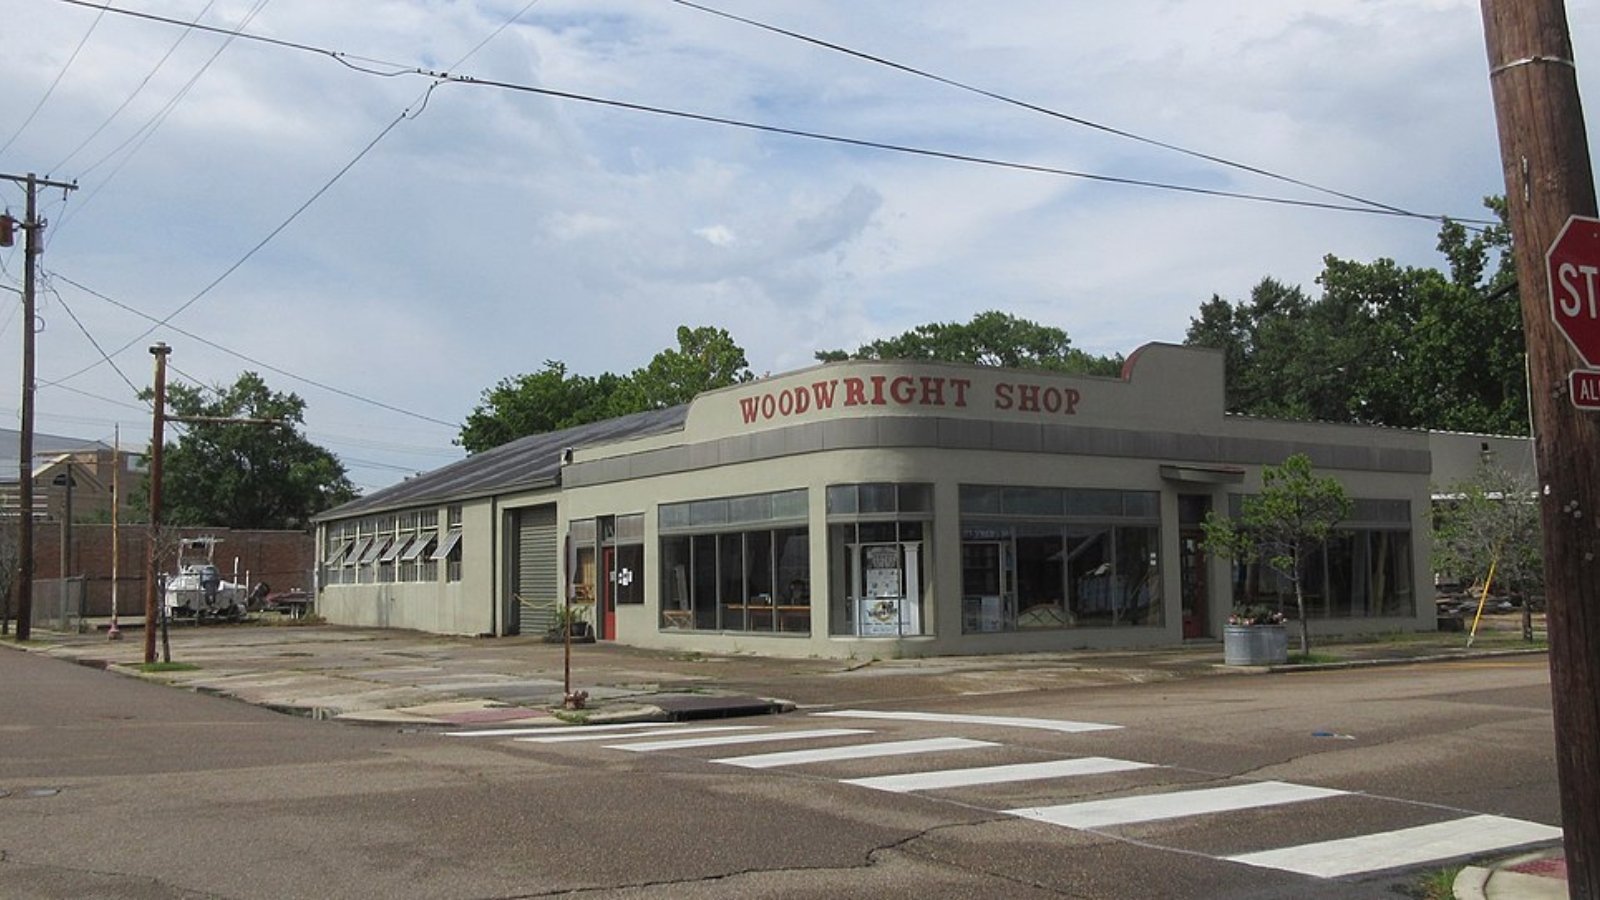
12. Prairieville – 42% Home Price Increase Since 2010
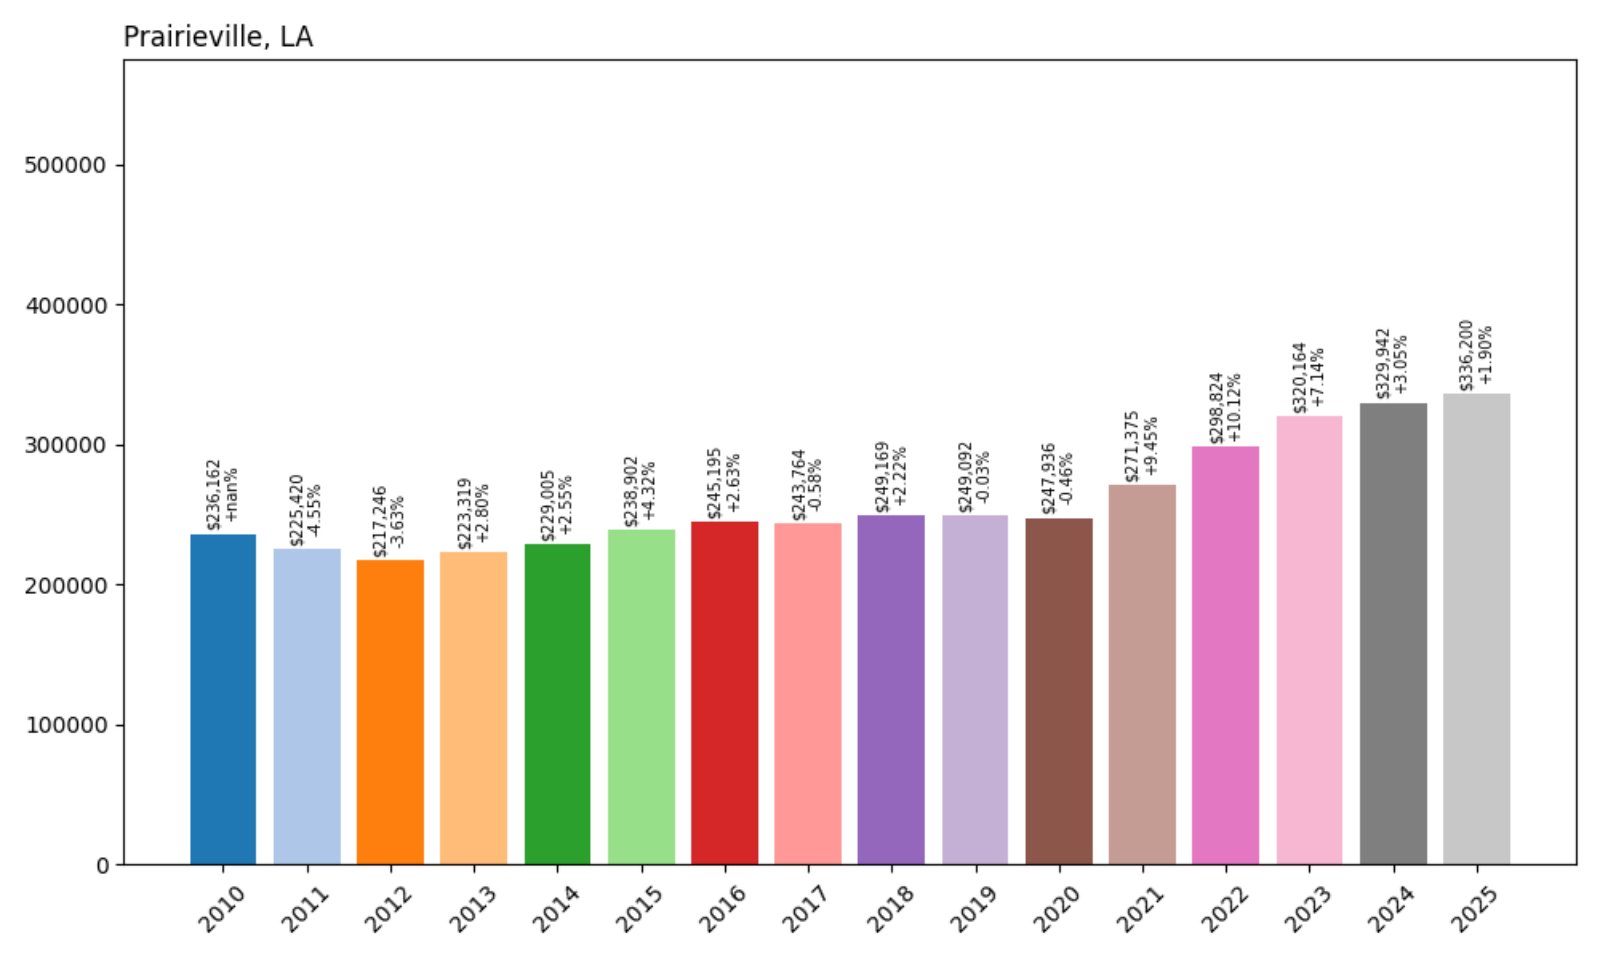
- 2010: $236,162
- 2011: $225,420 (−$10,742, −4.55% from previous year)
- 2012: $217,246 (−$8,175, −3.63% from previous year)
- 2013: $223,319 (+$6,074, +2.80% from previous year)
- 2014: $229,005 (+$5,685, +2.55% from previous year)
- 2015: $238,902 (+$9,897, +4.32% from previous year)
- 2016: $245,195 (+$6,293, +2.63% from previous year)
- 2017: $243,764 (−$1,431, −0.58% from previous year)
- 2018: $249,169 (+$5,405, +2.22% from previous year)
- 2019: $249,092 (−$77, −0.03% from previous year)
- 2020: $247,936 (−$1,156, −0.46% from previous year)
- 2021: $271,375 (+$23,439, +9.45% from previous year)
- 2022: $298,824 (+$27,450, +10.12% from previous year)
- 2023: $320,164 (+$21,340, +7.14% from previous year)
- 2024: $329,942 (+$9,778, +3.05% from previous year)
- 2025: $336,200 (+$6,258, +1.90% from previous year)
Prairieville’s values grew from $236,162 in 2010 to $336,200 in 2025 — a 42% increase. The last five years have seen particularly strong gains, driving the town higher up this list.
Prairieville – Fast-Growing Suburb With Lasting Appeal
Prairieville is an unincorporated community in Ascension Parish that has grown rapidly thanks to its proximity to Baton Rouge and strong local schools. It’s frequently cited as one of the best places to live in the state for families.
Its housing market saw exceptional growth in the early 2020s, and while the rate has slowed recently, values continue to rise. Demand for new construction and easy access to urban job centers make it a consistent performer.
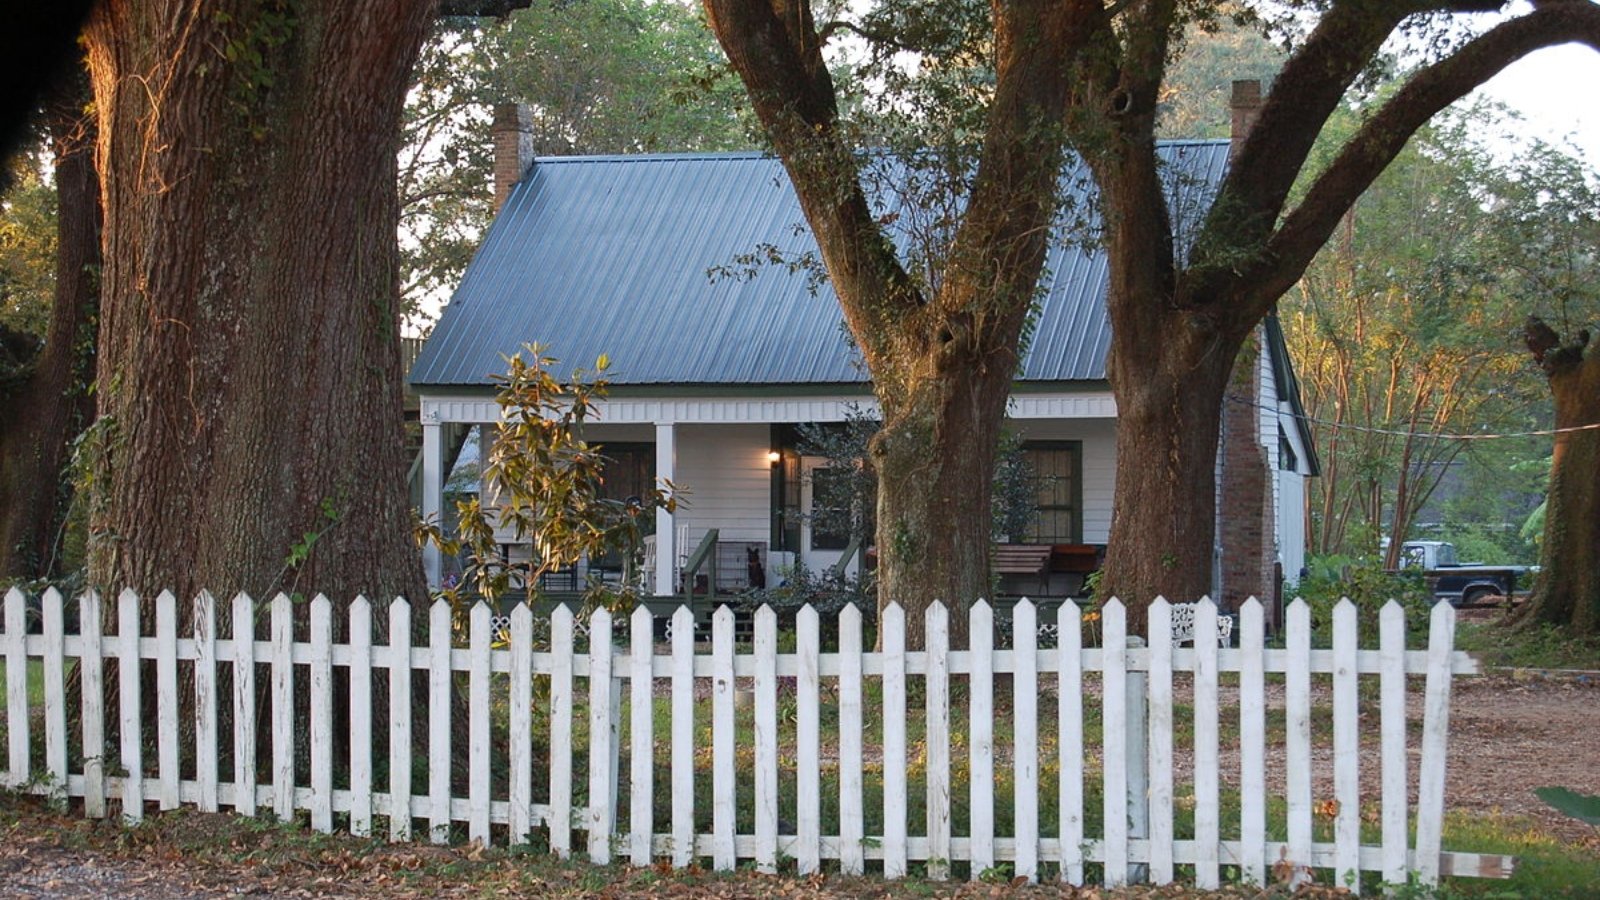
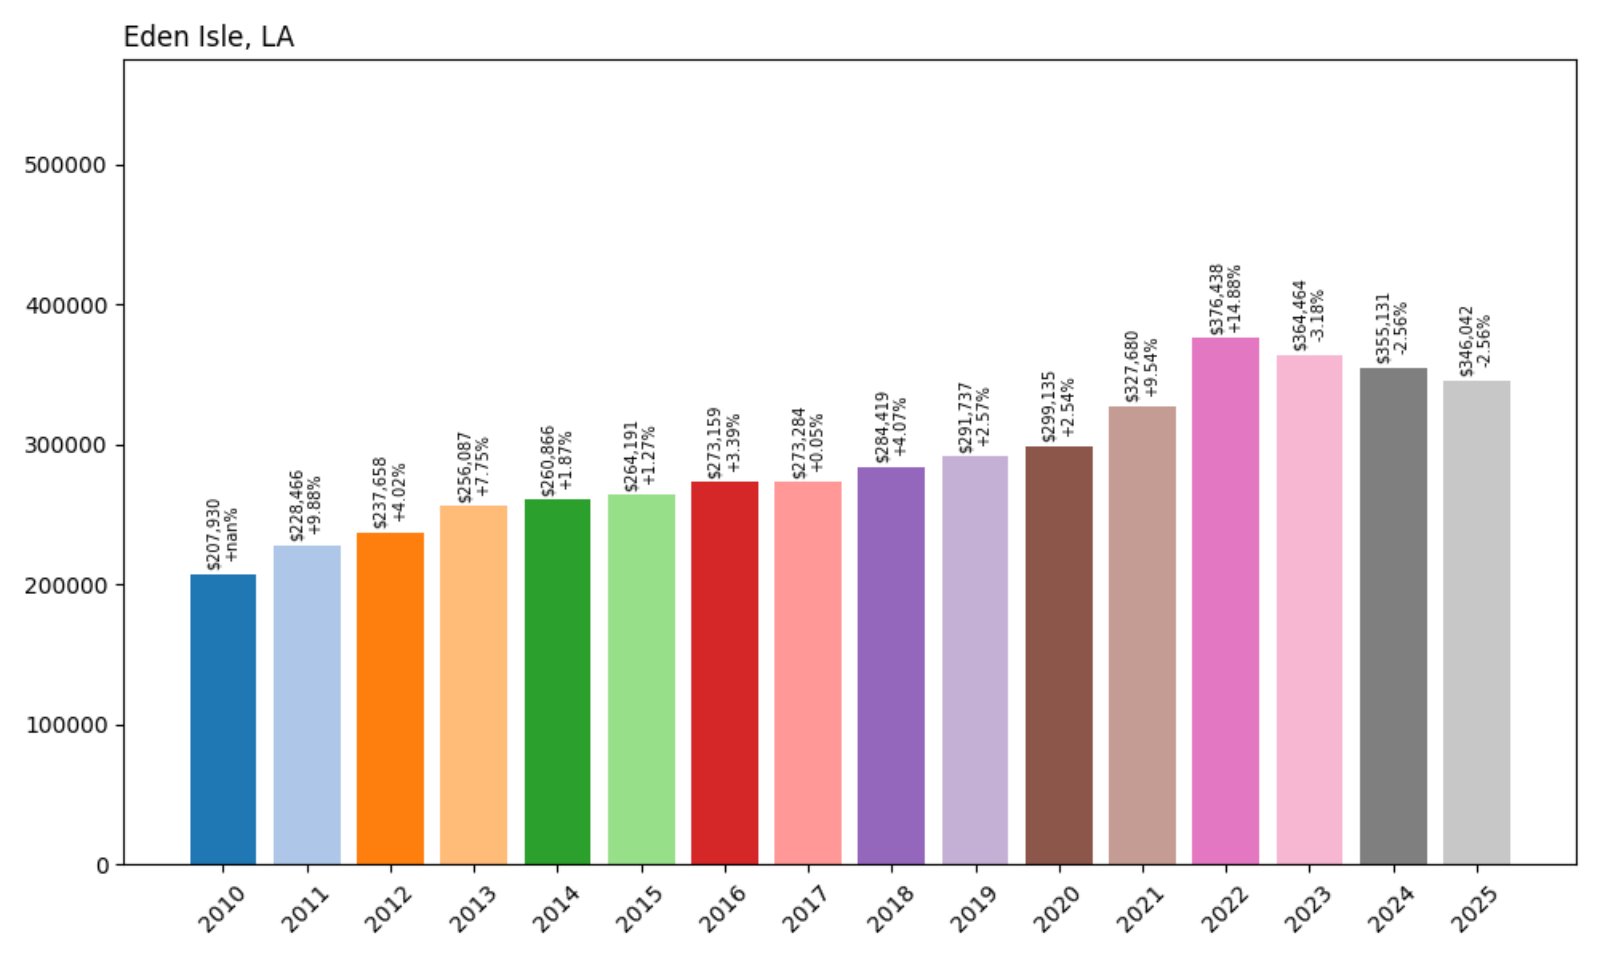
11. Eden Isle – 41% Home Price Increase Since 2010
- 2010: $245,508
- 2011: $244,410 (−$1,098, −0.45% from previous year)
- 2012: $243,713 (−$697, −0.29% from previous year)
- 2013: $254,643 (+$10,930, +4.48% from previous year)
- 2014: $264,788 (+$10,144, +3.98% from previous year)
- 2015: $267,961 (+$3,173, +1.20% from previous year)
- 2016: $270,897 (+$2,936, +1.10% from previous year)
- 2017: $270,437 (−$460, −0.17% from previous year)
- 2018: $272,496 (+$2,059, +0.76% from previous year)
- 2019: $276,245 (+$3,748, +1.38% from previous year)
- 2020: $279,392 (+$3,147, +1.14% from previous year)
- 2021: $302,607 (+$23,215, +8.31% from previous year)
- 2022: $332,994 (+$30,386, +10.04% from previous year)
- 2023: $333,583 (+$590, +0.18% from previous year)
- 2024: $337,855 (+$4,272, +1.28% from previous year)
- 2025: $346,042 (+$8,187, +2.42% from previous year)
Eden Isle’s home values rose from $245,508 in 2010 to $346,042 in 2025 — a solid 41% increase. The market showed consistent growth over the years, with a significant spike starting in 2021.
Eden Isle – Waterfront Living on Lake Pontchartrain
Eden Isle is a scenic community located on the northeastern edge of Lake Pontchartrain in St. Tammany Parish. With many waterfront homes and canal access, it has long attracted boaters, second-home buyers, and retirees.
Though growth was modest through the 2010s, prices took off during the pandemic-era housing boom. Continued interest in waterfront properties and improved access via nearby Slidell have helped keep Eden Isle on the rise.
10. Benton – 43% Home Price Increase Since 2010
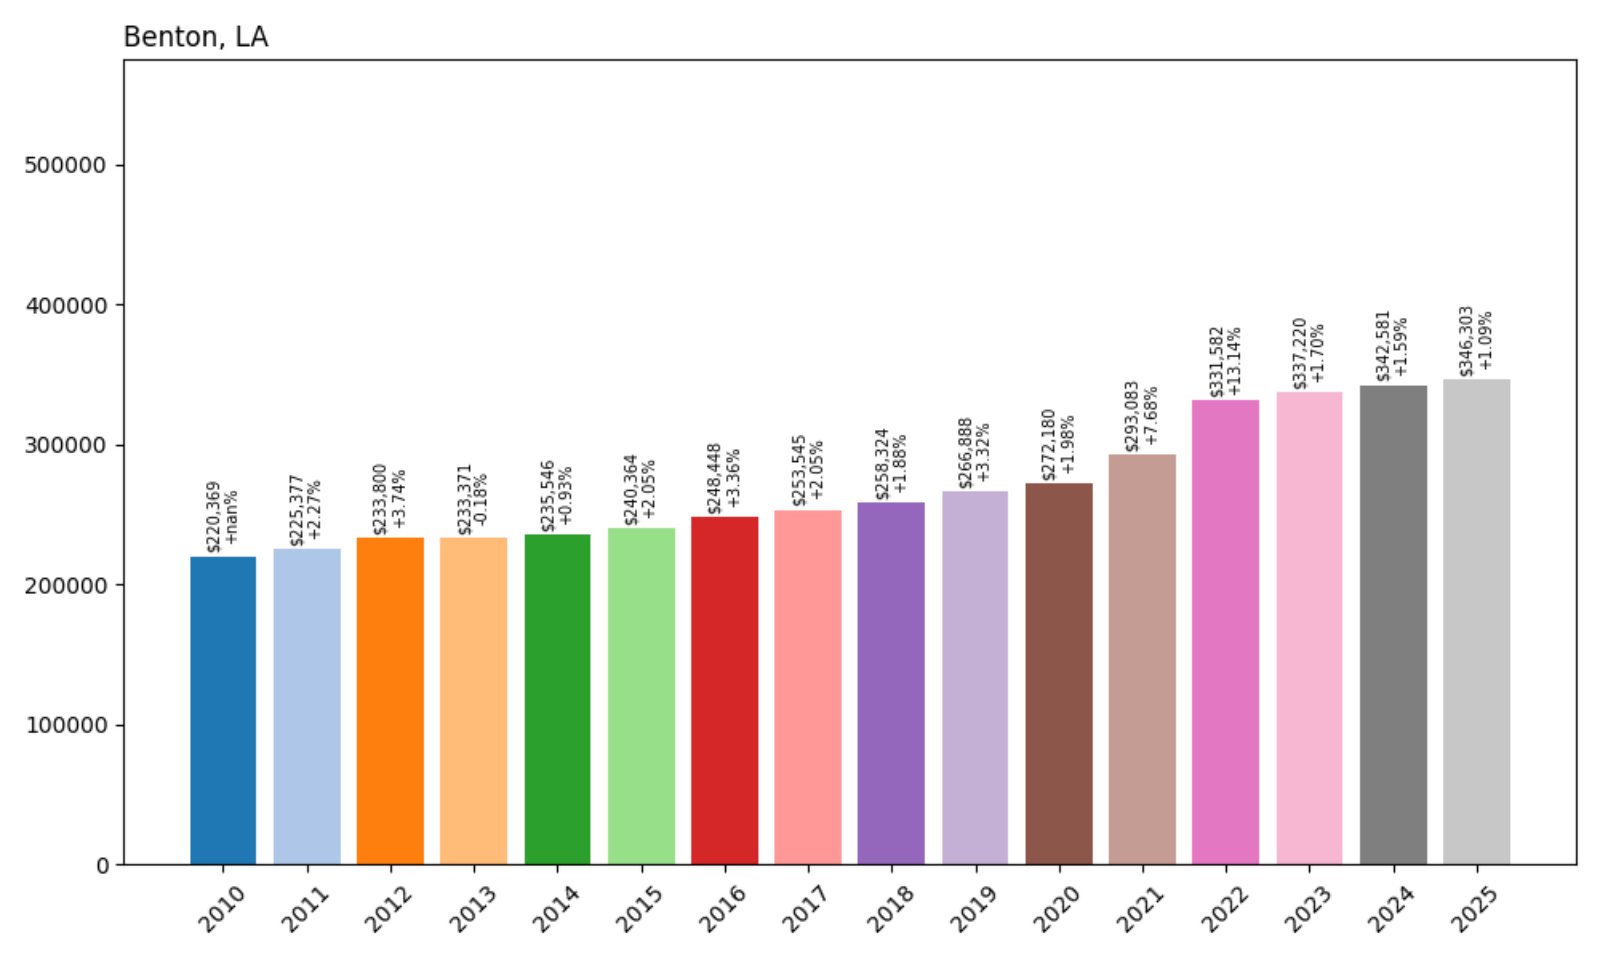
- 2010: $242,218
- 2011: $241,335 (−$883, −0.36% from previous year)
- 2012: $235,700 (−$5,635, −2.33% from previous year)
- 2013: $244,366 (+$8,666, +3.68% from previous year)
- 2014: $251,106 (+$6,740, +2.76% from previous year)
- 2015: $259,535 (+$8,429, +3.36% from previous year)
- 2016: $267,338 (+$7,803, +3.01% from previous year)
- 2017: $266,222 (−$1,116, −0.42% from previous year)
- 2018: $270,508 (+$4,286, +1.61% from previous year)
- 2019: $277,416 (+$6,908, +2.55% from previous year)
- 2020: $284,049 (+$6,632, +2.39% from previous year)
- 2021: $304,847 (+$20,797, +7.32% from previous year)
- 2022: $330,257 (+$25,410, +8.33% from previous year)
- 2023: $338,047 (+$7,790, +2.36% from previous year)
- 2024: $342,911 (+$4,864, +1.44% from previous year)
- 2025: $346,303 (+$3,392, +0.99% from previous year)
Benton’s home prices rose from $242,218 in 2010 to $346,303 in 2025 — a 43% increase. Most of the gains have come in the past five years, with steady, reliable growth and no major drops.
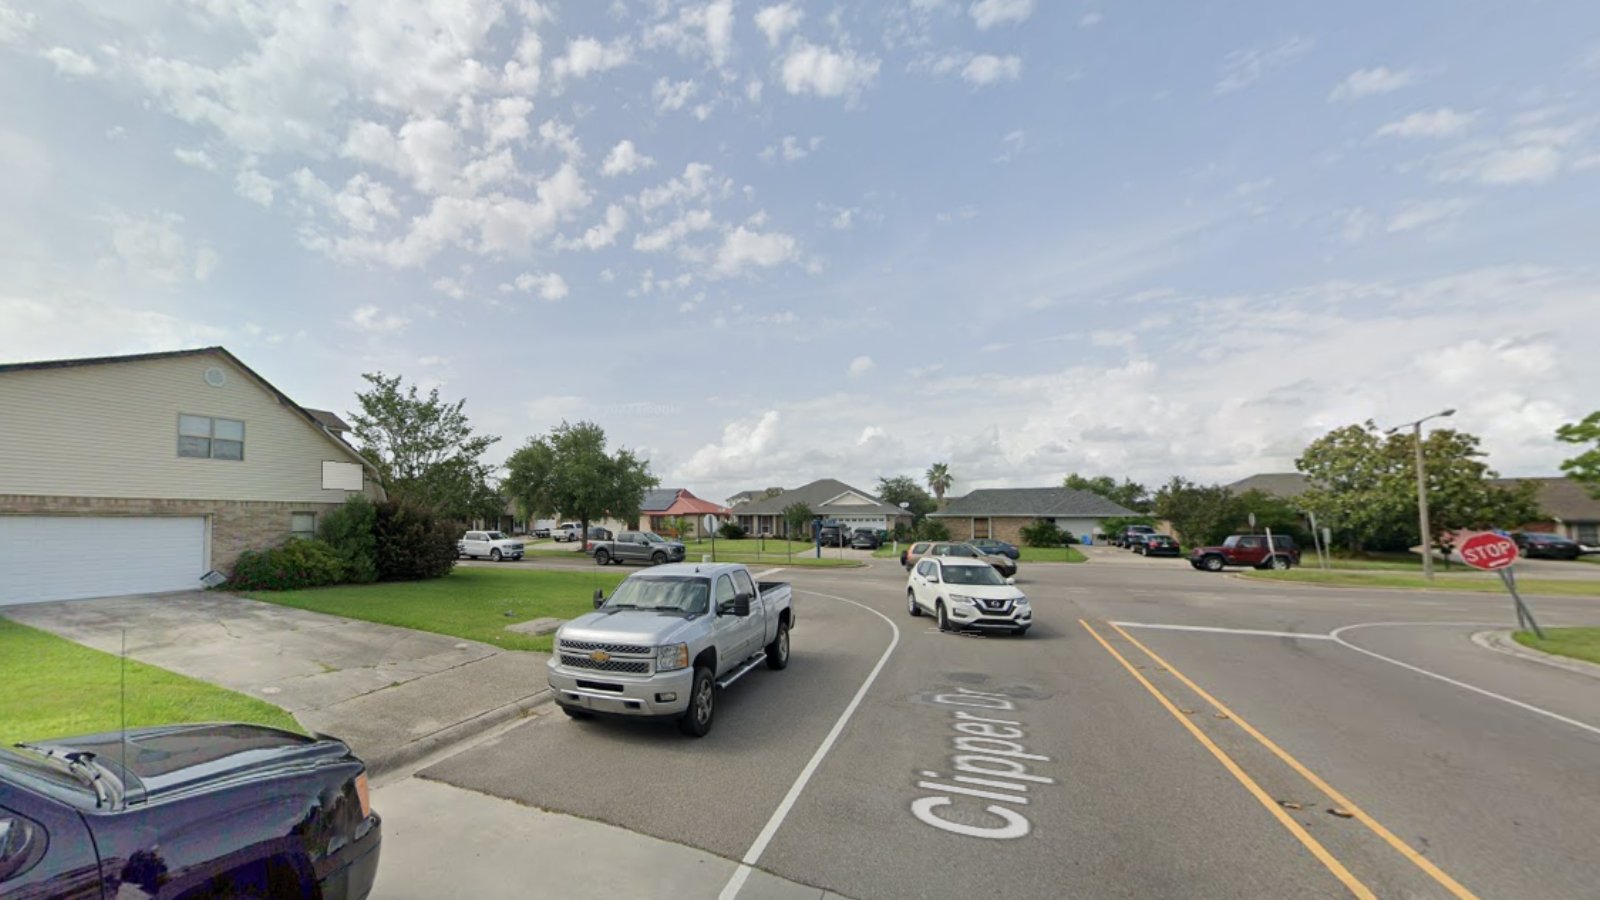
Benton – A Growing Hub in Bossier Parish
Located north of Bossier City, Benton is a rapidly growing town in northwest Louisiana. Known for strong public schools and proximity to Lake Bistineau, it has become one of the most sought-after suburbs in the region.
Benton’s housing market has grown in tandem with broader expansion in Bossier Parish, including retail and residential development. With ample land and an increasing number of subdivisions, it continues to be a magnet for families looking for space and good schools.
9. River Ridge – 44% Home Price Increase Since 2010
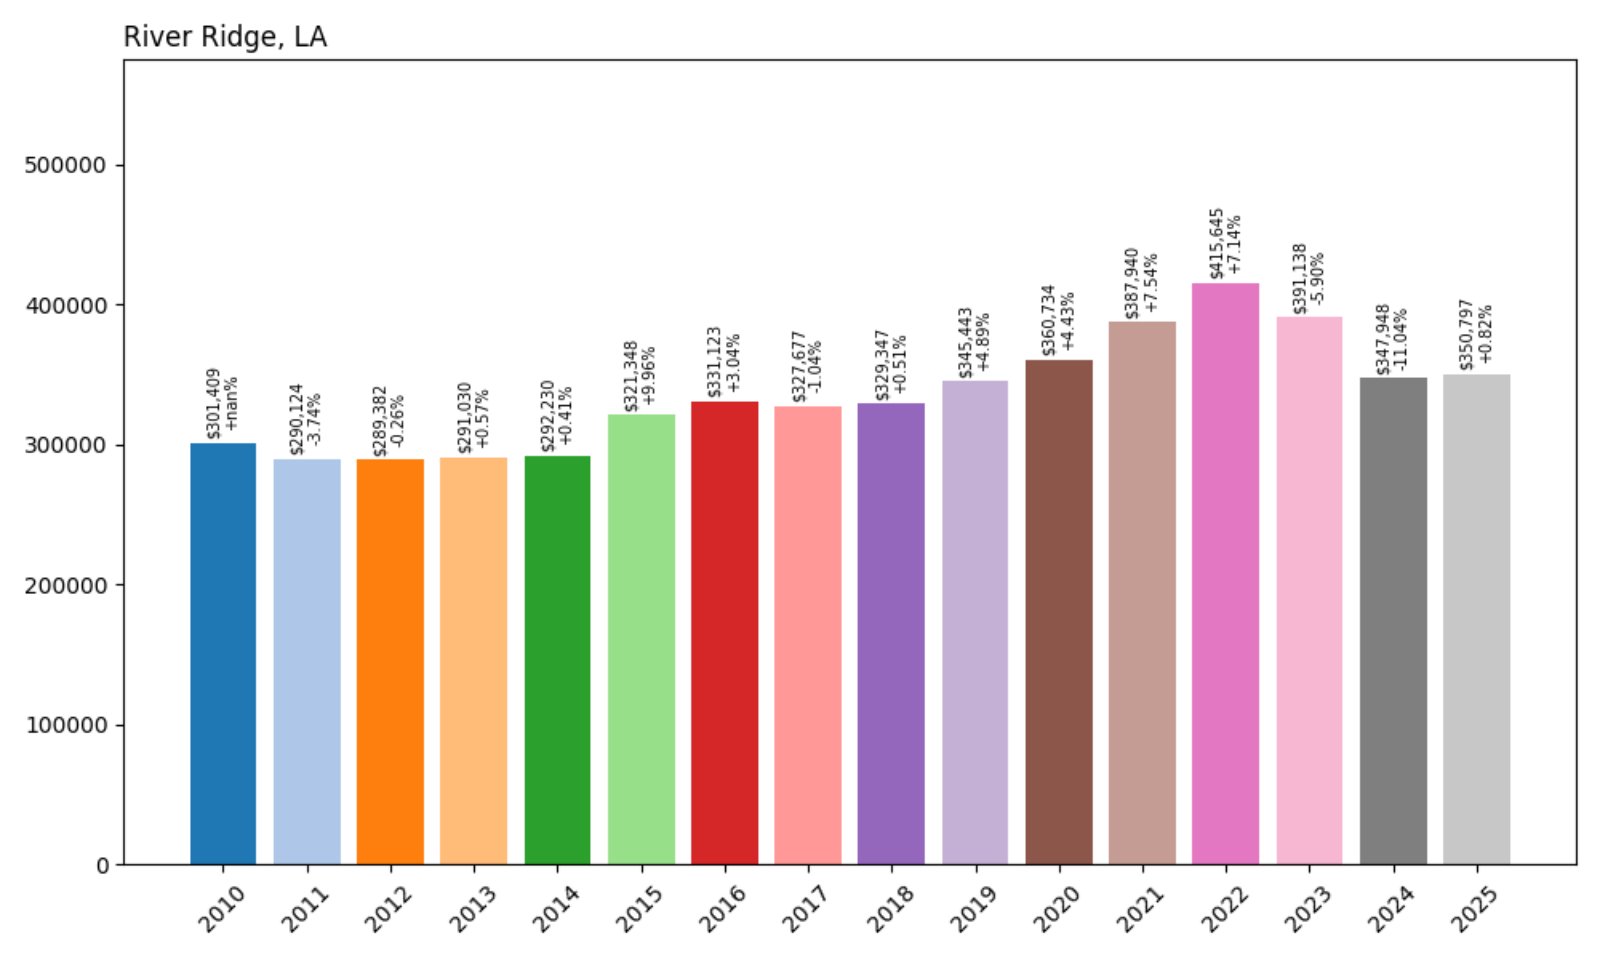
- 2010: $243,842
- 2011: $231,088 (−$12,754, −5.23% from previous year)
- 2012: $229,372 (−$1,716, −0.74% from previous year)
- 2013: $241,615 (+$12,243, +5.34% from previous year)
- 2014: $256,320 (+$14,705, +6.09% from previous year)
- 2015: $270,194 (+$13,873, +5.41% from previous year)
- 2016: $275,732 (+$5,538, +2.05% from previous year)
- 2017: $275,894 (+$162, +0.06% from previous year)
- 2018: $278,217 (+$2,322, +0.84% from previous year)
- 2019: $288,884 (+$10,667, +3.83% from previous year)
- 2020: $307,042 (+$18,158, +6.28% from previous year)
- 2021: $333,334 (+$26,292, +8.56% from previous year)
- 2022: $361,831 (+$28,497, +8.55% from previous year)
- 2023: $360,388 (−$1,443, −0.40% from previous year)
- 2024: $355,351 (−$5,037, −1.40% from previous year)
- 2025: $350,797 (−$4,554, −1.28% from previous year)
River Ridge’s prices rose from $243,842 in 2010 to $350,797 in 2025 — a 44% increase. After peaking in 2022, prices have declined modestly, but remain among the highest in the New Orleans metro.
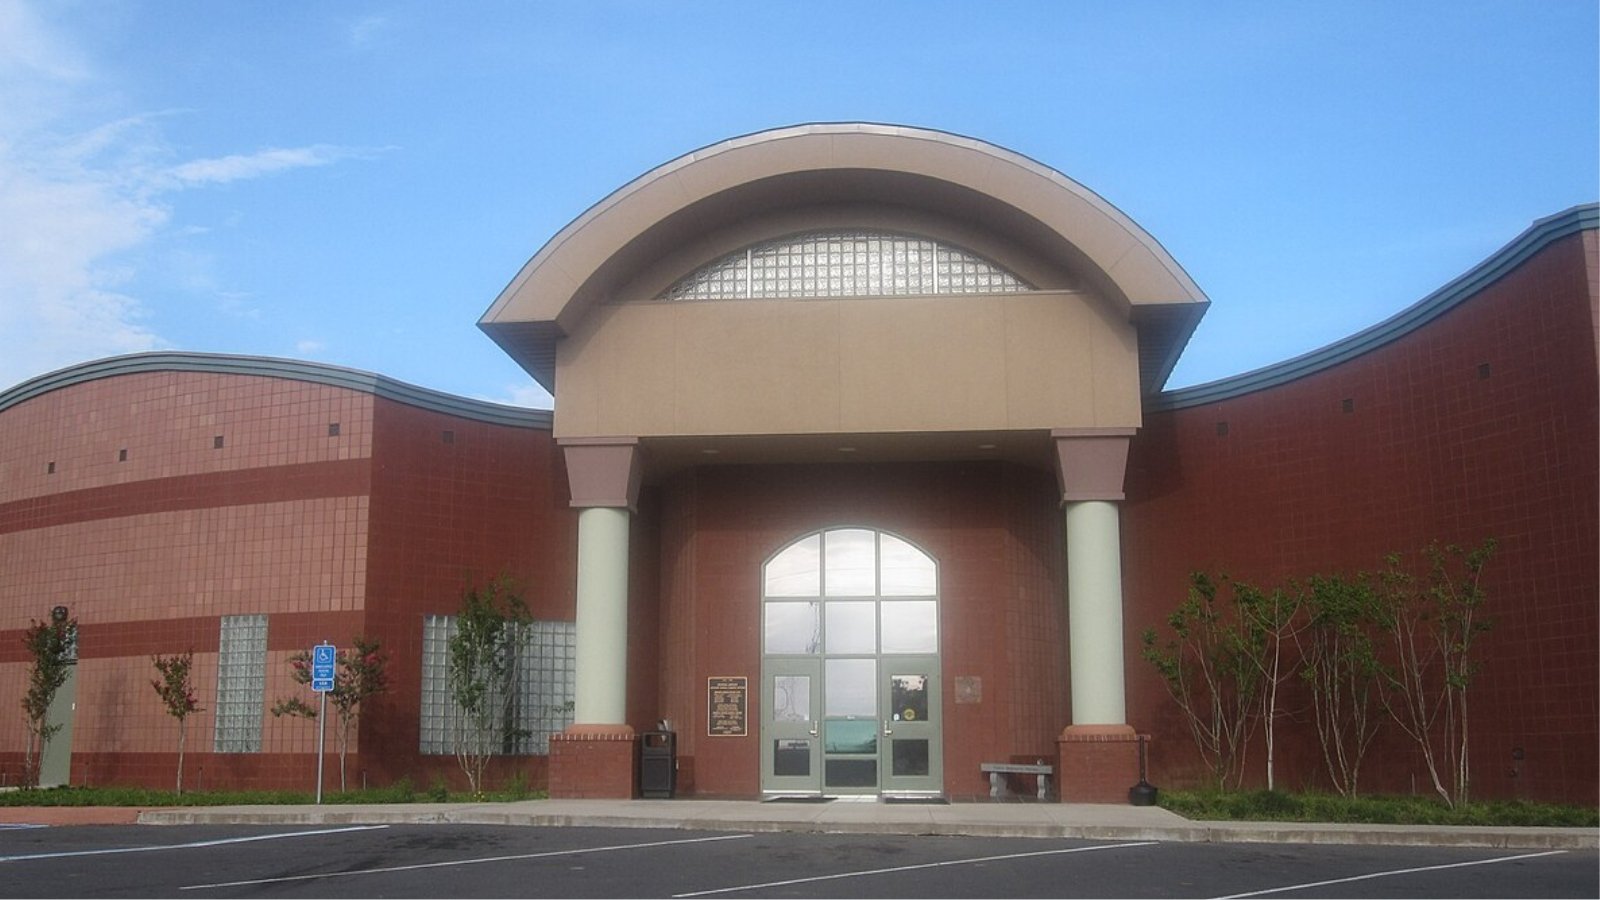
River Ridge – Steady Performer in Jefferson Parish
River Ridge is a desirable suburb of New Orleans, known for its large lots, tree-lined streets, and strong schools. Located just upriver from Harahan, it enjoys proximity to Elmwood, Metairie, and other major job hubs.
The market’s rise has been bolstered by stable demand and a relatively limited supply of homes. Even with recent dips, River Ridge’s prices remain well above pre-pandemic levels and reflect sustained interest in this quiet but accessible neighborhood.
8. Belle Chasse – 45% Home Price Increase Since 2010
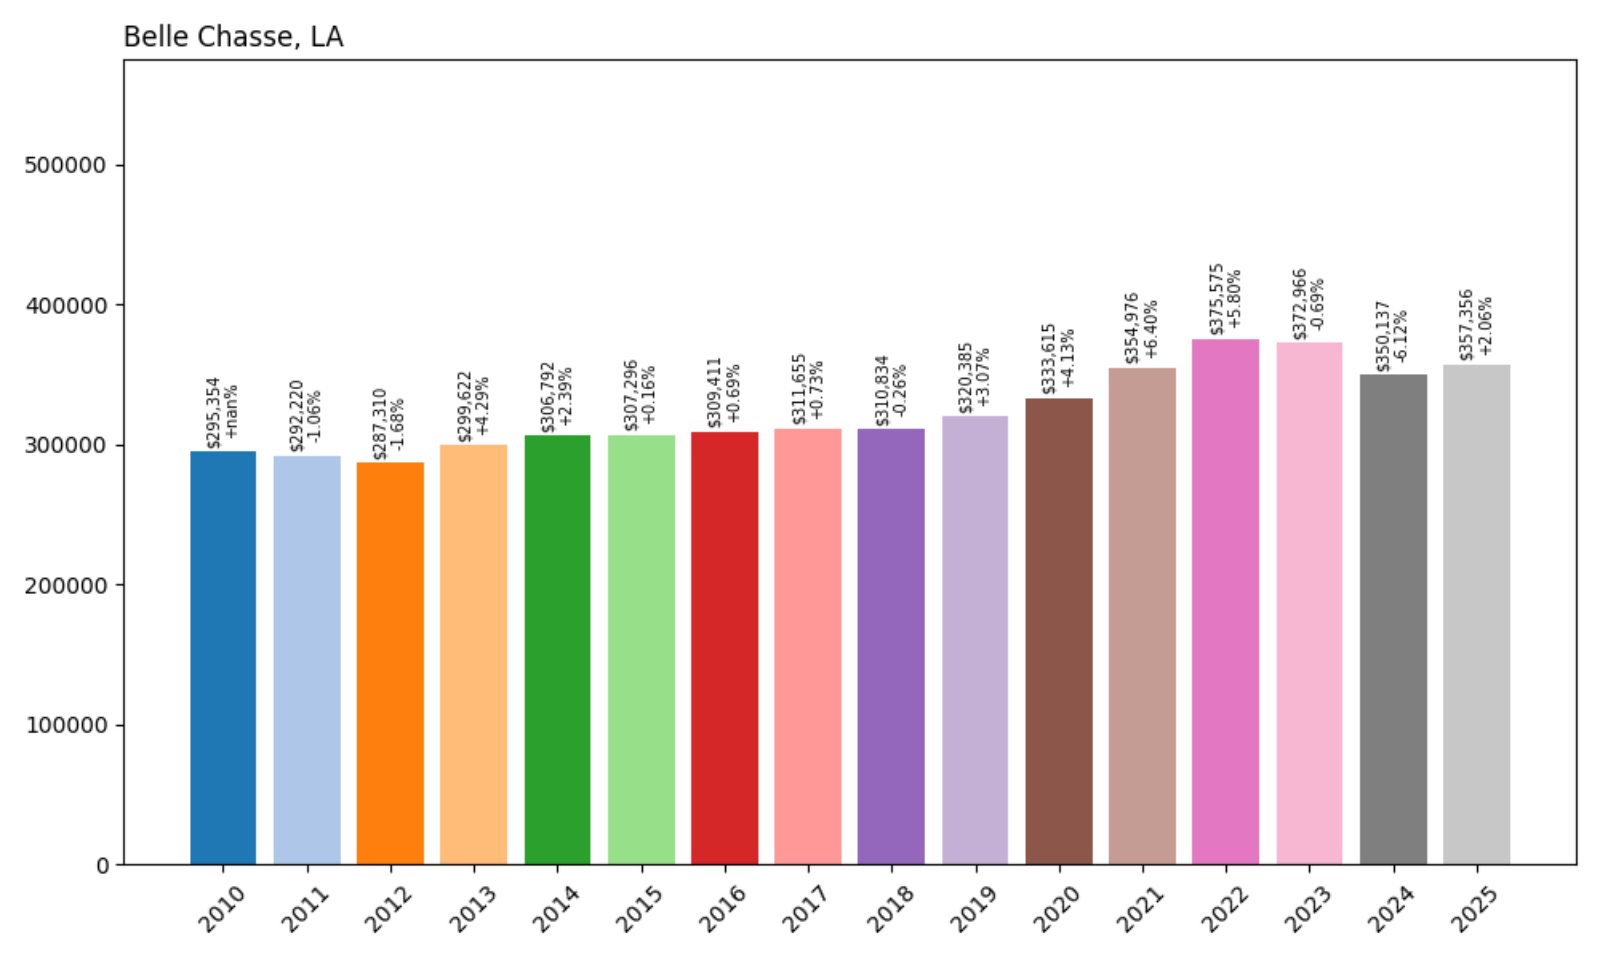
- 2010: $246,078
- 2011: $239,995 (−$6,083, −2.47% from previous year)
- 2012: $250,585 (+$10,589, +4.41% from previous year)
- 2013: $258,499 (+$7,914, +3.16% from previous year)
- 2014: $265,822 (+$7,323, +2.83% from previous year)
- 2015: $270,903 (+$5,081, +1.91% from previous year)
- 2016: $273,393 (+$2,490, +0.92% from previous year)
- 2017: $275,224 (+$1,831, +0.67% from previous year)
- 2018: $275,683 (+$459, +0.17% from previous year)
- 2019: $277,727 (+$2,044, +0.74% from previous year)
- 2020: $284,149 (+$6,422, +2.31% from previous year)
- 2021: $312,541 (+$28,392, +9.99% from previous year)
- 2022: $341,638 (+$29,096, +9.31% from previous year)
- 2023: $354,718 (+$13,080, +3.83% from previous year)
- 2024: $356,343 (+$1,624, +0.46% from previous year)
- 2025: $357,356 (+$1,013, +0.28% from previous year)
Belle Chasse home values have grown from $246,078 in 2010 to $357,356 in 2025 — a 45% increase. The market has shown impressive consistency with few downturns and a strong bump in the early 2020s.
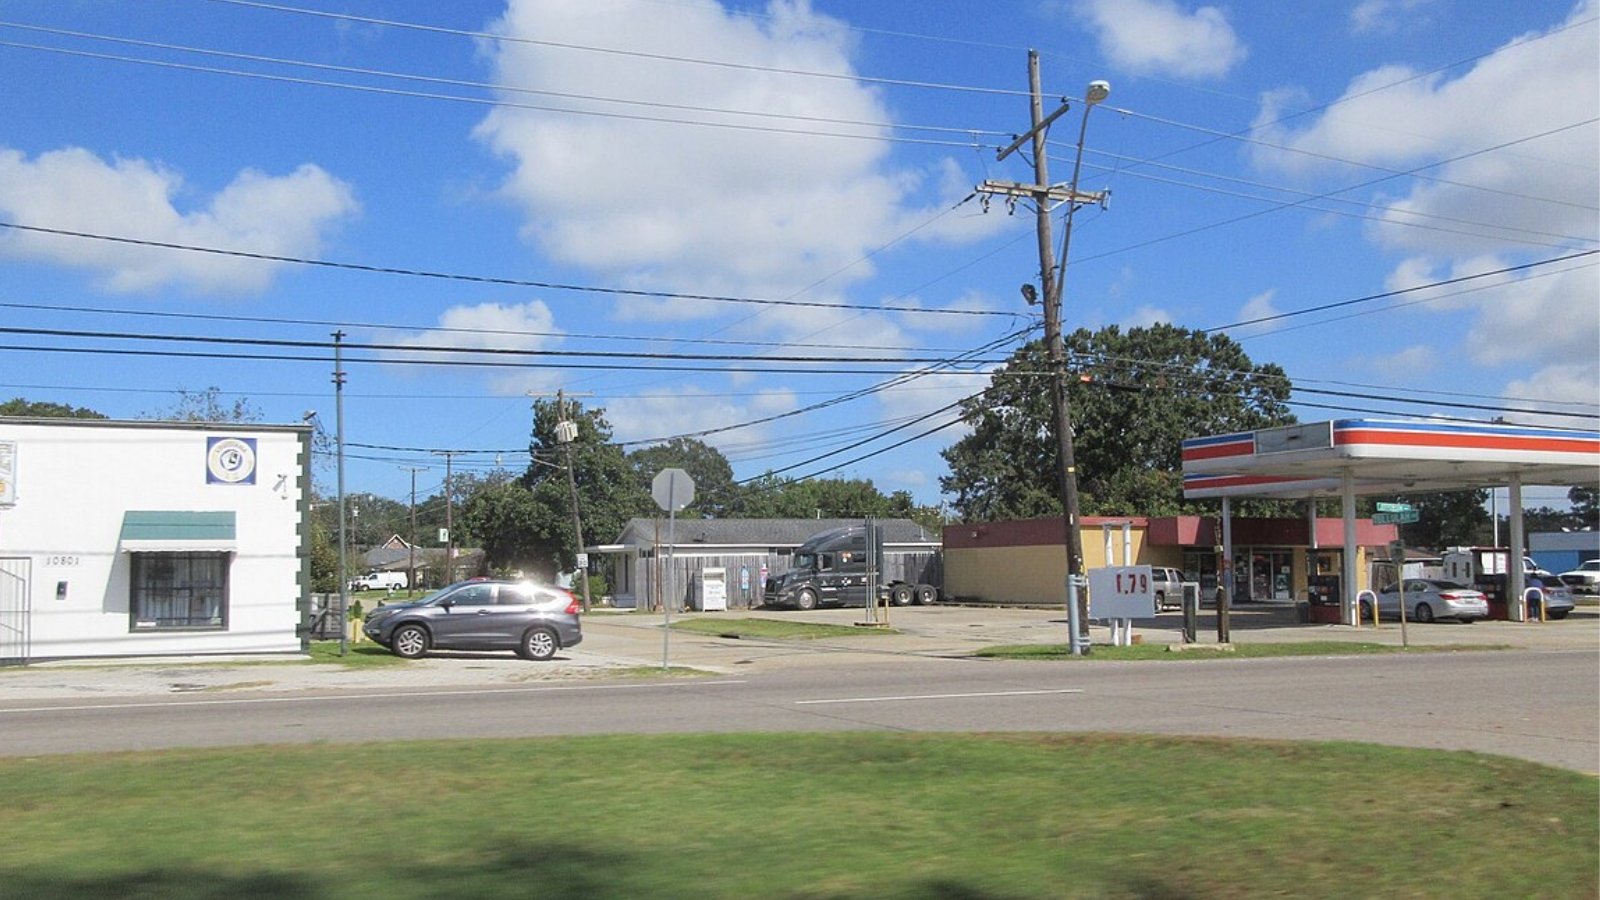
Belle Chasse – Military Roots and Market Stability
Situated in Plaquemines Parish, Belle Chasse is known for its military presence, including Naval Air Station Joint Reserve Base New Orleans. The town combines suburban comfort with access to nature and water recreation.
Steady demand from military families and contractors, along with relatively affordable coastal living, has driven price appreciation. Even in years when many markets dipped, Belle Chasse remained resilient, making it one of Louisiana’s most reliable housing performers.
7. Vienna – 1.33% Home Price Increase Since 2022
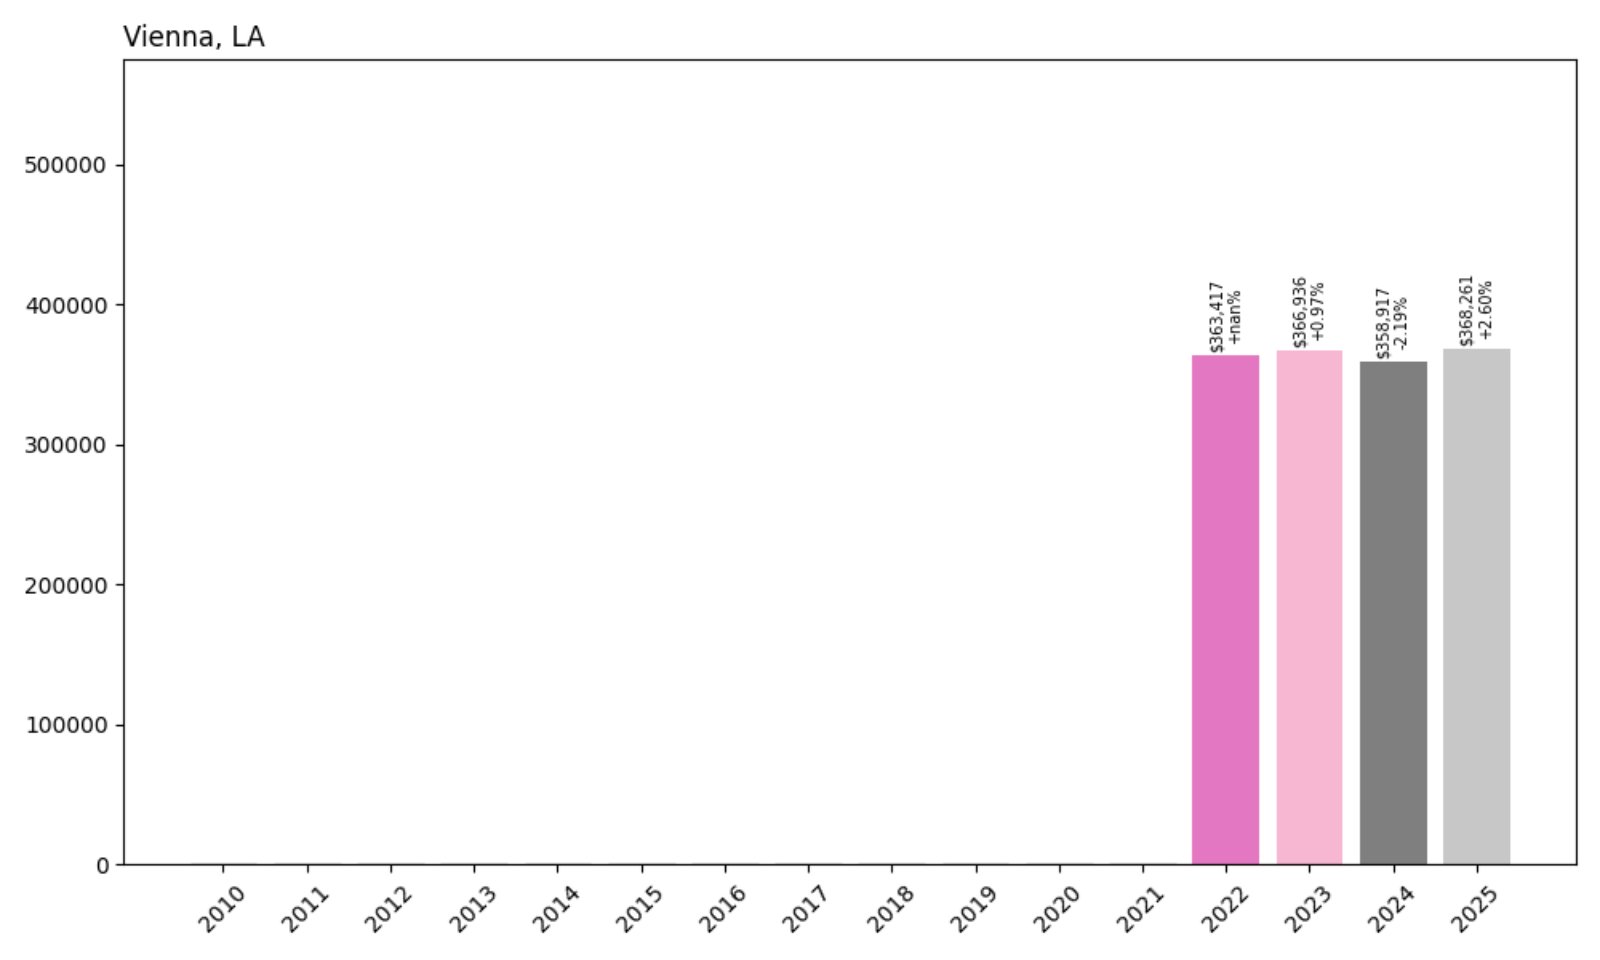
- 2022: $363,417
- 2023: $366,936 (+$3,519, +0.97% from previous year)
- 2024: $358,917 (−$8,019, −2.19% from previous year)
- 2025: $368,261 (+$9,344, +2.60% from previous year)
Vienna’s home prices edged up from $363,417 in 2022 to $368,261 in 2025 — a modest 1.33% increase over the three-year period. After a small dip in 2024, prices recovered in 2025, reflecting a market that’s largely stable but experiencing minimal growth.
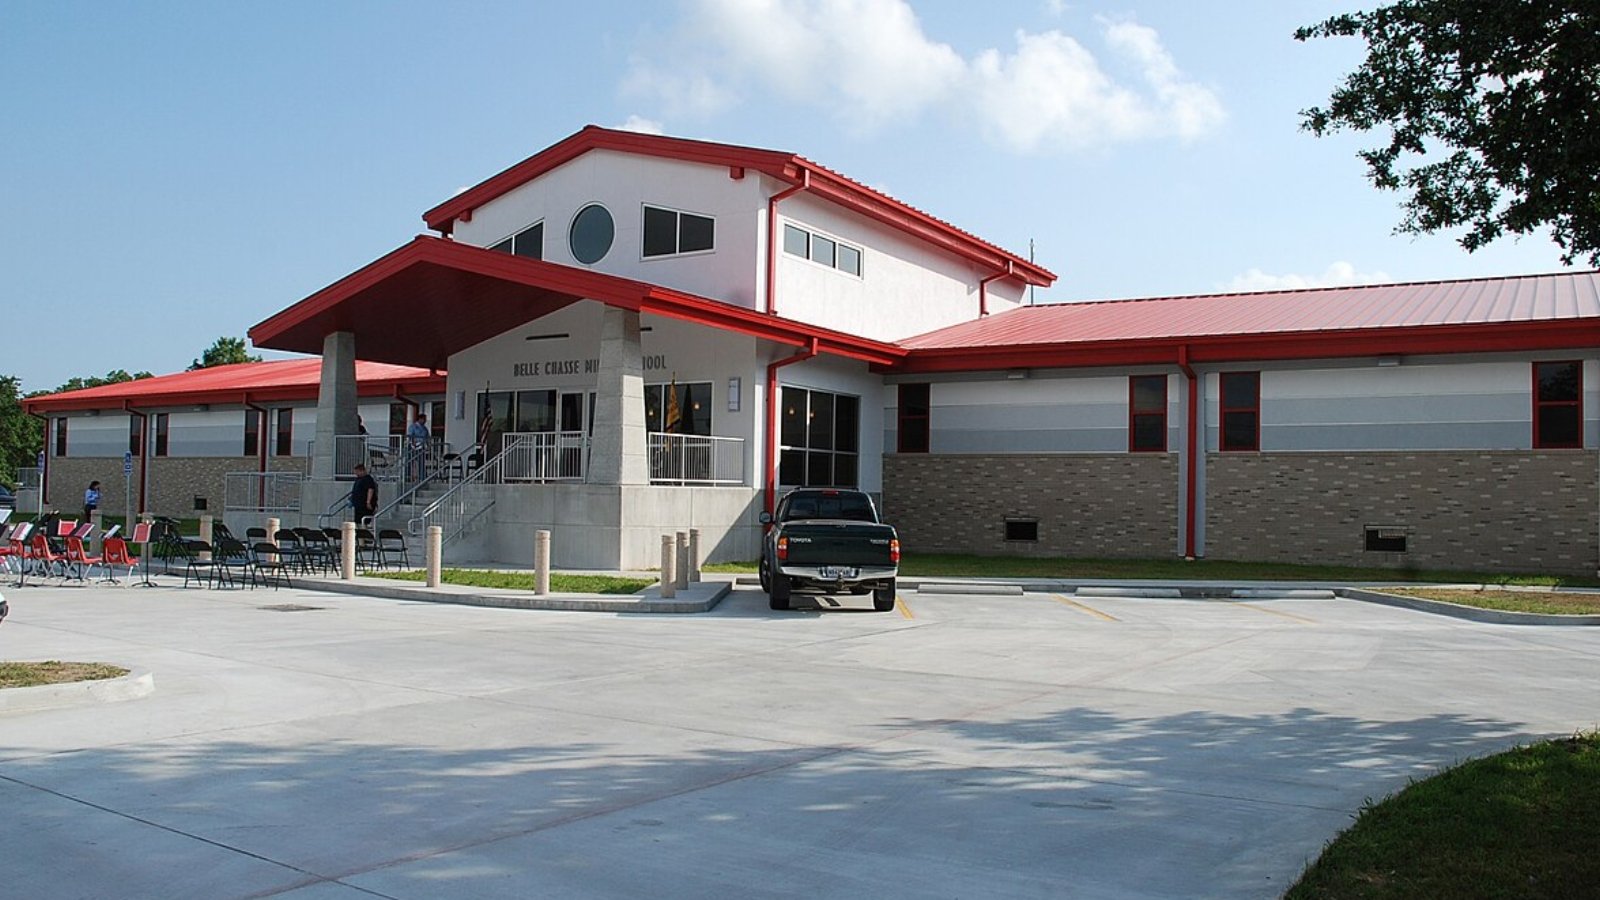
Vienna – Quiet Living With Ruston Proximity
Vienna is a small, rural town located just north of Ruston in Lincoln Parish. Its size and limited housing stock mean that home values here can be heavily influenced by a small number of sales. This makes price trends somewhat erratic year-to-year compared to larger towns.
Despite the fluctuations, Vienna remains attractive to those seeking privacy and acreage within commuting distance of Louisiana Tech University and downtown Ruston. The recent stabilization in pricing reflects slow but steady interest from buyers who value quiet living and proximity to larger amenities.
6. Mandeville – 49% Home Price Increase Since 2010

- 2010: $247,962
- 2011: $245,682 (−$2,280, −0.92% from previous year)
- 2012: $231,996 (−$13,686, −5.57% from previous year)
- 2013: $247,291 (+$15,295, +6.60% from previous year)
- 2014: $254,355 (+$7,064, +2.86% from previous year)
- 2015: $260,741 (+$6,386, +2.51% from previous year)
- 2016: $265,661 (+$4,920, +1.89% from previous year)
- 2017: $271,000 (+$5,339, +2.01% from previous year)
- 2018: $280,843 (+$9,843, +3.63% from previous year)
- 2019: $289,671 (+$8,828, +3.14% from previous year)
- 2020: $308,171 (+$18,500, +6.39% from previous year)
- 2021: $340,188 (+$32,017, +10.39% from previous year)
- 2022: $356,726 (+$16,538, +4.86% from previous year)
- 2023: $365,002 (+$8,276, +2.32% from previous year)
- 2024: $369,715 (+$4,713, +1.29% from previous year)
- 2025: $370,681 (+$966, +0.26% from previous year)
Mandeville’s home values rose from $247,962 in 2010 to $370,681 in 2025, representing a 49% increase. After a dip in 2012, prices steadily climbed year after year, with a particularly strong surge beginning in 2020.
Mandeville – Northshore Demand Keeps Prices High
Mandeville sits on the north shore of Lake Pontchartrain, offering quick access to New Orleans via the Causeway Bridge. It’s a favorite among commuters and families alike, with top-rated public schools, waterfront views, and a thriving local culture.
The housing market here surged during the early 2020s and has remained strong, thanks to its blend of natural beauty, walkable neighborhoods, and urban proximity. Though growth has leveled off recently, demand remains steady, keeping Mandeville among the most expensive towns in Louisiana.
5. Stonewall – 70% Home Price Increase Since 2010
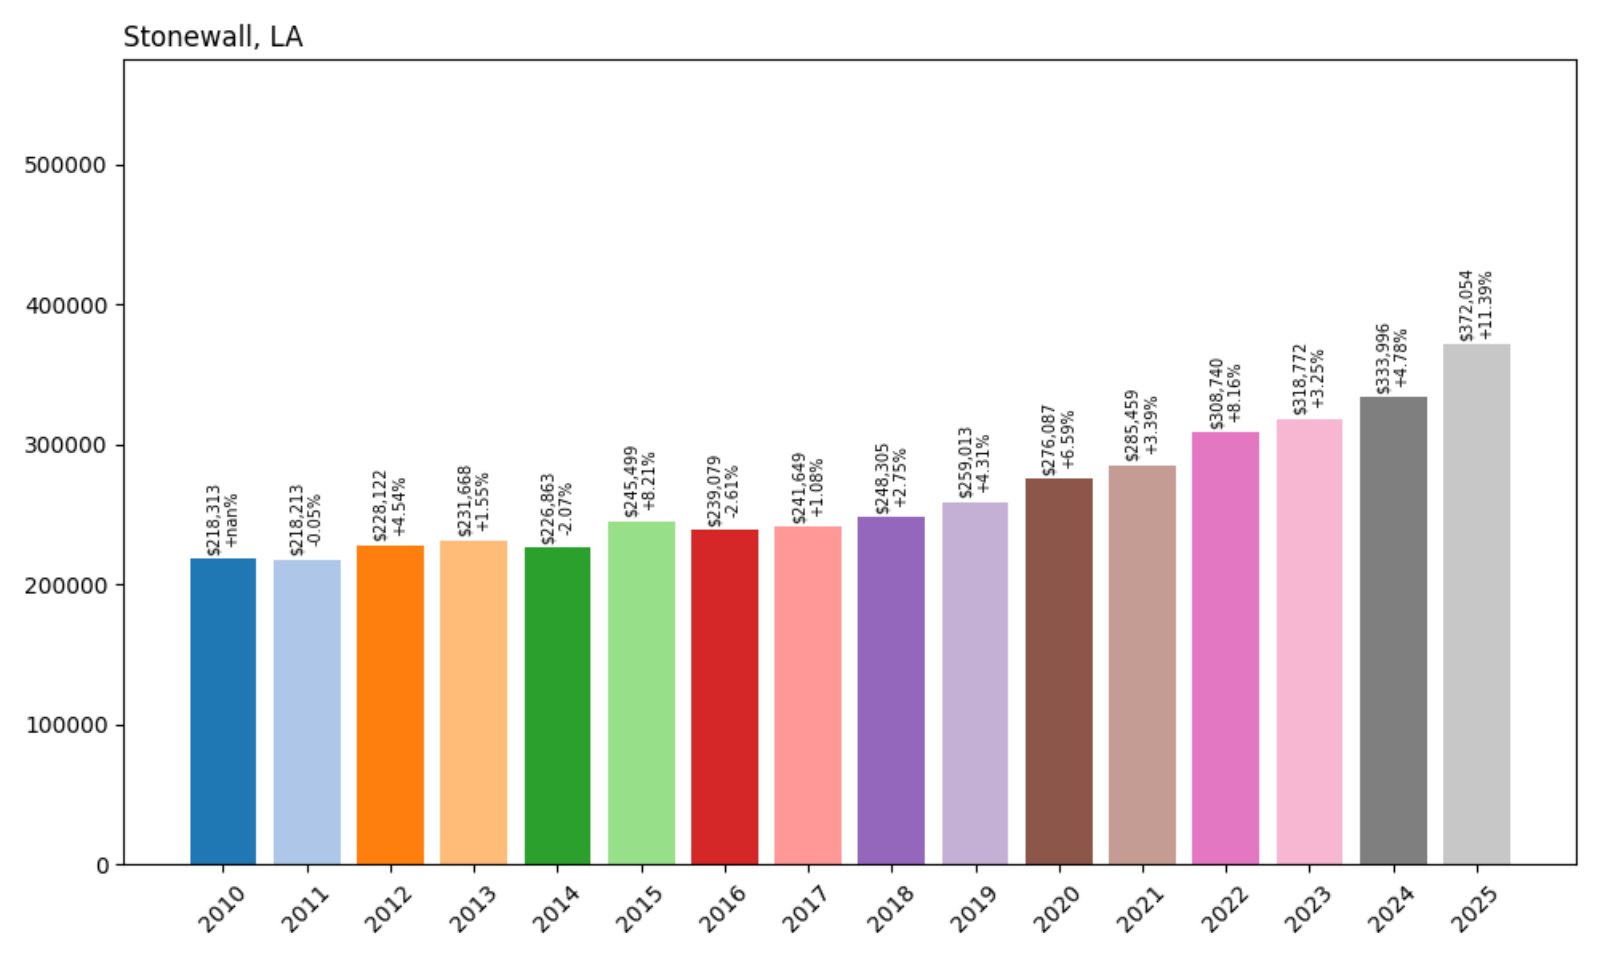
- 2010: $218,313
- 2011: $218,213 (−$100, −0.05% from previous year)
- 2012: $228,122 (+$9,909, +4.54% from previous year)
- 2013: $231,668 (+$3,546, +1.55% from previous year)
- 2014: $226,863 (−$4,805, −2.07% from previous year)
- 2015: $245,499 (+$18,636, +8.21% from previous year)
- 2016: $239,079 (−$6,420, −2.61% from previous year)
- 2017: $241,649 (+$2,570, +1.08% from previous year)
- 2018: $248,305 (+$6,656, +2.75% from previous year)
- 2019: $259,013 (+$10,708, +4.31% from previous year)
- 2020: $276,087 (+$17,074, +6.59% from previous year)
- 2021: $285,459 (+$9,372, +3.39% from previous year)
- 2022: $308,740 (+$23,281, +8.16% from previous year)
- 2023: $318,772 (+$10,032, +3.25% from previous year)
- 2024: $333,996 (+$15,224, +4.77% from previous year)
- 2025: $372,054 (+$38,058, +11.40% from previous year)
Stonewall’s home values climbed from $218,313 in 2010 to $372,054 in 2025 — a 70% increase. Though the town saw minor dips in a few years, overall the trend has been steadily upward, with a major acceleration in the early 2020s.
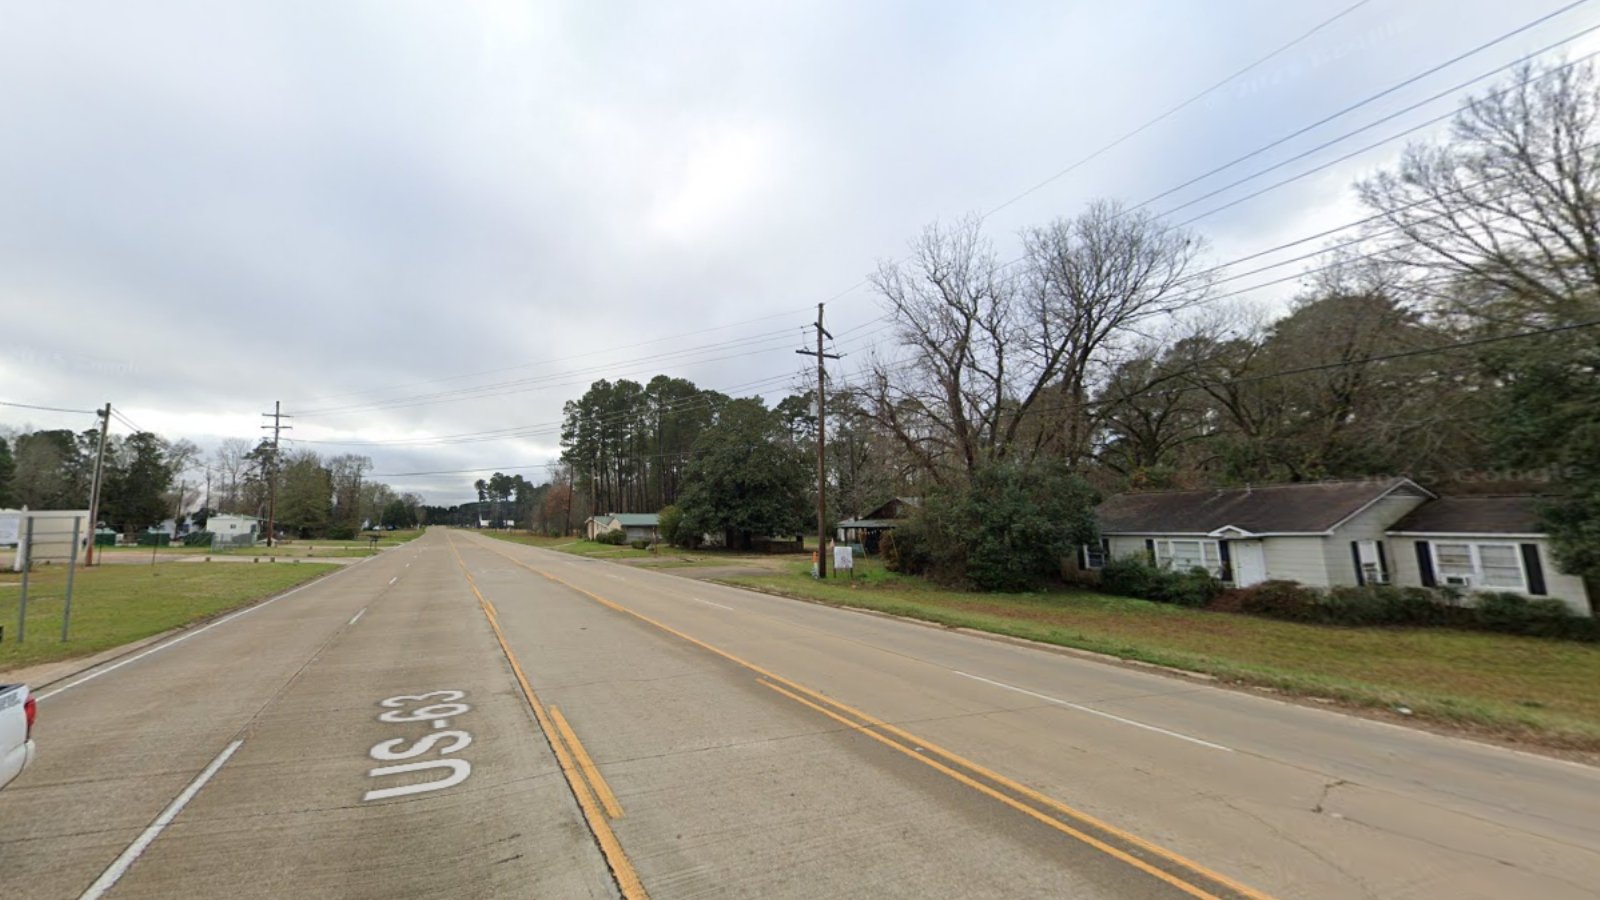
Stonewall – Fast-Growing Suburb South of Shreveport
Stonewall is a small but fast-growing town located in DeSoto Parish, just south of Shreveport. Its popularity has grown significantly in recent years due to suburban spillover, new construction, and strong school systems in the area.
The sharp rise in home prices since 2020 reflects rising demand for spacious, affordable housing outside the city core. Families and professionals alike have flocked to Stonewall for its quiet streets, modern homes, and quick access to nearby job centers. With double-digit price growth in 2024 and 2025, it’s become one of the strongest-performing real estate markets in the state.
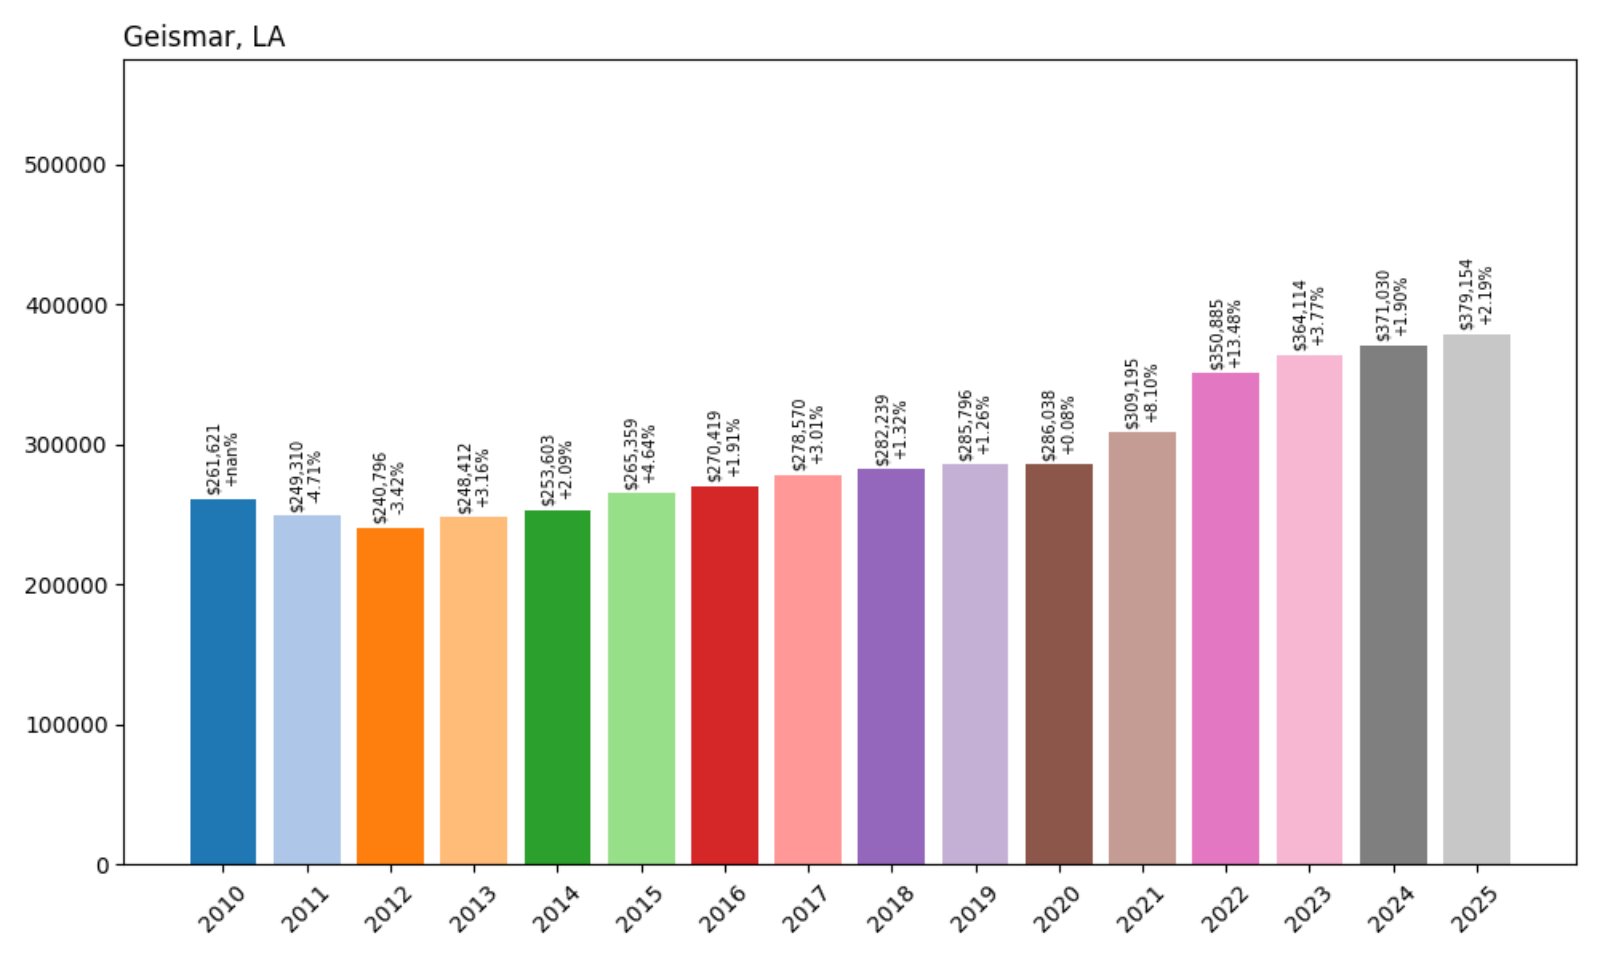
4. Geismar – 45% Home Price Increase Since 2010
- 2010: $261,163
- 2011: $250,633 (−$10,530, −4.03% from previous year)
- 2012: $256,113 (+$5,480, +2.19% from previous year)
- 2013: $257,104 (+$991, +0.39% from previous year)
- 2014: $256,650 (−$454, −0.18% from previous year)
- 2015: $268,779 (+$12,129, +4.73% from previous year)
- 2016: $271,384 (+$2,605, +0.97% from previous year)
- 2017: $274,880 (+$3,496, +1.29% from previous year)
- 2018: $278,689 (+$3,809, +1.39% from previous year)
- 2019: $290,032 (+$11,343, +4.07% from previous year)
- 2020: $306,844 (+$16,812, +5.80% from previous year)
- 2021: $335,180 (+$28,336, +9.23% from previous year)
- 2022: $359,255 (+$24,075, +7.18% from previous year)
- 2023: $368,373 (+$9,118, +2.54% from previous year)
- 2024: $371,048 (+$2,675, +0.73% from previous year)
- 2025: $379,154 (+$8,106, +2.18% from previous year)
Geismar’s home values rose from $261,163 in 2010 to $379,154 in 2025 — a 45% increase over 15 years. Most of that growth occurred after 2019, driven by consistent gains and particularly sharp jumps from 2020 onward.
Geismar – Industry Meets Upscale Suburb
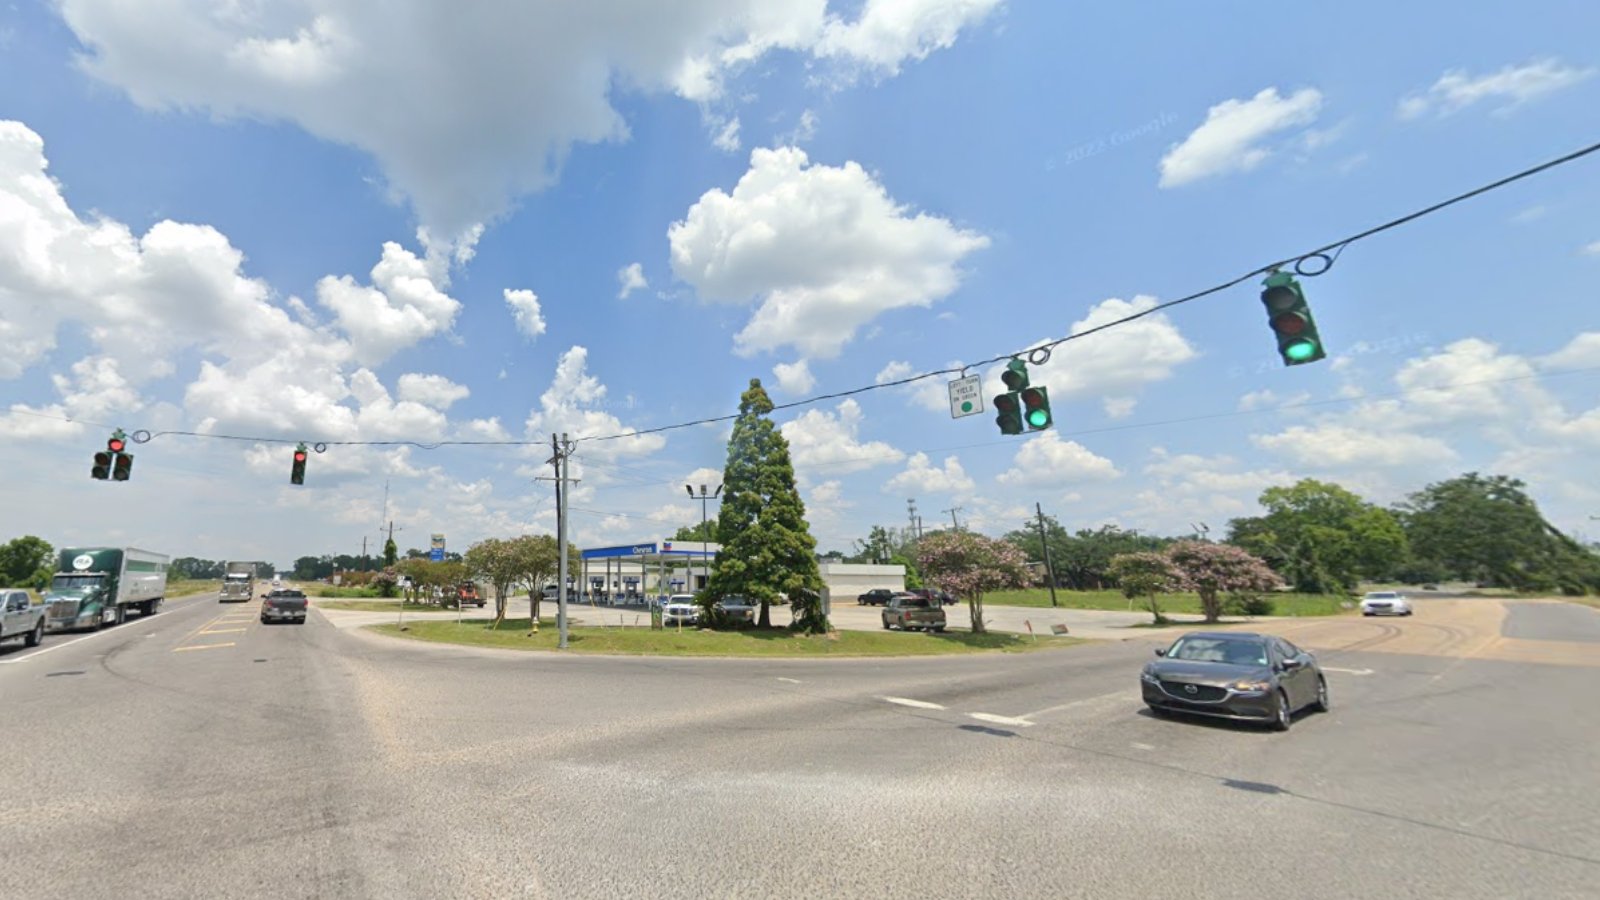
Geismar is located along the Mississippi River in Ascension Parish, about halfway between Baton Rouge and Gonzales. It’s known for its major chemical plants, but it also offers well-established residential communities and access to some of the best-rated schools in the region.
Despite being an industrial hub, Geismar’s housing market reflects strong suburban appeal — large homes, newer developments, and quick access to high-wage employment. That combination helped drive prices up quickly during the early 2020s, even as nearby markets cooled.
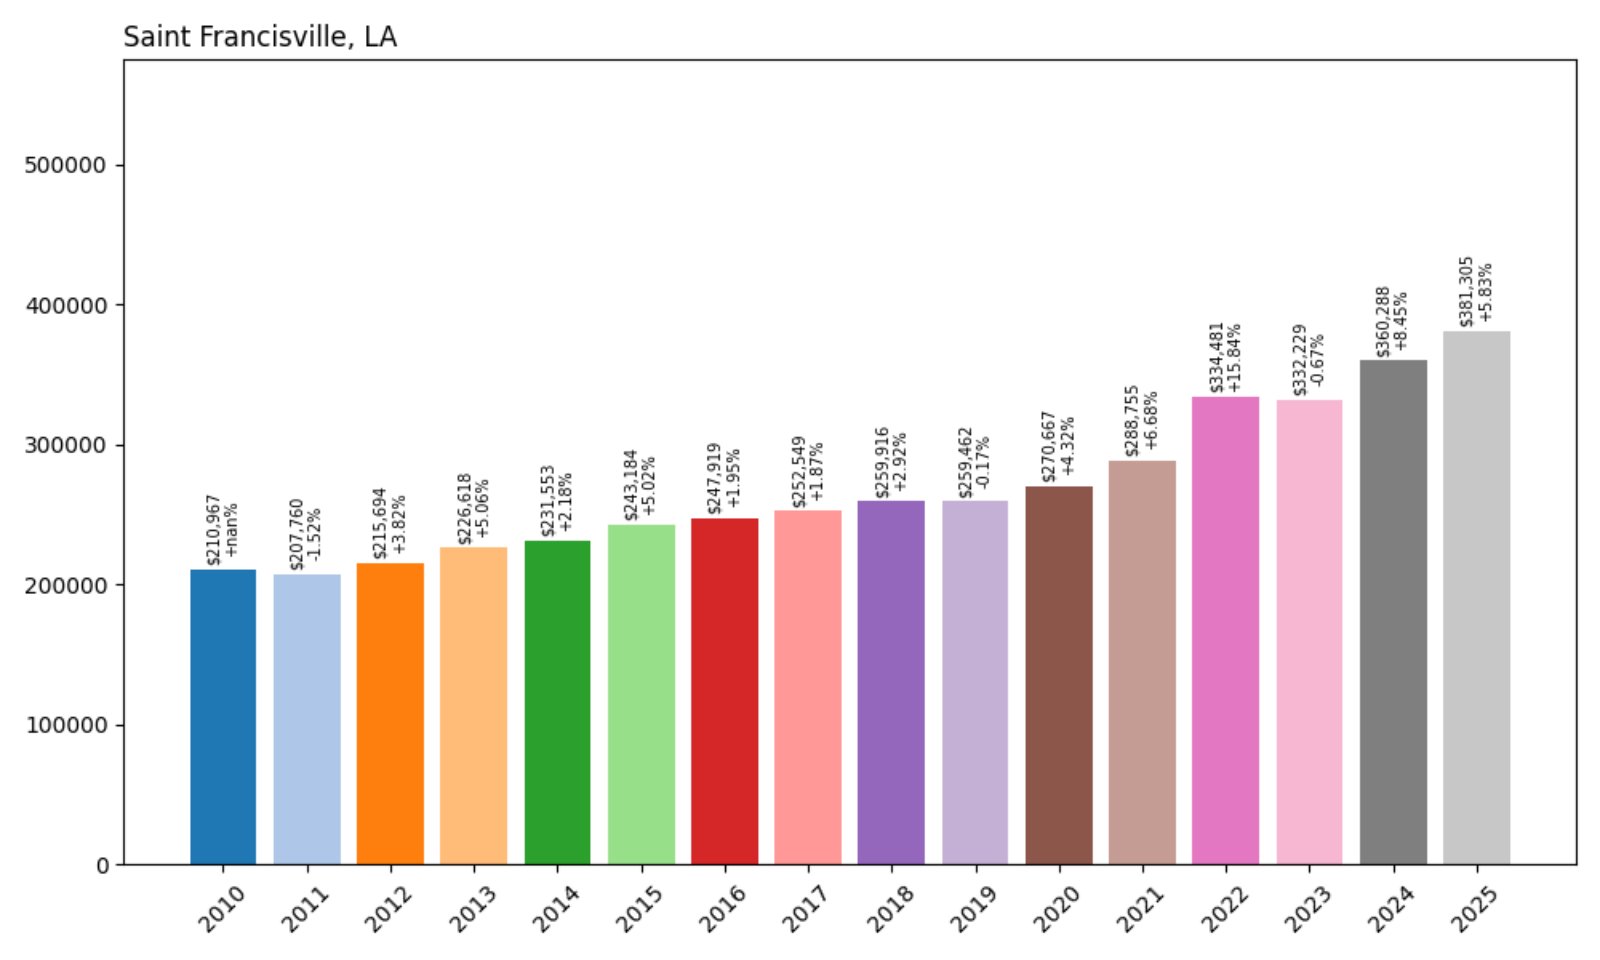
3. Saint Francisville – 81% Home Price Increase Since 2010
- 2010: $210,967
- 2011: $207,760 (−$3,207, −1.52% from previous year)
- 2012: $215,694 (+$7,934, +3.82% from previous year)
- 2013: $226,618 (+$10,924, +5.07% from previous year)
- 2014: $231,553 (+$4,935, +2.18% from previous year)
- 2015: $243,184 (+$11,631, +5.02% from previous year)
- 2016: $247,919 (+$4,735, +1.95% from previous year)
- 2017: $252,549 (+$4,630, +1.87% from previous year)
- 2018: $259,916 (+$7,367, +2.92% from previous year)
- 2019: $259,462 (−$454, −0.17% from previous year)
- 2020: $270,667 (+$11,205, +4.32% from previous year)
- 2021: $288,755 (+$18,088, +6.68% from previous year)
- 2022: $334,481 (+$45,726, +15.83% from previous year)
- 2023: $332,229 (−$2,252, −0.67% from previous year)
- 2024: $360,288 (+$28,059, +8.44% from previous year)
- 2025: $381,305 (+$21,017, +5.83% from previous year)
Home values in Saint Francisville rose from $210,967 in 2010 to $381,305 in 2025 — an impressive 81% increase. Most of the growth happened after 2020, particularly in 2022, which saw a jump of more than 15% in a single year.
Saint Francisville – Scenic Bluffside Living Near Baton Rouge
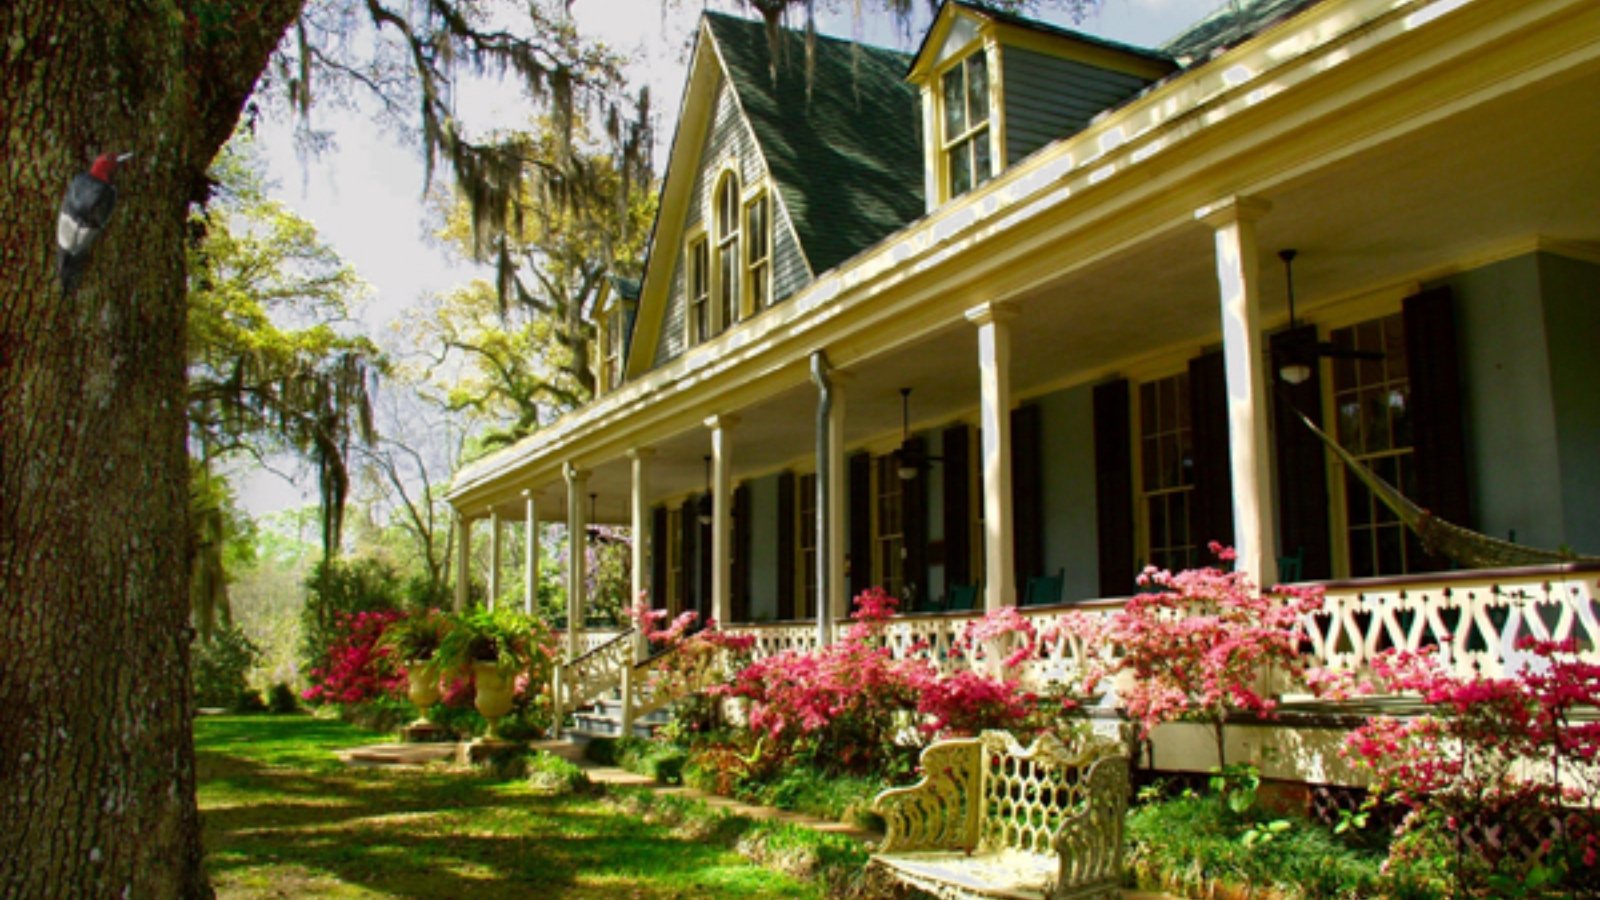
Saint Francisville sits on the bluffs above the Mississippi River in West Feliciana Parish. Known for its well-preserved historic homes, plantation sites, and walkable downtown, it’s a place where Southern charm and elevated living go hand in hand.
The housing market here stayed relatively stable until 2020, when demand for small-town living with easy access to Baton Rouge began to take off. Strong schools, beautiful landscapes, and a tight-knit community have all contributed to recent price spikes, especially among buyers seeking space and heritage-rich architecture.
2. Madisonville – 43% Home Price Increase Since 2010
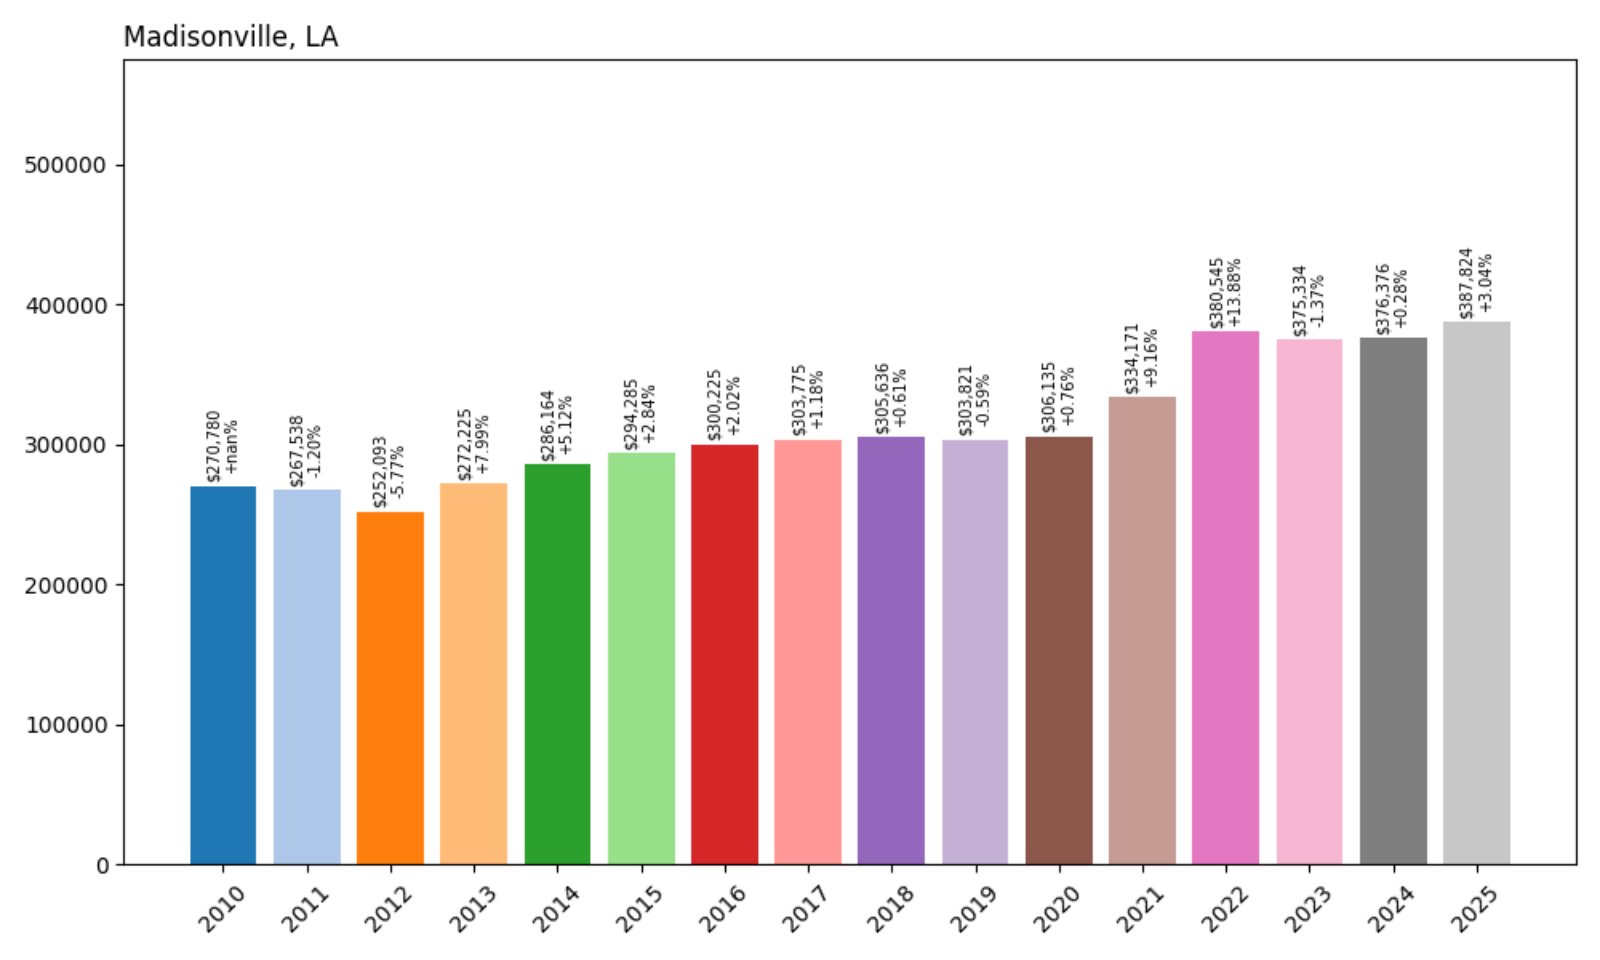
- 2010: $270,780
- 2011: $267,538 (−$3,242, −1.20% from previous year)
- 2012: $252,093 (−$15,445, −5.77% from previous year)
- 2013: $272,225 (+$20,132, +7.98% from previous year)
- 2014: $286,164 (+$13,939, +5.12% from previous year)
- 2015: $294,285 (+$8,121, +2.84% from previous year)
- 2016: $300,225 (+$5,940, +2.02% from previous year)
- 2017: $303,775 (+$3,550, +1.18% from previous year)
- 2018: $305,636 (+$1,861, +0.61% from previous year)
- 2019: $303,821 (−$1,815, −0.59% from previous year)
- 2020: $306,135 (+$2,314, +0.76% from previous year)
- 2021: $334,171 (+$28,036, +9.16% from previous year)
- 2022: $380,545 (+$46,374, +13.88% from previous year)
- 2023: $375,334 (−$5,211, −1.37% from previous year)
- 2024: $376,376 (+$1,042, +0.28% from previous year)
- 2025: $387,824 (+$11,448, +3.04% from previous year)
Madisonville’s home values jumped from $270,780 in 2010 to $387,824 in 2025 — a 43% increase. The market moved slowly for much of the 2010s before rising sharply from 2020 onward.
Madisonville – Waterfront Living With Upscale Appeal
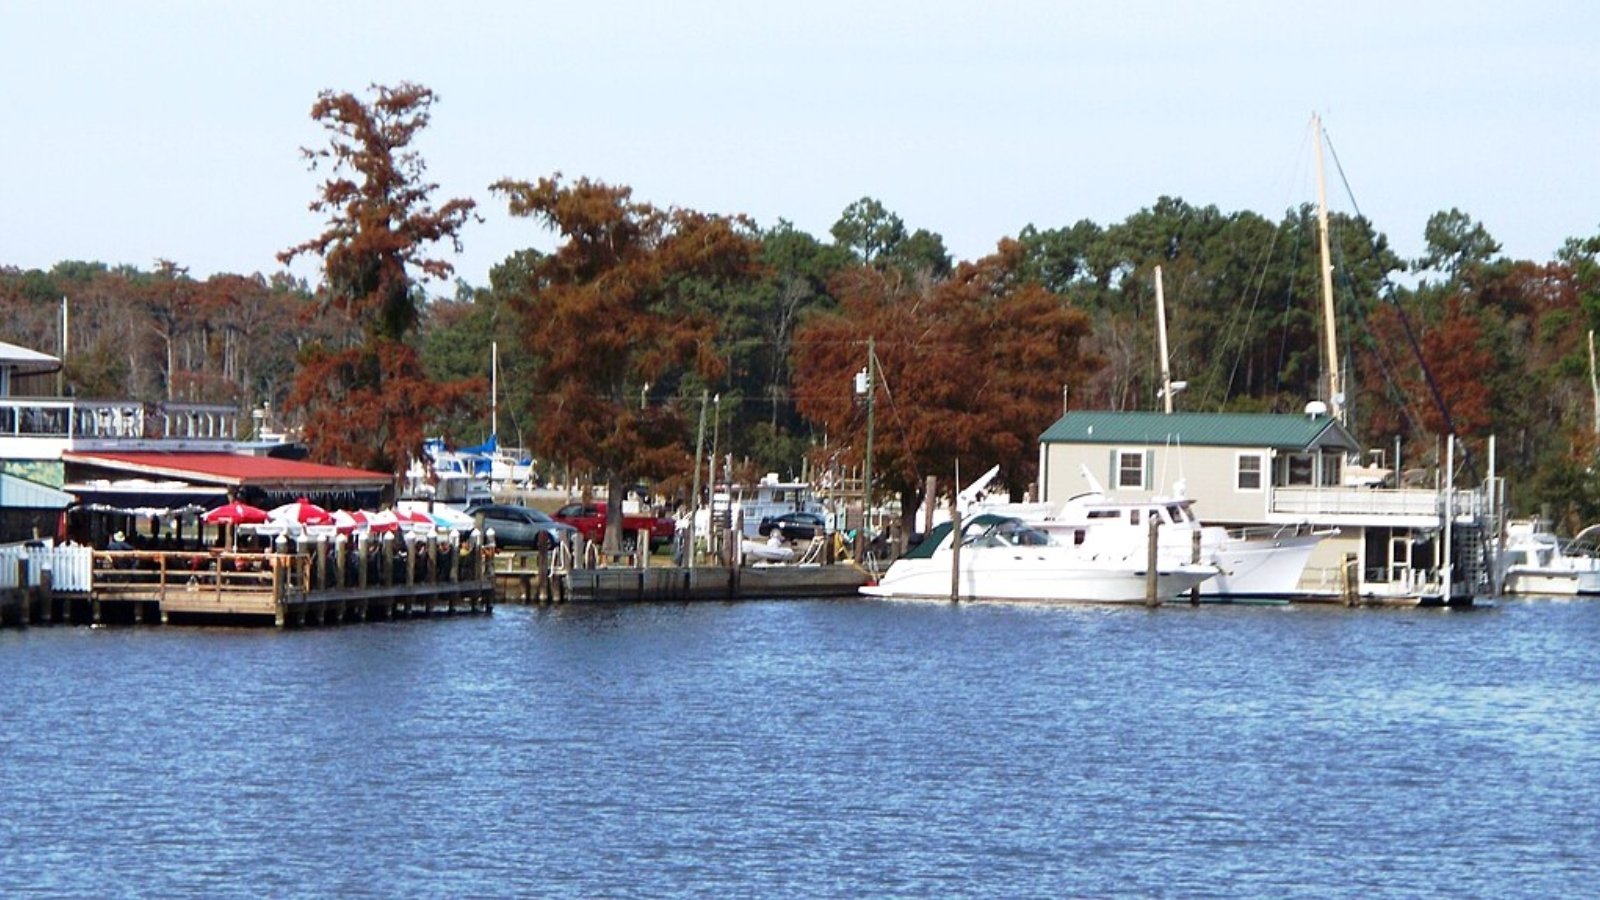
Located on the Tchefuncte River in St. Tammany Parish, Madisonville has become one of the Northshore’s most desirable towns. Known for its marina lifestyle, upscale homes, and proximity to Covington and Mandeville, it has drawn affluent buyers looking for access to nature and high-end amenities.
Price gains were modest through the mid-2010s, but a burst of post-pandemic demand pushed values to new highs, especially between 2020 and 2022. Today, Madisonville remains one of the most expensive places to buy in Louisiana — and one of the most scenic.
1. Elmwood – 19% Home Price Increase Since 2010
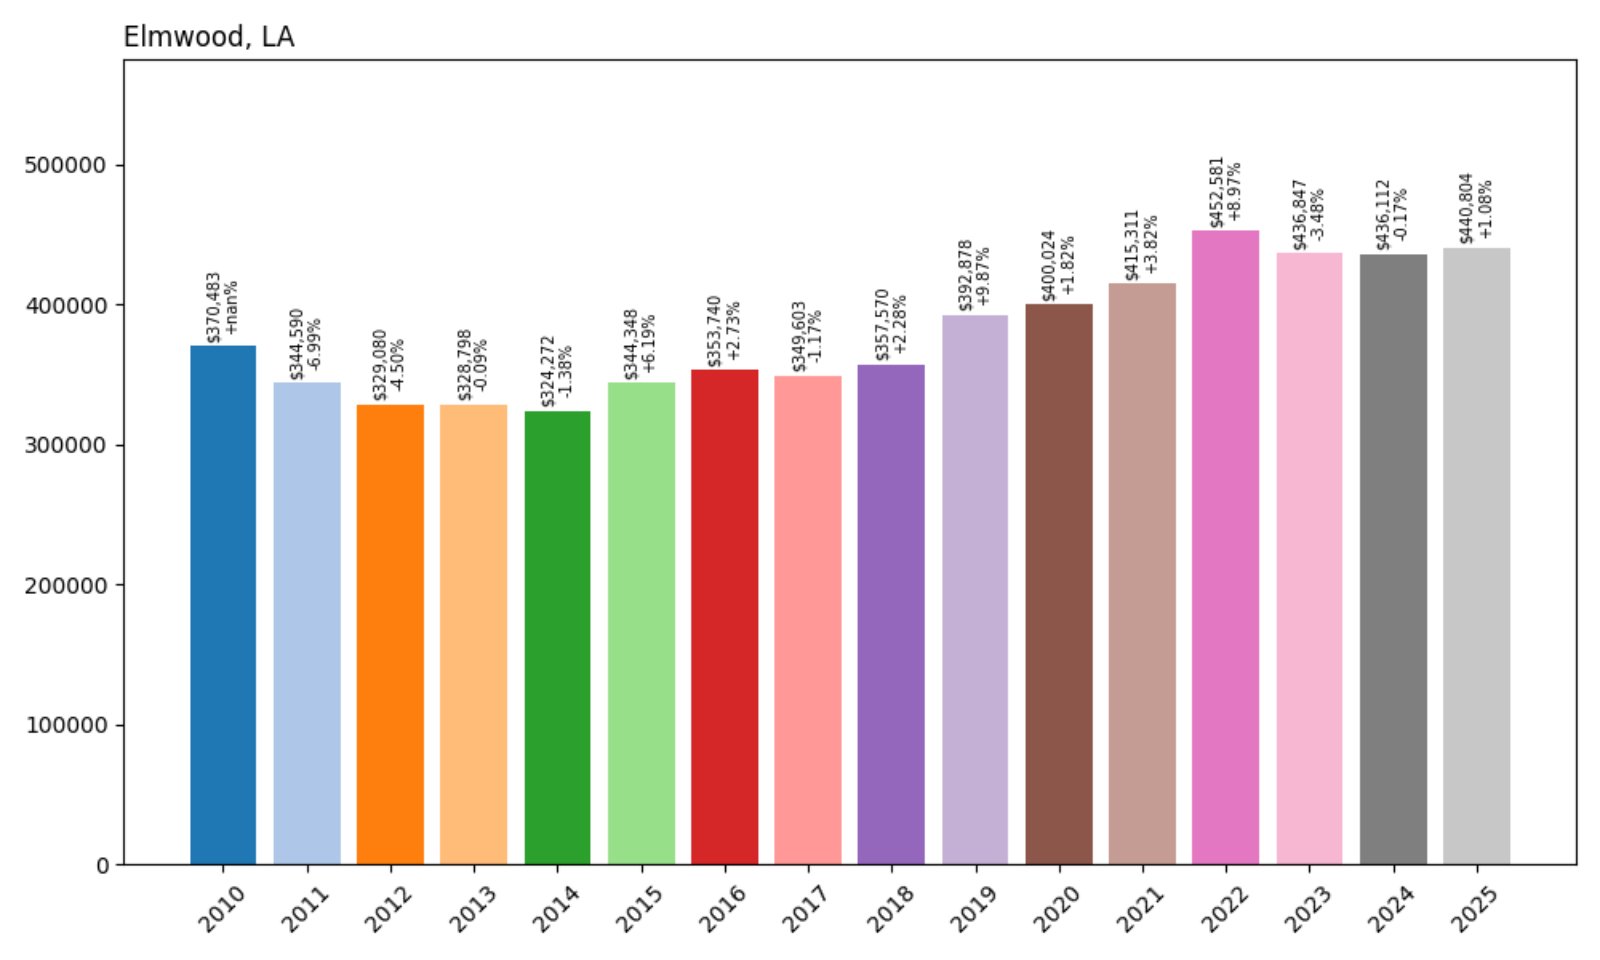
- 2010: $370,483
- 2011: $344,590 (−$25,893, −6.99% from previous year)
- 2012: $329,080 (−$15,510, −4.50% from previous year)
- 2013: $328,798 (−$282, −0.09% from previous year)
- 2014: $324,272 (−$4,526, −1.38% from previous year)
- 2015: $344,348 (+$20,076, +6.19% from previous year)
- 2016: $353,740 (+$9,392, +2.73% from previous year)
- 2017: $349,603 (−$4,137, −1.17% from previous year)
- 2018: $357,570 (+$7,967, +2.28% from previous year)
- 2019: $392,878 (+$35,308, +9.87% from previous year)
- 2020: $400,024 (+$7,146, +1.82% from previous year)
- 2021: $415,311 (+$15,287, +3.82% from previous year)
- 2022: $452,581 (+$37,270, +8.97% from previous year)
- 2023: $436,847 (−$15,734, −3.48% from previous year)
- 2024: $436,112 (−$735, −0.17% from previous year)
- 2025: $440,804 (+$4,692, +1.08% from previous year)
Elmwood tops the list with a 2025 home value of $440,804. That’s a 19% increase from 2010 — not the highest percentage-wise, but Elmwood has long had some of the most expensive real estate in Louisiana.
Elmwood – Suburban Commercial Hub With Rising Demand
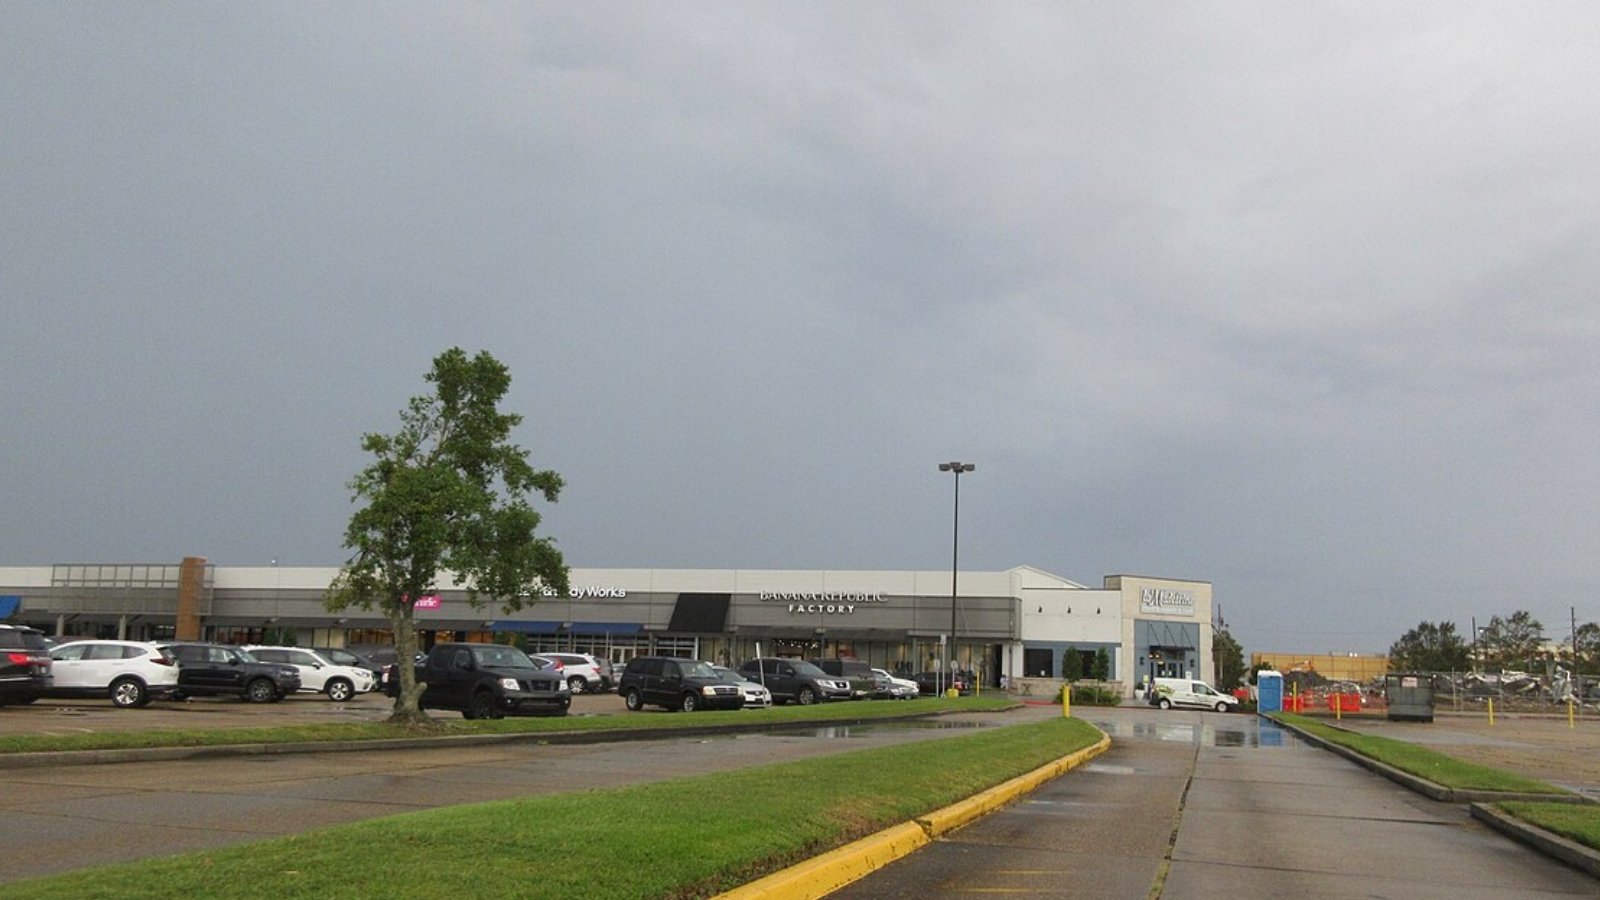
Elmwood lies just outside New Orleans in Jefferson Parish, offering a blend of residential neighborhoods and major retail centers. It’s home to Elmwood Shopping Center and various businesses, making it a high-traffic area with strong property values.
Prices saw dips in the early 2010s before rising sharply between 2019 and 2022. While growth has slowed more recently, Elmwood’s strategic location and commercial infrastructure continue to keep home values among the highest in the state.


