
🔥 Would you like to save this?
I’ve analyzed home value data from the Zillow Home Value Index to identify Maryland’s neighborhoods with the most dramatic price appreciation. These 25 areas have experienced remarkable growth, with some values more than tripling over just nine years.
Looking at the data, I’m struck by how Baltimore dominates this list, showing signs of urban revitalization despite its challenges. What’s particularly interesting is that neighborhoods with the lowest starting values often saw the highest percentage increases, though actual dollar amounts remain modest compared to Maryland’s more affluent areas.
In order to come up with the very specific design ideas, we create most designs with the assistance of state-of-the-art AI interior design software. Also, assume links that take you off the site are affiliate links such as links to Amazon. this means we may earn a commission if you buy something.
Digging deeper into these numbers reveals investment opportunities in emerging neighborhoods that might still be overlooked by mainstream buyers. Several areas show acceleration in recent years after slower early growth, suggesting momentum is building rather than fading.
25. Walbrook
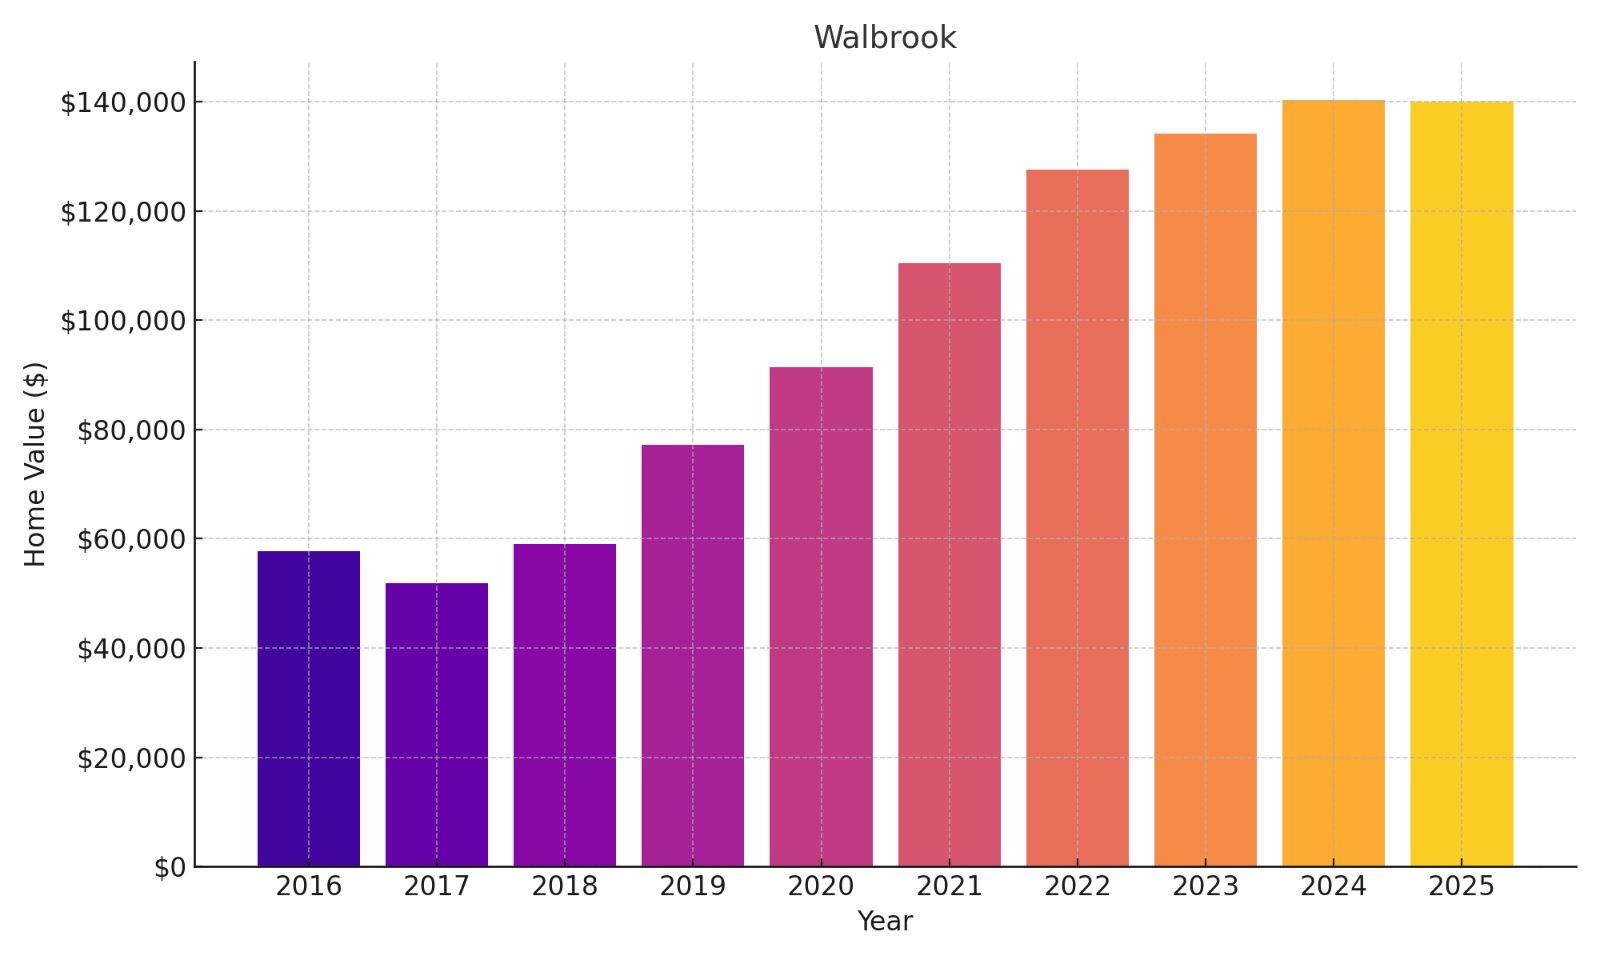
- % change from 2016 to 2025: 142.56%
- 2025: $140,023
- 2024: $140,355
- 2023: $134,130
- 2022: $127,523
- 2021: $110,356
- 2020: $91,403
- 2019: $77,134
- 2018: $59,050
- 2017: $51,918
- 2016: $57,728
Your investment would have more than doubled in Walbrook, showing healthy appreciation despite recent plateauing. The neighborhood’s consistent yearly growth pattern suggests sustainable demand rather than speculative bubbles. Located in western Baltimore, Walbrook represents an entry-level opportunity with substantial upside potential as surrounding areas develop.
24. Wilson Park

- % change from 2016 to 2025: 143.30%
- 2025: $120,522
- 2024: $119,113
- 2023: $115,673
- 2022: $110,390
- 2021: $97,270
- 2020: $79,972
- 2019: $68,058
- 2018: $62,863
- 2017: $60,478
- 2016: $49,536
Your capital would have expanded 2.4x in Wilson Park, with particularly strong gains during the post-pandemic surge. The steady climb through 2025 suggests this northern Baltimore neighborhood still has room to grow despite its relative affordability. For investors, the consistent year-over-year appreciation represents reduced volatility risk compared to some faster-growing but more erratic markets.
23. Northwest Community Action
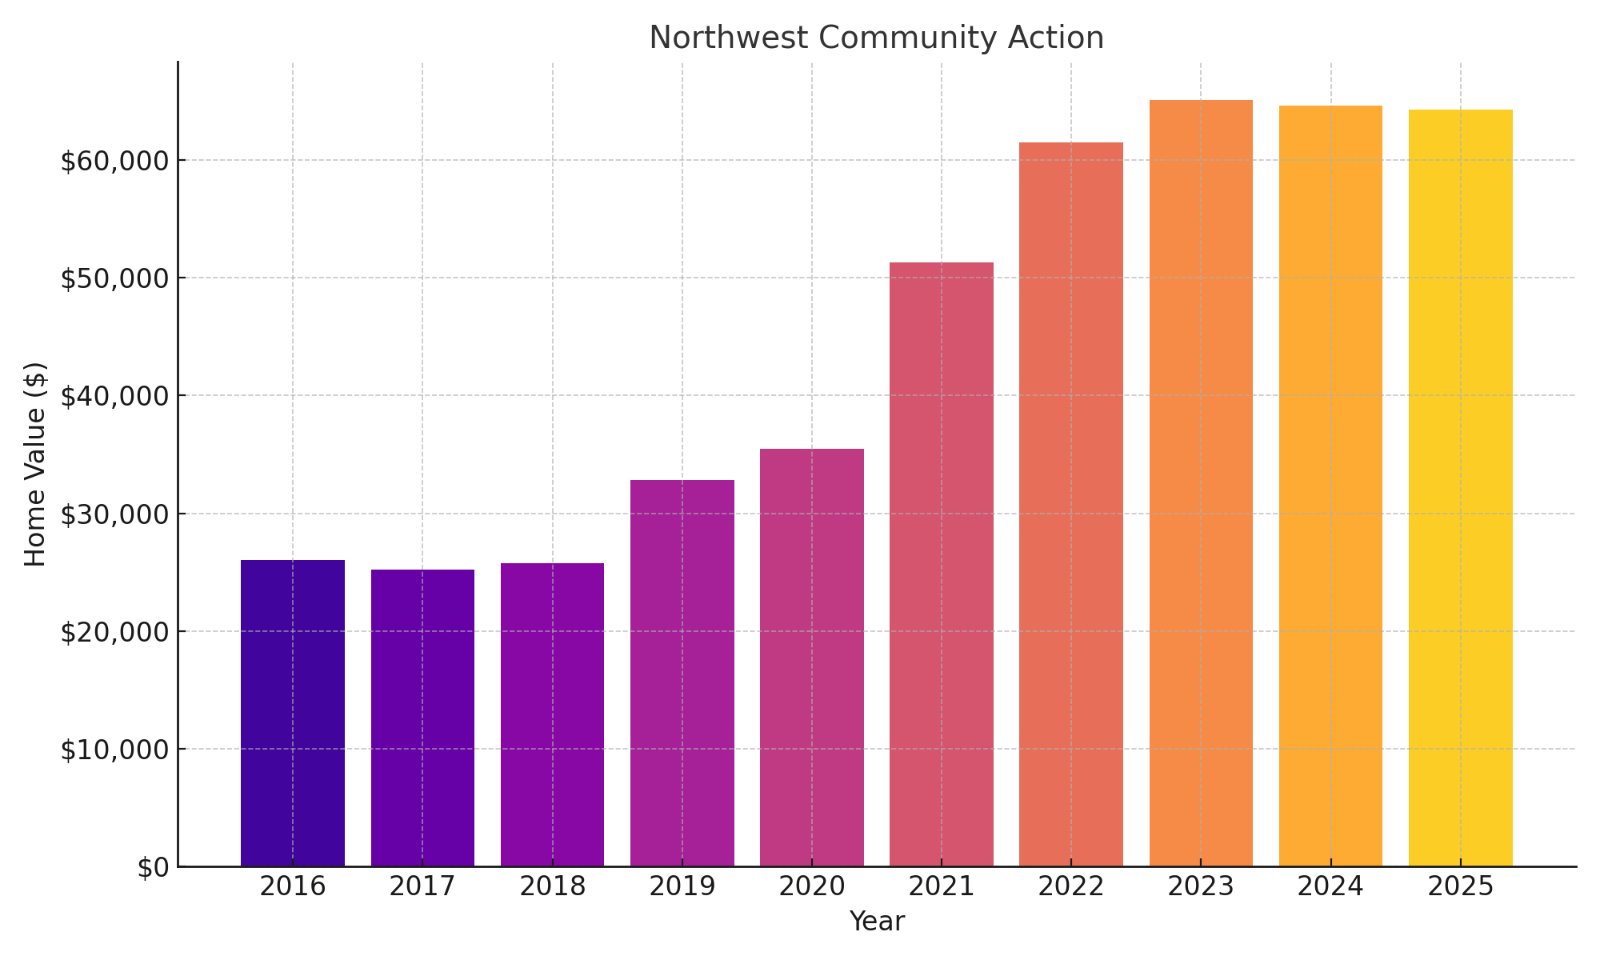
- % change from 2016 to 2025: 146.73%
- 2025: $64,265
- 2024: $64,605
- 2023: $65,125
- 2022: $61,477
- 2021: $51,317
- 2020: $35,475
- 2019: $32,826
- 2018: $25,750
- 2017: $25,228
- 2016: $26,047
Your investment here would have seen dramatic growth, especially during the 2020-2021 period where values jumped nearly 45%. This extremely affordable section of Baltimore offers tremendous percentage returns despite low absolute values. The slight price retreat over 2023-2025 suggests buyers should exercise caution, watching for stabilization before committing capital to this emerging district.
22. Winston-Govans
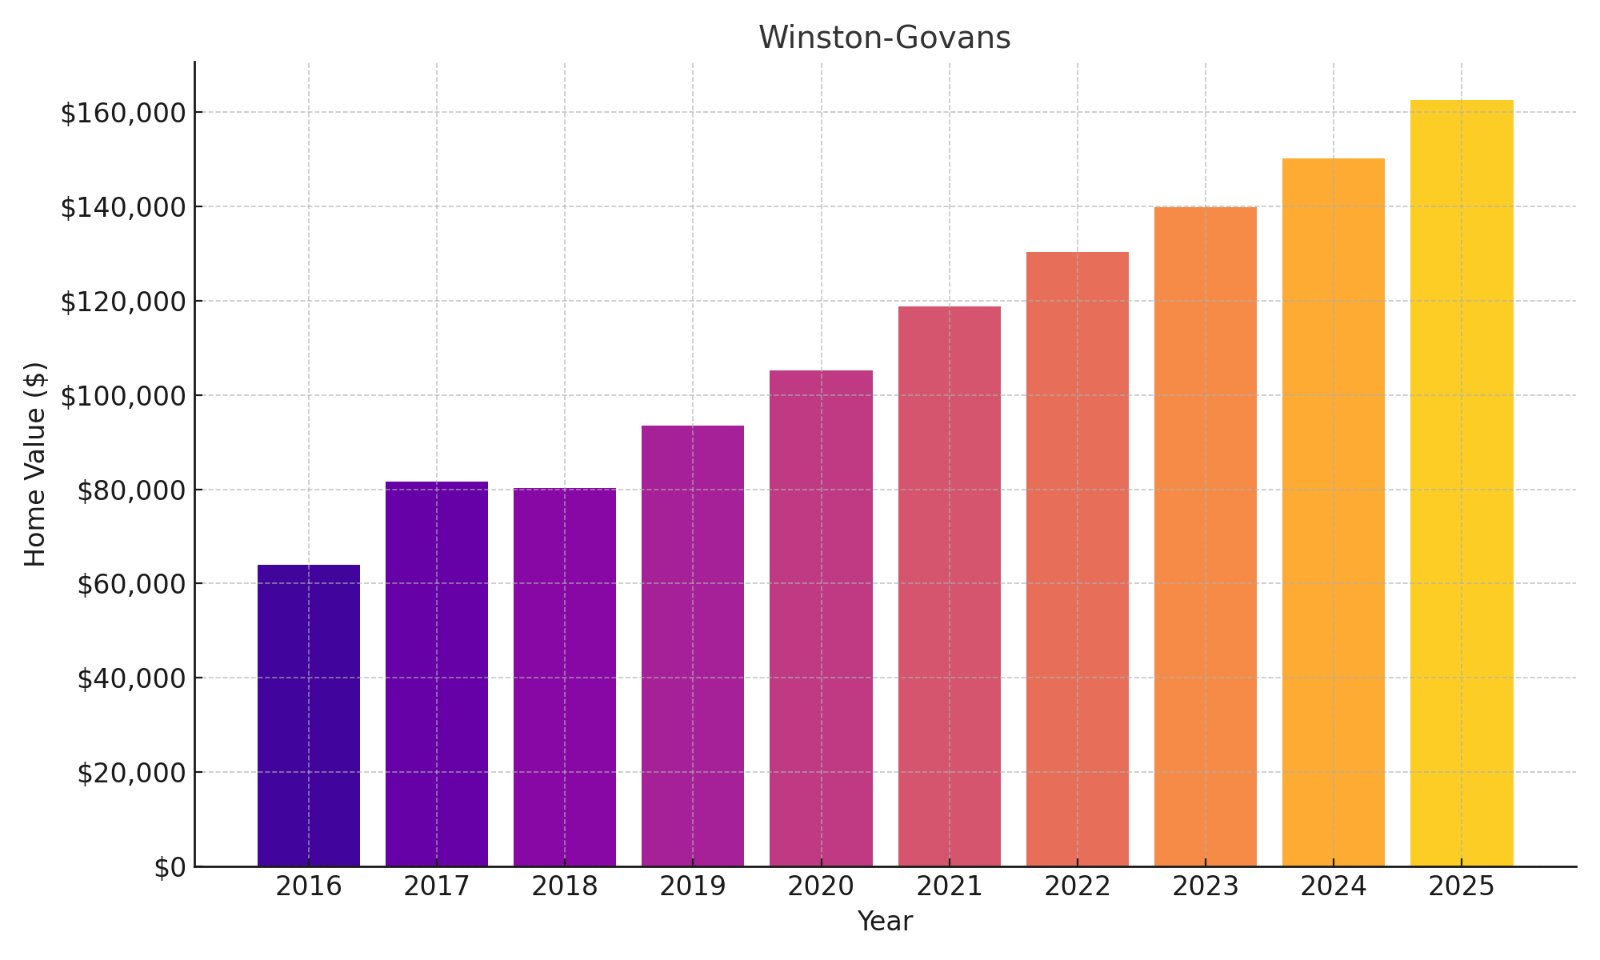
- % change from 2016 to 2025: 154.19%
- 2025: $162,607
- 2024: $150,197
- 2023: $139,836
- 2022: $130,346
- 2021: $118,779
- 2020: $105,246
- 2019: $93,434
- 2018: $80,333
- 2017: $81,636
- 2016: $63,970
Your property value would have more than doubled while showing remarkable consistency in annual growth rates. Winston-Govans stands out for its unbroken upward trajectory and continued acceleration even into 2025. This northern Baltimore neighborhood demonstrates strong fundamentals rather than speculative fever, making it attractive for buy-and-hold investors seeking stability with impressive returns.
21. Westport
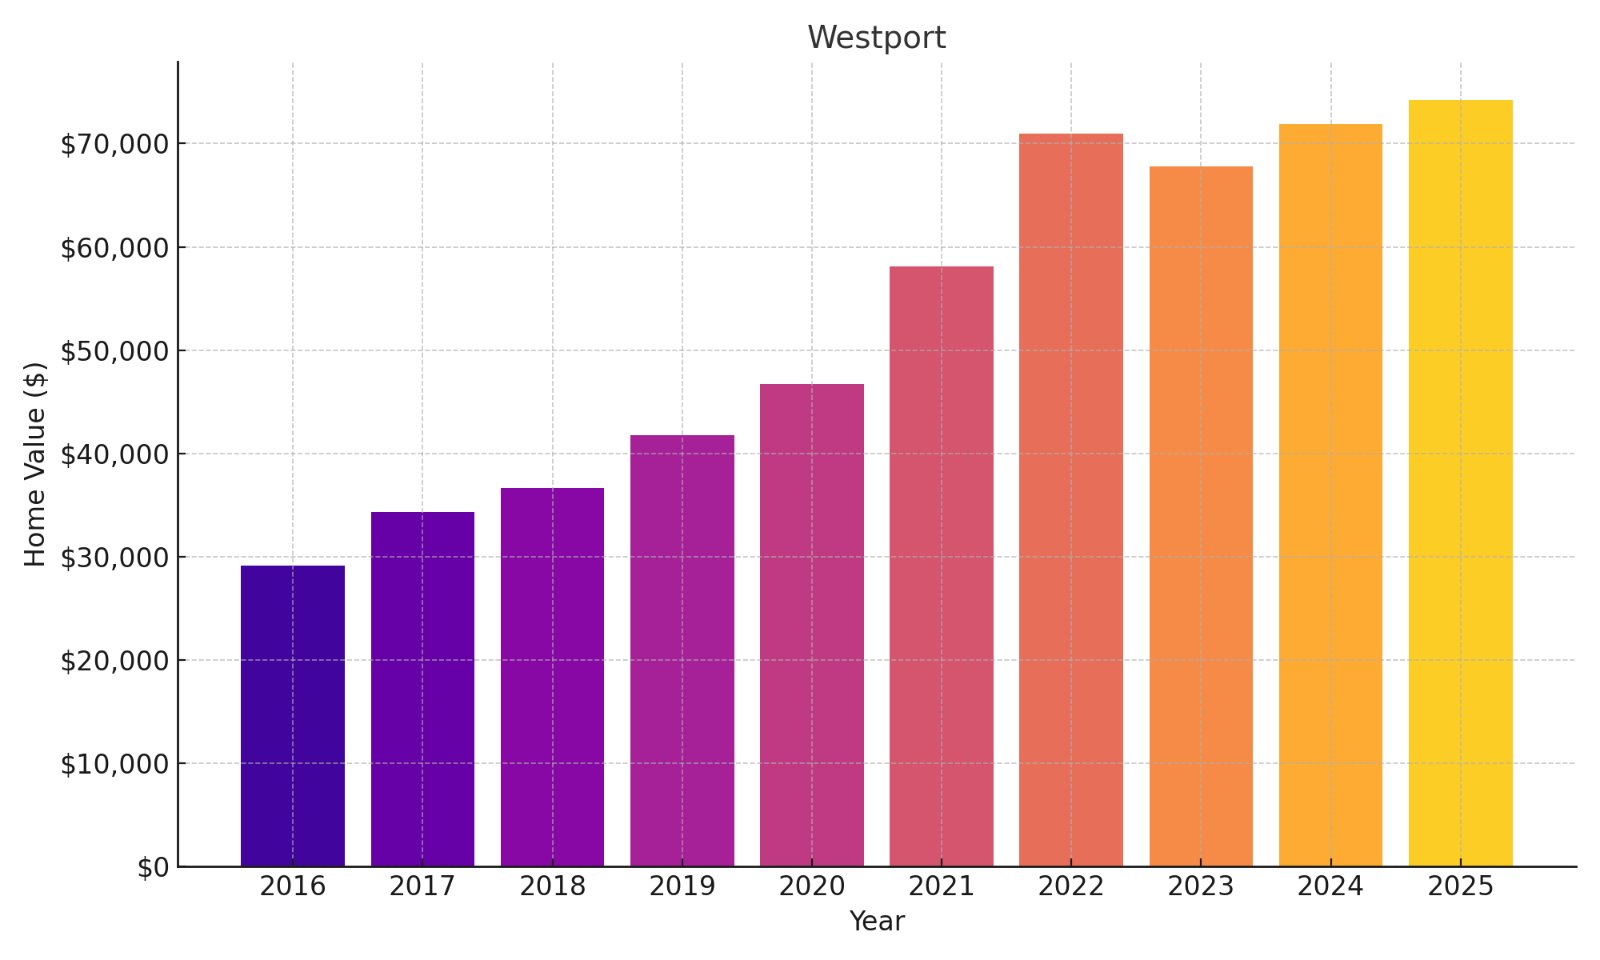
- % change from 2016 to 2025: 154.97%
- 2025: $74,249
- 2024: $71,861
- 2023: $67,806
- 2022: $70,936
- 2021: $58,096
- 2020: $46,692
- 2019: $41,761
- 2018: $36,673
- 2017: $34,327
- 2016: $29,121
Your investment could have delivered 155% returns in this waterfront-adjacent neighborhood with remarkable growth potential. The slight dip in 2022-2023 followed by renewed appreciation indicates market resilience and sustained buyer interest. Positioned near Baltimore’s harbor south of the city, Westport’s extremely affordable entry point makes it appealing for investors willing to weather some volatility for substantial long-term gains.
20. Penrose-Fayette Street Outreach

- % change from 2016 to 2025: 155.04%
- 2025: $59,460
- 2024: $55,289
- 2023: $60,551
- 2022: $61,467
- 2021: $48,811
- 2020: $33,165
- 2019: $31,609
- 2018: $26,235
- 2017: $23,513
- 2016: $23,314
Your capital would have grown significantly here despite recent price volatility suggesting market corrections. The dramatic 47% jump between 2020-2021 shows how quickly values can accelerate in emerging neighborhoods. Situated in west Baltimore, this extremely affordable area requires careful timing for investors, as the price fluctuations of 2022-2025 indicate a market still finding its equilibrium.
19. Richnor Springs
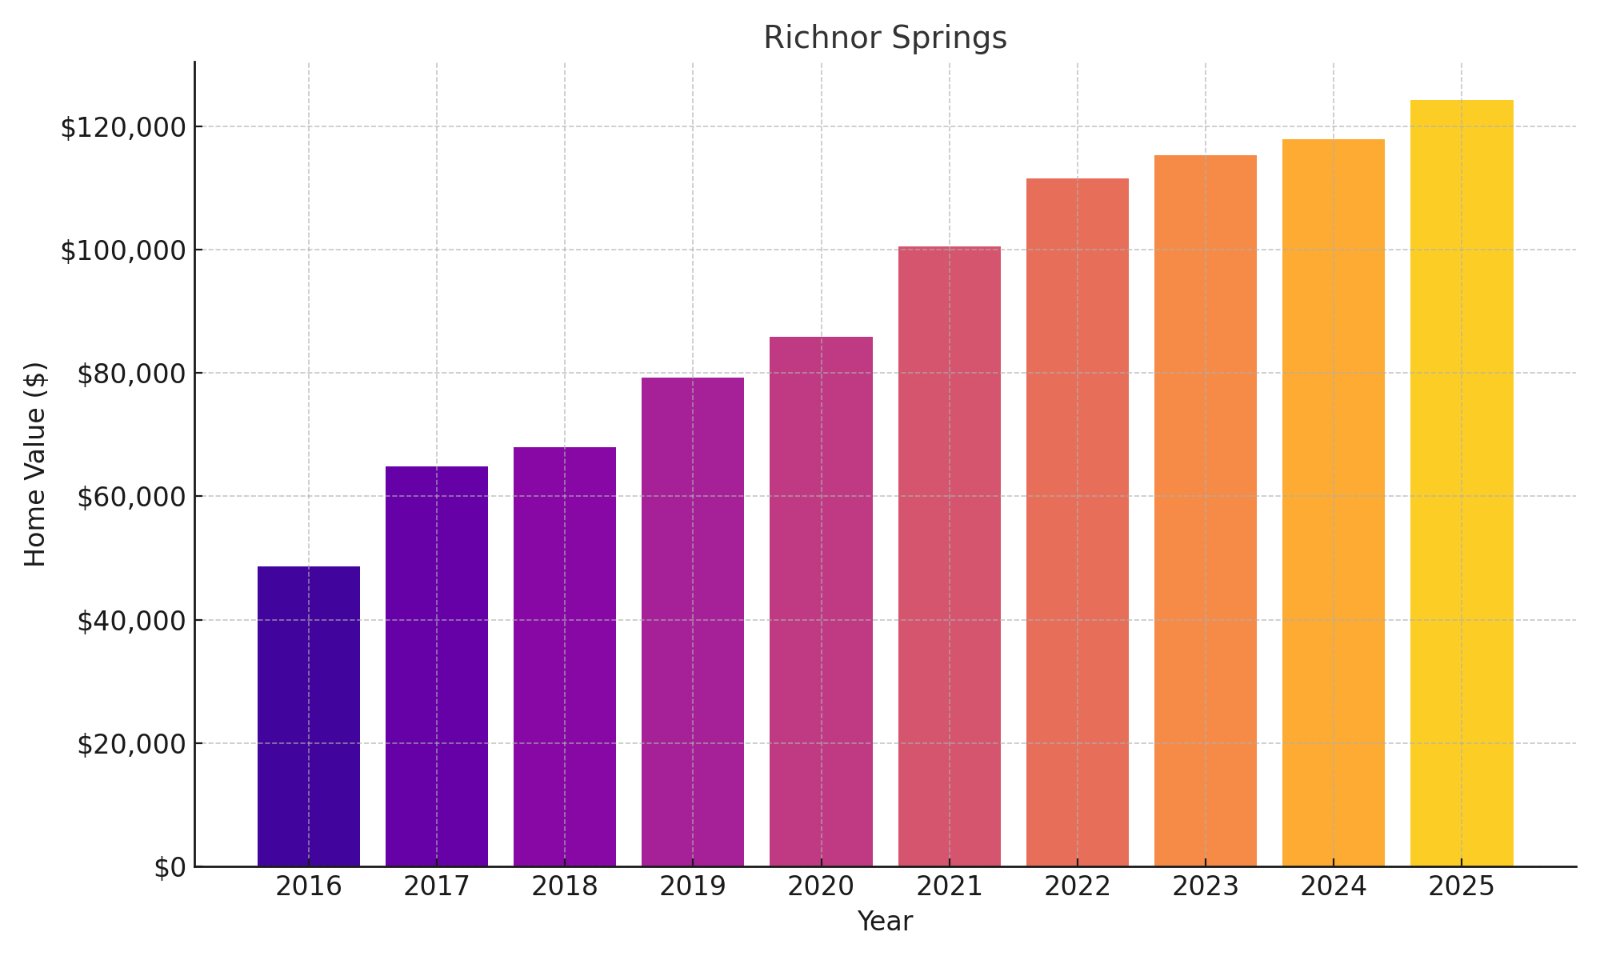
- % change from 2016 to 2025: 155.84%
- 2025: $124,308
- 2024: $117,877
- 2023: $115,252
- 2022: $111,585
- 2021: $100,485
- 2020: $85,913
- 2019: $79,230
- 2018: $68,021
- 2017: $64,811
- 2016: $48,588
Your investment would have increased 2.5x with remarkable consistency year after year. The steady appreciation trend without dramatic spikes suggests genuine demand rather than speculation. Located in northern Baltimore, Richnor Springs offers a compelling value proposition with homes still under $125,000 despite nine consecutive years of growth.
18. Doverdale/Church Street
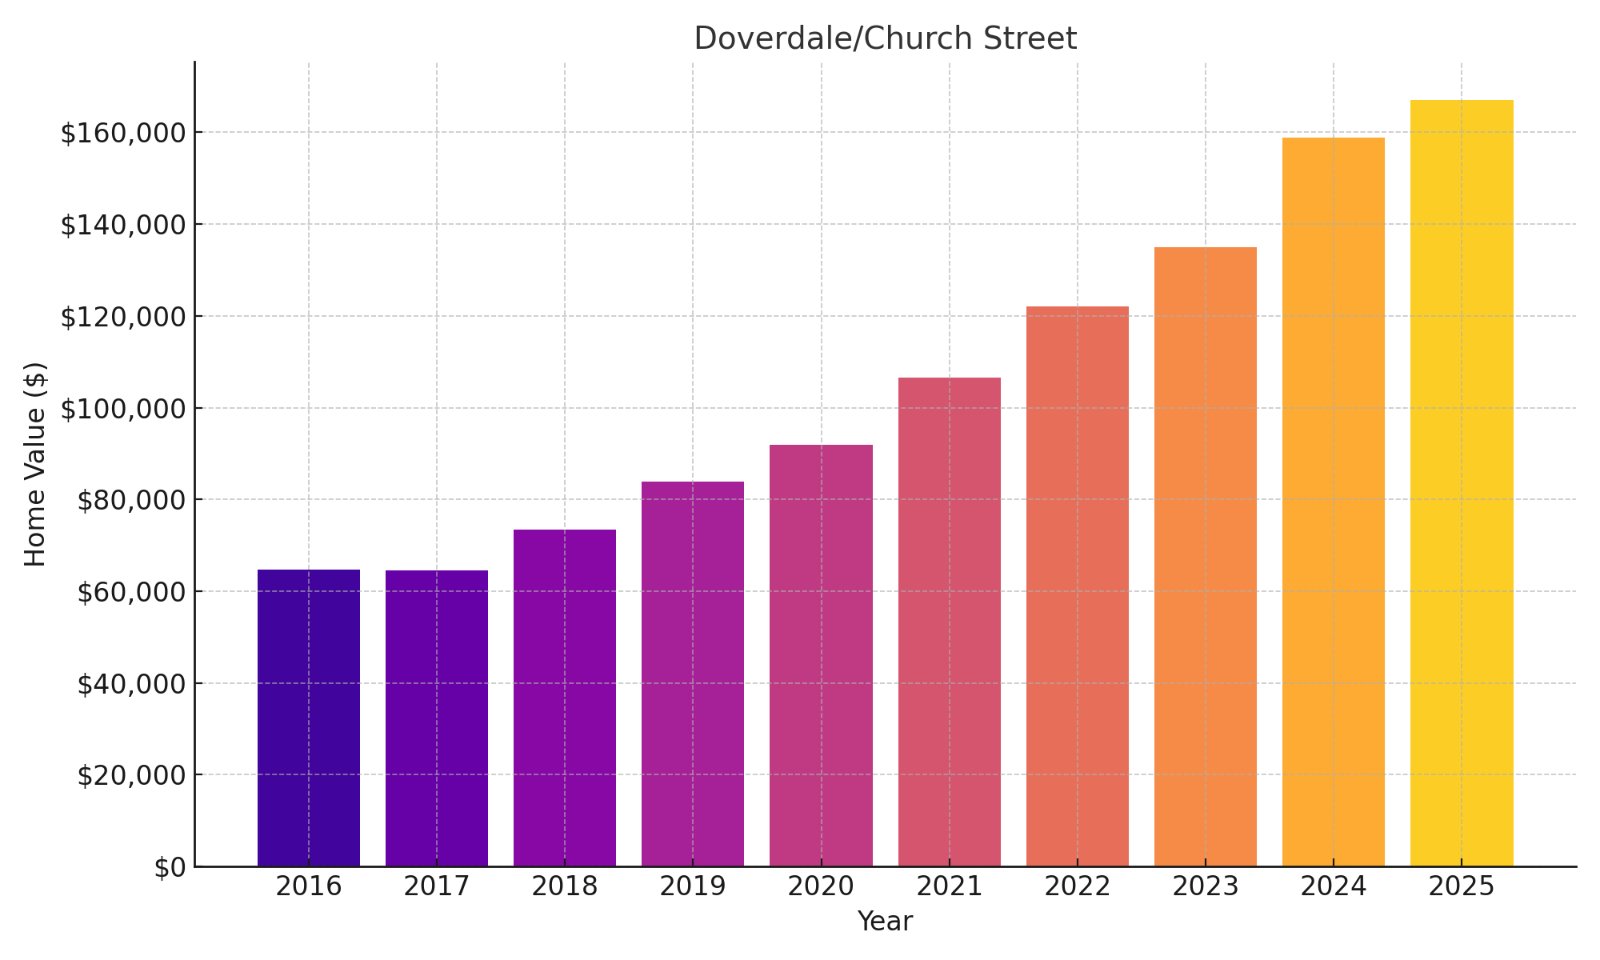
- % change from 2016 to 2025: 158.30%
- 2025: $167,125
- 2024: $158,942
- 2023: $134,947
- 2022: $122,087
- 2021: $106,478
- 2020: $91,993
- 2019: $83,808
- 2018: $73,499
- 2017: $64,570
- 2016: $64,701
Your property value would have grown substantially, with particularly strong acceleration in 2023-2025. The impressive 17.8% jump from 2023 to 2024 suggests momentum is building rather than fading. This Salisbury neighborhood stands out as one of the few non-Baltimore areas on the list, offering diversification potential for investors looking beyond the city center.
17. Allendale
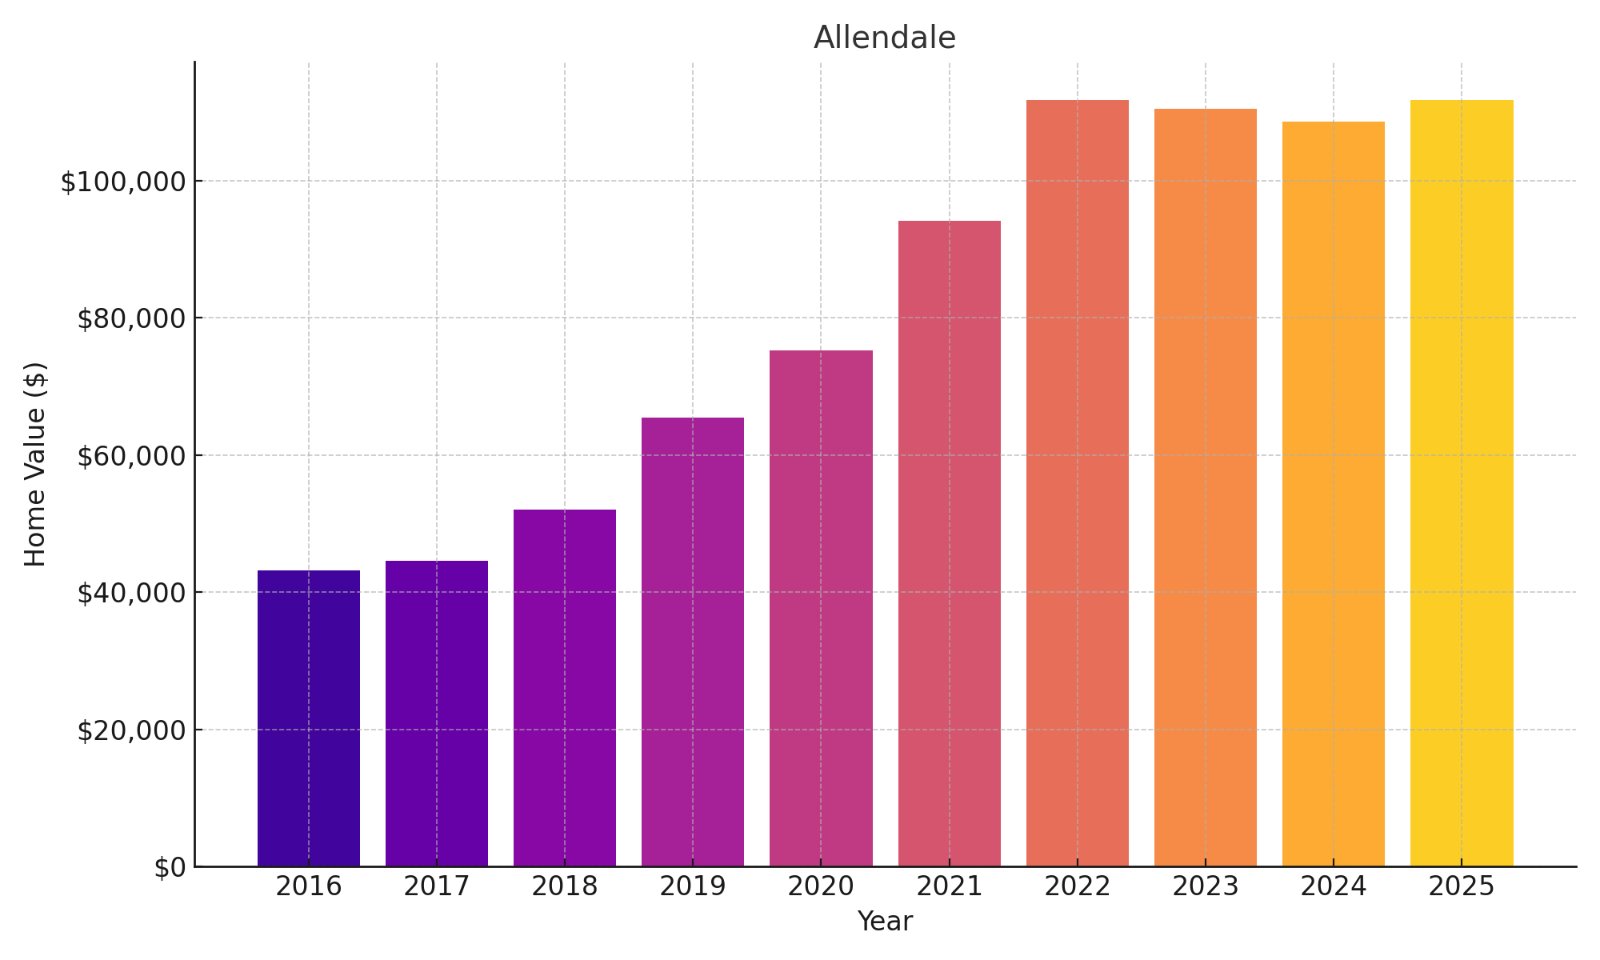
- % change from 2016 to 2025: 158.59%
- 2025: $111,729
- 2024: $108,636
- 2023: $110,492
- 2022: $111,834
- 2021: $94,115
- 2020: $75,278
- 2019: $65,429
- 2018: $52,072
- 2017: $44,638
- 2016: $43,206
Your investment would have more than doubled with particularly strong growth during the 2018-2022 period. The slight price plateau since 2022 suggests the market may be consolidating gains before potential future appreciation. Situated in southwest Baltimore, Allendale offers value investors an affordable entry point with proven long-term growth potential despite recent stabilization.
16. Panway – Braddish Avenue

- % change from 2016 to 2025: 160.70%
- 2025: $150,428
- 2024: $147,532
- 2023: $140,874
- 2022: $131,282
- 2021: $106,771
- 2020: $96,076
- 2019: $83,155
- 2018: $67,992
- 2017: $61,779
- 2016: $57,702
Your equity would have grown impressively with a standout 23% jump between 2020-2021. The continued steady appreciation through 2025 indicates sustained buyer interest rather than speculative fever. Located in west Baltimore near Mondawmin Mall, this neighborhood offers a balanced profile of affordability and consistent growth that appeals to both investors and owner-occupants.
15. Mount Holly

- % change from 2016 to 2025: 161.47%
- 2025: $164,952
- 2024: $157,488
- 2023: $145,109
- 2022: $142,058
- 2021: $132,978
- 2020: $112,603
- 2019: $95,920
- 2018: $77,064
- 2017: $70,859
- 2016: $63,085
Your investment would have delivered exceptional returns with striking consistency across nine years. The recent acceleration in 2024-2025 suggests Mount Holly may still have upside potential despite already substantial appreciation. Located in western Baltimore, this neighborhood has emerged as a relative value play with properties still under $165,000 despite more than doubling in value.
14. Mill Hill

- % change from 2016 to 2025: 165.30%
- 2025: $56,592
- 2024: $55,578
- 2023: $55,898
- 2022: $55,871
- 2021: $44,554
- 2020: $33,228
- 2019: $27,671
- 2018: $23,094
- 2017: $24,004
- 2016: $21,331
Your capital would have grown substantially despite values plateauing between 2022-2025. The dramatic 34% single-year jump from 2020 to 2021 demonstrates how quickly appreciation can accelerate in recovering neighborhoods. This southwest Baltimore area presents significant risk-reward considerations, with extremely low entry prices offset by price stabilization that may indicate limited near-term upside.
13. Darley Park

🔥 Would you like to save this?
- % change from 2016 to 2025: 165.82%
- 2025: $52,078
- 2024: $57,974
- 2023: $60,264
- 2022: $56,088
- 2021: $48,701
- 2020: $33,753
- 2019: $28,656
- 2018: $24,691
- 2017: $20,884
- 2016: $19,591
Your investment would have shown remarkable percentage growth despite recent price corrections from 2023-2025. The dramatic appreciation between 2017-2021 shows how rapidly values can climb in emerging neighborhoods. Located in northeast Baltimore, Darley Park’s ultra-low price point presents significant opportunity for investors comfortable with the inherent volatility of early-stage neighborhood revitalization.
12. Towanda-Grantley

- % change from 2016 to 2025: 167.89%
- 2025: $78,986
- 2024: $88,290
- 2023: $82,984
- 2022: $78,409
- 2021: $64,894
- 2020: $47,124
- 2019: $41,940
- 2018: $39,079
- 2017: $33,010
- 2016: $29,485
Your capital would have grown substantially despite the concerning 10.5% decline in 2024-2025. The dramatic 37.7% increase between 2020-2021 demonstrates how rapidly values can accelerate in transitioning neighborhoods. Located in northwest Baltimore, this area offers exceptional percentage returns but requires careful timing given the recent price volatility.
11. Madison – Eastend

- % change from 2016 to 2025: 178.49%
- 2025: $79,570
- 2024: $83,041
- 2023: $90,276
- 2022: $83,748
- 2021: $70,013
- 2020: $46,593
- 2019: $46,912
- 2018: $34,653
- 2017: $34,195
- 2016: $28,573
Your property value would have nearly tripled despite concerning price declines since 2023. The remarkable 50.3% surge in 2020-2021 demonstrates how rapidly values can accelerate when revitalization takes hold. This east Baltimore neighborhood presents a high-risk, high-reward scenario for investors, with extraordinary percentage returns tempered by recent market corrections.
10. Four by Four

- % change from 2016 to 2025: 188.71%
- 2025: $89,777
- 2024: $87,910
- 2023: $85,747
- 2022: $87,330
- 2021: $63,067
- 2020: $46,543
- 2019: $41,325
- 2018: $29,373
- 2017: $30,860
- 2016: $31,096
Your investment would have yielded extraordinary returns, with particularly explosive growth of 35.5% in a single year (2020-2021). The neighborhood’s impressive resilience is demonstrated by its recent growth despite earlier price fluctuations. Located in northeast Baltimore, Four by Four offers investors substantial upside potential with homes still under $90,000 despite nearly tripling in value.
9. Franklintown Road

- % change from 2016 to 2025: 189.58%
- 2025: $67,070
- 2024: $69,629
- 2023: $71,903
- 2022: $75,605
- 2021: $60,101
- 2020: $41,840
- 2019: $38,496
- 2018: $29,403
- 2017: $27,228
- 2016: $23,161
Your capital would have almost tripled despite concerning price declines since 2022. The extraordinary 43.6% surge in 2020-2021 illustrates how dramatically values can accelerate in neighborhoods gaining investor attention. Located in west Baltimore, this ultra-affordable area presents significant opportunity for contrarian investors who believe the recent correction is temporary rather than structural.
8. Winchester

- % change from 2016 to 2025: 192.82%
- 2025: $70,667
- 2024: $72,685
- 2023: $77,763
- 2022: $74,270
- 2021: $56,786
- 2020: $36,513
- 2019: $34,615
- 2018: $27,595
- 2017: $24,043
- 2016: $24,133
Your investment would have nearly tripled despite the concerning 9.1% decline since 2023. The remarkable 55.5% single-year jump between 2020-2021 shows the explosive potential in emerging neighborhoods. This west Baltimore area presents a high-volatility investment profile, with extraordinary percentage returns balanced against recent price corrections that suggest careful timing is essential.
7. Bridgeview – Greenlawn

- % change from 2016 to 2025: 192.96%
- 2025: $96,647
- 2024: $99,496
- 2023: $103,470
- 2022: $95,136
- 2021: $76,975
- 2020: $60,038
- 2019: $57,215
- 2018: $42,503
- 2017: $35,632
- 2016: $32,989
Your property value would have almost tripled though recent price declines suggest market consolidation after rapid growth. The impressive 28.2% increase from 2020-2021 demonstrates this west Baltimore neighborhood’s potential during favorable market conditions. For investors, the triple-digit appreciation represents extraordinary returns despite homes remaining extremely affordable at under $100,000.
6. Rosemont

- % change from 2016 to 2025: 193.53%
- 2025: $76,663
- 2024: $78,179
- 2023: $75,887
- 2022: $74,315
- 2021: $54,967
- 2020: $36,419
- 2019: $33,608
- 2018: $26,244
- 2017: $27,717
- 2016: $26,118
Your investment would have nearly tripled with dramatic acceleration during the 2020-2021 period when values surged 51%. The subsequent plateau suggests a market digesting gains rather than losing momentum. Situated in west Baltimore, Rosemont offers extraordinary percentage returns on a still-affordable base price, creating opportunity for investors seeking maximum appreciation potential.
5. Ellwood Park-Monument

- % change from 2016 to 2025: 195.12%
- 2025: $94,284
- 2024: $94,700
- 2023: $90,176
- 2022: $83,877
- 2021: $70,316
- 2020: $54,153
- 2019: $49,347
- 2018: $40,420
- 2017: $36,601
- 2016: $31,947
Your capital would have almost tripled with steady growth that accelerated significantly after 2020. The impressive resilience is demonstrated by continued appreciation through 2023 followed by price stabilization rather than correction. Located in east Baltimore, this neighborhood offers compelling value with homes still under $95,000 despite nearly 200% appreciation over nine years.
4. Rosemont Homeowners-Tenants

- % change from 2016 to 2025: 197.01%
- 2025: $79,216
- 2024: $79,459
- 2023: $77,789
- 2022: $76,345
- 2021: $62,823
- 2020: $50,393
- 2019: $41,820
- 2018: $33,339
- 2017: $27,744
- 2016: $26,672
Your investment would have nearly tripled with particularly strong momentum between 2017-2021. The market’s sustained growth followed by recent stability suggests genuine demand rather than speculative fever. This west Baltimore community offers exceptional returns with values still below $80,000, creating significant opportunity for investors seeking maximum percentage growth from minimal capital outlay.
3. Carrol-South Hilton

- % change from 2016 to 2025: 201.45%
- 2025: $102,245
- 2024: $95,502
- 2023: $89,639
- 2022: $87,024
- 2021: $79,128
- 2020: $64,568
- 2019: $53,162
- 2018: $44,871
- 2017: $39,649
- 2016: $33,918
Your property value would have tripled with impressive acceleration continuing even into 2025. The sustained upward trajectory without significant corrections suggests fundamental improvement rather than market hysteria. Located in southwest Baltimore, this neighborhood demonstrates exceptional resilience with seven consecutive years of growth and continued momentum that shows no signs of slowing.
2. Gwynns Falls

- % change from 2016 to 2025: 202.89%
- 2025: $93,364
- 2024: $93,777
- 2023: $83,990
- 2022: $80,191
- 2021: $71,973
- 2020: $56,697
- 2019: $43,022
- 2018: $37,241
- 2017: $33,990
- 2016: $30,825
Your investment would have tripled in value with extraordinary growth that has only recently begun to stabilize. The dramatic 27% increase between 2020-2021 shows how rapidly appreciation can accelerate when revitalization gains momentum. Situated in west Baltimore adjacent to the park of the same name, Gwynns Falls offers compelling value with homes still under $95,000 despite tripling in price.
1. Berea

🔥 Would you like to save this?
- % change from 2016 to 2025: 224.94%
- 2025: $109,370
- 2024: $114,048
- 2023: $99,280
- 2022: $99,074
- 2021: $87,486
- 2020: $62,601
- 2019: $54,601
- 2018: $41,063
- 2017: $34,464
- 2016: $33,659
Your property value would have more than tripled, making Berea Maryland’s standout growth neighborhood of the decade. The extraordinary 39.8% increase between 2020-2021 demonstrates how dramatically values can accelerate in emerging markets. Located in east Baltimore, Berea offers exceptional investment metrics with homes still remarkably affordable despite the state’s most impressive appreciation performance.


