
🔥 Would you like to save this?
According to the latest Zillow Home Value Index, home prices in parts of Oklahoma are climbing faster than ever. While the state still offers plenty of budget-friendly options, 17 towns have broken away from the pack with sharp increases in property values. From 2010 to 2025, these places have seen values double—or more—thanks to a mix of local growth, rising demand, and newfound appeal. Whether you’re investing, relocating, or just keeping tabs on the market, these towns are where Oklahoma real estate is heating up the most.
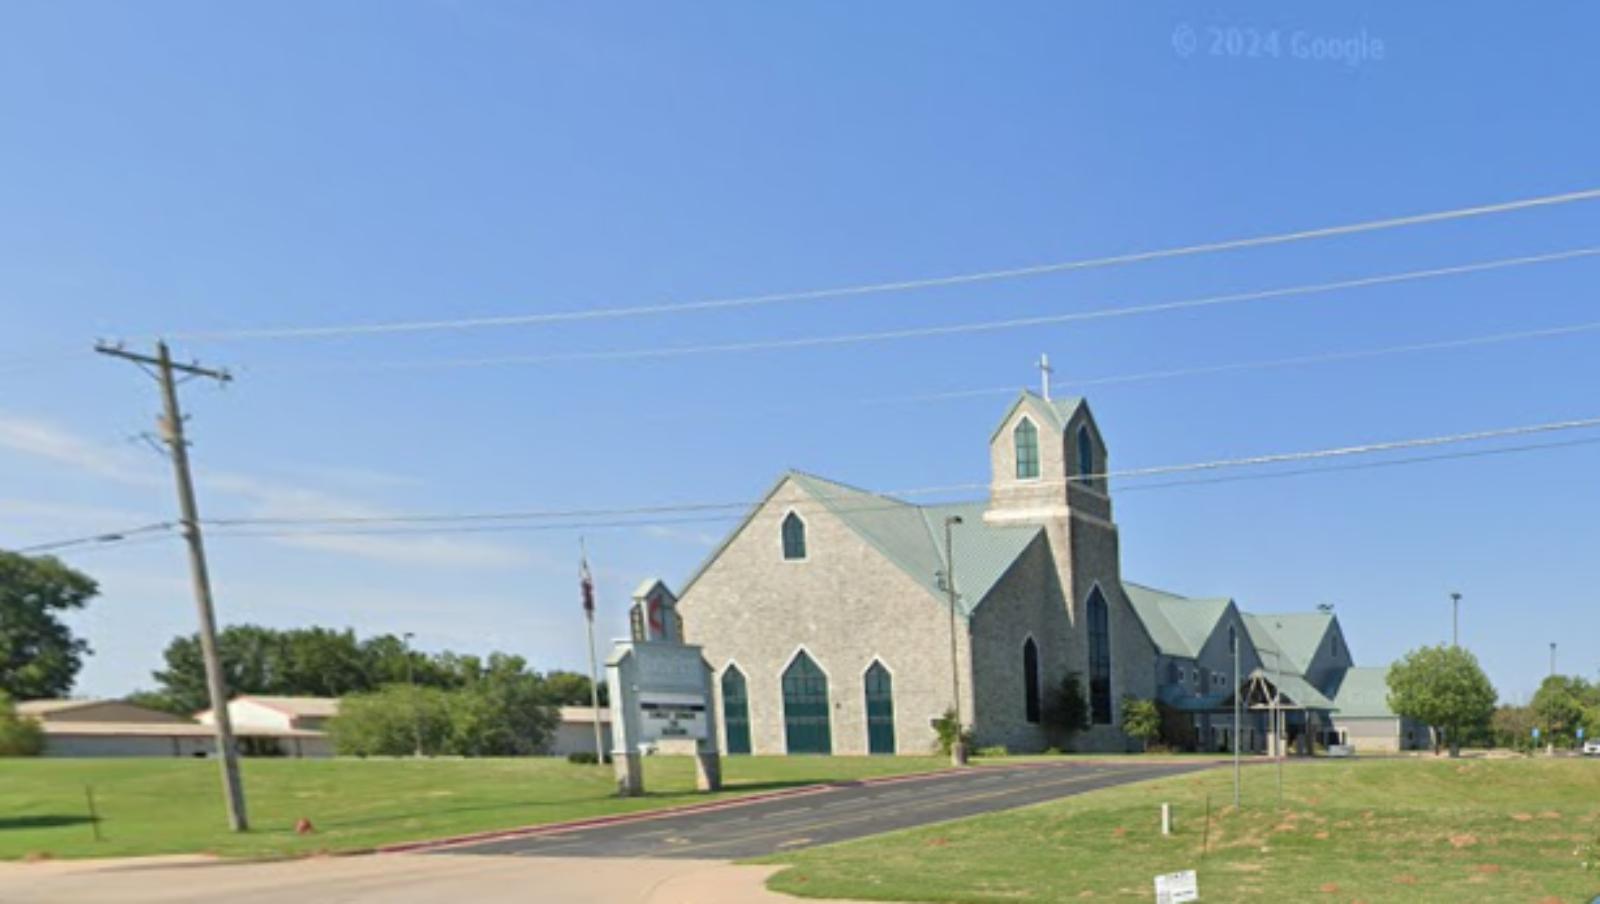
17. Choctaw – 84.07% Home Price Increase Since 2010

- 2010: $162,203
- 2011: $160,369 ($-1,834, -1.13%)
- 2012: $157,944 ($-2,425, -1.51%)
- 2013: $162,110 (+$4,166, +2.64%)
- 2014: $167,183 (+$5,073, +3.13%)
- 2015: $176,847 (+$9,664, +5.78%)
- 2016: $177,522 (+$674, +0.38%)
- 2017: $181,824 (+$4,302, +2.42%)
- 2018: $192,067 (+$10,243, +5.63%)
- 2019: $200,750 (+$8,683, +4.52%)
- 2020: N/A
- 2021: $234,978
- 2022: $268,956 (+$33,978, +14.46%)
- 2023: $282,728 (+$13,773, +5.12%)
- 2024: $292,011 (+$9,282, +3.28%)
- 2025: $298,559 (+$6,548, +2.24%)
Choctaw’s home prices have risen steadily since 2010, growing by over 84%. The city experienced its biggest price jumps in the early 2020s, with double-digit percentage gains in 2021 and 2022. Even though some years showed only marginal increases, the long-term trend points to rising demand and sustained interest from buyers looking for suburban appeal without being far from Oklahoma City.
In order to come up with the very specific design ideas, we create most designs with the assistance of state-of-the-art AI interior design software. Also, assume links that take you off the site are affiliate links such as links to Amazon. this means we may earn a commission if you buy something.
Choctaw – Affordable Growth Near the Metro
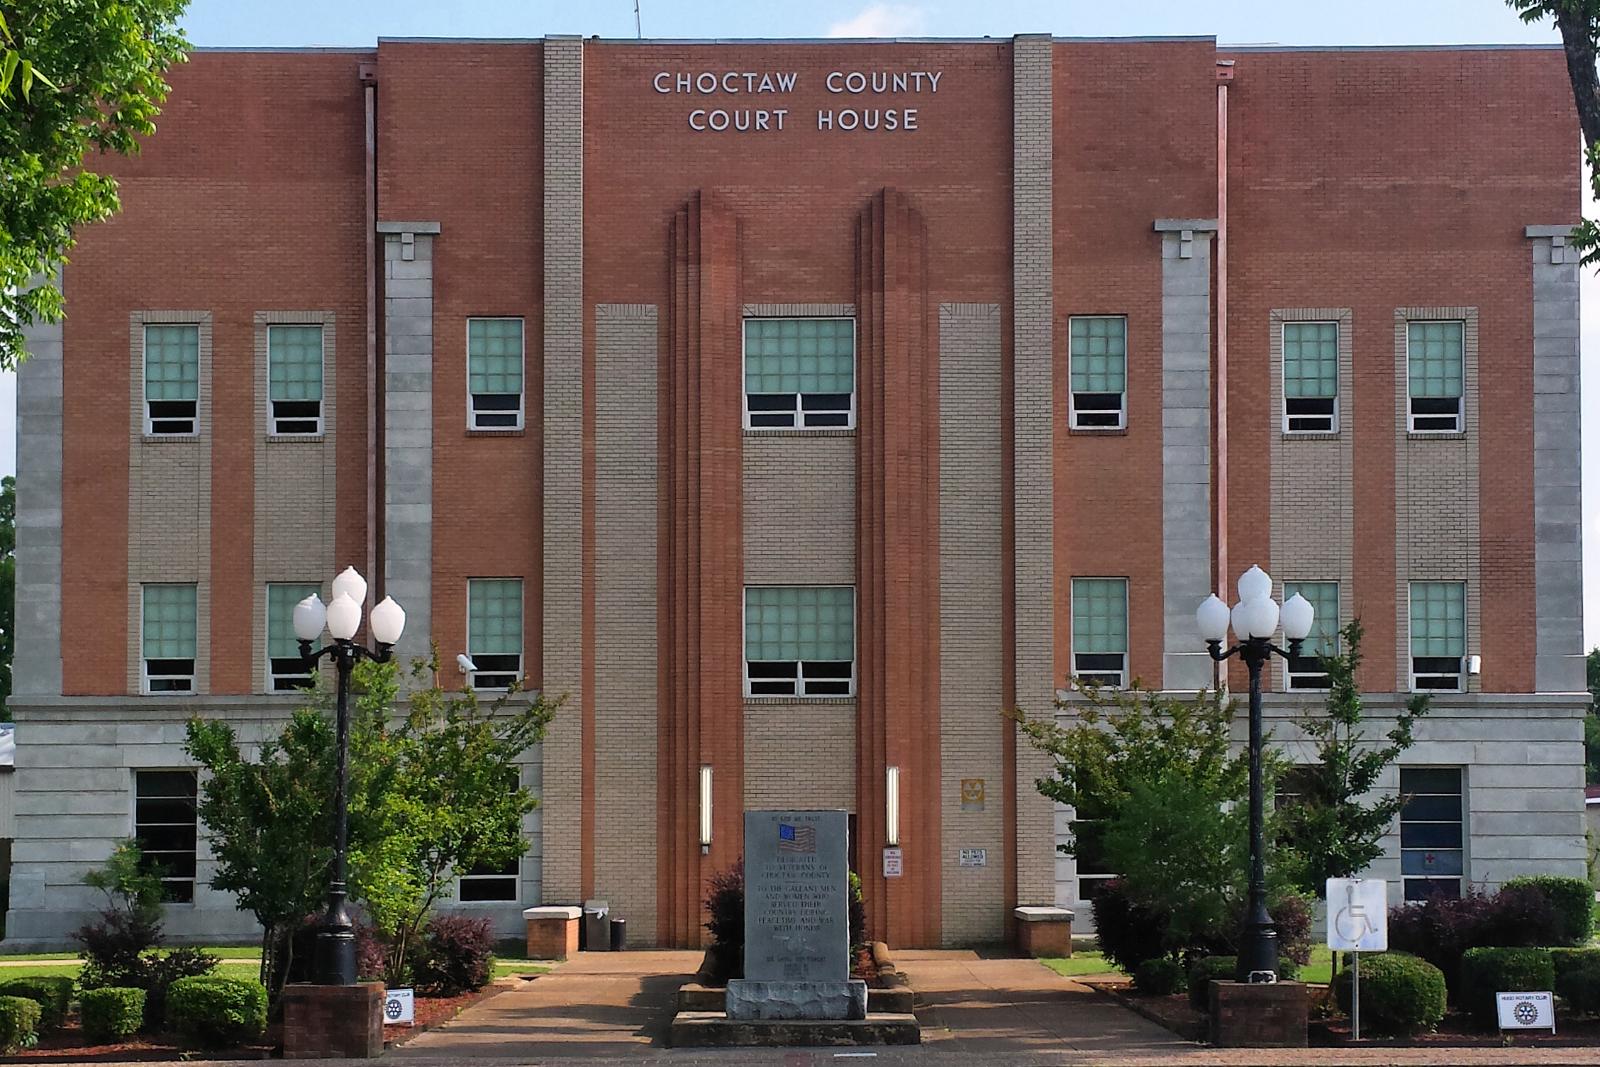
Located just east of Oklahoma City, Choctaw offers a blend of rural charm and suburban convenience. As the oldest chartered town in Oklahoma Territory, it has long been a quiet option for families and retirees alike. Over the years, as nearby areas filled up, buyers turned to Choctaw for larger lots and quieter neighborhoods—without sacrificing access to city jobs and amenities.
Its affordability in the early 2010s made it an attractive entry point, but those days are fading. As newer developments have come in and infrastructure has improved, home prices have followed suit. This surge is likely to continue as Choctaw balances small-town appeal with growing regional significance.
16. Bennington – 252.34% Home Price Increase Since 2010

- 2010: $84,833
- 2011: $87,023 (+$2,190, +2.58%)
- 2012: $94,456 (+$7,433, +8.54%)
- 2013: $99,082 (+$4,625, +4.90%)
- 2014: $104,234 (+$5,153, +5.20%)
- 2015: $112,696 (+$8,462, +8.12%)
- 2016: $120,819 (+$8,122, +7.21%)
- 2017: $126,011 (+$5,192, +4.30%)
- 2018: $136,666 (+$10,655, +8.46%)
- 2019: $145,314 (+$8,648, +6.33%)
- 2020: N/A
- 2021: $202,374
- 2022: $256,805 (+$54,431, +26.90%)
- 2023: $269,330 (+$12,525, +4.88%)
- 2024: $282,990 (+$13,660, +5.07%)
- 2025: $298,899 (+$15,909, +5.62%)
Bennington tops the chart in price growth with a stunning 252% increase since 2010. This small southeastern Oklahoma town has seen home values multiply as buyers look for bargains away from urban centers. Its biggest leaps came after 2020, when remote work and lifestyle shifts made rural markets like Bennington more attractive.
Bennington – Big Gains in a Small Town

Bennington may be small in population, but it’s grown in real estate attention. Tucked near the Texas border, it appeals to out-of-state buyers and those priced out of larger Oklahoma markets. Its rapid rise in value is partly a reflection of its once ultra-low prices—but the consistent annual gains show real demand has taken hold.
Low property taxes and an appealing cost of living help explain its popularity. As infrastructure improves and awareness spreads, Bennington could continue to punch above its weight in Oklahoma’s real estate picture.
15. Owasso – 67.10% Home Price Increase Since 2010

- 2010: $188,353
- 2011: $181,370 ($-6,983, -3.71%)
- 2012: $176,357 ($-5,013, -2.76%)
- 2013: $179,227 (+$2,870, +1.63%)
- 2014: $184,168 (+$4,941, +2.76%)
- 2015: $191,194 (+$7,026, +3.81%)
- 2016: $194,421 (+$3,227, +1.69%)
- 2017: $203,209 (+$8,788, +4.52%)
- 2018: $203,540 (+$330, +0.16%)
- 2019: $208,739 (+$5,200, +2.55%)
- 2020: N/A
- 2021: $243,729
- 2022: $282,080 (+$38,351, +15.73%)
- 2023: $297,894 (+$15,814, +5.61%)
- 2024: $308,476 (+$10,582, +3.55%)
- 2025: $314,739 (+$6,264, +2.03%)
Home values in Owasso have risen over 67% since 2010, with the steepest gains occurring after 2020. While early years saw modest or even declining prices, the past five years have brought solid appreciation. The city’s expanding retail scene, good schools, and proximity to Tulsa all make it a hot choice for suburban buyers.
Owasso – Steady Growth in a Tulsa Suburb
Owasso’s blend of suburban comfort and big-city access has helped drive home demand. It offers shopping centers, parks, and a well-rated school district—key factors attracting families. While price growth was moderate before 2020, the recent acceleration shows how much buyers value the area’s mix of convenience and quality of life.
Its location just north of Tulsa means residents can enjoy short commutes without sacrificing space. As the area continues to grow economically and demographically, Owasso is likely to stay on the radar of upwardly mobile buyers.
14. Blanchard – 107.13% Home Price Increase Since 2010

- 2010: $153,468
- 2011: $150,029 ($-3,439, -2.24%)
- 2012: $151,348 (+$1,318, +0.88%)
- 2013: $157,914 (+$6,566, +4.34%)
- 2014: $164,872 (+$6,959, +4.41%)
- 2015: $173,243 (+$8,371, +5.08%)
- 2016: $178,886 (+$5,643, +3.26%)
- 2017: $183,120 (+$4,234, +2.37%)
- 2018: $190,769 (+$7,649, +4.18%)
- 2019: $199,448 (+$8,679, +4.55%)
- 2020: N/A
- 2021: $235,585
- 2022: $275,450 (+$39,865, +16.92%)
- 2023: $291,526 (+$16,076, +5.84%)
- 2024: $307,008 (+$15,482, +5.31%)
- 2025: $317,881 (+$10,873, +3.54%)
Blanchard has seen home prices double since 2010, thanks to consistent year-over-year appreciation and strong jumps post-2020. The town’s steady growth, coupled with relative affordability, makes it a strong choice for families and buyers looking for room to grow.
Blanchard – Consistent Gains in a Growing Community
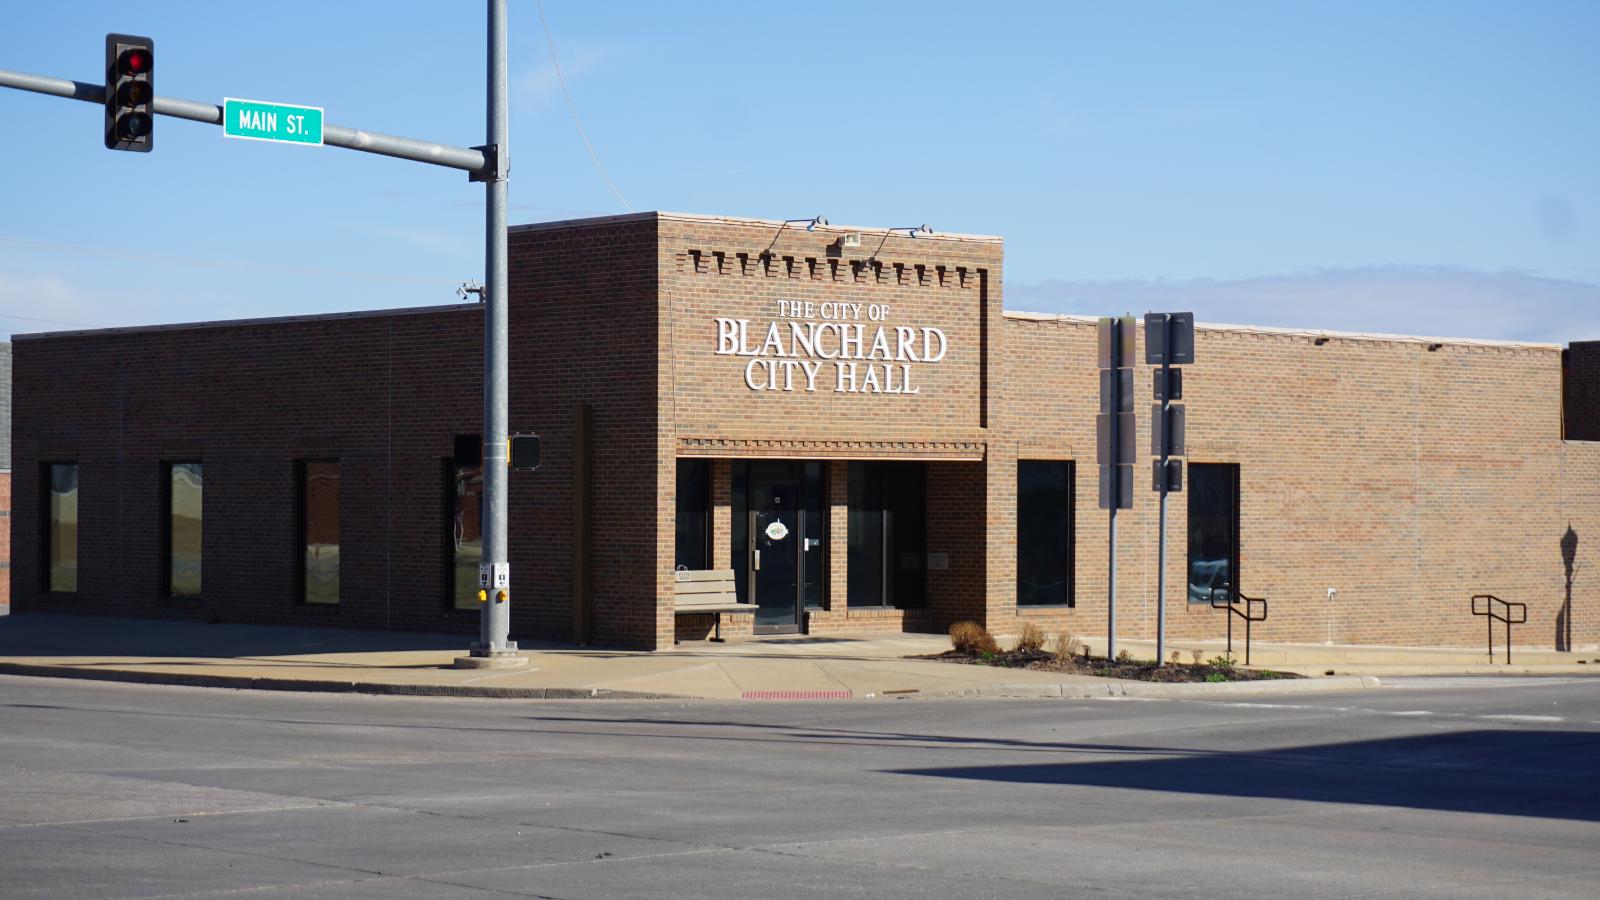
Situated southwest of Oklahoma City, Blanchard is a town on the rise. Its appeal lies in the blend of small-town peace with access to metro conveniences. Local schools, community events, and housing developments have brought more attention to the area in recent years.
Buyers have responded to Blanchard’s value proposition, pushing up home prices without the volatility seen in flashier markets. With new neighborhoods and infrastructure upgrades in the works, the town’s strong price trajectory looks set to continue.
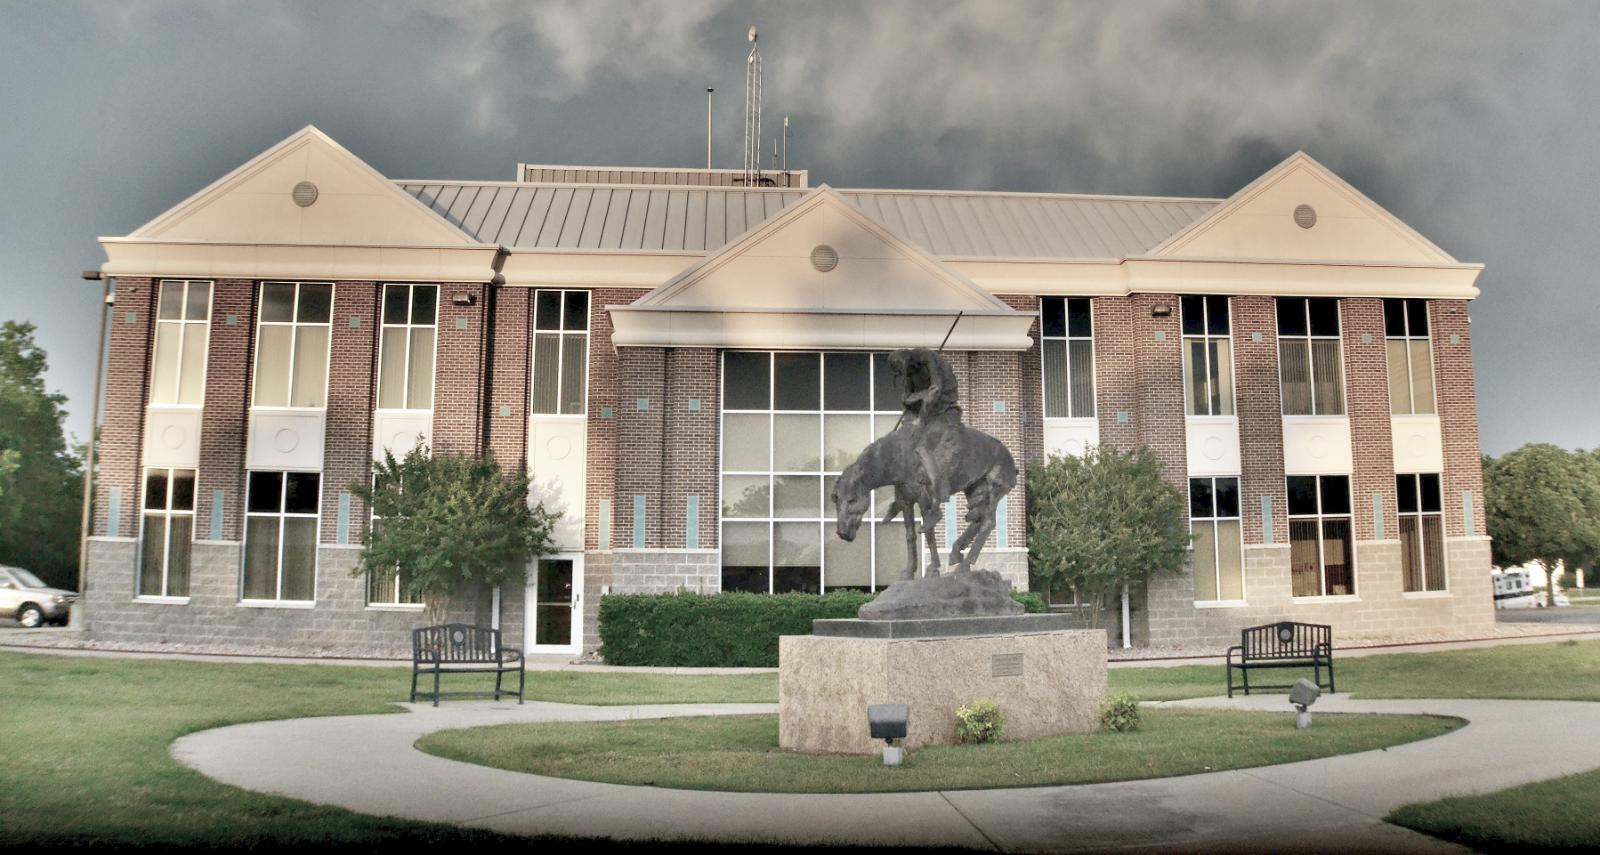
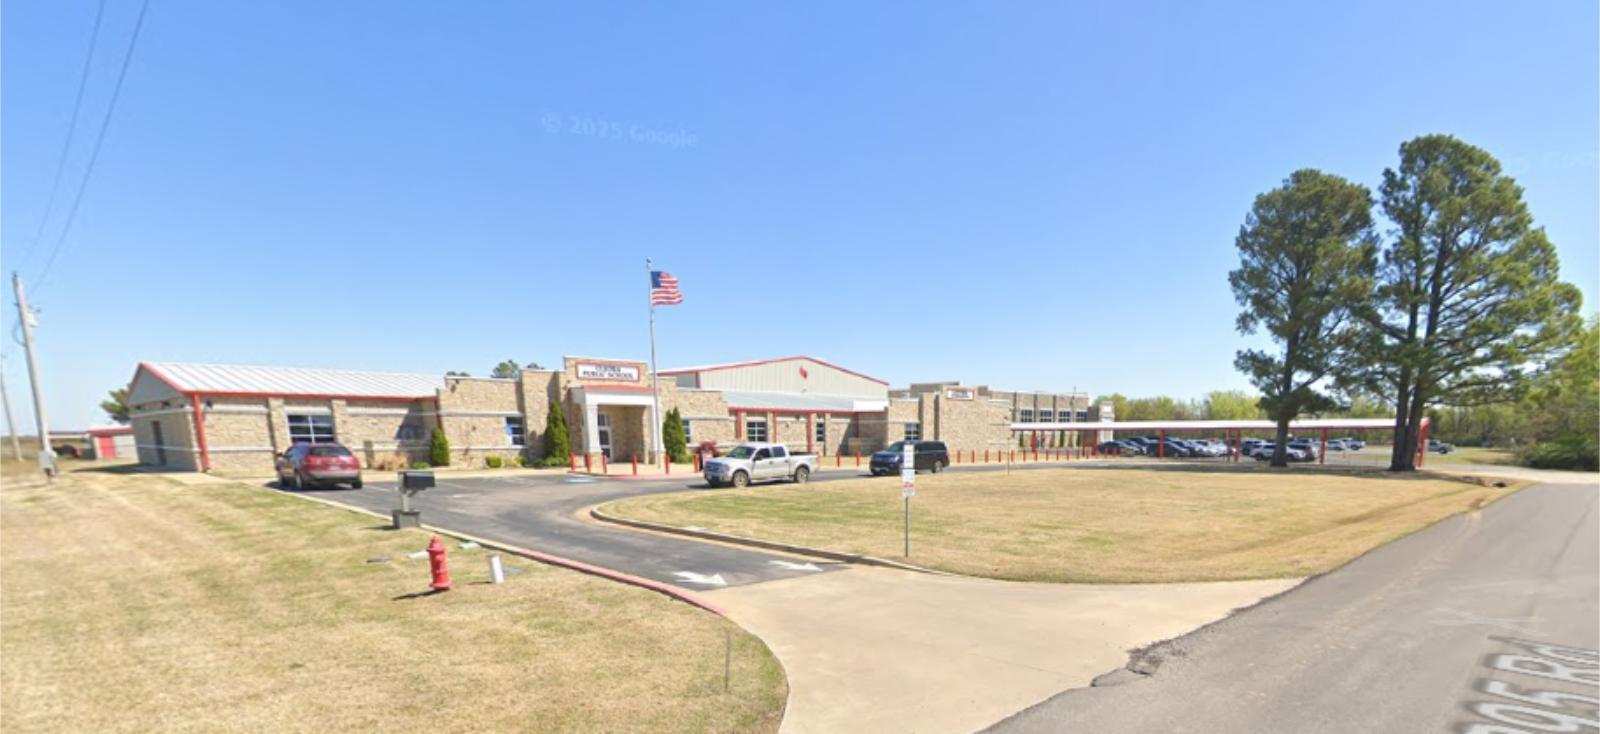
13. Tuttle – 99.57% Home Price Increase Since 2010

- 2010: $160,746
- 2011: $158,050 ($-2,696, -1.68%)
- 2012: $159,152 (+$1,101, +0.70%)
- 2013: $161,758 (+$2,606, +1.64%)
- 2014: $168,922 (+$7,164, +4.43%)
- 2015: $177,840 (+$8,918, +5.28%)
- 2016: $179,670 (+$1,830, +1.03%)
- 2017: $183,499 (+$3,829, +2.13%)
- 2018: $195,231 (+$11,732, +6.39%)
- 2019: $206,355 (+$11,124, +5.70%)
- 2020: N/A
- 2021: $247,717
- 2022: $286,504 (+$38,787, +15.66%)
- 2023: $301,105 (+$14,601, +5.10%)
- 2024: $309,457 (+$8,351, +2.77%)
- 2025: $320,798 (+$11,341, +3.66%)
Home prices in Tuttle are just shy of doubling over the 15-year span, making it one of Oklahoma’s fastest risers. The city has experienced steady, compounding gains, particularly after 2020. Each year builds on the last, reflecting ongoing growth and appeal to buyers across demographics.
Tuttle – A Balanced Blend of Value and Stability
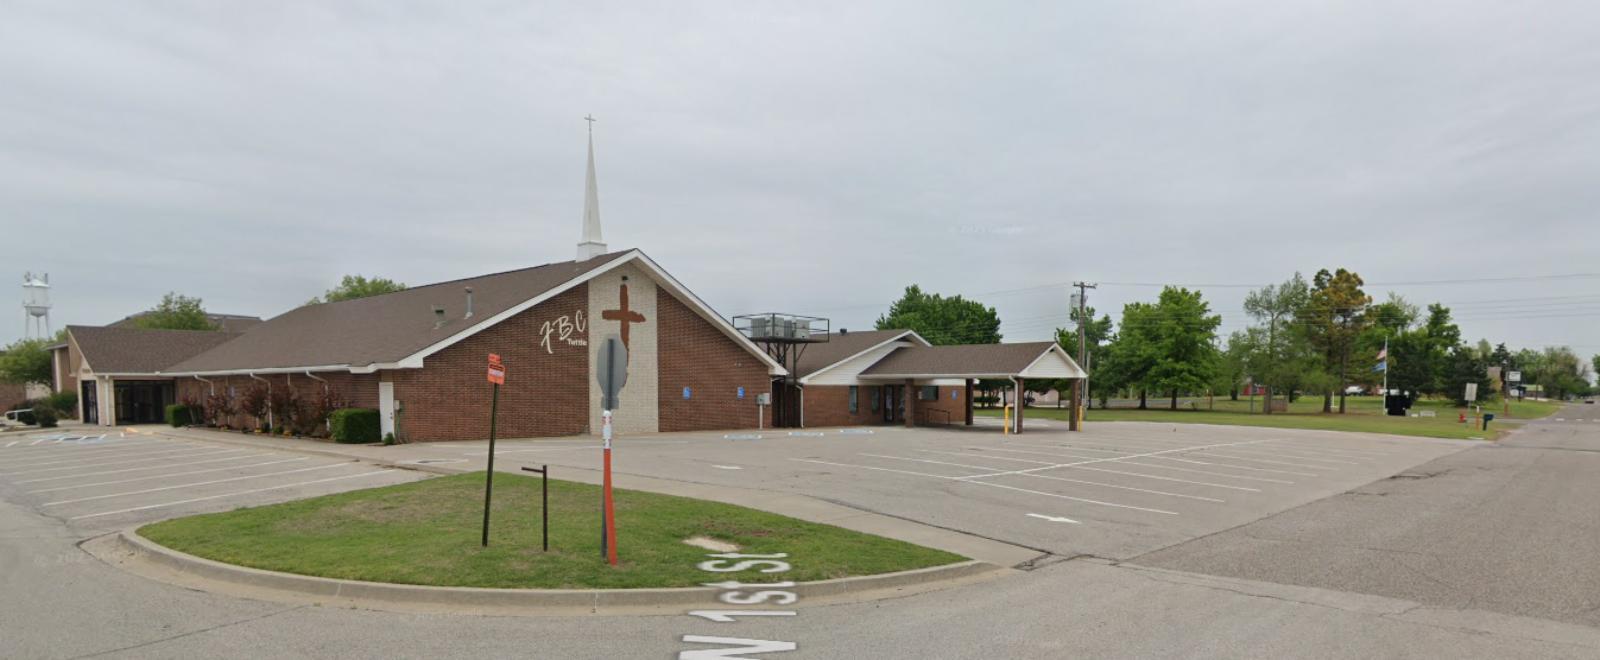
Tuttle sits just southwest of Oklahoma City and has evolved from a rural community into a sought-after residential area. Its schools, parks, and modest cost of living make it ideal for young families and retirees alike. Unlike boom-and-bust towns, Tuttle’s climb in home values has been measured and reliable.
This stability, paired with recent surges in pricing, shows a market that’s maturing. Buyers looking to get ahead of future increases may see Tuttle as a smart place to enter before prices move even higher.
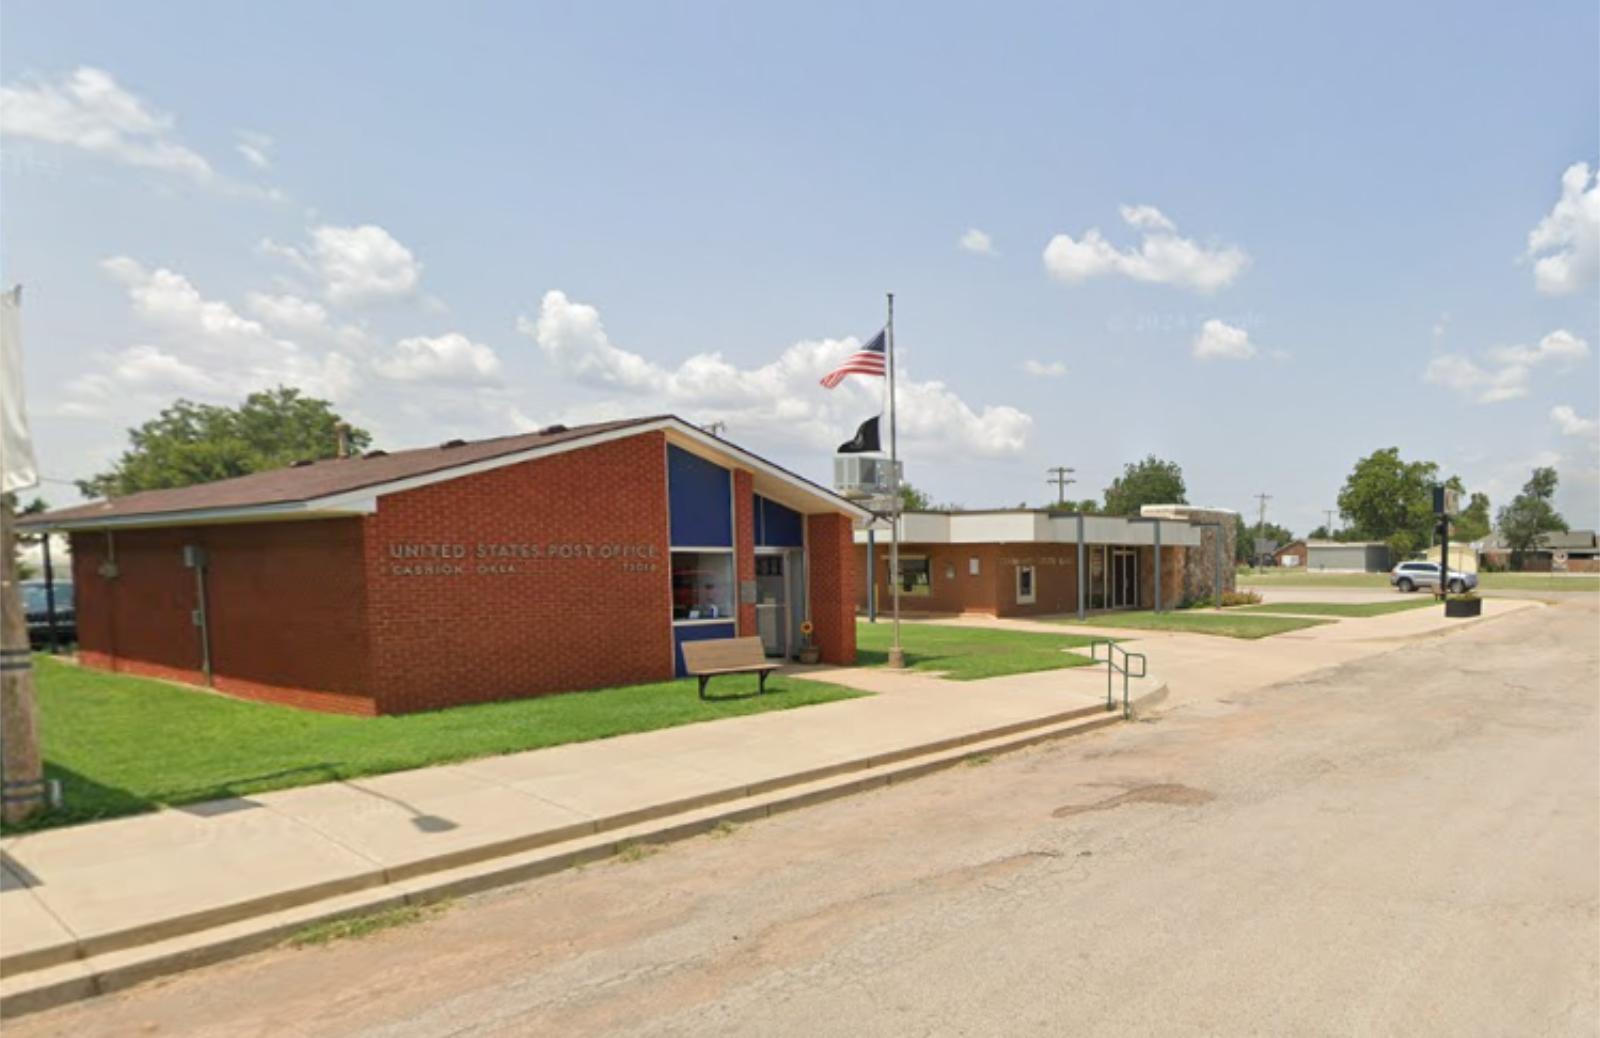
12. Cashion – 103.87% Home Price Increase Since 2010

- 2010: $157,961
- 2011: $156,583 ($-1,378, -0.87%)
- 2012: $161,315 (+$4,732, +3.02%)
- 2013: $168,260 (+$6,945, +4.31%)
- 2014: $175,645 (+$7,385, +4.39%)
- 2015: $175,789 (+$144, +0.08%)
- 2016: $182,991 (+$7,202, +4.10%)
- 2017: $195,447 (+$12,457, +6.81%)
- 2018: $204,275 (+$8,828, +4.52%)
- 2019: $216,815 (+$12,539, +6.14%)
- 2020: N/A
- 2021: $259,459
- 2022: $292,436 (+$32,977, +12.71%)
- 2023: $298,789 (+$6,354, +2.17%)
- 2024: $307,718 (+$8,929, +2.99%)
- 2025: $322,031 (+$14,313, +4.65%)
Cashion has more than doubled in home value since 2010, with prices increasing 103.87%. This growth has been consistent and gradual, with no major volatility year to year. While early gains were modest, the town’s market accelerated from 2021 onward, especially with a sharp 12.71% increase in 2022. This trend reflects a steady climb in desirability as the area continues to attract families and buyers seeking space and small-town stability.
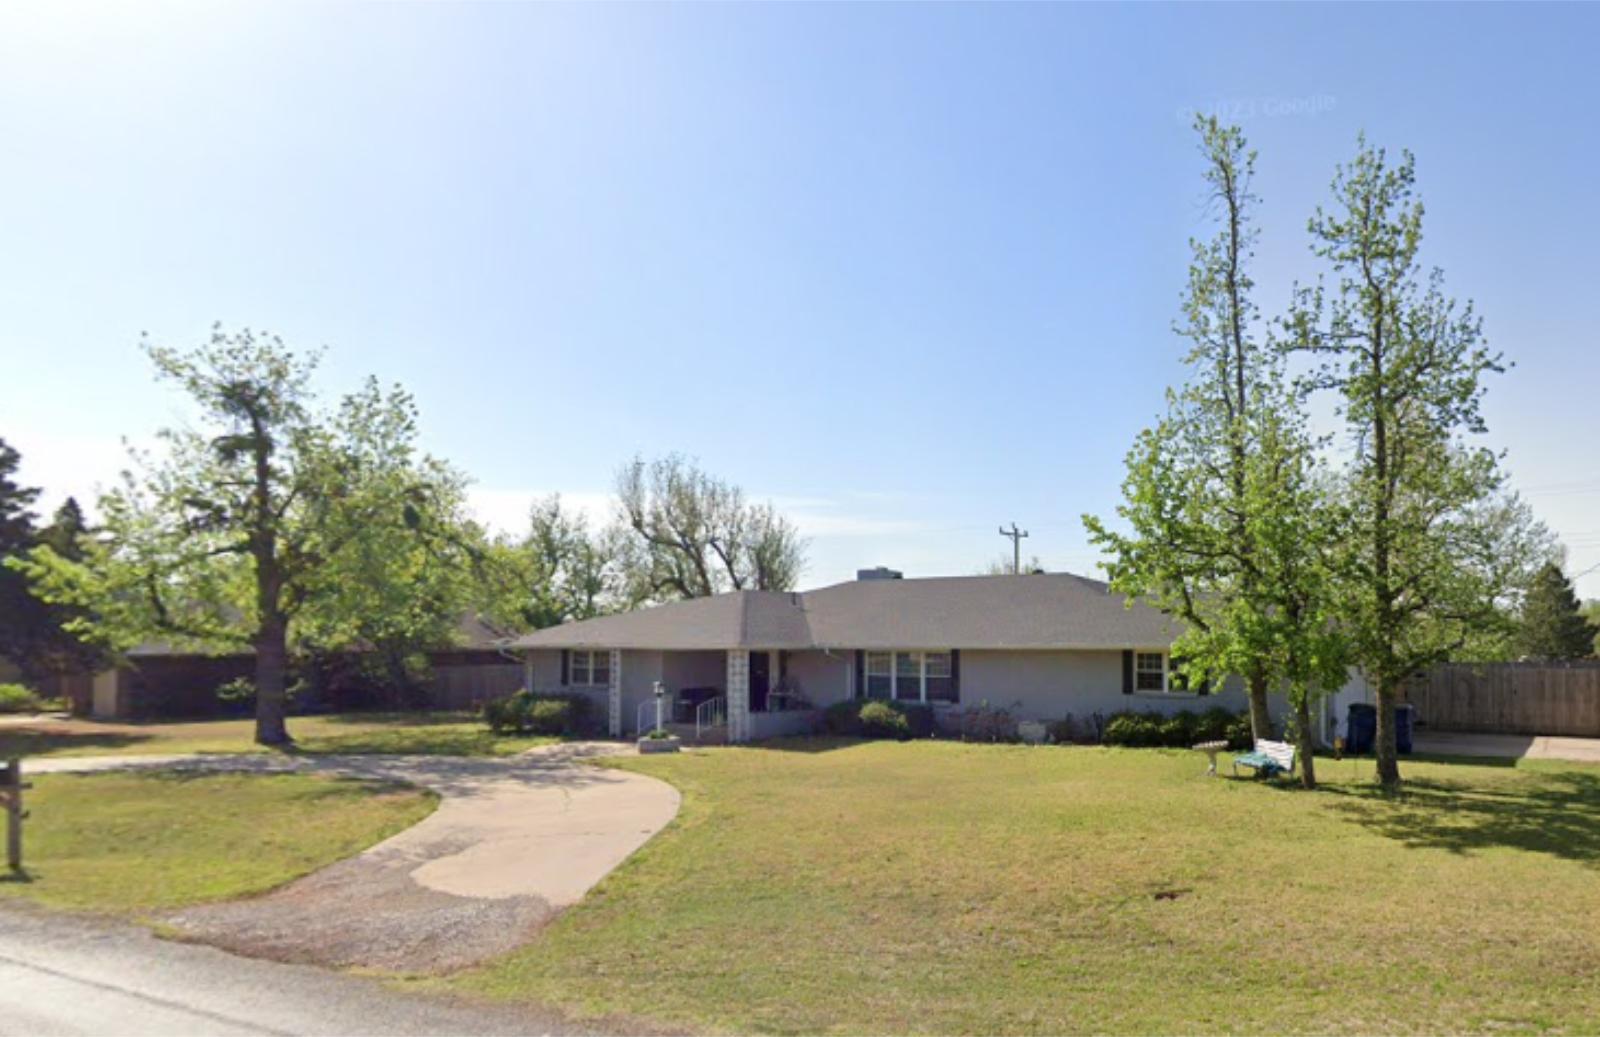
Cashion – Steady Growth with Rural Appeal
Located northwest of Oklahoma City, Cashion is a quiet community with a strong sense of local identity. It draws buyers looking for peaceful neighborhoods, solid schools, and a break from urban congestion. Unlike boomtowns that see sudden spikes, Cashion’s appeal has built up steadily over the years.
This predictability has made it a smart investment, particularly for those looking for long-term value. Newer construction and interest from commuters have helped push home values upward, and its rising profile shows no signs of fading soon.
11. Bixby – 56.90% Home Price Increase Since 2010

🔥 Would you like to save this?
- 2010: $208,695
- 2011: $198,695 ($-10,001, -4.79%)
- 2012: $196,718 ($-1,977, -0.99%)
- 2013: $200,976 (+$4,258, +2.16%)
- 2014: $205,377 (+$4,401, +2.19%)
- 2015: $213,590 (+$8,213, +4.00%)
- 2016: $214,994 (+$1,405, +0.66%)
- 2017: $226,004 (+$11,010, +5.12%)
- 2018: $223,045 ($-2,958, -1.31%)
- 2019: $226,829 (+$3,783, +1.70%)
- 2020: N/A
- 2021: $260,300
- 2022: $304,282 (+$43,981, +16.90%)
- 2023: $317,198 (+$12,916, +4.24%)
- 2024: $321,917 (+$4,719, +1.49%)
- 2025: $327,440 (+$5,523, +1.72%)
Bixby’s home prices are up nearly 57% since 2010, driven by a mix of new housing and suburban demand. While the early years showed minor drops and plateaus, the post-2020 period brought sharper increases, especially in 2022 with a 16.9% gain. This suggests growing interest in the Tulsa-area suburb as infrastructure and amenities expanded.
Bixby – A Popular Choice in the Tulsa Metro
Located just southeast of Tulsa, Bixby has become one of the metro area’s most desirable suburbs. Known for its strong school system, active parks department, and suburban feel, it’s no surprise that home prices have followed suit. The town balances residential tranquility with economic access.
Recent development projects and retail expansion continue to attract buyers. While growth has been less explosive than in some towns, Bixby’s consistent upward trajectory points to solid long-term potential.
10. Piedmont – 86.41% Home Price Increase Since 2010

- 2010: $182,467
- 2011: $177,304 ($-5,163, -2.83%)
- 2012: $175,933 ($-1,371, -0.77%)
- 2013: $181,141 (+$5,208, +2.96%)
- 2014: $189,272 (+$8,131, +4.49%)
- 2015: $199,818 (+$10,547, +5.57%)
- 2016: $206,085 (+$6,266, +3.14%)
- 2017: $211,347 (+$5,262, +2.55%)
- 2018: $218,236 (+$6,889, +3.26%)
- 2019: $226,258 (+$8,021, +3.68%)
- 2020: N/A
- 2021: $259,008
- 2022: $295,241 (+$36,233, +13.99%)
- 2023: $316,582 (+$21,341, +7.23%)
- 2024: $327,388 (+$10,806, +3.41%)
- 2025: $340,132 (+$12,744, +3.89%)
With an 86.41% increase since 2010, Piedmont has emerged as one of Oklahoma’s strongest mid-sized markets. Despite slight early declines, it rebounded quickly with steady growth. The town saw major appreciation post-2021, marking it as a place of increasing suburban demand west of OKC.
Piedmont – A Family-Friendly Option on the Rise
Piedmont’s appeal lies in its mix of quiet neighborhoods, spacious properties, and access to Oklahoma City. It’s an ideal spot for families looking for top-ranked schools and safe surroundings. New subdivisions and community investment have supported its home value growth.
As demand for affordable suburbs increases, Piedmont has positioned itself well. Its steady appreciation makes it a reliable choice for buyers who want both value and quality of life.
9. Broken Bow – 156.17% Home Price Increase Since 2010

- 2010: $132,812
- 2011: $131,989 ($-823, -0.62%)
- 2012: $134,127 (+$2,138, +1.62%)
- 2013: $145,294 (+$11,167, +8.33%)
- 2014: $148,729 (+$3,436, +2.36%)
- 2015: $158,728 (+$9,999, +6.72%)
- 2016: $169,153 (+$10,425, +6.57%)
- 2017: $176,983 (+$7,830, +4.63%)
- 2018: $192,461 (+$15,478, +8.75%)
- 2019: $205,534 (+$13,073, +6.79%)
- 2020: N/A
- 2021: $283,937
- 2022: $367,284 (+$83,347, +29.35%)
- 2023: $378,471 (+$11,187, +3.05%)
- 2024: $366,190 ($-12,281, -3.24%)
- 2025: $340,219 ($-25,971, -7.09%)
Broken Bow’s values surged by over 150% since 2010, largely due to tourism and short-term rental demand. Though the most recent years show a decline, the decade-long upward trend has transformed this quiet town into a real estate hotspot. Its location near the Hochatown recreation area has made it a magnet for cabins, vacation homes, and Airbnb rentals.
Broken Bow – Tourism-Driven Housing Boom
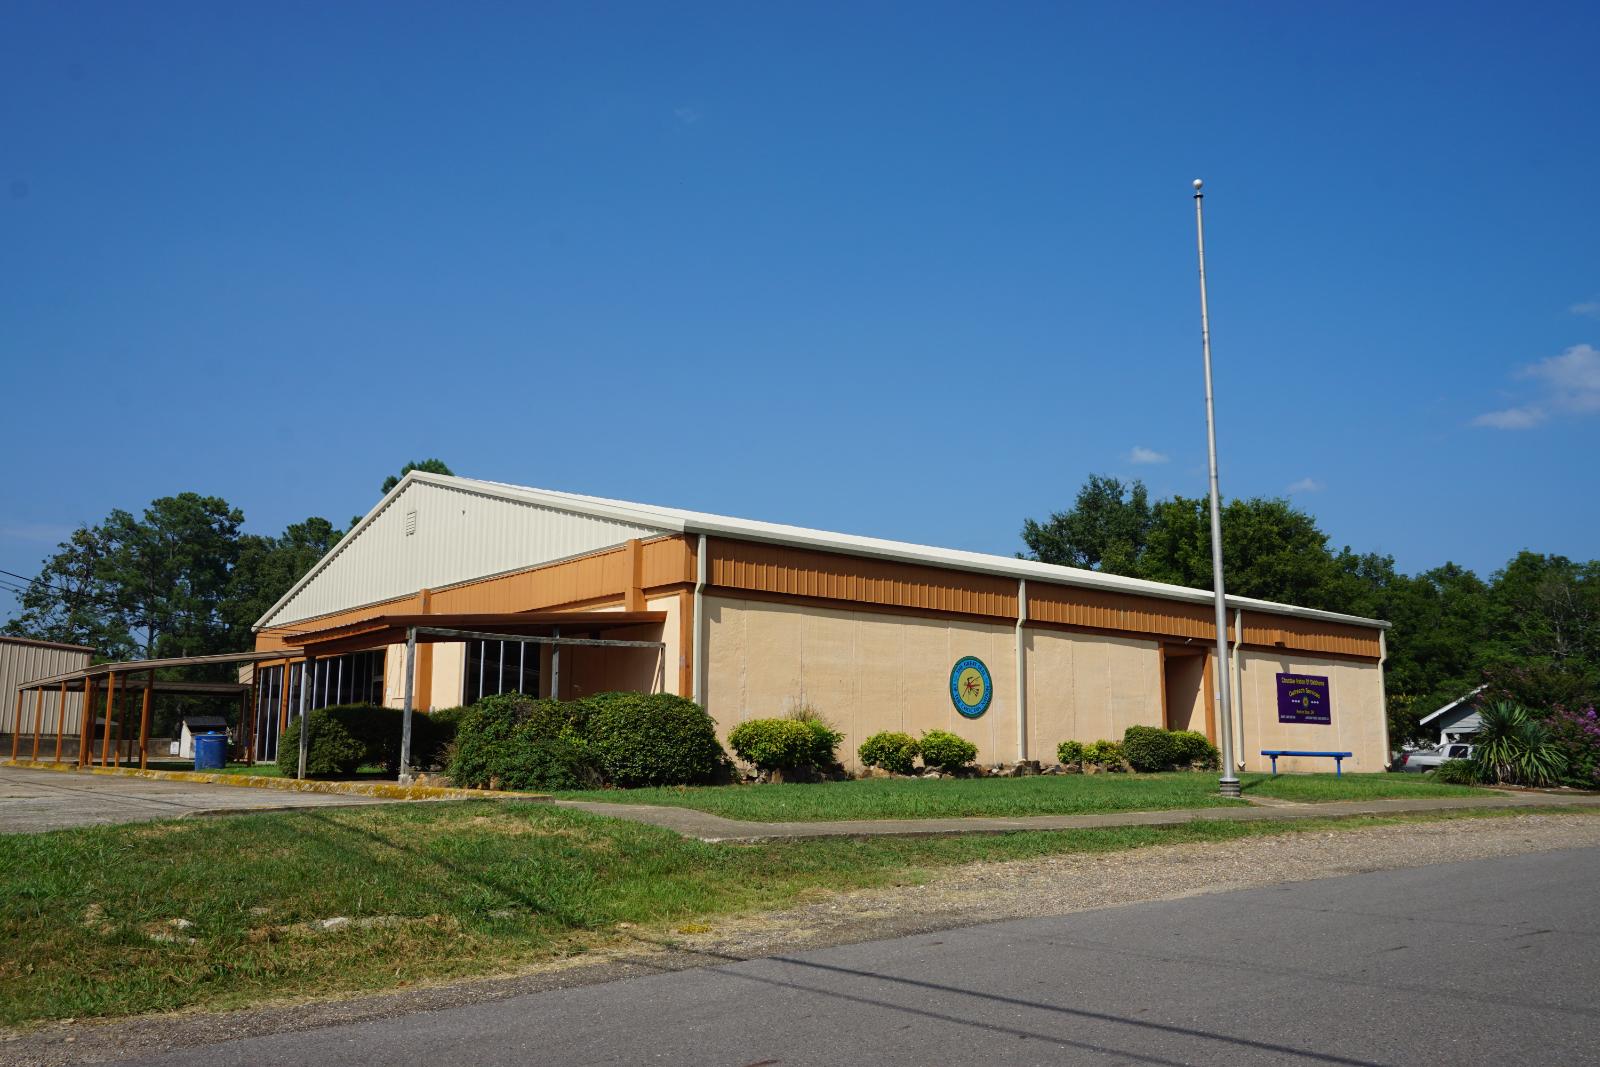
Nestled in southeast Oklahoma, Broken Bow sits near popular nature attractions like Beavers Bend State Park and the Mountain Fork River. Over the past decade, it’s become a vacation destination for travelers from Texas, Arkansas, and beyond. That growing interest has fueled investment in local real estate, driving up prices dramatically.
While there’s been a recent dip in value—possibly due to saturation or shifting demand—the town’s appeal remains strong. As Oklahoma’s outdoor tourism continues to grow, Broken Bow is likely to see continued attention from both investors and lifestyle buyers.
8. Afton – 126.69% Home Price Increase Since 2010

- 2010: $153,747
- 2011: $152,952 ($-795, -0.52%)
- 2012: $158,803 (+$5,851, +3.83%)
- 2013: $171,019 (+$12,215, +7.69%)
- 2014: $187,441 (+$16,422, +9.60%)
- 2015: $191,322 (+$3,881, +2.07%)
- 2016: $193,108 (+$1,787, +0.93%)
- 2017: $198,420 (+$5,312, +2.75%)
- 2018: $204,141 (+$5,721, +2.88%)
- 2019: $208,478 (+$4,337, +2.12%)
- 2020: N/A
- 2021: $270,709
- 2022: $316,706 (+$45,997, +16.99%)
- 2023: $322,716 (+$6,010, +1.90%)
- 2024: $338,586 (+$15,870, +4.92%)
- 2025: $348,528 (+$9,942, +2.94%)
Afton’s home prices have jumped by more than 126% since 2010, with most of the appreciation occurring between 2021 and 2025. After several years of stable but modest gains, values took off during the pandemic as rural demand soared. With easy access to Grand Lake O’ the Cherokees, it’s increasingly seen as a second-home destination.
Afton – From Quiet Town to Second-Home Hotspot
Located in northeast Oklahoma, Afton is close to Grand Lake, one of the state’s premier recreational areas. That proximity has turned it into a popular choice for lakefront living and vacation properties. As more Oklahomans and out-of-state buyers seek peaceful escapes, Afton has reaped the benefits.
Though once overlooked, it now holds significant market value. The town’s consistent appreciation and natural appeal make it one of the standout performers in Oklahoma real estate this decade.
7. Jenks – 62.68% Home Price Increase Since 2010

- 2010: $215,489
- 2011: $207,539 ($-7,950, -3.69%)
- 2012: $206,049 ($-1,489, -0.72%)
- 2013: $212,062 (+$6,013, +2.92%)
- 2014: $217,923 (+$5,861, +2.76%)
- 2015: $224,224 (+$6,301, +2.89%)
- 2016: $226,637 (+$2,413, +1.08%)
- 2017: $236,555 (+$9,918, +4.38%)
- 2018: $235,778 ($-777, -0.33%)
- 2019: $240,429 (+$4,651, +1.97%)
- 2020: N/A
- 2021: $276,529
- 2022: $323,145 (+$46,616, +16.86%)
- 2023: $338,256 (+$15,111, +4.68%)
- 2024: $344,724 (+$6,468, +1.91%)
- 2025: $350,560 (+$5,835, +1.69%)
Jenks has seen a healthy 62.68% growth in home prices since 2010, with much of the acceleration happening after 2020. The town’s housing market remained stable for most of the decade, but recent years brought strong appreciation—especially in 2022. These trends show that Jenks has matured into a highly desirable Tulsa-area suburb.
Jenks – Strong Schools and Rising Demand
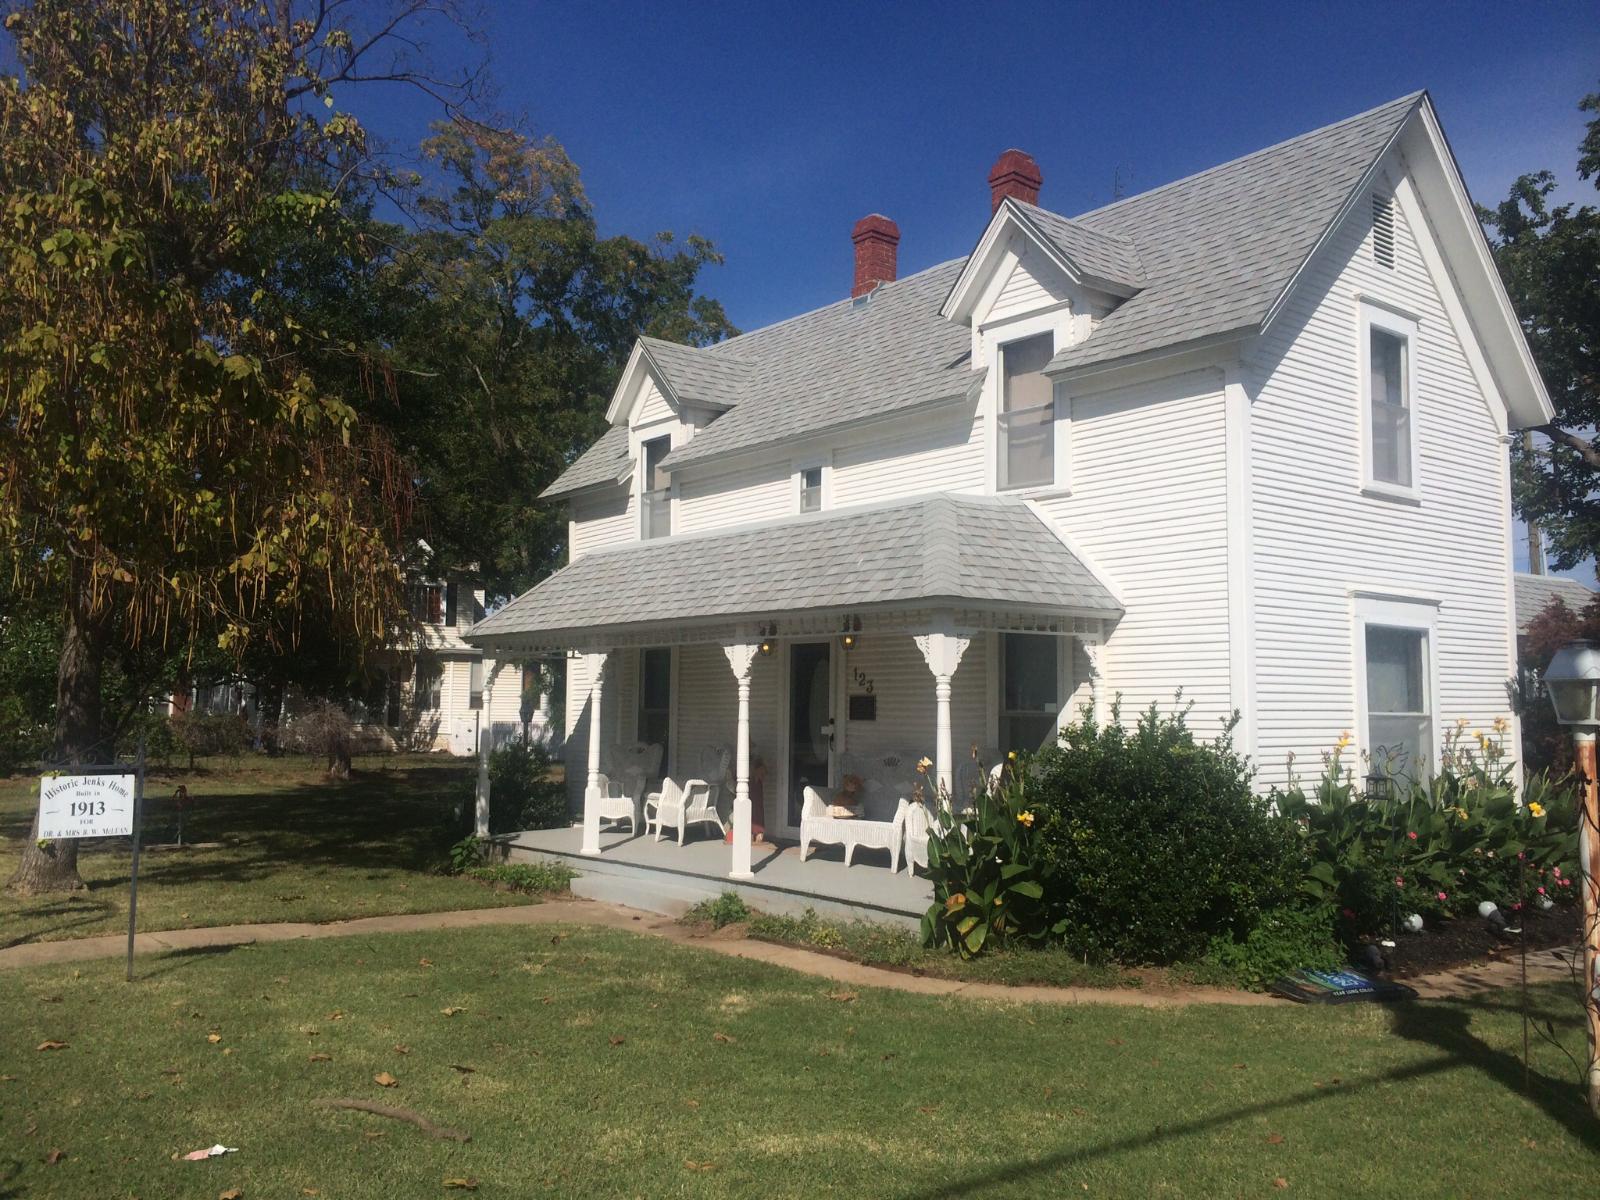
Jenks is widely known for its award-winning public school system, which plays a major role in its popularity among families. Located just south of Tulsa, it offers suburban peace with quick access to city jobs and entertainment. That mix has kept demand high and inventory tight.
Alongside its educational appeal, Jenks benefits from riverfront development, a walkable downtown, and family-oriented neighborhoods. Homebuyers who moved in before the big jump in 2022 have seen substantial equity growth, and market signals suggest steady value in the years ahead.
6. Edmond – 62.22% Home Price Increase Since 2010

- 2010: $216,826
- 2011: $212,044 ($-4,782, -2.21%)
- 2012: $210,179 ($-1,864, -0.88%)
- 2013: $217,574 (+$7,395, +3.52%)
- 2014: $224,629 (+$7,055, +3.24%)
- 2015: $233,135 (+$8,507, +3.79%)
- 2016: $237,158 (+$4,023, +1.73%)
- 2017: $239,008 (+$1,850, +0.78%)
- 2018: $241,857 (+$2,849, +1.19%)
- 2019: $247,560 (+$5,703, +2.36%)
- 2020: N/A
- 2021: $279,153
- 2022: $326,966 (+$47,813, +17.13%)
- 2023: $344,960 (+$17,994, +5.50%)
- 2024: $349,522 (+$4,562, +1.32%)
- 2025: $351,740 (+$2,218, +0.63%)
Home values in Edmond have climbed over 62% in the last 15 years, thanks to consistent appreciation and a notable jump in 2022. Edmond’s growth reflects its status as a major residential hub just north of Oklahoma City. Even during slower years, home prices in Edmond held strong, offering stability in uncertain markets.
Edmond – A Desirable Suburb with Staying Power

Edmond is one of Oklahoma’s largest and most developed suburban cities, offering a combination of strong schools, recreational amenities, and upscale neighborhoods. Residents benefit from large parks, cultural attractions, and a thriving local economy.
The market here rarely sees dramatic spikes, but it also avoids harsh corrections. That predictability has made Edmond a favorite among buyers seeking long-term value. As new housing continues to expand and demand remains high, its steady price growth is likely to continue.
5. Jones – 126.16% Home Price Increase Since 2010

🔥 Would you like to save this?
- 2010: $159,497
- 2011: $161,732 (+$2,235, +1.40%)
- 2012: $154,402 ($-7,330, -4.53%)
- 2013: $166,980 (+$12,578, +8.15%)
- 2014: $177,194 (+$10,213, +6.12%)
- 2015: $195,225 (+$18,031, +10.18%)
- 2016: $196,779 (+$1,554, +0.80%)
- 2017: $202,578 (+$5,799, +2.95%)
- 2018: $222,128 (+$19,550, +9.65%)
- 2019: $227,609 (+$5,481, +2.47%)
- 2020: N/A
- 2021: $276,048
- 2022: $314,672 (+$38,624, +13.99%)
- 2023: $335,964 (+$21,292, +6.77%)
- 2024: $346,942 (+$10,978, +3.27%)
- 2025: $360,726 (+$13,784, +3.97%)
Jones has seen explosive growth since 2010, with home prices more than doubling. Large annual increases throughout the 2010s laid the foundation, but the post-2020 housing boom pushed it even further. The town’s small size and rural appeal have made it a rising star just outside Oklahoma City.
Jones – Country Living with Investment Potential
Jones offers a more rural lifestyle while still being within commuting range of Oklahoma City. It’s this balance of space, quiet, and accessibility that has driven growth. Buyers looking for acreage and newer construction have helped fuel rising prices in recent years.
Infrastructure improvements and the growing appeal of exurban living have helped keep momentum going. With limited inventory and strong demand, Jones is positioned for continued appreciation in the coming years.
4. Cedar Valley – 83.85% Home Price Increase Since 2010

- 2010: $199,021
- 2011: $195,558 ($-3,463, -1.74%)
- 2012: $200,165 (+$4,607, +2.36%)
- 2013: $209,197 (+$9,031, +4.51%)
- 2014: $220,562 (+$11,365, +5.43%)
- 2015: $228,532 (+$7,969, +3.61%)
- 2016: $235,397 (+$6,865, +3.00%)
- 2017: $239,164 (+$3,768, +1.60%)
- 2018: $243,117 (+$3,952, +1.65%)
- 2019: $251,994 (+$8,878, +3.65%)
- 2020: N/A
- 2021: $298,207
- 2022: $333,794 (+$35,587, +11.93%)
- 2023: $347,520 (+$13,727, +4.11%)
- 2024: $356,193 (+$8,672, +2.50%)
- 2025: $365,900 (+$9,708, +2.73%)
Cedar Valley has posted a solid 83.85% rise in home values over the 15-year period. With a mix of steady year-to-year growth and a jump in the early 2020s, the town offers a dependable track record. The gains suggest growing interest in smaller towns that offer space, privacy, and lifestyle flexibility.
Cedar Valley – Small Town, Strong Returns
Located northwest of the Oklahoma City metro, Cedar Valley is a compact, peaceful community. Its location near golf courses and open spaces makes it attractive for retirees and buyers looking for low-density living. Development has remained modest, keeping the town quiet and stable.
Despite its small size, home values have appreciated sharply—likely due to limited supply and growing spillover demand from nearby cities. Buyers looking for low-maintenance housing options outside city limits continue to push prices upward.
3. Cleora – 70.50% Home Price Increase Since 2016

- 2010: N/A
- 2011: N/A
- 2012: N/A
- 2013: N/A
- 2014: N/A
- 2015: N/A
- 2016: $232,886
- 2017: $233,597 (+$711, +0.31%)
- 2018: $241,407 (+$7,811, +3.34%)
- 2019: $248,417 (+$7,010, +2.90%)
- 2020: N/A
- 2021: $298,660
- 2022: $364,621 (+$65,960, +22.09%)
- 2023: $374,674 (+$10,054, +2.76%)
- 2024: $377,290 (+$2,615, +0.70%)
- 2025: $397,072 (+$19,782, +5.24%)
Though data begins in 2016, Cleora has still shown a 70.5% increase in home values—a sign of rapid growth in a short window. The 2022 leap of 22% stands out, suggesting high demand for lake-area properties. As prices continue to rise, Cleora has cemented its place as one of northeast Oklahoma’s top growth markets.
Cleora – Lakefront Growth in Grand Lake Country
Cleora sits along Grand Lake O’ the Cherokees, one of Oklahoma’s most popular lake destinations. This scenic location has drawn increasing numbers of second-home buyers and retirees, boosting real estate interest. The area’s tranquil surroundings and recreational access make it a strong magnet for those looking to escape city life.
Cleora’s real estate market reflects this shift, with prices rising fast in recent years. As lake towns grow in popularity across the country, Cleora is clearly benefiting from that broader trend—becoming a choice destination for both seasonal and full-time residents.
2. Goldsby – 110.29% Home Price Increase Since 2010

- 2010: $199,496
- 2011: $191,966 ($-7,530, -3.77%)
- 2012: $194,159 (+$2,194, +1.14%)
- 2013: $210,336 (+$16,177, +8.33%)
- 2014: $221,570 (+$11,234, +5.34%)
- 2015: $234,240 (+$12,670, +5.72%)
- 2016: $240,513 (+$6,273, +2.68%)
- 2017: $250,281 (+$9,767, +4.06%)
- 2018: $263,347 (+$13,067, +5.22%)
- 2019: $265,110 (+$1,762, +0.67%)
- 2020: N/A
- 2021: $318,072
- 2022: $367,937 (+$49,865, +15.68%)
- 2023: $384,610 (+$16,673, +4.53%)
- 2024: $408,010 (+$23,400, +6.08%)
- 2025: $419,516 (+$11,507, +2.82%)
Goldsby has witnessed an impressive 110.29% rise in home prices since 2010, fueled by consistent year-over-year gains and a major spike after 2020. While early years showed gradual growth, the pace quickened sharply in 2021–2022. This rural town turned suburban standout reflects the broader trend of buyers moving farther from urban centers for space and affordability—until prices caught up.
Goldsby – Rural Roots, Modern Momentum
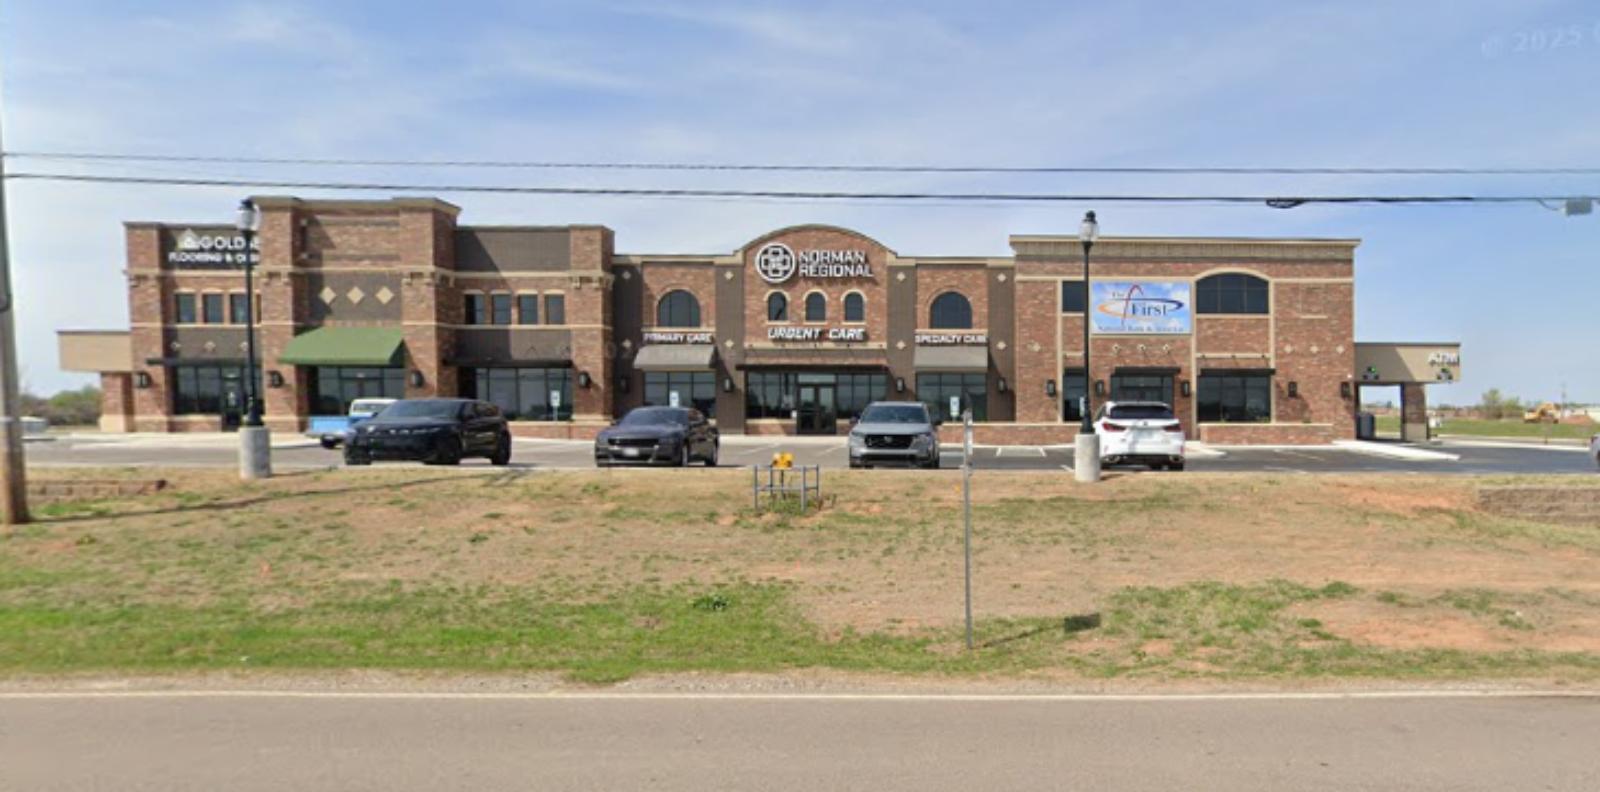
Goldsby is a town in McClain County, just south of Norman, that’s long been known for its wide-open spaces and small-town charm. But in recent years, it’s seen significant residential development, transforming it into a sought-after destination for those escaping city congestion. The increase in property values speaks to rising demand and limited supply in the area.
Strong local schools and proximity to both I-35 and the University of Oklahoma make Goldsby an attractive place for commuters and families alike. While it retains its quiet character, it’s clearly no longer a secret in Oklahoma real estate circles.
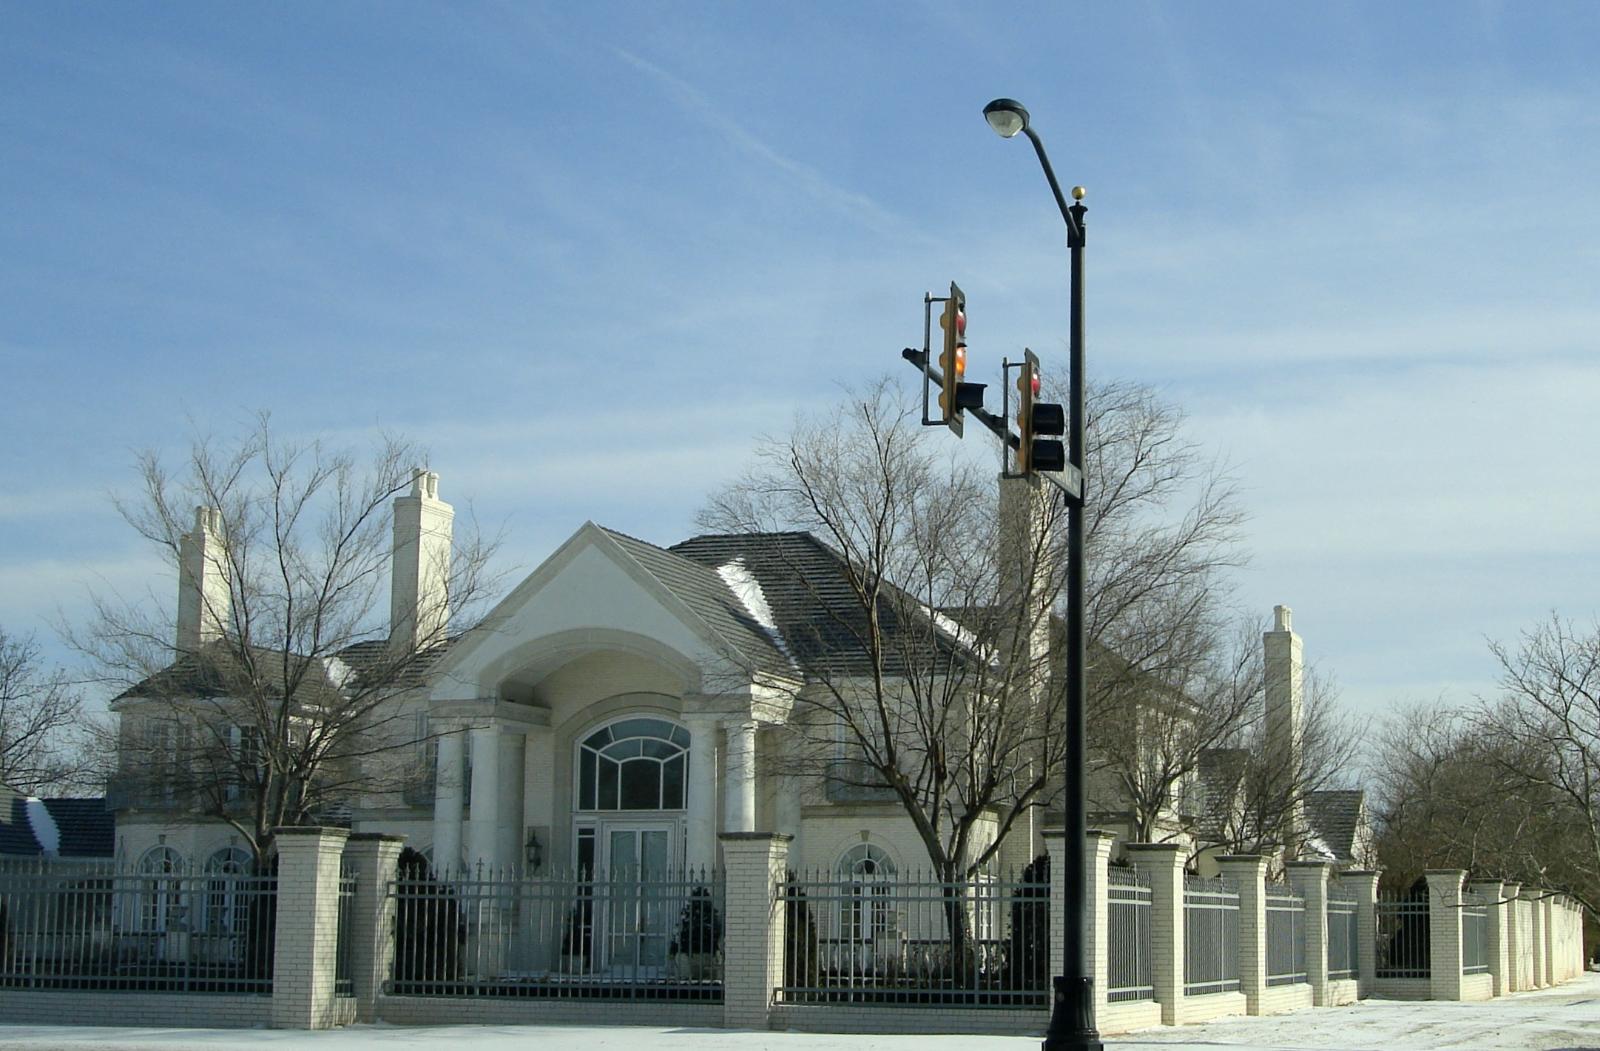
1. Nichols Hills – 84.12% Home Price Increase Since 2010

- 2010: $512,601
- 2011: $501,548 ($-11,054, -2.16%)
- 2012: $504,608 (+$3,061, +0.61%)
- 2013: $540,213 (+$35,605, +7.06%)
- 2014: $579,898 (+$39,685, +7.35%)
- 2015: $623,922 (+$44,024, +7.59%)
- 2016: $617,893 ($-6,029, -0.97%)
- 2017: $602,772 ($-15,121, -2.45%)
- 2018: $662,116 (+$59,344, +9.85%)
- 2019: $708,075 (+$45,959, +6.94%)
- 2020: N/A
- 2021: $748,318
- 2022: $854,830 (+$106,512, +14.23%)
- 2023: $886,331 (+$31,501, +3.69%)
- 2024: $905,335 (+$19,004, +2.14%)
- 2025: $943,781 (+$38,447, +4.25%)
Nichols Hills tops the list as Oklahoma’s most expensive town in 2025, with home prices climbing over 84% since 2010. While it already started at a high base, values continued to climb through economic cycles, with major gains from 2021 to 2025. Its consistent rise reflects elite demand and ultra-limited inventory in one of the state’s most exclusive areas.
Nichols Hills – Oklahoma’s Premier Luxury Enclave
🔥 Would you like to save this?
Nestled inside Oklahoma City, Nichols Hills is synonymous with upscale living. From grand estates to boutique shops and pristine parks, everything in Nichols Hills is designed with affluence in mind. The neighborhood has long attracted high-income professionals, executives, and longtime residents seeking prestige and privacy.
Even with economic uncertainty over the years, prices have rarely dipped significantly. Instead, the neighborhood continues to appreciate steadily, buoyed by legacy ownership, architectural beauty, and strict zoning that maintains its character. As of 2025, Nichols Hills remains the state’s benchmark for top-tier residential real estate.


