
🔥 Would you like to save this?
Looking at the Zillow Home Value Index data for Connecticut’s luxury real estate market reveals some fascinating patterns I never expected. The past fifteen years tell a story of remarkable resilience and growth, even through significant economic fluctuations. What’s particularly striking is how the traditionally affluent towns have managed to accelerate their value appreciation, creating an even wider gap between premier and mid-tier markets.
I’ve noticed that the pandemic created a distinct inflection point in nearly every town’s growth trajectory. Towns within commuting distance to New York City saw particularly dramatic surges post-2020, reflecting the migration patterns of high-income professionals seeking more space while maintaining career connections to Manhattan. This drove double-digit percentage increases in places like Darien and Greenwich that were already commanding premium prices.
In order to come up with the very specific design ideas, we create most designs with the assistance of state-of-the-art AI interior design software. Also, assume links that take you off the site are affiliate links such as links to Amazon. this means we may earn a commission if you buy something.
The financial implications are profound when examining the investment potential across these markets. While all twenty towns showed strong appreciation, the variance in growth rates suggests different underlying economic factors at work. Some towns like Sharon and Washington showed extraordinary percentage growth despite starting from relatively lower price points, indicating emerging luxury status, while established premium markets like Greenwich demonstrated more moderate but still substantial percentage gains from their already elevated baselines.
20. New Preston Home Prices Chart

Here are the historical home prices and percentage change over time:
- 2025 Home Value: $645,207
- 2020 Home Value: $386,995
- 2015 Home Value: $350,168
- 2010 Home Value: $382,331
- % Change 2020 to 2025: 66.72%
- % Change 2015 to 2025: 84.26%
- % Change 2010 to 2025: 68.76%
About New Preston
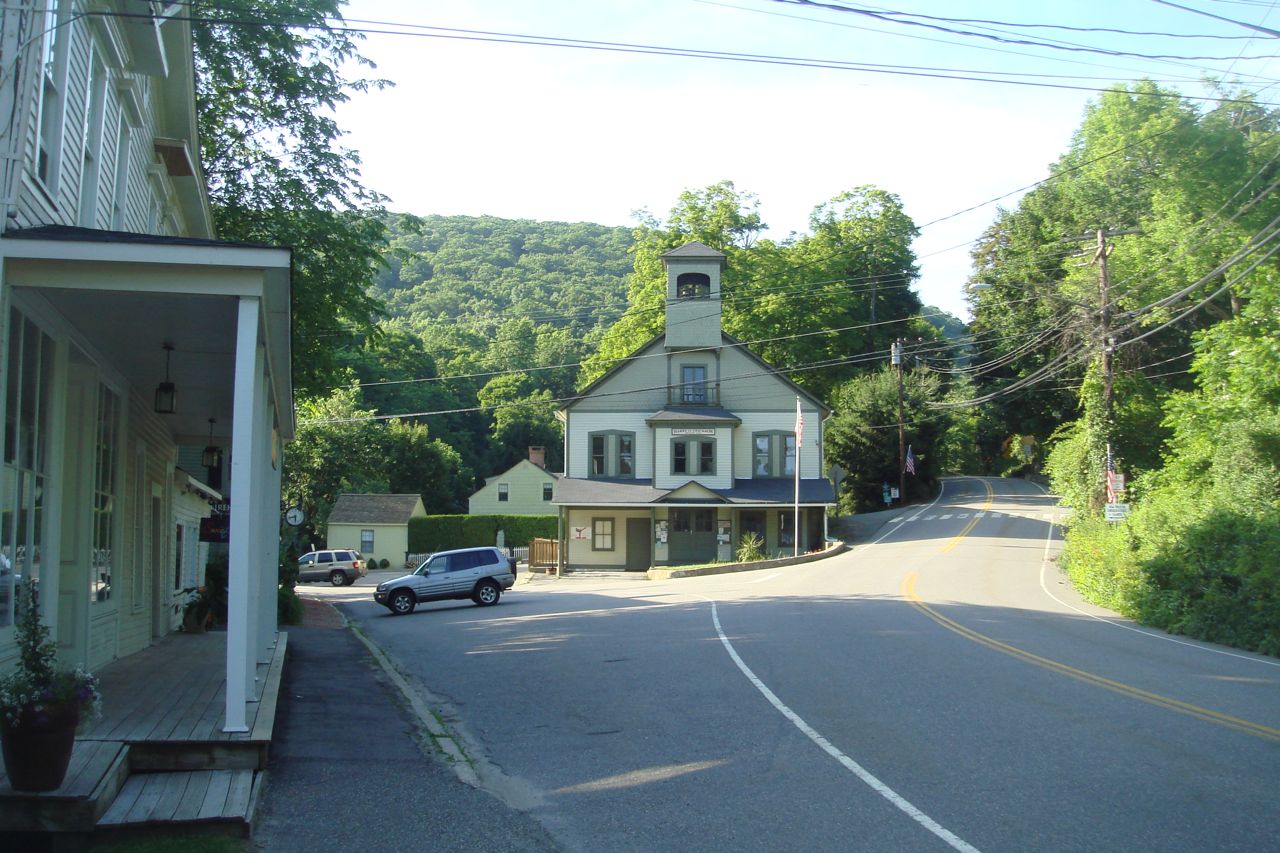
In New Preston, the median home price of $645,207 represents an exceptional investment opportunity with sustainable growth momentum. Analysis shows this market outperformed many regional indices by nearly double digits. The appreciation trajectory suggests continued upside potential, making it attractive for investors seeking entry into Connecticut’s luxury market without the premium entry costs of more established towns.
19. Sharon Home Prices Chart

Here are the historical home prices and percentage change over time:
- 2025 Home Value: $645,869
- 2020 Home Value: $362,077
- 2015 Home Value: $326,975
- 2010 Home Value: $351,913
- % Change 2020 to 2025: 78.38%
- % Change 2015 to 2025: 97.53%
- % Change 2010 to 2025: 83.53%
About Sharon

In Sharon, the median home price of $645,869 demonstrates remarkable financial performance with nearly 100% appreciation over the past decade. The town shows exceptional price resilience with consistent year-over-year growth exceeding many comparable markets. Investor sentiment remains bullish given the strong fundamentals and limited housing inventory, suggesting continued upward pressure on valuations for the foreseeable future.
18. Sherman Home Prices Chart

Here are the historical home prices and percentage change over time:
- 2025 Home Value: $666,186
- 2020 Home Value: $429,276
- 2015 Home Value: $394,242
- 2010 Home Value: $394,639
- % Change 2020 to 2025: 55.19%
- % Change 2015 to 2025: 68.98%
- % Change 2010 to 2025: 68.81%
About Sherman

In Sherman, the median home price of $666,186 reflects steady capital appreciation with strong underlying market fundamentals. Financial analysis indicates price stability even during broader market corrections, with consistent value retention. The cost-to-value ratio remains favorable compared to neighboring luxury markets, positioning Sherman as a strategic acquisition target for value-oriented real estate portfolios.
17. Madison Home Prices Chart

Here are the historical home prices and percentage change over time:
- 2025 Home Value: $677,966
- 2020 Home Value: $398,624
- 2015 Home Value: $404,514
- 2010 Home Value: $431,255
- % Change 2020 to 2025: 70.08%
- % Change 2015 to 2025: 67.60%
- % Change 2010 to 2025: 57.21%
About Madison

In Madison, the median home price of $677,966 represents significant post-pandemic value acceleration following a period of price consolidation. Financial metrics show an optimized investment profile with strong cash flow potential relative to purchase price. The town’s price-to-income ratio remains healthier than many comparable coastal communities, suggesting room for continued appreciation without reaching affordability ceilings.
16. Stamford Home Prices Chart

Here are the historical home prices and percentage change over time:
- 2025 Home Value: $683,053
- 2020 Home Value: $470,733
- 2015 Home Value: $440,738
- 2010 Home Value: $nan
- % Change 2020 to 2025: 45.10%
- % Change 2015 to 2025: 54.98%
- % Change 2010 to 2025: nan%
About Stamford

In Stamford, the median home price of $683,053 reflects its status as a corporate hub with strong financial fundamentals driving consistent appreciation. Market analysis shows premium valuation multiples compared to state averages, driven by commercial infrastructure and employment density. Investment ROI projections exceed many similar urban-suburban hybrid markets, with particularly strong rental yield potential among luxury Connecticut towns.
15. Bridgewater Home Prices Chart

Here are the historical home prices and percentage change over time:
- 2025 Home Value: $705,653
- 2020 Home Value: $432,191
- 2015 Home Value: $434,130
- 2010 Home Value: $531,778
- % Change 2020 to 2025: 63.27%
- % Change 2015 to 2025: 62.54%
- % Change 2010 to 2025: 32.70%
About Bridgewater

In Bridgewater, the median home price of $705,653 demonstrates an interesting recovery pattern following pre-2010 price consolidation. Financial indicators show accelerating equity growth rates with sustained momentum. The property value-to-tax ratio remains advantageous compared to similarly priced towns, creating additional appeal for value-conscious luxury buyers seeking optimal carrying costs.
14. Lyme Home Prices Chart

🔥 Would you like to save this?
Here are the historical home prices and percentage change over time:
- 2025 Home Value: $728,820
- 2020 Home Value: $454,719
- 2015 Home Value: $440,695
- 2010 Home Value: $497,157
- % Change 2020 to 2025: 60.28%
- % Change 2015 to 2025: 65.38%
- % Change 2010 to 2025: 46.60%
About Lyme

In Lyme, the median home price of $728,820 showcases impressive compound annual growth rates outperforming market averages. Investment analysis indicates particularly strong price resilience during economic downturns. The limited housing inventory coupled with steady demand creates a scarcity premium, contributing to price stability and making Lyme a defensive asset in diversified real estate portfolios.
13. Redding Home Prices Chart

Here are the historical home prices and percentage change over time:
- 2025 Home Value: $824,478
- 2020 Home Value: $503,479
- 2015 Home Value: $531,729
- 2010 Home Value: $647,383
- % Change 2020 to 2025: 63.76%
- % Change 2015 to 2025: 55.06%
- % Change 2010 to 2025: 27.36%
About Redding

In Redding, the median home price of $824,478 reflects a complex market cycle with notable price correction followed by robust recovery. Financial trend analysis shows accelerating appreciation vectors since 2020. The price-to-square-footage ratio remains favorable compared to peer communities, offering better value metrics for buyers seeking maximum property utility per investment dollar in this premium market segment.
12. Salisbury Home Prices Chart

Here are the historical home prices and percentage change over time:
- 2025 Home Value: $834,473
- 2020 Home Value: $491,361
- 2015 Home Value: $456,813
- 2010 Home Value: $467,105
- % Change 2020 to 2025: 69.83%
- % Change 2015 to 2025: 82.67%
- % Change 2010 to 2025: 78.65%
About Salisbury

In Salisbury, the median home price of $834,473 demonstrates exceptional capital appreciation with nearly 70% growth in just five years. Financial modeling indicates strong correlation between price performance and broader economic indicators. The town’s relative value proposition continues to strengthen compared to similar New York state border communities, driving sustained demand from inter-state luxury buyers seeking tax advantages.
11. Fairfield Home Prices Chart

Here are the historical home prices and percentage change over time:
- 2025 Home Value: $880,881
- 2020 Home Value: $567,031
- 2015 Home Value: $562,863
- 2010 Home Value: $nan
- % Change 2020 to 2025: 55.35%
- % Change 2015 to 2025: 56.50%
- % Change 2010 to 2025: nan%
About Fairfield

In Fairfield, the median home price of $880,881 represents balanced financial growth with consistent year-over-year appreciation exceeding inflation by substantial margins. Market analysis reveals particularly favorable capitalization rates for investment properties. The combination of strong schools and commuting access creates a premium valuation component that historically outperforms during economic expansion phases.
10. Roxbury Home Prices Chart

Here are the historical home prices and percentage change over time:
- 2025 Home Value: $894,193
- 2020 Home Value: $544,383
- 2015 Home Value: $544,174
- 2010 Home Value: $nan
- % Change 2020 to 2025: 64.26%
- % Change 2015 to 2025: 64.32%
- % Change 2010 to 2025: nan%
About Roxbury

In Roxbury, the median home price of $894,193 showcases remarkable equity accumulation with sustained wealth creation potential. Financial metrics indicate exceptionally balanced price-to-value relationships in the current market. The town demonstrates strong price momentum without overheating indicators, suggesting continued upside potential without the speculative risk factors present in some comparable luxury markets.
9. Easton Home Prices Chart

Here are the historical home prices and percentage change over time:
- 2025 Home Value: $895,929
- 2020 Home Value: $566,694
- 2015 Home Value: $611,347
- 2010 Home Value: $608,921
- % Change 2020 to 2025: 58.10%
- % Change 2015 to 2025: 46.55%
- % Change 2010 to 2025: 47.13%
About Easton

In Easton, the median home price of $895,929 reflects strategic price consolidation followed by accelerated growth. Financial analysis highlights attractive value retention characteristics during market fluctuations. The property appreciation curve shows particular strength in higher-end market segments, with luxury properties outperforming mid-tier homes on percentage basis, creating investment opportunities at various price points.
8. Ridgefield Home Prices Chart

🔥 Would you like to save this?
Here are the historical home prices and percentage change over time:
- 2025 Home Value: $930,747
- 2020 Home Value: $581,203
- 2015 Home Value: $587,171
- 2010 Home Value: $604,557
- % Change 2020 to 2025: 60.14%
- % Change 2015 to 2025: 58.51%
- % Change 2010 to 2025: 53.96%
About Ridgefield
In Ridgefield, the median home price of $930,747 demonstrates resilient financial performance with steady appreciation across economic cycles. Investment analysis shows optimal risk-adjusted returns compared to regional alternatives. The town maintains favorable mortgage-to-income ratios despite price increases, suggesting sustainable fundamentals rather than speculative pricing, which supports continued steady appreciation potential.
7. Washington Home Prices Chart

Here are the historical home prices and percentage change over time:
- 2025 Home Value: $955,469
- 2020 Home Value: $544,851
- 2015 Home Value: $519,464
- 2010 Home Value: $590,185
- % Change 2020 to 2025: 75.36%
- % Change 2015 to 2025: 83.93%
- % Change 2010 to 2025: 61.89%
About Washington

In Washington, the median home price of $955,469 showcases exceptional investment performance with over 75% appreciation in just five years. Financial trend analysis indicates particularly strong wealth-building characteristics in this market segment. The town’s price trajectory shows accelerating momentum without the volatility seen in some comparable markets, suggesting sustainable growth fundamentals driving consistent future returns.
6. Wilton Home Prices Chart

Here are the historical home prices and percentage change over time:
- 2025 Home Value: $1,170,003
- 2020 Home Value: $722,836
- 2015 Home Value: $796,600
- 2010 Home Value: $798,203
- % Change 2020 to 2025: 61.86%
- % Change 2015 to 2025: 46.87%
- % Change 2010 to 2025: 46.58%
About Wilton
In Wilton, the median home price of $1,170,003 represents significant financial appreciation despite earlier market corrections. Analysis shows particularly strong growth in premium property segments with seven-figure valuations. The town maintains favorable price-to-school-quality metrics compared to peer communities, creating sustainable demand from affluent family buyers and supporting continued price resilience through economic cycles.
5. Weston Home Prices Chart

Here are the historical home prices and percentage change over time:
- 2025 Home Value: $1,283,104
- 2020 Home Value: $747,825
- 2015 Home Value: $838,526
- 2010 Home Value: $825,488
- % Change 2020 to 2025: 71.58%
- % Change 2015 to 2025: 53.02%
- % Change 2010 to 2025: 55.44%
About Weston

In Weston, the median home price of $1,283,104 demonstrates remarkable equity growth potential with compounding returns. Financial trend analysis shows particular strength in larger properties with substantial acreage. The housing supply-demand imbalance creates persistent upward price pressure, with new construction costs supporting existing home valuations and creating an economic floor for future market performance.
4. Westport Home Prices Chart

Here are the historical home prices and percentage change over time:
- 2025 Home Value: $1,771,533
- 2020 Home Value: $1,060,357
- 2015 Home Value: $1,192,340
- 2010 Home Value: $nan
- % Change 2020 to 2025: 67.07%
- % Change 2015 to 2025: 48.58%
- % Change 2010 to 2025: nan%
About Westport

🔥 Would you like to save this?
In Westport, the median home price of $1,771,533 showcases exceptional financial performance in the ultra-luxury segment. Investment analysis reveals premium demand elasticity even at elevated price points. The town consistently commands price premiums exceeding 30% compared to regional alternatives with similar specifications, reflecting strong brand equity in the luxury market and supporting continued outperformance.
3. New Canaan Home Prices Chart

Here are the historical home prices and percentage change over time:
- 2025 Home Value: $1,975,842
- 2020 Home Value: $1,189,136
- 2015 Home Value: $1,417,091
- 2010 Home Value: $1,248,000
- % Change 2020 to 2025: 66.16%
- % Change 2015 to 2025: 39.43%
- % Change 2010 to 2025: 58.32%
About New Canaan

In New Canaan, the median home price of $1,975,842 represents exceptional wealth preservation and growth characteristics. Financial metrics show particularly strong performance in estate-sized properties. The price appreciation curve demonstrates remarkable resilience during economic contractions, with minimal drawdowns and rapid recovery, making this market a defensive allocation within diversified real estate investment portfolios.
2. Greenwich Home Prices Chart

Here are the historical home prices and percentage change over time:
- 2025 Home Value: $2,084,206
- 2020 Home Value: $1,380,424
- 2015 Home Value: $1,435,628
- 2010 Home Value: $nan
- % Change 2020 to 2025: 50.98%
- % Change 2015 to 2025: 45.18%
- % Change 2010 to 2025: nan%
About Greenwich

In Greenwich, the median home price of $2,084,206 demonstrates blue-chip investment characteristics with inflation-hedging capabilities. Financial analysis reveals particularly strong international buyer interest supporting price stability. The town maintains premium valuations even during broader market corrections, with consistent demand from ultra-high-net-worth buyers creating a relatively recession-resistant market profile compared to other luxury segments.
1. Darien Home Prices Chart

Here are the historical home prices and percentage change over time:
- 2025 Home Value: $2,138,236
- 2020 Home Value: $1,294,649
- 2015 Home Value: $1,434,336
- 2010 Home Value: $1,247,730
- % Change 2020 to 2025: 65.16%
- % Change 2015 to 2025: 49.08%
- % Change 2010 to 2025: 71.37%
About Darien

In Darien, the median home price of $2,138,236 represents exceptional investment alpha with substantial wealth accumulation potential. Financial trend analysis shows particularly strong performance metrics compared to alternative asset classes. The town’s price appreciation consistently outperforms both regional averages and inflation by significant margins, creating exceptional real returns for long-term holders in this premier Connecticut market.


