
🔥 Would you like to save this?
According to the latest Zillow Home Value Index, home prices are rising fastest in these 17 Washington towns—and buyers are still lining up. From forested islands to booming tech suburbs, these places have nailed the mix of beauty, jobs, and lifestyle that drives demand. Some saw pandemic-era surges, others have climbed steadily for years. Either way, they’re now among the state’s priciest—and most wanted—places to live.
17. Snoqualmie – 219% Home Price Increase Since 2012

- 2010: $433,136
- 2011: $411,168 (-$21,969, -5.07% from previous year)
- 2012: $370,571 (-$40,597, -9.87% from previous year)
- 2013: $392,340 (+$21,769, +5.87% from previous year)
- 2014: $443,182 (+$50,842, +12.96% from previous year)
- 2015: $477,513 (+$34,331, +7.75% from previous year)
- 2016: $543,355 (+$65,842, +13.79% from previous year)
- 2017: $613,735 (+$70,381, +12.95% from previous year)
- 2018: $695,293 (+$81,558, +13.29% from previous year)
- 2019: $706,322 (+$11,028, +1.59% from previous year)
- 2020: N/A
- 2021: $872,650
- 2022: $1,197,991 (+$325,341, +37.28% from previous year)
- 2023: $1,041,363 (-$156,627, -13.07% from previous year)
- 2024: $1,117,071 (+$75,708, +7.27% from previous year)
- 2025: $1,183,083 (+$66,012, +5.91% from previous year)
Snoqualmie – Scenic Retreat Turned Luxury Suburb

Home prices in Snoqualmie have skyrocketed 219% since 2012, with the typical home now valued at $1.18 million. This mountain-edge community has transformed into one of the most in-demand towns in western Washington, attracting buyers with its balance of peaceful surroundings and city access. The most dramatic leap came in 2022, when home values jumped more than 37% in just one year.
In order to come up with the very specific design ideas, we create most designs with the assistance of state-of-the-art AI interior design software. Also, assume links that take you off the site are affiliate links such as links to Amazon. this means we may earn a commission if you buy something.
Situated about 30 miles east of Seattle, Snoqualmie offers breathtaking views, newer construction, and access to top-rated schools. Outdoor attractions like Snoqualmie Falls and the nearby Cascade foothills boost its appeal for both families and retirees. Its rising profile as a luxury enclave has firmly placed it among the most expensive places to buy a home in the state.
16. Bainbridge Island – 159% Home Price Increase Since 2012

- 2010: $547,904
- 2011: $513,359 (-$34,545, -6.30% from previous year)
- 2012: $461,107 (-$52,252, -10.18% from previous year)
- 2013: $468,555 (+$7,448, +1.62% from previous year)
- 2014: $509,738 (+$41,183, +8.79% from previous year)
- 2015: $555,655 (+$45,917, +9.01% from previous year)
- 2016: $636,618 (+$80,963, +14.57% from previous year)
- 2017: $718,345 (+$81,727, +12.84% from previous year)
- 2018: $769,770 (+$51,425, +7.16% from previous year)
- 2019: $802,453 (+$32,683, +4.25% from previous year)
- 2020: N/A
- 2021: $1,013,766
- 2022: $1,261,766 (+$248,000, +24.46% from previous year)
- 2023: $1,144,961 (-$116,805, -9.26% from previous year)
- 2024: $1,187,063 (+$42,103, +3.68% from previous year)
- 2025: $1,193,906 (+$6,843, +0.58% from previous year)
Bainbridge Island – Waterfront Living With a City Connection

Home values on Bainbridge Island have risen 159% since 2012, with the 2025 median nearing $1.2 million. While the market cooled slightly after a sharp 2022 spike, prices have stabilized at high levels. The island’s mix of small-town charm and easy ferry access to Seattle makes it especially popular among commuters seeking tranquility without giving up city conveniences.
Known for its coastal beauty, Bainbridge offers forested trails, boutique shopping, and a lively arts scene. Limited land and high demand keep inventory tight, contributing to its consistently high price tags. Even modest homes here carry premium values, solidifying its place among the state’s costliest locales.
15. Issaquah – 206% Home Price Increase Since 2012
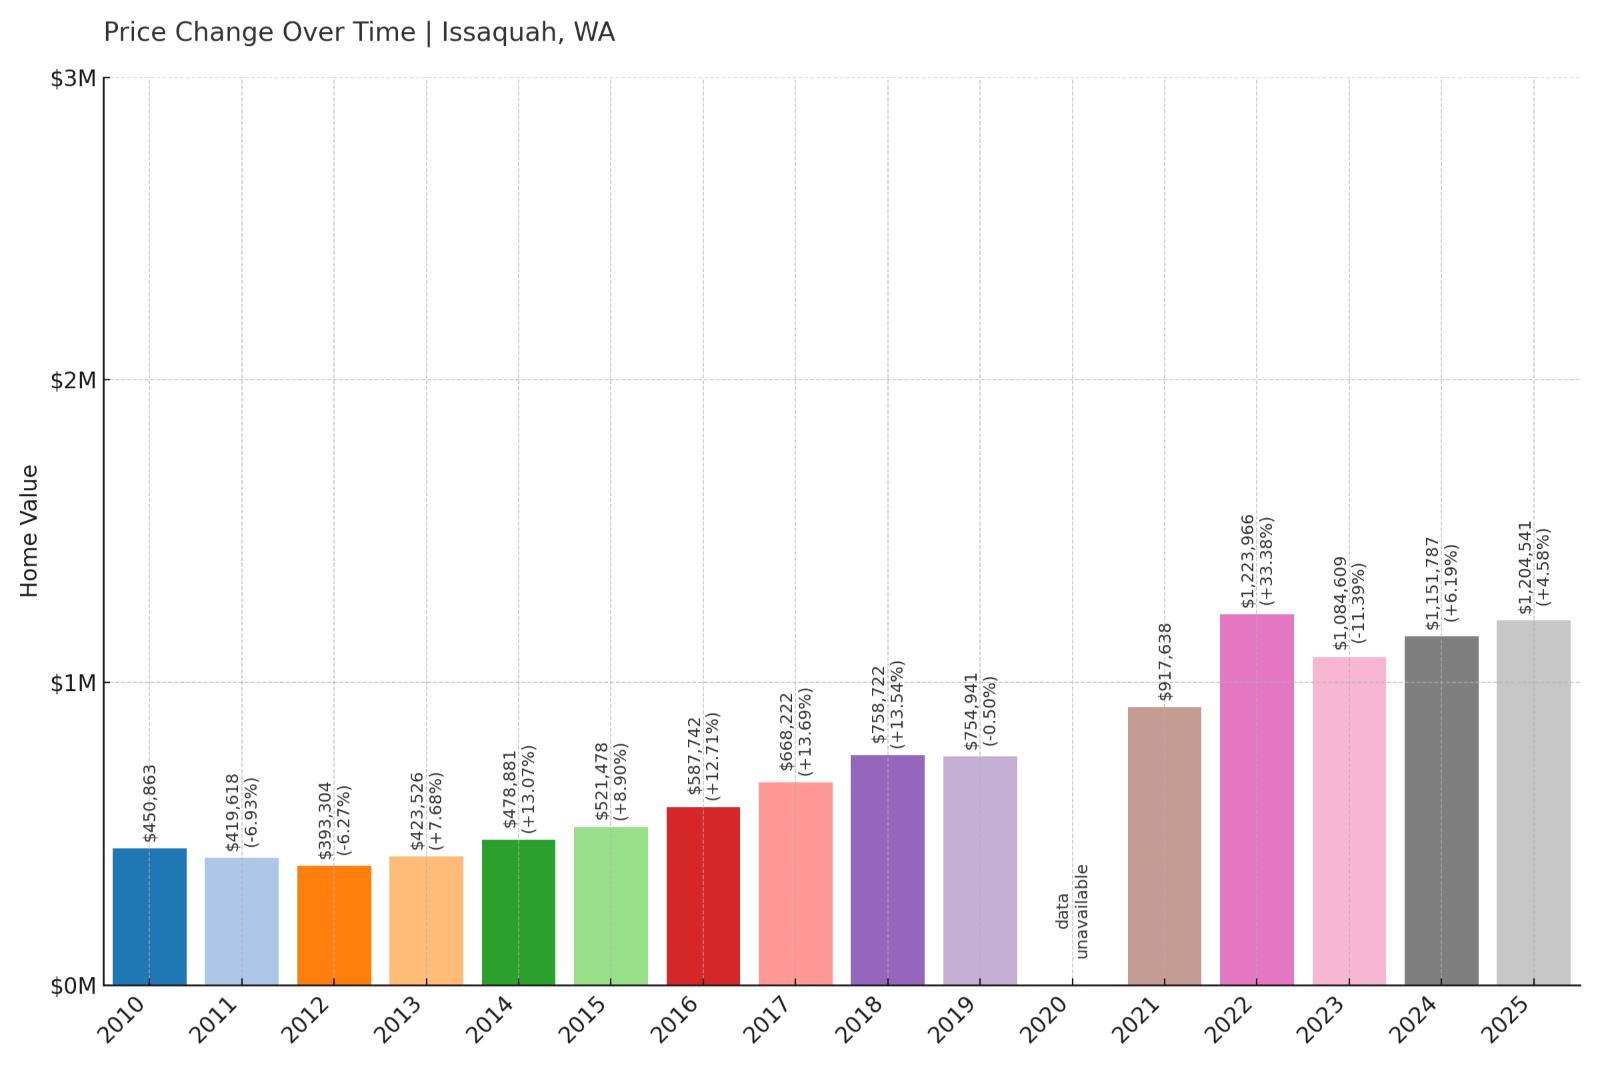
- 2010: $450,863
- 2011: $419,618 (-$31,246, -6.93% from previous year)
- 2012: $393,304 (-$26,314, -6.27% from previous year)
- 2013: $423,526 (+$30,223, +7.68% from previous year)
- 2014: $478,881 (+$55,355, +13.07% from previous year)
- 2015: $521,478 (+$42,596, +8.89% from previous year)
- 2016: $587,742 (+$66,265, +12.71% from previous year)
- 2017: $668,222 (+$80,480, +13.69% from previous year)
- 2018: $758,722 (+$90,500, +13.54% from previous year)
- 2019: $754,941 (-$3,781, -0.50% from previous year)
- 2020: N/A
- 2021: $917,638
- 2022: $1,223,966 (+$306,328, +33.38% from previous year)
- 2023: $1,084,609 (-$139,357, -11.39% from previous year)
- 2024: $1,151,787 (+$67,178, +6.19% from previous year)
- 2025: $1,204,541 (+$52,754, +4.58% from previous year)
Issaquah – Outdoorsy Suburb With Big-Price Energy

Issaquah home values have increased 206% since 2012, with prices reaching over $1.2 million in 2025. After explosive gains in 2022, the market softened briefly before picking back up. The town’s desirable school district, walkable downtown, and proximity to Bellevue and Seattle continue to attract high-income buyers.
Flanked by mountains and hiking trails, Issaquah offers a rare blend of suburban convenience and natural beauty. It’s especially popular with families and tech workers. As the Eastside continues to grow, Issaquah remains a key player in Washington’s luxury housing market.
14. Fall City – 198% Home Price Increase Since 2012
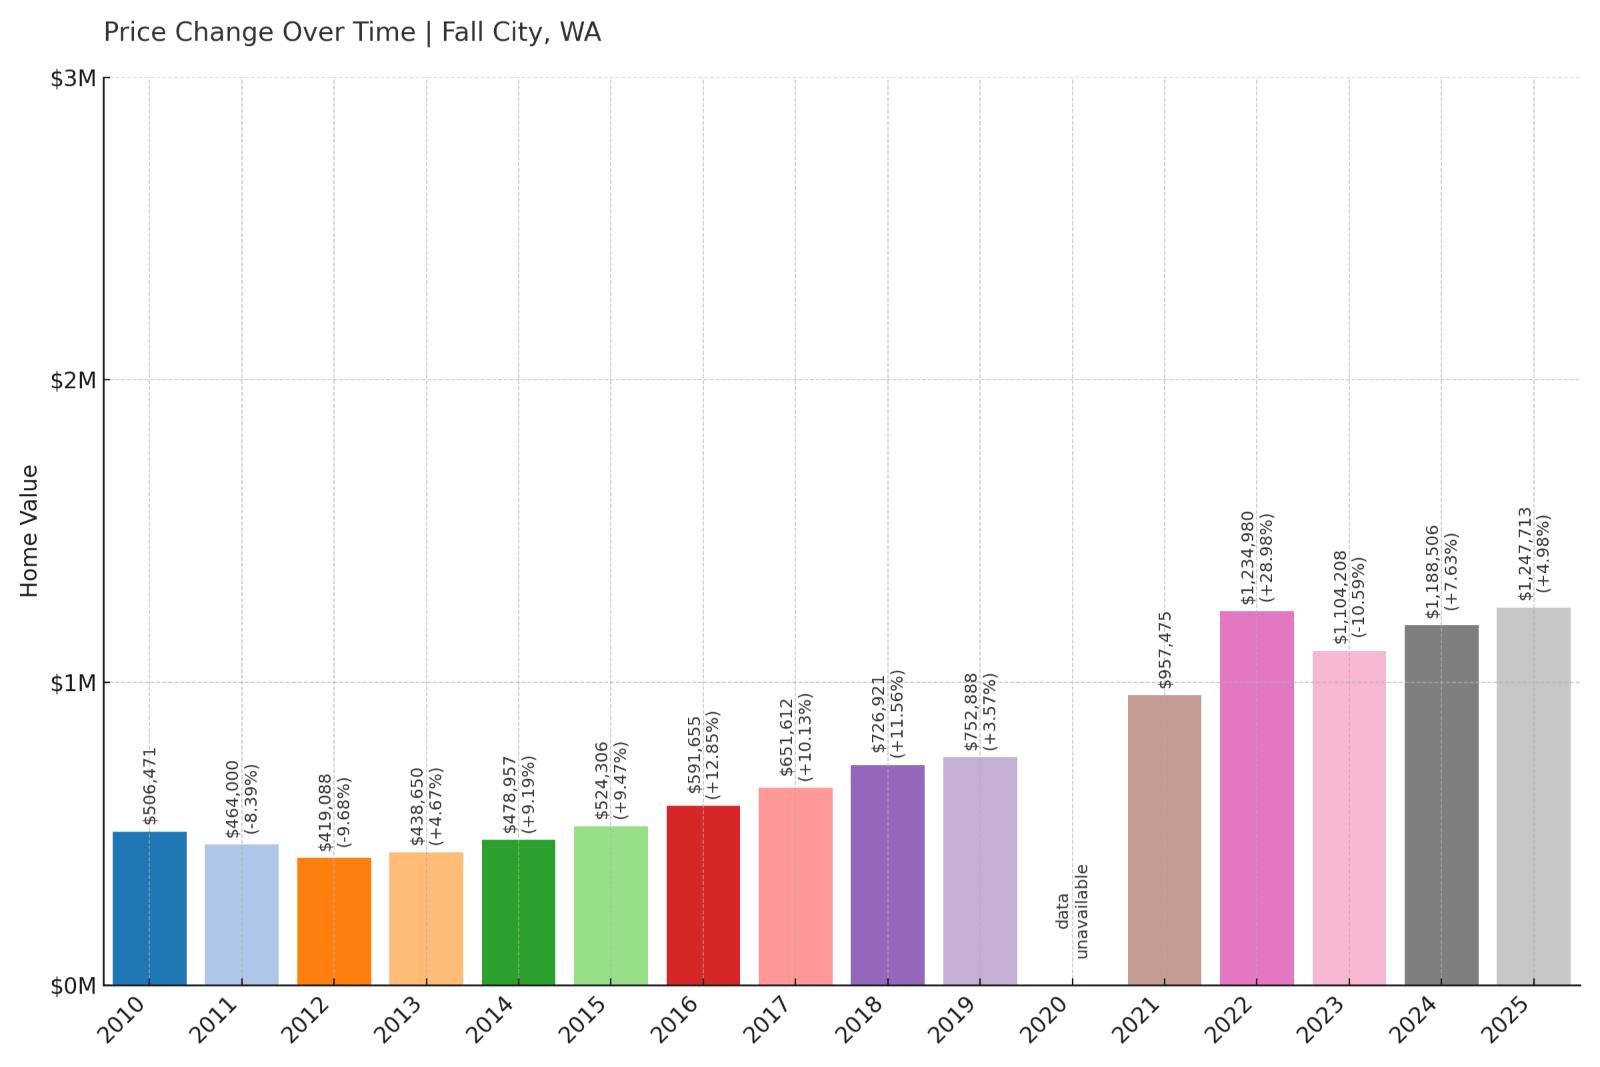
- 2010: $506,471
- 2011: $464,000 (-$42,472, -8.39% from previous year)
- 2012: $419,088 (-$44,912, -9.68% from previous year)
- 2013: $438,650 (+$19,562, +4.67% from previous year)
- 2014: $478,957 (+$40,307, +9.19% from previous year)
- 2015: $524,306 (+$45,348, +9.47% from previous year)
- 2016: $591,655 (+$67,350, +12.85% from previous year)
- 2017: $651,612 (+$59,957, +10.13% from previous year)
- 2018: $726,921 (+$75,310, +11.56% from previous year)
- 2019: $752,888 (+$25,966, +3.57% from previous year)
- 2020: N/A
- 2021: $957,475
- 2022: $1,234,980 (+$277,505, +28.98% from previous year)
- 2023: $1,104,208 (-$130,772, -10.59% from previous year)
- 2024: $1,188,506 (+$84,298, +7.63% from previous year)
- 2025: $1,247,713 (+$59,206, +4.98% from previous year)
Fall City – Secluded, Expensive, and on the Rise

Fall City may be rural in size, but not in price. Home values have increased 198% since 2012, with a 2025 median price approaching $1.25 million. It saw one of its biggest jumps in 2022, with values climbing nearly 29% in a single year. Despite a brief downturn in 2023, the upward trend has resumed.
This small community in the Snoqualmie Valley is known for large lots, scenic riverside properties, and access to outdoor recreation. Its peaceful vibe and proximity to Redmond and Issaquah make it attractive to buyers seeking privacy without giving up proximity to the tech corridor.
13. Kirkland – 269% Home Price Increase Since 2012

- 2010: $430,802
- 2011: $398,841 (-$31,962, -7.42% from previous year)
- 2012: $364,310 (-$34,531, -8.66% from previous year)
- 2013: $410,266 (+$45,956, +12.61% from previous year)
- 2014: $463,303 (+$53,036, +12.93% from previous year)
- 2015: $512,006 (+$48,703, +10.51% from previous year)
- 2016: $582,721 (+$70,715, +13.81% from previous year)
- 2017: $669,987 (+$87,266, +14.98% from previous year)
- 2018: $794,785 (+$124,798, +18.63% from previous year)
- 2019: $788,474 (-$6,311, -0.79% from previous year)
- 2020: N/A
- 2021: $975,843
- 2022: $1,325,315 (+$349,472, +35.81% from previous year)
- 2023: $1,142,781 (-$182,535, -13.77% from previous year)
- 2024: $1,244,443 (+$101,663, +8.90% from previous year)
- 2025: $1,345,306 (+$100,863, +8.11% from previous year)
Kirkland – Lakefront Living With Big Tech Money

Kirkland’s home values have soared 269% since 2012, with the typical home now valued at more than $1.34 million. The city’s lakefront location, walkability, and proximity to tech hubs like Google’s Kirkland campus have made it one of the hottest real estate markets in the state.
Strong buyer interest helped the city rebound quickly from a 2023 dip. With thriving businesses, upscale dining, and scenic parks, Kirkland remains a top-tier destination for those seeking both community and convenience on Seattle’s Eastside.
12. Newcastle – 218% Home Price Increase Since 2012

- 2010: $503,708
- 2011: $477,538 (-$26,170, -5.20% from previous year)
- 2012: $455,039 (-$22,499, -4.71% from previous year)
- 2013: $503,505 (+$48,466, +10.65% from previous year)
- 2014: $555,271 (+$51,766, +10.28% from previous year)
- 2015: $600,540 (+$45,269, +8.15% from previous year)
- 2016: $671,932 (+$71,391, +11.89% from previous year)
- 2017: $753,855 (+$81,923, +12.19% from previous year)
- 2018: $860,644 (+$106,789, +14.17% from previous year)
- 2019: $872,882 (+$12,239, +1.42% from previous year)
- 2020: N/A
- 2021: $1,063,731
- 2022: $1,437,200 (+$373,469, +35.11% from previous year)
- 2023: $1,276,151 (-$161,050, -11.21% from previous year)
- 2024: $1,371,732 (+$95,582, +7.49% from previous year)
- 2025: $1,449,911 (+$78,179, +5.70% from previous year)
Newcastle – Quietly Expensive With Easy Commutes

Newcastle’s home prices have jumped 218% since 2012, reaching nearly $1.45 million in 2025. Its location between Bellevue and Renton makes it an ideal choice for professionals looking to balance quiet neighborhoods with quick freeway access. The sharp spike in 2022 helped catapult it further up the price ladder.
Despite a slight dip in 2023, prices have regained momentum. Newcastle offers a mix of suburban comforts and proximity to nature, with Lake Washington to the west and Cougar Mountain to the east. Its strong schools and growing stock of upscale homes help keep demand consistently high.
11. Woodinville – 220% Home Price Increase Since 2012

🔥 Would you like to save this?
- 2010: $524,504
- 2011: $495,846 (-$28,657, -5.46% from previous year)
- 2012: $456,248 (-$39,598, -7.99% from previous year)
- 2013: $491,457 (+$35,209, +7.72% from previous year)
- 2014: $552,943 (+$61,486, +12.51% from previous year)
- 2015: $600,712 (+$47,769, +8.64% from previous year)
- 2016: $663,496 (+$62,784, +10.45% from previous year)
- 2017: $749,841 (+$86,345, +13.01% from previous year)
- 2018: $842,356 (+$92,516, +12.34% from previous year)
- 2019: $855,021 (+$12,665, +1.50% from previous year)
- 2020: N/A
- 2021: $1,069,822
- 2022: $1,457,930 (+$388,107, +36.28% from previous year)
- 2023: $1,262,190 (-$195,740, -13.43% from previous year)
- 2024: $1,369,115 (+$106,925, +8.47% from previous year)
- 2025: $1,460,564 (+$91,450, +6.68% from previous year)
Woodinville – Wine Country With a Luxury Market

Woodinville has seen a 220% home price increase since 2012, with values topping $1.46 million in 2025. Known for its vineyards and tasting rooms, the town also benefits from being within commuting distance of Bellevue and Redmond. Its big gains in 2022, followed by a steady recovery after a short downturn, reflect consistent buyer interest.
Beyond wine tourism, Woodinville is attractive for its wooded neighborhoods, larger properties, and semi-rural feel. It offers an upscale lifestyle with access to both nature and tech jobs, making it a standout destination for affluent homebuyers in King County.
10. Redmond – 228% Home Price Increase Since 2012

- 2010: $488,832
- 2011: $460,817 (-$28,015, -5.73% from previous year)
- 2012: $426,283 (-$34,534, -7.49% from previous year)
- 2013: $463,992 (+$37,709, +8.85% from previous year)
- 2014: $523,151 (+$59,159, +12.75% from previous year)
- 2015: $569,495 (+$46,344, +8.86% from previous year)
- 2016: $636,033 (+$66,538, +11.68% from previous year)
- 2017: $726,861 (+$90,829, +14.28% from previous year)
- 2018: $850,190 (+$123,328, +16.97% from previous year)
- 2019: $854,985 (+$4,795, +0.56% from previous year)
- 2020: N/A
- 2021: $1,054,271
- 2022: $1,474,929 (+$420,658, +39.90% from previous year)
- 2023: $1,250,228 (-$224,701, -15.23% from previous year)
- 2024: $1,366,640 (+$116,411, +9.31% from previous year)
- 2025: $1,469,670 (+$103,030, +7.54% from previous year)
Redmond – Tech Capital With a Price Tag to Match

Redmond’s home prices have surged 228% since 2012, hitting just under $1.47 million in 2025. It’s no surprise, given the town is home to Microsoft and a growing cluster of tech companies. Prices jumped nearly 40% in 2022, driven by soaring demand and limited inventory.
Redmond blends corporate power with family-friendly amenities, parks, and trails. It’s seen major redevelopment in recent years, including light rail expansion and new housing. These factors continue to attract high-income professionals, keeping its real estate market highly competitive.
9. Bellevue – 228% Home Price Increase Since 2012
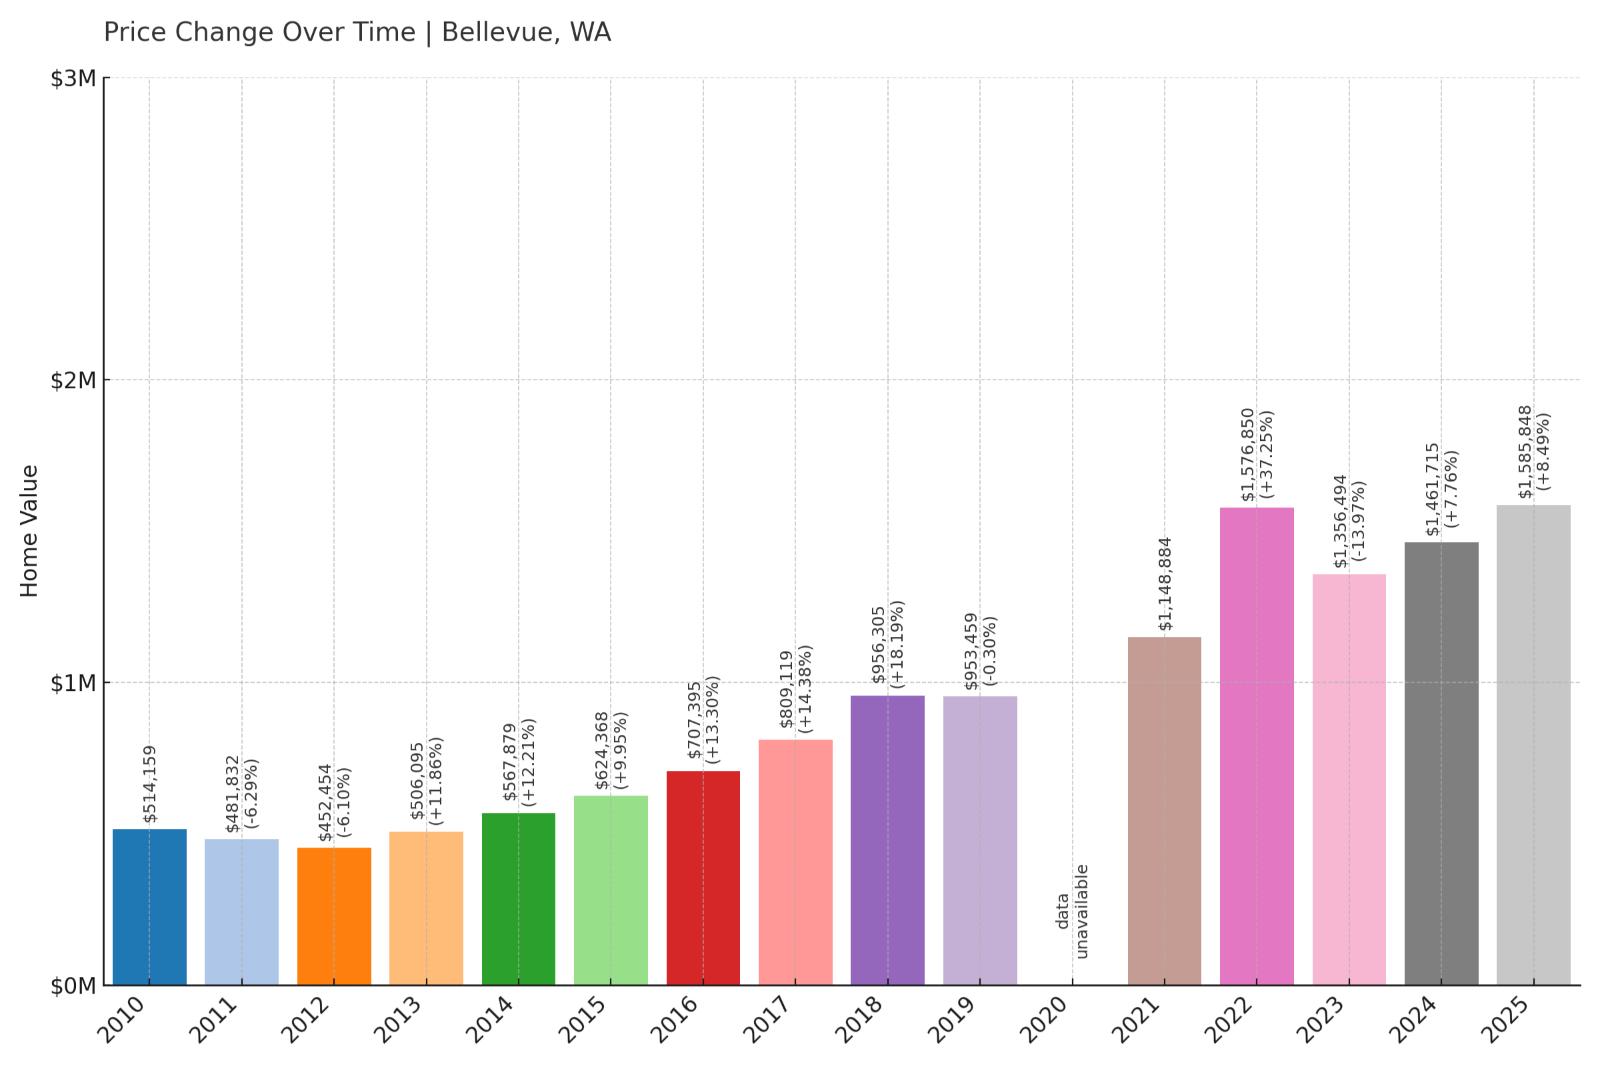
- 2010: $514,159
- 2011: $481,832 (-$32,327, -6.29% from previous year)
- 2012: $452,454 (-$29,378, -6.10% from previous year)
- 2013: $506,095 (+$53,641, +11.86% from previous year)
- 2014: $567,879 (+$61,784, +12.21% from previous year)
- 2015: $624,368 (+$56,490, +9.95% from previous year)
- 2016: $707,395 (+$83,026, +13.30% from previous year)
- 2017: $809,119 (+$101,724, +14.38% from previous year)
- 2018: $956,305 (+$147,186, +18.19% from previous year)
- 2019: $953,459 (-$2,846, -0.30% from previous year)
- 2020: N/A
- 2021: $1,148,884
- 2022: $1,576,850 (+$427,965, +37.25% from previous year)
- 2023: $1,356,494 (-$220,356, -13.97% from previous year)
- 2024: $1,461,715 (+$105,222, +7.76% from previous year)
- 2025: $1,585,848 (+$124,132, +8.49% from previous year)
Bellevue – Big Business, Bigger Prices

Bellevue has kept pace with Redmond, posting a 228% price increase since 2012. By 2025, the average home here costs nearly $1.59 million. The city remains a core hub for tech and finance, with massive developments like Amazon’s Eastside campus fueling demand.
With a walkable downtown, world-class shopping, and lake views, Bellevue combines urban amenities with residential appeal. Its steady price growth, even after short-term corrections, confirms its status as one of the most sought-after places to live in Washington.
8. Sammamish – 289% Home Price Increase Since 2012
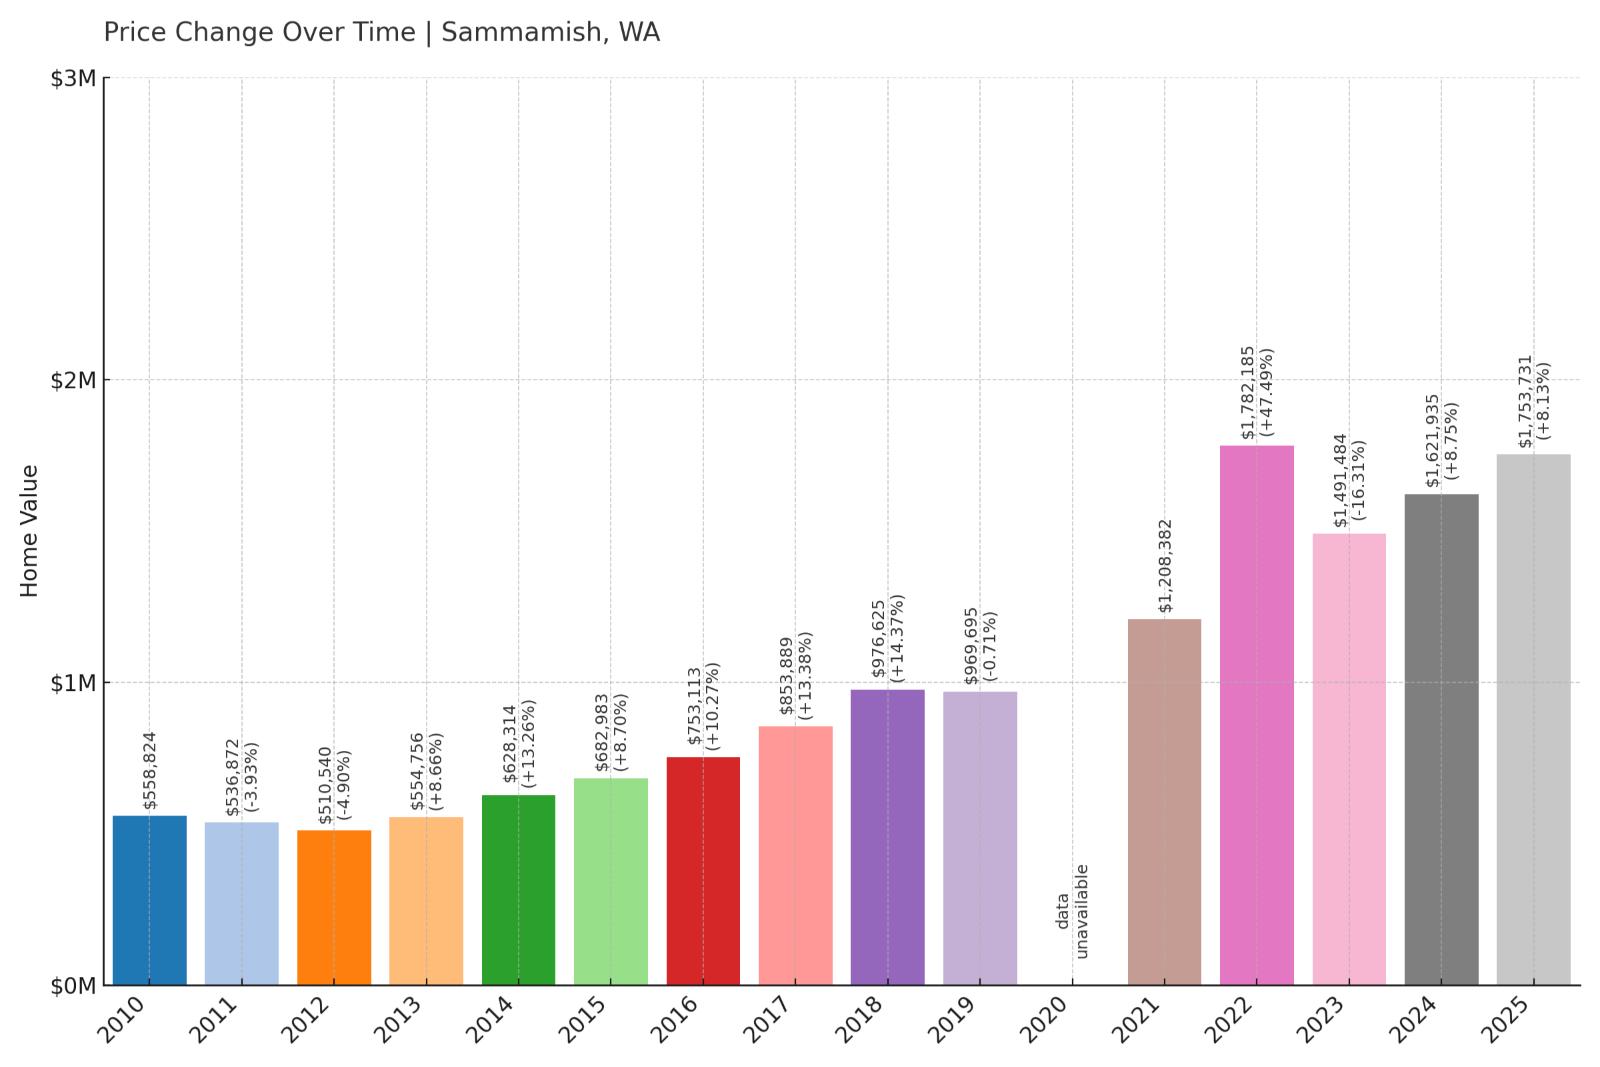
- 2010: $558,824
- 2011: $536,872 (-$21,952, -3.93% from previous year)
- 2012: $510,540 (-$26,332, -4.90% from previous year)
- 2013: $554,756 (+$44,215, +8.66% from previous year)
- 2014: $628,314 (+$73,559, +13.26% from previous year)
- 2015: $682,983 (+$54,668, +8.70% from previous year)
- 2016: $753,113 (+$70,130, +10.27% from previous year)
- 2017: $853,889 (+$100,776, +13.38% from previous year)
- 2018: $976,625 (+$122,737, +14.37% from previous year)
- 2019: $969,695 (-$6,931, -0.71% from previous year)
- 2020: N/A
- 2021: $1,208,382
- 2022: $1,782,185 (+$573,804, +47.49% from previous year)
- 2023: $1,491,484 (-$290,701, -16.31% from previous year)
- 2024: $1,621,935 (+$130,451, +8.75% from previous year)
- 2025: $1,753,731 (+$131,796, +8.13% from previous year)
Sammamish – Family-Friendly and Rapidly Appreciating

Home prices in Sammamish have soared 289% since 2012, putting the median value at over $1.75 million in 2025. The largest jump came in 2022, when values surged nearly 48% in a single year—one of the most aggressive increases in the state. The strong rebound after a dip in 2023 suggests ongoing demand.
Sammamish consistently ranks among the best places to live in Washington, thanks to its top-rated schools, large homes, and extensive park system. Located on the Eastside with proximity to tech employment, it’s become a haven for affluent families seeking space, safety, and natural beauty.
7. Mercer Island – 242% Home Price Increase Since 2012

- 2010: $946,848
- 2011: $882,086 (-$64,761, -6.84% from previous year)
- 2012: $834,789 (-$47,297, -5.36% from previous year)
- 2013: $893,714 (+$58,925, +7.06% from previous year)
- 2014: $993,687 (+$99,973, +11.19% from previous year)
- 2015: $1,080,155 (+$86,469, +8.70% from previous year)
- 2016: $1,219,470 (+$139,314, +12.90% from previous year)
- 2017: $1,353,286 (+$133,816, +10.97% from previous year)
- 2018: $1,532,837 (+$179,551, +13.27% from previous year)
- 2019: $1,551,731 (+$18,895, +1.23% from previous year)
- 2020: N/A
- 2021: $1,866,529
- 2022: $2,472,523 (+$605,993, +32.47% from previous year)
- 2023: $2,168,958 (-$303,565, -12.28% from previous year)
- 2024: $2,279,677 (+$110,719, +5.10% from previous year)
- 2025: $2,420,680 (+$141,004, +6.19% from previous year)
Mercer Island – Exclusive Access and Pricey Views

Mercer Island has seen home values rise 242% since 2012, with the typical property valued at over $2.4 million in 2025. This exclusive island community, located directly between Seattle and Bellevue, continues to command premium prices thanks to its waterfront real estate and limited housing supply.
The island offers quick bridge access to the city while feeling worlds away in terms of peace and quiet. High-performing schools, multi-million-dollar homes, and expansive lake views make it a long-standing favorite among executives and high-net-worth buyers.
6. Woodway – 274% Home Price Increase Since 2012

- 2010: $1,012,377
- 2011: $898,183 (-$114,194, -11.28% from previous year)
- 2012: $831,339 (-$66,844, -7.44% from previous year)
- 2013: $895,728 (+$64,389, +7.75% from previous year)
- 2014: $981,062 (+$85,334, +9.53% from previous year)
- 2015: $1,038,887 (+$57,825, +5.89% from previous year)
- 2016: $1,118,618 (+$79,730, +7.67% from previous year)
- 2017: $1,190,063 (+$71,446, +6.39% from previous year)
- 2018: $1,346,186 (+$156,123, +13.12% from previous year)
- 2019: $1,458,621 (+$112,435, +8.35% from previous year)
- 2020: N/A
- 2021: $1,744,828
- 2022: $2,335,054 (+$590,226, +33.83% from previous year)
- 2023: $2,138,342 (-$196,712, -8.42% from previous year)
- 2024: $2,304,943 (+$166,601, +7.79% from previous year)
- 2025: $2,462,341 (+$157,398, +6.83% from previous year)
Woodway – Secluded, Affluent, and Pricey

Tucked near Edmonds in Snohomish County, Woodway has long been a quiet enclave for the wealthy. Home prices have increased 274% since 2012, hitting $2.46 million in 2025. The city’s surge in 2022 was particularly notable, jumping over 33% in just one year.
With no commercial districts and a heavily wooded environment, Woodway feels like a rural retreat despite being minutes from Seattle suburbs. The area’s large estates, strict zoning, and proximity to the waterfront continue to drive high values in this tiny, exclusive city.
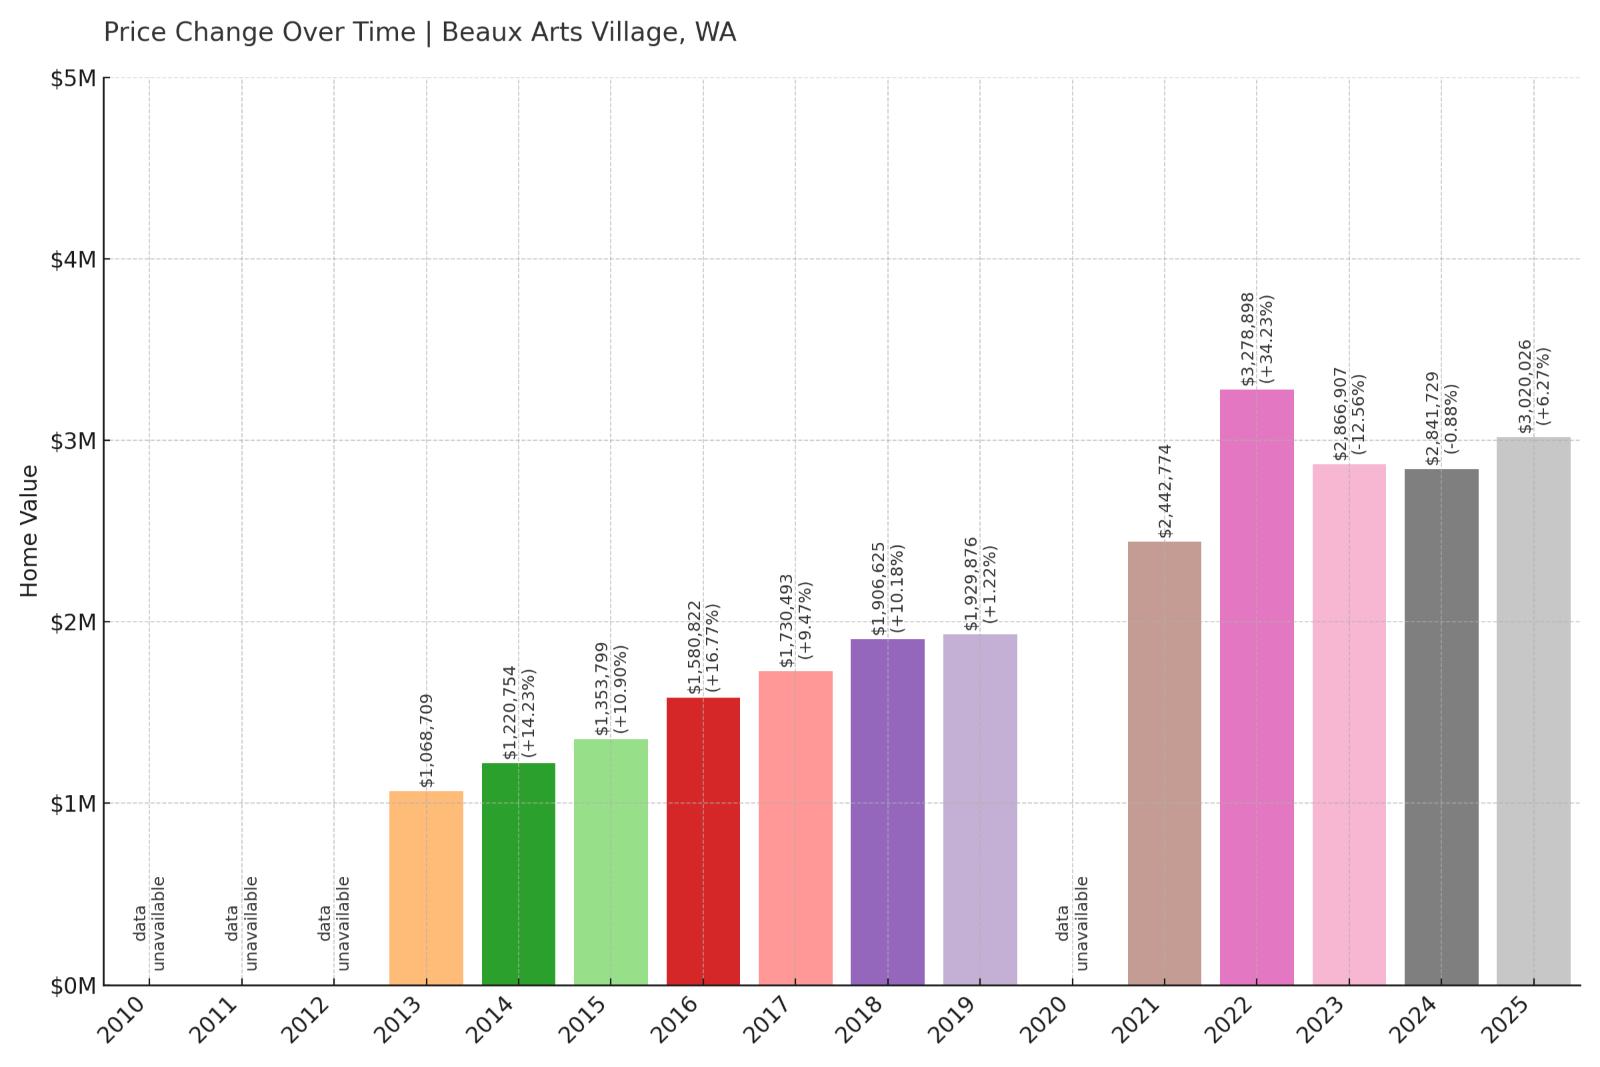
5. Beaux Arts Village – 182% Home Price Increase Since 2013
🔥 Would you like to save this?
- 2010: N/A
- 2011: N/A
- 2012: N/A
- 2013: $1,068,709
- 2014: $1,220,754 (+$152,045, +14.23% from previous year)
- 2015: $1,353,799 (+$133,045, +10.90% from previous year)
- 2016: $1,580,822 (+$227,023, +16.77% from previous year)
- 2017: $1,730,493 (+$149,671, +9.47% from previous year)
- 2018: $1,906,625 (+$176,132, +10.18% from previous year)
- 2019: $1,929,876 (+$23,252, +1.22% from previous year)
- 2020: N/A
- 2021: $2,442,774
- 2022: $3,278,898 (+$836,124, +34.23% from previous year)
- 2023: $2,866,907 (-$411,991, -12.56% from previous year)
- 2024: $2,841,729 (-$25,179, -0.88% from previous year)
- 2025: $3,020,026 (+$178,297, +6.27% from previous year)
Beaux Arts Village – Elite Hamlet With a Waterfront Premium

With fewer than 400 residents, Beaux Arts Village is one of Washington’s smallest towns—and one of its most expensive. Since 2013, home values have risen 182%, reaching just over $3 million in 2025. Its biggest surge came in 2022, during the height of demand for waterfront luxury homes.
Nestled along Lake Washington south of Bellevue, Beaux Arts Village offers private beach access, tight-knit community life, and almost no commercial activity. The exclusivity, limited housing stock, and picturesque location continue to make it a highly desirable (and costly) place to live.
4. Clyde Hill – 241% Home Price Increase Since 2012

- 2010: $1,449,392
- 2011: $1,355,494 (-$93,898, -6.48% from previous year)
- 2012: $1,265,915 (-$89,579, -6.61% from previous year)
- 2013: $1,412,441 (+$146,527, +11.57% from previous year)
- 2014: $1,699,174 (+$286,733, +20.30% from previous year)
- 2015: $1,939,017 (+$239,843, +14.12% from previous year)
- 2016: $2,176,510 (+$237,492, +12.25% from previous year)
- 2017: $2,352,722 (+$176,213, +8.10% from previous year)
- 2018: $2,664,409 (+$311,686, +13.25% from previous year)
- 2019: $2,802,845 (+$138,436, +5.20% from previous year)
- 2020: N/A
- 2021: $3,293,950
- 2022: $4,573,083 (+$1,279,132, +38.83% from previous year)
- 2023: $3,973,412 (-$599,671, -13.11% from previous year)
- 2024: $4,013,985 (+$40,574, +1.02% from previous year)
- 2025: $4,314,268 (+$300,282, +7.48% from previous year)
Clyde Hill – Prestige and Price on the Eastside

Clyde Hill has seen home values skyrocket 241% since 2012, reaching a median of over $4.3 million in 2025. This wealthy enclave near downtown Bellevue experienced its largest gain in 2022, with a nearly 39% jump during a surge in luxury real estate demand. Despite a dip in 2023, prices have climbed steadily since.
Known for its stunning views of Lake Washington and the Olympic Mountains, Clyde Hill offers privacy, spacious lots, and top-tier schools. With proximity to high-paying tech jobs and a reputation for exclusivity, it remains one of Washington’s most coveted (and costly) addresses.
3. Yarrow Point – 216% Home Price Increase Since 2012

- 2010: $1,677,120
- 2011: $1,559,574 (-$117,547, -7.01% from previous year)
- 2012: $1,434,531 (-$125,043, -8.02% from previous year)
- 2013: $1,561,875 (+$127,344, +8.88% from previous year)
- 2014: $1,868,093 (+$306,217, +19.61% from previous year)
- 2015: $2,153,697 (+$285,604, +15.29% from previous year)
- 2016: $2,331,450 (+$177,754, +8.25% from previous year)
- 2017: $2,495,888 (+$164,438, +7.05% from previous year)
- 2018: $2,793,404 (+$297,515, +11.92% from previous year)
- 2019: $2,956,244 (+$162,841, +5.83% from previous year)
- 2020: N/A
- 2021: $3,613,770
- 2022: $4,816,038 (+$1,202,268, +33.27% from previous year)
- 2023: $4,234,750 (-$581,289, -12.07% from previous year)
- 2024: $4,264,208 (+$29,458, +0.70% from previous year)
- 2025: $4,527,877 (+$263,669, +6.18% from previous year)
Yarrow Point – Ultra-Luxury on a Peninsula

Tucked on a peninsula jutting into Lake Washington, Yarrow Point has long been a magnet for multi-million-dollar estates. Home values have jumped 216% since 2012, hitting $4.53 million in 2025. The town saw explosive growth in 2022, gaining more than $1.2 million in median value in just one year.
Yarrow Point offers an extremely limited housing stock, abundant waterfront lots, and an atmosphere of privacy. Located near Clyde Hill and Medina, it’s one of the most exclusive addresses in the Seattle metro area. Tight supply and elite appeal continue to push prices upward, even in cooler markets.
2. Medina – 228% Home Price Increase Since 2012
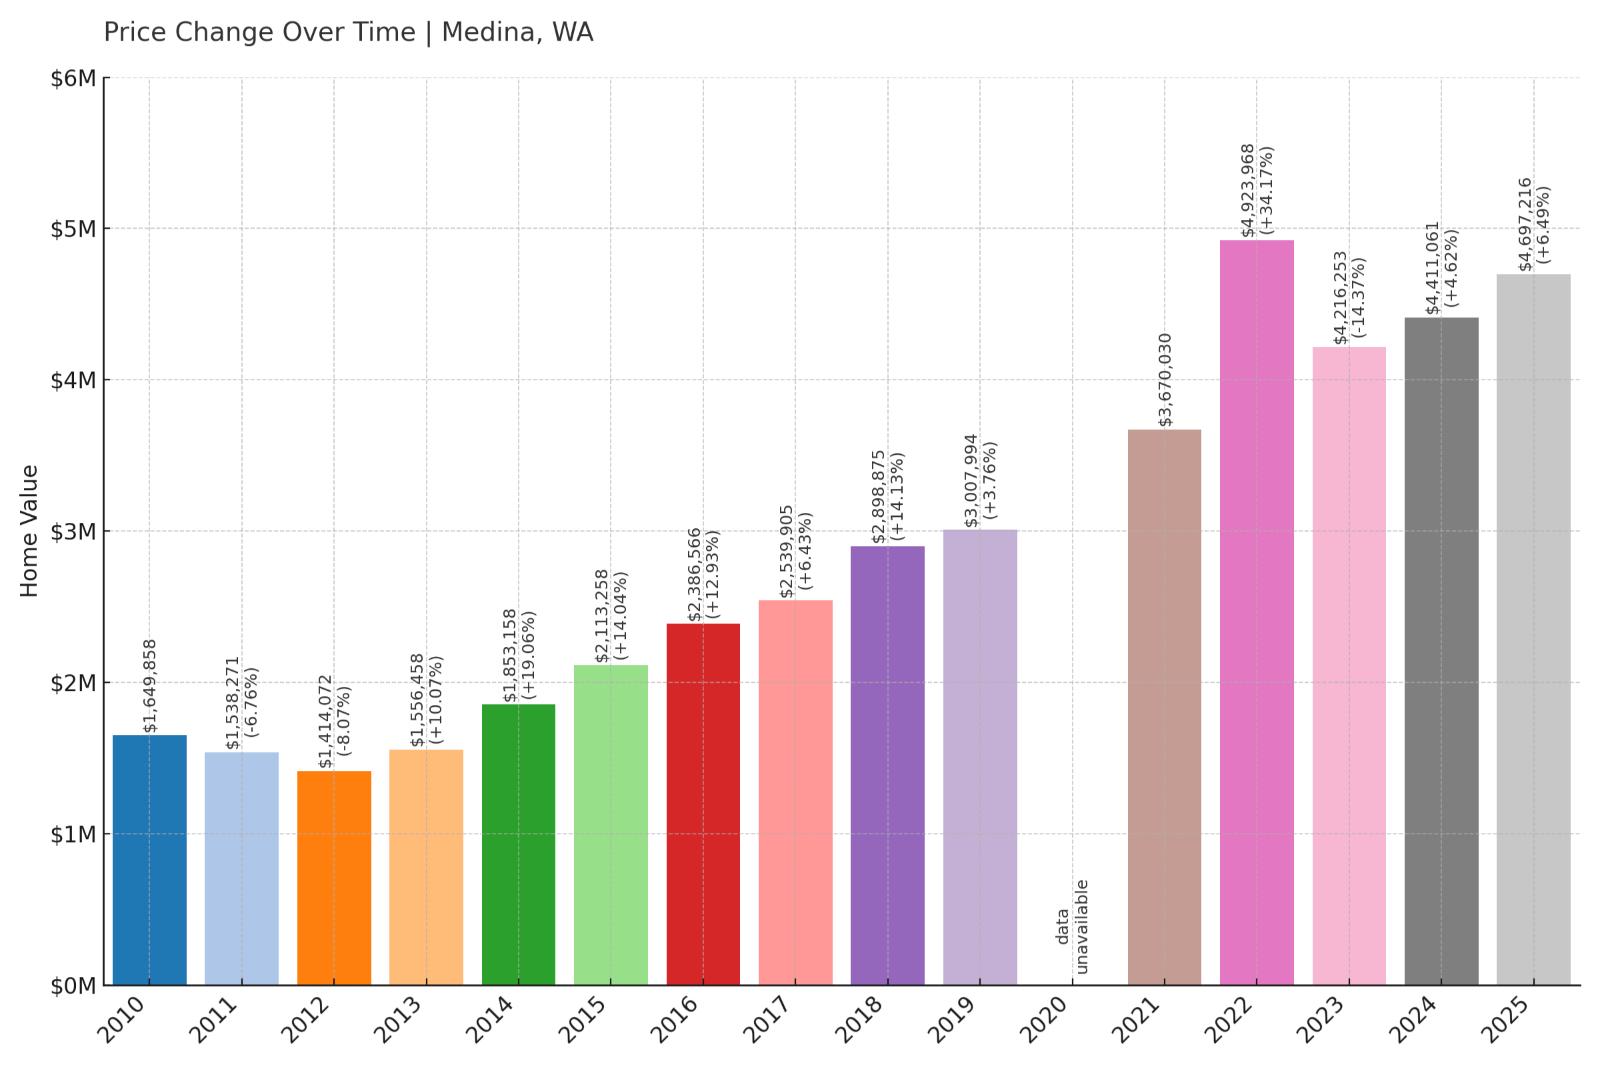
- 2010: $1,649,858
- 2011: $1,538,271 (-$111,586, -6.76% from previous year)
- 2012: $1,414,072 (-$124,200, -8.07% from previous year)
- 2013: $1,556,458 (+$142,387, +10.07% from previous year)
- 2014: $1,853,158 (+$296,700, +19.06% from previous year)
- 2015: $2,113,258 (+$260,100, +14.04% from previous year)
- 2016: $2,386,566 (+$273,309, +12.93% from previous year)
- 2017: $2,539,905 (+$153,338, +6.43% from previous year)
- 2018: $2,898,875 (+$358,970, +14.13% from previous year)
- 2019: $3,007,994 (+$109,120, +3.76% from previous year)
- 2020: N/A
- 2021: $3,670,030
- 2022: $4,923,968 (+$1,253,938, +34.17% from previous year)
- 2023: $4,216,253 (-$707,715, -14.37% from previous year)
- 2024: $4,411,061 (+$194,808, +4.62% from previous year)
- 2025: $4,697,216 (+$286,155, +6.49% from previous year)
Medina – Bill Gates’s Neighborhood and Home to Billionaires

With a 228% price increase since 2012, Medina’s median home value now stands at nearly $4.7 million. This waterfront community is world-renowned as the longtime home of Bill Gates and a number of other ultra-wealthy residents. In 2022 alone, home prices rose over $1.25 million.
Located just west of Bellevue and across the water from Seattle, Medina is known for its security, exclusivity, and pristine real estate. Gated mansions, lake access, and heavily restricted development help preserve its elite status—and keep prices among the highest in the state.
1. Hunts Point – 174% Home Price Increase Since 2013

- 2010: N/A
- 2011: N/A
- 2012: N/A
- 2013: $2,998,591
- 2014: $3,428,137 (+$429,547, +14.32% from previous year)
- 2015: $3,850,717 (+$422,580, +12.33% from previous year)
- 2016: $4,313,445 (+$462,729, +12.02% from previous year)
- 2017: $4,583,165 (+$269,720, +6.25% from previous year)
- 2018: $5,067,584 (+$484,418, +10.57% from previous year)
- 2019: $5,421,333 (+$353,749, +6.98% from previous year)
- 2020: N/A
- 2021: $6,539,612
- 2022: $9,197,029 (+$2,657,417, +40.64% from previous year)
- 2023: $8,041,126 (-$1,155,903, -12.57% from previous year)
- 2024: $7,990,916 (-$50,210, -0.62% from previous year)
- 2025: $8,209,483 (+$218,567, +2.74% from previous year)
Hunts Point – Washington’s Most Expensive Town

🔥 Would you like to save this?
Hunts Point tops the list as the most expensive town in Washington, with a 2025 median home value of $8.2 million. Since 2013, prices have risen 174%, with a staggering $2.65 million increase occurring in just one year—2022. Despite a brief cooling period, prices have rebounded, holding steady near record highs.
This ultra-private community sits on a peninsula in Lake Washington, just north of Medina. With just a few dozen homes and no commercial development, it offers unparalleled privacy. Homes here often feature expansive waterfront lots, private docks, and resort-like amenities, reflecting its status as the pinnacle of Washington luxury living.


