
🔥 Would you like to save this?
Utah’s real estate market has seen extraordinary growth over the past decade, with luxury towns and scenic communities climbing to the top of the price charts. Using the Zillow Home Value Index as our data source, we’ve ranked the 18 most expensive towns in the state as of 2025. These rankings are based on a combination of long-term value growth, recent trends, and overall home value — not just spikes or dips.
Whether you’re curious about where property prices are peaking or just want to see how your favorite towns stack up, this list offers a data-backed look at Utah’s priciest places to buy a home. From alpine retreats to upscale suburbs, each entry offers something unique — and a price tag to match.
In order to come up with the very specific design ideas, we create most designs with the assistance of state-of-the-art AI interior design software. Also, assume links that take you off the site are affiliate links such as links to Amazon. this means we may earn a commission if you buy something.
Below, you’ll find detailed price histories, growth trends, and local features for each town — listed in ascending order, with the most expensive town coming in at number 1.
18. Draper – 139% Home Price Increase Since 2012

- 2010: $339,375
- 2011: $316,423 (-$22,951, -6.76% from previous year)
- 2012: $312,629 (-$3,795, -1.20% from previous year)
- 2013: $347,237 (+$34,608, +11.07% from previous year)
- 2014: $381,349 (+$34,113, +9.82% from previous year)
- 2015: $392,734 (+$11,385, +2.99% from previous year)
- 2016: $425,785 (+$33,051, +8.42% from previous year)
- 2017: $450,323 (+$24,539, +5.76% from previous year)
- 2018: $487,652 (+$37,329, +8.29% from previous year)
- 2019: $520,055 (+$32,403, +6.64% from previous year)
- 2020: N/A
- 2021: $655,987
- 2022: $821,997 (+$166,010, +25.31% from previous year)
- 2023: $780,145 (-$41,852, -5.09% from previous year)
- 2024: $790,819 (+$10,673, +1.37% from previous year)
- 2025: $812,181 (+$21,362, +2.70% from previous year)
Draper has seen a significant home price increase of 139% since 2012, driven by steady year-over-year gains and punctuated by a major spike in 2022. While 2023 brought a slight dip, values have rebounded modestly since. The town’s proximity to Salt Lake City and access to major highways contribute to its sustained housing demand.
Draper – Fast Growth on the Wasatch Front
Located on the southern edge of Salt Lake County, Draper has become one of Utah’s most sought-after suburbs thanks to its high-performing schools, tech employment opportunities, and access to outdoor recreation like Corner Canyon. Draper’s rapid appreciation in home values reflects not just demand, but substantial investment in infrastructure and quality of life.
The 2022 jump of more than 25% pushed Draper well into the upper tier of Utah real estate, and prices have held firm despite broader economic shifts. The town blends upscale living with natural amenities, helping it maintain strong buyer interest even during fluctuating market conditions.
17. Holladay – 145% Home Price Increase Since 2012

- 2010: $327,402
- 2011: $301,585 (-$25,816, -7.89% from previous year)
- 2012: $298,838 (-$2,748, -0.91% from previous year)
- 2013: $339,501 (+$40,663, +13.61% from previous year)
- 2014: $372,883 (+$33,382, +9.83% from previous year)
- 2015: $378,621 (+$5,738, +1.54% from previous year)
- 2016: $411,269 (+$32,648, +8.62% from previous year)
- 2017: $443,589 (+$32,320, +7.86% from previous year)
- 2018: $491,926 (+$48,337, +10.90% from previous year)
- 2019: $530,139 (+$38,213, +7.77% from previous year)
- 2020: N/A
- 2021: $683,815
- 2022: $823,946 (+$140,131, +20.49% from previous year)
- 2023: $778,559 (-$45,388, -5.51% from previous year)
- 2024: $796,625 (+$18,066, +2.32% from previous year)
- 2025: $817,449 (+$20,824, +2.61% from previous year)
Holladay has seen a home price increase of 145% since 2012, buoyed by consistent annual growth and an especially sharp rise in 2022. While 2023 saw a modest correction, 2024 and 2025 figures show the market stabilizing and returning to its upward trend.
Holladay – Desirability Meets Stability

Holladay sits in east-central Salt Lake County and is one of Utah’s oldest and most established communities. Its tree-lined streets, mountain views, and excellent schools have made it a long-standing favorite for homebuyers looking for a blend of suburban peace and urban access.
Recent value growth reflects both renovation of older homes and demand for its walkable neighborhoods. Its proximity to ski resorts and downtown Salt Lake City keeps it attractive year-round, making Holladay a premium location with lasting appeal.
16. Genola – 223% Home Price Increase Since 2012

- 2010: N/A
- 2011: N/A
- 2012: $253,882
- 2013: $294,246 (+$40,364, +15.90% from previous year)
- 2014: $317,701 (+$23,455, +7.97% from previous year)
- 2015: $344,708 (+$27,007, +8.50% from previous year)
- 2016: $388,540 (+$43,832, +12.72% from previous year)
- 2017: $424,054 (+$35,514, +9.14% from previous year)
- 2018: $466,720 (+$42,666, +10.06% from previous year)
- 2019: $514,939 (+$48,219, +10.33% from previous year)
- 2020: N/A
- 2021: $665,249
- 2022: $799,063 (+$133,814, +20.11% from previous year)
- 2023: $773,739 (-$25,324, -3.17% from previous year)
- 2024: $775,719 (+$1,980, +0.26% from previous year)
- 2025: $820,658 (+$44,938, +5.79% from previous year)
Genola has experienced a staggering 223% increase in home values since 2012. The town has consistently posted double-digit gains through much of the 2010s, reflecting rising interest in rural and semi-rural living spaces within reach of Utah County’s tech corridor.
Genola – Rural Charm, Big Gains

Joe Tordiff, CC BY-SA 2.0 , via Wikimedia Commons
Genola, located in southern Utah County, offers larger lot sizes and open space that have become increasingly attractive. While historically agricultural, the town has seen more residential development in recent years. Buyers seeking affordability and privacy have flocked here, driving prices up steadily.
Home values topped $820,000 in 2025, a remarkable leap from under $300,000 just a decade ago. With proximity to Spanish Fork and Payson, Genola’s appeal lies in its blend of rural living with convenient access to services and jobs.
15. Heber City – 222% Home Price Increase Since 2012
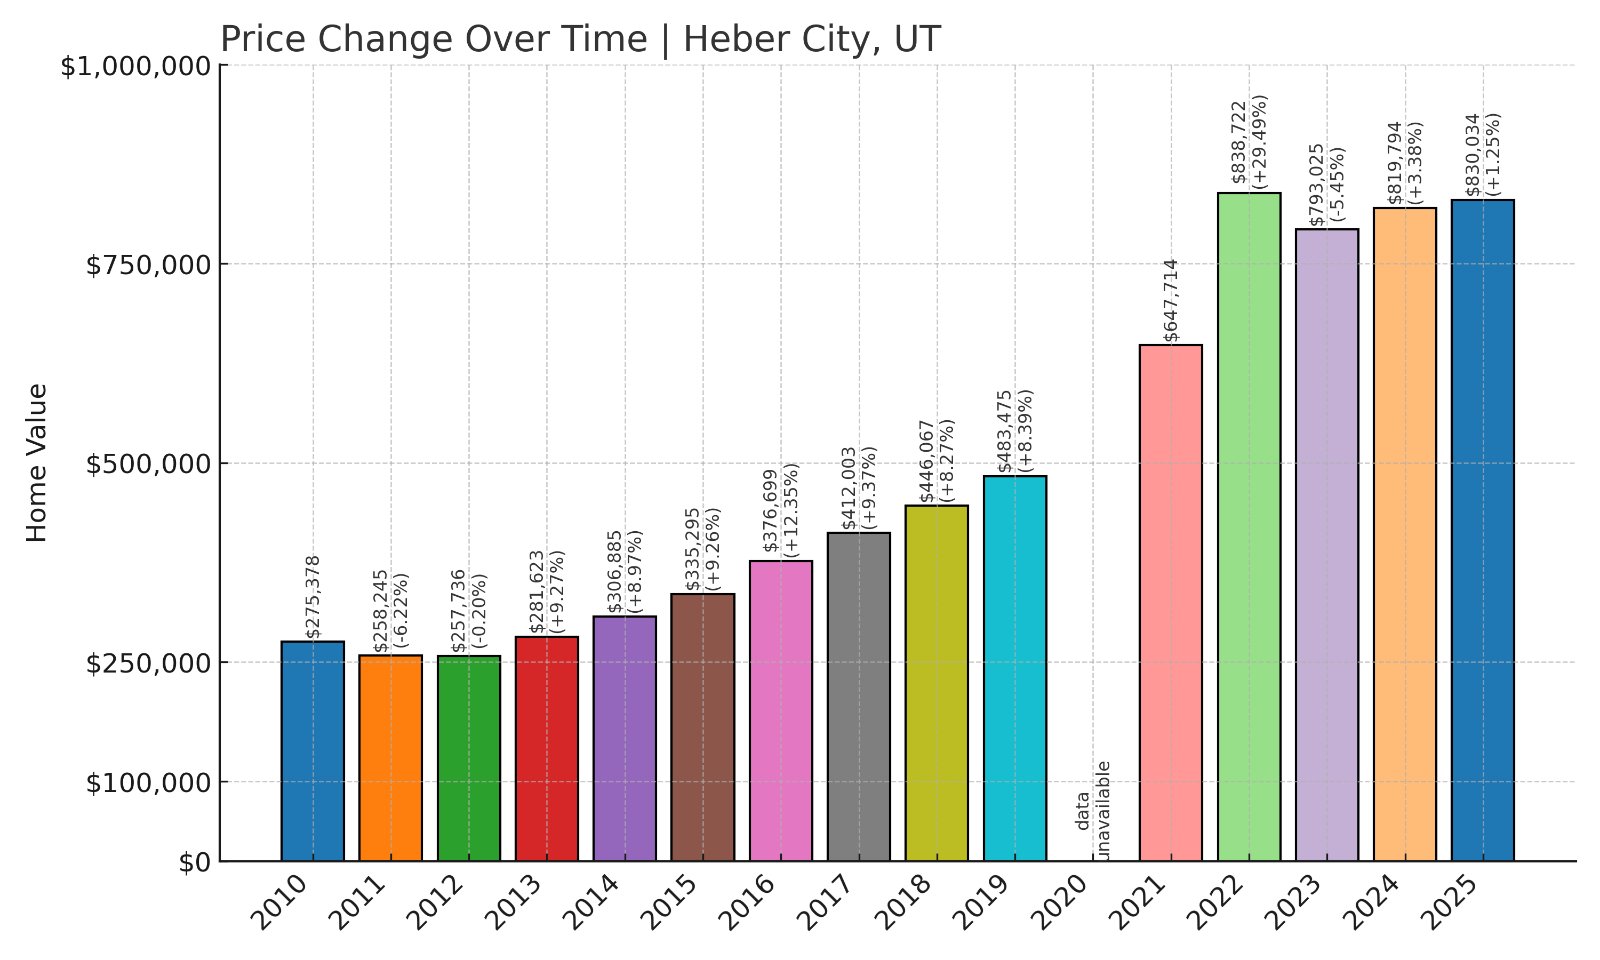
- 2010: $275,378
- 2011: $258,245 (-$17,133, -6.22% from previous year)
- 2012: $257,736 (-$509, -0.20% from previous year)
- 2013: $281,623 (+$23,887, +9.27% from previous year)
- 2014: $306,885 (+$25,262, +8.97% from previous year)
- 2015: $335,295 (+$28,410, +9.26% from previous year)
- 2016: $376,699 (+$41,404, +12.35% from previous year)
- 2017: $412,003 (+$35,304, +9.37% from previous year)
- 2018: $446,067 (+$34,064, +8.27% from previous year)
- 2019: $483,475 (+$37,408, +8.39% from previous year)
- 2020: N/A
- 2021: $647,714
- 2022: $838,722 (+$191,008, +29.49% from previous year)
- 2023: $793,025 (-$45,696, -5.45% from previous year)
- 2024: $819,794 (+$26,769, +3.38% from previous year)
- 2025: $830,034 (+$10,240, +1.25% from previous year)
Heber City’s home prices have climbed 222% since 2012, reflecting strong demand in this scenic mountain town. Major appreciation took place from 2021 to 2022, when prices jumped nearly 30% in a single year. Though prices dipped slightly in 2023, they have resumed a steady upward climb.
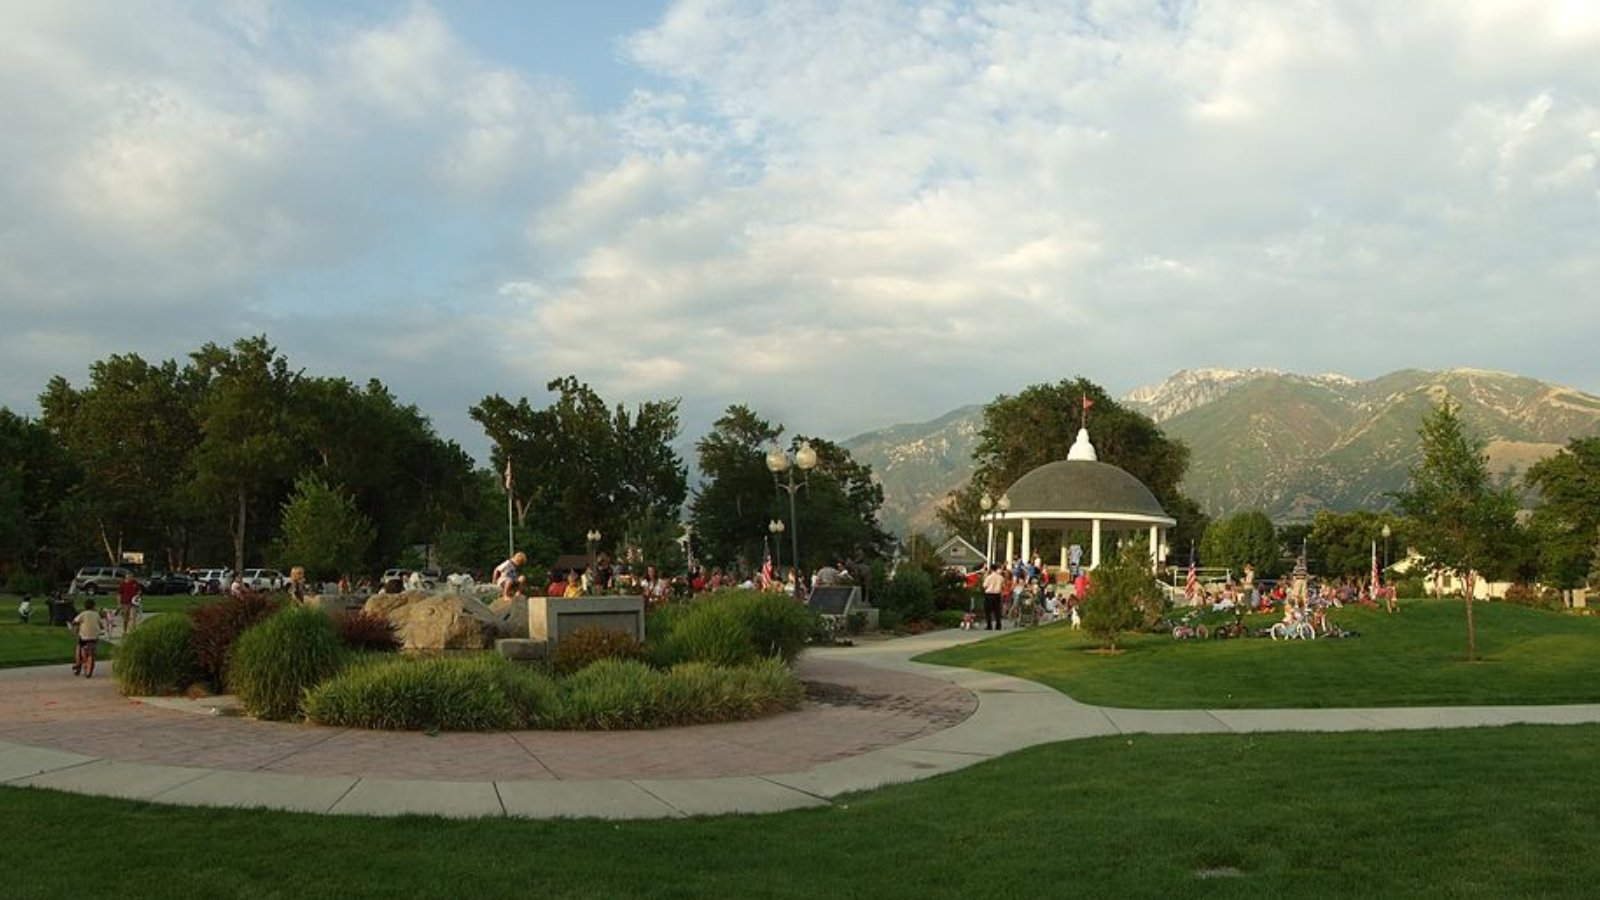
Heber City – A Scenic Destination with Soaring Values

Annzimmerman, CC BY-SA 3.0 , via Wikimedia Commons
Located in Wasatch County, Heber City sits just a short drive from Park City and offers mountain views, historic charm, and quick access to outdoor recreation. Its growth has been fueled by tourism and second-home buyers as much as primary residents relocating from Salt Lake and Utah counties.
The dramatic post-2020 spike in prices reflects the town’s growing desirability as a year-round destination. With access to Jordanelle Reservoir and Deer Valley, Heber City combines small-town living with luxury amenities, making it a prime area for high-value homes.
14. Wallsburg – 71% Home Price Increase Since 2019

- 2010: N/A
- 2011: N/A
- 2012: N/A
- 2013: N/A
- 2014: N/A
- 2015: N/A
- 2016: N/A
- 2017: N/A
- 2018: N/A
- 2019: $529,172
- 2020: N/A
- 2021: $731,782
- 2022: $928,437 (+$196,654, +26.87% from previous year)
- 2023: $876,912 (-$51,525, -5.55% from previous year)
- 2024: $918,886 (+$41,974, +4.79% from previous year)
- 2025: $905,113 (-$13,773, -1.50% from previous year)
Wallsburg has seen a 71% increase in home prices since 2019. Although 2023 and 2025 saw modest price declines, the town’s median home values remain near the $900,000 mark — a substantial rise from half that just a few years ago.
Wallsburg – High Values in a Hidden Valley

Wallsburg, nestled in the Wasatch Mountains, is one of the most remote towns on this list — and one of the most peaceful. Known for ranch land, open skies, and quiet surroundings, it appeals to buyers seeking space and solitude.
The town’s limited inventory and scenic location have made it attractive for buyers looking for privacy and luxury, often for second homes or long-term investments. While data is limited, the surge from 2019 to 2022 reflects rising interest in rural luxury living.
13. Daniel – $930,499 Median Price in 2025

- 2010: N/A
- 2011: N/A
- 2012: N/A
- 2013: N/A
- 2014: N/A
- 2015: N/A
- 2016: N/A
- 2017: N/A
- 2018: N/A
- 2019: N/A
- 2020: N/A
- 2021: N/A
- 2022: N/A
- 2023: N/A
- 2024: $932,013
- 2025: $930,499 (-$1,514, -0.16% from previous year)
Daniel entered the available home price dataset in 2024 with a median home value just over $932,000. A minor dip of 0.16% in 2025 brought it to $930,499, but it remains one of the most expensive towns in Utah despite the limited historical data.
Daniel – Quiet Luxury in the Heber Valley

Daniel is a small incorporated town located near Heber City in Wasatch County. Though lesser known, it’s an area of quiet affluence where large parcels and upscale homes have kept property values high. Its location in the Heber Valley offers mountain views, open land, and a low-density layout that appeals to high-end buyers.
Given its recent appearance in public data and already high home values, Daniel reflects an emerging pattern in Utah where affluent communities form on the periphery of more developed towns. Buyers here often seek rural luxury with easy access to ski resorts and recreation.
12. Woodland Hills – 185% Home Price Increase Since 2012

🔥 Would you like to save this?
- 2010: $350,992
- 2011: $336,791 (-$14,200, -4.05% from previous year)
- 2012: $327,467 (-$9,324, -2.77% from previous year)
- 2013: $366,494 (+$39,027, +11.92% from previous year)
- 2014: $401,930 (+$35,436, +9.67% from previous year)
- 2015: $417,487 (+$15,557, +3.87% from previous year)
- 2016: $460,325 (+$42,837, +10.26% from previous year)
- 2017: $480,213 (+$19,889, +4.32% from previous year)
- 2018: $515,772 (+$35,558, +7.40% from previous year)
- 2019: $553,952 (+$38,180, +7.40% from previous year)
- 2020: N/A
- 2021: $733,281
- 2022: $939,714 (+$206,433, +28.15% from previous year)
- 2023: $885,595 (-$54,119, -5.76% from previous year)
- 2024: $907,733 (+$22,138, +2.50% from previous year)
- 2025: $933,902 (+$26,168, +2.88% from previous year)
Woodland Hills home values have jumped by 185% since 2012, reaching $933,902 in 2025. A sharp increase in 2022 helped push the town into Utah’s top tier for housing prices. Despite a small dip in 2023, home values have resumed a slow upward climb.
Woodland Hills – A Forested, Affluent Enclave
Nestled in the foothills southeast of Spanish Fork, Woodland Hills is known for its panoramic views, custom homes, and wooded lots. The town offers a quiet, semi-rural lifestyle with upscale housing options that have gained popularity in recent years.
The dramatic leap in home prices in 2022 likely reflects a surge in buyer demand for space, privacy, and natural beauty. As working from home became more common, towns like Woodland Hills, with ample land and scenic surroundings, saw strong real estate interest.
11. Highland – 184% Home Price Increase Since 2012

- 2010: $359,820
- 2011: $334,896 (-$24,924, -6.93% from previous year)
- 2012: $343,688 (+$8,793, +2.63% from previous year)
- 2013: $379,762 (+$36,074, +10.50% from previous year)
- 2014: $418,281 (+$38,520, +10.14% from previous year)
- 2015: $437,292 (+$19,011, +4.54% from previous year)
- 2016: $469,270 (+$31,978, +7.31% from previous year)
- 2017: $495,737 (+$26,468, +5.64% from previous year)
- 2018: $531,625 (+$35,888, +7.24% from previous year)
- 2019: $581,439 (+$49,813, +9.37% from previous year)
- 2020: N/A
- 2021: $742,903
- 2022: $948,324 (+$205,421, +27.65% from previous year)
- 2023: $894,553 (-$53,771, -5.67% from previous year)
- 2024: $917,483 (+$22,930, +2.56% from previous year)
- 2025: $975,427 (+$57,944, +6.32% from previous year)
Highland’s home values have grown by 184% since 2012, reflecting steady demand over the years and a breakout gain in 2022. After a short correction in 2023, the market rebounded with strong growth in both 2024 and 2025.
Highland – Growth and Green Space in Utah County

Located north of American Fork in Utah County, Highland is known for its spacious homes and family-friendly environment. The area offers easy access to Provo, Lehi, and Salt Lake City, making it ideal for professionals working in the booming tech corridor known as Silicon Slopes.
Highland’s strong growth is tied to its high quality of life, good schools, and proximity to employment centers. The town’s development has been deliberate, maintaining large lot sizes and green space, which has helped keep demand high and values rising.
10. Midway – 221% Home Price Increase Since 2012
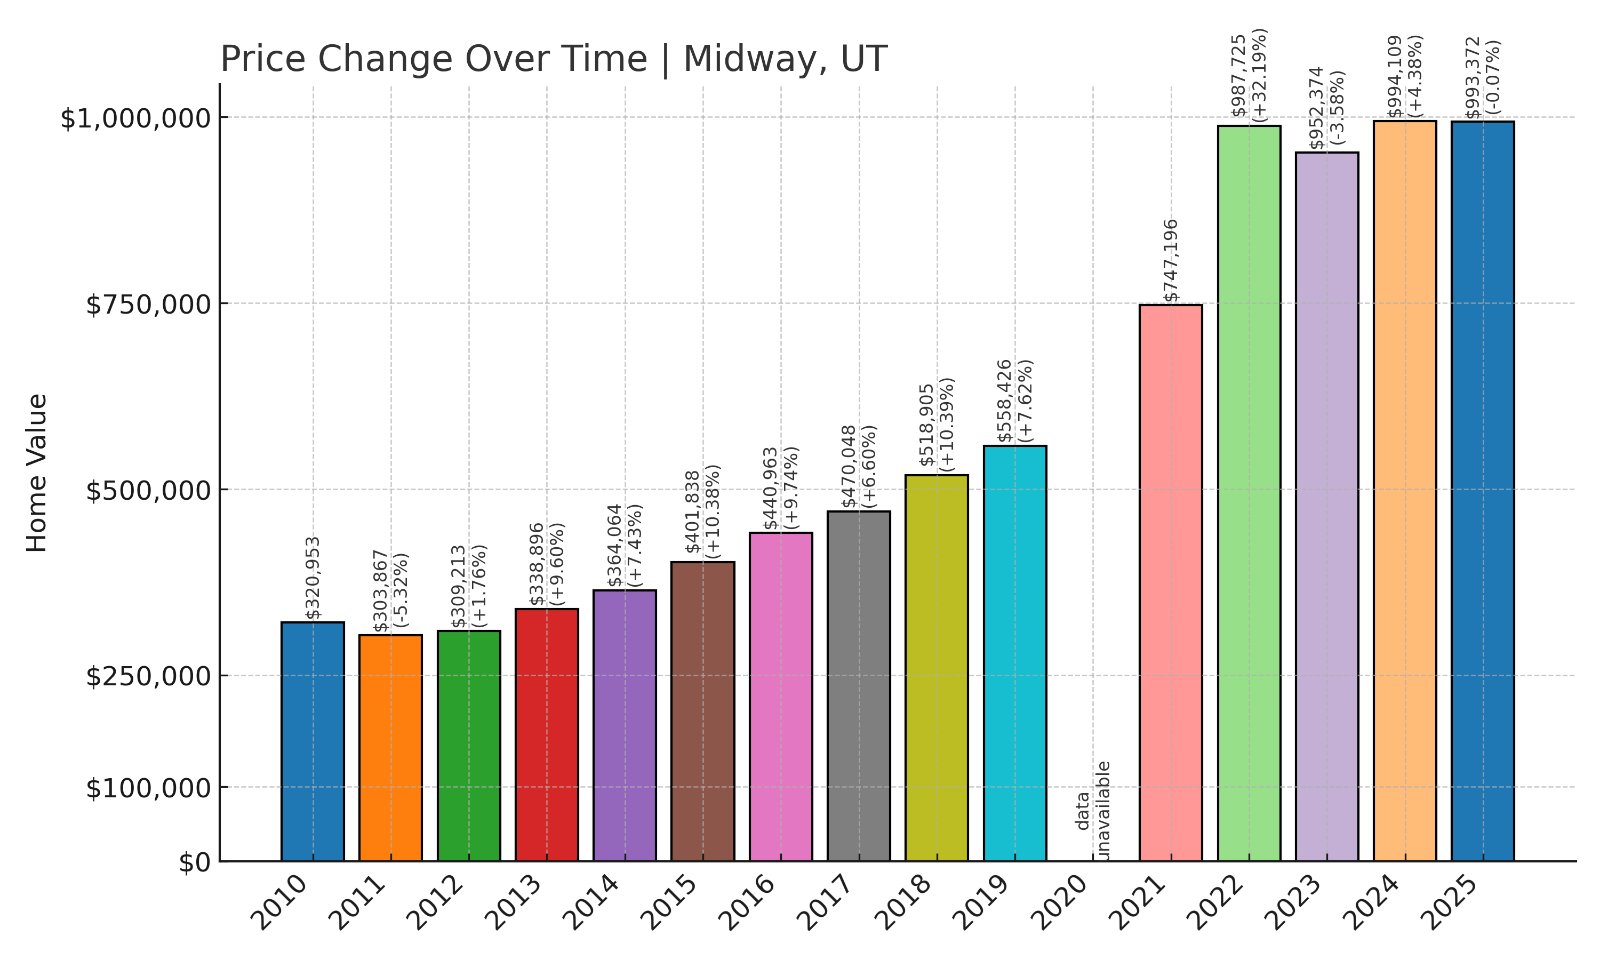
- 2010: $320,953
- 2011: $303,867 (-$17,086, -5.32% from previous year)
- 2012: $309,213 (+$5,347, +1.76% from previous year)
- 2013: $338,896 (+$29,683, +9.60% from previous year)
- 2014: $364,064 (+$25,168, +7.43% from previous year)
- 2015: $401,838 (+$37,774, +10.38% from previous year)
- 2016: $440,963 (+$39,125, +9.74% from previous year)
- 2017: $470,048 (+$29,084, +6.60% from previous year)
- 2018: $518,905 (+$48,857, +10.39% from previous year)
- 2019: $558,426 (+$39,521, +7.62% from previous year)
- 2020: N/A
- 2021: $747,196
- 2022: $987,725 (+$240,529, +32.19% from previous year)
- 2023: $952,374 (-$35,351, -3.58% from previous year)
- 2024: $994,109 (+$41,735, +4.38% from previous year)
- 2025: $993,372 (-$737, -0.07% from previous year)
Midway’s home values have risen 221% since 2012, with especially rapid gains from 2020 to 2022. Although prices saw a slight dip in 2023 and leveled off in 2025, the overall upward trajectory places Midway firmly in Utah’s top ten most expensive towns.
Midway – Swiss Heritage, Modern Appeal
Midway is located in the Heber Valley and is known for its Swiss-themed architecture, geothermal attractions like the Homestead Crater, and its close proximity to ski resorts and national parks. The area has long been a favorite for second homes and vacation properties, which has helped drive demand.
Its popularity surged in the post-pandemic real estate boom, with home prices climbing steeply. Today, Midway’s mix of culture, scenery, and accessibility to recreation keeps it competitive in Utah’s high-end market.
9. Peoa – $1,036,985 Median Price in 2025

- 2010: N/A
- 2011: N/A
- 2012: N/A
- 2013: N/A
- 2014: N/A
- 2015: N/A
- 2016: N/A
- 2017: N/A
- 2018: N/A
- 2019: N/A
- 2020: N/A
- 2021: N/A
- 2022: $1,013,252
- 2023: $977,775 (-$35,477, -3.50% from previous year)
- 2024: $1,008,093 (+$30,318, +3.10% from previous year)
- 2025: $1,036,985 (+$28,892, +2.87% from previous year)
Peoa broke into the seven-figure range with a median home price of $1,036,985 in 2025. Although historical data is limited, the available figures show mild fluctuations followed by consistent appreciation over the past two years.
Peoa – Rural Setting, Rising Prices

Peoa is a small, rural community east of Park City in Summit County. Known for wide-open spaces, horse properties, and its quiet setting along the Weber River, Peoa offers a distinctly different pace compared to more densely developed resort towns.
Its location near both Park City and Kamas gives residents access to world-class skiing and hiking while enjoying lower-density living. The area’s high property values reflect demand for land, seclusion, and mountain access within driving range of Salt Lake City.
8. Mount Olympus – 166% Home Price Increase Since 2012

- 2010: $413,813
- 2011: $403,383 (-$10,430, -2.52% from previous year)
- 2012: $403,646 (+$264, +0.07% from previous year)
- 2013: $444,069 (+$40,422, +10.01% from previous year)
- 2014: $486,341 (+$42,272, +9.52% from previous year)
- 2015: $504,919 (+$18,578, +3.82% from previous year)
- 2016: $537,961 (+$33,043, +6.54% from previous year)
- 2017: $567,525 (+$29,564, +5.50% from previous year)
- 2018: $626,648 (+$59,123, +10.42% from previous year)
- 2019: $676,991 (+$50,342, +8.03% from previous year)
- 2020: N/A
- 2021: $860,577
- 2022: $1,057,710 (+$197,133, +22.91% from previous year)
- 2023: $986,287 (-$71,423, -6.75% from previous year)
- 2024: $1,025,728 (+$39,440, +4.00% from previous year)
- 2025: $1,072,721 (+$46,993, +4.58% from previous year)
Mount Olympus homes have increased 166% in value since 2012, with a strong price surge from 2020 to 2022 pushing values over $1 million. Despite a dip in 2023, the market regained its momentum with steady growth into 2025.
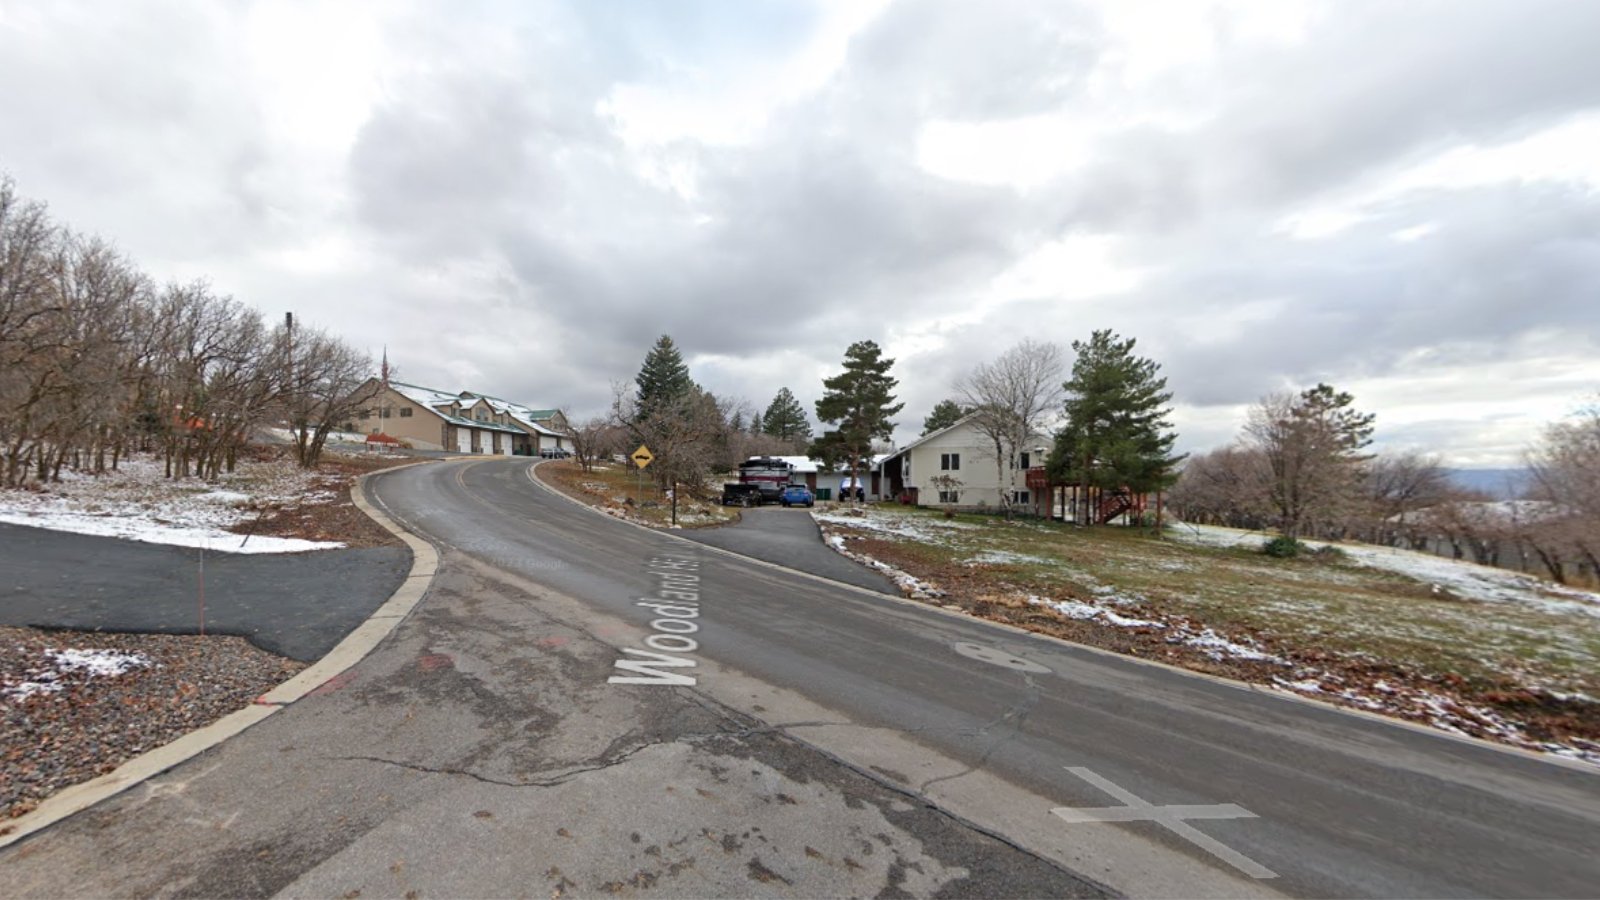
Mount Olympus – East Bench Luxury

Google Street View
Mount Olympus is a prominent East Bench neighborhood in the Salt Lake Valley, known for its stunning mountain views and proximity to Millcreek Canyon. It offers upscale living with quick access to trails, skiing, and downtown Salt Lake City.
This area has long been popular with professionals and retirees seeking a mix of natural beauty and urban convenience. The high home prices reflect both the desirability of its location and the quality of its custom-built homes, many with expansive lots and premium finishes.
7. Charleston – $1,086,866 Median Price in 2025

- 2010: N/A
- 2011: N/A
- 2012: N/A
- 2013: N/A
- 2014: N/A
- 2015: N/A
- 2016: N/A
- 2017: N/A
- 2018: N/A
- 2019: N/A
- 2020: N/A
- 2021: N/A
- 2022: N/A
- 2023: N/A
- 2024: $1,107,320
- 2025: $1,086,866 (-$20,454, -1.85% from previous year)
Charleston enters the list with a 2025 median home price of $1,086,866, despite only limited data being available. A slight decline from the previous year still places it comfortably among Utah’s most expensive towns.
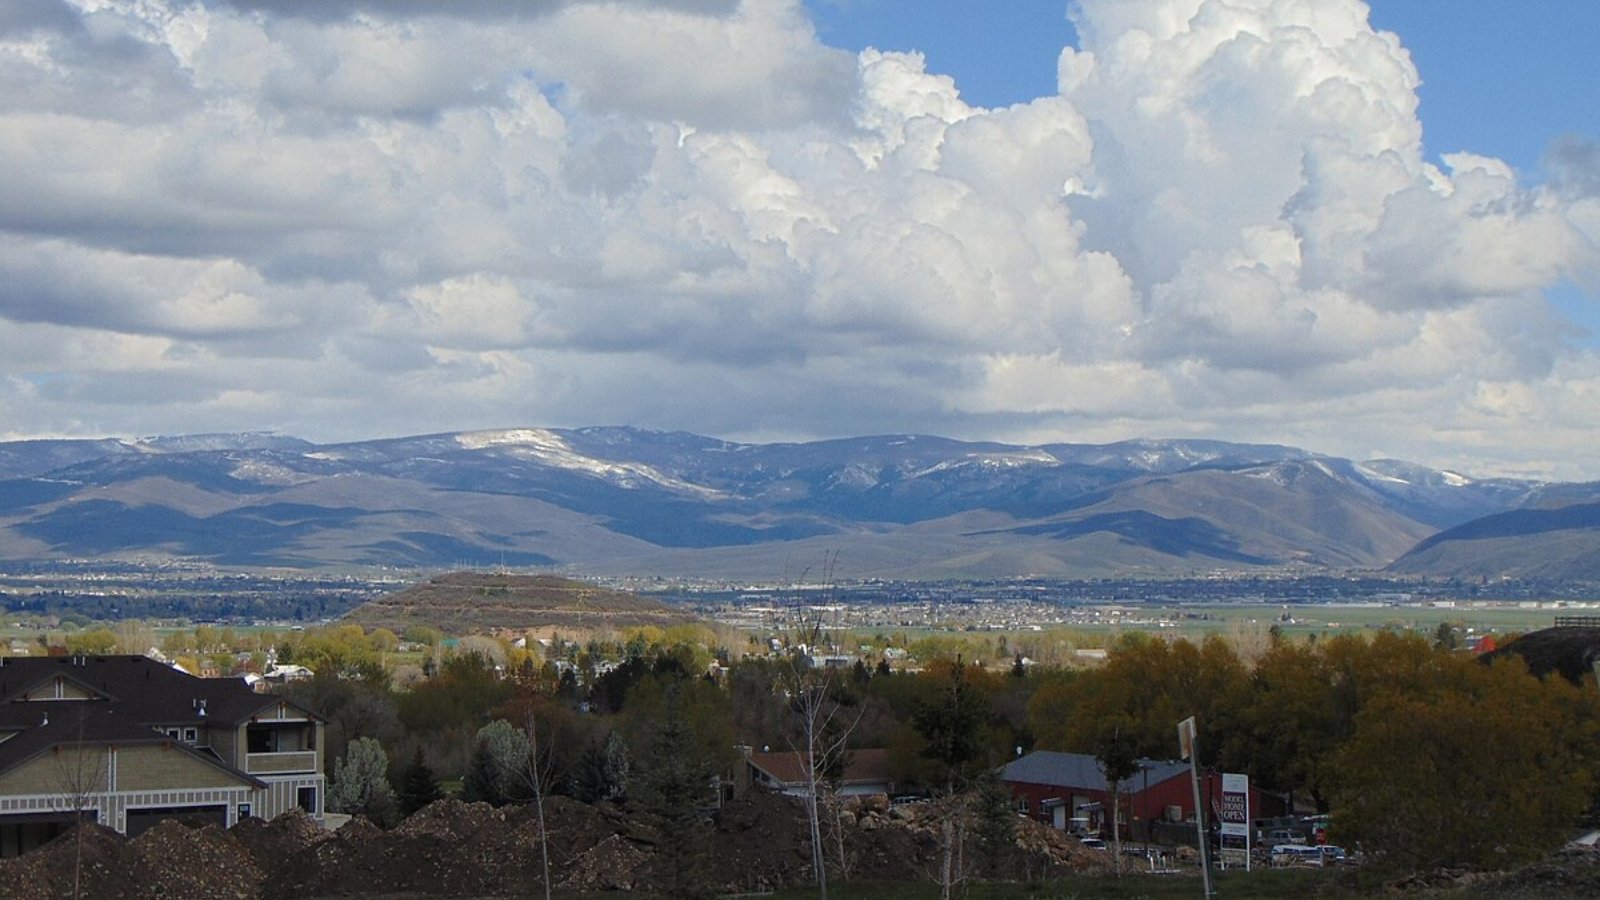
Charleston – Exclusive Appeal in the Heber Valley
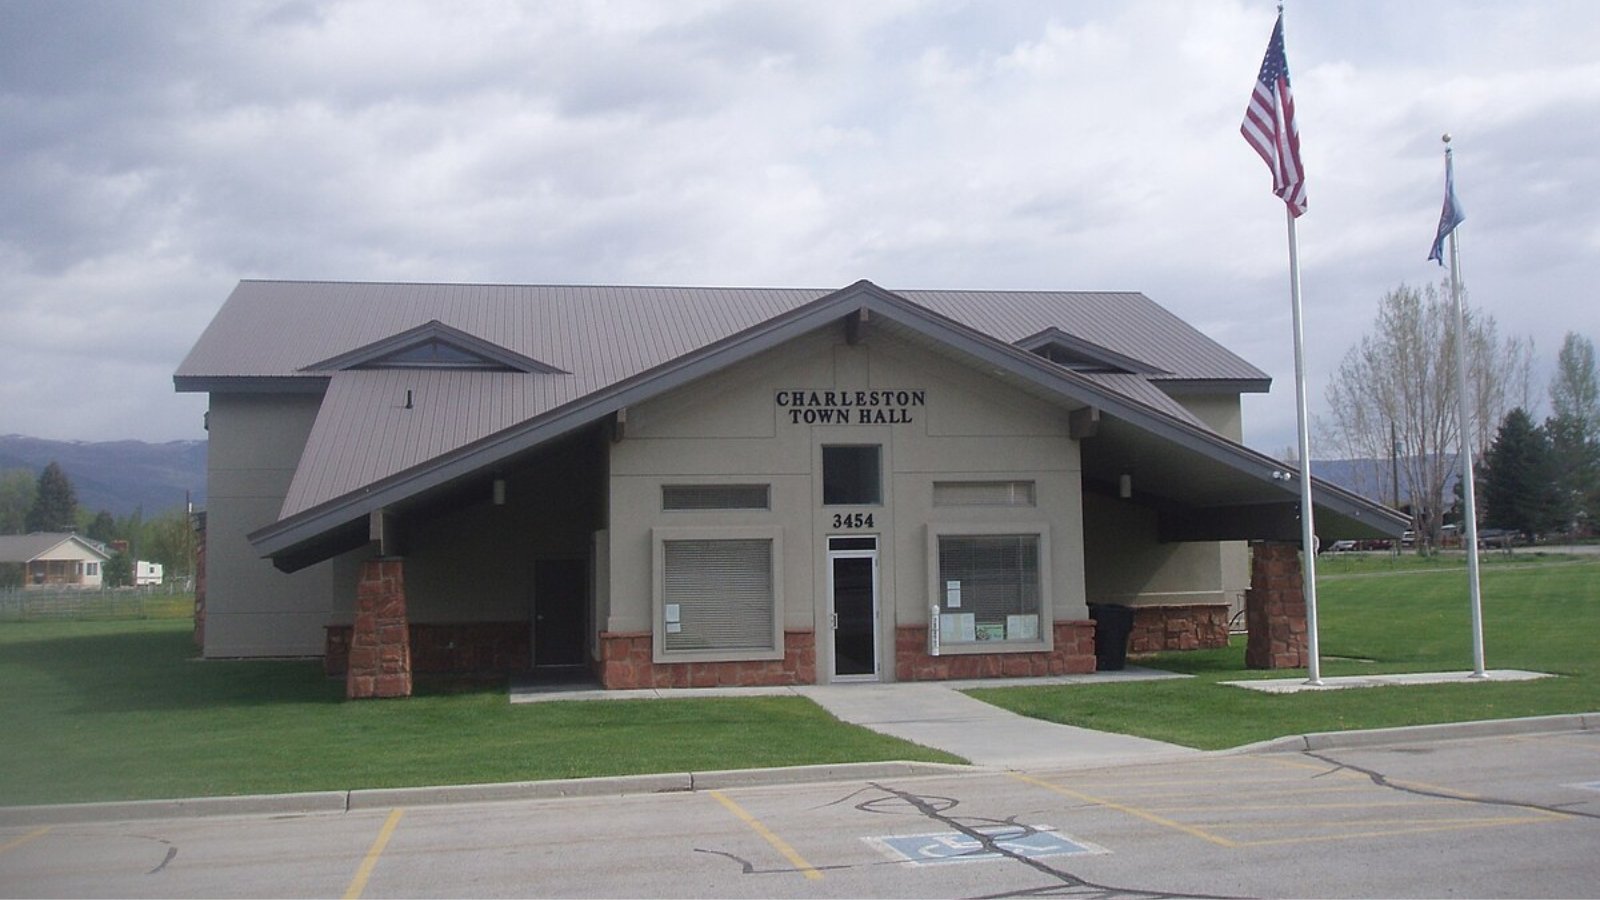
Ntsimp, Public domain, via Wikimedia Commons
Charleston is a quiet, rural community on the western edge of the Heber Valley near Deer Creek Reservoir. It is known for large estate-style homes, expansive farmland, and unobstructed mountain views, which together make it a prime destination for buyers seeking peace and privacy.
Though data is minimal, home prices well above $1 million signal an exclusive and established luxury market. The town’s low population and limited development have helped preserve its appeal as a secluded yet scenic location within reach of Park City and Provo.
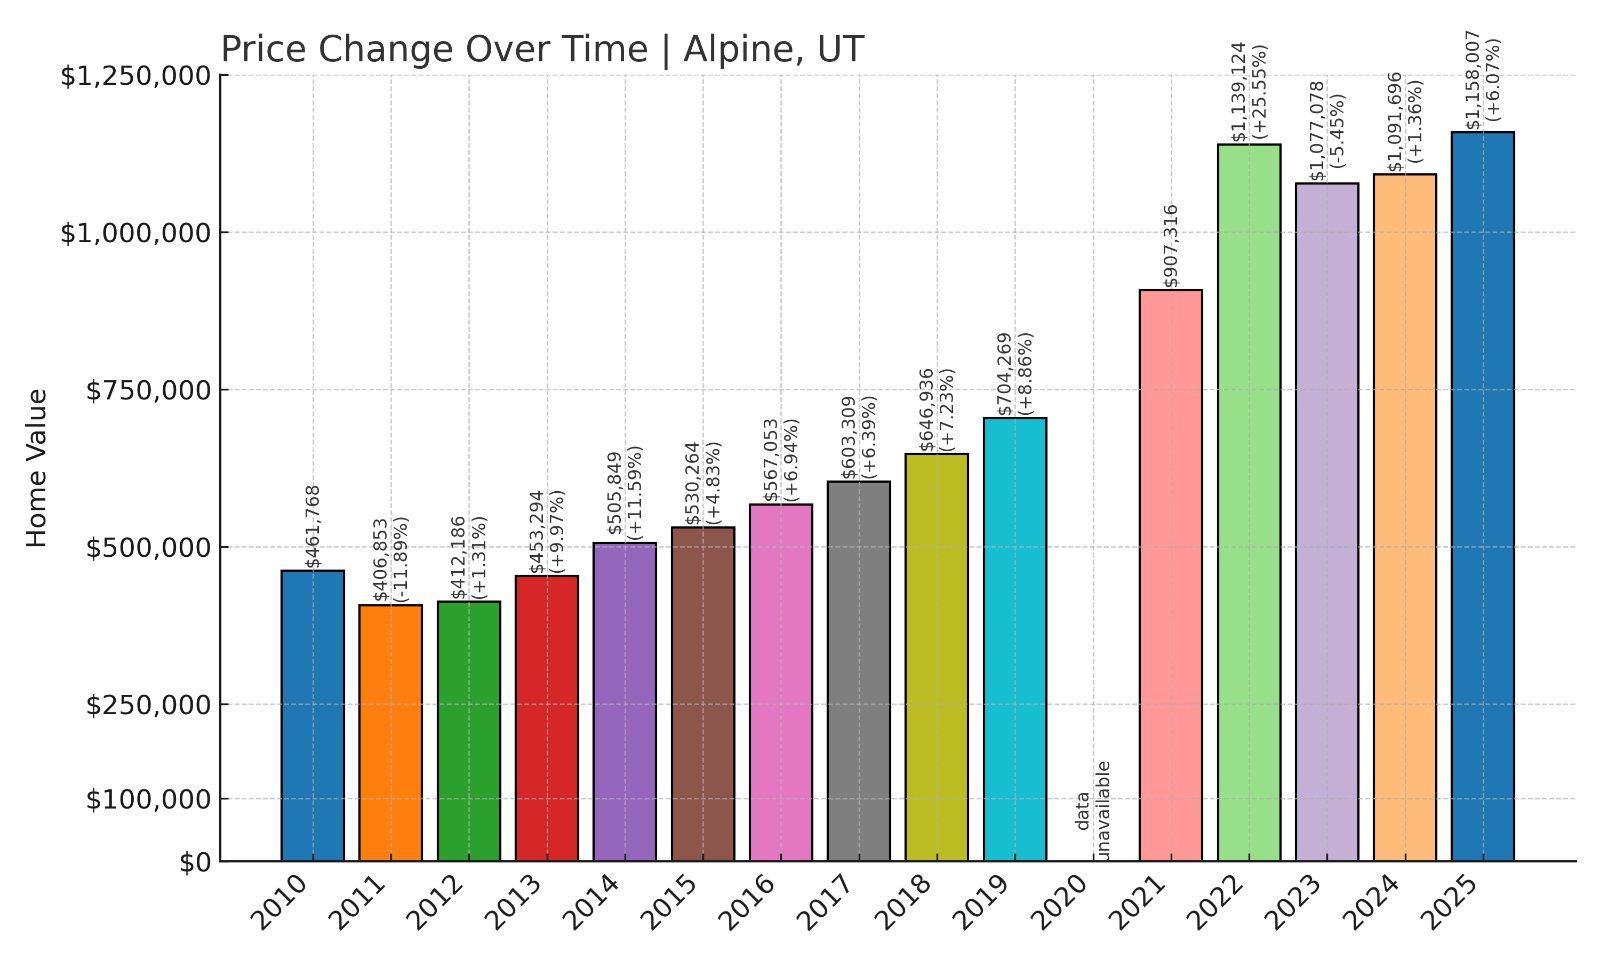
6. Alpine – 181% Home Price Increase Since 2012
🔥 Would you like to save this?
- 2010: $461,768
- 2011: $406,853 (-$54,916, -11.89% from previous year)
- 2012: $412,186 (+$5,333, +1.31% from previous year)
- 2013: $453,294 (+$41,108, +9.97% from previous year)
- 2014: $505,849 (+$52,555, +11.59% from previous year)
- 2015: $530,264 (+$24,415, +4.83% from previous year)
- 2016: $567,053 (+$36,789, +6.94% from previous year)
- 2017: $603,309 (+$36,255, +6.39% from previous year)
- 2018: $646,936 (+$43,627, +7.23% from previous year)
- 2019: $704,269 (+$57,333, +8.86% from previous year)
- 2020: N/A
- 2021: $907,316
- 2022: $1,139,124 (+$231,808, +25.55% from previous year)
- 2023: $1,077,078 (-$62,046, -5.45% from previous year)
- 2024: $1,091,696 (+$14,618, +1.36% from previous year)
- 2025: $1,158,007 (+$66,312, +6.07% from previous year)
Alpine’s home prices have grown by 181% since 2012. The town saw consistent growth through the 2010s, with a major leap in 2022. Despite a temporary drop in 2023, values have continued to climb into 2025, reaching $1.16 million.
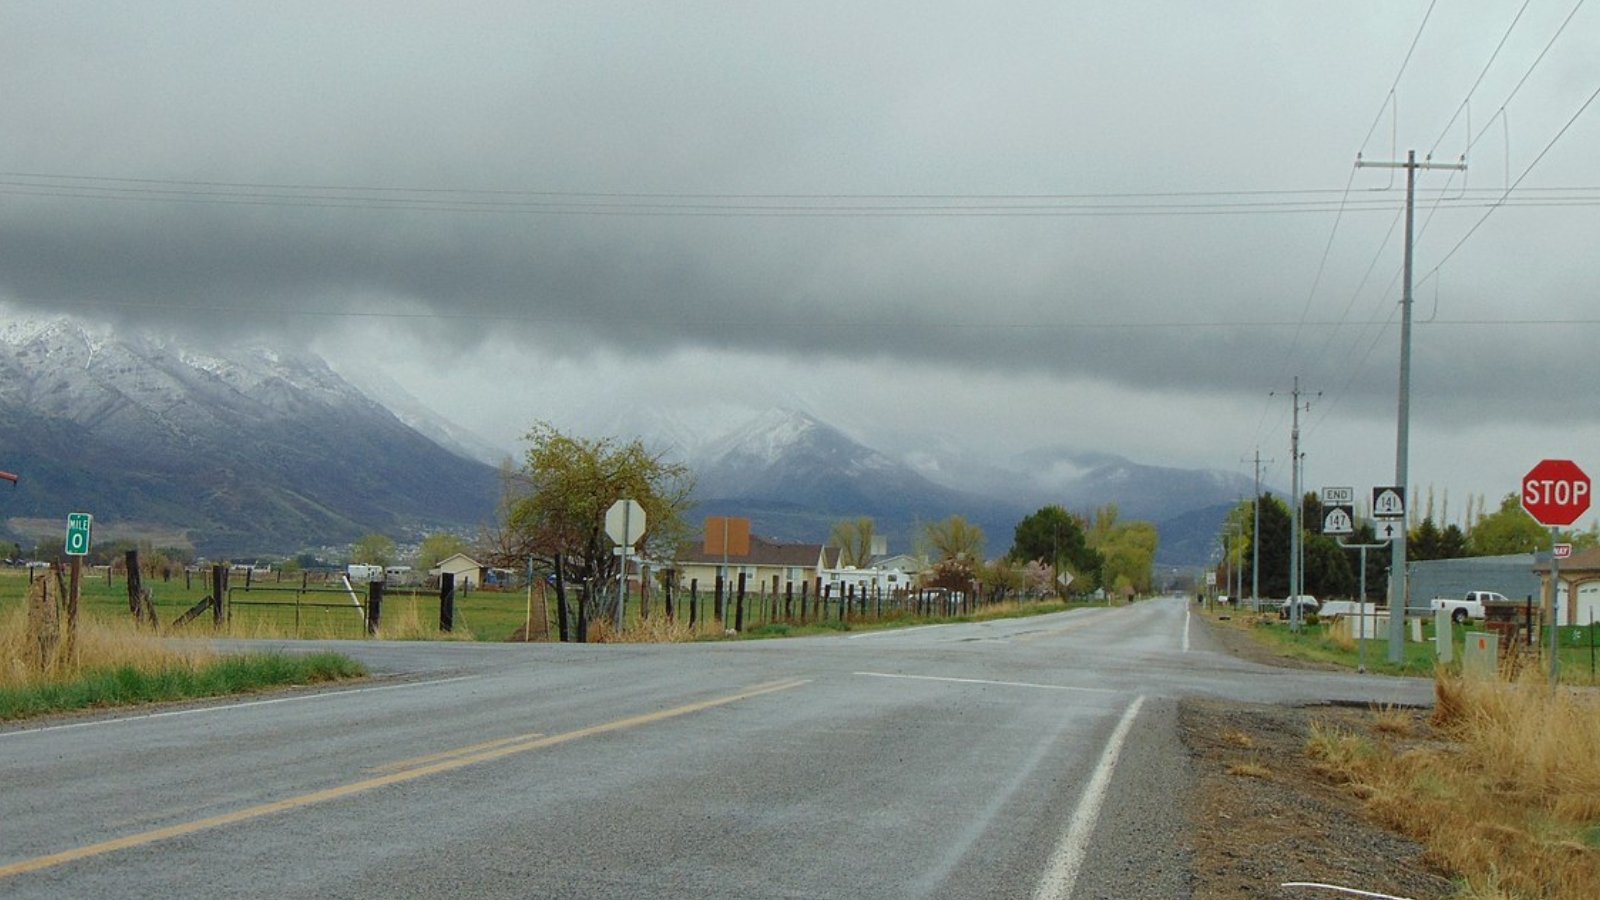
Alpine – Scenic Living with Suburban Access

Scottie2hotie, CC BY-SA 4.0 , via Wikimedia Commons
Alpine is perched at the base of the Wasatch Mountains in northern Utah County. It’s known for its natural beauty, upscale neighborhoods, and easy access to Lehi, Silicon Slopes, and Salt Lake City. Families are drawn by excellent schools and recreational opportunities.
The housing market reflects a mix of custom estates and large new builds. Alpine’s growth has been shaped by its desirability among executives and professionals seeking space and quality construction without sacrificing access to the urban core.
5. Granite – 193% Home Price Increase Since 2012

- 2010: $571,156
- 2011: $513,358 (-$57,798, -10.12% from previous year)
- 2012: $496,898 (-$16,460, -3.21% from previous year)
- 2013: $536,981 (+$40,083, +8.07% from previous year)
- 2014: $574,062 (+$37,081, +6.91% from previous year)
- 2015: $584,577 (+$10,516, +1.83% from previous year)
- 2016: $616,901 (+$32,323, +5.53% from previous year)
- 2017: $640,542 (+$23,641, +3.83% from previous year)
- 2018: $683,232 (+$42,690, +6.66% from previous year)
- 2019: $730,275 (+$47,043, +6.89% from previous year)
- 2020: N/A
- 2021: $942,439
- 2022: $1,157,807 (+$215,368, +22.85% from previous year)
- 2023: $1,100,713 (-$57,094, -4.93% from previous year)
- 2024: $1,123,808 (+$23,095, +2.10% from previous year)
- 2025: $1,179,484 (+$55,676, +4.95% from previous year)
Granite’s home values have increased 193% since 2012, with substantial appreciation in the 2020s pushing the median price near $1.18 million. While 2023 saw a temporary drop, strong gains in 2024 and 2025 reflect renewed market strength.
Granite – Serenity at the Edge of the Wasatch

Granite is a secluded, unincorporated area in southeast Salt Lake County. Nestled near Little Cottonwood Canyon, it is prized for privacy, natural beauty, and luxury properties with unmatched mountain access. Its limited development and proximity to world-class skiing make it uniquely appealing.
Real estate in Granite typically consists of expansive homes with high-end finishes. Its combination of seclusion and prestige has kept demand — and prices — consistently high, especially among those seeking proximity to nature without leaving the Salt Lake metro area.
4. West Mountain – $1,189,359 Median Price in 2025

- 2010: N/A
- 2011: N/A
- 2012: N/A
- 2013: N/A
- 2014: N/A
- 2015: N/A
- 2016: N/A
- 2017: N/A
- 2018: N/A
- 2019: N/A
- 2020: N/A
- 2021: N/A
- 2022: $1,142,679
- 2023: $1,083,335 (-$59,344, -5.19% from previous year)
- 2024: $1,073,135 (-$10,199, -0.94% from previous year)
- 2025: $1,189,359 (+$116,224, +10.83% from previous year)
West Mountain crossed the $1.18 million mark in 2025 following a sharp price increase of nearly 11% over the previous year. After two years of small declines, this rebound suggests growing interest and renewed buyer confidence in the area.
West Mountain – Big Land, Big Value
West Mountain is a sparsely developed area southwest of Spanish Fork in Utah County. It’s known for its rural character, agricultural properties, and views of Utah Lake. With large parcels and minimal commercial development, it offers space and privacy that attract affluent buyers seeking escape from city sprawl.
Though real estate data is recent, West Mountain’s pricing reflects a shift in buyer demand toward larger properties in secluded areas. The 2025 surge hints at increasing investment in the region, likely tied to Utah County’s continued population and infrastructure growth.
3. Kamas – 256% Home Price Increase Since 2012

- 2010: $378,772
- 2011: $344,787 (-$33,985, -8.97% from previous year)
- 2012: $337,528 (-$7,259, -2.11% from previous year)
- 2013: $378,097 (+$40,569, +12.02% from previous year)
- 2014: $431,423 (+$53,326, +14.10% from previous year)
- 2015: $452,568 (+$21,144, +4.90% from previous year)
- 2016: $505,449 (+$52,881, +11.68% from previous year)
- 2017: $567,763 (+$62,314, +12.33% from previous year)
- 2018: $615,000 (+$47,238, +8.32% from previous year)
- 2019: $670,117 (+$55,116, +8.96% from previous year)
- 2020: N/A
- 2021: $927,820
- 2022: $1,161,843 (+$234,023, +25.22% from previous year)
- 2023: $1,095,631 (-$66,212, -5.70% from previous year)
- 2024: $1,164,480 (+$68,849, +6.28% from previous year)
- 2025: $1,201,126 (+$36,646, +3.15% from previous year)
Kamas has seen a dramatic 256% increase in home prices since 2012. The market gained significant steam after 2020, with 2022 marking a 25% annual increase. Since then, home prices have continued climbing, topping $1.2 million in 2025.
Kamas – Gateway to the Uintas

An Errant Knight, CC BY-SA 4.0 , via Wikimedia Commons
Kamas lies just east of Park City and is often considered the gateway to the Uinta Mountains. Its location combines scenic appeal, recreational access, and small-town living, which makes it attractive to both primary residents and vacation home buyers.
With high demand for homes that offer both access and tranquility, Kamas has emerged as one of the state’s high-value markets. Home prices reflect its rising popularity, driven by proximity to ski resorts and pristine wilderness while avoiding Park City’s more saturated pricing.
2. Park City – 211% Home Price Increase Since 2012

- 2010: $489,633
- 2011: $511,770 (+$22,137, +4.52% from previous year)
- 2012: $501,473 (-$10,297, -2.01% from previous year)
- 2013: $534,610 (+$33,138, +6.61% from previous year)
- 2014: $593,895 (+$59,285, +11.09% from previous year)
- 2015: $657,336 (+$63,441, +10.68% from previous year)
- 2016: $728,563 (+$71,227, +10.84% from previous year)
- 2017: $790,865 (+$62,302, +8.55% from previous year)
- 2018: $832,589 (+$41,724, +5.28% from previous year)
- 2019: $880,100 (+$47,511, +5.71% from previous year)
- 2020: N/A
- 2021: $1,122,348
- 2022: $1,588,768 (+$466,420, +41.56% from previous year)
- 2023: $1,487,634 (-$101,134, -6.37% from previous year)
- 2024: $1,537,377 (+$49,743, +3.34% from previous year)
- 2025: $1,561,649 (+$24,272, +1.58% from previous year)
Park City’s home prices have surged 211% since 2012. The town experienced a historic jump in 2022, with prices climbing over 40% in a single year. Despite some correction, prices have remained strong and continue to rise modestly into 2025.
Park City – Utah’s Iconic Luxury Market

🔥 Would you like to save this?
Park City is the crown jewel of Utah’s resort towns. Known internationally for its ski resorts, film festival, and high-end real estate, it continues to attract luxury buyers from around the globe. With excellent schools, restaurants, and outdoor access, it’s one of the most livable high-end destinations in the Mountain West.
The 2022 spike was partly fueled by pandemic-era migration and investment, but the town’s long-term appeal keeps its market robust. With prices over $1.5 million, Park City remains the top-tier benchmark for Utah real estate.
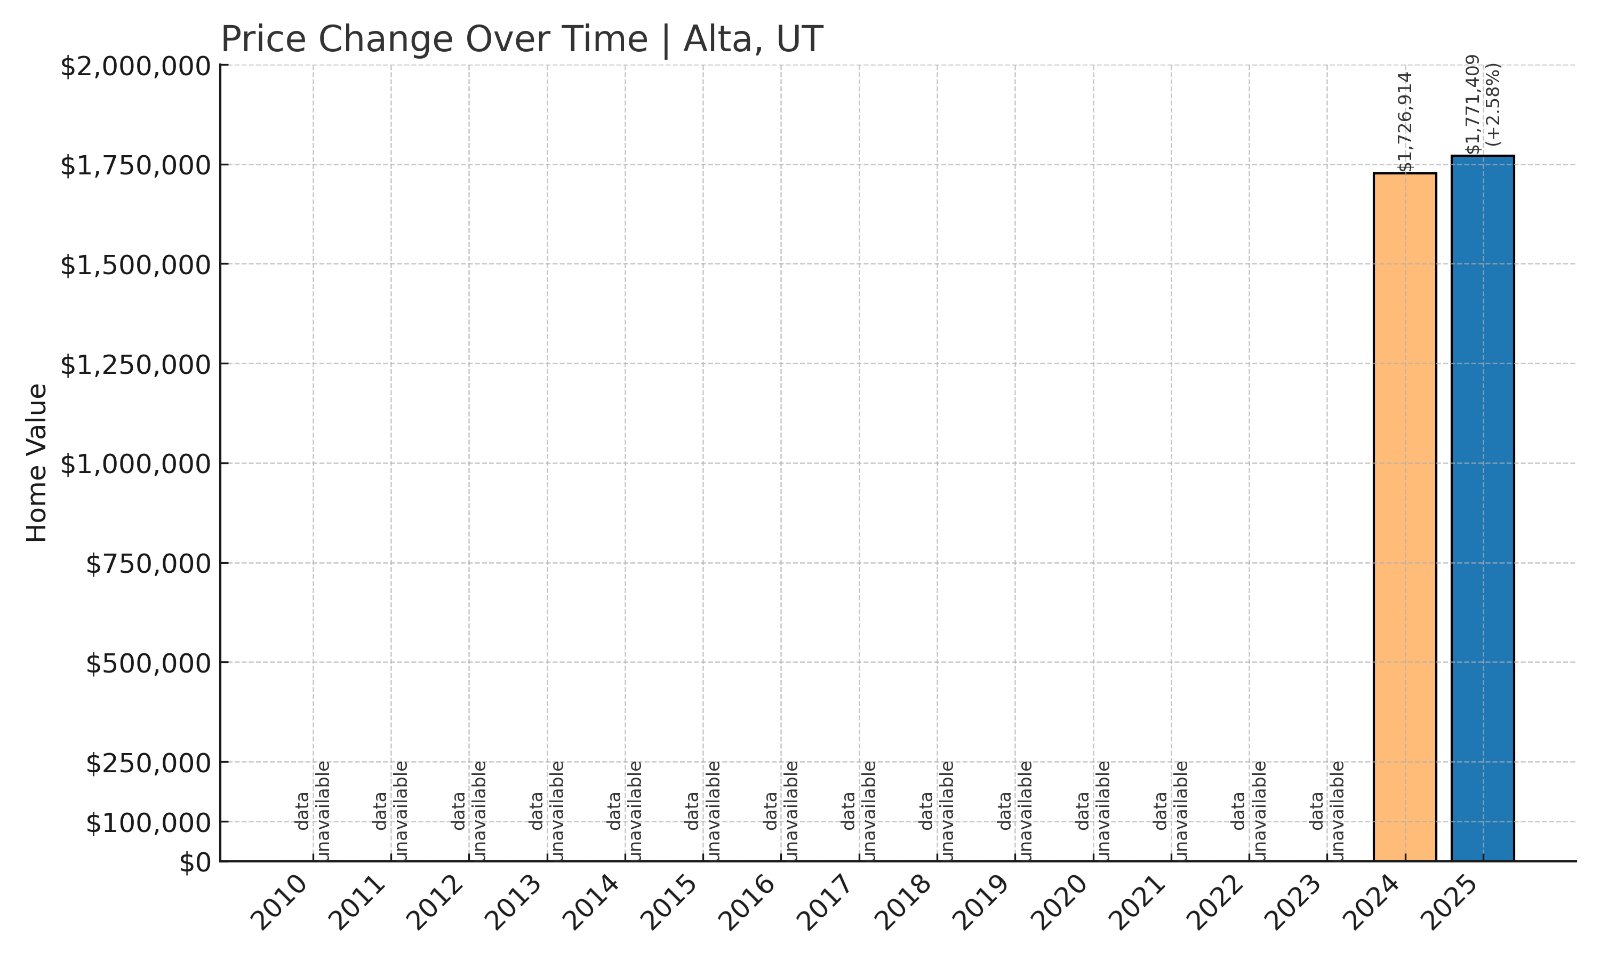
1. Alta – $1,771,409 Median Price in 2025
- 2010: N/A
- 2011: N/A
- 2012: N/A
- 2013: N/A
- 2014: N/A
- 2015: N/A
- 2016: N/A
- 2017: N/A
- 2018: N/A
- 2019: N/A
- 2020: N/A
- 2021: N/A
- 2022: N/A
- 2023: N/A
- 2024: $1,726,914
- 2025: $1,771,409 (+$44,495, +2.58% from previous year)
Alta ranks as the most expensive town in Utah in 2025, with a median home price of $1,771,409. Despite limited public data, the available figures place it well above other towns on this list, cementing its place at the top.
Alta – High Altitude, High Value

Credit: Sumanch @ Wikimedia Commons, CC BY 3.0 , via Wikimedia Commons
Alta is best known for its namesake ski resort, which is among the most famous for powder skiing in North America. Situated in Little Cottonwood Canyon, Alta is a tiny, exclusive community with limited housing stock — contributing to its sky-high real estate values.
With strict zoning, breathtaking mountain views, and seasonal access challenges, Alta homes are few and prized. Most homes are used as ski chalets or seasonal retreats, and prices reflect both scarcity and prestige. For those who want true alpine living, Alta is as high as it gets — in elevation and in price.


