
🔥 Would you like to save this?
Home values in some Idaho towns didn’t just rise in 2025—they rocketed. Based on Zillow’s Home Value Index, these 18 places saw prices grow faster and higher than anywhere else in the state. Whether it’s lakeside charm or newfound development gold, each town has a story behind the spike, and the numbers to back it up.
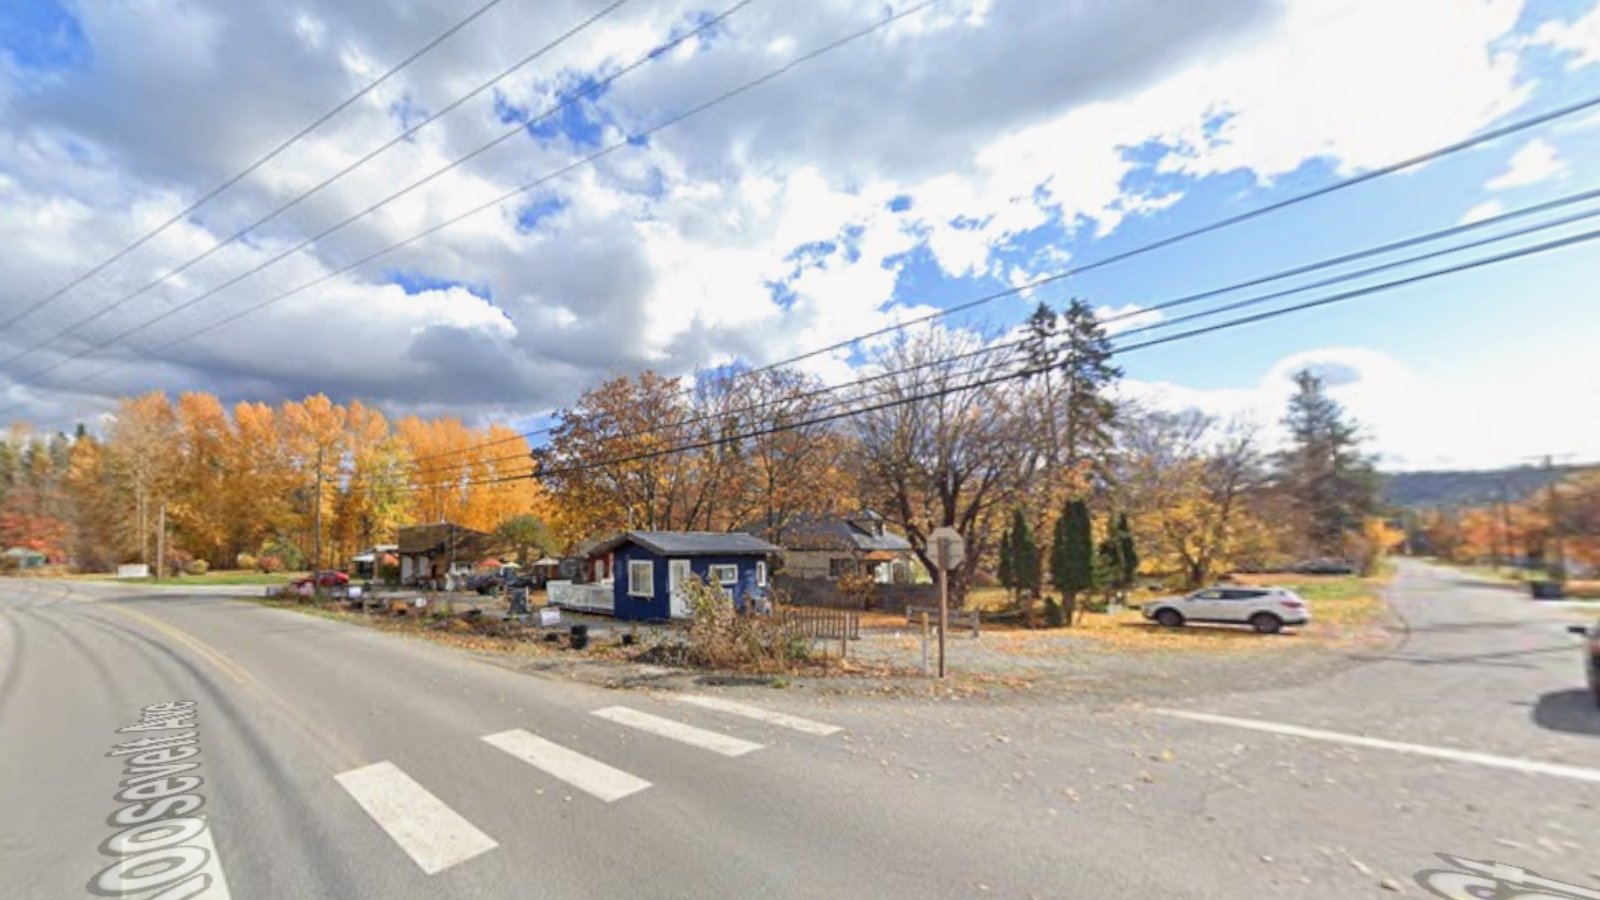
18. Laclede – 119% Home Price Increase Since 2017

- 2010: N/A
- 2011: N/A
- 2012: N/A
- 2013: N/A
- 2014: N/A
- 2015: N/A
- 2016: N/A
- 2017: $319,849
- 2018: $350,592 (+$30,743, +9.61% from previous year)
- 2019: $372,045 (+$21,453, +6.12% from previous year)
- 2020: N/A
- 2021: $541,571
- 2022: $685,156 (+$143,585, +26.51% from previous year)
- 2023: $625,817 (-$59,340, -8.66% from previous year)
- 2024: $692,067 (+$66,250, +10.59% from previous year)
- 2025: $701,805 (+$9,738, +1.41% from previous year)
Laclede’s home values have risen sharply since 2017, climbing from just under $320,000 to over $700,000 in 2025. The biggest surge came in 2022, when prices jumped by more than 26% year-over-year. Despite a dip in 2023, values rebounded again, suggesting continued demand for homes in this quiet riverside community.
In order to come up with the very specific design ideas, we create most designs with the assistance of state-of-the-art AI interior design software. Also, assume links that take you off the site are affiliate links such as links to Amazon. this means we may earn a commission if you buy something.
Laclede – Strong Comeback After Price Dip

Laclede is a small town along the Pend Oreille River in Bonner County, northern Idaho. Known for its tranquil setting and proximity to national forests, it appeals to buyers looking for space, seclusion, and scenic beauty. The jump in prices may reflect increased interest in second homes and rural getaways. Though prices briefly dipped in 2023, the town saw a recovery in 2024 and 2025, bringing home values close to all-time highs again. With outdoor recreation and lake access nearby, demand may remain steady even with market shifts.
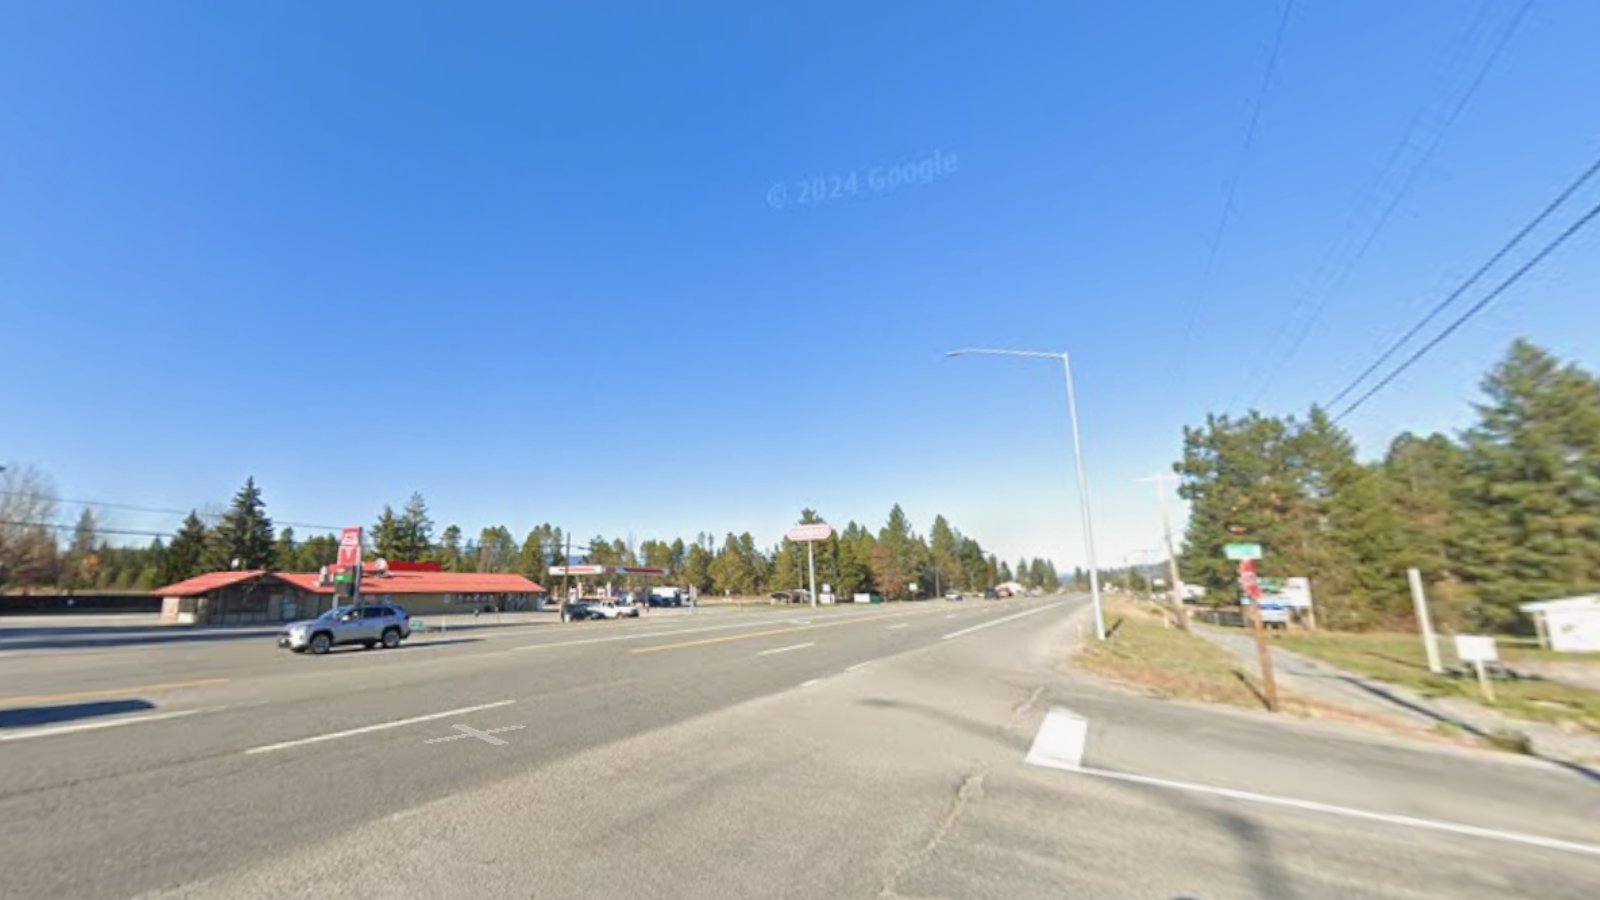
17. Sweet – 101% Home Price Increase Since 2019

- 2010: N/A
- 2011: N/A
- 2012: N/A
- 2013: N/A
- 2014: N/A
- 2015: N/A
- 2016: N/A
- 2017: N/A
- 2018: N/A
- 2019: $353,517
- 2020: N/A
- 2021: $575,702
- 2022: $726,895 (+$151,193, +26.26% from previous year)
- 2023: $672,820 (-$54,075, -7.44% from previous year)
- 2024: $675,520 (+$2,700, +0.40% from previous year)
- 2025: $710,268 (+$34,748, +5.14% from previous year)
Sweet’s home values nearly doubled between 2019 and 2025. Most of the appreciation occurred between 2019 and 2022, when home prices jumped by more than 105%. While prices dipped slightly in 2023, they quickly stabilized and climbed again by 2025, suggesting ongoing interest in the area.
Sweet – Growing Interest in Rural Property

Located in Gem County, Sweet is a quiet farming community northwest of Boise. It offers rural charm while still being within driving distance of urban amenities. During the post-2020 housing surge, many buyers sought more open space, which may explain Sweet’s dramatic home price increases. With scenic views, low population density, and relatively large property parcels, the area is likely to remain attractive to buyers seeking a slower pace of life. Recent years have shown modest but consistent price increases after an earlier boom.
16. Hope – 147% Home Price Increase Since 2010

- 2010: $297,534
- 2011: $271,426 (-$26,109, -8.78% from previous year)
- 2012: $280,578 (+$9,152, +3.37% from previous year)
- 2013: $300,692 (+$20,114, +7.17% from previous year)
- 2014: $312,558 (+$11,867, +3.95% from previous year)
- 2015: $333,221 (+$20,663, +6.61% from previous year)
- 2016: $366,565 (+$33,344, +10.01% from previous year)
- 2017: $387,724 (+$21,159, +5.77% from previous year)
- 2018: $408,038 (+$20,314, +5.24% from previous year)
- 2019: $429,731 (+$21,693, +5.32% from previous year)
- 2020: N/A
- 2021: $611,220
- 2022: $780,987 (+$169,767, +27.78% from previous year)
- 2023: $731,372 (-$49,615, -6.35% from previous year)
- 2024: $751,948 (+$20,576, +2.81% from previous year)
- 2025: $736,105 (-$15,842, -2.11% from previous year)
Hope has seen steady appreciation since 2010, with prices climbing from around $297,000 to over $736,000. The town’s biggest spike came in 2022 with a nearly 28% rise. Although prices have cooled slightly since then, they remain well above pre-pandemic levels.
Hope – Scenic Location Drives Long-Term Growth

Hope is perched on the northern edge of Lake Pend Oreille, offering stunning water views and access to boating, fishing, and outdoor recreation. With a small population and picturesque surroundings, the town has long attracted second-home buyers and retirees. Its relatively consistent year-over-year growth, especially post-2015, suggests steady demand. The huge surge in 2022 likely reflects national pandemic-driven buying trends that favored scenic, rural places with lifestyle appeal.
15. Athol – 291% Home Price Increase Since 2010

- 2010: $198,590
- 2011: $180,692 (-$17,898, -9.01% from previous year)
- 2012: $180,958 (+$265, +0.15% from previous year)
- 2013: $202,662 (+$21,705, +11.99% from previous year)
- 2014: $229,745 (+$27,083, +13.36% from previous year)
- 2015: $252,194 (+$22,449, +9.77% from previous year)
- 2016: $281,948 (+$29,754, +11.80% from previous year)
- 2017: $306,456 (+$24,508, +8.69% from previous year)
- 2018: $338,991 (+$32,535, +10.62% from previous year)
- 2019: $383,359 (+$44,368, +13.09% from previous year)
- 2020: N/A
- 2021: $586,305
- 2022: $753,119 (+$166,815, +28.45% from previous year)
- 2023: $752,936 (-$183, -0.02% from previous year)
- 2024: $763,349 (+$10,413, +1.38% from previous year)
- 2025: $777,000 (+$13,651, +1.79% from previous year)
Home prices in Athol have nearly quadrupled since 2010. While the biggest price jump came in 2022, overall growth has been strong and steady across most years. Recent gains have been smaller but consistent, showing the town’s continued popularity.
Athol – Steady Growth With Outdoor Appeal
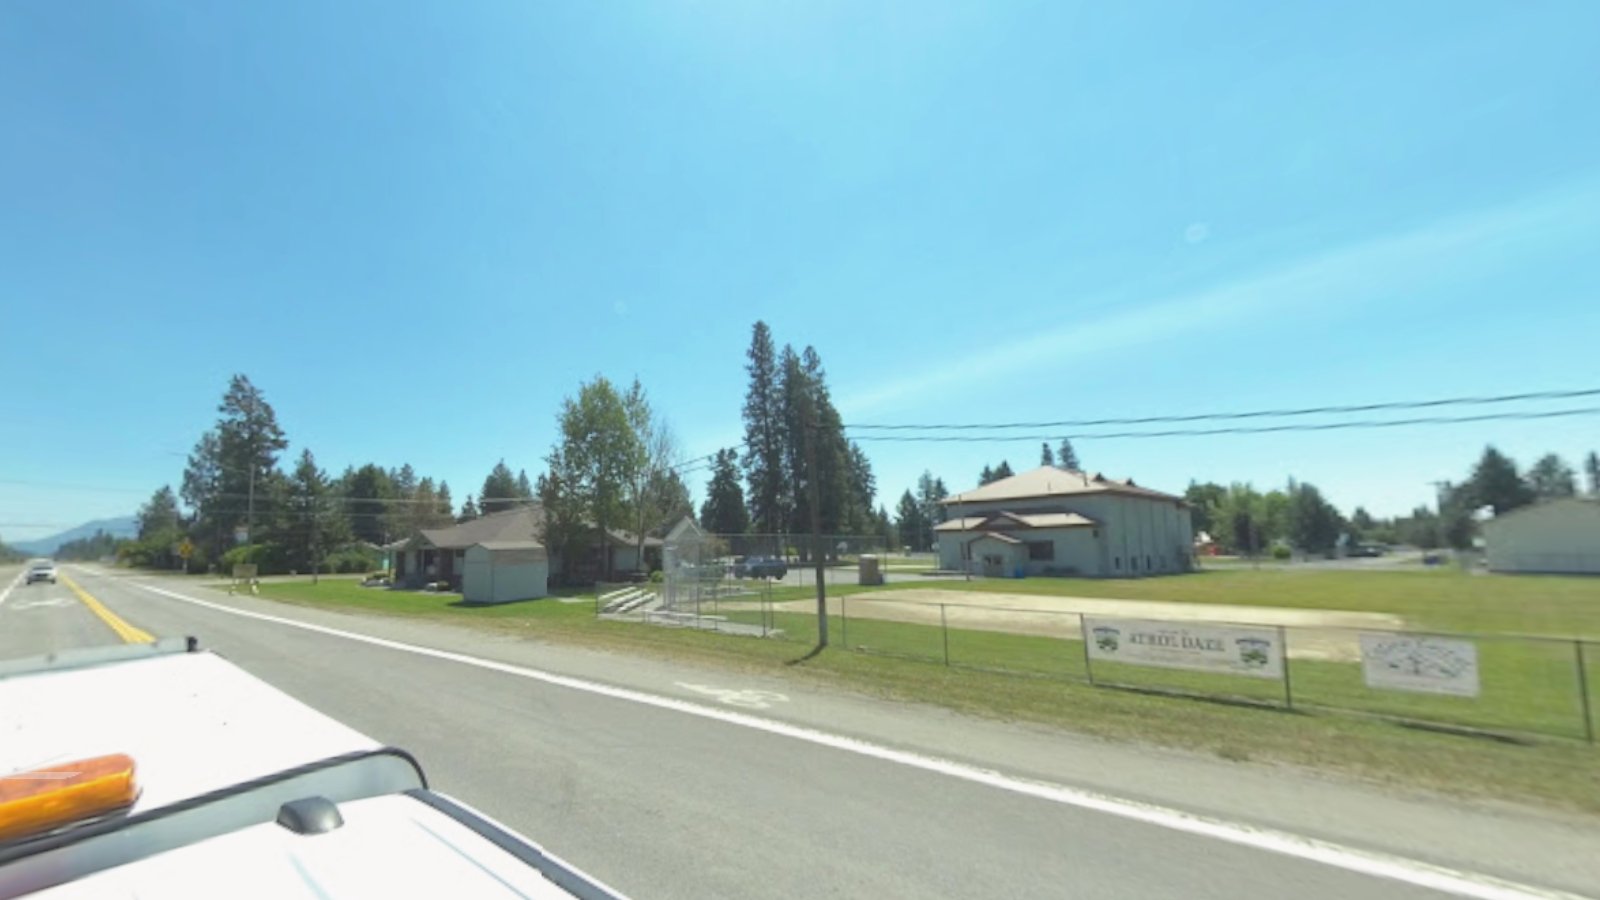
Athol is located in Kootenai County near Farragut State Park, just north of Hayden and Coeur d’Alene. Its appeal lies in its spacious lots, rural atmosphere, and easy access to outdoor recreation. As more people have moved to Idaho in search of open space, places like Athol have seen rapid home value increases. The town’s housing market has matured over time, with only minor adjustments in the last couple of years following a major leap in 2022.
14. Sagle – 188% Home Price Increase Since 2010

- 2010: $270,168
- 2011: $253,165 (-$17,003, -6.29% from previous year)
- 2012: $251,469 (-$1,696, -0.67% from previous year)
- 2013: $267,317 (+$15,847, +6.30% from previous year)
- 2014: $293,444 (+$26,128, +9.77% from previous year)
- 2015: $306,657 (+$13,213, +4.50% from previous year)
- 2016: $327,983 (+$21,326, +6.95% from previous year)
- 2017: $352,861 (+$24,877, +7.58% from previous year)
- 2018: $380,645 (+$27,784, +7.87% from previous year)
- 2019: $409,717 (+$29,072, +7.64% from previous year)
- 2020: N/A
- 2021: $609,994
- 2022: $813,279 (+$203,285, +33.33% from previous year)
- 2023: $734,978 (-$78,301, -9.63% from previous year)
- 2024: $773,416 (+$38,438, +5.23% from previous year)
- 2025: $777,877 (+$4,461, +0.58% from previous year)
Sagle’s home prices have surged nearly 190% since 2010. Price growth was especially strong from 2015 through 2022, with values peaking at over $813,000 before leveling off. While recent increases have been modest, prices remain near record highs.
Sagle – Consistent Rise for a Waterfront Town
Sagle is located just south of Sandpoint along the western shores of Lake Pend Oreille. Its proximity to the lake and forested hills makes it a favorite among outdoor enthusiasts and second-home buyers. The area has benefited from the broader surge in interest in Idaho’s natural beauty, particularly during the early 2020s. Even after a 2023 price dip, values remain historically high, with slight upward movement continuing through 2025.
13. Dover – 138% Home Price Increase Since 2010

- 2010: $326,757
- 2011: $305,963 (-$20,794, -6.36% from previous year)
- 2012: $300,371 (-$5,591, -1.83% from previous year)
- 2013: $314,039 (+$13,668, +4.55% from previous year)
- 2014: $337,371 (+$23,332, +7.43% from previous year)
- 2015: $347,254 (+$9,883, +2.93% from previous year)
- 2016: $369,532 (+$22,278, +6.42% from previous year)
- 2017: $386,636 (+$17,104, +4.63% from previous year)
- 2018: $404,371 (+$17,735, +4.59% from previous year)
- 2019: $422,170 (+$17,798, +4.40% from previous year)
- 2020: N/A
- 2021: $579,687
- 2022: $765,879 (+$186,192, +32.12% from previous year)
- 2023: $728,553 (-$37,326, -4.87% from previous year)
- 2024: $778,113 (+$49,560, +6.80% from previous year)
- 2025: $779,059 (+$946, +0.12% from previous year)
Home values in Dover have risen from just under $327,000 in 2010 to nearly $780,000 in 2025. After steady, moderate growth through the 2010s, the market surged in 2021 and 2022. A short dip in 2023 was quickly reversed, with prices stabilizing again in the following two years.
Dover – Lakeside Living Continues to Attract Buyers
Dover sits on the northern edge of Lake Pend Oreille, offering one of Idaho’s most scenic waterfront lifestyles. Known for its marina, resort-style amenities, and trail systems, Dover Bay has helped transform the town into a premium housing market. Its proximity to Sandpoint makes it an easy choice for buyers who want both luxury and access to year-round outdoor recreation. The major increase in value between 2021 and 2022 is a reflection of that demand, with prices now leveling but holding strong into 2025.
12. McCall – 202% Home Price Increase Since 2010

🔥 Would you like to save this?
- 2010: $258,253
- 2011: $222,492 (-$35,761, -13.85% from previous year)
- 2012: $217,668 (-$4,824, -2.17% from previous year)
- 2013: $216,866 (-$802, -0.37% from previous year)
- 2014: $253,612 (+$36,745, +16.94% from previous year)
- 2015: $277,005 (+$23,394, +9.22% from previous year)
- 2016: $305,403 (+$28,397, +10.25% from previous year)
- 2017: $330,233 (+$24,830, +8.13% from previous year)
- 2018: $357,159 (+$26,926, +8.15% from previous year)
- 2019: $400,463 (+$43,304, +12.12% from previous year)
- 2020: N/A
- 2021: $594,196
- 2022: $842,566 (+$248,370, +41.80% from previous year)
- 2023: $746,045 (-$96,522, -11.46% from previous year)
- 2024: $761,336 (+$15,292, +2.05% from previous year)
- 2025: $779,123 (+$17,787, +2.34% from previous year)
McCall’s home values have more than tripled since 2010, rising from about $258,000 to over $779,000 in 2025. The sharpest rise came in 2022, with a 41.8% surge. Though values dipped the following year, recent data shows prices are climbing again, albeit at a more moderate pace.
McCall – Resort Town With Strong Demand

McCall is a well-known mountain resort town on the shores of Payette Lake. It’s popular for both summer recreation and winter skiing at nearby Brundage Mountain. The post-pandemic demand for second homes, remote work setups, and outdoor access helped fuel the huge price jump seen in 2022. While a price correction followed in 2023, McCall’s reputation as a year-round destination continues to support high home values heading into 2025.
11. Driggs – 291% Home Price Increase Since 2011

- 2010: N/A
- 2011: $202,486
- 2012: $209,235 (+$6,749, +3.33% from previous year)
- 2013: $233,487 (+$24,251, +11.59% from previous year)
- 2014: $262,864 (+$29,377, +12.58% from previous year)
- 2015: $293,769 (+$30,905, +11.76% from previous year)
- 2016: $333,299 (+$39,530, +13.46% from previous year)
- 2017: $386,395 (+$53,096, +15.93% from previous year)
- 2018: $421,304 (+$34,909, +9.03% from previous year)
- 2019: $421,651 (+$347, +0.08% from previous year)
- 2020: N/A
- 2021: $571,727
- 2022: $777,397 (+$205,670, +35.97% from previous year)
- 2023: $744,673 (-$32,724, -4.21% from previous year)
- 2024: $784,318 (+$39,646, +5.32% from previous year)
- 2025: $790,799 (+$6,481, +0.83% from previous year)
Since 2011, home prices in Driggs have nearly tripled, jumping from just over $200,000 to nearly $791,000. After a peak in 2022, prices dipped slightly before leveling off in 2025. The upward trend remains clear, even after market adjustments.
Driggs – Gateway to the Tetons

Driggs sits in Teton County near the Idaho-Wyoming border, offering access to the Teton Range and views that rival nearby Jackson, Wyoming. While it’s more affordable than its Wyoming neighbor, Driggs has been catching up in home prices due to its popularity with outdoor enthusiasts and vacation home buyers. Its rapid growth in the early 2020s and the 2022 spike reflect a broader pattern of high-altitude real estate becoming increasingly competitive. As of 2025, demand remains steady, keeping prices among the highest in Idaho.
10. Hailey – 192% Home Price Increase Since 2010

- 2010: $276,082
- 2011: $246,257 (-$29,824, -10.80% from previous year)
- 2012: $241,124 (-$5,134, -2.08% from previous year)
- 2013: $253,907 (+$12,783, +5.30% from previous year)
- 2014: $296,543 (+$42,636, +16.79% from previous year)
- 2015: $323,232 (+$26,690, +9.00% from previous year)
- 2016: $348,296 (+$25,063, +7.75% from previous year)
- 2017: $357,892 (+$9,596, +2.76% from previous year)
- 2018: $396,813 (+$38,921, +10.87% from previous year)
- 2019: $411,094 (+$14,282, +3.60% from previous year)
- 2020: N/A
- 2021: $565,824
- 2022: $730,107 (+$164,283, +29.03% from previous year)
- 2023: $715,282 (-$14,825, -2.03% from previous year)
- 2024: $774,838 (+$59,556, +8.33% from previous year)
- 2025: $806,455 (+$31,617, +4.08% from previous year)
Hailey’s home values have nearly tripled since 2010, reaching over $800,000 in 2025. Strong appreciation has continued even after a brief dip in 2023. Price gains have been steady and widespread, with especially high jumps in 2021 and 2022.
Hailey – Big Price Growth in the Sun Valley Region

Hailey is located in Blaine County just south of Sun Valley, one of Idaho’s most famous resort areas. While often overshadowed by its pricier neighbors, Hailey has grown quickly thanks to its proximity to skiing, hiking, and employment centers. More locals and transplants alike have turned to Hailey for slightly more accessible prices, pushing demand upward. Even with cooling trends elsewhere, Hailey continues to see appreciation thanks to its strategic location and quality of life offerings.
9. Worley – 197% Home Price Increase Since 2010

- 2010: $274,640
- 2011: $284,509 (+$9,869, +3.59% from previous year)
- 2012: $263,699 (-$20,810, -7.31% from previous year)
- 2013: $268,110 (+$4,410, +1.67% from previous year)
- 2014: $296,306 (+$28,196, +10.52% from previous year)
- 2015: $320,274 (+$23,968, +8.09% from previous year)
- 2016: $339,803 (+$19,530, +6.10% from previous year)
- 2017: $357,398 (+$17,595, +5.18% from previous year)
- 2018: $390,981 (+$33,583, +9.40% from previous year)
- 2019: $423,979 (+$32,998, +8.44% from previous year)
- 2020: N/A
- 2021: $587,588
- 2022: $759,659 (+$172,071, +29.28% from previous year)
- 2023: $756,825 (-$2,834, -0.37% from previous year)
- 2024: $804,448 (+$47,623, +6.29% from previous year)
- 2025: $817,214 (+$12,766, +1.59% from previous year)
Worley’s home prices have climbed from under $275,000 in 2010 to over $817,000 by 2025. This near-tripling in value includes a large jump in 2022, followed by modest corrections and renewed growth. Prices have been trending upward almost every year in the past decade.
Worley – Price Growth Fueled by Proximity and Recreation

Located in Kootenai County, Worley is best known for being home to the Coeur d’Alene Casino and its surrounding amenities. It’s within an easy drive of Coeur d’Alene and Spokane, making it a practical choice for homebuyers wanting space without sacrificing access to urban centers. With lakes, forests, and a golf course nearby, the town appeals to both retirees and remote workers. Its sharp rise in values in 2022 matches trends seen across northern Idaho during that time, driven by lifestyle-driven migration.
8. Eagle – 183% Home Price Increase Since 2010

- 2010: $290,056
- 2011: $261,421 (-$28,636, -9.87% from previous year)
- 2012: $267,437 (+$6,016, +2.30% from previous year)
- 2013: $302,573 (+$35,136, +13.14% from previous year)
- 2014: $332,209 (+$29,636, +9.79% from previous year)
- 2015: $340,485 (+$8,276, +2.49% from previous year)
- 2016: $361,128 (+$20,643, +6.06% from previous year)
- 2017: $389,323 (+$28,195, +7.81% from previous year)
- 2018: $422,594 (+$33,271, +8.55% from previous year)
- 2019: $470,692 (+$48,098, +11.38% from previous year)
- 2020: N/A
- 2021: $714,858
- 2022: $887,855 (+$172,997, +24.20% from previous year)
- 2023: $775,270 (-$112,585, -12.68% from previous year)
- 2024: $802,054 (+$26,783, +3.45% from previous year)
- 2025: $821,752 (+$19,698, +2.46% from previous year)
Since 2010, Eagle has seen home prices soar from about $290,000 to over $820,000. While 2022 brought a substantial leap, the following year saw a temporary correction. Still, the overall trend shows continued demand and steady recovery in 2024 and 2025.
Eagle – Boise Suburb With Big-Time Price Gains
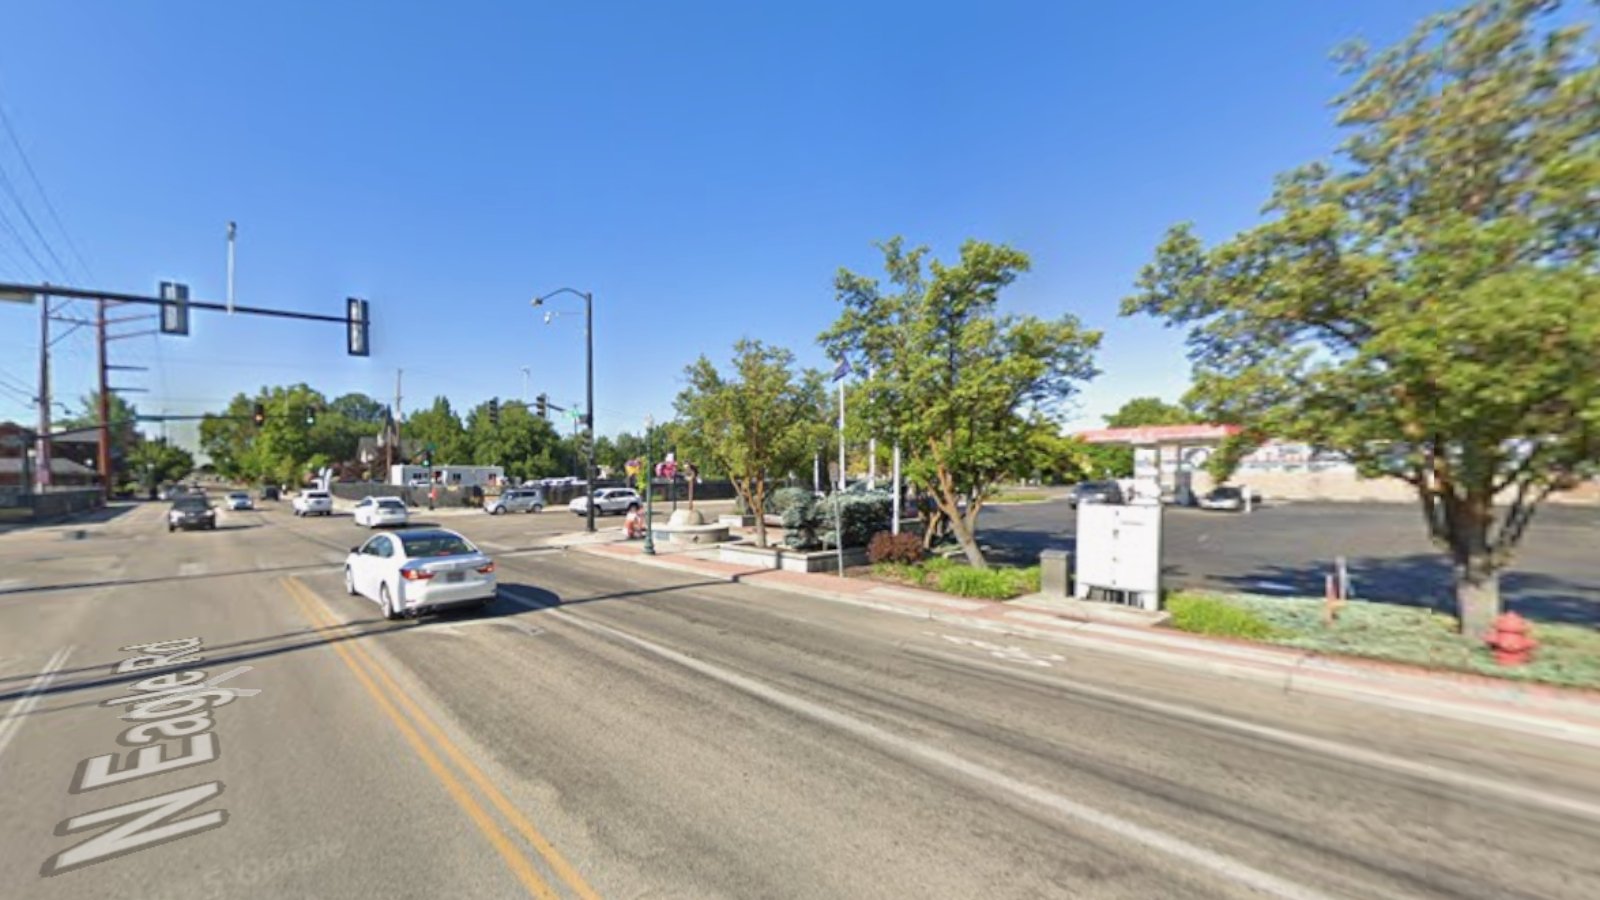
Eagle is one of the fastest-growing and most desirable suburbs of Boise. Known for its schools, upscale neighborhoods, and riverfront trails, it draws families and retirees alike. Home prices surged dramatically during the early 2020s, especially in 2022. Although prices dipped in 2023, recent years have seen recovery, suggesting Eagle’s long-term appeal remains strong. Its balance of natural beauty, urban access, and well-developed infrastructure keeps demand high.
7. Tetonia – 274% Home Price Increase Since 2011

- 2010: N/A
- 2011: $226,445
- 2012: $234,824 (+$8,379, +3.70% from previous year)
- 2013: $258,193 (+$23,369, +9.95% from previous year)
- 2014: $280,420 (+$22,228, +8.61% from previous year)
- 2015: $292,105 (+$11,685, +4.17% from previous year)
- 2016: $335,012 (+$42,906, +14.69% from previous year)
- 2017: $382,023 (+$47,011, +14.03% from previous year)
- 2018: $416,825 (+$34,802, +9.11% from previous year)
- 2019: $432,027 (+$15,202, +3.65% from previous year)
- 2020: N/A
- 2021: $620,949
- 2022: $814,680 (+$193,731, +31.20% from previous year)
- 2023: $755,908 (-$58,771, -7.21% from previous year)
- 2024: $821,820 (+$65,912, +8.72% from previous year)
- 2025: $847,509 (+$25,689, +3.13% from previous year)
Tetonia’s home prices have nearly quadrupled since 2011, with values increasing from $226,000 to more than $847,000 in 2025. While 2022 was a peak year, growth resumed quickly after a short correction, indicating sustained demand.
Tetonia – Quiet Teton Valley Boomtown
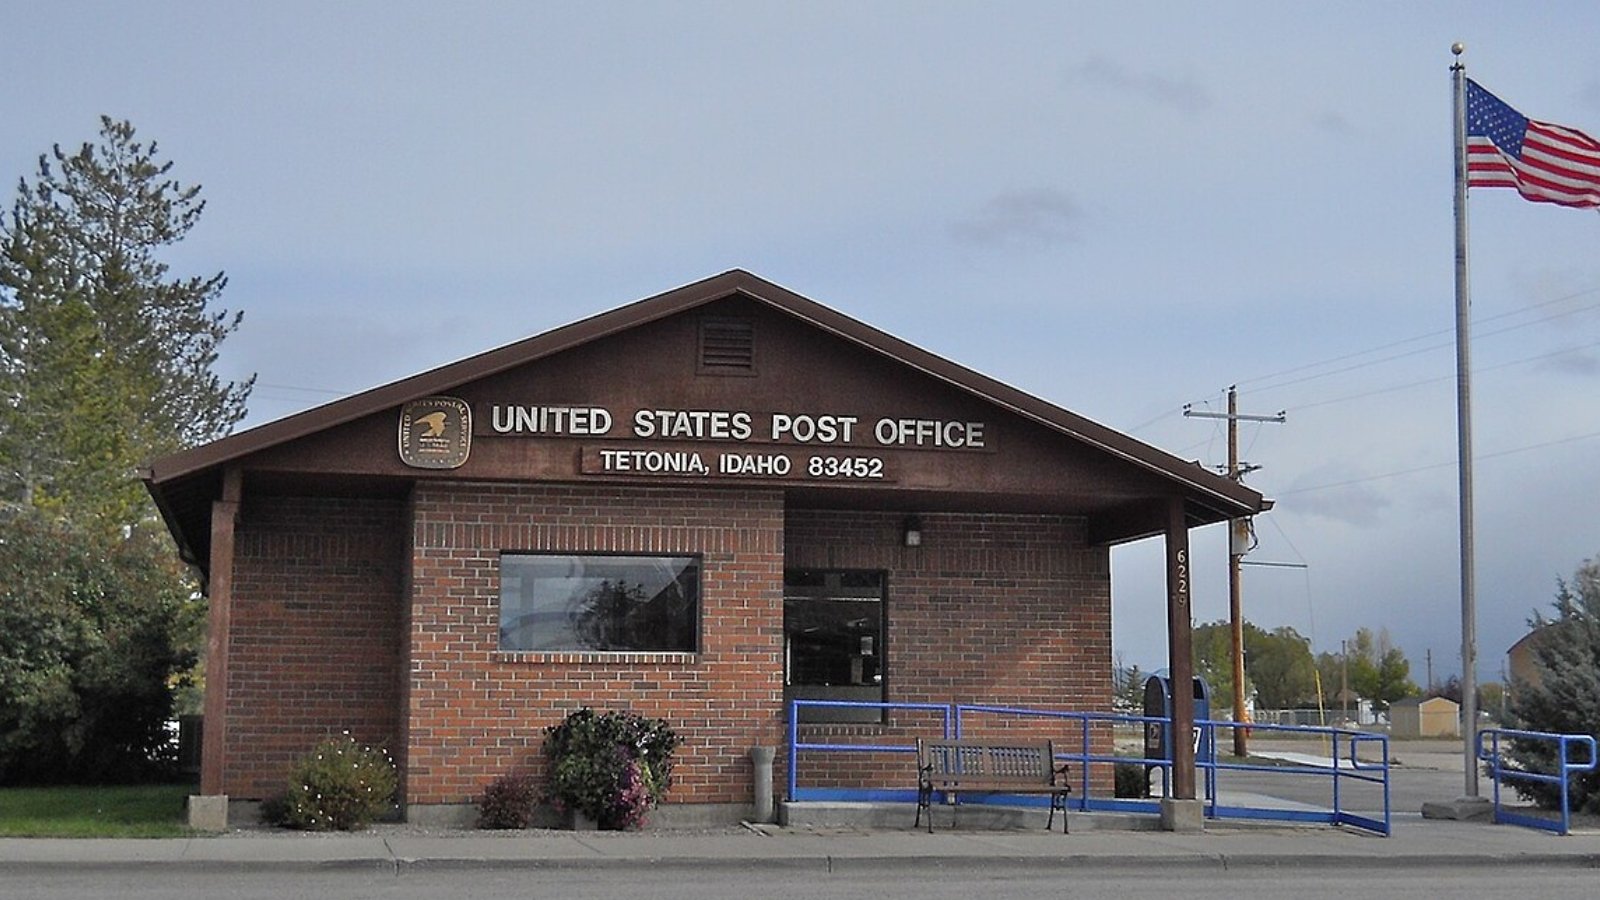
Tetonia sits in Idaho’s Teton Valley, west of the famous mountain range. It’s less crowded and less expensive than nearby Driggs or Jackson, but it offers many of the same benefits: scenic views, rural tranquility, and access to recreation. Prices have risen fast since the mid-2010s as more people discovered the area. The massive jump in 2022 reflected a rush of buyers, while recent years suggest a settling market with continued interest in this scenic outpost.
6. Victor – 246% Home Price Increase Since 2011

🔥 Would you like to save this?
- 2010: N/A
- 2011: $254,168
- 2012: $257,587 (+$3,419, +1.35% from previous year)
- 2013: $291,988 (+$34,401, +13.36% from previous year)
- 2014: $309,021 (+$17,034, +5.83% from previous year)
- 2015: $342,982 (+$33,960, +10.99% from previous year)
- 2016: $386,731 (+$43,749, +12.76% from previous year)
- 2017: $445,465 (+$58,734, +15.19% from previous year)
- 2018: $471,338 (+$25,873, +5.81% from previous year)
- 2019: $476,835 (+$5,497, +1.17% from previous year)
- 2020: N/A
- 2021: $660,825
- 2022: $870,677 (+$209,852, +31.76% from previous year)
- 2023: $815,761 (-$54,916, -6.31% from previous year)
- 2024: $866,400 (+$50,639, +6.21% from previous year)
- 2025: $879,994 (+$13,594, +1.57% from previous year)
Victor’s home values have grown from just over $254,000 in 2011 to nearly $880,000 in 2025. After a big leap in 2022, prices adjusted slightly before climbing again. The growth trend has been strong and steady over the past decade.
Victor – A Rising Star Near Jackson Hole
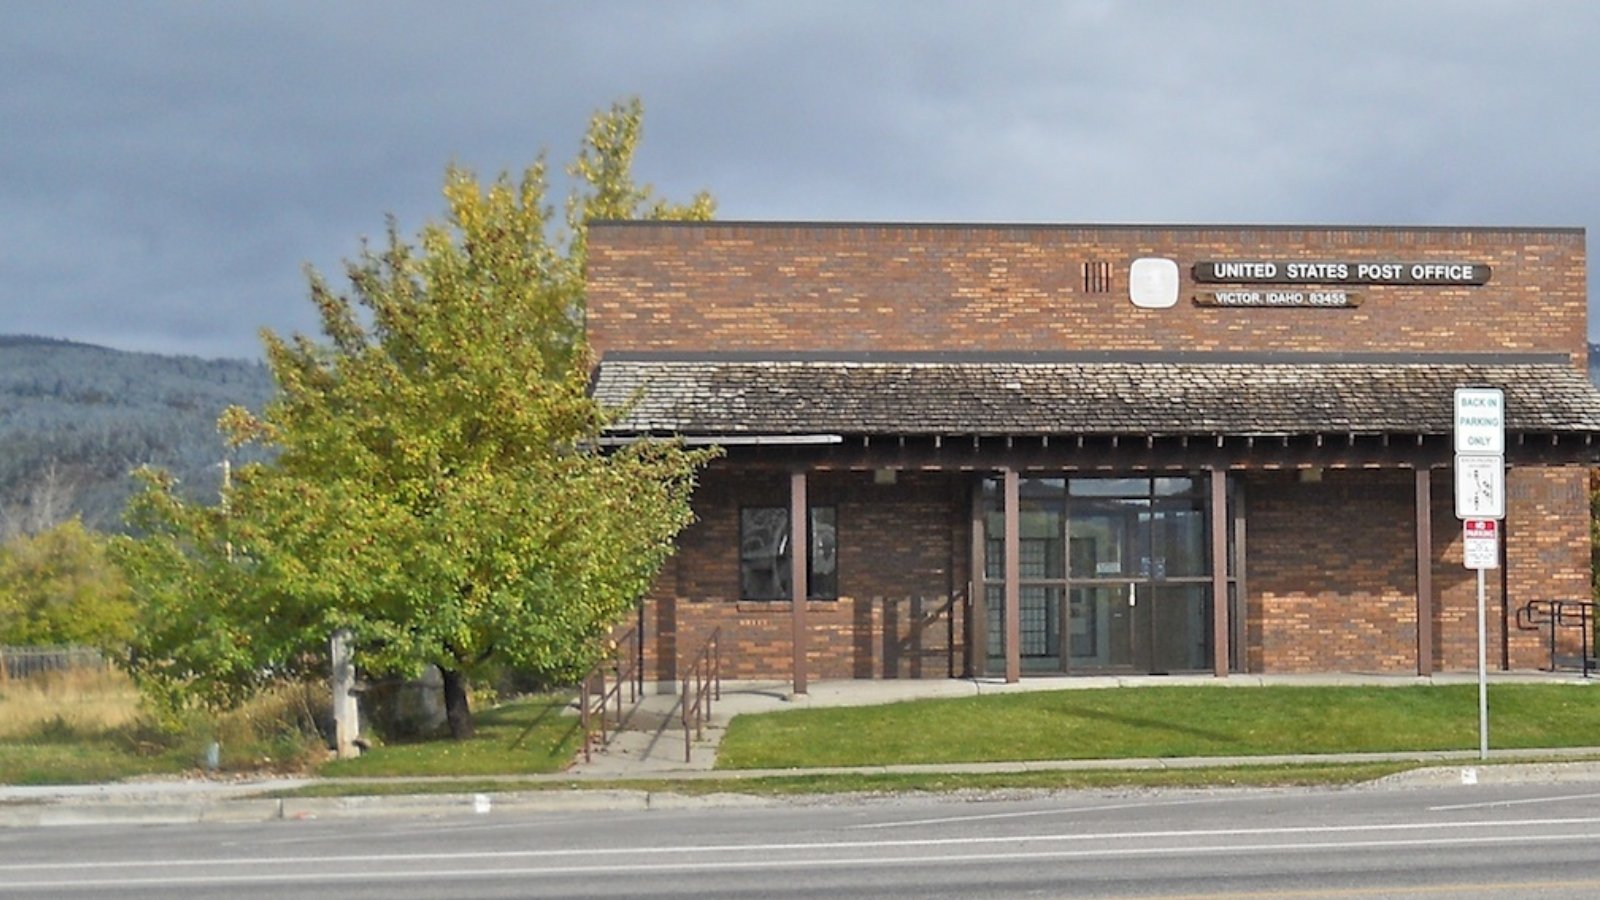
Victor is located in Teton County near the Wyoming border and serves as a more affordable option for those priced out of Jackson. Its proximity to Grand Teton National Park and world-class skiing makes it a magnet for outdoor enthusiasts. The town’s real estate market took off in the 2010s and exploded after 2020. While a price dip occurred in 2023, values have recovered and continue trending up as interest in the region remains high.
5. Harrison – 92% Home Price Increase Since 2010

- 2010: $493,897
- 2011: $360,051 (-$133,847, -27.10% from previous year)
- 2012: $338,086 (-$21,965, -6.10% from previous year)
- 2013: $353,991 (+$15,905, +4.70% from previous year)
- 2014: $367,408 (+$13,417, +3.79% from previous year)
- 2015: $393,039 (+$25,631, +6.98% from previous year)
- 2016: $406,813 (+$13,774, +3.50% from previous year)
- 2017: $405,046 (-$1,767, -0.43% from previous year)
- 2018: $443,815 (+$38,769, +9.57% from previous year)
- 2019: $481,117 (+$37,302, +8.40% from previous year)
- 2020: N/A
- 2021: $691,267
- 2022: $873,336 (+$182,069, +26.34% from previous year)
- 2023: $925,034 (+$51,698, +5.92% from previous year)
- 2024: $963,823 (+$38,789, +4.19% from previous year)
- 2025: $948,550 (-$15,273, -1.58% from previous year)
Despite early setbacks after 2010, Harrison’s home prices rebounded and reached nearly $950,000 in 2025. Much of the growth occurred after 2020, reflecting a broader surge in demand for lakeside property in northern Idaho.
Harrison – Rebounding From a Rocky Start
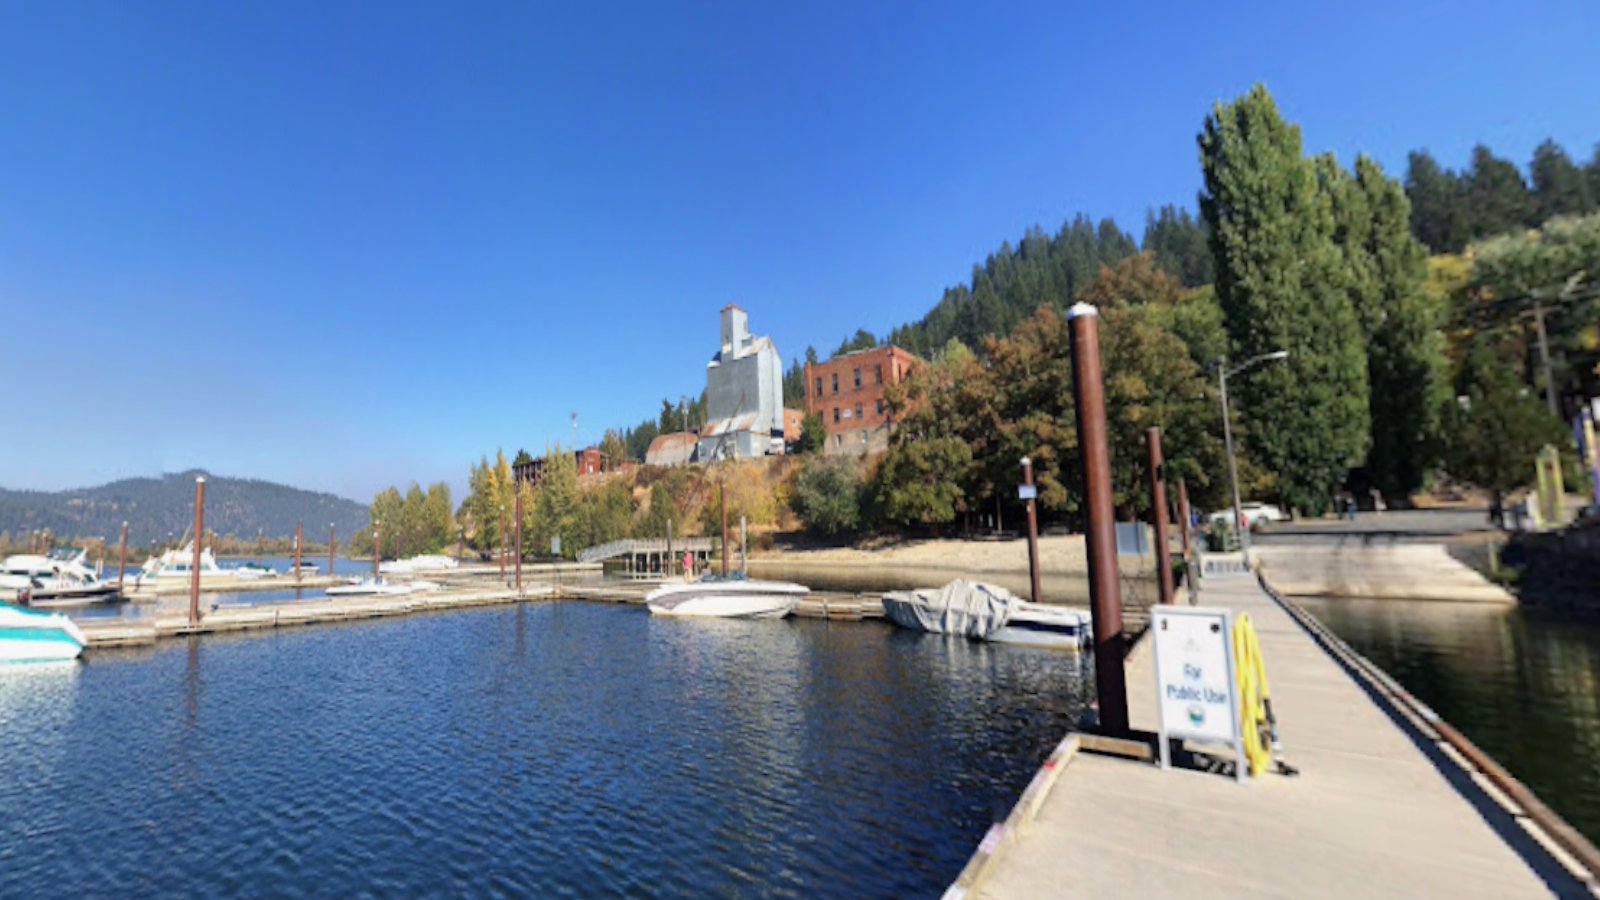
Harrison overlooks Lake Coeur d’Alene and offers stunning views, boating access, and a peaceful atmosphere. While prices fell sharply after 2010, the market stabilized and began rising steadily by the mid-2010s. The pandemic period brought a major boost, with 2022 marking the peak year. Though prices dipped slightly in 2025, the town remains among the priciest in the state thanks to its desirable waterfront setting and limited housing supply.
4. Coolin – 211% Home Price Increase Since 2010

- 2010: $317,544
- 2011: $303,282 (-$14,262, -4.49% from previous year)
- 2012: $334,861 (+$31,579, +10.41% from previous year)
- 2013: $351,085 (+$16,225, +4.85% from previous year)
- 2014: $373,687 (+$22,602, +6.44% from previous year)
- 2015: $421,070 (+$47,383, +12.68% from previous year)
- 2016: $476,372 (+$55,302, +13.13% from previous year)
- 2017: $481,834 (+$5,462, +1.15% from previous year)
- 2018: $526,895 (+$45,062, +9.35% from previous year)
- 2019: $545,041 (+$18,145, +3.44% from previous year)
- 2020: N/A
- 2021: $761,795
- 2022: $991,804 (+$230,009, +30.19% from previous year)
- 2023: $922,574 (-$69,230, -6.98% from previous year)
- 2024: $995,601 (+$73,027, +7.92% from previous year)
- 2025: $986,000 (-$9,601, -0.96% from previous year)
Coolin’s home prices have more than tripled since 2010, moving from just over $317,000 to $986,000 by 2025. The biggest spike occurred in 2022, with a 30% year-over-year increase. While values dipped slightly in 2023 and again in 2025, prices remain near all-time highs.
Coolin – High Demand for Lakeside Real Estate
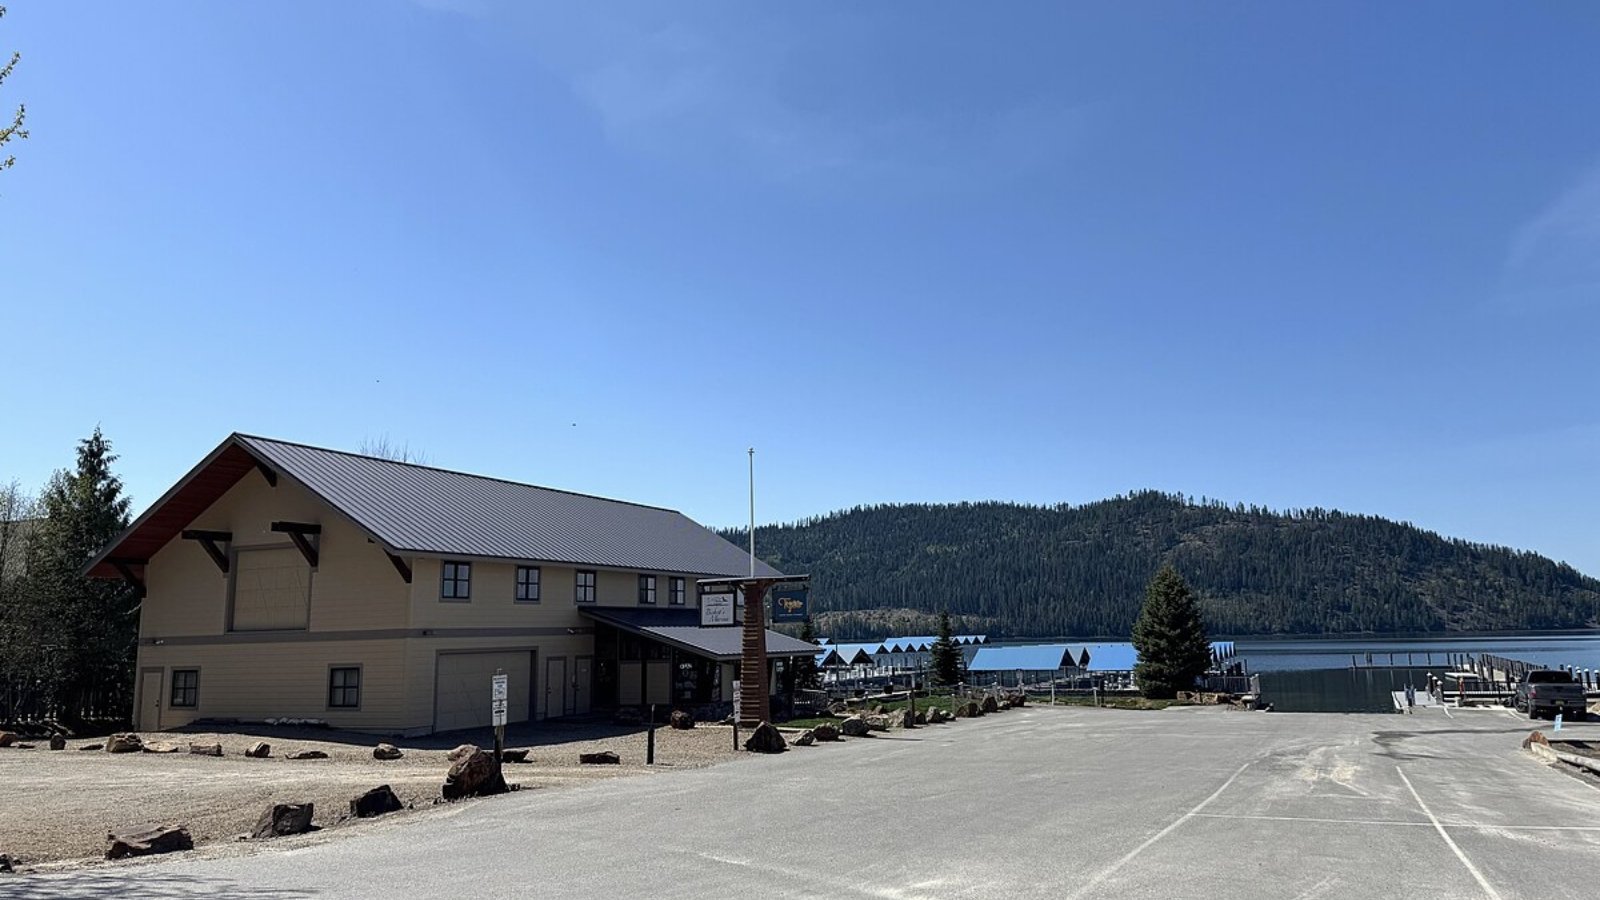
Coolin is located on the southern end of Priest Lake in northern Idaho, a region known for pristine waters, cabins, and vacation homes. The town has long been a destination for seasonal residents and those seeking seclusion. As remote work grew more common, Coolin became more than a summer destination. The enormous surge in 2022 reflects this trend. Despite minor pullbacks in later years, Coolin remains one of Idaho’s most expensive markets in 2025 due to its tight inventory and highly desirable setting.
3. Hayden Lake – 160% Home Price Increase Since 2010

- 2010: $394,748
- 2011: $319,780 (-$74,968, -18.99% from previous year)
- 2012: $318,588 (-$1,192, -0.37% from previous year)
- 2013: $343,152 (+$24,565, +7.71% from previous year)
- 2014: $379,913 (+$36,761, +10.71% from previous year)
- 2015: $395,492 (+$15,579, +4.10% from previous year)
- 2016: $423,433 (+$27,941, +7.06% from previous year)
- 2017: $458,226 (+$34,793, +8.22% from previous year)
- 2018: $499,900 (+$41,675, +9.09% from previous year)
- 2019: $534,741 (+$34,841, +6.97% from previous year)
- 2020: N/A
- 2021: $738,002
- 2022: $969,668 (+$231,666, +31.39% from previous year)
- 2023: $986,025 (+$16,357, +1.69% from previous year)
- 2024: $1,011,543 (+$25,518, +2.59% from previous year)
- 2025: $1,026,982 (+$15,439, +1.53% from previous year)
Home prices in Hayden Lake rose from under $400,000 in 2010 to more than $1 million in 2025. Although the town experienced a dip in the early 2010s, it rebounded strongly. The biggest spike came in 2022, and values have continued to edge up since.
Hayden Lake – North Idaho Luxury Continues to Thrive
Hayden Lake, in Kootenai County, is one of the most exclusive residential areas in northern Idaho. Its waterfront homes and golf course communities attract affluent buyers from across the country. The strong price rise in 2022 coincides with broader demand for resort-style living and larger homes. Continued growth in the following years points to long-term strength in the local housing market. As of 2025, Hayden Lake ranks among the priciest places to buy property in the state.
2. Sun Valley – 150% Home Price Increase Since 2010
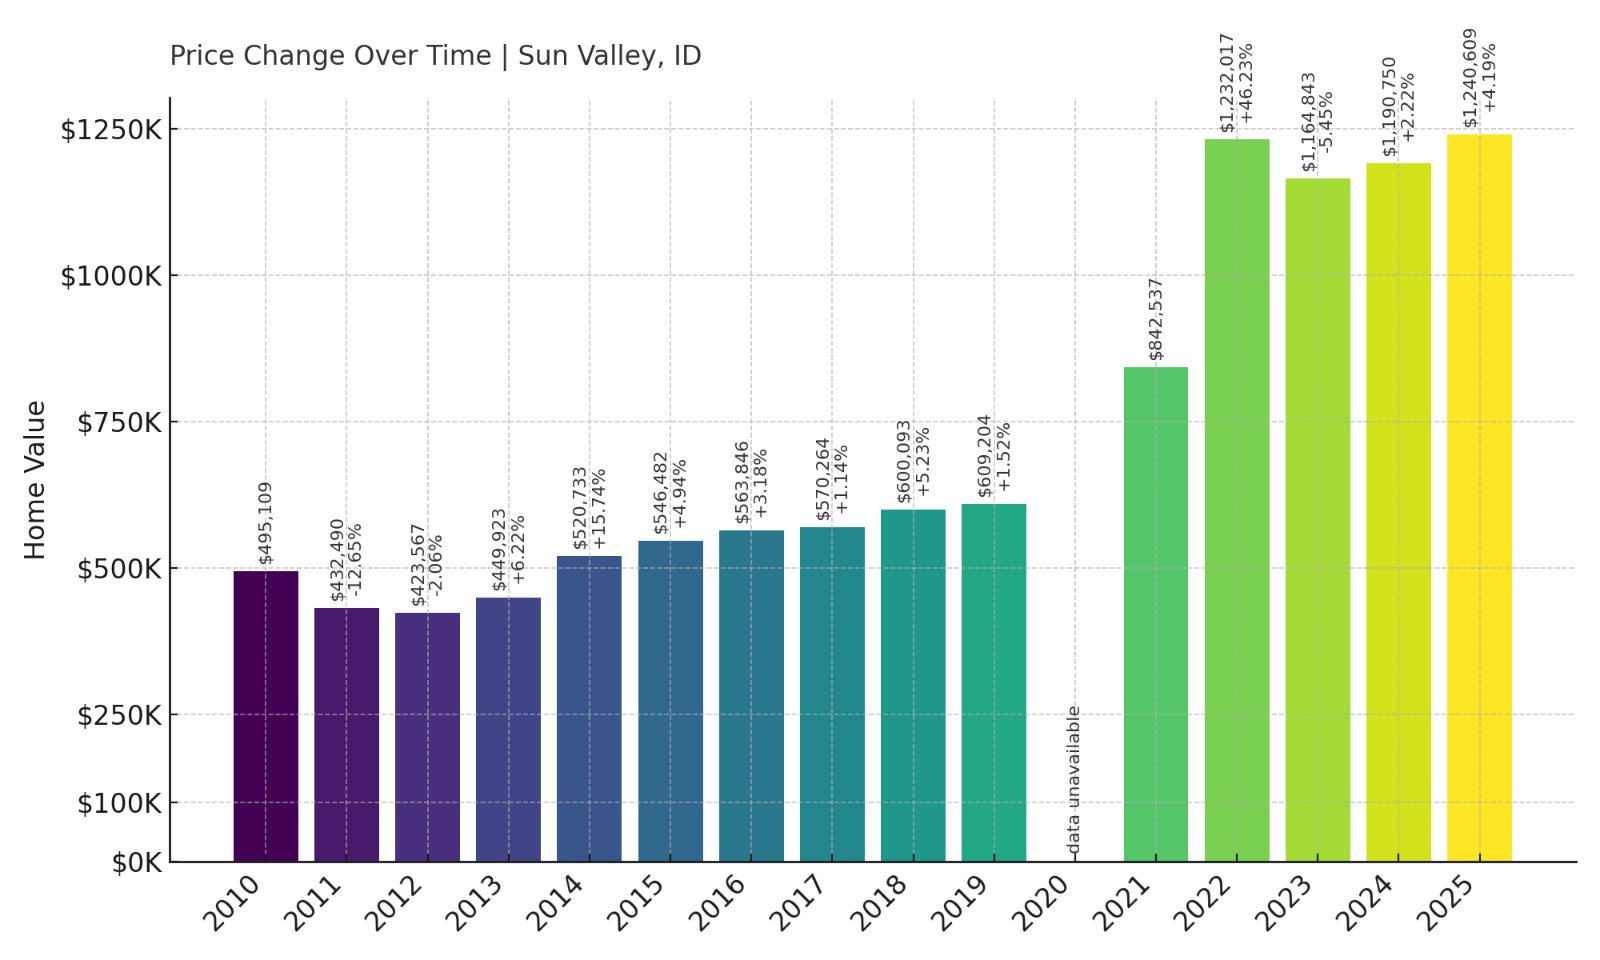
- 2010: $495,109
- 2011: $432,490 (-$62,619, -12.65% from previous year)
- 2012: $423,567 (-$8,923, -2.06% from previous year)
- 2013: $449,923 (+$26,356, +6.22% from previous year)
- 2014: $520,733 (+$70,810, +15.74% from previous year)
- 2015: $546,482 (+$25,749, +4.94% from previous year)
- 2016: $563,846 (+$17,364, +3.18% from previous year)
- 2017: $570,264 (+$6,418, +1.14% from previous year)
- 2018: $600,093 (+$29,829, +5.23% from previous year)
- 2019: $609,204 (+$9,111, +1.52% from previous year)
- 2020: N/A
- 2021: $842,537
- 2022: $1,232,017 (+$389,480, +46.23% from previous year)
- 2023: $1,164,843 (-$67,174, -5.45% from previous year)
- 2024: $1,190,750 (+$25,907, +2.22% from previous year)
- 2025: $1,240,609 (+$49,859, +4.19% from previous year)
Sun Valley’s home prices have soared from $495,000 in 2010 to over $1.24 million in 2025. The town saw a major boost in 2022, with prices rising more than 46% in a single year. Though prices briefly dipped in 2023, growth has resumed steadily.
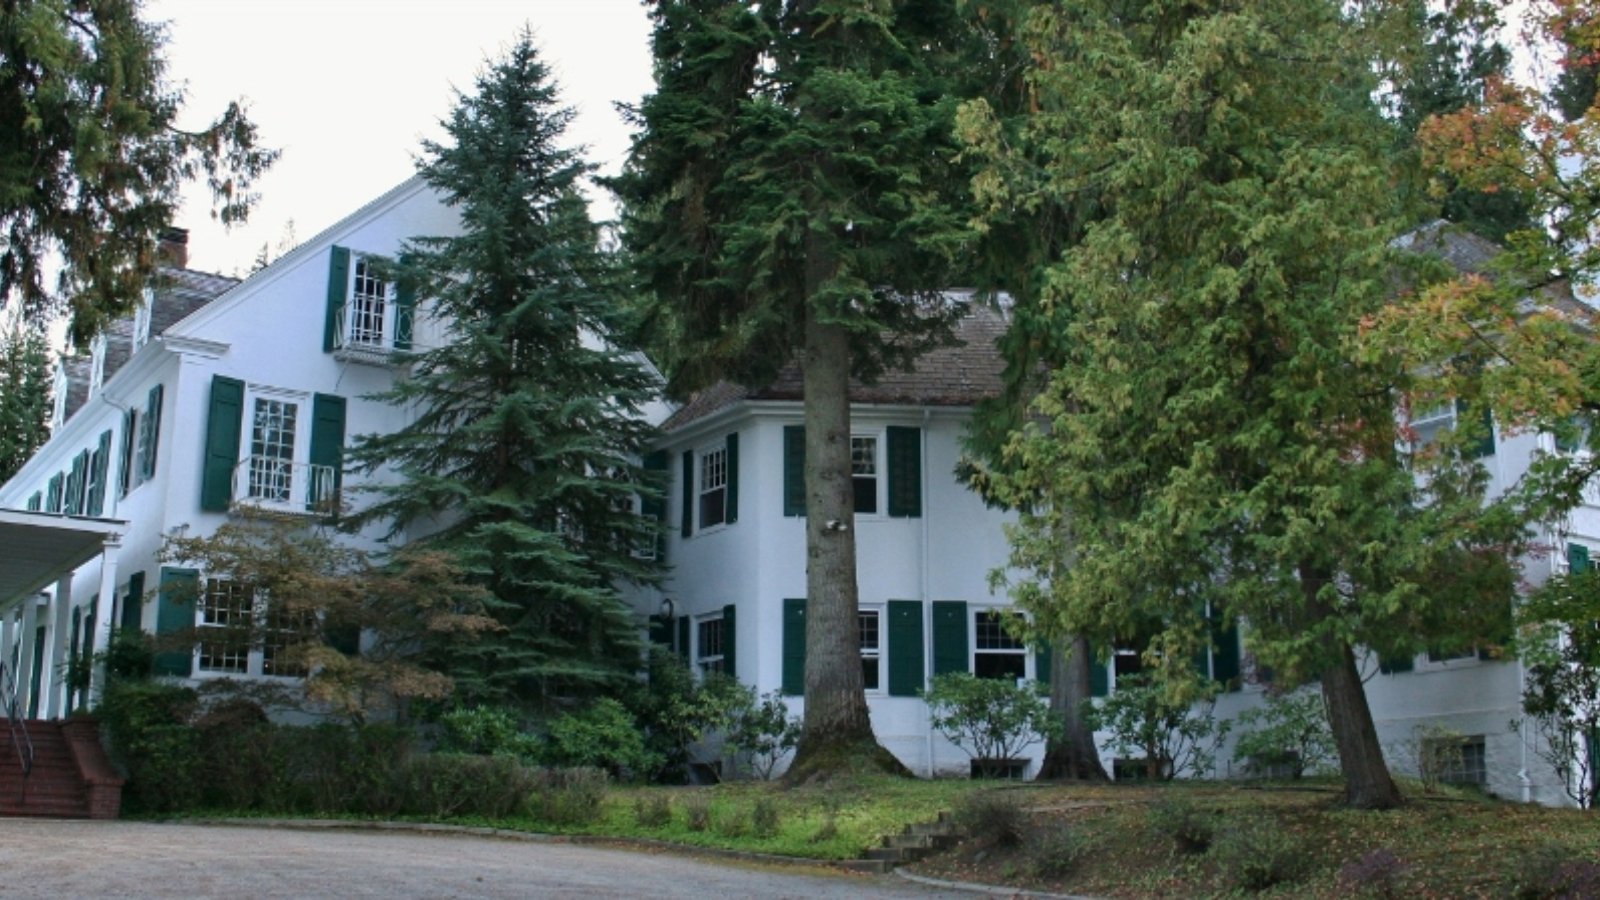
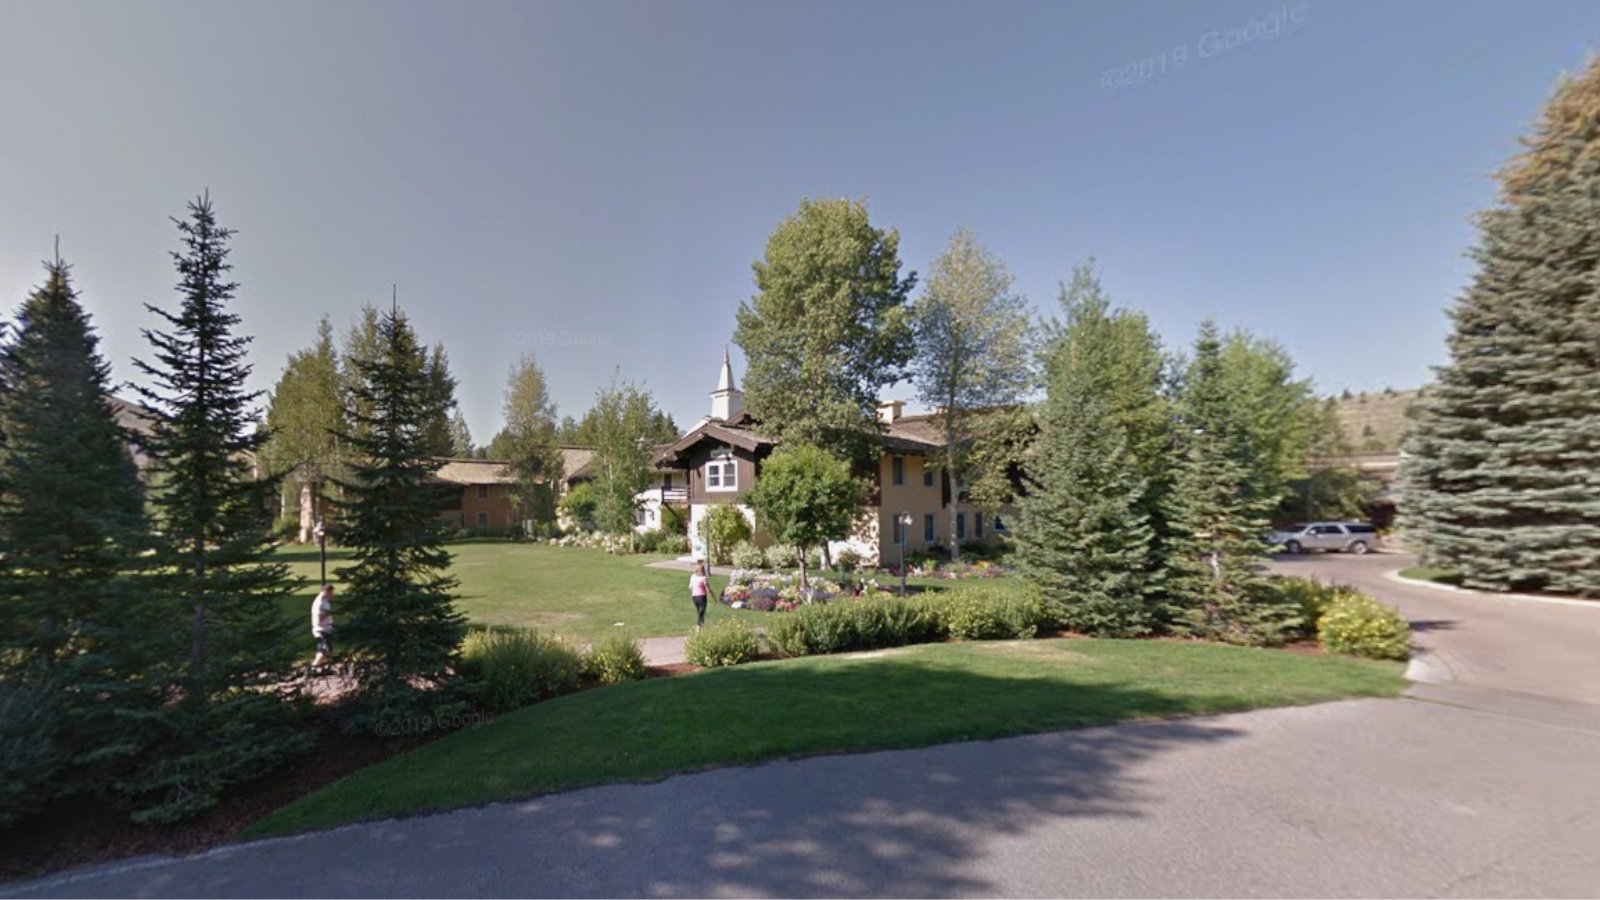
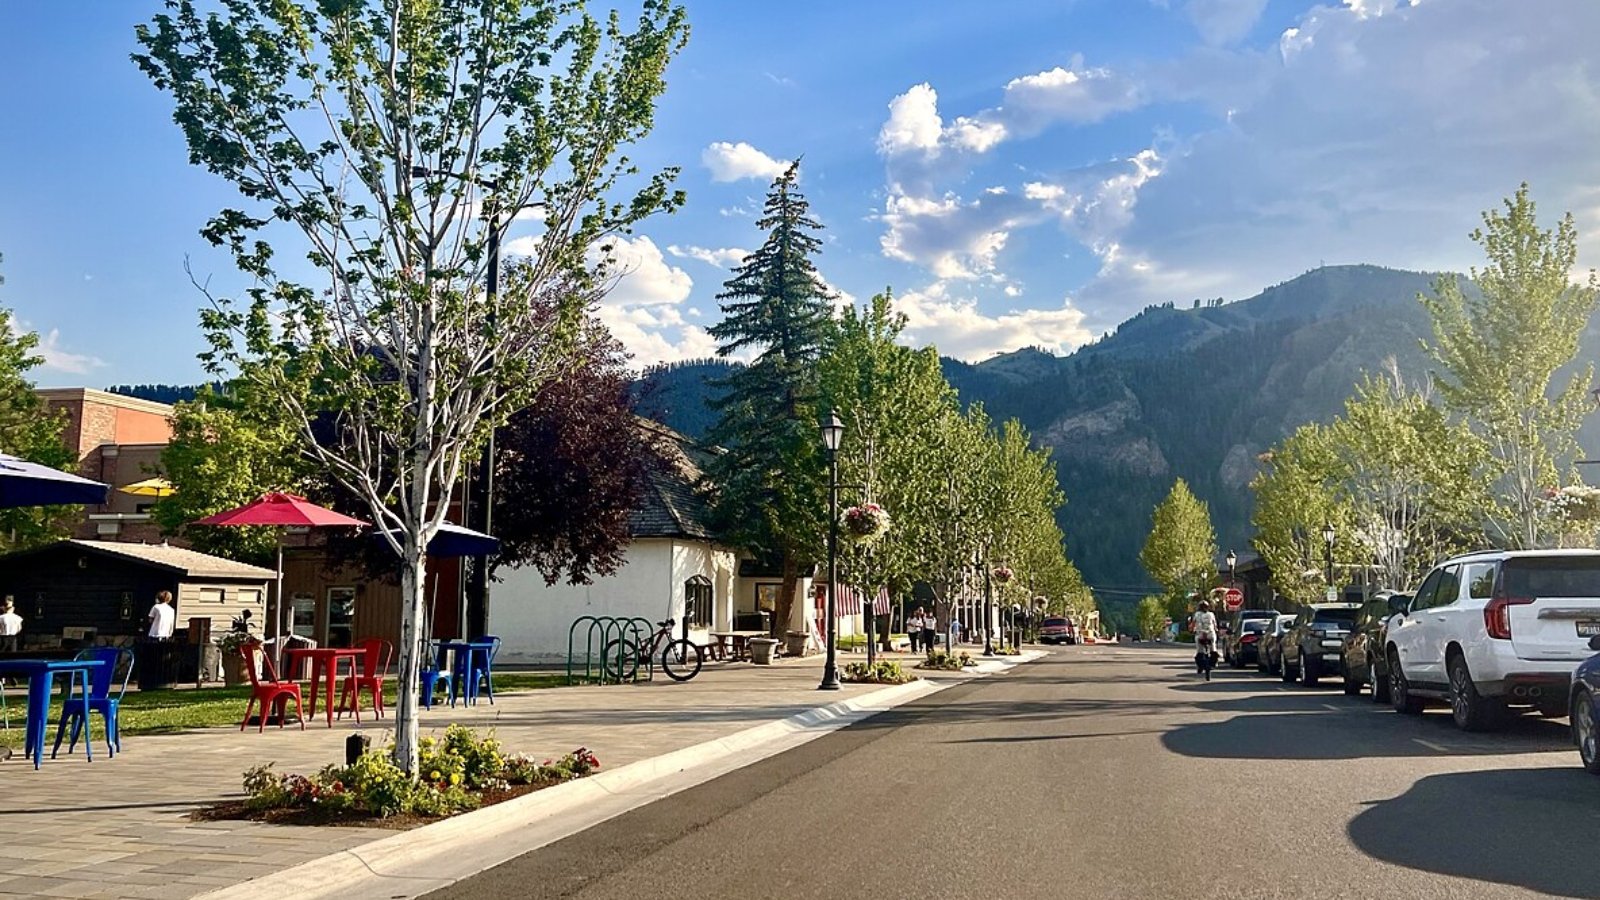
Sun Valley – Idaho’s Iconic Resort Town Stays Hot
🔥 Would you like to save this?
Sun Valley has long been synonymous with luxury and mountain recreation. Known for its ski slopes, culture, and celebrity visitors, the town commands some of the highest real estate prices in the state. The massive surge in 2022 was part of a broader trend among high-end resort towns across the U.S. Even after a modest cooling, prices remain firmly above $1.2 million in 2025. With its enduring appeal, Sun Valley is likely to stay among the most expensive housing markets in the state for years to come.
1. Ketchum – 138% Home Price Increase Since 2010

- 2010: $633,190
- 2011: $534,565 (-$98,626, -15.58% from previous year)
- 2012: $517,918 (-$16,647, -3.11% from previous year)
- 2013: $535,871 (+$17,953, +3.47% from previous year)
- 2014: $597,915 (+$62,044, +11.58% from previous year)
- 2015: $636,668 (+$38,753, +6.48% from previous year)
- 2016: $668,566 (+$31,899, +5.01% from previous year)
- 2017: $687,918 (+$19,351, +2.89% from previous year)
- 2018: $745,044 (+$57,127, +8.30% from previous year)
- 2019: $739,142 (-$5,903, -0.79% from previous year)
- 2020: N/A
- 2021: $1,000,828
- 2022: $1,422,247 (+$421,419, +42.11% from previous year)
- 2023: $1,371,405 (-$50,842, -3.57% from previous year)
- 2024: $1,486,085 (+$114,680, +8.36% from previous year)
- 2025: $1,505,952 (+$19,866, +1.34% from previous year)
Ketchum has seen prices rise from about $633,000 in 2010 to over $1.5 million in 2025. The largest increase came in 2022, with a 42% year-over-year gain. Even after minor fluctuations, values have continued to climb, keeping Ketchum at the top of Idaho’s most expensive housing markets.
Ketchum – Idaho’s Premier Real Estate Destination
Adjacent to Sun Valley, Ketchum blends historic charm with high-end living. Its galleries, restaurants, and trail access make it both a year-round community and a resort haven. The market here skyrocketed after 2020, especially in 2022, as luxury homebuyers expanded their search for scenic second homes. By 2025, the average home value tops $1.5 million, earning Ketchum the number one spot on this list. With continued investment and limited land for development, prices are likely to remain elevated for the foreseeable future.


