
🔥 Would you like to save this?
The Zillow Home Value Index shows a clear trend: Washington home prices are up—but not everywhere. While the spotlight stays on pricey cities like Seattle and Bellevue, there are still pockets of affordability tucked into smaller, lesser-known towns. These 18 communities defy the state’s high-cost reputation, offering lower prices, long-term stability, and small-town charm. Whether you’re after peace, space, or just a better deal, these hidden gems prove you don’t need deep pockets to buy a home in the Evergreen State.
18. Northport – 184% Home Price Increase Since 2011

- 2010: N/A
- 2011: $86,550
- 2012: $94,542 (+$7,992, +9.23% from previous year)
- 2013: $92,007 (-$2,535, -2.68% from previous year)
- 2014: $108,848 (+$16,841, +18.30% from previous year)
- 2015: $107,625 (-$1,223, -1.12% from previous year)
- 2016: $120,076 (+$12,451, +11.57% from previous year)
- 2017: $109,982 (-$10,094, -8.41% from previous year)
- 2018: $112,069 (+$2,087, +1.90% from previous year)
- 2019: $134,966 (+$22,897, +20.43% from previous year)
- 2020: N/A
- 2021: $189,454
- 2022: $212,973 (+$23,519, +12.41% from previous year)
- 2023: $212,801 (-$172, -0.08% from previous year)
- 2024: $229,227 (+$16,426, +7.72% from previous year)
- 2025: $246,330 (+$17,103, +7.46% from previous year)
Northport – A Remote Frontier with Affordable Prices

Northport, located near the Canadian border in Stevens County, is one of the most affordable towns in the entire state. Despite being remote, the town has experienced substantial price growth, with home values jumping from just $86,550 in 2011 to $246,330 in 2025. The nearly 184% increase reflects slow but steady interest from buyers looking for quiet, rural living away from major metropolitan areas.
In order to come up with the very specific design ideas, we create most designs with the assistance of state-of-the-art AI interior design software. Also, assume links that take you off the site are affiliate links such as links to Amazon. this means we may earn a commission if you buy something.
Set along the Columbia River, Northport offers a rugged, scenic lifestyle that appeals to outdoor enthusiasts. Its affordability stands in sharp contrast to skyrocketing prices in the western half of the state, and even after all the gains, it’s still well below the state median. Infrastructure remains basic, but for buyers who value space and solitude, Northport presents a compelling option.
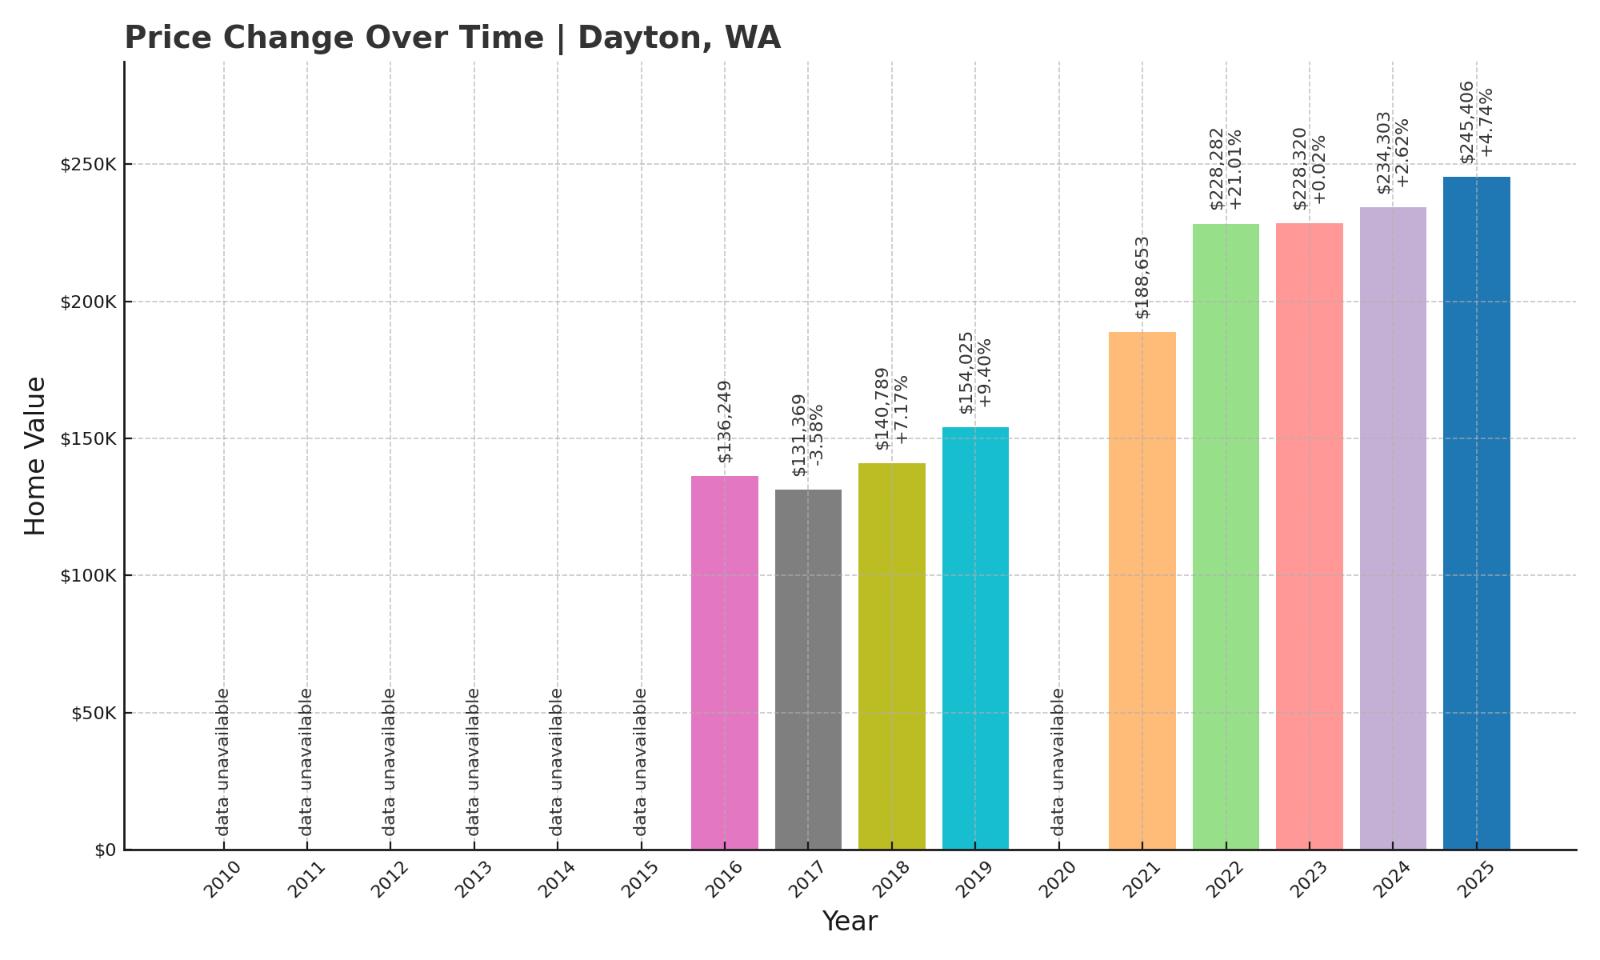
17. Dayton – 80% Home Price Increase Since 2016
- 2010: N/A
- 2011: N/A
- 2012: N/A
- 2013: N/A
- 2014: N/A
- 2015: N/A
- 2016: $136,249
- 2017: $131,369 (-$4,880, -3.58% from previous year)
- 2018: $140,789 (+$9,420, +7.17% from previous year)
- 2019: $154,025 (+$13,235, +9.40% from previous year)
- 2020: N/A
- 2021: $188,653
- 2022: $228,282 (+$39,629, +21.01% from previous year)
- 2023: $228,320 (+$38, +0.02% from previous year)
- 2024: $234,303 (+$5,982, +2.62% from previous year)
- 2025: $245,406 (+$11,103, +4.74% from previous year)
Dayton – Small-Town Charm in Southeastern Washington

Dayton sits in Columbia County, tucked into the agricultural plains of southeastern Washington. With 2025 home values at $245,406, it’s still among the cheapest places in the state, even after prices jumped nearly 80% since 2016. Most of that growth came post-2020, with sharp increases during the pandemic years.
The town is known for its well-preserved downtown and quiet pace of life. Though it’s isolated compared to the bustling I-5 corridor, Dayton offers essential amenities, access to hiking and wine country, and a strong sense of history. Its housing market remains attractive to buyers priced out of larger regional cities like Walla Walla or Spokane.
16. Metaline Falls – 87% Home Price Increase Since 2017

- 2010: N/A
- 2011: N/A
- 2012: N/A
- 2013: N/A
- 2014: N/A
- 2015: N/A
- 2016: N/A
- 2017: $129,254
- 2018: $140,013 (+$10,760, +8.32% from previous year)
- 2019: $148,702 (+$8,689, +6.21% from previous year)
- 2020: N/A
- 2021: $195,370
- 2022: $225,815 (+$30,444, +15.58% from previous year)
- 2023: $225,831 (+$17, +0.01% from previous year)
- 2024: $221,941 (-$3,890, -1.72% from previous year)
- 2025: $241,438 (+$19,497, +8.78% from previous year)
Metaline Falls – Quiet Wilderness, Modest Housing

Located in Pend Oreille County near the Idaho border, Metaline Falls is a former mining town surrounded by forests and mountains. Home values have increased 87% since 2017, reaching $241,438 in 2025, yet prices are still low for Washington state. Unlike the major metro regions, growth here has been steadier and less volatile.
The town’s appeal lies in its isolation and outdoor access. With fewer than 300 residents, it offers peace and seclusion in abundance. The economy is small and tourism-dependent, but for retirees or remote workers looking for affordability in a beautiful setting, Metaline Falls holds promise.
15. Tekoa – 119% Home Price Increase Since 2016

- 2010: N/A
- 2011: N/A
- 2012: N/A
- 2013: N/A
- 2014: N/A
- 2015: N/A
- 2016: $109,617
- 2017: $110,183 (+$566, +0.52% from previous year)
- 2018: $125,199 (+$15,017, +13.63% from previous year)
- 2019: $141,665 (+$16,466, +13.15% from previous year)
- 2020: N/A
- 2021: $186,539
- 2022: $224,158 (+$37,620, +20.17% from previous year)
- 2023: $229,346 (+$5,188, +2.31% from previous year)
- 2024: $236,902 (+$7,555, +3.29% from previous year)
- 2025: $239,708 (+$2,806, +1.18% from previous year)
Tekoa – Rural and Rising in the Palouse

Tekoa lies in Whitman County, part of the rolling Palouse farmland in eastern Washington. It’s a quintessential small town with agricultural roots and scenic views. Home prices have risen over 119% since 2016, but the median value in 2025 remains just $239,708.
The growth reflects gradual interest from regional buyers and those seeking lower-cost alternatives to Pullman or Spokane. Tekoa’s historic buildings and calm surroundings have drawn some new residents, but it retains its rural feel and affordability, especially for first-time buyers or retirees.
14. Ritzville – 146% Home Price Increase Since 2010

- 2010: $97,256
- 2011: $93,778 (-$3,479, -3.58% from previous year)
- 2012: $93,470 (-$308, -0.33% from previous year)
- 2013: $92,233 (-$1,237, -1.32% from previous year)
- 2014: $92,100 (-$133, -0.14% from previous year)
- 2015: $93,028 (+$927, +1.01% from previous year)
- 2016: $97,463 (+$4,435, +4.77% from previous year)
- 2017: $102,491 (+$5,028, +5.16% from previous year)
- 2018: $112,348 (+$9,857, +9.62% from previous year)
- 2019: $127,338 (+$14,990, +13.34% from previous year)
- 2020: N/A
- 2021: $185,006
- 2022: $226,781 (+$41,776, +22.58% from previous year)
- 2023: $231,108 (+$4,326, +1.91% from previous year)
- 2024: $231,365 (+$257, +0.11% from previous year)
- 2025: $239,150 (+$7,785, +3.36% from previous year)
Ritzville – Historic Agriculture Hub with Steady Gains

In the heart of wheat country, Ritzville is the seat of Adams County and has long been a center of farming in eastern Washington. Home prices in the town have climbed 146% since 2010, reaching $239,150 in 2025—still well below state averages.
Ritzville offers a well-preserved historic downtown, easy access to I-90, and a strong sense of community. The steady price appreciation reflects both improved infrastructure and renewed interest in small-town living. For buyers seeking quiet and affordability, Ritzville is a standout choice in central Washington.
13. Mansfield – 166% Home Price Increase Since 2014

- 2010: N/A
- 2011: N/A
- 2012: N/A
- 2013: N/A
- 2014: $88,928
- 2015: $97,423 (+$8,495, +9.55% from previous year)
- 2016: $97,989 (+$565, +0.58% from previous year)
- 2017: $102,989 (+$5,001, +5.10% from previous year)
- 2018: $125,454 (+$22,464, +21.81% from previous year)
- 2019: $143,358 (+$17,904, +14.27% from previous year)
- 2020: N/A
- 2021: $193,888
- 2022: $225,072 (+$31,184, +16.08% from previous year)
- 2023: $223,888 (-$1,185, -0.53% from previous year)
- 2024: $225,468 (+$1,580, +0.71% from previous year)
- 2025: $236,770 (+$11,303, +5.01% from previous year)
Mansfield – A High Plateau Town with Big Price Gains

Perched in north-central Washington’s wheat country, Mansfield has quietly seen home values jump by 166% since 2014. While growth has leveled off somewhat in the last two years, the 2025 price of $236,770 still marks a major climb from its sub-$90K levels a decade ago.
Its location in Douglas County offers sweeping farmland views, minimal traffic, and peace—plus one of the lowest costs of living in the region. Infrastructure is sparse, but those drawn to open landscapes and quiet living have helped drive this small town’s steady appreciation.
12. Tonasket – 100% Home Price Increase Since 2010

🔥 Would you like to save this?
- 2010: $118,174
- 2011: $112,121 (-$6,053, -5.12% from previous year)
- 2012: $109,762 (-$2,359, -2.10% from previous year)
- 2013: $117,867 (+$8,105, +7.38% from previous year)
- 2014: $118,385 (+$518, +0.44% from previous year)
- 2015: $120,745 (+$2,361, +1.99% from previous year)
- 2016: $129,506 (+$8,761, +7.26% from previous year)
- 2017: $137,910 (+$8,404, +6.49% from previous year)
- 2018: $145,403 (+$7,493, +5.43% from previous year)
- 2019: $155,361 (+$9,958, +6.85% from previous year)
- 2020: N/A
- 2021: $200,112
- 2022: $233,225 (+$33,114, +16.55% from previous year)
- 2023: $221,787 (-$11,438, -4.90% from previous year)
- 2024: $226,177 (+$4,390, +1.98% from previous year)
- 2025: $236,101 (+$9,924, +4.39% from previous year)
Tonasket – Gateway to the Okanogan Highlands

Located in Okanogan County, Tonasket is a rural community nestled between mountains, forests, and farms. Despite its modest size, its home prices have doubled since 2010. After a brief dip in 2023, prices rebounded again in 2024 and 2025, reaching $236,101 this year.
The town is known for its self-sufficiency and connection to the land. Many residents are small-scale farmers, artists, or retirees seeking solitude. The recent price growth underscores a rising interest in areas that offer affordability without sacrificing scenery and outdoor access.
11. Rosalia – 142% Home Price Increase Since 2016

- 2010: N/A
- 2011: N/A
- 2012: N/A
- 2013: N/A
- 2014: N/A
- 2015: N/A
- 2016: $97,133
- 2017: $106,717 (+$9,584, +9.87% from previous year)
- 2018: $125,895 (+$19,178, +17.97% from previous year)
- 2019: $142,027 (+$16,132, +12.81% from previous year)
- 2020: N/A
- 2021: $182,538
- 2022: $225,909 (+$43,370, +23.76% from previous year)
- 2023: $244,779 (+$18,870, +8.35% from previous year)
- 2024: $248,392 (+$3,613, +1.48% from previous year)
- 2025: $235,306 (-$13,086, -5.27% from previous year)
Rosalia – Pastoral Views and Pandemic-Era Surge

Rosalia, located in the Palouse region, saw explosive growth in the early 2020s as remote work allowed more people to relocate to smaller towns. Between 2016 and 2025, home values increased over 140%, reaching $235,306 this year—even with a drop from 2024 levels.
Though the recent dip may signal a cooling period, Rosalia remains affordable and appealing for buyers priced out of Spokane. The rolling hills and farmland make it ideal for those seeking a slower pace, and its housing stock offers room to grow for young families and retirees alike.
10. Concrete – 208% Home Price Increase Since 2010

- 2010: $76,159
- 2011: $71,121 (-$5,038, -6.62% from previous year)
- 2012: $69,005 (-$2,116, -2.98% from previous year)
- 2013: $70,841 (+$1,836, +2.66% from previous year)
- 2014: $76,392 (+$5,551, +7.84% from previous year)
- 2015: $82,177 (+$5,785, +7.57% from previous year)
- 2016: $97,156 (+$14,978, +18.23% from previous year)
- 2017: $111,265 (+$14,109, +14.52% from previous year)
- 2018: $129,035 (+$17,770, +15.97% from previous year)
- 2019: $140,493 (+$11,457, +8.88% from previous year)
- 2020: N/A
- 2021: $198,075
- 2022: $233,563 (+$35,488, +17.92% from previous year)
- 2023: $225,922 (-$7,641, -3.27% from previous year)
- 2024: $231,574 (+$5,652, +2.50% from previous year)
- 2025: $234,935 (+$3,361, +1.45% from previous year)
Concrete – Rugged Beauty and Rebounding Prices

With its name derived from the nearby cement industry, Concrete is tucked into the North Cascades foothills and boasts one of the most striking natural backdrops in the state. Home values have surged 208% since 2010, landing at $234,935 in 2025.
The town saw especially strong appreciation during the pandemic, as buyers turned to affordable, rural towns within reach of western Washington’s urban centers. While price growth slowed recently, the long-term trend suggests that interest in Concrete—and places like it—remains strong among those seeking affordability near adventure.
9. Bridgeport – 115% Home Price Increase Since 2013

- 2010: N/A
- 2011: N/A
- 2012: N/A
- 2013: $108,852
- 2014: $110,780 (+$1,928, +1.77% from previous year)
- 2015: $121,181 (+$10,402, +9.39% from previous year)
- 2016: $129,111 (+$7,930, +6.54% from previous year)
- 2017: $139,301 (+$10,189, +7.89% from previous year)
- 2018: $161,271 (+$21,971, +15.77% from previous year)
- 2019: $180,013 (+$18,741, +11.62% from previous year)
- 2020: N/A
- 2021: $220,471
- 2022: $233,252 (+$12,781, +5.80% from previous year)
- 2023: $225,609 (-$7,642, -3.28% from previous year)
- 2024: $234,300 (+$8,690, +3.85% from previous year)
- 2025: $234,535 (+$235, +0.10% from previous year)
Bridgeport – Eastern Washington Affordability with Strong Gains

Bridgeport sits along the Columbia River in Douglas County and has benefited from consistent home value growth since 2013. Prices rose from just over $100,000 to $234,535 in 2025—a 115% increase over 12 years.
Though price growth slowed significantly in 2023 and 2025 saw only a slight gain, Bridgeport continues to offer one of the lowest cost options in the state. The nearby Chief Joseph Dam and access to outdoor recreation make it an attractive choice for those seeking a mix of affordability and natural amenities.
8. Coulee Dam – 111% Home Price Increase Since 2010
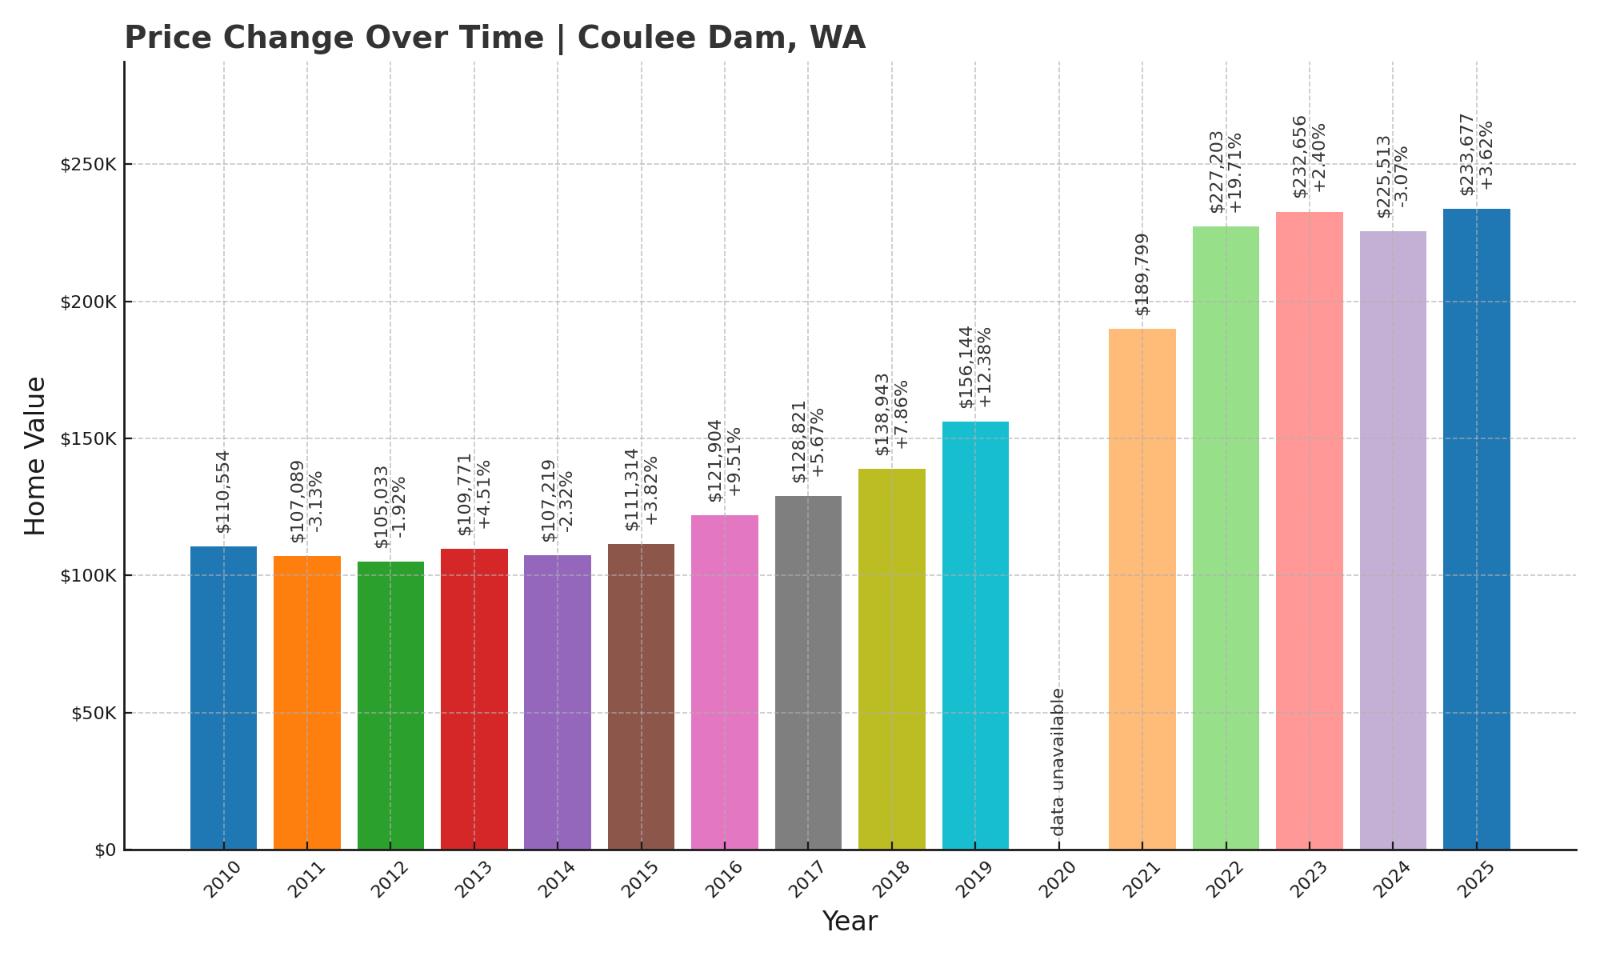
- 2010: $110,554
- 2011: $107,089 (-$3,464, -3.13% from previous year)
- 2012: $105,033 (-$2,057, -1.92% from previous year)
- 2013: $109,771 (+$4,739, +4.51% from previous year)
- 2014: $107,219 (-$2,552, -2.32% from previous year)
- 2015: $111,314 (+$4,095, +3.82% from previous year)
- 2016: $121,904 (+$10,590, +9.51% from previous year)
- 2017: $128,821 (+$6,917, +5.67% from previous year)
- 2018: $138,943 (+$10,123, +7.86% from previous year)
- 2019: $156,144 (+$17,201, +12.38% from previous year)
- 2020: N/A
- 2021: $189,799
- 2022: $227,203 (+$37,404, +19.71% from previous year)
- 2023: $232,656 (+$5,453, +2.40% from previous year)
- 2024: $225,513 (-$7,143, -3.07% from previous year)
- 2025: $233,677 (+$8,164, +3.62% from previous year)
Coulee Dam – Historic Engineering Town with Modest Prices

Best known for its namesake dam—one of the largest concrete structures in the world—Coulee Dam offers a slice of New Deal-era history with remarkably accessible real estate. Home values have more than doubled since 2010, reaching $233,677 in 2025.
Located on the Columbia River, the town draws visitors and residents alike for its scenic setting, rich heritage, and proximity to recreation. Despite some volatility in recent years, its modest price growth reflects stable demand in an area that remains one of the most affordable in central Washington.
7. Pomeroy – 138% Home Price Increase Since 2012

- 2010: N/A
- 2011: N/A
- 2012: $97,861
- 2013: $107,101 (+$9,240, +9.44% from previous year)
- 2014: $109,410 (+$2,309, +2.16% from previous year)
- 2015: $116,759 (+$7,349, +6.72% from previous year)
- 2016: $124,643 (+$7,884, +6.75% from previous year)
- 2017: $132,830 (+$8,187, +6.57% from previous year)
- 2018: $146,033 (+$13,203, +9.94% from previous year)
- 2019: $149,581 (+$3,548, +2.43% from previous year)
- 2020: N/A
- 2021: $178,709
- 2022: $207,832 (+$29,123, +16.30% from previous year)
- 2023: $217,752 (+$9,920, +4.77% from previous year)
- 2024: $228,237 (+$10,485, +4.82% from previous year)
- 2025: $233,358 (+$5,120, +2.24% from previous year)
Pomeroy – Agricultural Heartland with Steady Growth

Pomeroy, the only incorporated city in Garfield County, has seen consistent home value increases over the past decade, totaling a 138% gain since 2012. With a 2025 median price of $233,358, it still ranks among the state’s most affordable markets.
Surrounded by wheat fields and rolling hills, Pomeroy serves as a small hub for farming and local commerce. It offers a tight-knit community and an appealing cost of living for buyers looking beyond urban areas. Modest, reliable growth makes it a solid option for long-term affordability.
6. Endicott – 123% Home Price Increase Since 2017

🔥 Would you like to save this?
- 2010: N/A
- 2011: N/A
- 2012: N/A
- 2013: N/A
- 2014: N/A
- 2015: N/A
- 2016: N/A
- 2017: $104,451
- 2018: $120,960 (+$16,509, +15.81% from previous year)
- 2019: $135,096 (+$14,136, +11.69% from previous year)
- 2020: N/A
- 2021: $188,640
- 2022: $220,198 (+$31,558, +16.73% from previous year)
- 2023: $208,434 (-$11,763, -5.34% from previous year)
- 2024: $220,890 (+$12,456, +5.98% from previous year)
- 2025: $232,520 (+$11,630, +5.27% from previous year)
Endicott – Rural Revival in Whitman County

In the Palouse hills of Whitman County, Endicott is a tiny community with big percentage growth. Prices have jumped 123% since 2017, landing at $232,520 in 2025. Despite a dip in 2023, values have bounced back solidly in the past two years.
With fewer than 300 residents, Endicott offers peace and space, making it attractive for those wanting a slower pace of life. Many buyers are locals or remote workers seeking affordability without leaving the state entirely. It’s a place where housing remains simple—and sensibly priced.
5. Inchelium – 4.3% Home Price Increase Since 2024

- 2010: N/A
- 2011: N/A
- 2012: N/A
- 2013: N/A
- 2014: N/A
- 2015: N/A
- 2016: N/A
- 2017: N/A
- 2018: N/A
- 2019: N/A
- 2020: N/A
- 2021: N/A
- 2022: N/A
- 2023: N/A
- 2024: $218,988
- 2025: $228,336 (+$9,348, +4.27% from previous year)
Inchelium – Remote, Scenic, and Under the Radar

Located on the Colville Indian Reservation and bordering the Columbia River, Inchelium has only just started appearing in statewide real estate data. Its home value in 2025 is $228,336, up slightly from the year before—suggesting mild growth in a still-emerging market.
The town remains one of the most secluded on this list, with limited infrastructure but exceptional natural surroundings. For those seeking solitude and affordability far from Washington’s urban cores, Inchelium’s real estate may still offer undiscovered potential.
4. Hartline – 12% Home Price Increase Since 2021

- 2010: N/A
- 2011: N/A
- 2012: N/A
- 2013: N/A
- 2014: N/A
- 2015: N/A
- 2016: N/A
- 2017: N/A
- 2018: N/A
- 2019: N/A
- 2020: N/A
- 2021: $202,224
- 2022: $234,768 (+$32,544, +16.09% from previous year)
- 2023: $230,622 (-$4,146, -1.77% from previous year)
- 2024: $231,415 (+$794, +0.34% from previous year)
- 2025: $226,524 (-$4,891, -2.11% from previous year)
Hartline – High Plateau Affordability with Minor Fluctuations

Hartline, a tiny farming town in Grant County, has seen home values grow from $202,224 in 2021 to $226,524 in 2025—a modest 12% increase over four years. Prices peaked in 2022, but have seen slight declines since, suggesting a market that may have hit its ceiling for now.
This quiet, high-desert town is among the most affordable in the state. With its flat farmland and sparse population, Hartline offers affordability and elbow room. The recent price plateau could attract bargain hunters interested in rural living without rapid appreciation pressure.
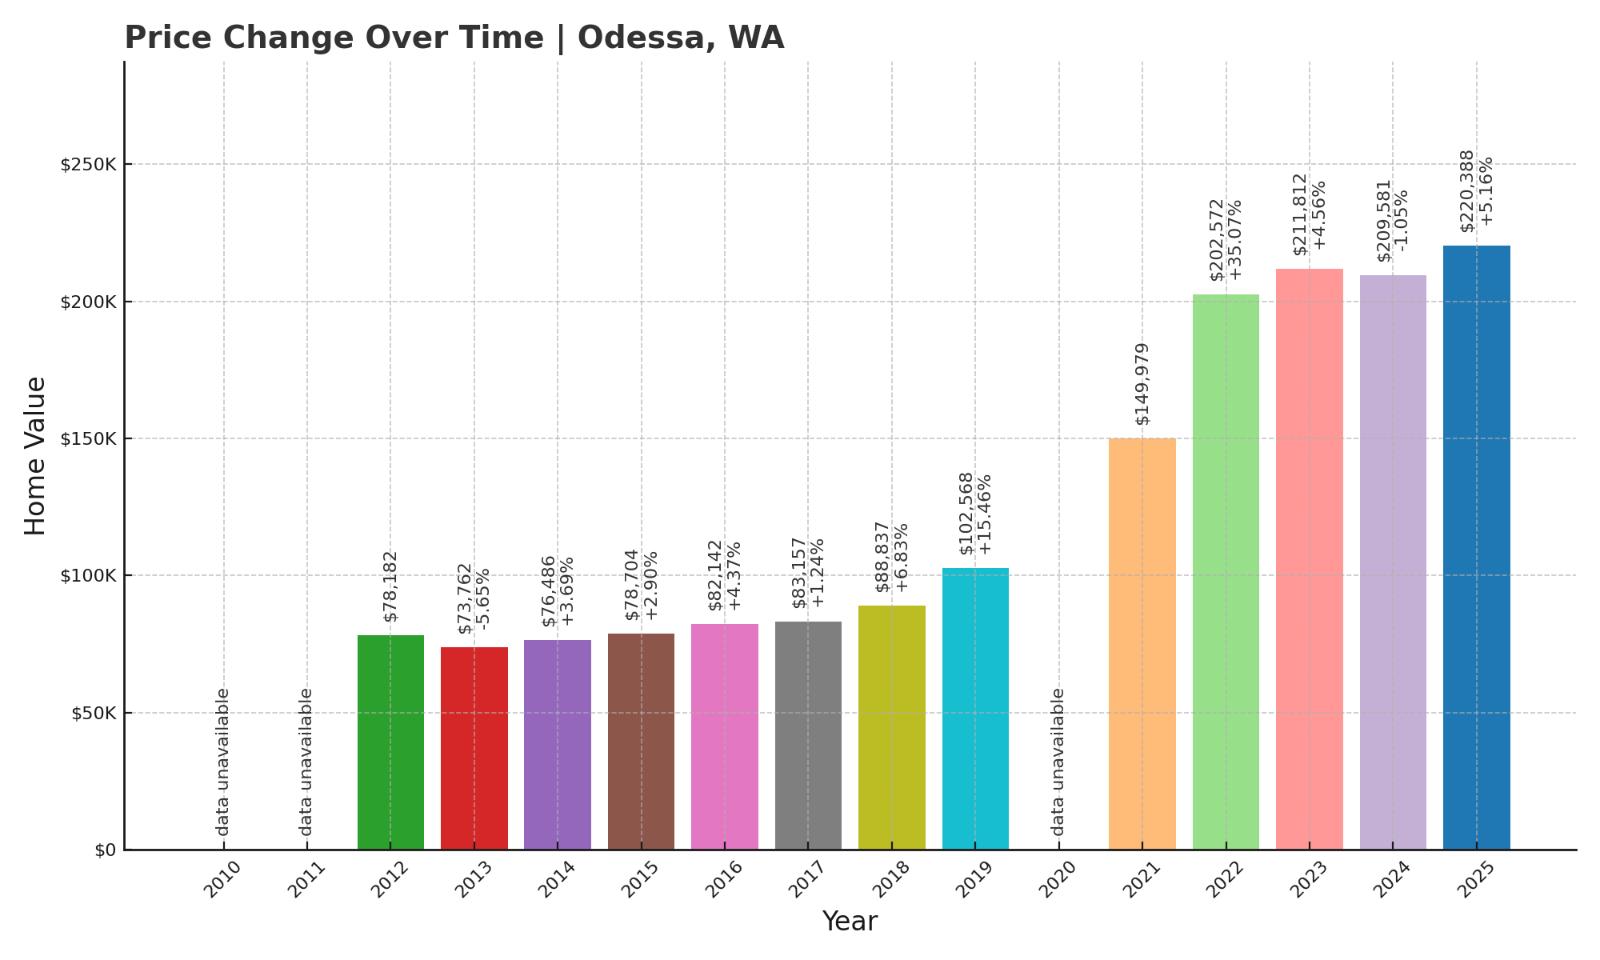
3. Odessa – 182% Home Price Increase Since 2012
- 2010: N/A
- 2011: N/A
- 2012: $78,182
- 2013: $73,762 (-$4,420, -5.65% from previous year)
- 2014: $76,486 (+$2,724, +3.69% from previous year)
- 2015: $78,704 (+$2,218, +2.90% from previous year)
- 2016: $82,142 (+$3,438, +4.37% from previous year)
- 2017: $83,157 (+$1,015, +1.24% from previous year)
- 2018: $88,837 (+$5,680, +6.83% from previous year)
- 2019: $102,568 (+$13,731, +15.46% from previous year)
- 2020: N/A
- 2021: $149,979
- 2022: $202,572 (+$52,593, +35.07% from previous year)
- 2023: $211,812 (+$9,240, +4.56% from previous year)
- 2024: $209,581 (-$2,231, -1.05% from previous year)
- 2025: $220,388 (+$10,807, +5.16% from previous year)
Odessa – Eastern Washington’s Quiet Price Climber

Odessa, located in Lincoln County, has quietly seen a dramatic 182% rise in home values since 2012. From a modest $78,182 to $220,388 in 2025, the growth has been steady—with a major leap after 2020. Though there was a small correction in 2024, prices rebounded quickly.
This rural town, originally settled by German-Russian immigrants, is surrounded by wheat fields and boasts a rich agricultural heritage. Odessa’s affordability, combined with its stability and sense of community, continues to appeal to buyers seeking simple living and long-term value.
2. Marblemount – 176% Home Price Increase Since 2010

- 2010: $73,015
- 2011: $70,537 (-$2,477, -3.39% from previous year)
- 2012: $68,072 (-$2,465, -3.49% from previous year)
- 2013: $68,799 (+$727, +1.07% from previous year)
- 2014: $72,095 (+$3,296, +4.79% from previous year)
- 2015: $78,634 (+$6,539, +9.07% from previous year)
- 2016: $94,255 (+$15,621, +19.86% from previous year)
- 2017: $102,721 (+$8,466, +8.98% from previous year)
- 2018: $116,721 (+$14,000, +13.63% from previous year)
- 2019: $120,739 (+$4,017, +3.44% from previous year)
- 2020: N/A
- 2021: $169,438
- 2022: $198,240 (+$28,803, +17.00% from previous year)
- 2023: $190,191 (-$8,049, -4.06% from previous year)
- 2024: $194,685 (+$4,494, +2.36% from previous year)
- 2025: $201,383 (+$6,698, +3.44% from previous year)
Marblemount – At the Edge of the Wild, Yet Affordable

🔥 Would you like to save this?
Marblemount sits on the western gateway to North Cascades National Park and remains one of Washington’s most affordable towns, despite a 176% increase in home values since 2010. As of 2025, prices average $201,383—well under the state’s median.
Though growth was steep during the pandemic-era demand for rural retreats, recent years have seen slower increases. The area’s appeal is undeniable: towering peaks, abundant wildlife, and a peaceful river valley draw buyers looking for affordable access to Washington’s most dramatic landscapes.
1. Lind – 184% Home Price Increase Since 2010

- 2010: $69,799
- 2011: $67,798 (-$2,001, -2.87% from previous year)
- 2012: $67,593 (-$205, -0.30% from previous year)
- 2013: $68,099 (+$506, +0.75% from previous year)
- 2014: $68,917 (+$818, +1.20% from previous year)
- 2015: $69,579 (+$662, +0.96% from previous year)
- 2016: $72,811 (+$3,232, +4.64% from previous year)
- 2017: $80,035 (+$7,224, +9.92% from previous year)
- 2018: $91,898 (+$11,863, +14.82% from previous year)
- 2019: $98,102 (+$6,204, +6.75% from previous year)
- 2020: N/A
- 2021: $151,435
- 2022: $173,540 (+$22,105, +14.60% from previous year)
- 2023: $177,960 (+$4,420, +2.55% from previous year)
- 2024: $187,460 (+$9,500, +5.34% from previous year)
- 2025: $198,112 (+$10,652, +5.68% from previous year)
Lind – Washington’s Least Expensive Housing Market in 2025

Lind tops the list as the most affordable town in Washington for 2025, with home values averaging $198,112. Despite a remarkable 184% increase since 2010, Lind’s housing prices remain well below most areas in the state. Much of the growth occurred after 2020, with consistent annual gains through 2025.
This Adams County town is deeply rooted in agriculture, with a friendly, rural atmosphere and quiet pace. Though small and remote, it continues to attract buyers interested in owning property without the steep price tags found elsewhere in the region. For those seeking true affordability, Lind remains the clearest choice.


