
🔥 Would you like to save this?
Utah’s housing market has been on a wild ride—but some towns are still flying under the radar when it comes to affordability. According to the Zillow Home Value Index, these 15 communities stand out in 2025 for keeping home prices relatively low. Whether you’re looking to settle down, invest smart, or just escape big-city prices, these towns offer a shot at homeownership without the financial whiplash.
We looked at long-term price trends to see where value is holding strong and where things might be heating up. Some of these spots have stayed affordable for years, while others are only just starting to draw attention. What they have in common is potential—backed by data, local charm, and room to grow.
In order to come up with the very specific design ideas, we create most designs with the assistance of state-of-the-art AI interior design software. Also, assume links that take you off the site are affiliate links such as links to Amazon. this means we may earn a commission if you buy something.
15. Salina – 179% Home Price Increase Since 2011
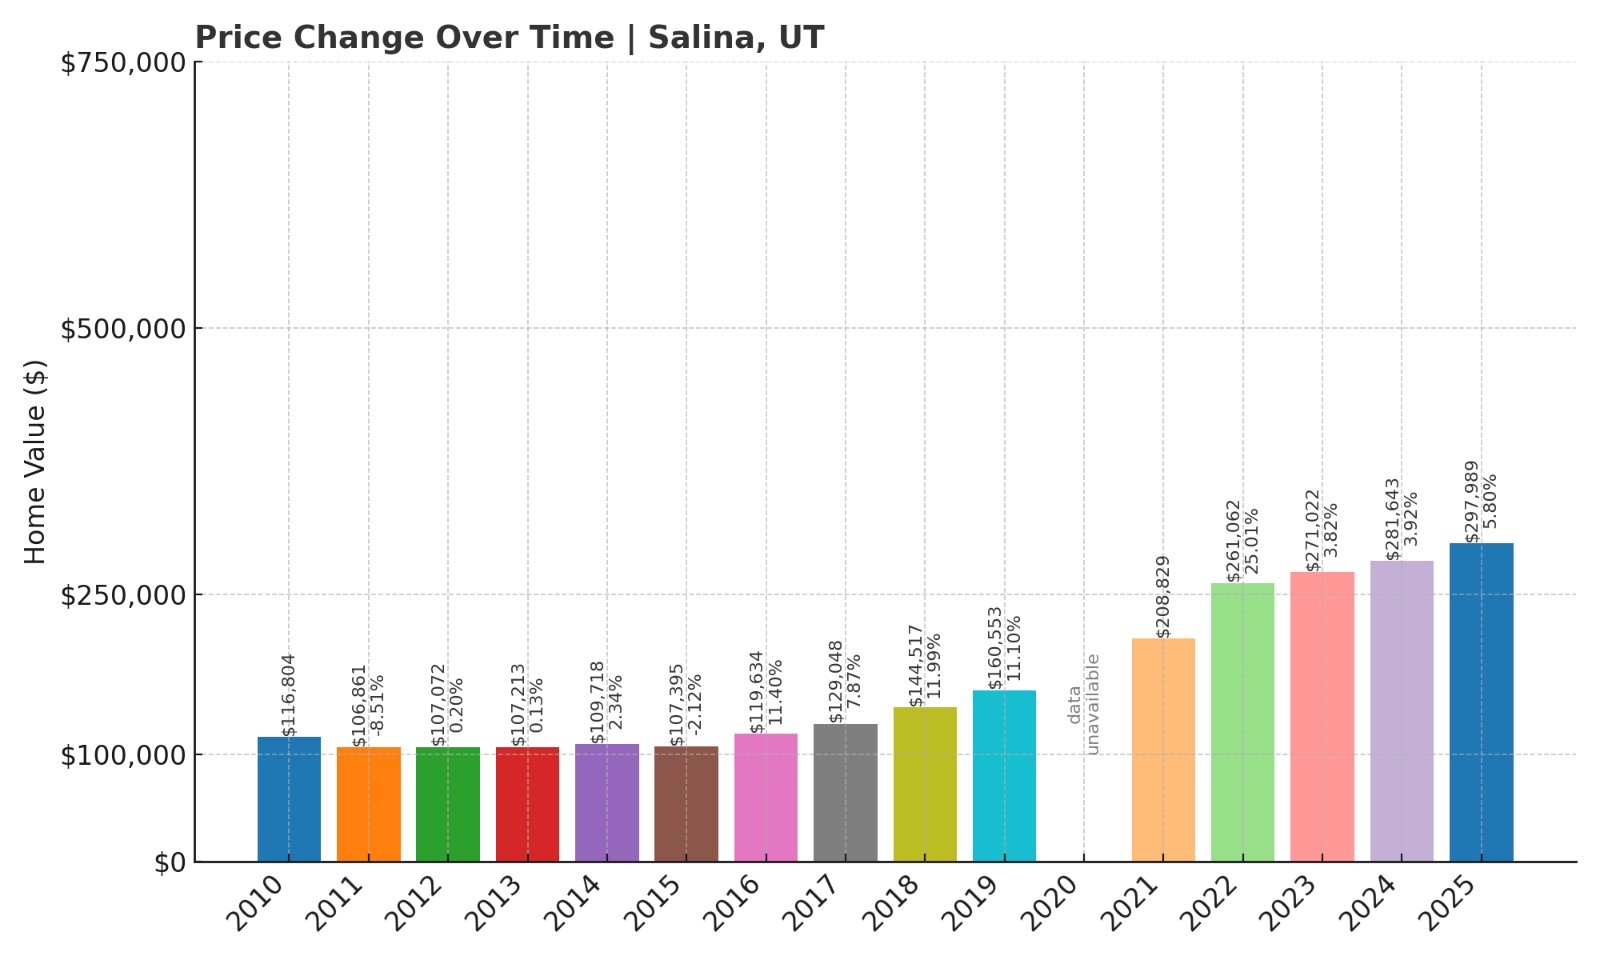
- 2010: $116,804
- 2011: $106,861 (-9,943, -8.51% from previous year)
- 2012: $107,072 (+211, +0.20% from previous year)
- 2013: $107,213 (+141, +0.13% from previous year)
- 2014: $109,718 (+2,505, +2.34% from previous year)
- 2015: $107,395 (-2,323, -2.12% from previous year)
- 2016: $119,634 (+12,239, +11.40% from previous year)
- 2017: $129,048 (+9,414, +7.87% from previous year)
- 2018: $144,517 (+15,469, +11.99% from previous year)
- 2019: $160,553 (+16,036, +11.10% from previous year)
- 2020: N/A
- 2021: $208,829
- 2022: $261,062 (+52,233, +25.01% from previous year)
- 2023: $271,022 (+9,960, +3.82% from previous year)
- 2024: $281,643 (+10,621, +3.92% from previous year)
- 2025: $297,989 (+16,346, +5.80% from previous year)
Salina’s home values have surged nearly 180% since 2011, climbing from just under $107,000 to just shy of $298,000 in 2025. The town saw its most dramatic gains between 2016 and 2022, with particularly strong growth during the pandemic recovery period. Despite an early slump, Salina’s consistent upward momentum points to growing demand and increased investment in this central Utah community.
Salina – Growing Market With Steady Long-Term Value
Located in Sevier County, Salina sits at the crossroads of I-70 and US-89, making it a small but strategically positioned hub in central Utah. The town is surrounded by natural beauty, including Fishlake National Forest and the nearby Sevier River. These outdoor attractions may be driving interest from both full-time residents and remote workers looking for scenic, affordable living.
Salina’s affordability relative to other parts of Utah makes it attractive to first-time buyers and families. With improved transportation links and steady appreciation, it’s become a standout option for those seeking long-term value in a smaller town. Its schools and community services also add to the appeal for those planning to settle down outside major metro areas.
14. Minersville – 2.1% Home Price Increase Since 2022

- 2010: N/A
- 2011: N/A
- 2012: N/A
- 2013: N/A
- 2014: N/A
- 2015: N/A
- 2016: N/A
- 2017: N/A
- 2018: N/A
- 2019: N/A
- 2020: N/A
- 2021: N/A
- 2022: $290,776
- 2023: $287,918 (-2,858, -0.98% from previous year)
- 2024: $299,366 (+11,448, +3.98% from previous year)
- 2025: $296,888 (-2,478, -0.83% from previous year)
Minersville’s pricing trend has been modest, showing a small overall increase since 2022. The average home value reached nearly $297,000 in 2025, a slight gain from where it stood three years earlier. While not experiencing a housing boom, its price stability could make it attractive for buyers looking for steady conditions in rural areas.
Minersville – A Small Town With Affordable Living
Minersville is a quiet town in Beaver County that holds on to its pioneer roots. With a population of under 1,000, it’s one of Utah’s least crowded housing markets. Its rural character and low traffic levels appeal to buyers looking for a slower pace of life without breaking the bank.
The town’s slight price fluctuations suggest a stable but slow-growing housing market. This can work in favor of buyers seeking predictability and fewer bidding wars. With proximity to larger towns like Cedar City and Beaver, it’s also within reach of shopping, healthcare, and employment hubs.
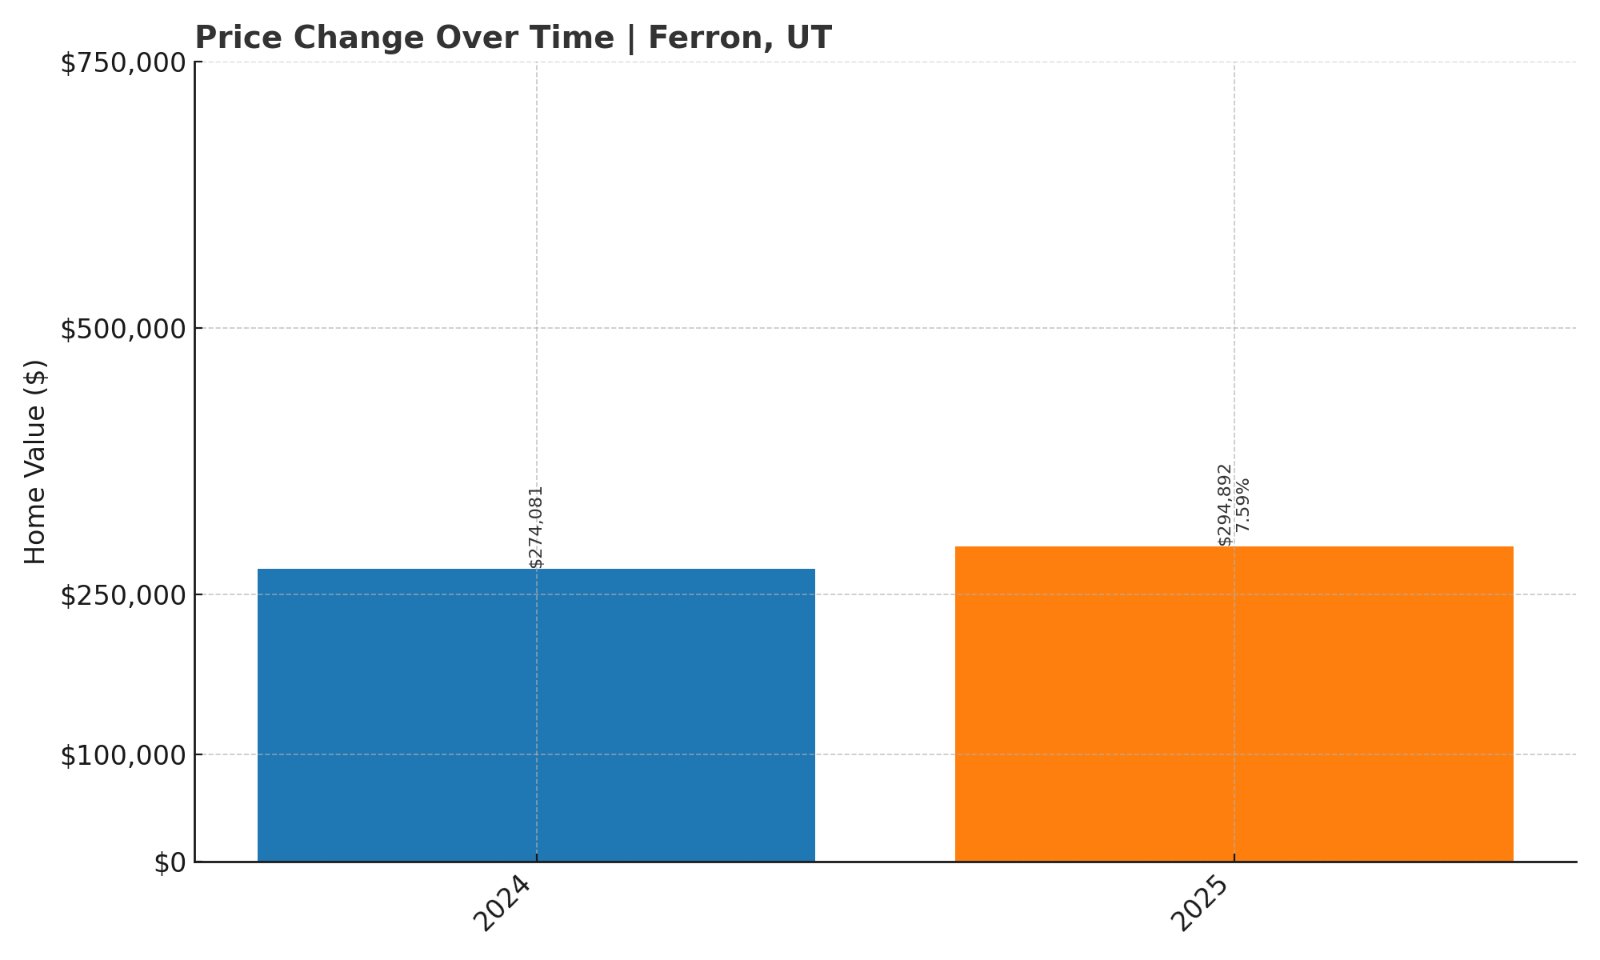
13. Ferron – 7.6% Home Price Increase Since 2024
- 2010: N/A
- 2011: N/A
- 2012: N/A
- 2013: N/A
- 2014: N/A
- 2015: N/A
- 2016: N/A
- 2017: N/A
- 2018: N/A
- 2019: N/A
- 2020: N/A
- 2021: N/A
- 2022: N/A
- 2023: N/A
- 2024: $274,081
- 2025: $294,892 (+20,811, +7.59% from previous year)
Ferron has only just entered the data picture with available figures beginning in 2024, but in that short time, it’s already seen a nearly 8% increase in home prices. Reaching $294,892 by 2025, this quick gain may hint at increased attention from bargain-hunting buyers or small-town relocators.
Ferron – Rural Charm Meets New Interest
Nestled in Emery County, Ferron is surrounded by high desert, mountains, and recreation lands. The area’s scenery and tranquility make it attractive to those looking for a simpler lifestyle. Ferron Reservoir and Millsite State Park bring visitors to town, which may contribute to a modest rise in demand.
Though the data is new, the spike between 2024 and 2025 may reflect a growing desire for homes in rural Utah that are still relatively inexpensive compared to the state average. With limited data, the long-term trend remains uncertain, but the early movement is notable.
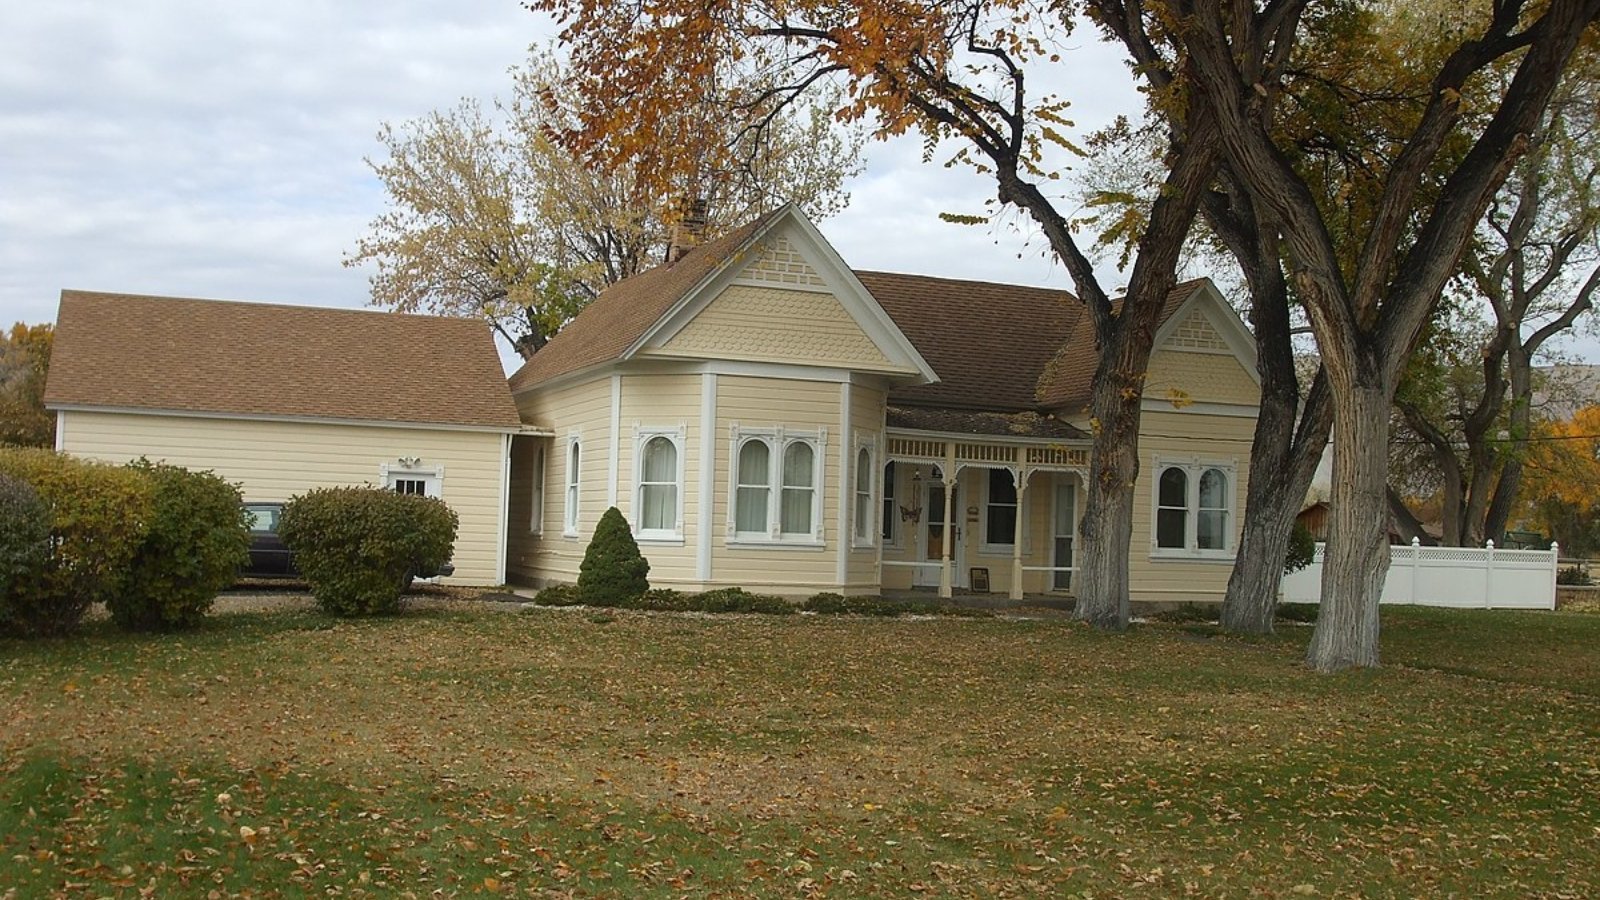
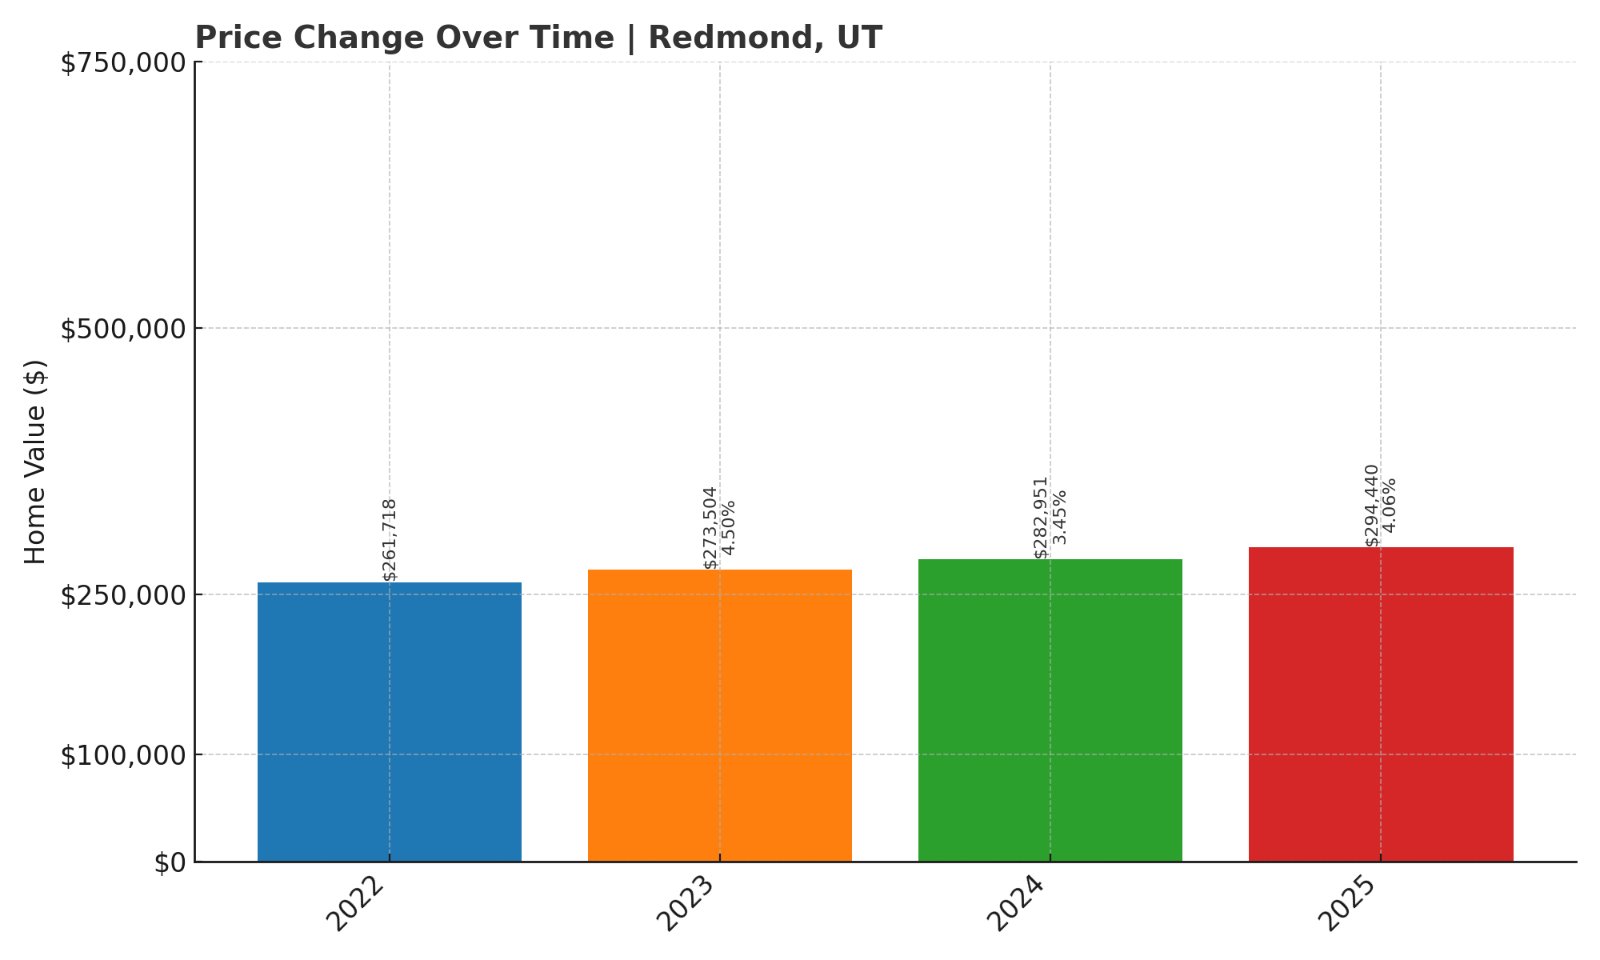
12. Redmond – 12.5% Home Price Increase Since 2022
- 2010: N/A
- 2011: N/A
- 2012: N/A
- 2013: N/A
- 2014: N/A
- 2015: N/A
- 2016: N/A
- 2017: N/A
- 2018: N/A
- 2019: N/A
- 2020: N/A
- 2021: N/A
- 2022: $261,718
- 2023: $273,504 (+11,786, +4.50% from previous year)
- 2024: $282,951 (+9,447, +3.45% from previous year)
- 2025: $294,440 (+11,489, +4.06% from previous year)
Since entering the dataset in 2022, Redmond’s home prices have risen over 12%, finishing 2025 at just under $295,000. The increases have been steady year-over-year, suggesting growing interest or local development pressures in this small Sevier County town.
Redmond – Steady Growth in a Small Community
Redmond is a compact town located along Highway 89, known for its red rock quarries and proximity to the Sevier Valley. It offers small-town life with access to hiking, ATV trails, and open land, which may appeal to nature-focused homebuyers.
While its population remains modest, Redmond’s consistent price gains reflect strong buyer confidence in the area. It stands out for its affordability, with prices still well below Utah’s urban averages despite the upward trend.
11. Sigurd – 21.4% Home Price Increase Since 2022

- 2010: N/A
- 2011: N/A
- 2012: N/A
- 2013: N/A
- 2014: N/A
- 2015: N/A
- 2016: N/A
- 2017: N/A
- 2018: N/A
- 2019: N/A
- 2020: N/A
- 2021: N/A
- 2022: $241,228
- 2023: $276,410 (+35,182, +14.58% from previous year)
- 2024: $281,388 (+4,978, +1.80% from previous year)
- 2025: $292,988 (+11,600, +4.12% from previous year)
Sigurd has seen a sharp jump in home values since 2022, rising by more than 21% in just three years. The pace has cooled since the initial leap, but home prices in this part of Sevier County remain among the lowest in Utah, finishing at $292,988 in 2025.
Sigurd – Affordable Homes With Strong Recent Growth
Sigurd sits just southeast of Salina and north of Richfield. Though small in population, it enjoys easy access to major highways and public lands. This makes it a practical spot for commuters or those seeking more land for their money.
The significant increase between 2022 and 2023 suggests rising attention from buyers priced out of other areas. While growth has slowed, Sigurd remains a competitive option for budget-conscious buyers in Utah.
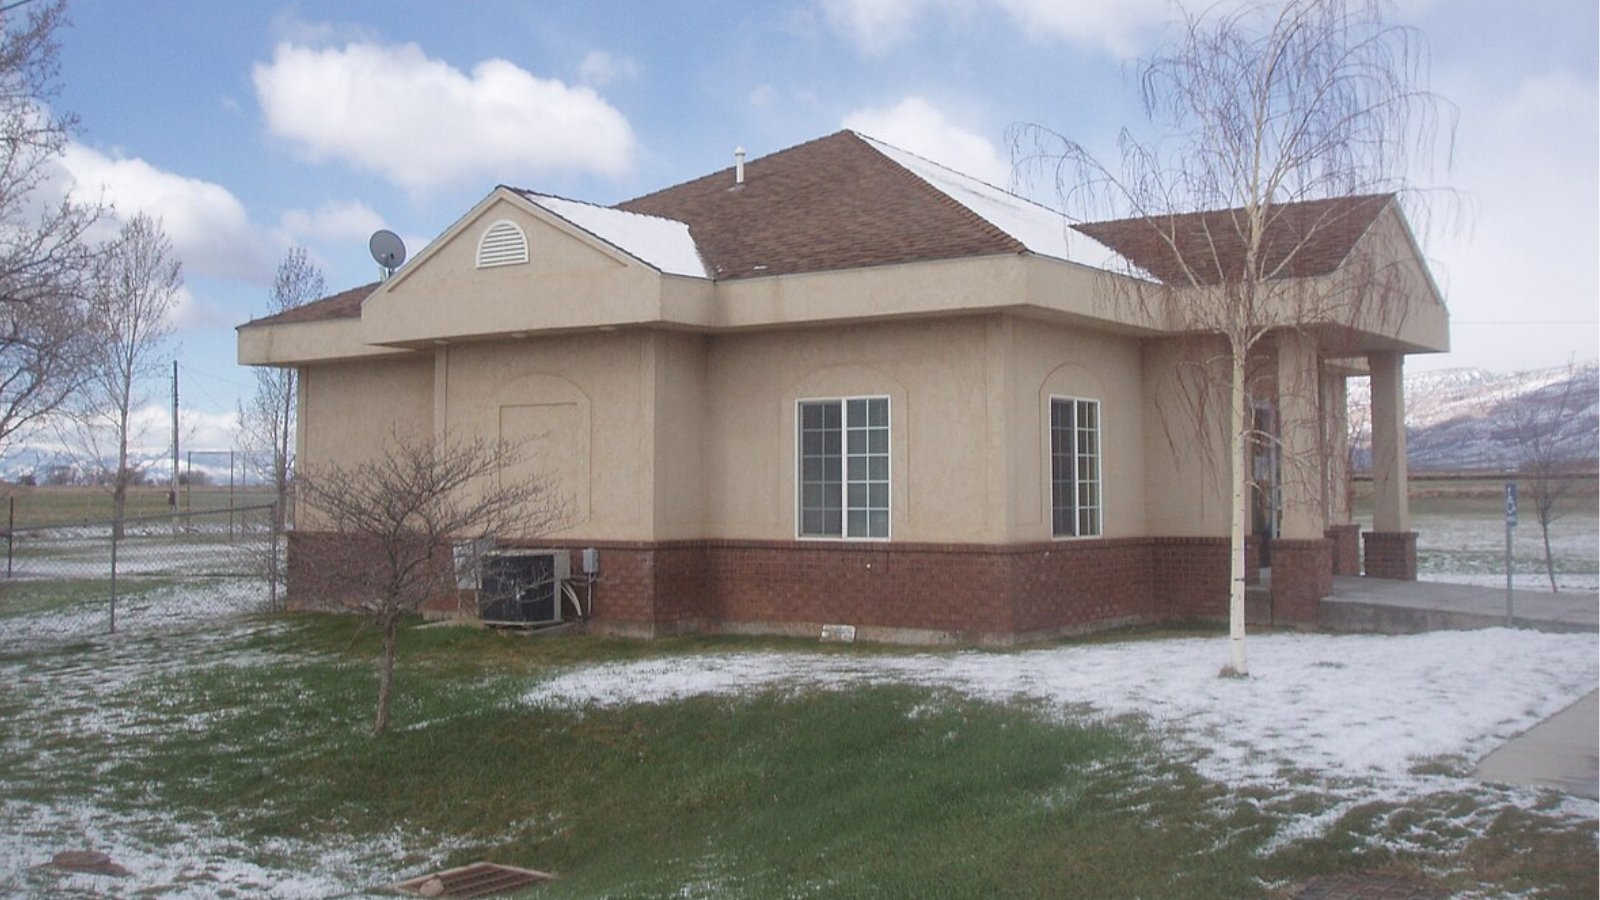
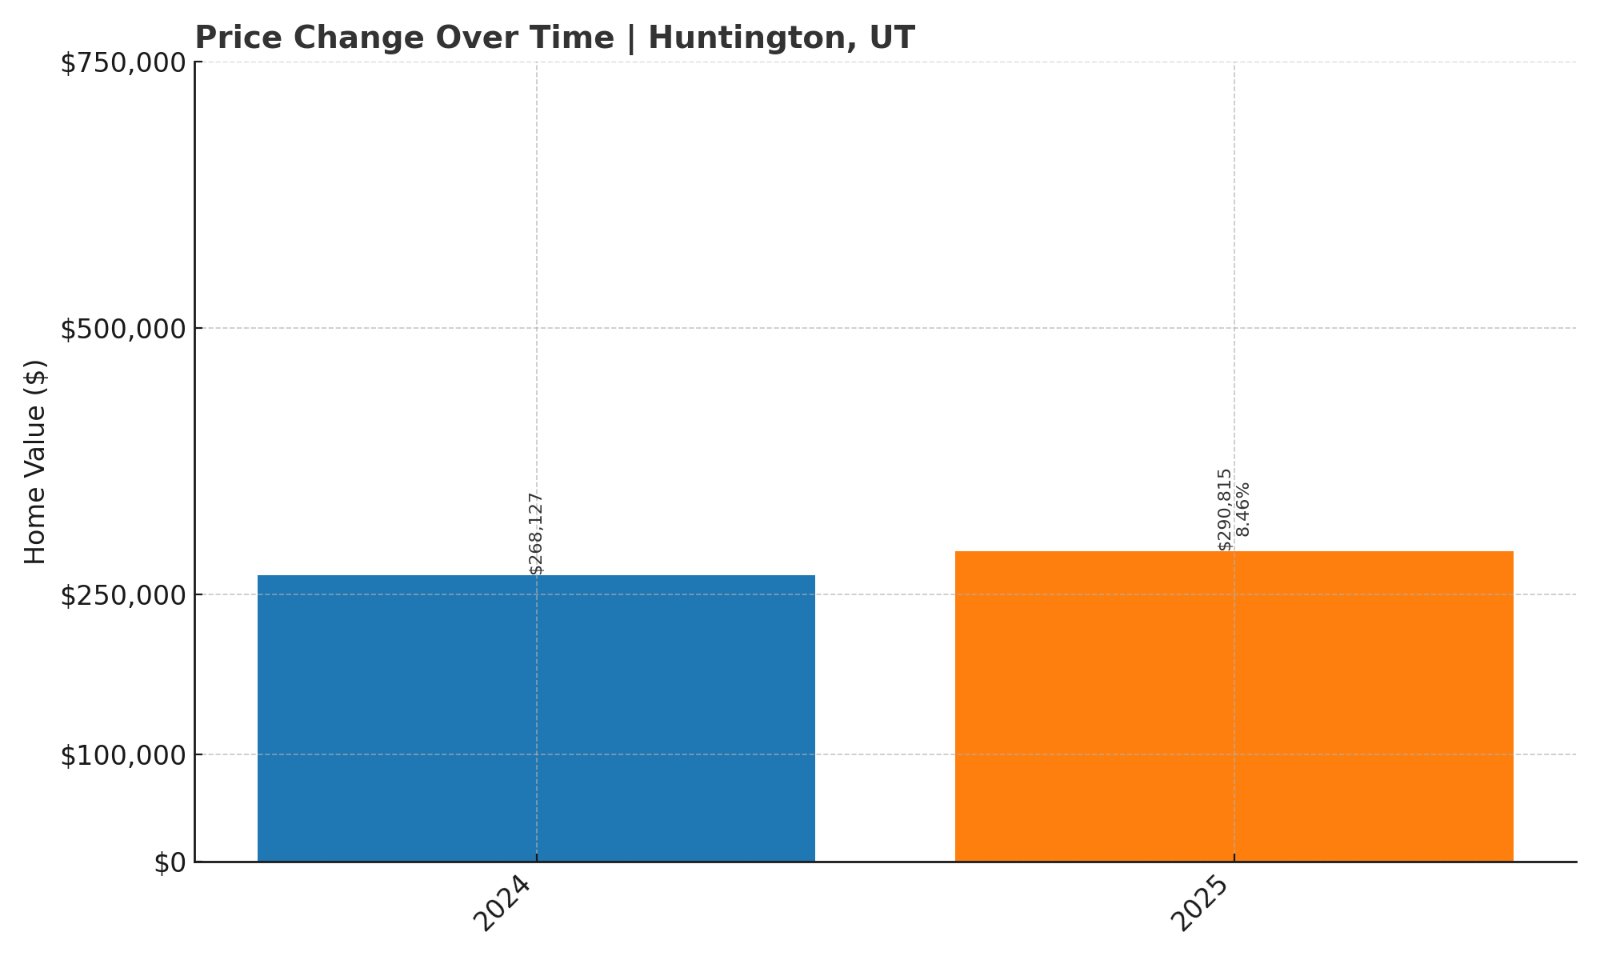
10. Huntington – 8.5% Home Price Increase Since 2024
- 2010: N/A
- 2011: N/A
- 2012: N/A
- 2013: N/A
- 2014: N/A
- 2015: N/A
- 2016: N/A
- 2017: N/A
- 2018: N/A
- 2019: N/A
- 2020: N/A
- 2021: N/A
- 2022: N/A
- 2023: N/A
- 2024: $268,127
- 2025: $290,815 (+22,688, +8.46% from previous year)
Huntington saw an 8.5% price bump in a single year, taking its average home value from $268,127 in 2024 to just over $290,000 in 2025. Though data is limited to just two years, the gain is notable and places it among Utah’s more affordable towns with rising interest.
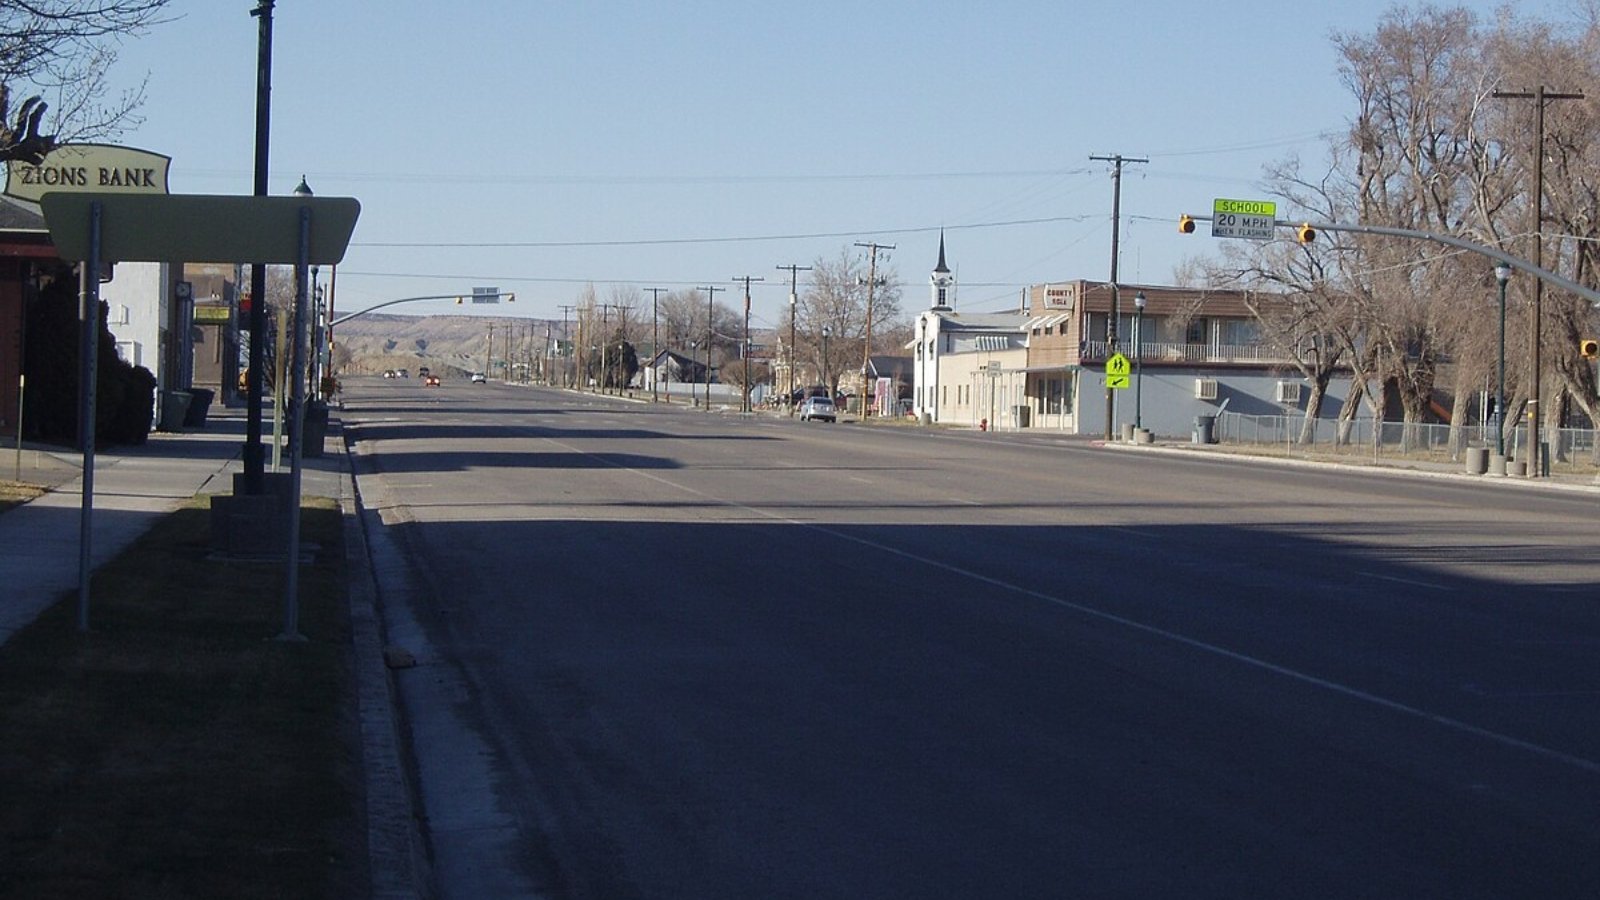
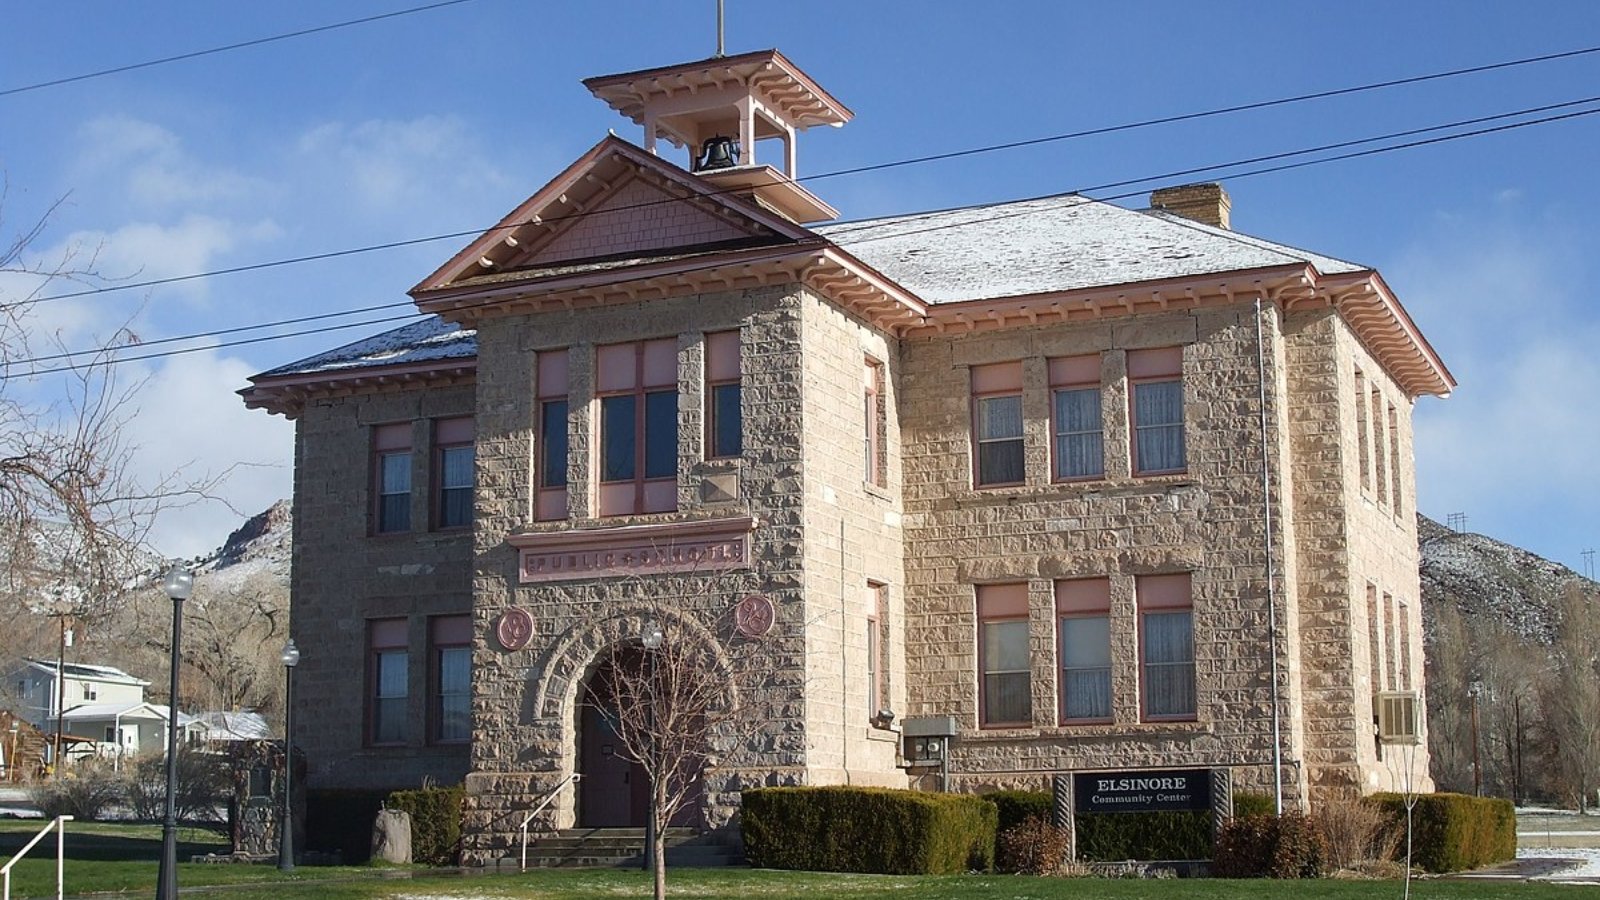
Huntington – Affordable Housing in Eastern Utah
Tricia Simpson, CC BY-SA 4.0 , via Wikimedia Commons
Situated in Emery County, Huntington is bordered by the Manti-La Sal National Forest and San Rafael Swell. It’s known for outdoor access, coal mining history, and quiet living. The area offers some of the most budget-friendly housing in the region, particularly for buyers interested in large lots or proximity to recreation.
The jump in home prices suggests Huntington is starting to see renewed demand. With affordable options and fewer urban pressures, it’s an attractive destination for families and retirees alike who are looking for space and savings in rural Utah.
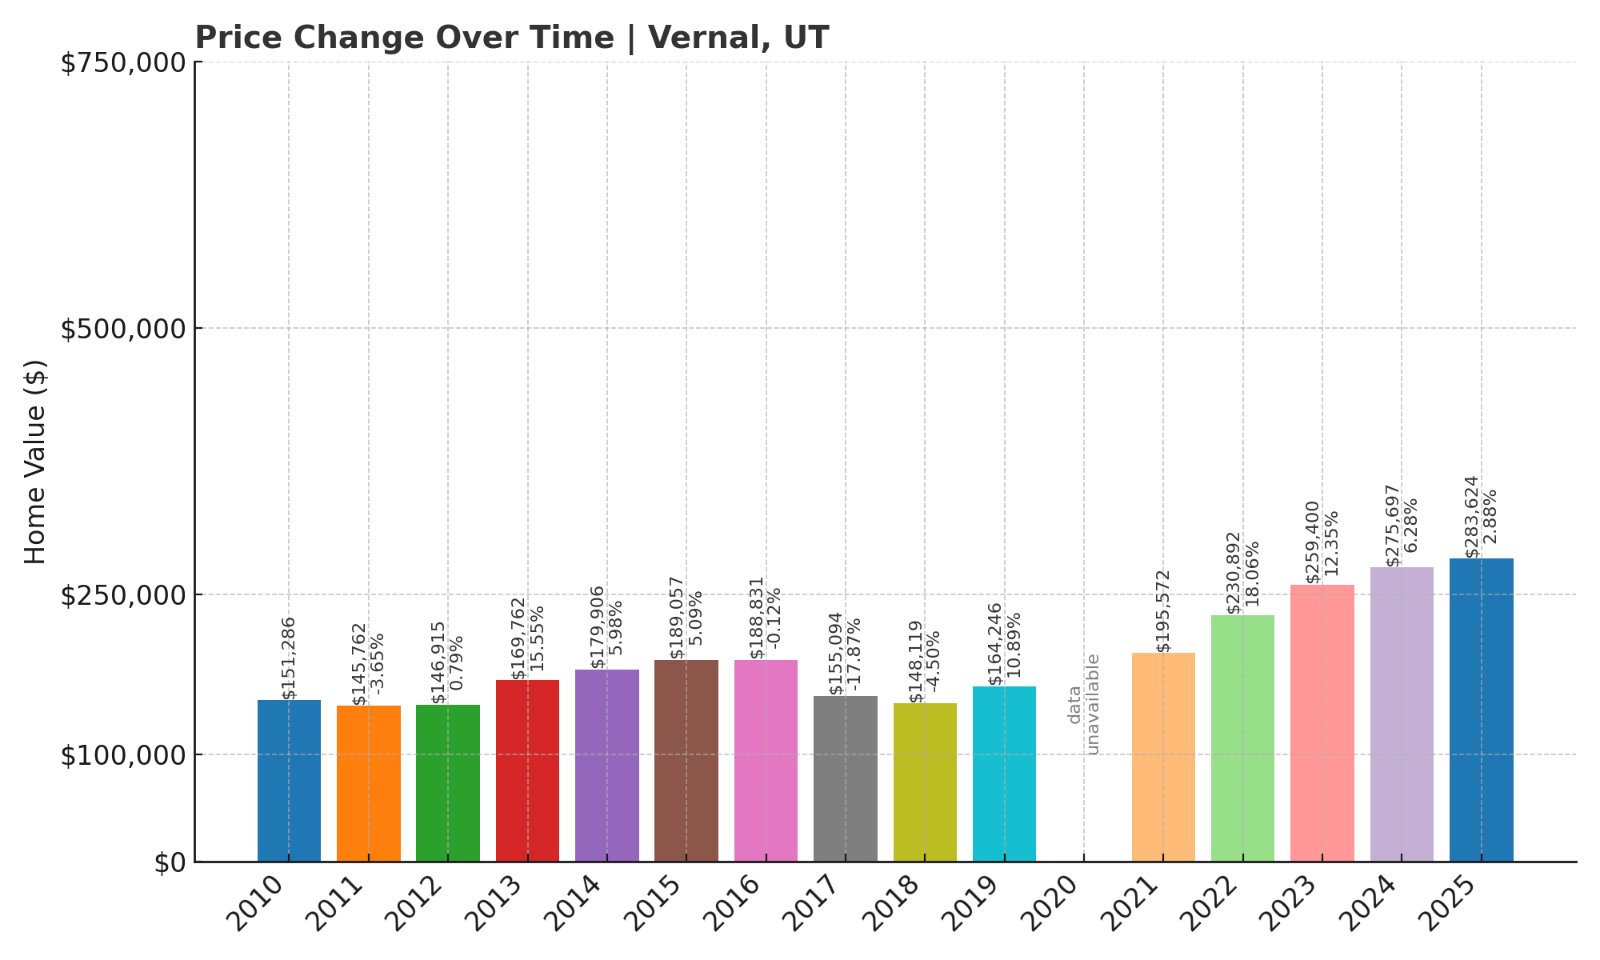
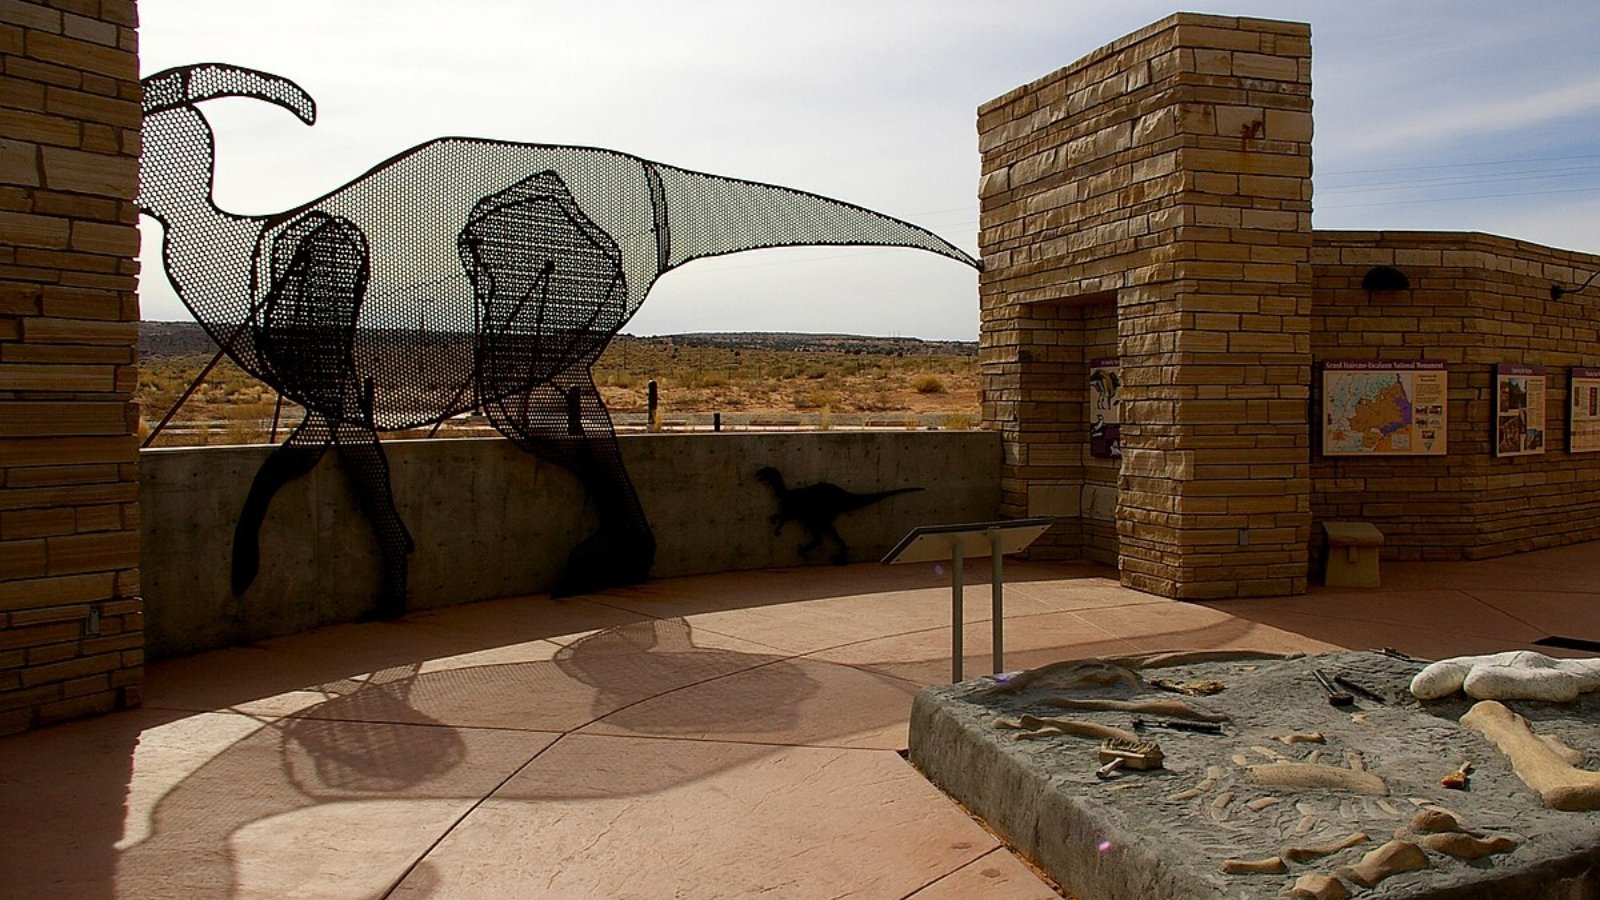
9. Vernal – 87% Home Price Increase Since 2011
🔥 Would you like to save this?
- 2010: $151,286
- 2011: $145,762 (-5,524, -3.65% from previous year)
- 2012: $146,915 (+1,153, +0.79% from previous year)
- 2013: $169,762 (+22,847, +15.55% from previous year)
- 2014: $179,906 (+10,144, +5.98% from previous year)
- 2015: $189,057 (+9,151, +5.09% from previous year)
- 2016: $188,831 (-226, -0.12% from previous year)
- 2017: $155,094 (-33,737, -17.87% from previous year)
- 2018: $148,119 (-6,975, -4.50% from previous year)
- 2019: $164,246 (+16,127, +10.89% from previous year)
- 2020: N/A
- 2021: $195,572
- 2022: $230,892 (+35,320, +18.06% from previous year)
- 2023: $259,400 (+28,508, +12.35% from previous year)
- 2024: $275,697 (+16,297, +6.28% from previous year)
- 2025: $283,624 (+7,927, +2.88% from previous year)
Vernal’s housing market has more than recovered from its mid-2010s slump, with home values rising 87% since 2011. Though prices dipped sharply around 2017, the past five years have shown steady and strong growth, with the average home now priced at $283,624.
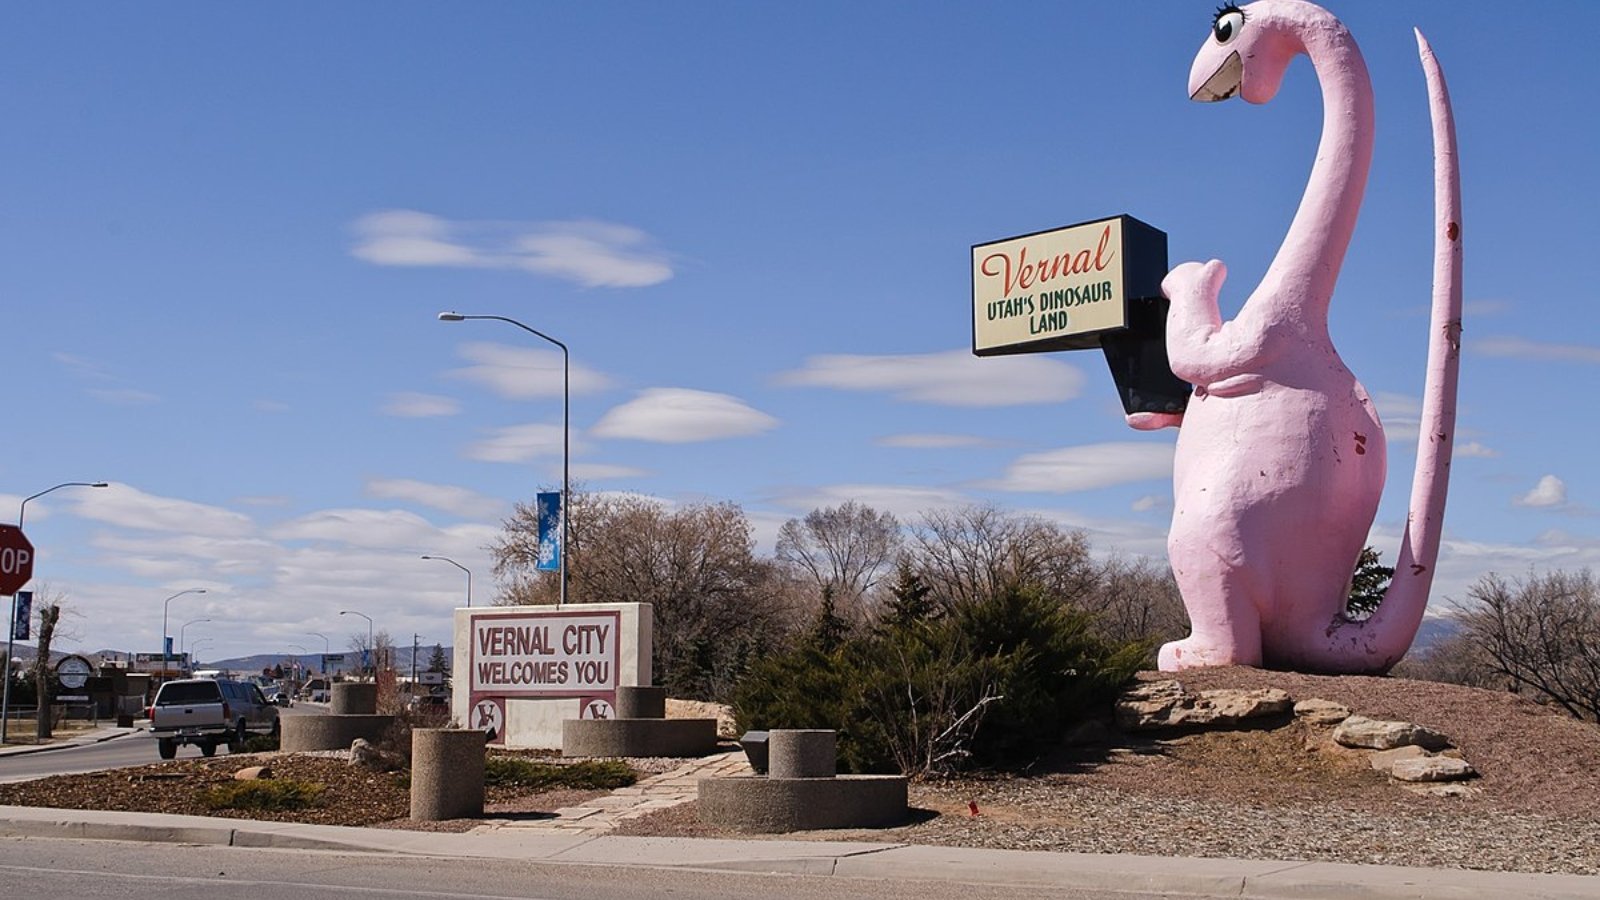
Vernal – A Rebounding Market With Outdoor Appeal
InSapphoWeTrust from Los Angeles, California, USA, CC BY-SA 2.0 , via Wikimedia Commons
Located in northeastern Utah near the Colorado border, Vernal is known for its energy industry roots, dinosaur fossil sites, and access to Flaming Gorge. Its economy has long been tied to oil and gas, which helps explain earlier volatility in home prices.
Recent stability and growth suggest a maturing housing market, supported by outdoor tourism and improved amenities. Vernal remains a cost-effective option for buyers, especially those drawn to adventure and wide open space.
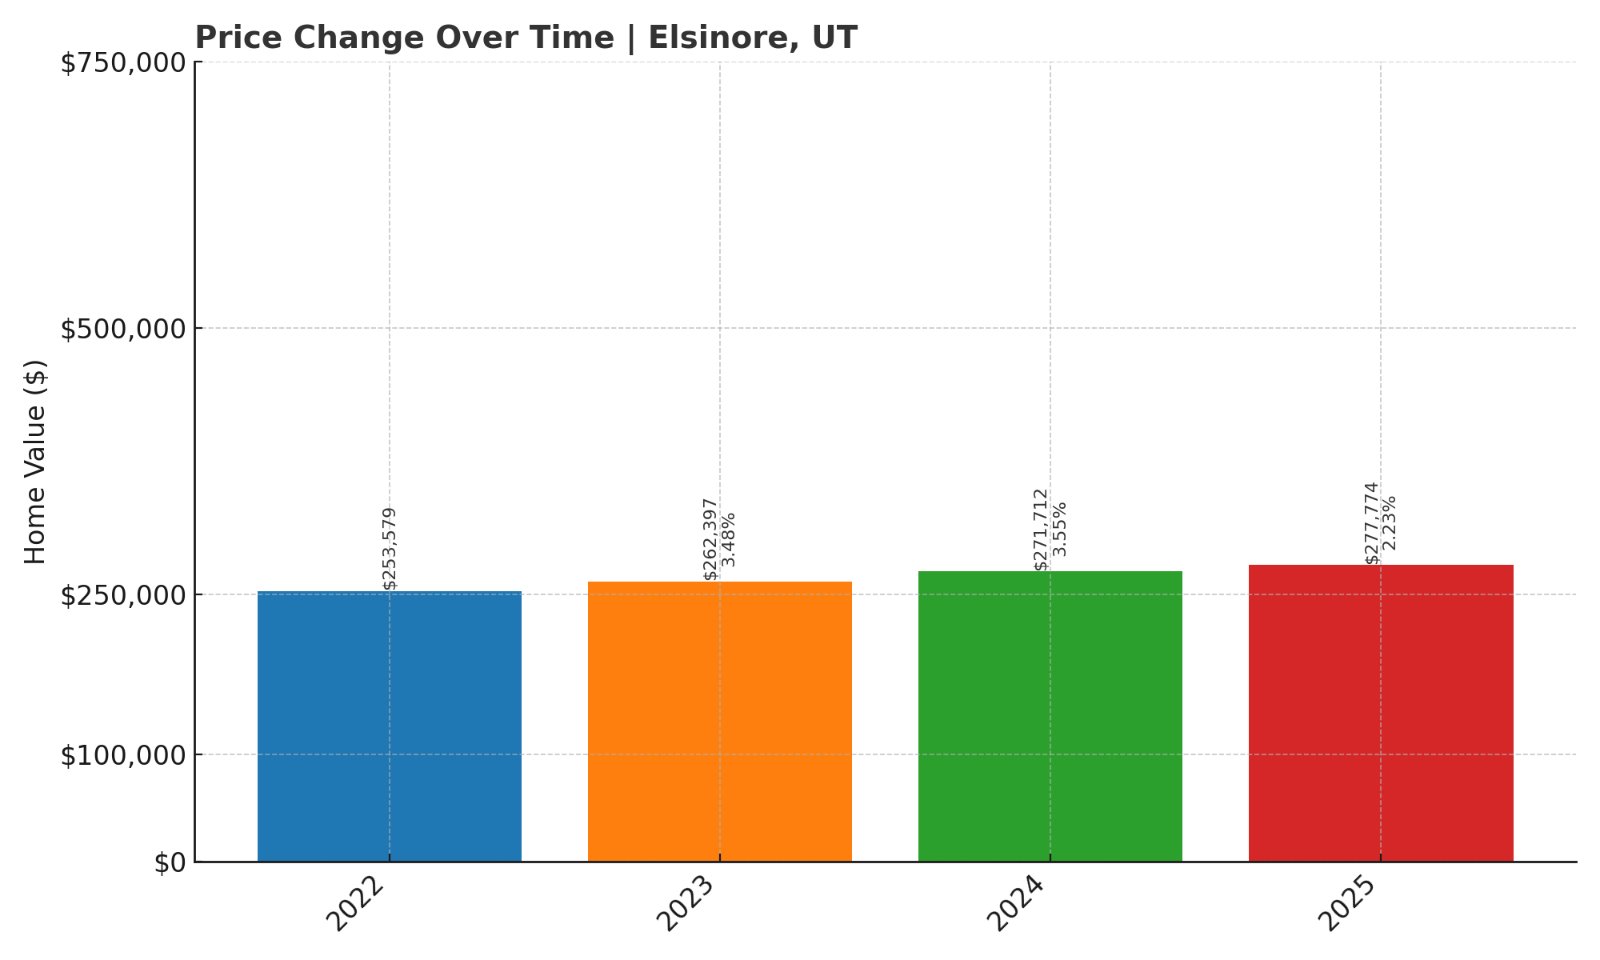
8. Elsinore – 9.6% Home Price Increase Since 2022
- 2010: N/A
- 2011: N/A
- 2012: N/A
- 2013: N/A
- 2014: N/A
- 2015: N/A
- 2016: N/A
- 2017: N/A
- 2018: N/A
- 2019: N/A
- 2020: N/A
- 2021: N/A
- 2022: $253,579
- 2023: $262,397 (+8,818, +3.48% from previous year)
- 2024: $271,712 (+9,315, +3.55% from previous year)
- 2025: $277,774 (+6,062, +2.23% from previous year)
Elsinore’s housing prices have inched up steadily since 2022, with a total increase of nearly 10% over three years. Though price hikes have been moderate, the town’s affordability remains a draw—especially with 2025 values staying well under the $300,000 mark.
Elsinore – Steady Gains in a Small Sevier County Town
Tricia Simpson, CC BY-SA 3.0 , via Wikimedia Commons
Elsinore is tucked between Richfield and Monroe, offering easy access to both while maintaining a quieter, more rural atmosphere. The town has roots in Scandinavian settlement and agriculture, lending it a distinct charm and sense of community.
Its gradual price growth makes it a low-risk option for homebuyers seeking long-term affordability. As Sevier County continues to attract residents from more crowded counties, Elsinore’s strategic location may keep it on buyers’ radar.
7. Helper – 164% Home Price Increase Since 2016

- 2010: N/A
- 2011: N/A
- 2012: N/A
- 2013: N/A
- 2014: N/A
- 2015: N/A
- 2016: $104,005
- 2017: $111,766 (+7,761, +7.46% from previous year)
- 2018: $120,717 (+8,951, +8.01% from previous year)
- 2019: $128,727 (+8,010, +6.64% from previous year)
- 2020: N/A
- 2021: $171,456
- 2022: $217,837 (+46,381, +27.05% from previous year)
- 2023: $241,740 (+23,903, +10.97% from previous year)
- 2024: $256,166 (+14,426, +5.97% from previous year)
- 2025: $274,585 (+18,419, +7.19% from previous year)
Helper’s housing market has exploded since 2016, with home prices growing more than 160%. From just over $100,000 to nearly $275,000, the town’s real estate transformation has been one of the most dramatic in rural Utah.
Helper – From Forgotten Rail Town to Market Riser
Once a bustling coal and rail town, Helper in Carbon County is now reinventing itself. Thanks to art galleries, renovated historic buildings, and an influx of interest from Salt Lake City buyers, the town is riding a wave of revitalization.
The price jumps reflect both increased demand and local efforts to breathe new life into the community. Helper’s affordability compared to Wasatch Front cities has made it a go-to for those craving affordability with character.
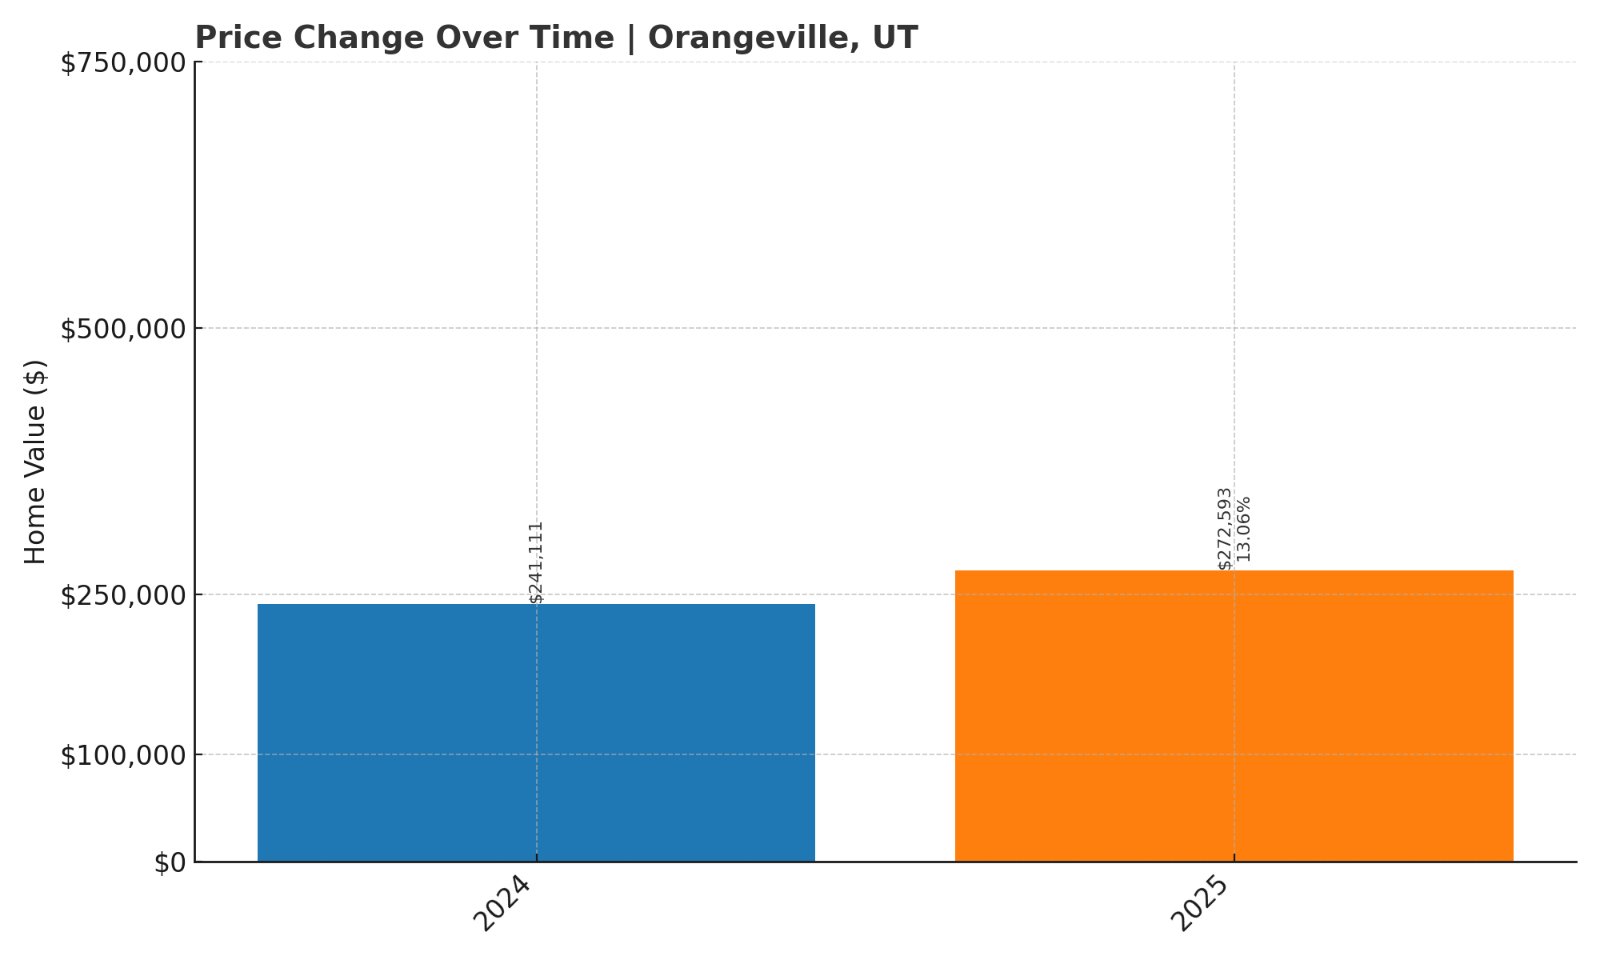
6. Orangeville – 13.1% Home Price Increase Since 2024
- 2010: N/A
- 2011: N/A
- 2012: N/A
- 2013: N/A
- 2014: N/A
- 2015: N/A
- 2016: N/A
- 2017: N/A
- 2018: N/A
- 2019: N/A
- 2020: N/A
- 2021: N/A
- 2022: N/A
- 2023: N/A
- 2024: $241,111
- 2025: $272,593 (+31,482, +13.06% from previous year)
Orangeville’s housing market made a bold move between 2024 and 2025, with home values jumping more than 13% in a single year. Though long-term data is not yet available, the uptick signals new attention toward this quiet Emery County town.
Orangeville – Big Price Jump in a Quiet Community
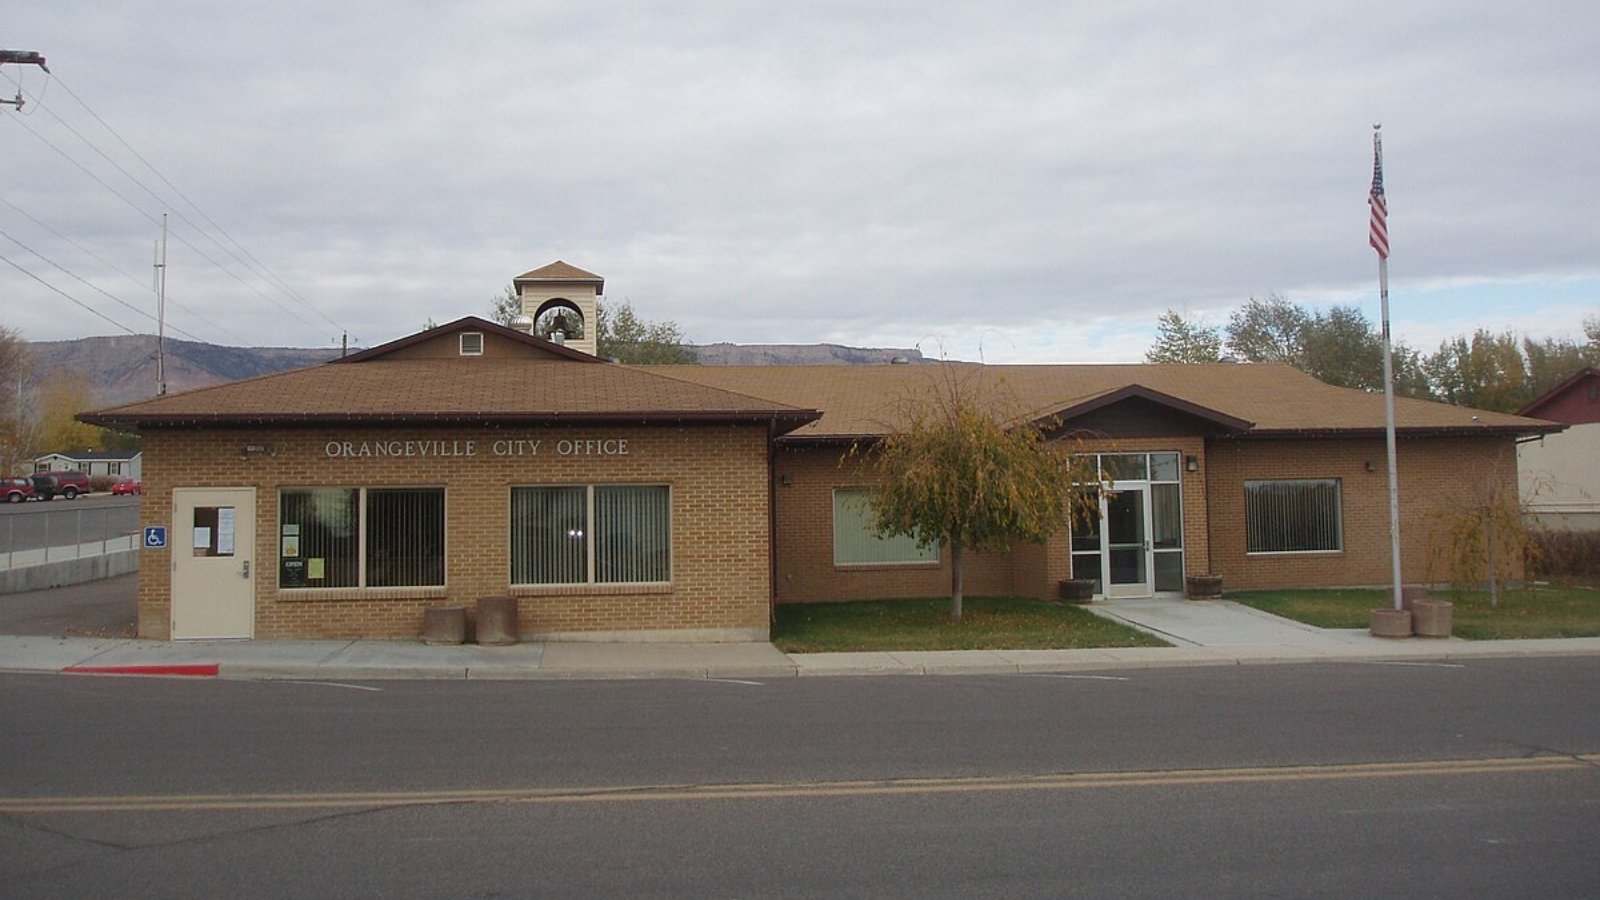
Orangeville lies near the foot of the Wasatch Plateau, surrounded by mines, farms, and the San Rafael Swell. It’s a modest community with just over 1,000 residents, many of whom have deep local roots. Recent price growth suggests new interest, possibly from buyers priced out of other Utah towns.
The scale of the jump, especially without multi-year buildup, may also reflect new listings or a limited housing stock driving up median prices. Either way, Orangeville now finds itself among Utah’s more affordable towns with notable short-term growth.
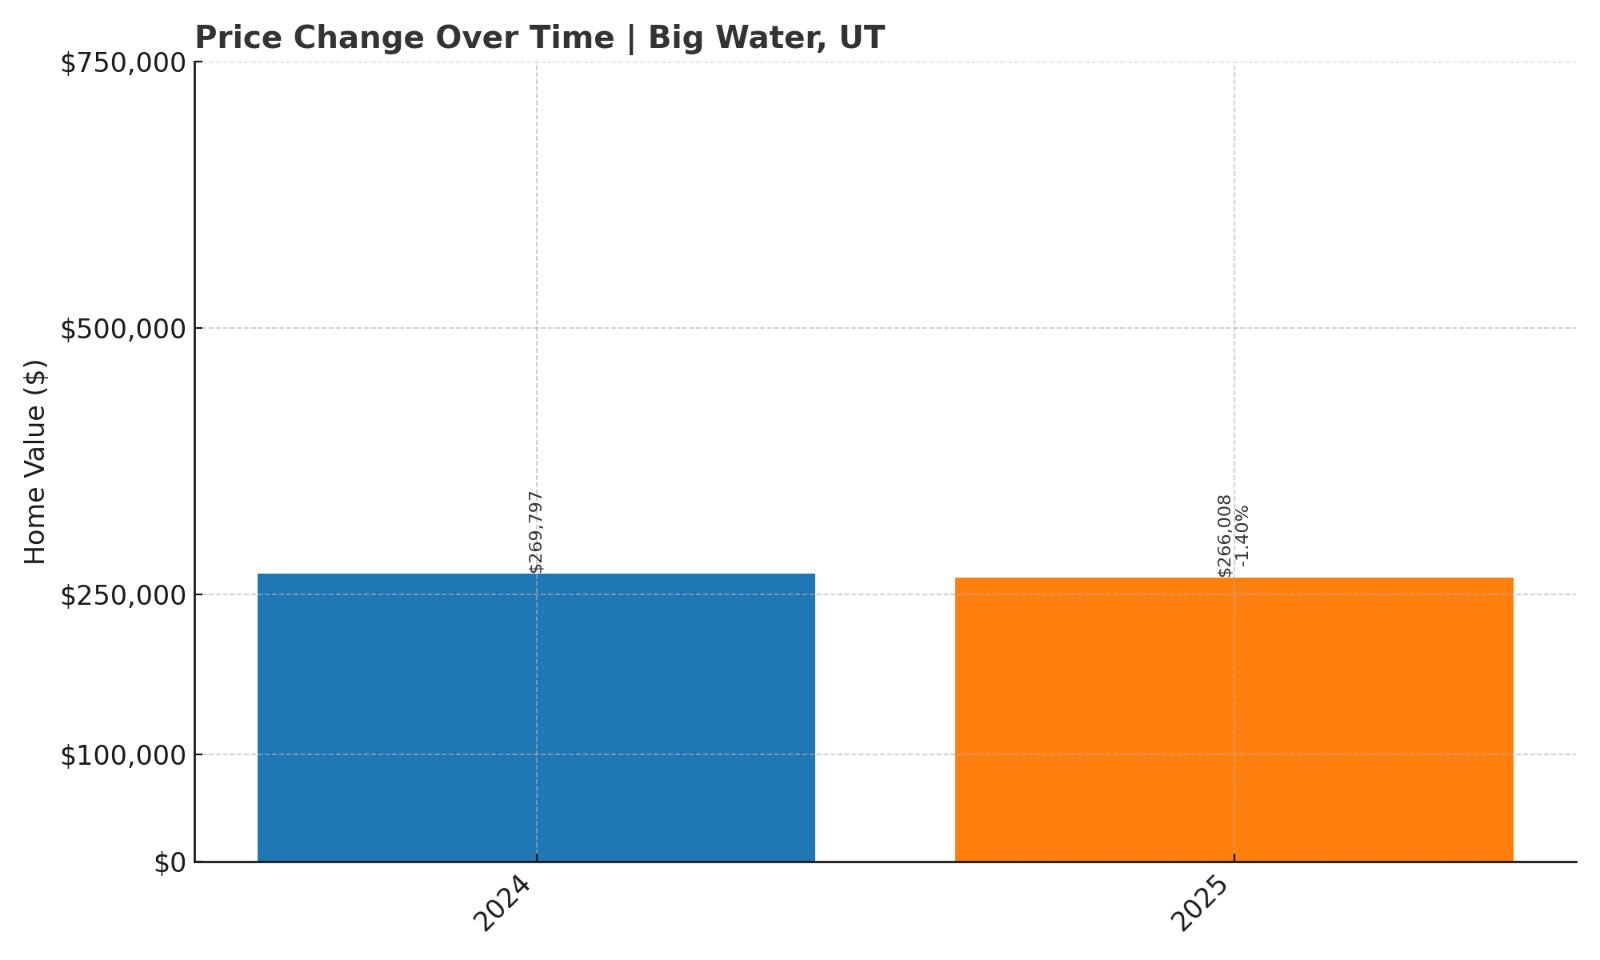
5. Big Water – 1.4% Home Price Decrease Since 2024
- 2010: N/A
- 2011: N/A
- 2012: N/A
- 2013: N/A
- 2014: N/A
- 2015: N/A
- 2016: N/A
- 2017: N/A
- 2018: N/A
- 2019: N/A
- 2020: N/A
- 2021: N/A
- 2022: N/A
- 2023: N/A
- 2024: $269,797
- 2025: $266,008 (-3,789, -1.40% from previous year)
Big Water is one of the few towns on this list to see a year-over-year decrease in home values, slipping 1.4% from 2024 to 2025. The drop is relatively minor, and average prices remain just over $266,000—still well below Utah’s overall median home value.
Big Water – Desert Views With Price Stability
BLMUtah, Public domain, via Wikimedia Commons
Big Water sits near the southern edge of Utah in Kane County, just minutes from the Arizona border and the shores of Lake Powell. It’s a gateway to major outdoor attractions like Grand Staircase–Escalante National Monument, making it a draw for nature lovers and retirees.
The slight drop in price may be the result of a correction following earlier growth or variability in a small local housing market. With open space and scenic beauty, Big Water remains a compelling option for buyers looking to live near Utah’s red rock country without paying Sedona prices.
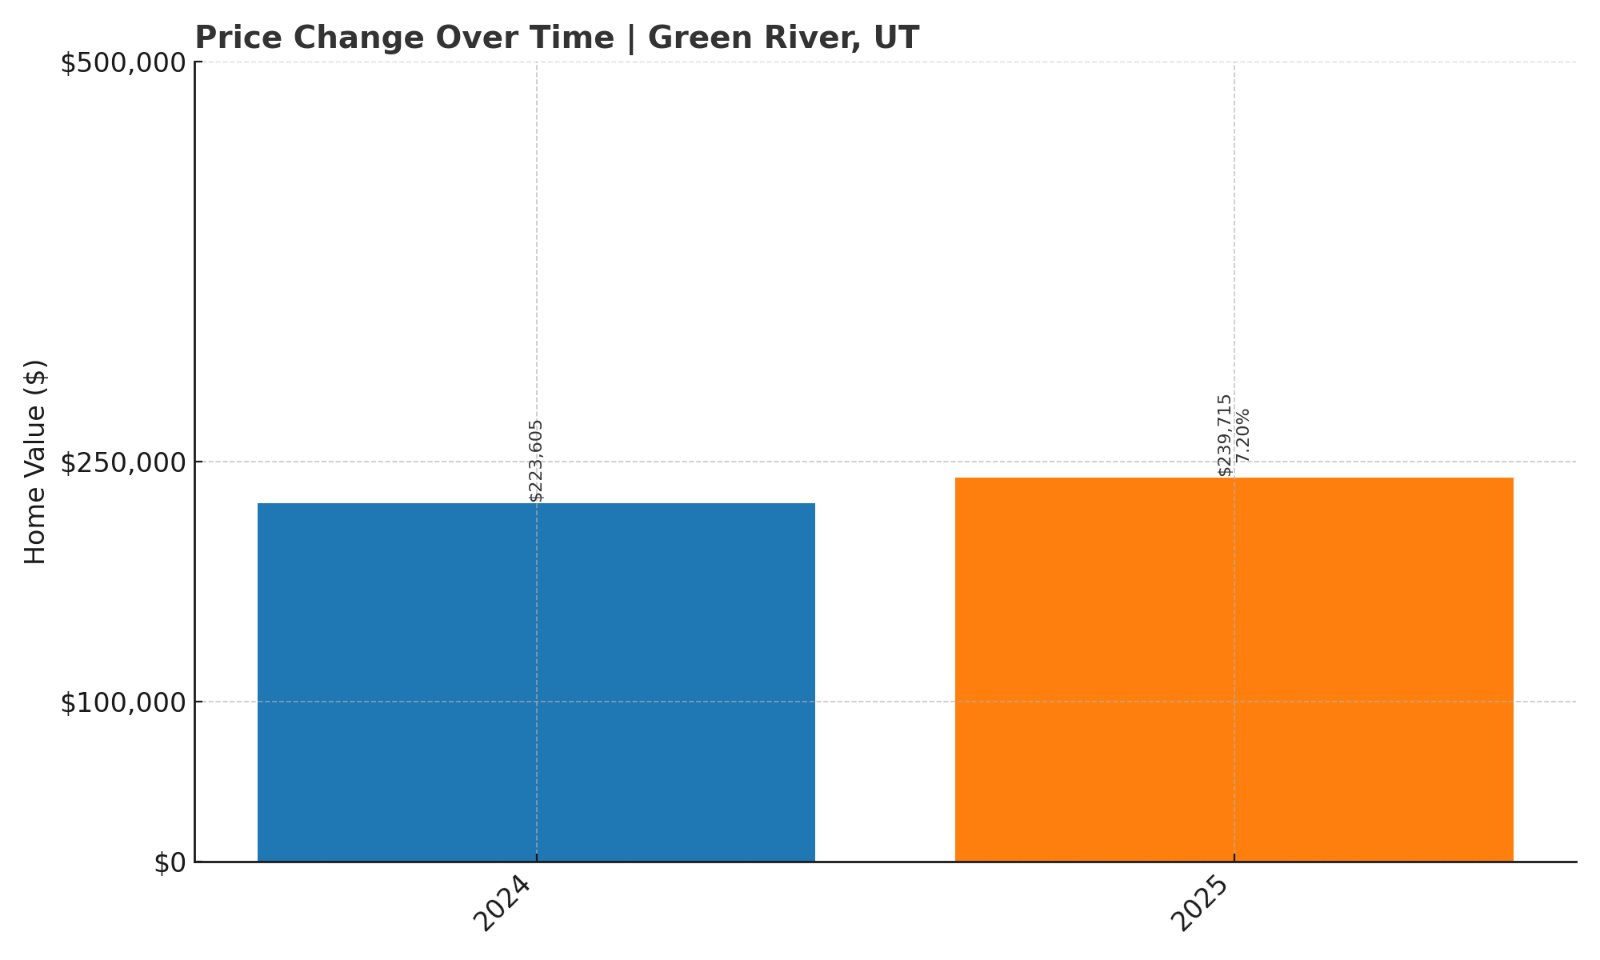
4. Green River – 7.2% Home Price Increase Since 2024
- 2010: N/A
- 2011: N/A
- 2012: N/A
- 2013: N/A
- 2014: N/A
- 2015: N/A
- 2016: N/A
- 2017: N/A
- 2018: N/A
- 2019: N/A
- 2020: N/A
- 2021: N/A
- 2022: N/A
- 2023: N/A
- 2024: $223,605
- 2025: $239,715 (+16,110, +7.20% from previous year)
Green River has seen a healthy 7.2% uptick in home prices since 2024, bringing its 2025 average to just under $240,000. That growth puts it among the more affordable towns in the state, while still signaling forward momentum in the market.
Green River – Budget-Friendly Homes With River Access

Located in Emery County, Green River is best known for its melon farms, desert landscape, and namesake river that snakes through town. Once a stop on the Old Spanish Trail and later the railroad, the town today offers outdoor access and a quiet lifestyle.
Its remote location has kept home values low, but proximity to Arches National Park and the San Rafael Swell has sparked modest tourism and interest from remote workers. Price gains like those seen in 2025 reflect that slow but steady shift.
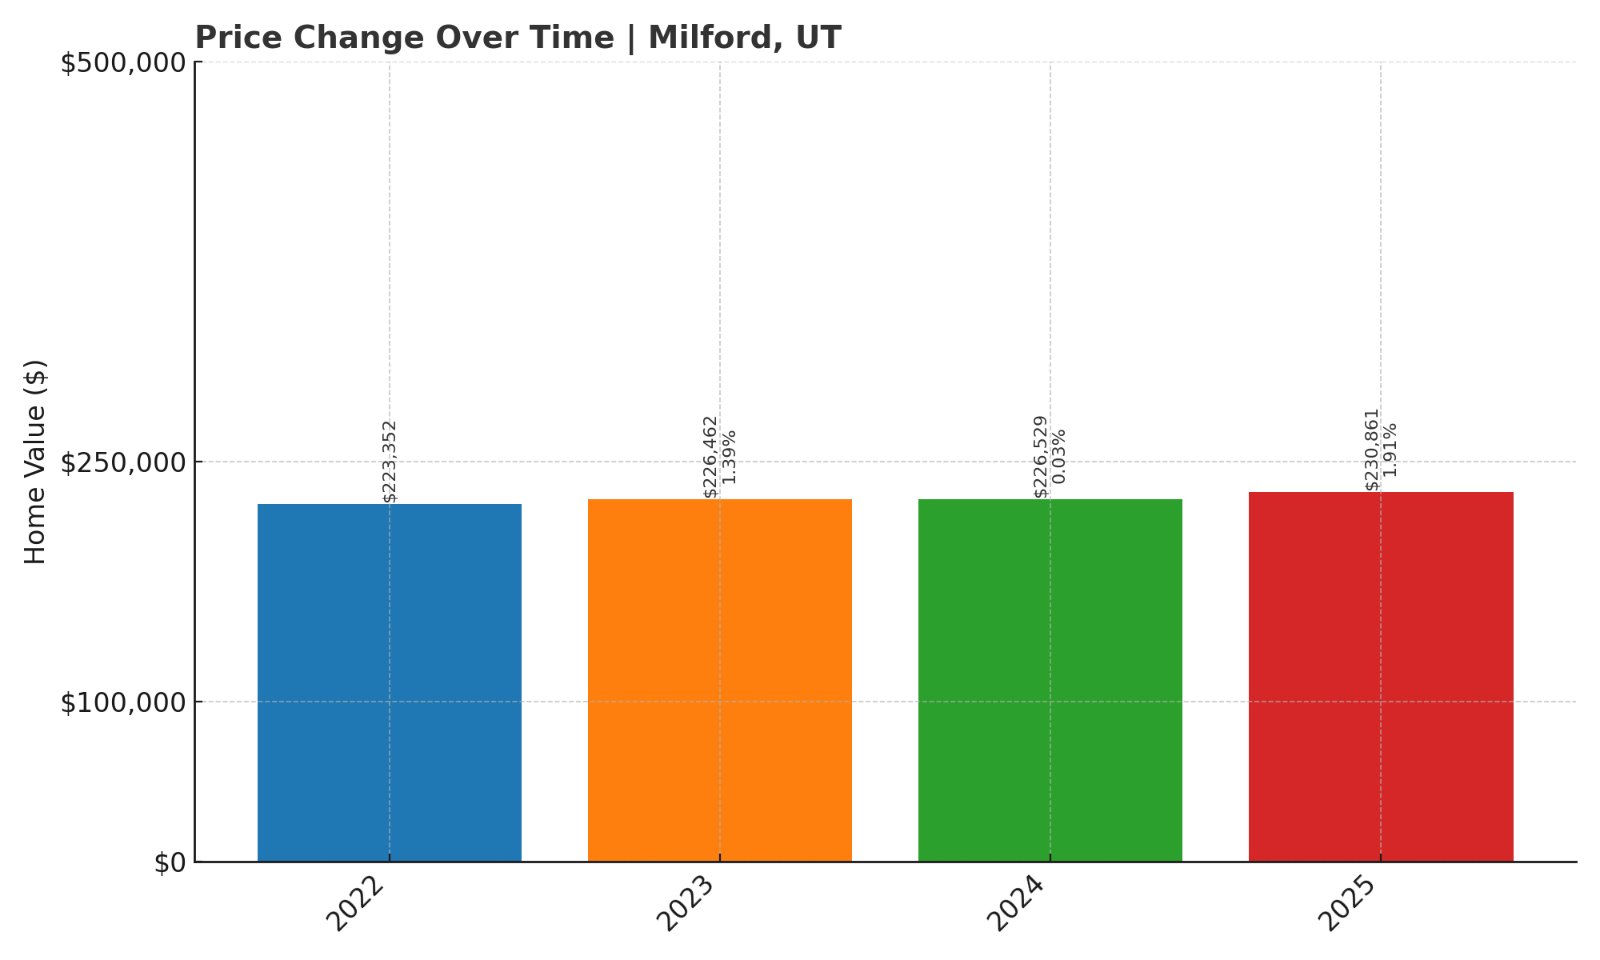
3. Milford – 3.4% Home Price Increase Since 2022
🔥 Would you like to save this?
- 2010: N/A
- 2011: N/A
- 2012: N/A
- 2013: N/A
- 2014: N/A
- 2015: N/A
- 2016: N/A
- 2017: N/A
- 2018: N/A
- 2019: N/A
- 2020: N/A
- 2021: N/A
- 2022: $223,352
- 2023: $226,462 (+3,110, +1.39% from previous year)
- 2024: $226,529 (+67, +0.03% from previous year)
- 2025: $230,861 (+4,332, +1.91% from previous year)
Milford’s housing prices have stayed nearly flat over the past three years, with just a 3.4% total increase since 2022. At $230,861 in 2025, Milford offers one of Utah’s lowest median home prices, making it highly attractive to budget-conscious buyers.
Milford – Rock-Bottom Prices in Western Utah
Milford is tucked into the far western part of Beaver County and has long served as a rail town and agricultural hub. Its isolated location helps keep housing prices grounded, even while nearby communities show sharper price increases.
That said, stable pricing and a slow growth trend may appeal to those looking for affordability without the fear of price volatility. For Utahns seeking wide open space and low housing costs, Milford remains one of the most accessible options on the market.
2. Brian Head – 148% Home Price Increase Since 2012

- 2010: N/A
- 2011: N/A
- 2012: $90,554
- 2013: $84,092 (-6,462, -7.14% from previous year)
- 2014: $96,070 (+11,978, +14.24% from previous year)
- 2015: $93,267 (-2,803, -2.92% from previous year)
- 2016: $97,756 (+4,489, +4.81% from previous year)
- 2017: $100,560 (+2,804, +2.87% from previous year)
- 2018: $99,146 (-1,414, -1.41% from previous year)
- 2019: $111,905 (+12,759, +12.87% from previous year)
- 2020: N/A
- 2021: $146,571
- 2022: $221,688 (+75,117, +51.25% from previous year)
- 2023: $220,851 (-837, -0.38% from previous year)
- 2024: $218,472 (-2,379, -1.08% from previous year)
- 2025: $224,540 (+6,068, +2.78% from previous year)
Brian Head has seen an overall increase of 148% in home values since 2012, despite some recent cooling in prices. From under $91,000 in 2012 to nearly $225,000 in 2025, it remains one of Utah’s most affordable resort towns by a wide margin.
Brian Head – Ski Town Affordability Still Exists
As Utah’s highest town in elevation, Brian Head is primarily known for its ski resort, making it a popular destination for seasonal visitors and second-home buyers. Yet, prices remain relatively low, especially compared to resorts along the Wasatch Front.
Fluctuations in the market are common in vacation communities, but the long-term trend here is clear: consistent growth driven by tourism. Despite some dips since 2022, Brian Head’s combination of outdoor access and entry-level pricing gives it lasting appeal.
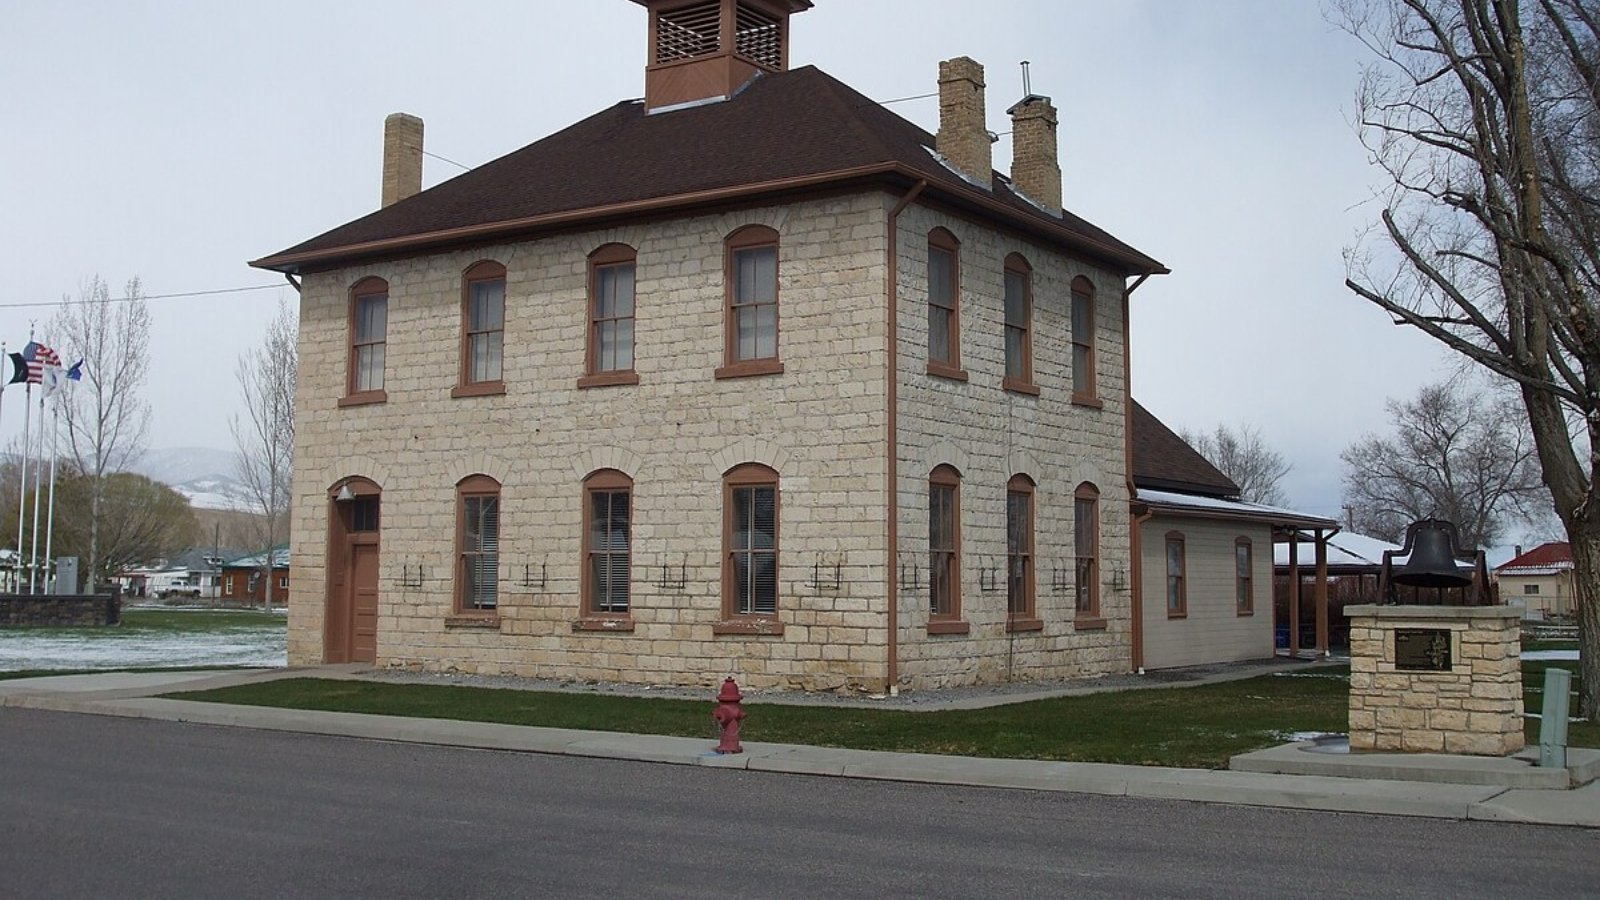
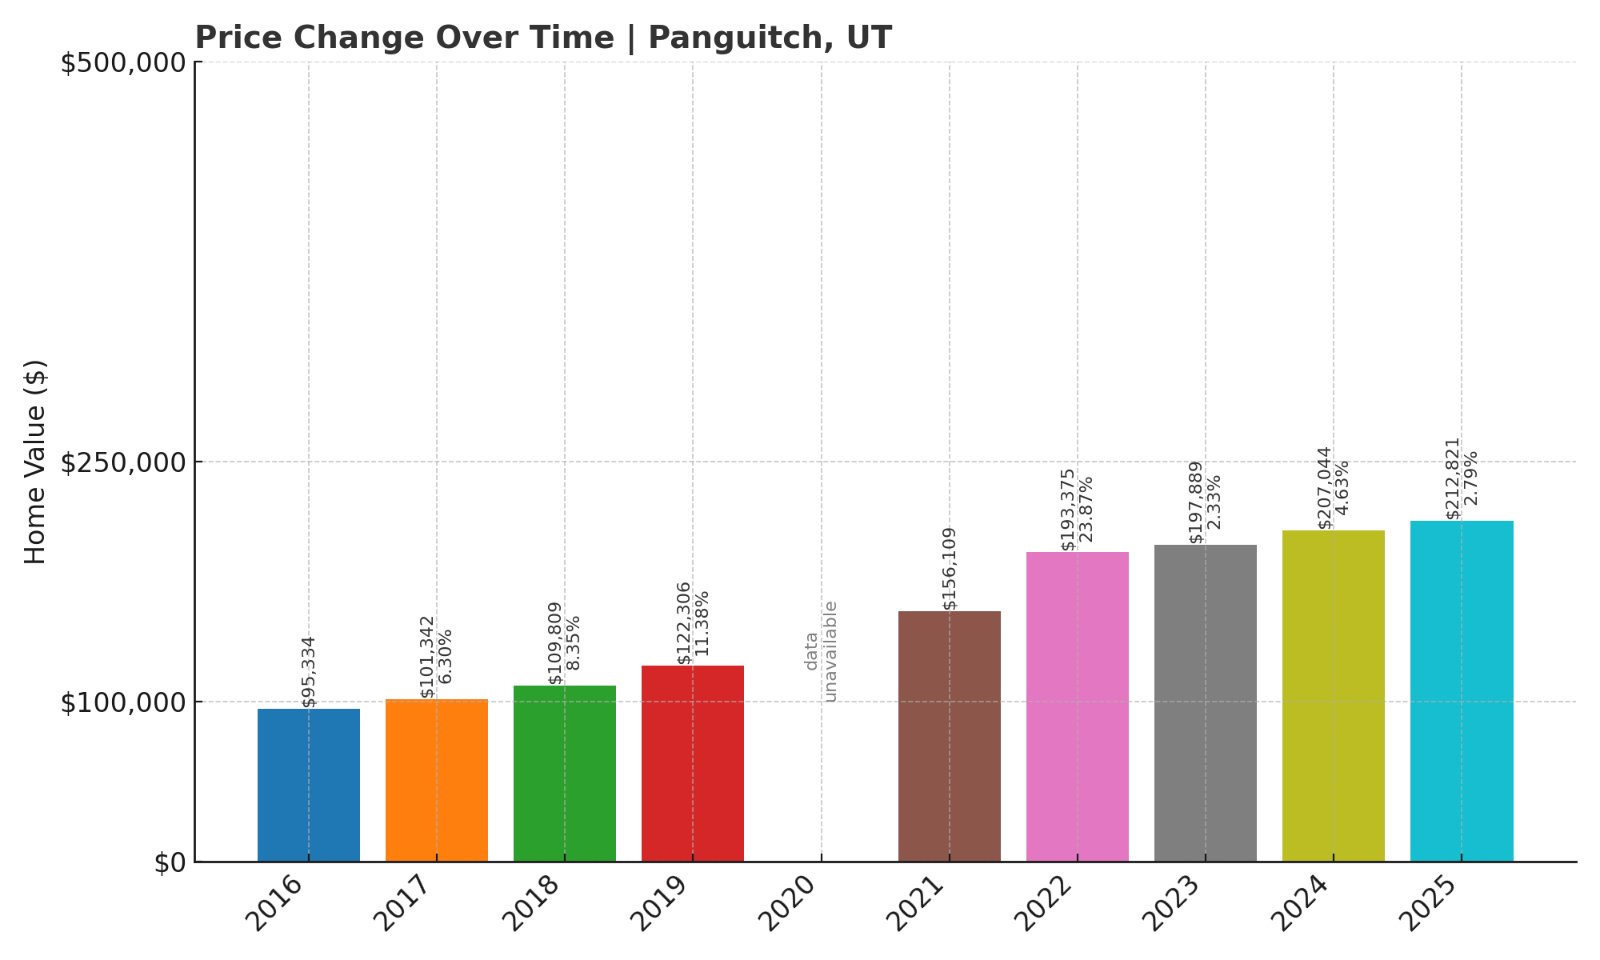
1. Panguitch – 123% Home Price Increase Since 2016
- 2010: N/A
- 2011: N/A
- 2012: N/A
- 2013: N/A
- 2014: N/A
- 2015: N/A
- 2016: $95,334
- 2017: $101,342 (+6,008, +6.30% from previous year)
- 2018: $109,809 (+8,467, +8.35% from previous year)
- 2019: $122,306 (+12,497, +11.38% from previous year)
- 2020: N/A
- 2021: $156,109
- 2022: $193,375 (+37,266, +23.87% from previous year)
- 2023: $197,889 (+4,514, +2.33% from previous year)
- 2024: $207,044 (+9,155, +4.63% from previous year)
- 2025: $212,821 (+5,777, +2.79% from previous year)
Panguitch tops this list with a 123% increase in home values since 2016. From just under $96,000 to nearly $213,000, the market here has expanded steadily over the past decade, making it both affordable and upward-trending.
Panguitch – Quiet Growth in a National Park Gateway
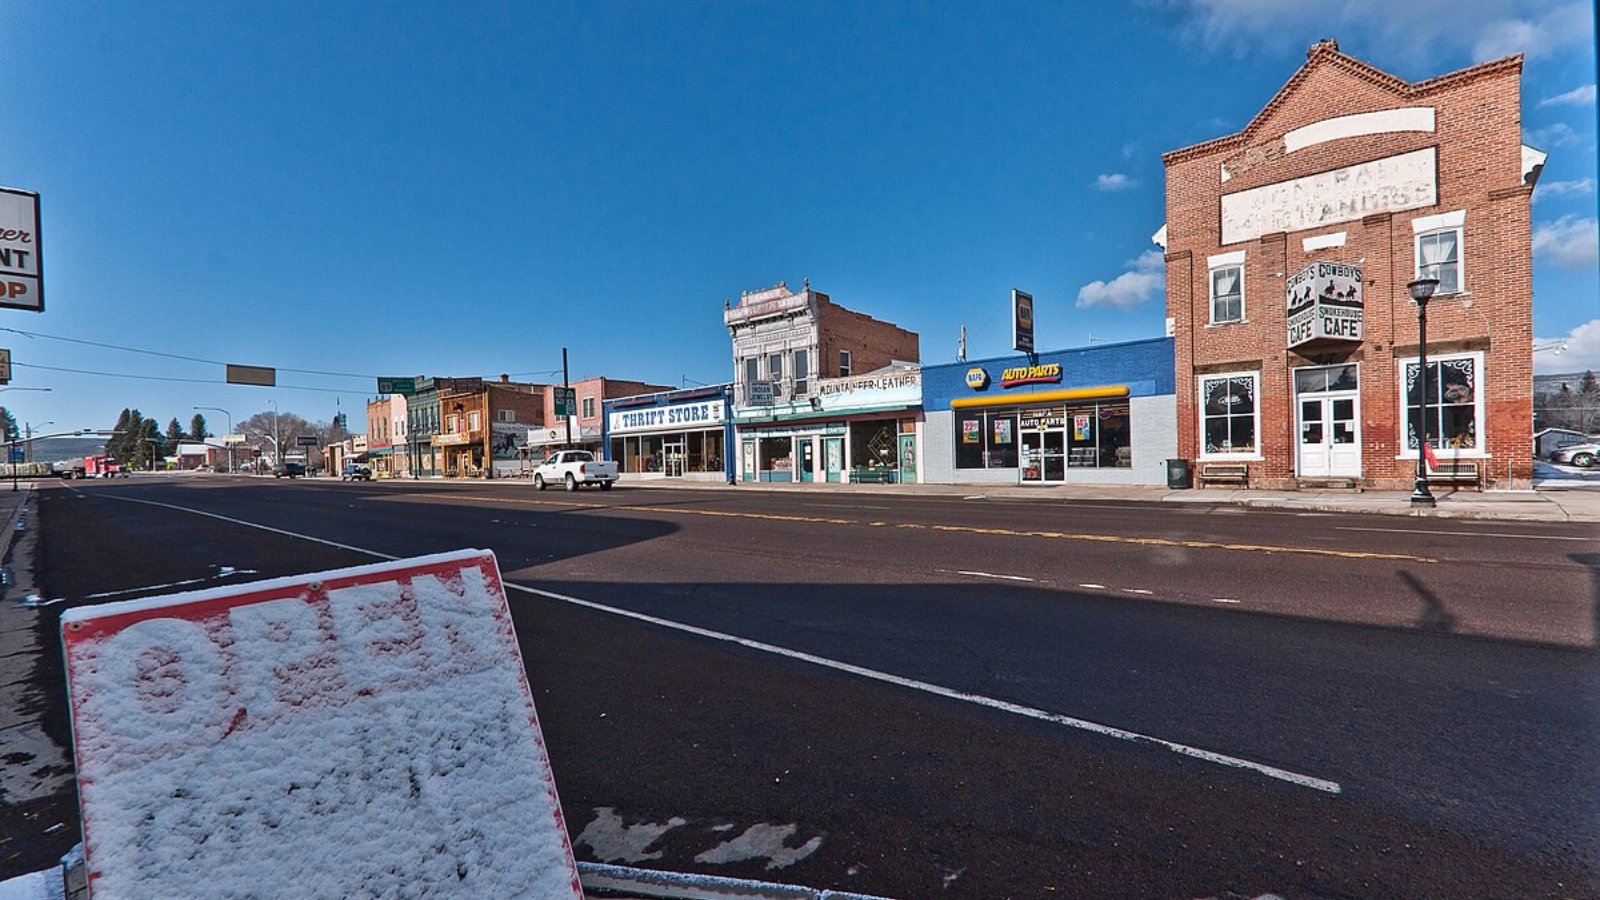
Panguitch is located in Garfield County and serves as a charming base for travelers heading to Bryce Canyon National Park. Its red brick homes, walkable downtown, and local heritage festivals give it distinct personality and historic value.
Though remote, Panguitch’s access to scenic destinations and slow-but-steady growth have drawn interest from those seeking affordable homes in picturesque settings. The market’s stability adds to its appeal for long-term homeowners.


