
🔥 Would you like to save this?
I’ve analyzed data from the Zillow Home Value Index to identify Florida’s towns with the most impressive real estate appreciation over the past decade. The results reveal fascinating geographic and economic patterns across the Sunshine State.
What surprised me most was how many of these high-growth areas are historically undervalued communities now experiencing remarkable revitalization. The Miami-Dade region dominates the list with multiple entries, suggesting a significant economic transformation is underway in previously overlooked neighborhoods.
In order to come up with the very specific design ideas, we create most designs with the assistance of state-of-the-art AI interior design software. Also, assume links that take you off the site are affiliate links such as links to Amazon. this means we may earn a commission if you buy something.
Looking at the decade-long trends, these areas have demonstrated extraordinary resilience through economic fluctuations, with most showing particularly strong acceleration since 2020. Many top performers have nearly tripled in value, representing life-changing equity gains for long-term homeowners.
21. Royal Palm Estates

Historic prices and percent change over time:
- % change from 2016 to 2025: 177.95%
- 2025: $393,978
- 2024: $388,678
- 2023: $354,968
- 2022: $320,689
- 2021: $266,894
- 2020: $239,433
- 2019: $217,644
- 2018: $198,286
- 2017: $171,375
- 2016: $141,745
About Royal Palm Estates

Royal Palm Estates presents an appreciating asset class with its median home price of $393,978 reflecting a 177.95% decade growth rate. Your investment potential here benefits from consistent year-over-year gains that have outpaced inflation significantly. The steady price escalation creates an attractive entry point for value investors seeking markets with proven appreciation histories. Located in a transitioning corridor with improving economic indicators, timing suggests long-term holding prospects remain favorable.
20. Plantation Mobile Home Park

Historic prices and percent change over time:
- % change from 2016 to 2025: 182.81%
- 2025: $389,085
- 2024: $388,295
- 2023: $358,643
- 2022: $315,318
- 2021: $269,459
- 2020: $230,650
- 2019: $211,130
- 2018: $187,902
- 2017: $161,754
- 2016: $137,577
About Plantation Mobile Home Park

With properties now commanding $389,085 median valuations, Plantation Mobile Home Park represents exceptional 182.81% capital appreciation potential. Your equity position would have nearly tripled over this investment window, outperforming many traditional investment vehicles. The area’s growth trajectory shows resilience through economic cycles with particularly strong momentum during the 2020-2023 surge period. Proximity to expanding commercial districts makes this an emerging hotspot for investors seeking value appreciation with future upside potential.
19. Polk City

Historic prices and percent change over time:
- % change from 2016 to 2025: 184.78%
- 2025: $330,257
- 2024: $331,979
- 2023: $314,574
- 2022: $282,079
- 2021: $225,636
- 2020: $196,410
- 2019: $174,673
- 2018: $154,151
- 2017: $141,610
- 2016: $115,968
About Polk City

Polk City’s property values have surged to $330,257, yielding a 184.78% appreciation that signals robust wealth-building opportunities. Your investment here benefits from accelerated growth particularly evident in the 2020-2022 period when values jumped nearly $86,000. The town demonstrates excellent price-to-value metrics compared to surrounding regions, with limited new development preserving scarcity value. Located in a growth corridor with improving infrastructure, long-term market fundamentals remain strong despite recent stabilization.
18. Century Village

Historic prices and percent change over time:
- % change from 2016 to 2025: 187.1%
- 2025: $101,995
- 2024: $116,639
- 2023: $110,588
- 2022: $81,187
- 2021: $62,884
- 2020: $58,247
- 2019: $55,353
- 2018: $50,779
- 2017: $43,367
- 2016: $35,526
About Century Village

Century Village offers exceptional investment metrics with modest $101,995 entry points yet remarkable 187.1% decade appreciation. Your capital would benefit from the area’s rapid value acceleration that saw nearly 30% annual growth during the 2021-2022 period. Despite recent price adjustments from 2024-2025, the long-term appreciation curve remains dramatically positive with potential for market recovery. For investors seeking affordable options with proven growth history, this community presents compelling opportunity-to-cost ratios.
17. Indiantown
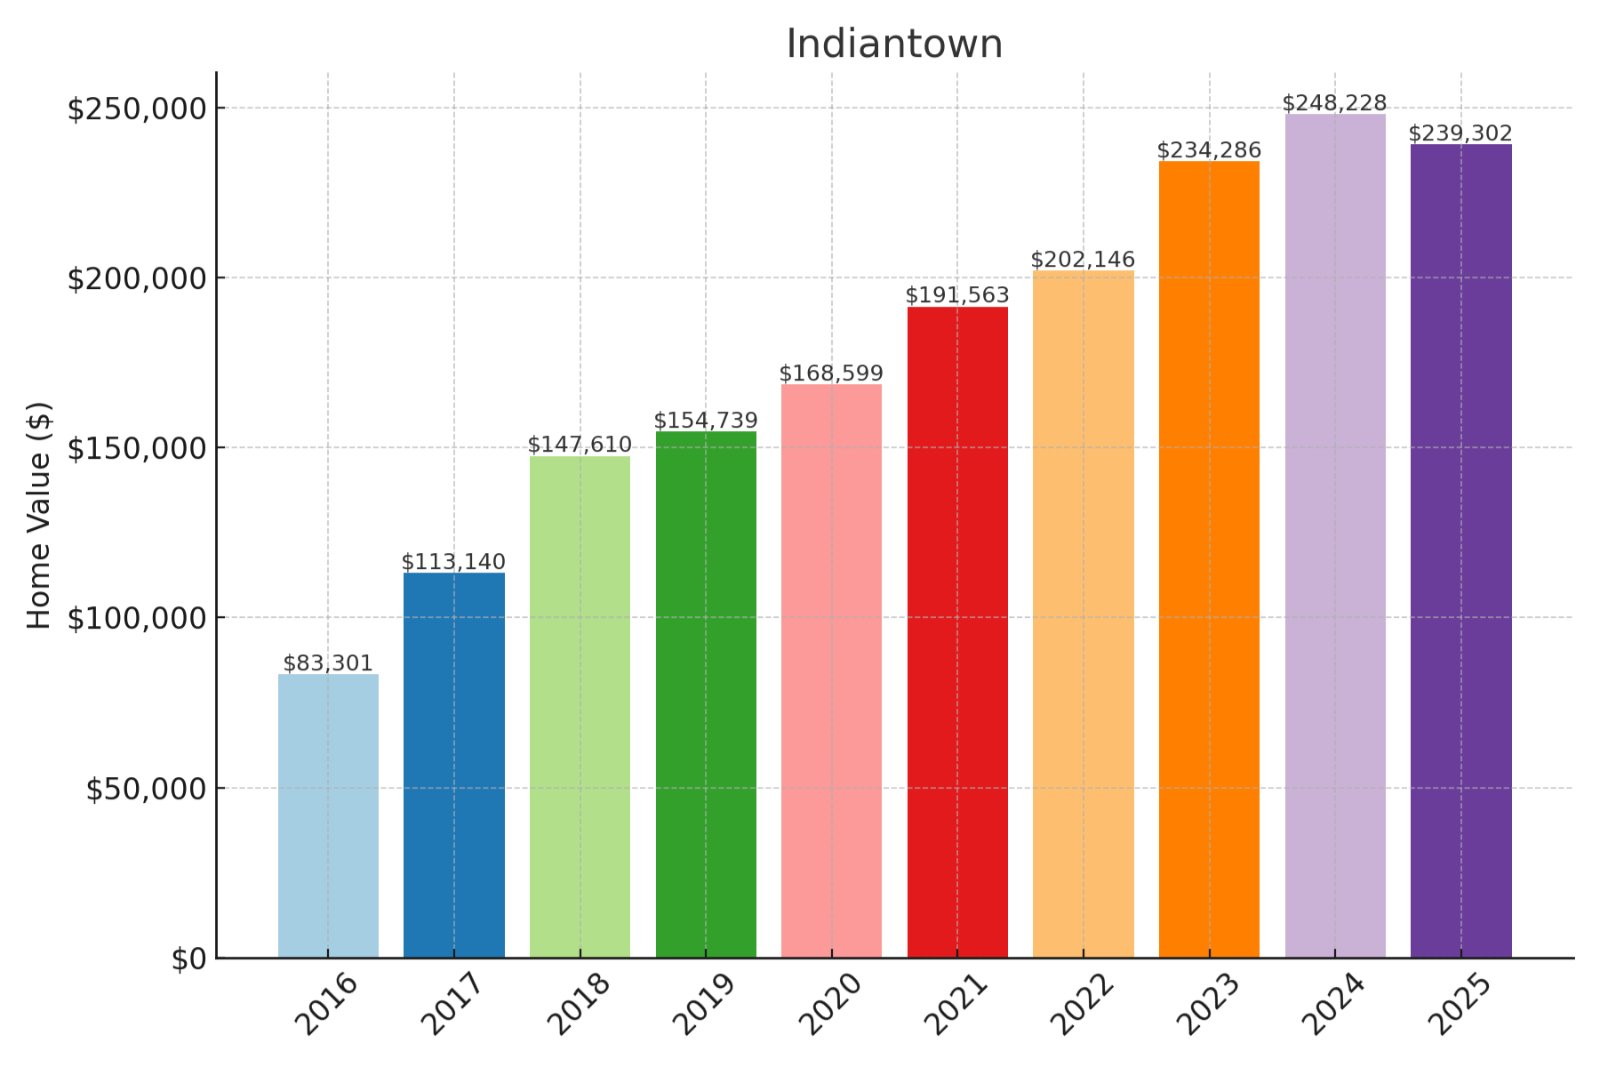
Historic prices and percent change over time:
- % change from 2016 to 2025: 187.27%
- 2025: $239,302
- 2024: $248,228
- 2023: $234,286
- 2022: $202,146
- 2021: $191,563
- 2020: $168,599
- 2019: $154,739
- 2018: $147,610
- 2017: $113,140
- 2016: $83,301
About Indiantown

Indiantown’s investment profile features $239,302 median valuations reflecting extraordinary 187.27% decade appreciation on your potential capital. The market experienced its sharpest value acceleration during 2016-2017 when prices jumped 35.8%, suggesting early recognition of untapped potential. Despite recent modest price adjustments from peak 2024 values, the long-term trendline maintains strong upward momentum. This emerging market offers accessibility at price points significantly below coastal alternatives while delivering comparable appreciation profiles.
16. Golden Glades

Historic prices and percent change over time:
- % change from 2016 to 2025: 190.37%
- 2025: $474,129
- 2024: $467,810
- 2023: $419,633
- 2022: $368,887
- 2021: $309,434
- 2020: $273,017
- 2019: $247,648
- 2018: $221,475
- 2017: $190,590
- 2016: $163,283
About Golden Glades

Golden Glades presents premium investment potential with $474,129 median values representing 190.37% returns over the investment window. Your capital would benefit from the consistent value escalation, particularly during the 2022-2023 period when prices surged nearly $51,000. The area’s proximity to high-demand regions contributes to its sustained appreciation profile with price resilience during market fluctuations. With limited development opportunities constraining supply, the fundamentals point toward continued price support for existing properties.
15. Miami Gardens

🔥 Would you like to save this?
Historic prices and percent change over time:
- % change from 2016 to 2025: 191.06%
- 2025: $472,023
- 2024: $455,244
- 2023: $406,116
- 2022: $358,985
- 2021: $304,500
- 2020: $269,820
- 2019: $248,480
- 2018: $224,424
- 2017: $191,835
- 2016: $162,171
About Miami Gardens

Miami Gardens offers substantial wealth-building potential with its $472,023 median values reflecting 191.06% decade appreciation on invested capital. Your property portfolio would benefit from the remarkable $309,852 absolute dollar gain over the study period. The market demonstrates exceptional resilience with consistent year-over-year growth through varying economic conditions. Located in an emerging commercial corridor with continuing infrastructure investments, property values show strong fundamentals for sustained appreciation.
14. Masaryktown

Historic prices and percent change over time:
- % change from 2016 to 2025: 202.07%
- 2025: $243,987
- 2024: $242,400
- 2023: $223,538
- 2022: $204,678
- 2021: $156,932
- 2020: $132,617
- 2019: $120,941
- 2018: $110,970
- 2017: $92,982
- 2016: $80,773
About Masaryktown

Masaryktown’s $243,987 median property values represent extraordinary 202.07% returns, tripling your investment capital over the decade. You would benefit from the market’s accelerated growth phase during 2020-2022 when values increased by nearly $72,000 in just two years. The area offers excellent value relative to surrounding markets with comparable growth metrics but at more accessible price points. Recent price stabilization suggests a sustainable consolidation phase following the rapid appreciation period rather than market weakness.
13. Port Richey

Historic prices and percent change over time:
- % change from 2016 to 2025: 204.41%
- 2025: $230,798
- 2024: $241,575
- 2023: $231,631
- 2022: $212,811
- 2021: $158,013
- 2020: $135,295
- 2019: $124,724
- 2018: $111,865
- 2017: $93,546
- 2016: $75,819
About Port Richey

Port Richey’s investment profile features $230,798 current valuations representing exceptional 204.41% appreciation on your capital deployment. Your property assets would have experienced particularly dramatic growth during 2020-2022 when values surged nearly $78,000. Despite recent price moderation from 2024 peaks, the long-term investment thesis remains intact with substantial realized equity. The coastal community’s limited developable land creates natural supply constraints that support continued price stability.
12. Holiday

Historic prices and percent change over time:
- % change from 2016 to 2025: 205.53%
- 2025: $229,278
- 2024: $243,083
- 2023: $232,402
- 2022: $207,309
- 2021: $156,270
- 2020: $135,187
- 2019: $123,538
- 2018: $108,038
- 2017: $89,320
- 2016: $75,043
About Holiday

Holiday presents exceptional investment metrics with current values of $229,278 reflecting remarkable 205.53% decade appreciation on capital. Your property portfolio would have benefited most dramatically during 2020-2022 when values surged by $72,122 in just two calendar years. While experiencing modest market correction from 2024 peaks, the long-term growth trajectory remains impressively positive with strong fundamentals. The coastal community’s natural geographic constraints limit new development, supporting continued price stability for existing properties.
11. West Park

Historic prices and percent change over time:
- % change from 2016 to 2025: 207.31%
- 2025: $425,272
- 2024: $416,029
- 2023: $376,835
- 2022: $337,975
- 2021: $280,348
- 2020: $249,475
- 2019: $225,621
- 2018: $197,976
- 2017: $164,288
- 2016: $138,388
About West Park

West Park’s investment landscape features $425,272 median values representing extraordinary 207.31% returns, more than tripling your initial capital. Your property assets would have consistently appreciated through all market conditions, with particularly strong acceleration during 2021-2023. The location benefits from proximity to high-demand areas while maintaining relative value advantage compared to neighboring premium markets. With a $286,884 absolute dollar gain over the study period, existing homeowners have realized substantial equity positions.
10. Pine Hills

Historic prices and percent change over time:
- % change from 2016 to 2025: 207.85%
- 2025: $280,605
- 2024: $282,500
- 2023: $264,060
- 2022: $243,752
- 2021: $200,455
- 2020: $177,340
- 2019: $165,873
- 2018: $141,869
- 2017: $111,126
- 2016: $91,150
About Pine Hills

Pine Hills offers compelling investment metrics with $280,605 current values representing exceptional 207.85% appreciation on deployed capital. Your equity position would have benefited most during 2016-2018 and 2020-2022, both periods showing accelerated value creation above market averages. The area demonstrates excellent price resilience with only minimal adjustment from 2024 peak values despite broader market headwinds. Accessibility at price points significantly below regional averages while delivering superior appreciation rates makes this a value investor’s opportunity.
9. Westview

🔥 Would you like to save this?
Historic prices and percent change over time:
- % change from 2016 to 2025: 212.89%
- 2025: $463,837
- 2024: $446,461
- 2023: $394,094
- 2022: $343,213
- 2021: $289,183
- 2020: $255,608
- 2019: $231,670
- 2018: $206,229
- 2017: $171,567
- 2016: $148,243
About Westview

Westview presents premium investment opportunities with $463,837 current valuations reflecting remarkable 212.89% decade appreciation on capital. Your property portfolio would show a staggering $315,594 absolute dollar gain through the analysis period, representing significant wealth creation. The market demonstrates exceptional resilience with consistent growth through varying economic conditions including accelerated momentum since 2020. Located in a high-demand corridor with limited new development opportunities, long-term price fundamentals remain exceptionally strong.
8. Florida City

Historic prices and percent change over time:
- % change from 2016 to 2025: 216.9%
- 2025: $380,303
- 2024: $369,899
- 2023: $342,040
- 2022: $301,333
- 2021: $236,914
- 2020: $211,681
- 2019: $194,605
- 2018: $176,410
- 2017: $147,773
- 2016: $120,008
About Florida City

Florida City exhibits extraordinary investment potential with $380,303 current values representing remarkable 216.9% decade appreciation on deployed capital. Your property assets would have experienced particularly dramatic growth during 2020-2022 when values surged by $89,652. The market demonstrates excellent compounding metrics with average annual appreciation exceeding 13.8% – substantially outperforming traditional investment vehicles. Strategic location near expanding economic corridors suggests continued strong fundamentals despite broader market fluctuations.
7. West Little River

Historic prices and percent change over time:
- % change from 2016 to 2025: 231.3%
- 2025: $434,313
- 2024: $416,289
- 2023: $369,409
- 2022: $327,155
- 2021: $284,117
- 2020: $250,394
- 2019: $222,991
- 2018: $195,506
- 2017: $161,765
- 2016: $131,092
About West Little River

West Little River presents exceptional wealth-building opportunities with $434,313 current values reflecting extraordinary 231.3% returns on investment capital. Your property assets would show remarkable $303,221 absolute dollar appreciation through this analysis period, representing significant wealth creation potential. The market demonstrates excellent price resilience with consistent year-over-year growth including accelerated momentum since 2022. Located in a revitalizing corridor with improving economic indicators, property fundamentals suggest continued strong valuation support.
6. Pinewood

Historic prices and percent change over time:
- % change from 2016 to 2025: 232.92%
- 2025: $430,859
- 2024: $422,456
- 2023: $382,500
- 2022: $335,182
- 2021: $278,325
- 2020: $248,629
- 2019: $220,183
- 2018: $193,838
- 2017: $159,338
- 2016: $129,417
About Pinewood

Pinewood offers extraordinary investment performance with $430,859 current values representing exceptional 232.92% decade appreciation on capital deployment. Your property portfolio would benefit from the substantial $301,442 absolute dollar gain through this analysis window, generating significant wealth effect. The market shows particularly impressive momentum since 2020, with three consecutive years of double-digit annual appreciation. Located in a transitioning neighborhood with improving amenities and infrastructure, property fundamentals suggest continued strong price support.
5. Opa-locka

Historic prices and percent change over time:
- % change from 2016 to 2025: 252.61%
- 2025: $471,360
- 2024: $459,188
- 2023: $407,909
- 2022: $359,561
- 2021: $308,433
- 2020: $272,910
- 2019: $241,140
- 2018: $209,832
- 2017: $167,335
- 2016: $133,676
About Opa-locka

🔥 Would you like to save this?
Opa-locka presents premium investment metrics with $471,360 current valuations reflecting remarkable 252.61% appreciation, more than tripling your initial capital. Your property assets would show extraordinary $337,684 absolute dollar gains throughout this period, creating substantial wealth accumulation opportunity. The market demonstrates exceptional resilience with consistent growth through all economic conditions including accelerated momentum since 2020. Strategic location in a revitalizing corridor with significant infrastructure investments supports continued strong price fundamentals.
4. Tangelo Park

Historic prices and percent change over time:
- % change from 2016 to 2025: 271.37%
- 2025: $253,320
- 2024: $260,199
- 2023: $236,864
- 2022: $210,158
- 2021: $174,869
- 2020: $147,322
- 2019: $134,586
- 2018: $116,391
- 2017: $86,823
- 2016: $68,211
About Tangelo Park

Tangelo Park offers exceptional wealth-building potential with modest $253,320 entry points yet extraordinary 271.37% decade appreciation on invested capital. Your property portfolio would have experienced its sharpest value acceleration during 2020-2022 when prices surged by $62,836. Despite modest price correction from 2024 peaks, the long-term investment thesis remains intact with substantial realized equity. Given the area’s strategic location near major employment and entertainment hubs, fundamental demand drivers remain strong.
3. Eatonville

Historic prices and percent change over time:
- % change from 2016 to 2025: 281.31%
- 2025: $247,926
- 2024: $246,557
- 2023: $233,294
- 2022: $196,951
- 2021: $170,644
- 2020: $136,154
- 2019: $130,143
- 2018: $104,633
- 2017: $84,057
- 2016: $65,020
About Eatonville

Eatonville presents exceptional investment metrics with accessible $247,926 valuations reflecting extraordinary 281.31% appreciation, nearly quadrupling your initial capital. Your property assets would have experienced their most dramatic growth during 2017-2018 and 2020-2022, both representing accelerated value creation phases. The historic community offers compelling price-to-growth ratios with $182,906 absolute dollar gains through the study period. Limited development opportunities within the established community create natural supply constraints supporting continued price stability.
2. Gladeview

Historic prices and percent change over time:
- % change from 2016 to 2025: 282.94%
- 2025: $399,220
- 2024: $389,950
- 2023: $345,839
- 2022: $309,066
- 2021: $253,635
- 2020: $225,312
- 2019: $196,951
- 2018: $164,711
- 2017: $130,801
- 2016: $104,253
About Gladeview

Gladeview delivers exceptional investment performance with $399,220 current values representing remarkable 282.94% decade appreciation, nearly quadrupling your initial capital. Your property assets would show extraordinary $294,967 absolute dollar gains throughout this analysis period, generating substantial wealth creation. The market demonstrates particularly strong acceleration since 2020, with consistent double-digit annual appreciation rates. Located in a transitioning urban corridor with improving amenities and infrastructure, property fundamentals suggest continued strong long-term price support.
1. Brownsville

Historic prices and percent change over time:
- % change from 2016 to 2025: 293.21%
- 2025: $412,923
- 2024: $399,070
- 2023: $355,876
- 2022: $313,798
- 2021: $261,966
- 2020: $226,759
- 2019: $196,440
- 2018: $167,889
- 2017: $135,866
- 2016: $105,013
About Brownsville

Brownsville leads Florida’s appreciation markets with $412,923 current values reflecting extraordinary 293.21% returns, nearly quadrupling your initial investment capital. Your property assets would benefit from the remarkable $307,910 absolute dollar gain through this analysis period, representing transformative wealth creation potential. The market shows exceptional resilience with consistent year-over-year growth throughout varying economic conditions including accelerated momentum since 2020. Located in a rapidly revitalizing urban corridor with significant redevelopment activity, long-term fundamentals remain exceptionally strong.


