
🔥 Would you like to save this?
I’ve analyzed data from the Zillow Home Value Index, which reveals fascinating trends in Alabama’s housing market over the past decade.
The coastal towns and lakefront communities are clearly outperforming other areas, with places like Elberta and Dauphin Island showing remarkable growth trajectories that outpace even many urban centers.
In order to come up with the very specific design ideas, we create most designs with the assistance of state-of-the-art AI interior design software. Also, assume links that take you off the site are affiliate links such as links to Amazon. this means we may earn a commission if you buy something.
What surprised me most was seeing such consistent growth patterns across diverse geographies within Alabama – from tiny mountain retreats to Gulf Coast havens, suggesting a statewide momentum rather than isolated pockets of opportunity.
25. Cedar Bluff
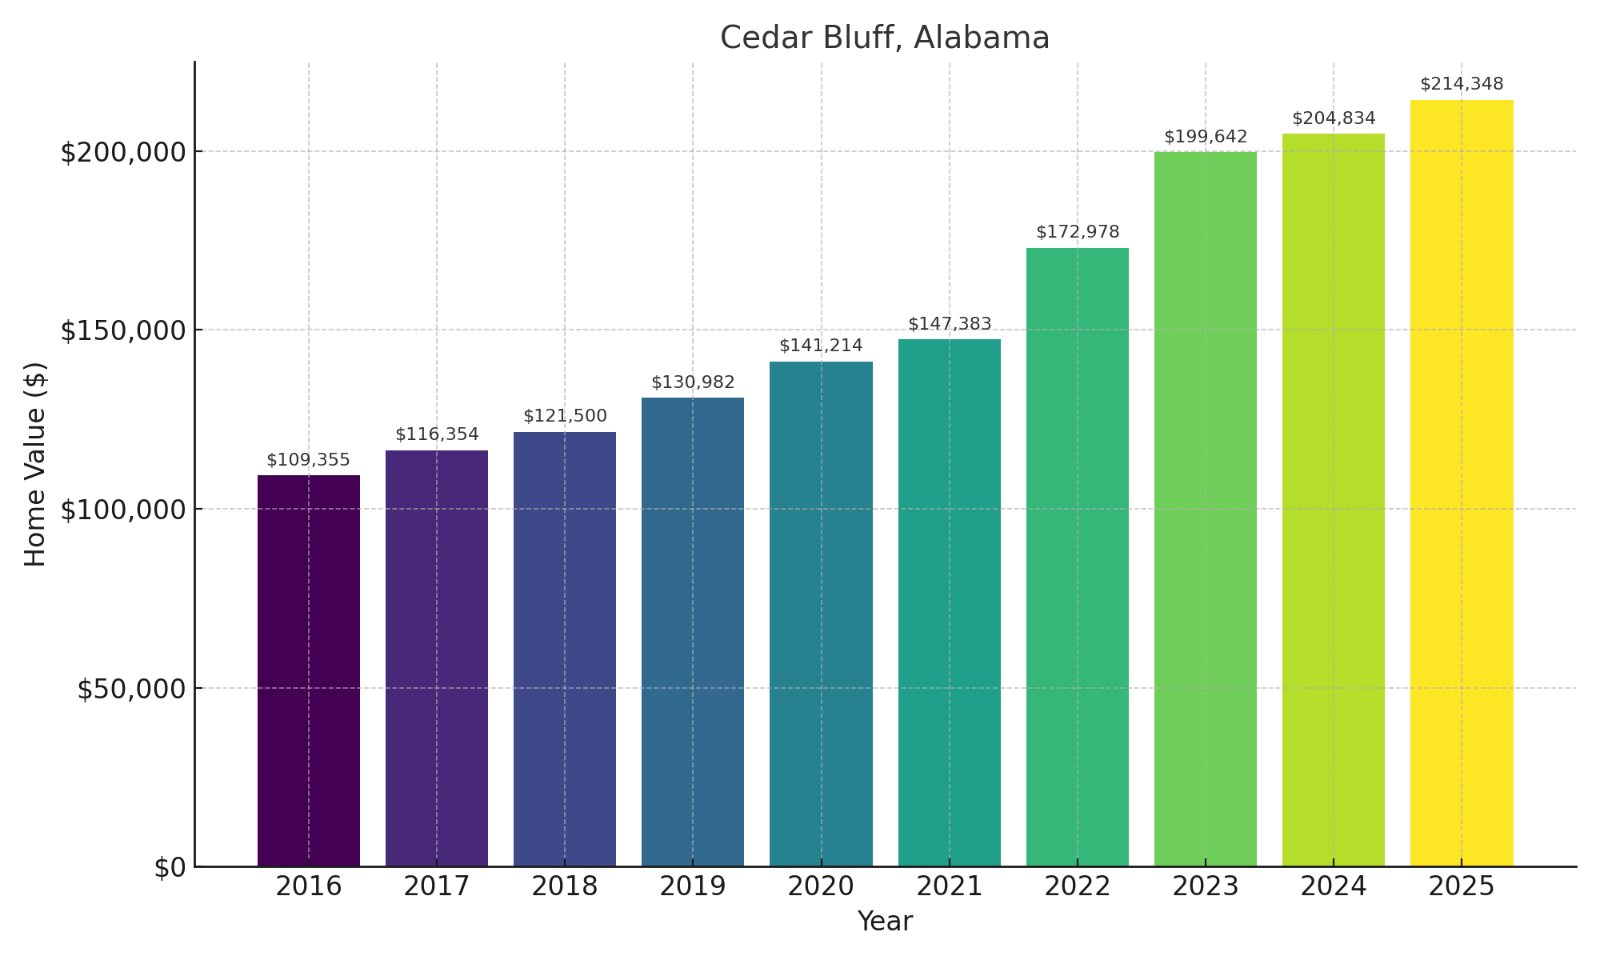
- % change from 2016 to 2025: 91.19%
- 2025: $214,348
- 2024: $204,834
- 2023: $199,642
- 2022: $172,978
- 2021: $147,383
- 2020: $141,214
- 2019: $130,982
- 2018: $121,500
- 2017: $116,354
- 2016: $109,355
Your investment in Cedar Bluff would have nearly doubled in value since 2016, outperforming many traditional investment vehicles. This lakeside community shows strong year-over-year appreciation trends, suggesting continued demand and limited inventory. For sellers, this represents an ideal market to maximize equity gained, while buyers should expect to pay premium prices for waterfront properties. The consistent growth trajectory indicates robust long-term value potential despite its small-town setting.
24. Heflin

- % change from 2016 to 2025: 91.25%
- 2025: $210,134
- 2024: $202,855
- 2023: $209,841
- 2022: $177,054
- 2021: $152,333
- 2020: $139,743
- 2019: $131,744
- 2018: $127,149
- 2017: $117,192
- 2016: $110,179
Heflin presents an impressive investment case with 91.25% appreciation over nine years, representing an annualized return of approximately 7.5%. The slight dip between 2023-2024 indicates market correction rather than declining fundamentals. Investors should note the strong recovery in 2025, suggesting the underlying economic factors remain solid. Located along I-20, Heflin’s strategic position continues to drive demand despite its relatively modest median home values.
23. Loxley

- % change from 2016 to 2025: 92.65%
- 2025: $290,295
- 2024: $277,457
- 2023: $261,180
- 2022: $219,664
- 2021: $191,867
- 2020: $180,685
- 2019: $171,013
- 2018: $160,206
- 2017: $152,536
- 2016: $141,844
Loxley’s property values show remarkable consistency, with no down years and an acceleration in growth after 2021 that signals strengthening market fundamentals. The average price point sitting at $290,295 in 2025 offers a compelling value proposition compared to nearby coastal communities. For investors, the steady appreciation curve suggests low volatility and reliable equity building potential. The proximity to Gulf Shores without the premium prices makes this an attractive arbitrage opportunity in the coastal corridor.
22. Minor

- % change from 2016 to 2025: 92.9%
- 2025: $109,041
- 2024: $110,841
- 2023: $109,860
- 2022: $94,589
- 2021: $74,632
- 2020: $69,420
- 2019: $55,240
- 2018: $55,617
- 2017: $58,236
- 2016: $49,075
Minor offers extraordinary ROI potential with comparatively low capital requirements, making it ideal for first-time investors or portfolio diversification. Despite its modest absolute values, the financial growth trajectory shows 92.9% appreciation, outperforming many higher-priced markets. The slight value regression between 2024-2025 indicates a price consolidation phase rather than trend reversal. For budget-conscious buyers, Minor’s sub-$110K average price point combined with its proven growth history creates an appealing entry-level investment opportunity.
21. Munford

- % change from 2016 to 2025: 93.18%
- 2025: $166,579
- 2024: $157,585
- 2023: $162,602
- 2022: $145,248
- 2021: $119,988
- 2020: $109,869
- 2019: $109,801
- 2018: $100,601
- 2017: $96,067
- 2016: $89,515
Munford’s property values represent exceptional wealth creation potential, having nearly doubled since 2016 while maintaining an accessible price point. The temporary plateau between 2019-2020 followed by accelerated growth demonstrates resilience and emerging demand dynamics. Investors should note the strong recovery after a minor correction in 2023-2024, suggesting underlying market strength. The value proposition remains compelling with prices still under $170K despite the consistent upward trajectory.
20. Sardis City

- % change from 2016 to 2025: 93.68%
- 2025: $215,833
- 2024: $200,239
- 2023: $193,446
- 2022: $161,824
- 2021: $144,829
- 2020: $131,719
- 2019: $128,808
- 2018: $121,721
- 2017: $119,459
- 2016: $116,027
Sardis City demonstrates exceptional financial performance with 93.68% appreciation, representing an annualized return of approximately 7.6% that outpaces many traditional investment vehicles. The accelerated growth since 2021 (49% in just four years) signals increasing market momentum and demand. For investors, the consistent year-over-year gains without significant corrections indicate low volatility and sustainable appreciation patterns. The robust price appreciation combined with still-moderate entry points creates an attractive risk-return profile for mid-range investors.
19. Crossville

- % change from 2016 to 2025: 93.74%
- 2025: $174,122
- 2024: $174,060
- 2023: $162,536
- 2022: $146,657
- 2021: $122,427
- 2020: $113,193
- 2019: $108,744
- 2018: $103,547
- 2017: $98,488
- 2016: $87,585
Crossville presents a compelling value proposition with 93.74% appreciation while maintaining prices well below the state median. The flat growth between 2024-2025 suggests a natural consolidation phase after rapid 7.1% growth the previous year. For real estate portfolio diversification, Crossville offers significant upside potential without requiring substantial capital outlay. The steady growth curve without significant corrections indicates a stable market with consistent demand factors driving appreciation.
18. Bay Minette

- % change from 2016 to 2025: 94.5%
- 2025: $216,752
- 2024: $206,989
- 2023: $200,782
- 2022: $176,267
- 2021: $145,923
- 2020: $137,588
- 2019: $127,277
- 2018: $120,895
- 2017: $114,067
- 2016: $103,364
Bay Minette’s impressive 94.5% property value increase represents substantial wealth creation potential in this county seat location. The financial performance shows remarkable consistency with no down years and accelerated growth between 2021-2025. With the average home now exceeding $215K, early investors have realized significant equity gains while maintaining affordable entry points compared to coastal communities. The proximity to Mobile and the Gulf combined with administrative importance makes this a strategically positioned investment market.
17. Sylvania

- % change from 2016 to 2025: 94.81%
- 2025: $176,847
- 2024: $178,094
- 2023: $166,034
- 2022: $146,773
- 2021: $124,672
- 2020: $116,622
- 2019: $111,377
- 2018: $103,454
- 2017: $97,229
- 2016: $87,629
Sylvania showcases impressive capital appreciation of 94.81% while maintaining relatively affordable price points, creating an attractive entry opportunity for value investors. The minor 0.7% correction between 2024-2025 represents normal market fluctuation rather than a concerning trend reversal. The financial performance between 2020-2023 (42.4% in just three years) demonstrates accelerated value creation during post-pandemic market conditions. For investors seeking balance between growth potential and affordable entry costs, Sylvania’s consistent performance metrics present a compelling case.
16. Silverhill

- % change from 2016 to 2025: 96.7%
- 2025: $288,141
- 2024: $277,082
- 2023: $265,291
- 2022: $219,048
- 2021: $191,303
- 2020: $177,294
- 2019: $168,863
- 2018: $159,579
- 2017: $150,435
- 2016: $139,515
Silverhill demonstrates exceptional investment performance with consistent year-over-year growth culminating in 96.7% total appreciation since 2016. The financial trajectory shows accelerated value creation after 2021, with the 2022-2023 period alone delivering 21% gains. The stability of growth patterns without significant corrections indicates strong underlying market fundamentals rather than speculative activity. With average values approaching $290K, Silverhill represents a middle-market sweet spot combining robust appreciation with still-accessible entry points.
15. Childersburg

- % change from 2016 to 2025: 96.86%
- 2025: $160,725
- 2024: $150,641
- 2023: $148,870
- 2022: $130,246
- 2021: $108,585
- 2020: $98,568
- 2019: $95,208
- 2018: $91,015
- 2017: $84,006
- 2016: $82,240
Childersburg offers an exceptional financial growth story with values nearly doubling since 2016 while remaining well below state medians, creating opportunity for capital-efficient investment. The 6.7% growth in the last year alone suggests continued strong market momentum even after substantial prior appreciation. For cash flow investors, the combination of affordable purchase prices with strong appreciation potential creates favorable rental yield scenarios. The 48.3% increase since 2021 indicates accelerating demand despite the town’s relatively modest economic profile.
14. Equality

- % change from 2016 to 2025: 96.94%
- 2025: $626,300
- 2024: $558,220
- 2023: $523,848
- 2022: $450,449
- 2021: $404,644
- 2020: $385,087
- 2019: $377,990
- 2018: $361,843
- 2017: $353,419
- 2016: $347,507
Equality represents Alabama’s luxury market with remarkable 96.94% growth despite starting from an already substantial base value of $347,507 in 2016. The exceptional 12.2% single-year appreciation between 2024-2025 demonstrates accelerating demand at premium price points. Financial analysis indicates superior absolute dollar gains, with average properties adding nearly $279,000 in value over nine years. For high-net-worth investors, Equality offers strong wealth preservation combined with appreciation potential typically associated with more speculative investments.
13. Dadeville

🔥 Would you like to save this?
- % change from 2016 to 2025: 97.55%
- 2025: $457,176
- 2024: $440,817
- 2023: $442,963
- 2022: $361,631
- 2021: $309,274
- 2020: $290,703
- 2019: $277,270
- 2018: $259,478
- 2017: $237,869
- 2016: $225,326
Dadeville’s lakefront market demonstrates extraordinary financial performance, nearly doubling in value while operating in a premium price tier above $450K in 2025. The minor 0.5% correction between 2023-2024 proved temporary, with renewed 3.7% growth the following year indicating strong demand resilience. For wealth preservation, Dadeville offers compelling position with 26.4% growth just since 2021 despite already elevated valuations. The Lake Martin proximity creates a unique value proposition combining recreation demand with limited inventory, driving consistent price appreciation.
12. Rainsville

- % change from 2016 to 2025: 99.83%
- 2025: $200,821
- 2024: $193,372
- 2023: $181,068
- 2022: $158,690
- 2021: $135,473
- 2020: $125,890
- 2019: $120,672
- 2018: $113,147
- 2017: $108,240
- 2016: $98,013
Rainsville demonstrates exceptional financial performance, essentially doubling property values in nine years while maintaining accessibility with current prices just over $200K. The consistent upward trajectory with 3.9% growth in the last year suggests continued strong momentum rather than a maturing cycle. For investors seeking value appreciation combined with rental yield potential, Rainsville’s price point creates favorable cash flow dynamics. The accelerated 48.2% growth since 2021 indicates strengthening market fundamentals despite the town’s relatively modest population.
11. Fyffe

- % change from 2016 to 2025: 102.92%
- 2025: $151,029
- 2024: $149,288
- 2023: $134,993
- 2022: $116,848
- 2021: $98,319
- 2020: $91,422
- 2019: $87,958
- 2018: $82,739
- 2017: $78,969
- 2016: $69,072
Fyffe offers remarkable ROI potential, more than doubling investment value since 2016 while maintaining an exceptionally low entry point below $155K. The 53.6% growth since 2021 demonstrates accelerating momentum in recent years despite broader economic fluctuations. For cash flow investors, the combination of low acquisition costs with strong appreciation creates potentially market-leading capitalization rates. The modest 1.2% growth between 2024-2025 suggests a brief consolidation phase after exceptional 10.6% gains the previous year.
10. Ardmore

- % change from 2016 to 2025: 102.95%
- 2025: $245,492
- 2024: $236,785
- 2023: $230,077
- 2022: $193,099
- 2021: $161,363
- 2020: $143,371
- 2019: $135,252
- 2018: $130,480
- 2017: $121,910
- 2016: $117,699
Ardmore represents exceptional wealth creation with property values more than doubling since 2016, delivering over $127,000 in equity to early investors. The accelerated appreciation of 52.1% since 2021 demonstrates strengthening market dynamics despite already significant prior gains. For investors considering entry points, the current 3.7% annual growth rate suggests continued upward momentum rather than cycle maturation. The border position between Alabama and Tennessee creates unique investment dynamics with demand drivers from multiple metropolitan areas.
9. Graysville

- % change from 2016 to 2025: 103.24%
- 2025: $102,311
- 2024: $103,049
- 2023: $102,370
- 2022: $89,398
- 2021: $73,072
- 2020: $66,081
- 2019: $58,274
- 2018: $57,314
- 2017: $53,034
- 2016: $50,586
Graysville offers extraordinary financial leverage, more than doubling investment value while maintaining the lowest price point among top performers at just $102K. The slight 0.7% correction in 2024-2025 follows exceptional 39.9% growth since 2022, suggesting a brief consolidation phase. For yield-focused investors, the combination of low acquisition costs with strong appreciation trajectory creates potentially superior cash flow characteristics. The remarkable accessibility combined with 103.24% historical growth makes this an ideal starter investment market.
8. Robertsdale

- % change from 2016 to 2025: 103.96%
- 2025: $265,762
- 2024: $251,767
- 2023: $238,652
- 2022: $202,348
- 2021: $171,989
- 2020: $161,004
- 2019: $152,475
- 2018: $140,520
- 2017: $132,672
- 2016: $120,325
Robertsdale demonstrates exceptional investment performance with property values more than doubling since 2016, creating over $145,000 in equity for early market entrants. The consistent 5.6% growth in the last year indicates sustained momentum rather than market plateau after substantial appreciation. For investors analyzing coastal-adjacent markets, Robertsdale offers compelling value at 15-30% discount to prime Gulf properties while delivering comparable appreciation rates. The 54.5% growth since 2021 reflects accelerating demand dynamics in this strategically positioned community.
7. Seminole

- % change from 2016 to 2025: 105.4%
- 2025: $312,313
- 2024: $294,120
- 2023: $275,560
- 2022: $240,441
- 2021: $203,868
- 2020: $188,744
- 2019: $181,217
- 2018: $169,050
- 2017: $158,414
- 2016: $149,965
Seminole showcases extraordinary financial performance, with property values more than doubling while generating over $162,000 in absolute equity gains since 2016. The impressive 6.2% growth in the last year demonstrates continued strong momentum despite already substantial appreciation. For investors seeking coastal-adjacent opportunities, Seminole offers excellent value proposition compared to premium Gulf front properties while delivering superior appreciation rates. The property value acceleration since 2021 (53.2% in four years) indicates strengthening market fundamentals in this strategic corridor location.
6. Stapleton

- % change from 2016 to 2025: 107.96%
- 2025: $325,537
- 2024: $305,696
- 2023: $290,319
- 2022: $254,130
- 2021: $211,717
- 2020: $199,574
- 2019: $187,464
- 2018: $171,340
- 2017: $163,311
- 2016: $149,168
Stapleton’s property market demonstrates exceptional financial performance, with values more than doubling and delivering over $176,000 in equity to early investors. The robust 6.5% growth in the last year signals continued strong momentum despite already substantial prior appreciation. For portfolio diversification, Stapleton offers an attractive combination of strong appreciation trajectory with values still below premium coastal communities. The remarkable 53.8% growth just since 2021 indicates accelerating demand dynamics in this strategically positioned Baldwin County location.
5. Jacksons Gap

- % change from 2016 to 2025: 110.8%
- 2025: $540,337
- 2024: $495,847
- 2023: $471,554
- 2022: $392,132
- 2021: $334,436
- 2020: $305,990
- 2019: $287,877
- 2018: $267,257
- 2017: $254,158
- 2016: $244,180
Jacksons Gap represents premium lakefront property investment with extraordinary performance metrics, delivering 110.8% appreciation while generating nearly $300,000 in absolute equity gains. The exceptional 9% single-year growth between 2024-2025 demonstrates accelerating luxury market demand even after substantial prior appreciation. For high-net-worth investors, the Lake Martin location creates unique value proposition combining recreation appeal with limited inventory constraints. The remarkable 61.6% growth since 2021 outperforms many traditional wealth preservation vehicles despite starting from already elevated valuations.
4. Lillian

- % change from 2016 to 2025: 114.21%
- 2025: $312,230
- 2024: $297,038
- 2023: $278,405
- 2022: $223,186
- 2021: $194,893
- 2020: $179,248
- 2019: $169,326
- 2018: $155,967
- 2017: $148,112
- 2016: $136,669
Lillian showcases exceptional investment performance, more than doubling property values while generating over $175,000 in absolute equity gains since 2016. The strong 5.1% growth in the last year demonstrates continued momentum despite already substantial appreciation. For coastal investors, Lillian offers compelling value proposition at 30-40% discount to premium Gulf-front communities while delivering superior appreciation rates. The remarkable 60.2% growth since 2021 demonstrates accelerating demand dynamics in this waterfront corridor with strategic proximity to Florida.
3. Dauphin Island

- % change from 2016 to 2025: 115.5%
- 2025: $475,759
- 2024: $467,805
- 2023: $432,877
- 2022: $354,470
- 2021: $306,918
- 2020: $280,350
- 2019: $261,040
- 2018: $234,392
- 2017: $219,780
- 2016: $208,649
Dauphin Island demonstrates extraordinary investment performance, more than doubling property values while generating over $267,000 in absolute equity gains for early investors. The island’s limited inventory combined with growing coastal demand has driven exceptional 55% appreciation just since 2021. For high-net-worth investors, the unique barrier island location creates compelling value proposition combining exclusivity with strong appreciation potential. The continued 1.7% growth in 2025 suggests sustained demand despite reaching price points that significantly exceed mainland alternatives.
2. Mentone

- % change from 2016 to 2025: 115.94%
- 2025: $267,861
- 2024: $256,651
- 2023: $240,498
- 2022: $209,353
- 2021: $179,068
- 2020: $164,087
- 2019: $154,399
- 2018: $144,175
- 2017: $132,513
- 2016: $120,727
Mentone showcases remarkable investment performance, with mountain properties more than doubling in value while generating over $147,000 in equity gains since 2016. The strong 4.4% growth in the last year demonstrates continued momentum in this unique mountain retreat market. For investors seeking diversification, Mentone offers compelling combination of mountain recreation appeal with exceptional 49.6% appreciation since 2021. The limited development potential due to topography creates natural supply constraints that should continue supporting price appreciation despite reaching higher value thresholds.
1. Elberta

🔥 Would you like to save this?
- % change from 2016 to 2025: 121.19%
- 2025: $366,597
- 2024: $350,632
- 2023: $335,609
- 2022: $294,626
- 2021: $243,705
- 2020: $219,851
- 2019: $208,697
- 2018: $187,340
- 2017: $172,408
- 2016: $160,391
Elberta represents Alabama’s ultimate investment success story, with 121.19% appreciation generating over $206,000 in equity for early investors. The consistent 4.6% growth in the last year demonstrates sustained momentum despite already extraordinary prior gains. For strategic investors, Elberta offers compelling value proposition combining coastal proximity with prices still below premium Gulf communities. The remarkable 50.4% growth since 2021 outperforms many traditional investment vehicles while maintaining strong upward trajectory in this increasingly desirable Baldwin County location.


