
🔥 Would you like to save this?
I’ve analyzed data from the Zillow Home Value Index to identify Connecticut neighborhoods with the most remarkable growth trajectories over the past decade. The numbers tell a fascinating story of economic resilience and changing market preferences.
Looking at the percentage increases from 2016 to 2025, I’m struck by how many previously overlooked neighborhoods are now commanding premium prices. Several areas have seen their values more than triple, representing extraordinary returns for early investors who recognized these emerging hotspots.
In order to come up with the very specific design ideas, we create most designs with the assistance of state-of-the-art AI interior design software. Also, assume links that take you off the site are affiliate links such as links to Amazon. this means we may earn a commission if you buy something.
What’s particularly interesting is the diversity of neighborhoods on this list – from urban rejuvenation projects to quiet suburban enclaves. The common thread is consistent, substantial growth that outpaces the broader Connecticut market, suggesting fundamental shifts in where people want to live.
25. Mill Plain

- % change from 2016 to 2025: 186.33%
- 2025: $245,604
- 2024: $224,275
- 2023: $191,137
- 2022: $172,730
- 2021: $140,389
- 2020: $115,708
- 2019: $105,861
- 2018: $99,510
- 2017: $90,740
- 2016: $85,776
You’re witnessing an investment goldmine in Mill Plain, where property values have nearly tripled in less than a decade. For sellers, this represents a prime opportunity to cash in on substantial equity gains, while buyers should consider the consistent upward trajectory as a promising indicator of future returns. The area has transformed from an affordable entry-level neighborhood to a desirable location with significant appreciation potential. Nestled in a convenient location with improving amenities, Mill Plain exemplifies smart growth in action.
24. Hopeville

- % change from 2016 to 2025: 186.59%
- 2025: $248,454
- 2024: $228,720
- 2023: $193,685
- 2022: $171,645
- 2021: $143,638
- 2020: $119,991
- 2019: $110,911
- 2018: $98,991
- 2017: $90,815
- 2016: $86,695
You’re looking at Hopeville’s impressive financial performance, where your investment would have almost tripled since 2016. The consistently rising values suggest strong market fundamentals rather than speculative bubbles, making this an excellent consideration for your portfolio diversification strategy. For current homeowners, your equity position has strengthened dramatically, potentially opening doors to leveraging this wealth for other investments. This centrally located neighborhood offers the perfect blend of accessibility and appreciation potential.
23. Bucks Hill
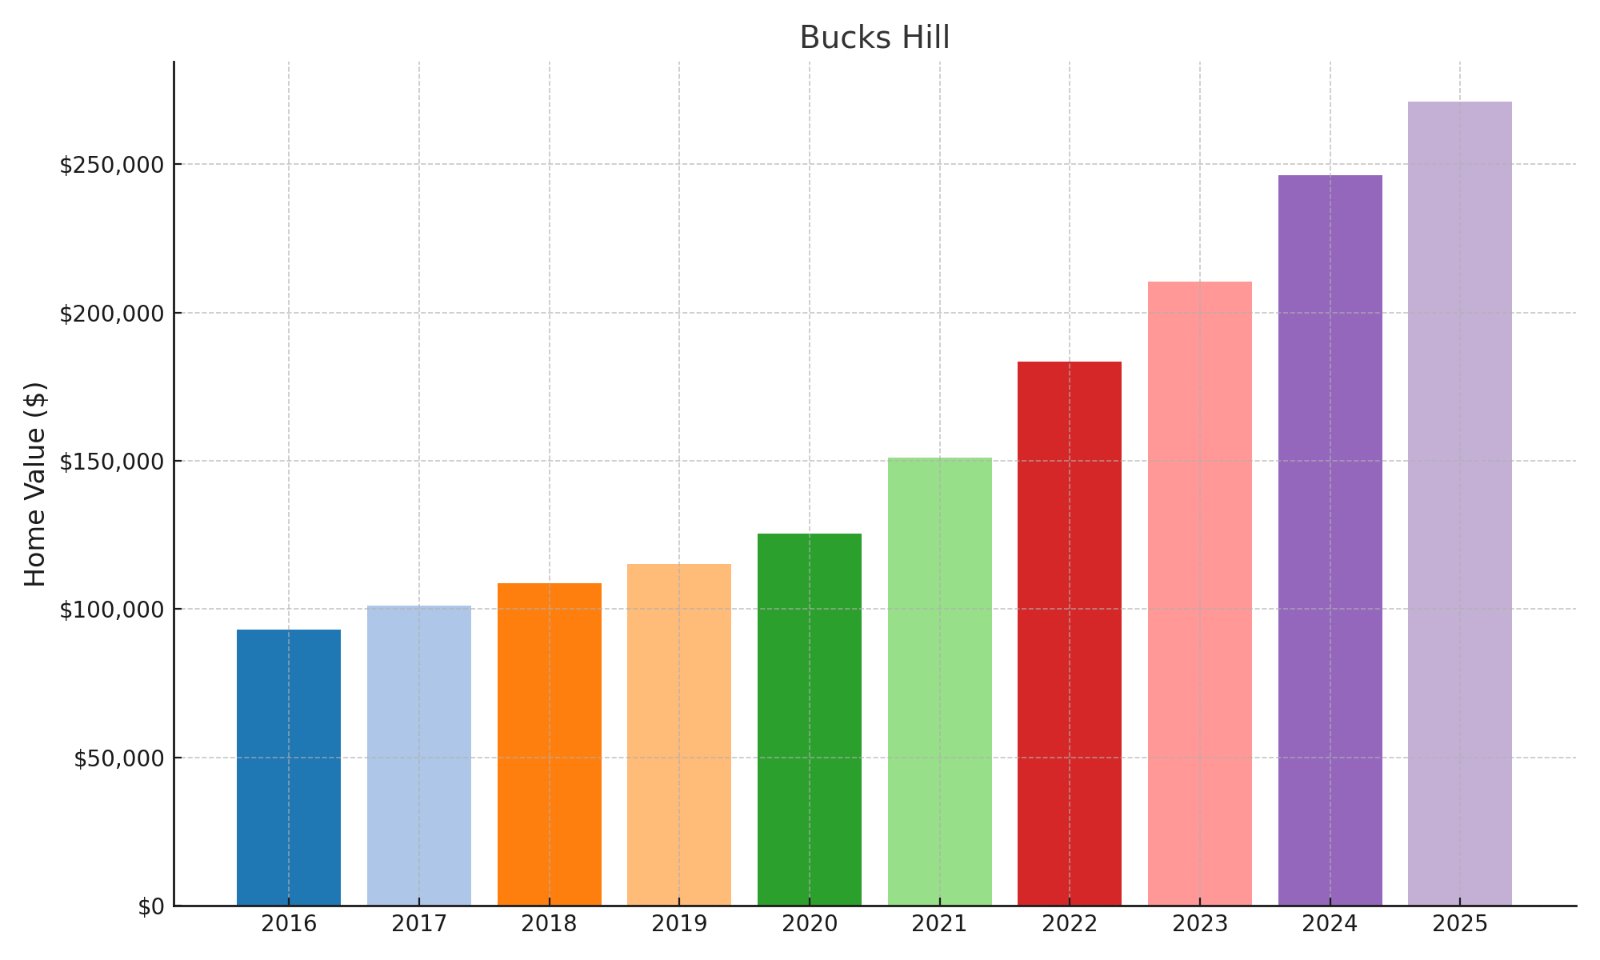
- % change from 2016 to 2025: 191.07%
- 2025: $271,107
- 2024: $246,384
- 2023: $210,297
- 2022: $183,453
- 2021: $150,963
- 2020: $125,494
- 2019: $115,100
- 2018: $108,815
- 2017: $101,081
- 2016: $93,142
You’re witnessing Bucks Hill’s remarkable wealth creation story, where property values have nearly tripled while maintaining steady year-over-year growth. This consistent appreciation pattern signals a sustainable market trajectory rather than a volatile bubble, creating an exceptional environment for building long-term equity. The area presents an increasingly compelling value proposition for buyers seeking growth markets with proven track records. Positioned conveniently with improving infrastructure, Bucks Hill demonstrates the financial rewards of strategic neighborhood selection.
22. Brooklyn

- % change from 2016 to 2025: 191.54%
- 2025: $228,466
- 2024: $209,893
- 2023: $180,473
- 2022: $154,853
- 2021: $124,010
- 2020: $104,705
- 2019: $92,094
- 2018: $87,996
- 2017: $80,181
- 2016: $78,366
You’re witnessing Brooklyn’s financial transformation, where property values have nearly tripled despite starting from a relatively modest baseline. This extraordinary appreciation rate creates a compelling case for investment, demonstrating how emerging neighborhoods can deliver outsized returns compared to established areas. For current owners, your equity position has strengthened dramatically, potentially creating opportunities for strategic refinancing or portfolio expansion. Located in a historically rich area experiencing revitalization, Brooklyn presents exceptional value with continued upside potential.
21. East End

- % change from 2016 to 2025: 194.62%
- 2025: $269,980
- 2024: $266,292
- 2023: $242,002
- 2022: $232,260
- 2021: $196,321
- 2020: $158,883
- 2019: $140,663
- 2018: $119,717
- 2017: $100,687
- 2016: $91,636
You’re looking at East End’s impressive investment narrative, where early buyers have nearly tripled their property’s value in under a decade. The acceleration in appreciation since 2020 signals growing market recognition and increasing buyer competition, suggesting the neighborhood has hit an inflection point in its development cycle. For prospective investors, the consistent upward trajectory indicates continued growth potential despite the impressive gains already realized. This evolving district combines urban convenience with rapid price appreciation, making it a standout performer in the local real estate ecosystem.
20. West Side/ West End

- % change from 2016 to 2025: 195.04%
- 2025: $290,800
- 2024: $285,723
- 2023: $256,336
- 2022: $233,036
- 2021: $201,143
- 2020: $169,644
- 2019: $149,072
- 2018: $131,818
- 2017: $105,974
- 2016: $98,564
You’re witnessing West Side/West End’s financial renaissance, where property values have effectively tripled, creating substantial wealth for early investors. The near-$300K valuation represents extraordinary ROI compared to 2016 prices, with particularly strong acceleration visible during the post-pandemic period. For buyers, this price trajectory suggests entering a neighborhood with powerful market momentum and established upward mobility in valuations. This well-positioned area combines convenient location with dramatic appreciation potential, exemplifying smart growth within the regional housing market.
19. Bouley Manor

- % change from 2016 to 2025: 197.56%
- 2025: $240,635
- 2024: $219,707
- 2023: $185,396
- 2022: $165,572
- 2021: $134,599
- 2020: $112,756
- 2019: $102,700
- 2018: $96,602
- 2017: $86,203
- 2016: $80,868
You’re analyzing Bouley Manor’s compelling investment case, where property values have nearly tripled since 2016, dramatically outperforming traditional investment vehicles. The consistent year-over-year gains signal a neighborhood with strong fundamental appeal rather than speculative interest, suggesting potential for continued appreciation. Current owners are sitting on substantial equity that could be leveraged for portfolio expansion or improvements to further enhance property values. Situated in an increasingly sought-after location, Bouley Manor demonstrates how strategic real estate selection can transform moderate investments into significant wealth.
18. Hill Street

- % change from 2016 to 2025: 198.33%
- 2025: $247,123
- 2024: $227,474
- 2023: $190,705
- 2022: $171,869
- 2021: $138,710
- 2020: $116,828
- 2019: $107,361
- 2018: $97,932
- 2017: $89,975
- 2016: $82,836
You’re examining Hill Street’s remarkable financial trajectory, where property values have essentially tripled, representing exceptional returns on investment capital. The steady climb without significant plateaus suggests sustained buyer demand and neighborhood improvements driving genuine value creation. For sellers, this creates an optimal exit opportunity with substantial equity realization, while buyers should recognize they’re entering a proven growth market. This centrally positioned area combines accessibility with impressive appreciation, making it a standout performer in the regional housing landscape.
17. Lakewood

- % change from 2016 to 2025: 200.28%
- 2025: $229,000
- 2024: $215,508
- 2023: $182,632
- 2022: $160,757
- 2021: $128,893
- 2020: $107,328
- 2019: $99,357
- 2018: $91,062
- 2017: $83,153
- 2016: $76,262
You’re witnessing Lakewood’s investment triumph, where property values have tripled over nine years, generating exceptional returns compared to traditional investment vehicles. The consistent upward trajectory reflects sustained market confidence rather than volatile speculation, signaling a neighborhood with enduring appeal and growth prospects. For current owners, this represents a substantial increase in household wealth and improved financial position for potential upgrades or investment diversification. Situated in an increasingly desirable location with natural amenities, Lakewood demonstrates how strategic property selection can significantly outperform broader market averages.
16. Fairmount

- % change from 2016 to 2025: 211.13%
- 2025: $221,960
- 2024: $204,500
- 2023: $174,133
- 2022: $149,077
- 2021: $122,026
- 2020: $97,480
- 2019: $90,139
- 2018: $84,744
- 2017: $80,271
- 2016: $71,340
You’re examining Fairmount’s extraordinary wealth creation story, where property values have more than tripled, providing early investors with exceptional returns that significantly outpace inflation. The dramatic post-2020 acceleration suggests a neighborhood hitting its stride in market recognition and desirability, potentially indicating continued growth ahead. For buyers, these metrics suggest entering a proven growth market with momentum, though at a higher entry point than previous years. This well-positioned district combines affordability with strong appreciation potential, representing a strategic opportunity in the broader housing landscape.
15. Woodhaven

- % change from 2016 to 2025: 211.92%
- 2025: $164,209
- 2024: $149,871
- 2023: $124,545
- 2022: $103,305
- 2021: $82,059
- 2020: $71,921
- 2019: $60,829
- 2018: $56,084
- 2017: $54,163
- 2016: $52,645
You’re analyzing Woodhaven’s impressive investment case, where modest initial property values have more than tripled, creating substantial returns despite the relatively low absolute price point. The accelerating appreciation rate since 2020 indicates increasing market recognition and suggests potential for continued growth as the area develops further appeal. For investors, this represents an opportunity to enter a proven growth market at a price point still below many competing neighborhoods. Located in an evolving district with improving amenities, Woodhaven demonstrates how overlooked areas can deliver exceptional percentage returns while maintaining relative affordability.
14. South End

- % change from 2016 to 2025: 212.14%
- 2025: $175,536
- 2024: $176,519
- 2023: $157,980
- 2022: $146,152
- 2021: $131,244
- 2020: $111,945
- 2019: $93,146
- 2018: $77,614
- 2017: $61,315
- 2016: $56,236
You’re examining South End’s remarkable financial evolution, where property values have more than tripled, delivering exceptional returns that outpace most traditional investment vehicles. The modest 2024-2025 plateau suggests a potential market consolidation phase after explosive growth, presenting a strategic entry point for value-focused investors. For current owners, your property has generated substantial wealth through appreciation while maintaining a relatively affordable absolute price point compared to surrounding areas. This vibrant district combines urban amenities with impressive value appreciation, representing one of the region’s most dramatic transformation stories.
13. West River

🔥 Would you like to save this?
- % change from 2016 to 2025: 217.61%
- 2025: $262,707
- 2024: $246,846
- 2023: $228,393
- 2022: $204,396
- 2021: $174,830
- 2020: $140,811
- 2019: $125,750
- 2018: $116,169
- 2017: $98,596
- 2016: $82,714
You’re analyzing West River’s investment success story, where property values have more than tripled, creating substantial wealth for early investors who recognized its potential. The consistent appreciation without major plateaus suggests fundamental neighborhood improvements driving genuine value creation rather than speculative bubbles. For buyers, this price trajectory indicates entering a market with proven growth dynamics and sustained buyer confidence over multiple years. Positioned along desirable waterfront areas with improving infrastructure, West River exemplifies how location advantages can translate into exceptional financial returns.
12. Waterville

- % change from 2016 to 2025: 219.54%
- 2025: $243,908
- 2024: $216,806
- 2023: $184,443
- 2022: $162,932
- 2021: $131,580
- 2020: $105,622
- 2019: $96,564
- 2018: $88,558
- 2017: $81,448
- 2016: $76,332
You’re witnessing Waterville’s extraordinary wealth creation, where property values have more than tripled, delivering returns that substantially outperform most traditional investment vehicles. The dramatic post-2020 acceleration suggests a neighborhood experiencing increasing market recognition and buyer competition, potentially indicating continued growth ahead. For homeowners, this appreciation represents significant equity accumulation that could be leveraged for portfolio expansion or property improvements. This evolving district combines historical charm with modern market appeal, creating an exceptional investment proposition within the regional housing ecosystem.
11. Mill Hill

- % change from 2016 to 2025: 221.34%
- 2025: $246,331
- 2024: $234,167
- 2023: $205,992
- 2022: $192,340
- 2021: $158,941
- 2020: $131,313
- 2019: $114,234
- 2018: $101,704
- 2017: $82,638
- 2016: $76,658
You’re examining Mill Hill’s remarkable financial trajectory, where property values have more than tripled, creating substantial household wealth for early investors. The particularly strong growth during the 2020-2023 period indicates accelerating market recognition and increasing buyer competition for available properties. For new buyers, this consistent price appreciation suggests entering a neighborhood with proven market momentum and established upward mobility in valuations. Situated in a historically significant area experiencing revitalization, Mill Hill represents a compelling example of how strategic location selection drives exceptional investment performance.
10. East End

- % change from 2016 to 2025: 222.92%
- 2025: $234,667
- 2024: $211,866
- 2023: $182,274
- 2022: $162,333
- 2021: $136,982
- 2020: $111,353
- 2019: $100,174
- 2018: $90,184
- 2017: $77,968
- 2016: $72,670
You’re analyzing East End’s investment triumph, where property values have more than tripled, representing exceptional returns that significantly outperform traditional investment vehicles. The steady upward trajectory without significant plateaus indicates sustained buyer interest and genuine market appreciation rather than speculative bubbles. For sellers, this creates an optimal exit opportunity with substantial equity realization, while buyers should recognize they’re entering a proven growth market. This centrally positioned neighborhood combines accessibility with significant value creation, making it a standout performer in the regional real estate landscape.
9. North End

- % change from 2016 to 2025: 227.48%
- 2025: $241,169
- 2024: $220,434
- 2023: $188,013
- 2022: $164,017
- 2021: $129,133
- 2020: $105,114
- 2019: $97,454
- 2018: $91,099
- 2017: $82,969
- 2016: $73,645
You’re witnessing North End’s remarkable wealth generation story, where property values have more than tripled, creating exceptional returns compared to most alternative investments. The particularly dramatic growth since 2020 signals accelerating market recognition and suggests potential for continued appreciation as neighborhood improvements continue. For current owners, this represents substantial equity accumulation that could be leveraged for portfolio diversification or property enhancements. Positioned in a rapidly evolving district with improving amenities, North End exemplifies how strategic neighborhood selection can transform modest real estate investments into significant wealth.
8. Berkeley Heights

- % change from 2016 to 2025: 240.64%
- 2025: $236,400
- 2024: $216,744
- 2023: $184,237
- 2022: $163,279
- 2021: $124,402
- 2020: $102,920
- 2019: $91,838
- 2018: $86,217
- 2017: $77,477
- 2016: $69,399
You’re examining Berkeley Heights’ exceptional investment performance, where property values have nearly tripled and a half, delivering returns that substantially outpace inflation and most alternative investments. The acceleration in appreciation post-2020 indicates increasing market recognition of the area’s value proposition, suggesting a neighborhood hitting its stride in desirability. For buyers, this trajectory signals entering a market with proven growth fundamentals and momentum, though at a significantly higher entry point than previous years. This elevated neighborhood combines prestige with continued appreciation potential, representing one of the region’s most compelling value creation stories.
7. New Pac

- % change from 2016 to 2025: 267.36%
- 2025: $226,842
- 2024: $203,505
- 2023: $173,525
- 2022: $146,036
- 2021: $117,269
- 2020: $94,623
- 2019: $86,411
- 2018: $75,989
- 2017: $65,792
- 2016: $61,750
You’re witnessing New Pac’s remarkable financial transformation, where property values have more than tripled, creating extraordinary returns for early investors who recognized its potential. The consistent year-over-year gains demonstrate sustainable market fundamentals rather than volatile speculation, signaling genuine neighborhood improvement driving value creation. For homeowners, this represents substantial equity accumulation that dramatically strengthens your overall financial position and investment portfolio. Located in an increasingly sought-after district with improving amenities, New Pac exemplifies how strategic property selection in emerging areas can deliver exceptional returns on investment.
6. Wolcott Road

- % change from 2016 to 2025: 269.24%
- 2025: $126,697
- 2024: $120,371
- 2023: $97,790
- 2022: $78,802
- 2021: $56,509
- 2020: $48,074
- 2019: $45,434
- 2018: $39,913
- 2017: $36,235
- 2016: $34,312
You’re analyzing Wolcott Road’s extraordinary investment case, where property values have grown by nearly 270%, representing exceptional percentage returns despite modest absolute prices. The dramatic acceleration since 2021 indicates rapidly increasing market recognition and buyer competition, suggesting a neighborhood hitting an inflection point in its development cycle. For investors, this represents an opportunity to enter a proven growth market at a price point still accessible compared to surrounding areas. Located along a strategic corridor with improving infrastructure, Wolcott Road demonstrates how modestly priced properties can deliver outsized percentage returns through strategic neighborhood selection.
5. Washington Hill

- % change from 2016 to 2025: 288.12%
- 2025: $198,512
- 2024: $176,986
- 2023: $146,712
- 2022: $124,357
- 2021: $100,938
- 2020: $81,275
- 2019: $71,379
- 2018: $62,329
- 2017: $52,261
- 2016: $51,147
You’re witnessing Washington Hill’s remarkable wealth creation story, where property values have nearly quadrupled, delivering extraordinary returns that dramatically outperform traditional investment vehicles. The consistent year-over-year gains without plateaus indicate genuine market appreciation driven by neighborhood improvements rather than speculative bubbles. For investors, this price trajectory suggests entering a market with proven growth fundamentals and substantial momentum, though at a significantly higher entry point than previous years. This elevated district combines historic character with modern market appeal, representing one of the region’s most impressive financial transformation stories.
4. Crownbrook

- % change from 2016 to 2025: 298.48%
- 2025: $210,928
- 2024: $191,214
- 2023: $158,236
- 2022: $136,741
- 2021: $110,428
- 2020: $88,808
- 2019: $73,085
- 2018: $63,151
- 2017: $56,523
- 2016: $52,933
You’re examining Crownbrook’s exceptional investment performance, where property values have nearly quadrupled, creating substantial wealth for early investors who recognized its untapped potential. The dramatic post-2020 acceleration indicates rapidly increasing market recognition and buyer competition, suggesting a neighborhood that has fundamentally transformed in desirability. For current owners, this appreciation represents life-changing equity accumulation that could fund retirement, education, or significant lifestyle upgrades. Situated in an increasingly prestigious location with improving amenities, Crownbrook exemplifies how strategic real estate selection can generate returns that dramatically outperform broader market averages.
3. Hollow

- % change from 2016 to 2025: 299.36%
- 2025: $236,074
- 2024: $229,515
- 2023: $203,209
- 2022: $193,962
- 2021: $164,288
- 2020: $128,827
- 2019: $110,811
- 2018: $91,069
- 2017: $67,705
- 2016: $59,114
You’re analyzing Hollow’s extraordinary financial success story, where property values have nearly quadrupled, creating transformative wealth for early investors who recognized its potential. The explosive growth between 2017-2021 in particular represents one of the most dramatic value creation periods in the regional market, signaling fundamental shifts in neighborhood perception and desirability. For buyers today, you’re entering a market with proven growth dynamics, though the modest 2024-2025 slowing suggests a potential consolidation phase after years of dramatic gains. This distinctive district combines unique character with exceptional investment performance, representing one of Connecticut’s most remarkable real estate transformation narratives.
2. Willow Plaza

- % change from 2016 to 2025: 349.50%
- 2025: $162,040
- 2024: $147,069
- 2023: $127,310
- 2022: $115,160
- 2021: $91,969
- 2020: $65,392
- 2019: $57,039
- 2018: $46,433
- 2017: $39,573
- 2016: $36,049
You’re witnessing Willow Plaza’s remarkable investment triumph, where property values have more than quadrupled, delivering exceptional returns that dramatically outperform virtually all traditional investment vehicles. The explosive growth between 2020-2022 represents an extraordinary wealth creation period, likely driven by fundamental neighborhood revitalization and changing market perceptions. For early investors, this appreciation has created life-changing equity that could fund retirement, education, or significant lifestyle enhancements. Located in a rapidly evolving district with improving commercial amenities, Willow Plaza exemplifies how strategic investment in emerging neighborhoods can generate returns that profoundly outpace broader market averages.
1. Walnut-Orange-Walsh

🔥 Would you like to save this?
- % change from 2016 to 2025: 354.97%
- 2025: $165,906
- 2024: $147,087
- 2023: $126,301
- 2022: $112,783
- 2021: $91,628
- 2020: $58,046
- 2019: $49,858
- 2018: $42,553
- 2017: $40,307
- 2016: $36,465
You’re examining Walnut-Orange-Walsh’s extraordinary investment case, where property values have more than quadrupled, creating Connecticut’s most remarkable real estate success story of the decade. The explosive 2019-2022 growth period represents unprecedented percentage gains, likely driven by fundamental neighborhood transformation and dramatically shifting market perceptions. For early investors, this appreciation has generated exceptional wealth from relatively modest initial investments, demonstrating the power of identifying emerging neighborhoods before market recognition. Positioned in an area experiencing comprehensive revitalization, Walnut-Orange-Walsh exemplifies how strategic real estate selection can deliver returns that profoundly outperform even the most optimistic market expectations.


