
🔥 Would you like to save this?
The Zillow Home Value Index points to these 18 towns as Virginia’s most affordable housing markets in 2025. While prices have soared elsewhere, these spots buck the trend—offering lower-than-average home values and, in some cases, surprising resilience. Some towns have dipped in value over time, while others are holding steady or just beginning to rebound. Whether you’re house-hunting on a budget or watching the market shift, these communities reveal how local forces still shape where and how people live.
18. Lawrenceville – 8.6% Home Price Decrease Since 2011

- 2010: N/A
- 2011: $112,957
- 2012: $105,117 (-$7,840, -6.94% from previous year)
- 2013: $121,270 (+$16,153, +15.37% from previous year)
- 2014: $111,711 (-$9,559, -7.88% from previous year)
- 2015: $120,506 (+$8,795, +7.87% from previous year)
- 2016: $118,513 (-$1,993, -1.65% from previous year)
- 2017: $116,856 (-$1,657, -1.40% from previous year)
- 2018: $114,060 (-$2,796, -2.39% from previous year)
- 2019: $111,048 (-$3,012, -2.64% from previous year)
- 2020: N/A
- 2021: $120,467
- 2022: $128,010 (+$7,543, +6.26% from previous year)
- 2023: $123,446 (-$4,564, -3.57% from previous year)
- 2024: $113,830 (-$9,617, -7.79% from previous year)
- 2025: $103,324 (-$10,506, -9.23% from previous year)
Lawrenceville’s housing market tells a story of gradual but persistent decline. From a post-recession bounce in 2013 to renewed growth in 2022, the town briefly climbed to a high of $128,010 before experiencing three consecutive years of losses. As of 2025, prices have slipped back to $103,324—down 8.6% from 2011. This decline may be linked to shifting regional employment, aging housing stock, and broader rural market trends that affect affordability and demand.
In order to come up with the very specific design ideas, we create most designs with the assistance of state-of-the-art AI interior design software. Also, assume links that take you off the site are affiliate links such as links to Amazon. this means we may earn a commission if you buy something.
Lawrenceville – Steep Decline Following Post-Pandemic Peak

Located in southern Virginia near the North Carolina border, Lawrenceville has deep roots in agriculture and history. Despite its small size, it once thrived as a trade center and later developed into a service hub for nearby rural counties. While the town enjoyed a rebound in property values after 2021, recent declines may reflect limited new construction, outmigration, or demand tapering off as other regions attract more investment. With 2025 values dropping more than $10,000 year-over-year, affordability is increasing—but it’s worth watching whether this trend signals broader challenges or future opportunity.
Lawrenceville’s position close to the Meherrin River and its historic architecture lend it a quiet charm, but the region faces ongoing economic headwinds. While the housing market is currently affordable, long-term recovery would likely require more local economic revitalization. Still, for those seeking low-cost property in a historically rich setting, Lawrenceville may hold appeal.
17. Saint Paul – 43.4% Home Price Increase Since 2010
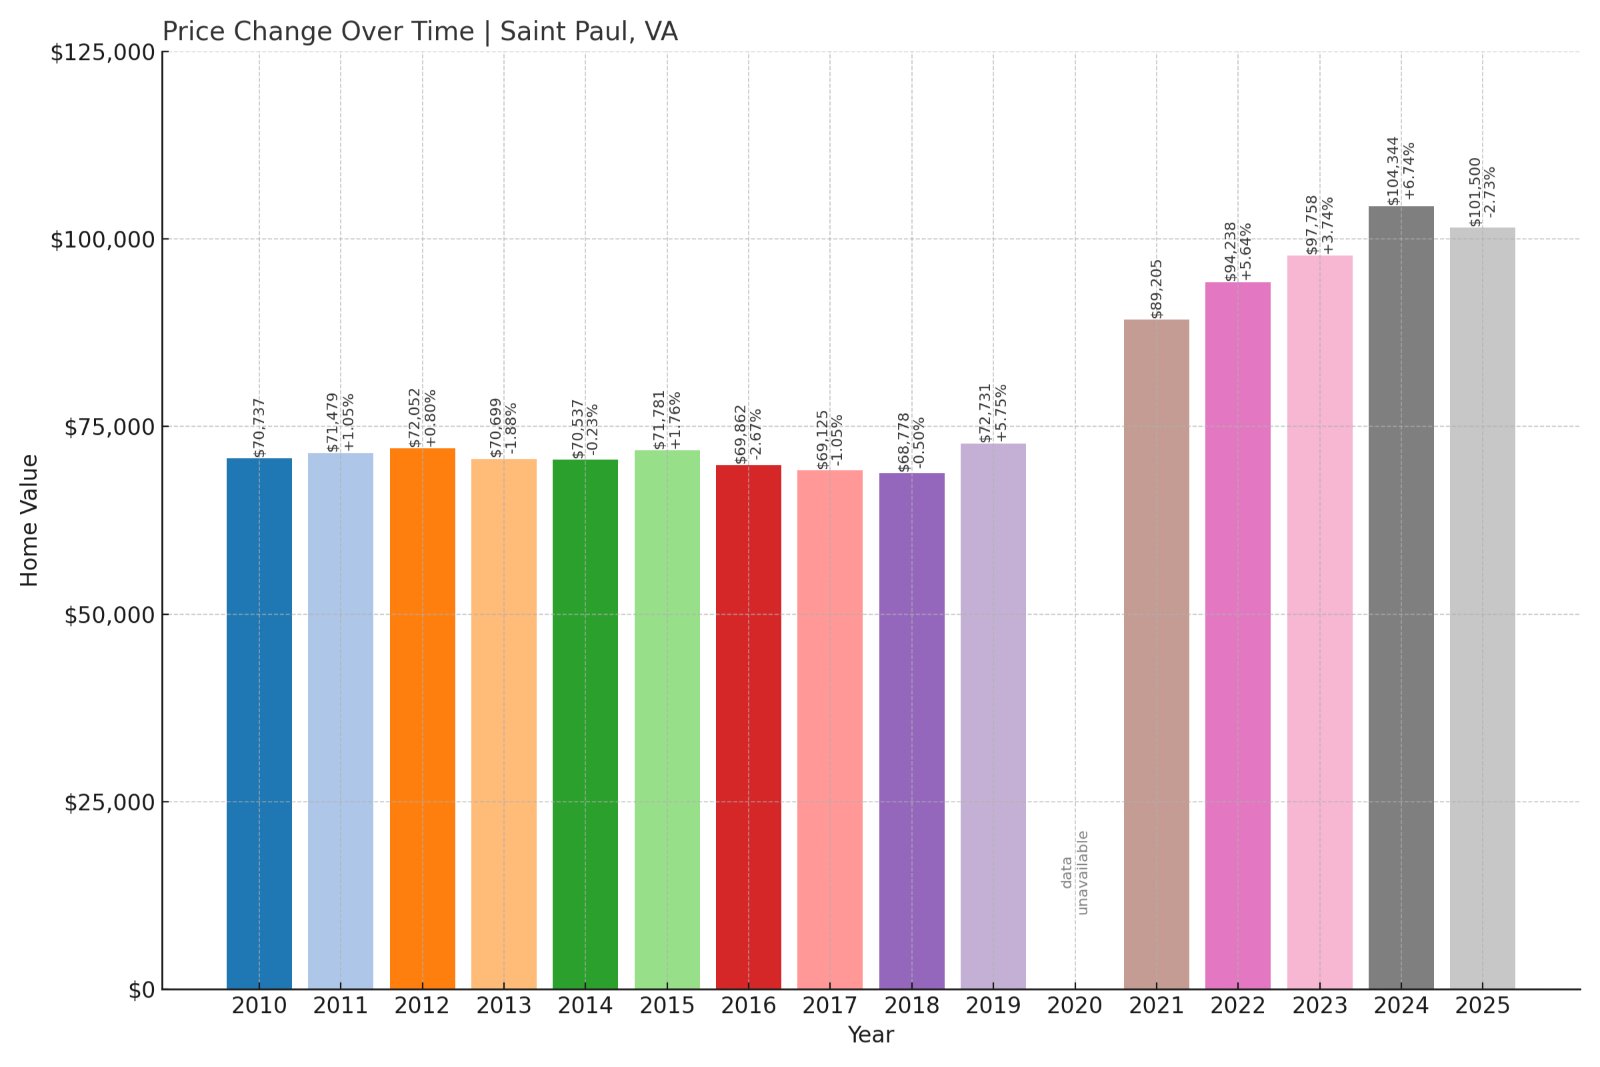
- 2010: $70,737
- 2011: $71,479 (+$741, +1.05% from previous year)
- 2012: $72,052 (+$573, +0.80% from previous year)
- 2013: $70,699 (-$1,353, -1.88% from previous year)
- 2014: $70,537 (-$161, -0.23% from previous year)
- 2015: $71,781 (+$1,243, +1.76% from previous year)
- 2016: $69,862 (-$1,919, -2.67% from previous year)
- 2017: $69,125 (-$737, -1.05% from previous year)
- 2018: $68,778 (-$348, -0.50% from previous year)
- 2019: $72,731 (+$3,953, +5.75% from previous year)
- 2020: N/A
- 2021: $89,205
- 2022: $94,238 (+$5,032, +5.64% from previous year)
- 2023: $97,758 (+$3,520, +3.74% from previous year)
- 2024: $104,344 (+$6,586, +6.74% from previous year)
- 2025: $101,500 (-$2,844, -2.73% from previous year)
Home prices in Saint Paul have steadily increased over the past decade, rising from $70,737 in 2010 to $101,500 in 2025. Although there were brief dips in the mid-2010s and a small drop in 2025, the general trend has been positive. The town saw its biggest price jump between 2020 and 2024, and while it cooled slightly last year, the long-term growth of 43.4% makes it one of the stronger markets among Virginia’s most affordable towns.
Saint Paul – Resilient Growth Despite Market Swings

Located along the Clinch River in southwest Virginia, Saint Paul is a small town with a strong sense of community and a growing focus on ecotourism. The town’s outdoor attractions, including access to trails and nearby state parks, have helped make it more appealing in recent years. Saint Paul’s housing market reflects that appeal, with gradual value increases despite economic challenges in the broader coalfield region.
After years of slow growth, prices took off post-2020, jumping by nearly $32,000 between 2019 and 2024. A slight drop in 2025 could be tied to affordability adjustments or broader cooling in rural markets, but the long-term outlook remains relatively stable. With a mix of affordability and amenities, Saint Paul continues to draw interest from buyers seeking low-cost options with outdoor access.
16. Dryden – 29.8% Home Price Increase Since 2016

- 2010: N/A
- 2011: N/A
- 2012: N/A
- 2013: N/A
- 2014: N/A
- 2015: N/A
- 2016: $77,801
- 2017: $83,192 (+$5,391, +6.93% from previous year)
- 2018: $82,844 (-$348, -0.42% from previous year)
- 2019: $78,107 (-$4,737, -5.72% from previous year)
- 2020: N/A
- 2021: $92,082
- 2022: $89,230 (-$2,852, -3.10% from previous year)
- 2023: $90,753 (+$1,523, +1.71% from previous year)
- 2024: $93,413 (+$2,660, +2.93% from previous year)
- 2025: $100,996 (+$7,583, +8.12% from previous year)
Dryden’s home values have risen nearly 30% since 2016, thanks to a steady upward trend since 2021. After a brief dip in 2022, the town rebounded with back-to-back gains, capped by a strong 8.1% increase in 2025. The current home price of $100,996 marks a nearly $24,000 increase from its 2016 value, indicating renewed local demand or improved conditions in the region.
Dryden – Quiet Climb Toward Affordability’s Edge

Tucked in Lee County in Virginia’s far southwestern corner, Dryden is a quiet rural town near the Kentucky border. Its small population and proximity to Appalachian mountain ranges give it a secluded feel, while still offering access to nearby hubs like Pennington Gap and Big Stone Gap. Recent price increases suggest improved confidence in the area’s housing market, even as it remains one of the more affordable places in the state.
Prices fell between 2018 and 2019 but recovered quickly after 2020, gaining over $20,000 in value by 2025. The area’s natural beauty and low population density may appeal to remote workers or retirees looking for inexpensive housing. While not immune to volatility, Dryden has emerged from a rocky stretch with renewed housing momentum.
15. Freeman – 15.3% Home Price Decrease Since 2024

- 2010: N/A
- 2011: N/A
- 2012: N/A
- 2013: N/A
- 2014: N/A
- 2015: N/A
- 2016: N/A
- 2017: N/A
- 2018: N/A
- 2019: N/A
- 2020: N/A
- 2021: N/A
- 2022: N/A
- 2023: N/A
- 2024: $112,944
- 2025: $95,654 (-$17,290, -15.31% from previous year)
With data available only for the past two years, Freeman’s market is harder to analyze over time. But what is clear is the sharp 15.3% drop in home prices from 2024 to 2025, wiping out nearly $17,300 in value in just one year. This kind of decline stands out even among Virginia’s most affordable towns and raises questions about recent economic or housing-related shifts.
Freeman – Sudden Dip in a Short Data Window

Freeman is a small unincorporated community in Brunswick County, not far from the North Carolina border. Traditionally a quiet agricultural area, the town has long attracted those seeking rural space at low cost. However, the sudden price dip in 2025 suggests a potential cooling off after a short-lived surge—or possibly the result of a one-time correction in the housing data.
At $95,654, homes here remain among the most budget-friendly in the state. With little available data before 2024, it’s difficult to track trends, but the recent drop may signal a temporary setback rather than a long-term downturn. Freeman remains a low-cost option, especially for buyers who prioritize price over amenities or growth potential.
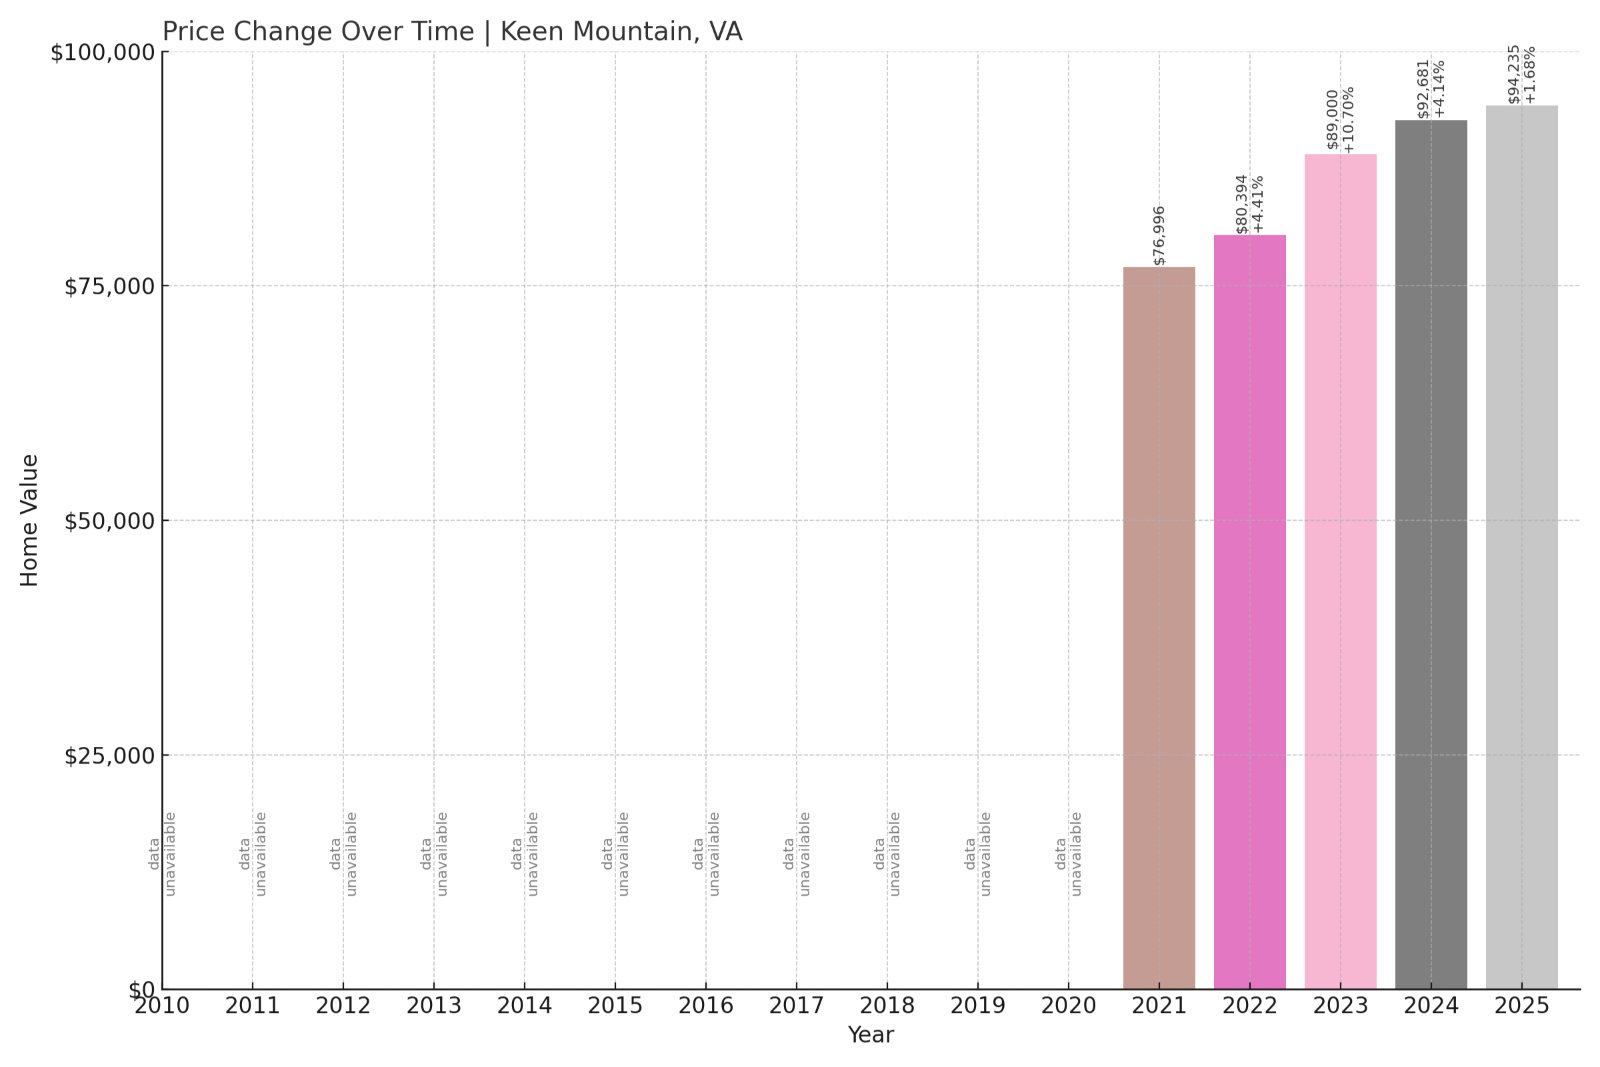
14. Keen Mountain – 22.4% Home Price Increase Since 2021
- 2010: N/A
- 2011: N/A
- 2012: N/A
- 2013: N/A
- 2014: N/A
- 2015: N/A
- 2016: N/A
- 2017: N/A
- 2018: N/A
- 2019: N/A
- 2020: N/A
- 2021: $76,996
- 2022: $80,394 (+$3,398, +4.41% from previous year)
- 2023: $89,000 (+$8,606, +10.70% from previous year)
- 2024: $92,681 (+$3,681, +4.14% from previous year)
- 2025: $94,235 (+$1,554, +1.68% from previous year)
Keen Mountain has seen consistent home price increases since 2021, gaining over 22% in four years. Growth was strongest in 2023, when prices jumped by more than $8,600, though that pace has slowed more recently. Still, the market remains one of the most affordable in Virginia, with a 2025 value of $94,235.
Keen Mountain – Steady Gains in a Remote Corner

Keen Mountain sits in Buchanan County in far southwest Virginia, not far from the border with West Virginia. Like many towns in the coalfield region, it has experienced economic shifts over the decades, but recent growth suggests a possible resurgence in housing interest. The relatively low base price has allowed for significant percentage gains even with modest dollar increases.
While the town remains isolated and small, those very qualities may make it attractive to buyers seeking rural peace and affordability. Its steady climb in property values may reflect gradual improvements in infrastructure or increased appeal to investors searching for low-cost markets with growth potential.
13. Honaker – 44.5% Home Price Increase Since 2012

- 2010: N/A
- 2011: N/A
- 2012: $64,627
- 2013: $68,631 (+$4,004, +6.20% from previous year)
- 2014: $67,694 (-$937, -1.37% from previous year)
- 2015: $70,040 (+$2,346, +3.47% from previous year)
- 2016: $70,266 (+$226, +0.32% from previous year)
- 2017: $70,388 (+$122, +0.17% from previous year)
- 2018: $70,700 (+$312, +0.44% from previous year)
- 2019: $75,678 (+$4,979, +7.04% from previous year)
- 2020: N/A
- 2021: $89,090
- 2022: $94,163 (+$5,072, +5.69% from previous year)
- 2023: $92,702 (-$1,461, -1.55% from previous year)
- 2024: $101,465 (+$8,763, +9.45% from previous year)
- 2025: $93,382 (-$8,083, -7.97% from previous year)
Honaker’s home prices have climbed by nearly 45% since 2012, with strong growth between 2021 and 2024. Despite a notable decline in 2025, the market remains well above its earlier levels. The ups and downs reflect shifts in local demand and possibly the availability of homes, but Honaker remains one of Virginia’s more affordable—and changeable—markets.
Honaker – Boom and Correction in a Small Appalachian Town

Nestled in Russell County in the Appalachian Highlands, Honaker is a compact town known for its annual Redbud Festival and historical downtown. Its location near Clinch Mountain and Clinch River makes it attractive for buyers looking for small-town charm and scenic surroundings. After a slow but steady climb through the 2010s, prices surged post-2020.
The peak in 2024—crossing the $100,000 mark—was followed by a nearly 8% drop in 2025, possibly due to broader market corrections or short-term saturation. Still, home values remain substantially higher than they were a decade ago, and buyers looking for rural affordability with character might still find Honaker appealing.
12. Clinchco – 44.3% Home Price Increase Since 2017

🔥 Would you like to save this?
- 2010: N/A
- 2011: N/A
- 2012: N/A
- 2013: N/A
- 2014: N/A
- 2015: N/A
- 2016: N/A
- 2017: $64,476
- 2018: $67,243 (+$2,768, +4.29% from previous year)
- 2019: $60,619 (-$6,624, -9.85% from previous year)
- 2020: N/A
- 2021: $79,156
- 2022: $84,479 (+$5,322, +6.72% from previous year)
- 2023: $81,046 (-$3,432, -4.06% from previous year)
- 2024: $85,742 (+$4,695, +5.79% from previous year)
- 2025: $93,046 (+$7,304, +8.52% from previous year)
Since 2017, home prices in Clinchco have grown by 44.3%, despite a few years of decline. The town saw significant growth after 2021, gaining nearly $14,000 in value from 2023 to 2025 alone. These figures point to renewed interest or investment in the area, though volatility remains a part of the picture.
Clinchco – Big Gains From a Low Starting Point

Clinchco, located in Dickenson County along the McClure River, is a former coal town that’s been reshaping its identity over time. Like many Appalachian communities, it has faced economic challenges—but its low property prices have started drawing attention. The area’s affordability has made it appealing to first-time buyers and retirees alike.
After bottoming out in 2019, home prices began to rebound significantly, especially after the pandemic. The value of $93,046 in 2025 represents a marked improvement for a town that’s still among Virginia’s most affordable. Continued growth may hinge on infrastructure investments and demand from bargain hunters willing to renovate older homes.
11. Haysi – 32.9% Home Price Increase Since 2017

- 2010: N/A
- 2011: N/A
- 2012: N/A
- 2013: N/A
- 2014: N/A
- 2015: N/A
- 2016: N/A
- 2017: $65,639
- 2018: $67,319 (+$1,679, +2.56% from previous year)
- 2019: $56,306 (-$11,013, -16.36% from previous year)
- 2020: N/A
- 2021: $73,111
- 2022: $77,984 (+$4,873, +6.67% from previous year)
- 2023: $71,634 (-$6,350, -8.14% from previous year)
- 2024: $80,300 (+$8,666, +12.10% from previous year)
- 2025: $87,217 (+$6,917, +8.61% from previous year)
Haysi’s home values have increased by almost 33% since 2017. Although prices dropped in 2019 and again in 2023, the gains in other years have more than made up for the dips. The town saw its largest year-over-year growth in 2024, adding more than $8,600 in value.
Haysi – Upward Momentum in a Scenic Setting

Haysi sits at the intersection of the Russell Fork River and the scenic Breaks Interstate Park. It’s known for its natural beauty and access to outdoor activities, making it a draw for those looking for affordability and recreation. With its proximity to hiking trails and whitewater rafting, the town has started to catch the eye of adventurous buyers.
Prices have steadily increased since 2021, with the market hitting $87,217 in 2025. While economic opportunities remain limited, the area’s affordability and beauty give it unique appeal. Continued value increases may depend on seasonal tourism, new residents from out of state, or additional infrastructure investment.
10. Pennington Gap – 41.6% Home Price Increase Since 2010

- 2010: $60,965
- 2011: $69,732 (+$8,767, +14.38% from previous year)
- 2012: $75,452 (+$5,720, +8.20% from previous year)
- 2013: $79,110 (+$3,658, +4.85% from previous year)
- 2014: $75,884 (-$3,226, -4.08% from previous year)
- 2015: $73,595 (-$2,289, -3.02% from previous year)
- 2016: $76,385 (+$2,790, +3.79% from previous year)
- 2017: $78,138 (+$1,752, +2.29% from previous year)
- 2018: $78,566 (+$428, +0.55% from previous year)
- 2019: $69,611 (-$8,955, -11.40% from previous year)
- 2020: N/A
- 2021: $80,628
- 2022: $76,064 (-$4,565, -5.66% from previous year)
- 2023: $77,587 (+$1,523, +2.00% from previous year)
- 2024: $78,580 (+$993, +1.28% from previous year)
- 2025: $86,395 (+$7,815, +9.95% from previous year)
Pennington Gap’s home values have increased by 41.6% since 2010, reflecting slow and steady growth with occasional sharp dips. The strongest recent gains came in 2025, when home prices rose nearly 10% in a single year. The current value of $86,395 keeps the town firmly in affordable territory.
Pennington Gap – Slow Climb With Strong Recent Gains

As one of the largest towns in Lee County, Pennington Gap serves as a small regional hub with access to healthcare, schools, and shopping. Its location in southwestern Virginia positions it near Cumberland Gap and outdoor attractions, making it an appealing mix of convenience and natural beauty.
Home values fluctuated in the 2010s, but the recent post-pandemic recovery has pushed prices upward. The area’s mix of amenities and affordability could help keep that momentum going, especially for buyers seeking practical living without high price tags. A nearly $8,000 jump in 2025 alone suggests renewed confidence in this Appalachian town.
9. Raven – 35.3% Home Price Increase Since 2010

- 2010: $59,738
- 2011: $62,648 (+$2,911, +4.87% from previous year)
- 2012: $60,816 (-$1,833, -2.93% from previous year)
- 2013: $63,213 (+$2,397, +3.94% from previous year)
- 2014: $62,082 (-$1,131, -1.79% from previous year)
- 2015: $61,338 (-$744, -1.20% from previous year)
- 2016: $61,629 (+$291, +0.47% from previous year)
- 2017: $60,978 (-$651, -1.06% from previous year)
- 2018: $62,028 (+$1,050, +1.72% from previous year)
- 2019: $63,227 (+$1,198, +1.93% from previous year)
- 2020: N/A
- 2021: $76,694
- 2022: $77,919 (+$1,225, +1.60% from previous year)
- 2023: $82,221 (+$4,302, +5.52% from previous year)
- 2024: $87,962 (+$5,741, +6.98% from previous year)
- 2025: $80,833 (-$7,130, -8.11% from previous year)
Home values in Raven have climbed by more than 35% since 2010, with the biggest gains occurring between 2021 and 2024. A drop in 2025 pulled prices down by over $7,000, but the overall trend still leans positive. At $80,833, the town remains very affordable by Virginia standards.
Raven – Big Growth, But a Cooling in 2025

Located in Russell County, Raven is a small community that blends affordability with access to nearby Cedar Bluff and Richlands. The town has traditionally drawn blue-collar residents, but recent price growth suggests new interest in this part of southwestern Virginia.
Despite a slight correction in 2025, Raven’s steady climb in prior years—especially post-2020—keeps it on the radar for buyers looking under the $100K mark. Whether 2025’s decline is a blip or the start of a longer trend remains to be seen, but the town’s low entry point makes it appealing in any market.
8. Grundy – 22.5% Home Price Increase Since 2014

- 2010: N/A
- 2011: N/A
- 2012: N/A
- 2013: N/A
- 2014: $63,023
- 2015: $62,505 (-$518, -0.82% from previous year)
- 2016: $65,562 (+$3,057, +4.89% from previous year)
- 2017: $65,046 (-$516, -0.79% from previous year)
- 2018: $66,653 (+$1,607, +2.47% from previous year)
- 2019: $68,620 (+$1,967, +2.95% from previous year)
- 2020: N/A
- 2021: $82,445
- 2022: $79,078 (-$3,367, -4.08% from previous year)
- 2023: $82,681 (+$3,602, +4.56% from previous year)
- 2024: $83,904 (+$1,224, +1.48% from previous year)
- 2025: $77,208 (-$6,696, -7.98% from previous year)
Grundy’s home prices have grown 22.5% since 2014, with noticeable jumps in 2021 and 2023. However, the town saw a sizable dip in 2025, bringing values back under $80,000. The mix of small gains, occasional declines, and strong recent years highlight the volatility of this Appalachian market.
Grundy – Rebuilding With Uneven Housing Gains

Grundy, the county seat of Buchanan County, is known for its recent revitalization efforts after devastating floods and mining decline. With ongoing infrastructure improvements, including a relocated downtown and expansion of the Appalachian School of Law, the town has been working to reinvent itself.
Home prices reflect this transition—rising during redevelopment phases, then falling slightly when demand slows. The drop in 2025 could indicate pricing correction or stalled momentum, but the long-term gains since 2014 suggest steady if uneven progress. Grundy remains a case study in small-town resilience and affordability.
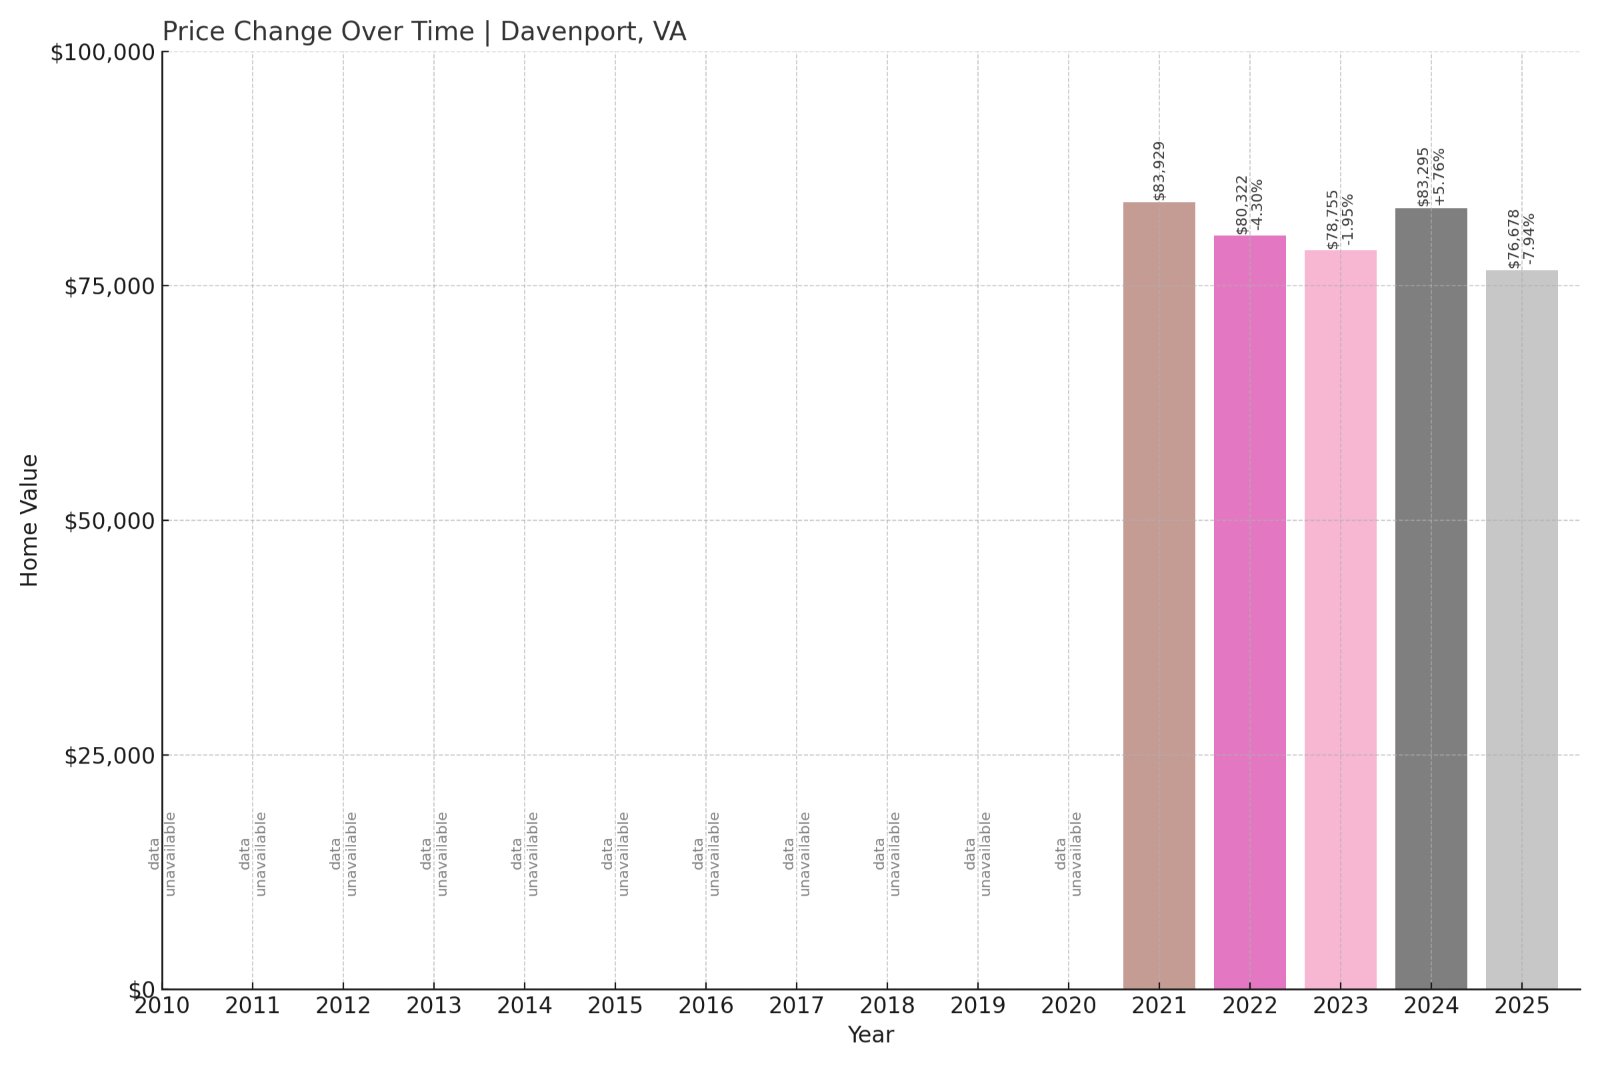
7. Davenport – 8.6% Home Price Decrease Since 2021
- 2010: N/A
- 2011: N/A
- 2012: N/A
- 2013: N/A
- 2014: N/A
- 2015: N/A
- 2016: N/A
- 2017: N/A
- 2018: N/A
- 2019: N/A
- 2020: N/A
- 2021: $83,929
- 2022: $80,322 (-$3,608, -4.30% from previous year)
- 2023: $78,755 (-$1,567, -1.95% from previous year)
- 2024: $83,295 (+$4,540, +5.76% from previous year)
- 2025: $76,678 (-$6,617, -7.94% from previous year)
Davenport has seen home prices fall 8.6% since 2021, despite a short-lived rebound in 2024. The latest dip in 2025—more than $6,600—erased the previous year’s gains. The market appears unstable, with fluctuating trends and no sustained growth pattern over this brief data window.
Davenport – Market Wobbles After Brief Recovery

Situated in Buchanan County, Davenport is a small, rural community with limited housing stock and few commercial amenities. Its real estate prices reflect its quiet profile—starting relatively high in 2021 and dropping gradually in subsequent years. The spike in 2024 gave hope for stabilization, but 2025 reversed course.
With few homes on the market and little new development, individual sales may disproportionately impact annual averages. While Davenport’s drop might deter investors, its affordability could appeal to those prioritizing budget over growth. Continued monitoring will be needed to see if 2024’s jump was an anomaly or a sign of underlying potential.
6. Hurley – 2.4% Home Price Increase Since 2019

🔥 Would you like to save this?
- 2010: N/A
- 2011: N/A
- 2012: N/A
- 2013: N/A
- 2014: N/A
- 2015: N/A
- 2016: N/A
- 2017: N/A
- 2018: N/A
- 2019: $56,176
- 2020: N/A
- 2021: $70,016
- 2022: $69,464 (-$552, -0.79% from previous year)
- 2023: $69,847 (+$384, +0.55% from previous year)
- 2024: $75,791 (+$5,944, +8.51% from previous year)
- 2025: $72,330 (-$3,461, -4.57% from previous year)
Hurley has seen only modest growth in home values since 2019, with a net gain of about 2.4%. The town peaked in 2024 at over $75,000 before dropping again in 2025. The back-and-forth suggests a market influenced by small-scale changes, typical for a town of its size and location.
Hurley – Subtle Shifts in a Remote Mountain Market

Located in Buchanan County, Hurley is a sparsely populated area nestled in the Appalachian Mountains. Known for its rural seclusion and natural beauty, the town faces challenges such as limited infrastructure and past flooding. These factors can directly impact its housing market from year to year.
While 2021 marked a sharp rise in values, recent years have shown inconsistent gains. The housing stock remains affordable, but 2025’s price dip may be linked to market adjustments or fewer transactions. For those looking for privacy and low cost, Hurley remains a contender—but growth may be slow and uneven.
5. Vansant – 17.9% Home Price Increase Since 2019

- 2010: N/A
- 2011: N/A
- 2012: N/A
- 2013: N/A
- 2014: N/A
- 2015: N/A
- 2016: N/A
- 2017: N/A
- 2018: N/A
- 2019: $59,251
- 2020: N/A
- 2021: $71,437
- 2022: $66,833 (-$4,604, -6.44% from previous year)
- 2023: $69,136 (+$2,304, +3.45% from previous year)
- 2024: $74,265 (+$5,129, +7.42% from previous year)
- 2025: $69,905 (-$4,360, -5.87% from previous year)
Vansant’s home prices have grown nearly 18% since 2019, though the road has been uneven. After a jump in 2021, prices declined and then climbed again—peaking in 2024. By 2025, however, values fell back below the $70,000 mark, showing the stop-start nature of the local market.
Vansant – Price Gains, But With Shaky Footing

Vansant is a small town in Buchanan County with deep roots in coal mining. Like many towns in the area, it faces limited development and economic uncertainty, which reflects in its housing prices. Still, it experienced significant momentum between 2022 and 2024, gaining nearly $7,400.
The 2025 drop could be a market correction or simply a result of low inventory influencing price averages. At under $70,000, homes in Vansant remain highly accessible, particularly for buyers seeking fixer-uppers or rental properties in rural Appalachia. Long-term stability remains uncertain, but short bursts of growth suggest some demand exists.
4. Oakwood – 9.3% Home Price Increase Since 2019

- 2010: N/A
- 2011: N/A
- 2012: N/A
- 2013: N/A
- 2014: N/A
- 2015: N/A
- 2016: N/A
- 2017: N/A
- 2018: N/A
- 2019: $63,309
- 2020: N/A
- 2021: $73,385
- 2022: $72,123 (-$1,263, -1.72% from previous year)
- 2023: $73,694 (+$1,571, +2.18% from previous year)
- 2024: $78,233 (+$4,538, +6.16% from previous year)
- 2025: $69,234 (-$8,999, -11.50% from previous year)
Oakwood has seen a 9.3% rise in home values since 2019, with prices reaching a high of $78,233 in 2024 before plunging in 2025. That $9,000 drop wiped out most of the previous gains and brought home values back under the $70,000 line. The result is a volatile, low-priced market in flux.
Oakwood – Gains Eclipsed by a Sharp Turn

Oakwood lies near the Appalachian Plateau in Buchanan County, Virginia. Its economy has historically been tied to coal, but like many towns in the region, it’s undergoing a slow shift. While new development is scarce, the housing market has shown brief bursts of optimism—especially in 2021 and 2024.
The nearly 12% drop in 2025 suggests a pullback, perhaps tied to declining demand or fewer home sales. Still, Oakwood remains extremely affordable, especially for buyers with renovation skills or interest in land. Whether prices will stabilize again or continue to fall remains to be seen.
3. Rowe – 3.5% Home Price Decrease Since 2021

- 2010: N/A
- 2011: N/A
- 2012: N/A
- 2013: N/A
- 2014: N/A
- 2015: N/A
- 2016: N/A
- 2017: N/A
- 2018: N/A
- 2019: N/A
- 2020: N/A
- 2021: $67,379
- 2022: $64,541 (-$2,838, -4.21% from previous year)
- 2023: $67,990 (+$3,450, +5.35% from previous year)
- 2024: $69,933 (+$1,942, +2.86% from previous year)
- 2025: $64,860 (-$5,073, -7.25% from previous year)
Home prices in Rowe have fallen by 3.5% since 2021, with a rollercoaster pattern that includes two periods of growth and two years of decline. Most recently, values dropped more than $5,000 between 2024 and 2025, bringing the median price down to $64,860. It’s a market that seems sensitive to small changes in demand.
Rowe – Small Market With Price Swings

Rowe is a remote, unincorporated area in Buchanan County with very few homes and limited commercial infrastructure. The housing stock is generally older, and the area’s appeal lies mostly in its affordability and quiet setting. Without major employers or retail development, housing trends here tend to reflect individual sales more than broader patterns.
The price recovery from 2022 to 2024 suggested possible new interest in the area, but the 2025 drop reversed that trend. Still, Rowe remains among the cheapest places to buy a home in Virginia, and it may interest buyers looking for rural land or low-cost properties to renovate.
2. Appalachia – 24.7% Home Price Increase Since 2010

- 2010: $38,159
- 2011: $37,009 (-$1,149, -3.01% from previous year)
- 2012: $37,148 (+$139, +0.38% from previous year)
- 2013: $37,075 (-$74, -0.20% from previous year)
- 2014: $33,817 (-$3,258, -8.79% from previous year)
- 2015: $34,950 (+$1,133, +3.35% from previous year)
- 2016: $32,985 (-$1,965, -5.62% from previous year)
- 2017: $32,631 (-$354, -1.07% from previous year)
- 2018: $37,128 (+$4,496, +13.78% from previous year)
- 2019: $39,421 (+$2,294, +6.18% from previous year)
- 2020: N/A
- 2021: $39,897
- 2022: $44,994 (+$5,097, +12.78% from previous year)
- 2023: $43,164 (-$1,830, -4.07% from previous year)
- 2024: $46,501 (+$3,337, +7.73% from previous year)
- 2025: $47,586 (+$1,084, +2.33% from previous year)
Appalachia’s home values have grown by nearly 25% since 2010, with the strongest gains coming after 2020. The market saw a small correction in 2023, but has otherwise shown steady progress toward higher values. The 2025 price of $47,586 keeps it one of the most affordable towns in the state, despite the upward trend.
Appalachia – Steady Gains From a Very Low Base

🔥 Would you like to save this?
Located in Wise County, Appalachia is a town with deep coal mining roots and a proud industrial heritage. In recent years, it has worked to reposition itself as a community focused on heritage tourism, nature, and affordability. This shift appears to have contributed to the home price increases seen since 2020.
Still, even with years of growth, prices remain low compared to state averages. That affordability may attract retirees, remote workers, and small investors, particularly those drawn to the area’s scenic setting and historical architecture. Appalachia’s upward trajectory may continue, albeit gradually, as housing demand redistributes in rural Virginia.
1. Bishop – 26.2% Home Price Increase Since 2012

- 2010: N/A
- 2011: N/A
- 2012: $28,981
- 2013: $29,136 (+$155, +0.54% from previous year)
- 2014: $27,625 (-$1,511, -5.19% from previous year)
- 2015: $26,538 (-$1,087, -3.94% from previous year)
- 2016: $29,436 (+$2,898, +10.92% from previous year)
- 2017: $28,543 (-$892, -3.03% from previous year)
- 2018: $29,144 (+$601, +2.11% from previous year)
- 2019: $31,459 (+$2,315, +7.94% from previous year)
- 2020: N/A
- 2021: $40,100
- 2022: $39,115 (-$985, -2.46% from previous year)
- 2023: $32,675 (-$6,439, -16.46% from previous year)
- 2024: $40,678 (+$8,003, +24.49% from previous year)
- 2025: $36,575 (-$4,103, -10.09% from previous year)
Bishop’s home prices have increased by 26.2% since 2012, but the ride has been anything but smooth. After peaking in 2021, the market went through a steep drop in 2023, followed by a dramatic rebound in 2024. The 2025 value of $36,575 reflects a decline from last year but still lands above the early 2010s figures.
Bishop – Big Swings in Virginia’s Most Affordable Town

Straddling the Virginia–West Virginia border, Bishop is a tiny coalfield town with one of the lowest average home prices in the state. The area has long struggled with economic challenges, but its extreme affordability remains a draw for buyers with tight budgets or specific investment goals.
Home values fluctuated wildly from 2021 through 2025, reflecting a small and possibly illiquid market where a few transactions can have an outsized effect. Despite those swings, Bishop is still the least expensive place to buy a home in Virginia as of 2025. That distinction might attract new interest, even as its market remains unpredictable.


