
🔥 Would you like to save this?
Tennessee’s housing market tells a vivid story—and the Zillow Home Value Index helps map it out. As of 2025, home values in certain towns have soared, reflecting not just demand, but deeper shifts in where people want to live and why. From scenic suburbs to fast-growing communities, these 18 towns top the state’s price rankings. Each one reveals something different about what’s shaping Tennessee real estate right now.
18. Ridgeside – 5.33% Home Price Increase Since 2024

- 2010: N/A
- 2011: N/A
- 2012: N/A
- 2013: N/A
- 2014: N/A
- 2015: N/A
- 2016: N/A
- 2017: N/A
- 2018: N/A
- 2019: N/A
- 2020: N/A
- 2021: N/A
- 2022: N/A
- 2023: N/A
- 2024: $521,933
- 2025: $549,761 (+$27,829, +5.33% from previous year)
Despite limited historical data, Ridgeside’s most recent figures show an increase in home values, rising 5.33% from 2024 to 2025. With a current median home price of $549,761, this small city is showing signs of steady demand and growth, even without a deep record of earlier years.
In order to come up with the very specific design ideas, we create most designs with the assistance of state-of-the-art AI interior design software. Also, assume links that take you off the site are affiliate links such as links to Amazon. this means we may earn a commission if you buy something.
Ridgeside – A Quiet City With Big Value

Located in Hamilton County and entirely surrounded by Chattanooga, Ridgeside is one of Tennessee’s smallest incorporated cities. Its exclusivity is part of its appeal. With just a few hundred residents, the area is known for tree-lined streets and mid-century homes with large lots.
The limited housing stock and proximity to Chattanooga’s amenities help maintain high home values. While small in footprint, Ridgeside offers privacy and charm that’s become increasingly attractive in recent years, especially as more buyers seek peaceful neighborhoods within commuting distance of larger cities.
17. Rossville – 96.81% Home Price Increase Since 2010

- 2010: $285,531
- 2011: $277,843 (-$7,688, -2.69% from previous year)
- 2012: $280,515 (+$2,672, +0.96% from previous year)
- 2013: $289,388 (+$8,872, +3.16% from previous year)
- 2014: $295,769 (+$6,382, +2.21% from previous year)
- 2015: $305,542 (+$9,772, +3.30% from previous year)
- 2016: $321,479 (+$15,938, +5.22% from previous year)
- 2017: $333,185 (+$11,706, +3.64% from previous year)
- 2018: $347,109 (+$13,924, +4.18% from previous year)
- 2019: $368,976 (+$21,867, +6.30% from previous year)
- 2020: N/A
- 2021: $430,936
- 2022: $519,245 (+$88,310, +20.49% from previous year)
- 2023: $535,891 (+$16,646, +3.21% from previous year)
- 2024: $554,363 (+$18,471, +3.45% from previous year)
- 2025: $562,155 (+$7,792, +1.41% from previous year)
Rossville’s home prices have nearly doubled since 2010, showing a 96.81% increase over 15 years. Growth has been especially strong since 2021, with double-digit annual gains in 2021 and 2022. Though the pace has slowed slightly, the town continues to command solid appreciation.
Rossville – Growing Appeal Near Memphis

Situated in Fayette County, just east of Memphis, Rossville offers a more rural alternative to the city’s suburbs. Its home prices reflect growing demand from buyers looking for space, peace, and relative affordability within driving distance of Memphis jobs.
Rossville’s development has picked up in recent years thanks to new residential communities and infrastructure improvements. While still small, its appeal lies in its access to nature, expanding amenities, and a lifestyle that blends rural charm with suburban convenience. Buyers priced out of Memphis often consider Rossville for its value and livability.
16. Hickory Withe – 96.49% Home Price Increase Since 2010

- 2010: $287,286
- 2011: $282,206 (-$5,079, -1.77% from previous year)
- 2012: $284,626 (+$2,420, +0.86% from previous year)
- 2013: $291,375 (+$6,748, +2.37% from previous year)
- 2014: $302,165 (+$10,790, +3.70% from previous year)
- 2015: $315,710 (+$13,545, +4.48% from previous year)
- 2016: $327,500 (+$11,790, +3.73% from previous year)
- 2017: $340,546 (+$13,046, +3.98% from previous year)
- 2018: $358,312 (+$17,766, +5.22% from previous year)
- 2019: $387,535 (+$29,222, +8.16% from previous year)
- 2020: N/A
- 2021: $453,261
- 2022: $524,318 (+$71,057, +15.68% from previous year)
- 2023: $526,045 (+$1,727, +0.33% from previous year)
- 2024: $553,475 (+$27,430, +5.21% from previous year)
- 2025: $564,385 (+$10,910, +1.97% from previous year)
Hickory Withe’s home prices have increased by nearly 97% since 2010, with gains accelerating sharply from 2021 onward. Though 2023 was relatively flat, the town rebounded in 2024 and 2025 with continued price strength, ending at $564,385.
Hickory Withe – Steady Growth in a Rural Corner

Hickory Withe is an unincorporated community in Fayette County, known for its large lots and quiet, residential feel. As suburban growth spreads eastward from Memphis, Hickory Withe has seen increasing interest from homebuyers seeking tranquility without sacrificing proximity to the city.
Recent developments have helped boost visibility and demand. The mix of newer construction and long-established homes, combined with an appealing rural setting, make this area increasingly attractive. Infrastructure updates and population growth nearby have supported steady appreciation in home values.
15. Mount Juliet – 145.43% Home Price Increase Since 2010

- 2010: $232,842
- 2011: $230,530 (-$2,313, -0.99% from previous year)
- 2012: $227,521 (-$3,009, -1.31% from previous year)
- 2013: $236,550 (+$9,029, +3.97% from previous year)
- 2014: $252,825 (+$16,275, +6.88% from previous year)
- 2015: $276,573 (+$23,747, +9.39% from previous year)
- 2016: $302,972 (+$26,399, +9.55% from previous year)
- 2017: $325,173 (+$22,201, +7.33% from previous year)
- 2018: $347,655 (+$22,482, +6.91% from previous year)
- 2019: $359,975 (+$12,320, +3.54% from previous year)
- 2020: N/A
- 2021: $414,058
- 2022: $535,106 (+$121,048, +29.23% from previous year)
- 2023: $547,074 (+$11,968, +2.24% from previous year)
- 2024: $561,122 (+$14,048, +2.57% from previous year)
- 2025: $571,535 (+$10,413, +1.86% from previous year)
Mount Juliet’s home values have surged by over 145% since 2010, fueled by rapid suburban expansion and infrastructure improvements. Growth remained especially strong post-2021, with a notable 29% jump in 2022 alone.
Mount Juliet – A Booming Suburb of Nashville

Located in Wilson County, Mount Juliet is one of the fastest-growing cities in the Nashville metro area. It offers a mix of newer subdivisions, shopping centers, and easy access to Nashville via I-40 and a commuter rail line. This accessibility, along with good schools and family-friendly amenities, has driven housing demand.
The city has consistently attracted both new residents and developers, making it a hotspot for home price growth. Its modern infrastructure, recreational options like Percy Priest Lake, and strong retail presence all contribute to a rising housing market with no signs of slowing down.
14. Primm Springs – 238.27% Home Price Increase Since 2010

- 2010: $170,670
- 2011: $162,725 (-$7,946, -4.66% from previous year)
- 2012: $167,722 (+$4,997, +3.07% from previous year)
- 2013: $181,760 (+$14,038, +8.37% from previous year)
- 2014: $186,592 (+$4,832, +2.66% from previous year)
- 2015: $210,587 (+$23,995, +12.86% from previous year)
- 2016: $230,695 (+$20,108, +9.55% from previous year)
- 2017: $269,148 (+$38,454, +16.67% from previous year)
- 2018: $292,348 (+$23,200, +8.62% from previous year)
- 2019: $312,792 (+$20,443, +6.99% from previous year)
- 2020: N/A
- 2021: $411,269
- 2022: $553,072 (+$141,804, +34.48% from previous year)
- 2023: $506,028 (-$47,045, -8.51% from previous year)
- 2024: $553,377 (+$47,349, +9.36% from previous year)
- 2025: $577,288 (+$23,911, +4.32% from previous year)
Primm Springs has experienced a remarkable 238% increase in home values since 2010. Though prices briefly dipped in 2023, they rebounded strongly in 2024 and 2025, continuing a long-term upward trend.
Primm Springs – Rising Prices in a Rustic Setting

Located in Hickman County, Primm Springs is a small rural community known for its scenic countryside and historic charm. Originally developed around a mineral spring resort in the 1800s, the town today is a peaceful retreat for those looking to escape urban sprawl.
Its affordability and open land have made it attractive to buyers seeking large plots or hobby farms. In recent years, demand for secluded properties has driven prices higher, especially as remote work has made commuting less essential. Primm Springs may be quiet, but its real estate market is anything but stagnant.
13. Signal Mountain – 115.41% Home Price Increase Since 2010

- 2010: $288,864
- 2011: $293,636 (+$4,772, +1.65% from previous year)
- 2012: $277,959 (-$15,677, -5.34% from previous year)
- 2013: $283,727 (+$5,768, +2.08% from previous year)
- 2014: $301,680 (+$17,953, +6.33% from previous year)
- 2015: $304,823 (+$3,143, +1.04% from previous year)
- 2016: $320,188 (+$15,365, +5.04% from previous year)
- 2017: $342,295 (+$22,107, +6.90% from previous year)
- 2018: $354,622 (+$12,327, +3.60% from previous year)
- 2019: $370,493 (+$15,871, +4.48% from previous year)
- 2020: N/A
- 2021: $433,198
- 2022: $525,211 (+$92,013, +21.24% from previous year)
- 2023: $543,532 (+$18,322, +3.49% from previous year)
- 2024: $598,633 (+$55,100, +10.14% from previous year)
- 2025: $622,350 (+$23,717, +3.96% from previous year)
Signal Mountain has seen a 115% rise in home prices since 2010, with steady annual increases and a sharp uptick between 2021 and 2022. Home values climbed again in 2024 and 2025, reaching $622,350, cementing its place among Tennessee’s most desirable towns.
Signal Mountain – Scenic Living Above the City

Perched above Chattanooga in Hamilton County, Signal Mountain offers breathtaking views, tight-knit neighborhoods, and access to nature. It’s known for excellent public schools, outdoor recreation, and a laid-back lifestyle that appeals to families and retirees alike.
Its appeal has only grown in recent years, as more homebuyers seek space and scenery while staying close to city amenities. The town’s trails, bluffs, and artistic culture continue to attract new residents, contributing to long-term growth in home prices and demand.
12. Milton – 14.63% Home Price Increase Since 2022

🔥 Would you like to save this?
- 2010: N/A
- 2011: N/A
- 2012: N/A
- 2013: N/A
- 2014: N/A
- 2015: N/A
- 2016: N/A
- 2017: N/A
- 2018: N/A
- 2019: N/A
- 2020: N/A
- 2021: N/A
- 2022: $557,664
- 2023: $560,979 (+$3,316, +0.59% from previous year)
- 2024: $605,774 (+$44,795, +7.99% from previous year)
- 2025: $639,374 (+$33,600, +5.55% from previous year)
While earlier data is incomplete, Milton has posted clear and consistent home value growth since 2022, totaling a 14.63% increase over three years. The 2025 median price of $639,374 puts it firmly in the upper tier of Tennessee real estate.
Milton – Quiet Country Living with Price Momentum

Milton is a small unincorporated community in Rutherford County, tucked between Murfreesboro and Woodbury. Though it’s rural in nature, increasing interest in country properties has driven up home values significantly in recent years.
The town’s location offers a peaceful environment within reach of larger cities, attracting buyers who want land and solitude without disconnecting from civilization. As development spreads outward from Murfreesboro, Milton’s scenic and spacious properties are catching more attention—and higher prices.
11. Farragut – 125.67% Home Price Increase Since 2010

- 2010: $302,749
- 2011: $298,091 (-$4,658, -1.54% from previous year)
- 2012: $297,531 (-$560, -0.19% from previous year)
- 2013: $308,104 (+$10,573, +3.55% from previous year)
- 2014: $317,825 (+$9,721, +3.15% from previous year)
- 2015: $328,640 (+$10,815, +3.40% from previous year)
- 2016: $339,666 (+$11,026, +3.35% from previous year)
- 2017: $350,672 (+$11,006, +3.24% from previous year)
- 2018: $364,343 (+$13,671, +3.90% from previous year)
- 2019: $373,914 (+$9,571, +2.63% from previous year)
- 2020: N/A
- 2021: $442,962
- 2022: $563,840 (+$120,878, +27.29% from previous year)
- 2023: $606,156 (+$42,316, +7.50% from previous year)
- 2024: $669,351 (+$63,195, +10.43% from previous year)
- 2025: $683,089 (+$13,738, +2.05% from previous year)
Farragut’s home values have grown by over 125% since 2010. The town has consistently posted gains year after year, with especially large jumps since 2021. Its 2025 price of $683,089 places it comfortably in the top tier of Tennessee towns by home value.
Farragut – Affluent Knoxville Suburb with Staying Power

Located west of Knoxville in Knox County, Farragut is a well-established suburb known for its high-performing schools, parks, and spacious homes. Its proximity to I-40 and top-tier shopping centers has made it a magnet for professionals and families.
Recent infrastructure improvements and strong local services have helped the area remain competitive in the real estate market. With a mix of traditional neighborhoods and upscale developments, Farragut continues to attract homebuyers who are willing to pay a premium for quality of life.
10. Piperton – 104.63% Home Price Increase Since 2010

- 2010: $338,435
- 2011: $333,207 (-$5,227, -1.54% from previous year)
- 2012: $332,766 (-$441, -0.13% from previous year)
- 2013: $349,189 (+$16,423, +4.94% from previous year)
- 2014: $368,762 (+$19,574, +5.61% from previous year)
- 2015: $382,341 (+$13,579, +3.68% from previous year)
- 2016: $396,240 (+$13,899, +3.64% from previous year)
- 2017: $415,648 (+$19,407, +4.90% from previous year)
- 2018: $429,074 (+$13,427, +3.23% from previous year)
- 2019: $471,024 (+$41,950, +9.78% from previous year)
- 2020: N/A
- 2021: $542,875
- 2022: $638,458 (+$95,582, +17.61% from previous year)
- 2023: $662,575 (+$24,118, +3.78% from previous year)
- 2024: $682,310 (+$19,734, +2.98% from previous year)
- 2025: $692,468 (+$10,159, +1.49% from previous year)
Piperton has more than doubled in home value since 2010, a 104.63% increase that reflects strong, consistent growth. Its location near Memphis and reputation for upscale living have made it a sought-after destination.
Piperton – West Tennessee’s High-End Haven

Just east of Collierville in Fayette County, Piperton is known for its spacious homes and quiet neighborhoods. The town has grown gradually but deliberately, with an emphasis on low-density development and quality residential design.
Its appeal lies in its access to Memphis jobs without the congestion of urban life. With new construction, excellent schools nearby, and a community-driven planning approach, Piperton continues to draw higher-income buyers and investors—driving property values steadily upward.
9. Walden – 113.79% Home Price Increase Since 2010

- 2010: $328,190
- 2011: $331,988 (+$3,798, +1.16% from previous year)
- 2012: $313,538 (-$18,450, -5.56% from previous year)
- 2013: $313,832 (+$294, +0.09% from previous year)
- 2014: $332,108 (+$18,277, +5.82% from previous year)
- 2015: $345,892 (+$13,783, +4.15% from previous year)
- 2016: $359,715 (+$13,824, +4.00% from previous year)
- 2017: $380,285 (+$20,569, +5.72% from previous year)
- 2018: $401,312 (+$21,028, +5.53% from previous year)
- 2019: $411,923 (+$10,610, +2.64% from previous year)
- 2020: N/A
- 2021: $480,150
- 2022: $587,730 (+$107,580, +22.41% from previous year)
- 2023: $607,912 (+$20,183, +3.43% from previous year)
- 2024: $658,175 (+$50,263, +8.27% from previous year)
- 2025: $701,409 (+$43,234, +6.57% from previous year)
Walden has seen a 113.79% increase in home values since 2010, with particularly strong growth over the past five years. The 2022 spike marked a turning point, followed by sustained year-over-year gains. The current median price stands at $701,409.
Walden – Mountain Top Living with City Views

Walden sits atop Signal Mountain in Hamilton County, a scenic and residential community overlooking Chattanooga. With a reputation for tranquility, good schools, and natural beauty, Walden attracts those seeking a slower pace without leaving behind urban conveniences.
Protected zoning and a lack of commercial sprawl have helped maintain the town’s character, which contributes to rising home values. Outdoor enthusiasts appreciate the town’s proximity to hiking trails and scenic bluffs, making it a prime spot for long-term investment in real estate.
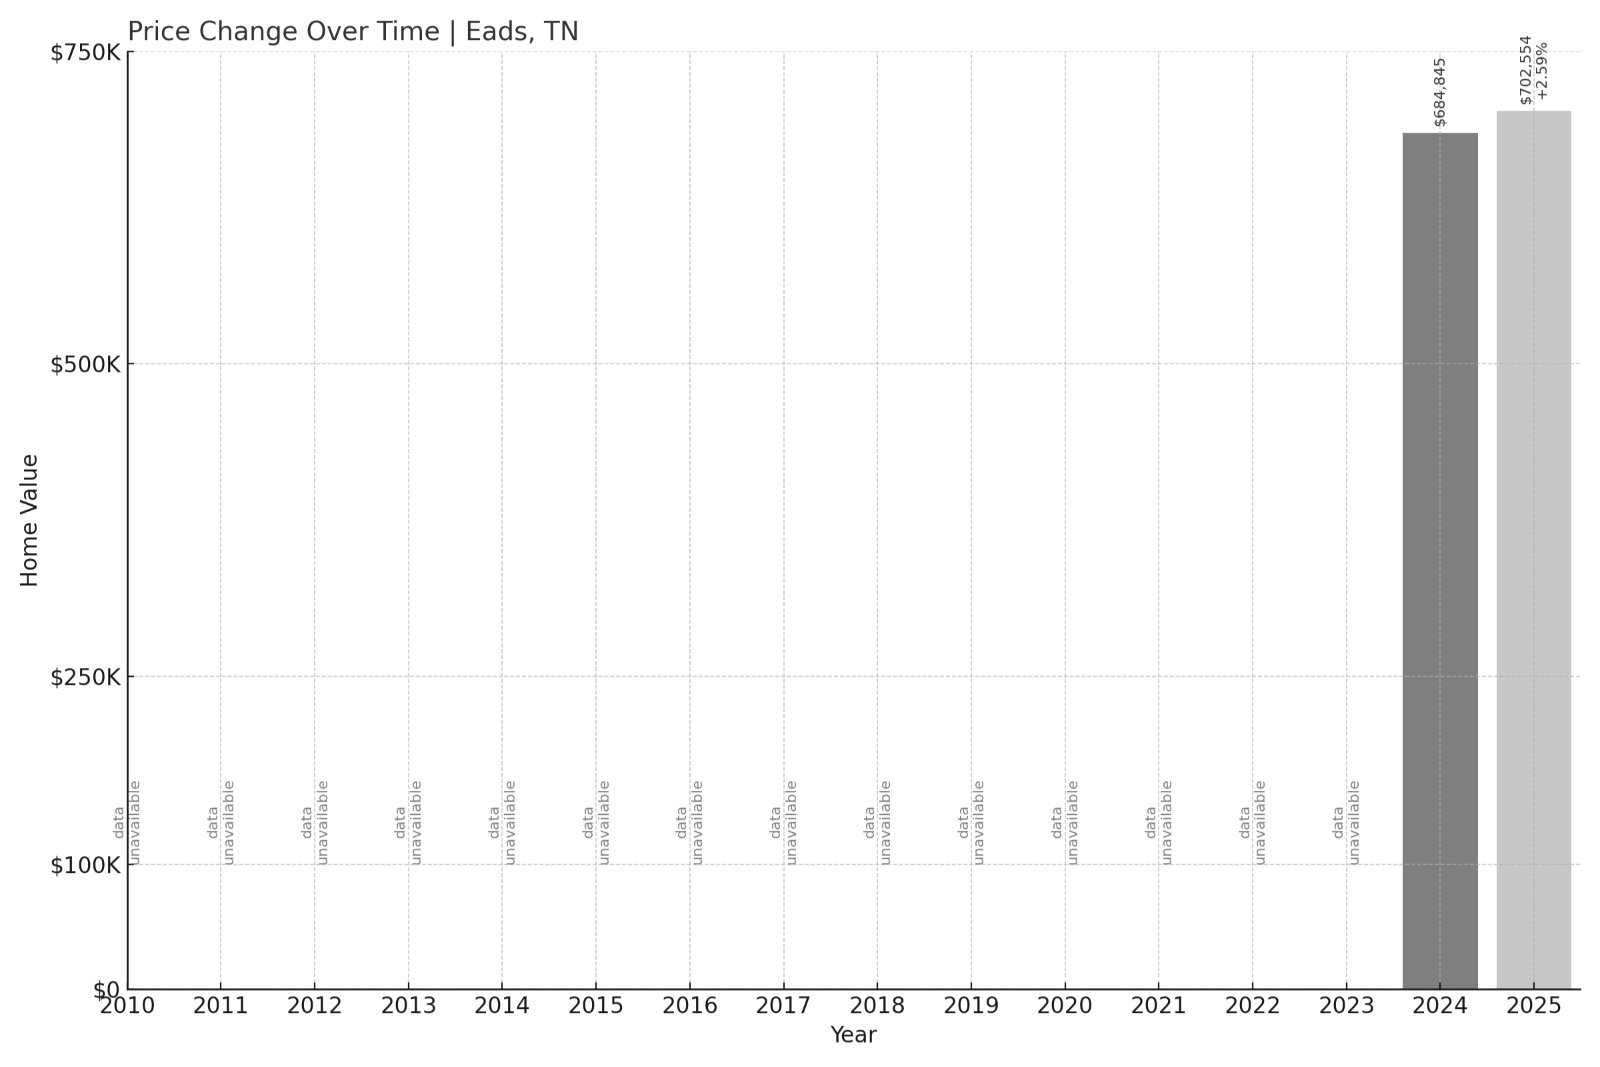
8. Eads – 2.59% Home Price Increase Since 2024
- 2010: N/A
- 2011: N/A
- 2012: N/A
- 2013: N/A
- 2014: N/A
- 2015: N/A
- 2016: N/A
- 2017: N/A
- 2018: N/A
- 2019: N/A
- 2020: N/A
- 2021: N/A
- 2022: N/A
- 2023: N/A
- 2024: $684,845
- 2025: $702,554 (+$17,708, +2.59% from previous year)
Though the dataset is limited, Eads shows a 2.59% home price increase from 2024 to 2025, reaching a median value of $702,554. This reflects its appeal as a semi-rural enclave near Memphis that’s seeing slow but steady growth.
Eads – Spacious Properties on the Edge of the City

Located in Shelby and Fayette counties, Eads is known for its expansive properties, equestrian estates, and peaceful, countryside atmosphere. Despite being just a short drive from Memphis, it retains a distinctly rural character that attracts buyers seeking space and privacy.
Its limited housing supply and premium lots contribute to high property values. Eads continues to appeal to professionals and families wanting upscale living outside the bustle of the city, helping push prices upward even without a history of dense development.
7. Thompsons Station – 181.91% Home Price Increase Since 2010

- 2010: $265,718
- 2011: $261,866 (-$3,852, -1.45% from previous year)
- 2012: $261,610 (-$256, -0.10% from previous year)
- 2013: $277,342 (+$15,731, +6.01% from previous year)
- 2014: $302,565 (+$25,223, +9.09% from previous year)
- 2015: $323,909 (+$21,344, +7.05% from previous year)
- 2016: $355,217 (+$31,308, +9.67% from previous year)
- 2017: $387,977 (+$32,760, +9.22% from previous year)
- 2018: $418,701 (+$30,724, +7.92% from previous year)
- 2019: $442,142 (+$23,441, +5.60% from previous year)
- 2020: N/A
- 2021: $522,924
- 2022: $708,617 (+$185,693, +35.51% from previous year)
- 2023: $705,329 (-$3,288, -0.46% from previous year)
- 2024: $736,682 (+$31,353, +4.45% from previous year)
- 2025: $749,139 (+$12,457, +1.69% from previous year)
Thompsons Station has experienced significant long-term growth, with an overall increase of nearly 182% in home values since 2010. Prices soared between 2021 and 2022 and have continued to trend upward through 2025, ending at $749,139.
Thompsons Station – Small-Town Feel with Fast Growth

Located in Williamson County, Thompsons Station has transformed from a quiet rural town into one of Middle Tennessee’s most sought-after suburbs. Its charm, strong schools, and relative affordability have made it attractive to families and professionals relocating from larger cities.
The town is surrounded by rolling hills and farmland but offers easy access to Franklin and Nashville, making it ideal for commuters. As new subdivisions and developments have taken shape, demand has surged—reflected in the sharp rise in home values over the past decade.
6. Nolensville – 153.47% Home Price Increase Since 2010

🔥 Would you like to save this?
- 2010: $330,293
- 2011: $324,538 (-$5,756, -1.74% from previous year)
- 2012: $311,615 (-$12,923, -3.98% from previous year)
- 2013: $330,954 (+$19,338, +6.21% from previous year)
- 2014: $359,905 (+$28,951, +8.75% from previous year)
- 2015: $382,991 (+$23,086, +6.41% from previous year)
- 2016: $419,980 (+$36,990, +9.66% from previous year)
- 2017: $456,187 (+$36,206, +8.62% from previous year)
- 2018: $485,458 (+$29,271, +6.42% from previous year)
- 2019: $508,611 (+$23,153, +4.77% from previous year)
- 2020: N/A
- 2021: $596,472
- 2022: $799,426 (+$202,953, +34.03% from previous year)
- 2023: $794,087 (-$5,339, -0.67% from previous year)
- 2024: $824,142 (+$30,055, +3.78% from previous year)
- 2025: $837,083 (+$12,941, +1.57% from previous year)
Since 2010, Nolensville’s home values have surged by over 153%, driven by explosive growth in the Nashville metro area. The sharpest increases came after 2021, with the median price reaching $837,083 in 2025.
Nolensville – Booming Growth Just South of Nashville

Nolensville, in Williamson County, has undergone dramatic change in the last decade. Once a small town with farmland and antique shops, it’s now one of the fastest-growing suburbs in Tennessee. New construction and planned developments have reshaped the town’s housing market.
Despite its growth, Nolensville retains a strong sense of community with local events, parks, and schools that appeal to families. Its location just southeast of Nashville makes it ideal for commuters and remote workers alike, fueling demand for housing and sustained price increases.
5. Franklin – 174.74% Home Price Increase Since 2010

- 2010: $336,467
- 2011: $334,518 (-$1,949, -0.58% from previous year)
- 2012: $335,203 (+$684, +0.20% from previous year)
- 2013: $355,374 (+$20,171, +6.02% from previous year)
- 2014: $382,676 (+$27,302, +7.68% from previous year)
- 2015: $407,493 (+$24,817, +6.49% from previous year)
- 2016: $440,512 (+$33,019, +8.10% from previous year)
- 2017: $472,530 (+$32,018, +7.27% from previous year)
- 2018: $499,737 (+$27,207, +5.76% from previous year)
- 2019: $531,044 (+$31,307, +6.26% from previous year)
- 2020: N/A
- 2021: $638,149
- 2022: $868,207 (+$230,059, +36.05% from previous year)
- 2023: $855,158 (-$13,050, -1.50% from previous year)
- 2024: $897,383 (+$42,225, +4.94% from previous year)
- 2025: $924,283 (+$26,900, +3.00% from previous year)
Franklin has seen home prices climb by nearly 175% since 2010. The market surged particularly after 2021, with consistent gains that place the median home price at $924,283 in 2025. Price dips have been minor compared to overall upward momentum.
Franklin – Historic Charm Meets Modern Prosperity

Franklin, located just south of Nashville in Williamson County, is one of the state’s most popular and affluent towns. With its blend of historic downtown architecture, cultural festivals, and corporate presence, Franklin appeals to a broad spectrum of homebuyers.
The town balances charm and growth, offering shopping, music venues, and proximity to major employers. Historic districts and upscale developments alike have pushed home prices higher, solidifying Franklin’s position as a long-term leader in Tennessee real estate.
4. Lookout Mountain – 117.32% Home Price Increase Since 2010

- 2010: $463,491
- 2011: $471,804 (+$8,312, +1.79% from previous year)
- 2012: $440,509 (-$31,295, -6.63% from previous year)
- 2013: $460,338 (+$19,830, +4.50% from previous year)
- 2014: $475,764 (+$15,425, +3.35% from previous year)
- 2015: $476,162 (+$398, +0.08% from previous year)
- 2016: $479,569 (+$3,408, +0.72% from previous year)
- 2017: $508,521 (+$28,952, +6.04% from previous year)
- 2018: $532,044 (+$23,523, +4.63% from previous year)
- 2019: $564,209 (+$32,165, +6.05% from previous year)
- 2020: N/A
- 2021: $659,406
- 2022: $810,076 (+$150,670, +22.85% from previous year)
- 2023: $853,073 (+$42,997, +5.31% from previous year)
- 2024: $945,636 (+$92,563, +10.85% from previous year)
- 2025: $1,007,055 (+$61,419, +6.50% from previous year)
Home values in Lookout Mountain have climbed 117% since 2010. With consistently strong gains over the past five years, the town has reached a 2025 median price just above $1 million, placing it among Tennessee’s most exclusive communities.
Lookout Mountain – Prestige with a View

Perched high above Chattanooga, Lookout Mountain is known for its panoramic vistas, winding roads, and stately homes. Its combination of natural beauty and high-end real estate makes it a standout even among Tennessee’s most desirable places to live.
The town is shared between Tennessee and Georgia, with the Tennessee portion offering some of the area’s most luxurious homes. Excellent schools, low crime, and proximity to Chattanooga’s amenities continue to drive premium demand for homes in this elevated retreat.
3. Arrington – 222.45% Home Price Increase Since 2010

- 2010: $343,409
- 2011: $356,133 (+$12,724, +3.71% from previous year)
- 2012: $368,234 (+$12,101, +3.40% from previous year)
- 2013: $372,349 (+$4,115, +1.12% from previous year)
- 2014: $401,368 (+$29,019, +7.79% from previous year)
- 2015: $432,941 (+$31,573, +7.87% from previous year)
- 2016: $469,938 (+$36,998, +8.55% from previous year)
- 2017: $507,532 (+$37,594, +8.00% from previous year)
- 2018: $539,905 (+$32,374, +6.38% from previous year)
- 2019: $589,372 (+$49,467, +9.16% from previous year)
- 2020: N/A
- 2021: $737,430
- 2022: $1,035,582 (+$298,152, +40.43% from previous year)
- 2023: $1,036,428 (+$846, +0.08% from previous year)
- 2024: $1,074,052 (+$37,624, +3.63% from previous year)
- 2025: $1,106,995 (+$32,943, +3.07% from previous year)
Home prices in Arrington have skyrocketed 222% since 2010, driven by a wave of luxury development and strong demand. With median prices topping $1.1 million in 2025, the town has emerged as a premier destination for affluent buyers.
Arrington – Luxury Living in Horse Country

Arrington is located in Williamson County, just southeast of Franklin, and is known for its rolling pastures, equestrian estates, and upscale neighborhoods. The presence of Arrington Vineyards adds to its rural charm while drawing in weekend visitors and potential residents.
Its high-end developments and large, custom-built homes have attracted buyers from across the region. As more people seek open space and luxury within reach of Nashville, Arrington has grown into one of the most prestigious addresses in Middle Tennessee.
2. College Grove – 255.87% Home Price Increase Since 2010

- 2010: $343,294
- 2011: $360,153 (+$16,859, +4.91% from previous year)
- 2012: $352,859 (-$7,294, -2.03% from previous year)
- 2013: $355,930 (+$3,071, +0.87% from previous year)
- 2014: $389,605 (+$33,675, +9.46% from previous year)
- 2015: $438,760 (+$49,155, +12.62% from previous year)
- 2016: $514,267 (+$75,506, +17.21% from previous year)
- 2017: $582,808 (+$68,542, +13.33% from previous year)
- 2018: $629,501 (+$46,693, +8.01% from previous year)
- 2019: $678,034 (+$48,533, +7.71% from previous year)
- 2020: N/A
- 2021: $845,936
- 2022: $1,173,409 (+$327,473, +38.71% from previous year)
- 2023: $1,111,237 (-$62,172, -5.30% from previous year)
- 2024: $1,168,911 (+$57,674, +5.19% from previous year)
- 2025: $1,221,755 (+$52,844, +4.52% from previous year)
College Grove has posted a 256% increase in home values since 2010 — among the highest in the state. Although 2023 saw a minor drop, prices quickly rebounded, topping $1.2 million in 2025.
College Grove – From Quiet Farmland to High-Dollar Haven

🔥 Would you like to save this?
Once a quiet rural town in Williamson County, College Grove has emerged as one of Tennessee’s most exclusive housing markets. With luxury developments like The Grove Golf & Country Club, the area has become a magnet for high-net-worth buyers.
Its serene setting, combined with private amenities and large estate lots, has made it a standout for those seeking luxury with room to breathe. Continued demand and limited supply help explain the area’s soaring prices and elite ranking on this list.
1. Brentwood – 171.32% Home Price Increase Since 2010

- 2010: $513,709
- 2011: $517,933 (+$4,224, +0.82% from previous year)
- 2012: $514,382 (-$3,551, -0.69% from previous year)
- 2013: $542,377 (+$27,995, +5.44% from previous year)
- 2014: $583,104 (+$40,727, +7.51% from previous year)
- 2015: $616,423 (+$33,319, +5.71% from previous year)
- 2016: $654,693 (+$38,270, +6.21% from previous year)
- 2017: $689,701 (+$35,008, +5.35% from previous year)
- 2018: $716,006 (+$26,305, +3.81% from previous year)
- 2019: $769,243 (+$53,237, +7.44% from previous year)
- 2020: N/A
- 2021: $925,123
- 2022: $1,288,837 (+$363,714, +39.32% from previous year)
- 2023: $1,244,946 (-$43,891, -3.41% from previous year)
- 2024: $1,316,445 (+$71,499, +5.74% from previous year)
- 2025: $1,393,796 (+$77,351, +5.88% from previous year)
Brentwood tops this list with a 171.32% increase in home values since 2010. Despite a slight dip in 2023, the town has rebounded strongly, reaching a 2025 median home price of $1.39 million.
Brentwood – Tennessee’s Premier Address

Located in Williamson County, Brentwood is synonymous with affluence, top-tier schools, and beautiful neighborhoods. Its proximity to Nashville and luxury lifestyle offerings make it one of the most desirable places to live in the state.
With a mix of sprawling estates, gated communities, and a strong sense of civic pride, Brentwood consistently ranks among the best places to live in the South. Its real estate market reflects its prestige—steady demand, high price points, and strong long-term growth.


