🔥 Would you like to save this?
Zillow Home Value Index data reveals a quieter side of Maryland’s real estate market—21 towns where home prices remain surprisingly low in 2025. These aren’t the places you see on postcards, but they offer something just as valuable: space, stability, and a chance to buy without bidding wars. Found in rural counties and along forgotten routes, these communities are holding the line on affordability—even as the rest of the state heats up.
21. Deal Island – 58.45% Home Price Increase Since 2010

- 2010: $126,072
- 2011: $123,120 (-$2,952, -2.34% from previous year)
- 2012: $125,946 (+$2,826, +2.30% from previous year)
- 2013: $111,227 (-$14,720, -11.69% from previous year)
- 2014: $117,041 (+$5,814, +5.23% from previous year)
- 2015: $122,133 (+$5,092, +4.35% from previous year)
- 2016: $123,798 (+$1,666, +1.36% from previous year)
- 2017: $118,121 (-$5,678, -4.59% from previous year)
- 2018: $123,502 (+$5,381, +4.56% from previous year)
- 2019: $132,712 (+$9,210, +7.46% from previous year)
- 2020: N/A
- 2021: $163,876
- 2022: $179,664 (+$15,788, +9.63% from previous year)
- 2023: $188,111 (+$8,446, +4.70% from previous year)
- 2024: $196,715 (+$8,604, +4.57% from previous year)
- 2025: $199,784 (+$3,070, +1.56% from previous year)
Deal Island has seen its typical home value increase from just over $126,000 in 2010 to nearly $200,000 in 2025, a rise of 58%. The market here has been bumpy, with dips in the early 2010s followed by a more sustained climb beginning in 2019. In recent years, modest year-over-year growth has brought greater price stability, although annual increases have started to taper off.
In order to come up with the very specific design ideas, we create most designs with the assistance of state-of-the-art AI interior design software. Also, assume links that take you off the site are affiliate links such as links to Amazon. this means we may earn a commission if you buy something.
Deal Island – Quiet Bay Living on Maryland’s Eastern Shore

Located in Somerset County along the Chesapeake Bay, Deal Island is a peaceful coastal community known for fishing, waterfowl hunting, and sweeping marshland views. Despite its scenic location, the housing market has remained highly affordable. The rise in home values over the past five years reflects renewed interest in remote living and affordable waterfront properties, though prices remain well below the state average.
Accessibility is limited—there’s no quick route to urban centers—which helps keep demand and prices in check. Deal Island is best suited for those seeking solitude, nature, and a strong sense of place rooted in the tides and traditions of the bay.
20. Marion Station – 82.45% Home Price Increase Since 2010

- 2010: $106,252
- 2011: $102,707 (-$3,545, -3.34% from previous year)
- 2012: $102,813 (+$105, +0.10% from previous year)
- 2013: $105,353 (+$2,541, +2.47% from previous year)
- 2014: $106,043 (+$690, +0.65% from previous year)
- 2015: $109,644 (+$3,601, +3.40% from previous year)
- 2016: $113,088 (+$3,444, +3.14% from previous year)
- 2017: $113,622 (+$534, +0.47% from previous year)
- 2018: $115,791 (+$2,169, +1.91% from previous year)
- 2019: $121,610 (+$5,818, +5.02% from previous year)
- 2020: N/A
- 2021: $158,396
- 2022: $177,741 (+$19,344, +12.21% from previous year)
- 2023: $176,304 (-$1,436, -0.81% from previous year)
- 2024: $195,016 (+$18,712, +10.61% from previous year)
- 2025: $193,850 (-$1,166, -0.60% from previous year)
Marion Station’s home prices have grown steadily from around $106,000 in 2010 to nearly $194,000 in 2025. While the town saw brief declines in 2011 and again in 2023, it generally enjoyed a positive trend. The last five years brought the most dramatic gains, with home values jumping over $36,000 since 2021 alone.
Marion Station – Historic Charm with Modest Growth

Often referred to as the “Strawberry Capital of the World” in its heyday, Marion Station is a small unincorporated community that still retains much of its rural character. The area’s affordability has made it attractive for retirees and telecommuters looking for peace and space without high prices. Its slow and steady price increases reflect growing awareness without large-scale development.
With its quiet streets, local farming heritage, and proximity to the Chesapeake Bay, Marion Station remains a haven for those seeking an unhurried pace of life. The recent growth is likely due in part to Maryland’s broader affordability squeeze pushing buyers further out.
19. Baltimore – 66.99% Home Price Increase Since 2010
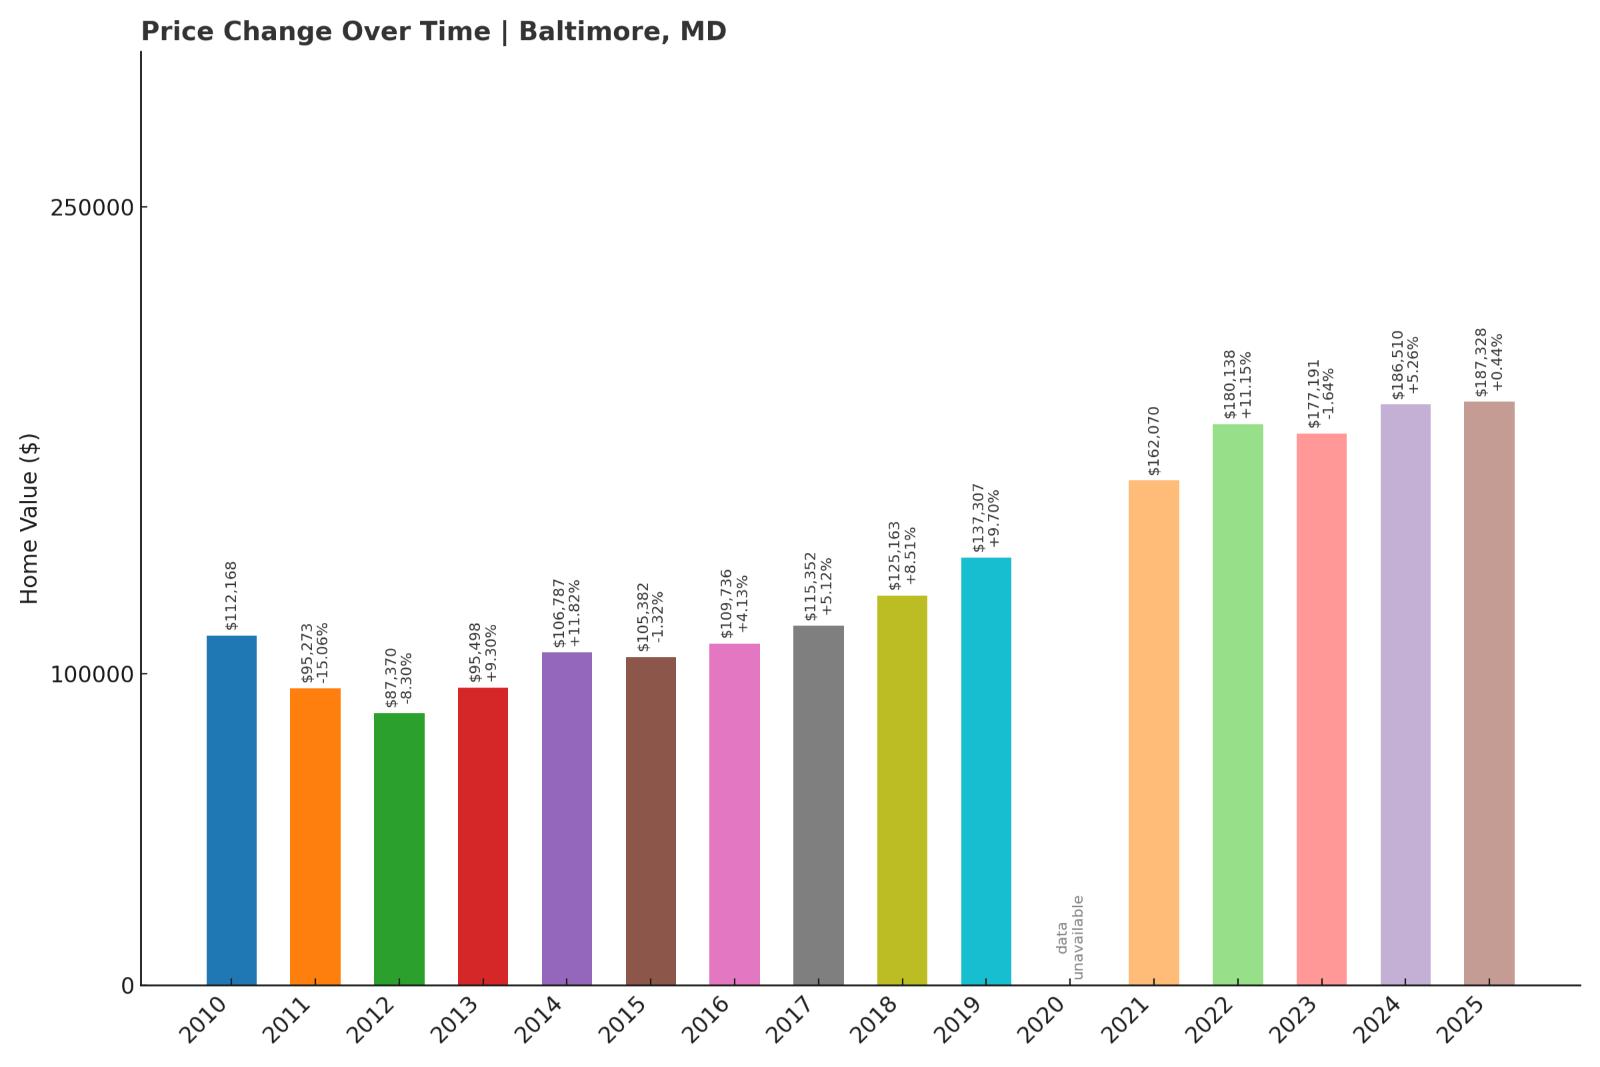
- 2010: $112,168
- 2011: $95,273 (-$16,895, -15.06% from previous year)
- 2012: $87,370 (-$7,903, -8.30% from previous year)
- 2013: $95,498 (+$8,127, +9.30% from previous year)
- 2014: $106,787 (+$11,289, +11.82% from previous year)
- 2015: $105,382 (-$1,406, -1.32% from previous year)
- 2016: $109,736 (+$4,354, +4.13% from previous year)
- 2017: $115,352 (+$5,616, +5.12% from previous year)
- 2018: $125,163 (+$9,811, +8.51% from previous year)
- 2019: $137,307 (+$12,144, +9.70% from previous year)
- 2020: N/A
- 2021: $162,070
- 2022: $180,138 (+$18,068, +11.15% from previous year)
- 2023: $177,191 (-$2,947, -1.64% from previous year)
- 2024: $186,510 (+$9,319, +5.26% from previous year)
- 2025: $187,328 (+$818, +0.44% from previous year)
Despite being the largest city in Maryland, Baltimore remains among the least expensive when it comes to typical home values. After a steep decline early in the last decade, prices rebounded significantly—climbing from around $87,000 in 2012 to over $187,000 in 2025.
Baltimore – Big-City Amenities with Budget Prices

Even as other major U.S. cities saw runaway housing costs, Baltimore’s real estate market has stayed relatively affordable. With a wide range of neighborhoods, from historic rowhomes to new developments, the city has long been a draw for budget-conscious buyers seeking urban living.
The city’s housing affordability is influenced by economic factors, vacancy rates, and public safety concerns in some areas. However, the recent gains suggest renewed investment and a potential turnaround for select neighborhoods—particularly near the waterfront and downtown core.
18. Oldtown – 61.55% Home Price Increase Since 2010

- 2010: $113,122
- 2011: N/A
- 2012: $114,205
- 2013: $115,063 (+$857, +0.75% from previous year)
- 2014: $112,788 (-$2,274, -1.98% from previous year)
- 2015: $119,398 (+$6,610, +5.86% from previous year)
- 2016: $119,217 (-$181, -0.15% from previous year)
- 2017: $121,554 (+$2,337, +1.96% from previous year)
- 2018: $123,215 (+$1,661, +1.37% from previous year)
- 2019: $129,678 (+$6,463, +5.24% from previous year)
- 2020: N/A
- 2021: $156,247
- 2022: $169,841 (+$13,594, +8.70% from previous year)
- 2023: $173,366 (+$3,525, +2.08% from previous year)
- 2024: $172,314 (-$1,051, -0.61% from previous year)
- 2025: $182,733 (+$10,418, +6.05% from previous year)
Oldtown’s home prices have grown gradually over the years, with the typical value now just above $182,000. After a slow start in the 2010s, most of the appreciation occurred post-2020. The town has shown some volatility but continues to trend upward overall.
Oldtown – Affordable Living in Allegany County

Oldtown sits near the West Virginia border and offers quiet, small-town living close to natural amenities like the C&O Canal and Potomac River. The town’s affordability and rural location make it appealing to buyers priced out of more urbanized regions of Maryland.
Recent price increases reflect a broader trend of rural revitalization and migration toward less crowded areas, especially since the pandemic. While home values remain below state averages, they’ve gained traction due to their low base and appeal to long-term homeowners.
17. Deer Park – 9.34% Home Price Increase Since 2022

- 2010: N/A
- 2011: N/A
- 2012: N/A
- 2013: N/A
- 2014: N/A
- 2015: N/A
- 2016: N/A
- 2017: N/A
- 2018: N/A
- 2019: N/A
- 2020: N/A
- 2021: N/A
- 2022: $158,581
- 2023: $160,352 (+$1,771, +1.12% from previous year)
- 2024: $158,651 (-$1,701, -1.06% from previous year)
- 2025: $173,406 (+$14,755, +9.30% from previous year)
Deer Park only has Zillow data starting in 2022, but from that point to 2025, home values have grown modestly. The biggest jump came in the last year, adding nearly $15,000 to the average home price. The overall growth since 2022 totals about 9.3%.
Deer Park – Modest Prices in Maryland’s Mountain Region

Located in Garrett County in far western Maryland, Deer Park is surrounded by forests, lakes, and rolling hills. Its location provides natural beauty and a slower lifestyle that appeals to full-time residents and second-home buyers alike.
The area’s real estate has remained relatively stable, likely due to its distance from major cities. However, the 2025 uptick may reflect increased interest in recreational properties or homes with access to outdoor amenities like Deep Creek Lake.
16. Frostburg – 65.88% Home Price Increase Since 2010

- 2010: $104,104
- 2011: $100,362 (-$3,742, -3.59% from previous year)
- 2012: $110,332 (+$9,969, +9.93% from previous year)
- 2013: $106,467 (-$3,865, -3.50% from previous year)
- 2014: $107,767 (+$1,301, +1.22% from previous year)
- 2015: $111,655 (+$3,888, +3.61% from previous year)
- 2016: $106,094 (-$5,562, -4.98% from previous year)
- 2017: $110,016 (+$3,922, +3.70% from previous year)
- 2018: $116,883 (+$6,867, +6.24% from previous year)
- 2019: $124,070 (+$7,187, +6.15% from previous year)
- 2020: N/A
- 2021: $139,378
- 2022: $154,775 (+$15,397, +11.05% from previous year)
- 2023: $156,645 (+$1,870, +1.21% from previous year)
- 2024: $165,333 (+$8,688, +5.55% from previous year)
- 2025: $172,688 (+$7,355, +4.45% from previous year)
Frostburg’s housing market has grown steadily from a typical home value of just over $104,000 in 2010 to nearly $173,000 in 2025. While there were a few years of decline earlier on, most of the recent gains came after 2020. Price increases in 2022 and 2024 especially stand out for their double-digit and high-single-digit jumps.
Frostburg – A College Town with Stable Growth

Famartin, CC BY-SA 4.0, via Wikimedia Commons
Located in western Maryland, Frostburg is home to Frostburg State University, which brings a steady flow of students, staff, and renters to the area. This university presence helps stabilize the housing market and adds appeal for investors and long-term homeowners alike.
Frostburg’s blend of affordability, walkable downtown, and scenic Appalachian surroundings makes it a desirable small-town option. The recent uptick in home values suggests growing recognition of its livability and rental income potential.
15. Rawlings – 100.83% Home Price Increase Since 2010

🔥 Would you like to save this?
- 2010: $81,804
- 2011: $81,170 (-$635, -0.78% from previous year)
- 2012: $97,620 (+$16,450, +20.27% from previous year)
- 2013: $95,343 (-$2,277, -2.33% from previous year)
- 2014: $97,432 (+$2,089, +2.19% from previous year)
- 2015: $95,518 (-$1,914, -1.96% from previous year)
- 2016: $96,795 (+$1,277, +1.34% from previous year)
- 2017: $100,219 (+$3,423, +3.54% from previous year)
- 2018: $103,773 (+$3,554, +3.55% from previous year)
- 2019: $113,333 (+$9,560, +9.21% from previous year)
- 2020: N/A
- 2021: $130,451
- 2022: $140,901 (+$10,451, +8.01% from previous year)
- 2023: $146,631 (+$5,730, +4.07% from previous year)
- 2024: $160,461 (+$13,830, +9.43% from previous year)
- 2025: $164,254 (+$3,793, +2.36% from previous year)
Rawlings has nearly doubled its typical home value since 2010, with a particularly sharp jump in 2012. Growth has been more consistent in the last five years, as prices climbed from around $130,000 in 2021 to over $164,000 in 2025. It’s one of the stronger appreciating markets among Maryland’s lowest-priced towns.
Rawlings – Solid Gains in a Quiet Allegany County Community

Rawlings is a small, unincorporated area in Allegany County with a rural character and strong local roots. It lacks the amenities of larger towns but benefits from its affordability and relatively stable housing stock.
Its location along U.S. Route 220 makes it convenient for residents who commute to nearby cities like Cumberland. The steady increase in home values reflects a growing interest in these outlying areas, especially for buyers looking for more space and less competition.
14. Loch Lynn Heights – 13.64% Home Price Increase Since 2022

- 2010: N/A
- 2011: N/A
- 2012: N/A
- 2013: N/A
- 2014: N/A
- 2015: N/A
- 2016: N/A
- 2017: N/A
- 2018: N/A
- 2019: N/A
- 2020: N/A
- 2021: N/A
- 2022: $140,896
- 2023: $147,569 (+$6,673, +4.74% from previous year)
- 2024: $155,946 (+$8,377, +5.68% from previous year)
- 2025: $160,175 (+$4,229, +2.71% from previous year)
Home prices in Loch Lynn Heights have increased about 14% since 2022, growing steadily each year. While values remain modest at around $160,000 in 2025, the upward trend signals improving demand or a tightening of available housing stock in the area.
Loch Lynn Heights – Gradual Growth in Western Maryland

This small town in Garrett County offers affordable housing close to Deep Creek Lake and other outdoor attractions. Its proximity to Oakland gives residents access to more services while maintaining a quiet residential feel.
Loch Lynn Heights has largely flown under the radar in Maryland’s housing market, but the recent gains suggest that may be changing. Its mix of affordability and access to natural recreation makes it attractive for working families and retirees alike.
13. Crisfield – 67.29% Home Price Increase Since 2010

- 2010: $94,552
- 2011: $91,613 (-$2,938, -3.11% from previous year)
- 2012: $88,183 (-$3,431, -3.74% from previous year)
- 2013: $86,269 (-$1,914, -2.17% from previous year)
- 2014: $86,798 (+$529, +0.61% from previous year)
- 2015: $80,611 (-$6,186, -7.13% from previous year)
- 2016: $82,495 (+$1,883, +2.34% from previous year)
- 2017: $84,490 (+$1,996, +2.42% from previous year)
- 2018: $85,539 (+$1,048, +1.24% from previous year)
- 2019: $92,641 (+$7,102, +8.30% from previous year)
- 2020: N/A
- 2021: $120,243
- 2022: $138,324 (+$18,081, +15.04% from previous year)
- 2023: $138,122 (-$203, -0.15% from previous year)
- 2024: $160,988 (+$22,866, +16.56% from previous year)
- 2025: $158,176 (-$2,811, -1.75% from previous year)
Crisfield’s home prices have risen more than 67% since 2010, with the largest growth occurring since 2021. Despite a few small declines, 2022 and 2024 each brought massive gains, pushing the typical home value to over $158,000 in 2025.
Crisfield – A Coastal Town Rebounding

Once a bustling seafood hub, Crisfield sits at Maryland’s southernmost tip and still carries its working waterfront heritage. Though it struggled with economic decline and population loss for years, recent interest in coastal living has helped revive local real estate.
Buyers are drawn to the low cost of entry and the appeal of the bay. While seasonal flooding and economic challenges persist, Crisfield’s affordability and cultural charm continue to attract a mix of longtime residents and newcomers.
12. Cumberland – 67.80% Home Price Increase Since 2010
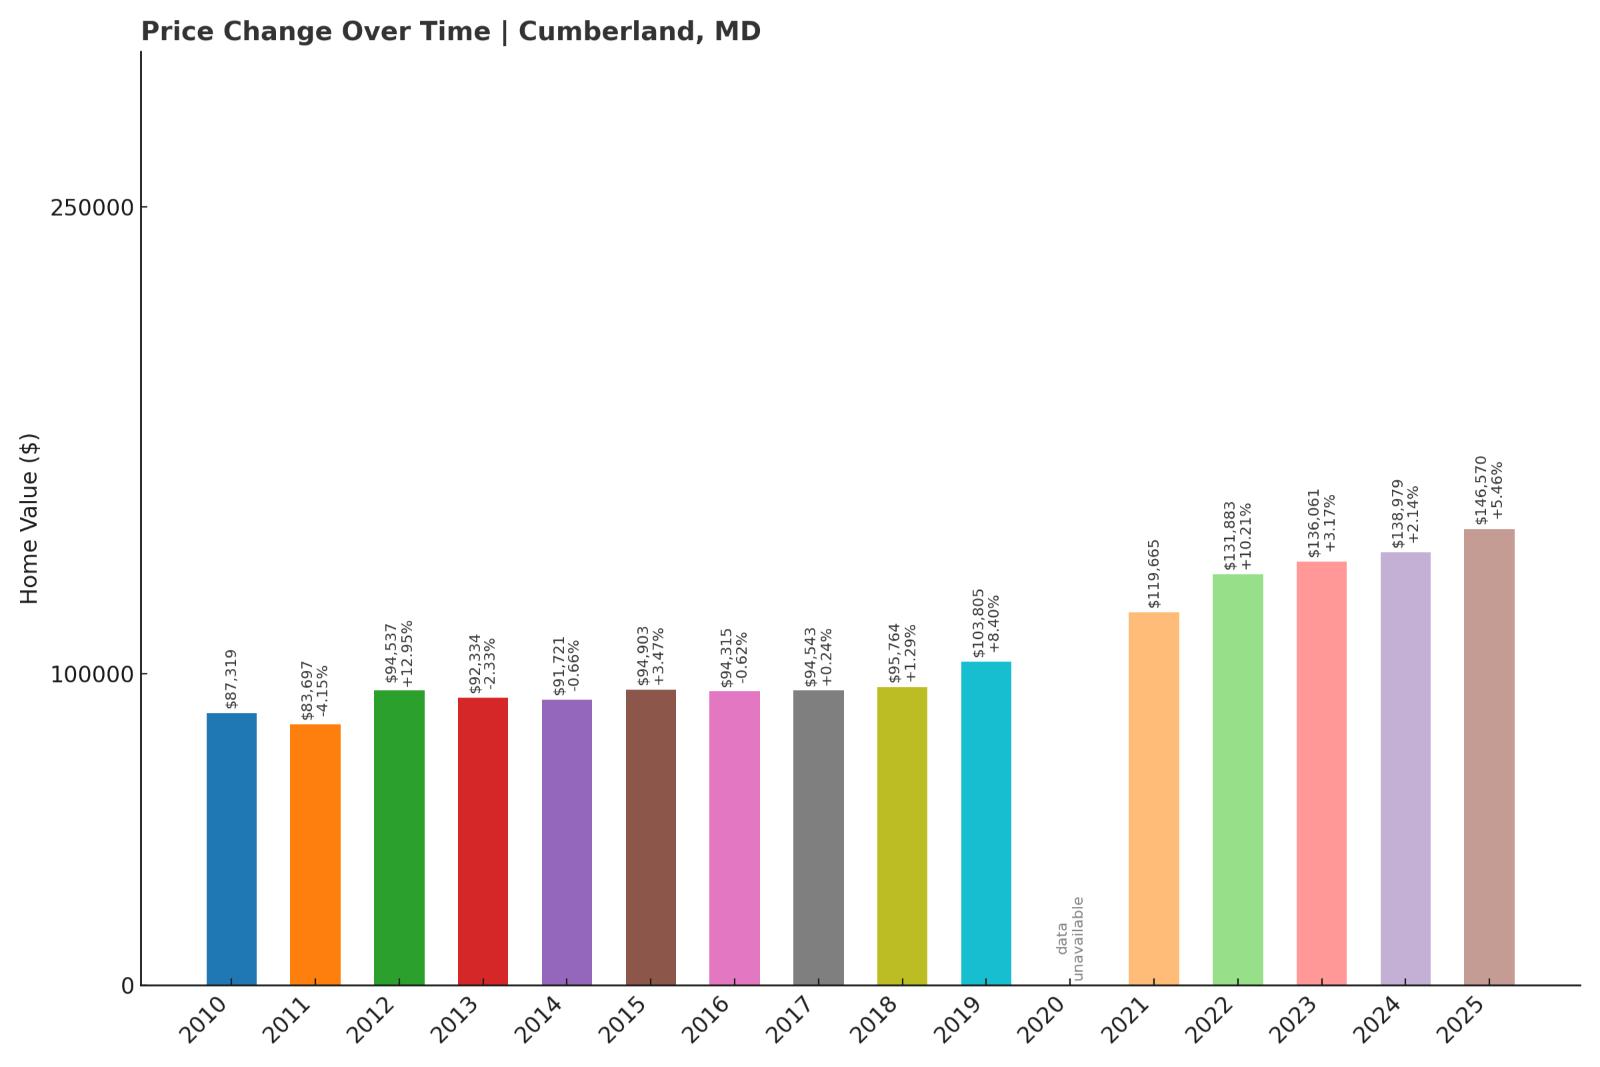
- 2010: $87,319
- 2011: $83,697 (-$3,623, -4.15% from previous year)
- 2012: $94,537 (+$10,840, +12.95% from previous year)
- 2013: $92,334 (-$2,203, -2.33% from previous year)
- 2014: $91,721 (-$613, -0.66% from previous year)
- 2015: $94,903 (+$3,182, +3.47% from previous year)
- 2016: $94,315 (-$588, -0.62% from previous year)
- 2017: $94,543 (+$228, +0.24% from previous year)
- 2018: $95,764 (+$1,222, +1.29% from previous year)
- 2019: $103,805 (+$8,040, +8.40% from previous year)
- 2020: N/A
- 2021: $119,665
- 2022: $131,883 (+$12,217, +10.21% from previous year)
- 2023: $136,061 (+$4,178, +3.17% from previous year)
- 2024: $138,979 (+$2,918, +2.14% from previous year)
- 2025: $146,570 (+$7,592, +5.46% from previous year)
Cumberland’s real estate market has nearly 68% appreciation since 2010. While growth was minimal in the early part of the decade, the last few years have brought more consistent increases. In 2025, home values stand at about $146,000.
Cumberland – Historic Rail Town with Steady Price Gains

Set in the Appalachian Mountains along the Potomac River, Cumberland boasts a historic downtown, rail connections, and easy access to outdoor recreation. It’s one of western Maryland’s larger towns and acts as a regional hub.
Affordability has been a long-standing feature here, but increasing attention from remote workers and retirees has contributed to recent value growth. Infrastructure improvements and small business development have also helped make the market more attractive.
11. Wingate – 2.97% Home Price Increase Since 2022

- 2010: N/A
- 2011: N/A
- 2012: N/A
- 2013: N/A
- 2014: N/A
- 2015: N/A
- 2016: N/A
- 2017: N/A
- 2018: N/A
- 2019: N/A
- 2020: N/A
- 2021: N/A
- 2022: $119,247
- 2023: $115,237 (-$4,011, -3.36% from previous year)
- 2024: $119,511 (+$4,274, +3.71% from previous year)
- 2025: $122,793 (+$3,282, +2.75% from previous year)
Wingate’s home values have grown slightly since 2022, with a net gain of just under 3%. After a dip in 2023, values recovered in 2024 and 2025, ending at around $122,800. It’s one of the more stable but modestly priced markets on this list.
Wingate – Slow Change in a Chesapeake Backwater

Wingate, located in Dorchester County, is a small waterfront community on the lower Eastern Shore. It’s mostly known for its access to the Chesapeake Bay and isolated, rural lifestyle. The real estate market here sees little turnover, which helps explain the subdued price shifts.
What draws people to Wingate is space and solitude. Its limited housing stock and remote location mean it appeals to a very specific buyer—but for those interested in off-the-grid, low-cost coastal living, it’s a compelling option.
10. Ellerslie – 13.70% Home Price Increase Since 2022

- 2010: N/A
- 2011: N/A
- 2012: N/A
- 2013: N/A
- 2014: N/A
- 2015: N/A
- 2016: N/A
- 2017: N/A
- 2018: N/A
- 2019: N/A
- 2020: N/A
- 2021: N/A
- 2022: $107,887
- 2023: $115,381 (+$7,494, +6.95% from previous year)
- 2024: $109,860 (-$5,522, -4.79% from previous year)
- 2025: $122,704 (+$12,844, +11.69% from previous year)
Ellerslie’s home prices have risen nearly 14% since 2022. The market experienced a notable drop in 2024, but bounced back sharply in 2025. These swings suggest a market that’s still adjusting to new demand or fluctuating inventory.
Ellerslie – Rural Market with Big Swings

Ellerslie is tucked into the far western corner of Maryland in Allegany County, just a short drive from the Pennsylvania border. The area offers quiet living, mountain views, and proximity to state parks, but very little commercial activity.
While housing here is still among the most affordable in the state, recent price jumps point to a small but active buyer pool—possibly including retirees or remote workers. Ellerslie’s appeal lies in its seclusion and natural beauty rather than any fast-paced development.
9. Midland – 12.59% Home Price Increase Since 2022

🔥 Would you like to save this?
- 2010: N/A
- 2011: N/A
- 2012: N/A
- 2013: N/A
- 2014: N/A
- 2015: N/A
- 2016: N/A
- 2017: N/A
- 2018: N/A
- 2019: N/A
- 2020: N/A
- 2021: N/A
- 2022: $106,687
- 2023: $111,489 (+$4,802, +4.50% from previous year)
- 2024: $120,233 (+$8,745, +7.84% from previous year)
- 2025: $120,131 (-$102, -0.08% from previous year)
Midland has posted a 12.6% rise in home values since 2022, with steady gains through 2024. Prices plateaued slightly in 2025, but still remain over $120,000. Overall, the growth pattern is smooth and consistent compared to other towns.
Midland – Gradual Increases in a Tiny Mountain Town

Midland sits on the western slope of the Appalachian Mountains in Allegany County. With fewer than 500 residents, it’s one of the smallest incorporated towns in the state. The housing stock is limited but stable, contributing to modest appreciation in recent years.
Homebuyers here are often local or looking for affordable second properties. Midland offers proximity to outdoor recreation, low taxes, and extremely reasonable home prices. The lack of volatility makes it a relatively safe bet among Maryland’s lowest-cost markets.
8. Lonaconing – 9.10% Home Price Increase Since 2022
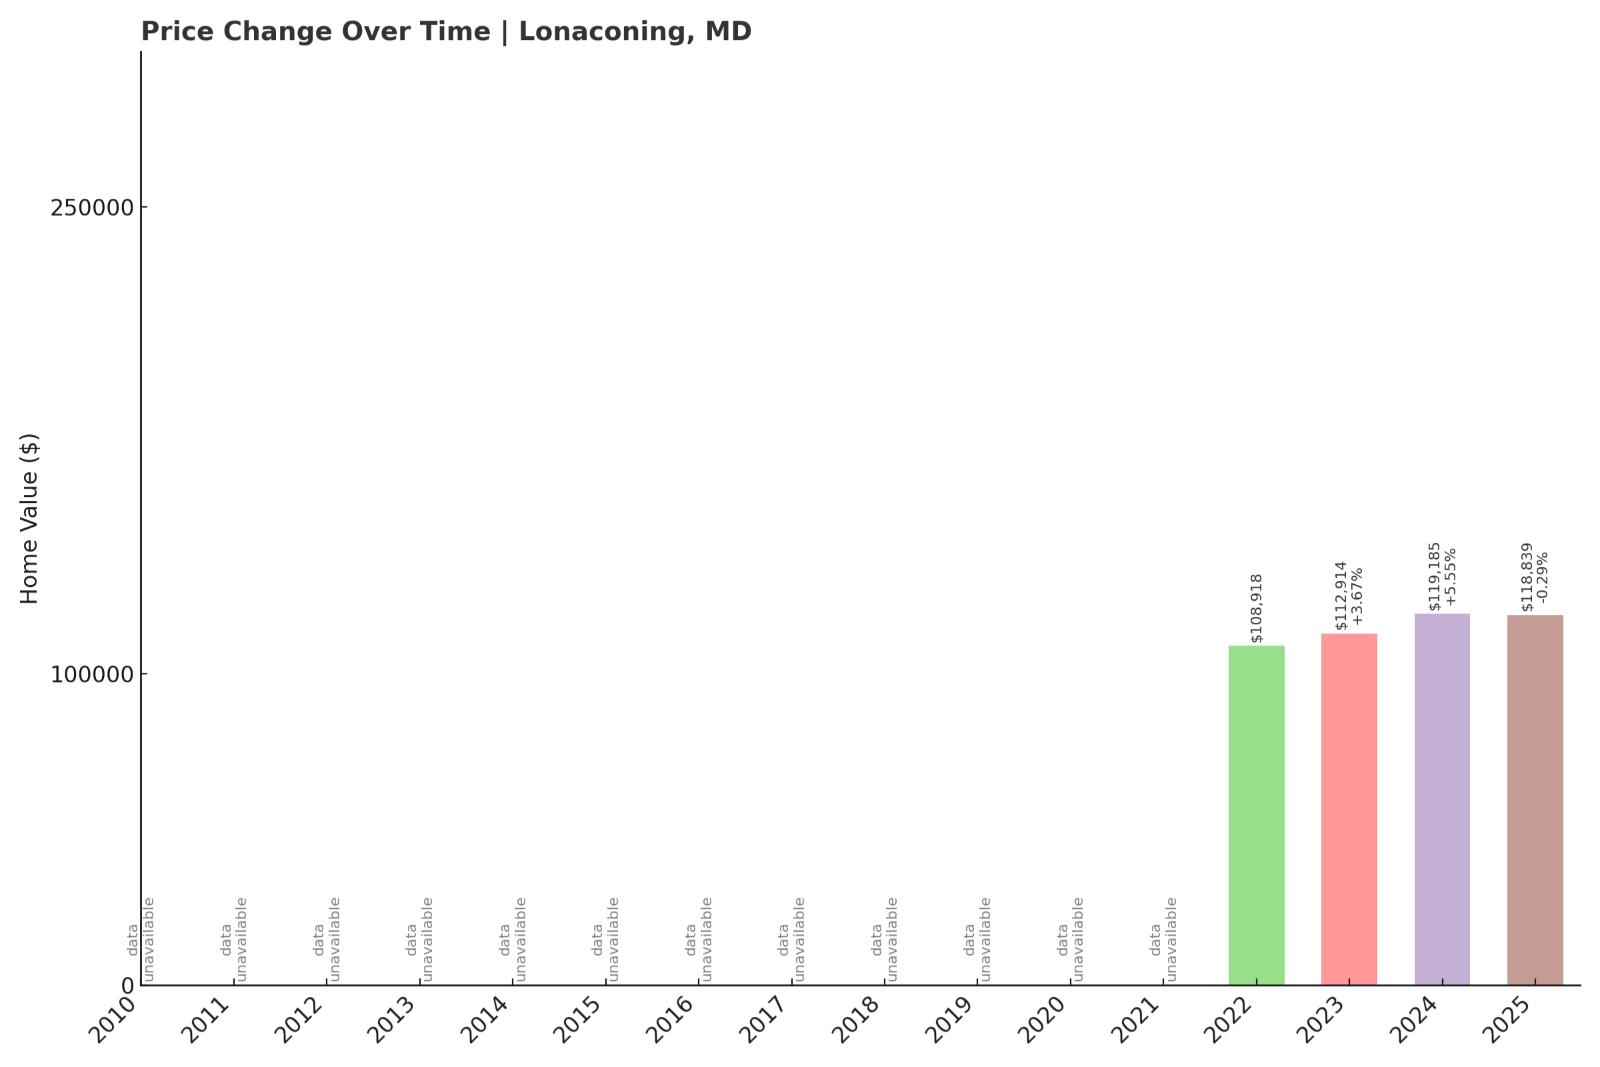
- 2010: N/A
- 2011: N/A
- 2012: N/A
- 2013: N/A
- 2014: N/A
- 2015: N/A
- 2016: N/A
- 2017: N/A
- 2018: N/A
- 2019: N/A
- 2020: N/A
- 2021: N/A
- 2022: $108,918
- 2023: $112,914 (+$3,996, +3.67% from previous year)
- 2024: $119,185 (+$6,271, +5.55% from previous year)
- 2025: $118,839 (-$346, -0.29% from previous year)
Lonaconing has seen a 9.1% price increase since 2022, driven mostly by gains in 2023 and 2024. Prices dipped slightly in 2025 but remained near the town’s all-time high, suggesting stability despite its modest size.
Lonaconing – Mining History and Market Stability

Lonaconing is a historic coal-mining town in western Maryland, part of the Georges Creek Valley. While the industry has long since faded, the town’s housing remains among the state’s most affordable. Recent price increases suggest rising interest in quiet, historic places with strong local identity.
The town’s compact size and scenic surroundings make it appealing for residents who prioritize affordability over access to amenities. Home values may remain modest, but the market has shown resilience and low volatility over the last three years.
7. Mount Savage – 75.01% Home Price Increase Since 2010
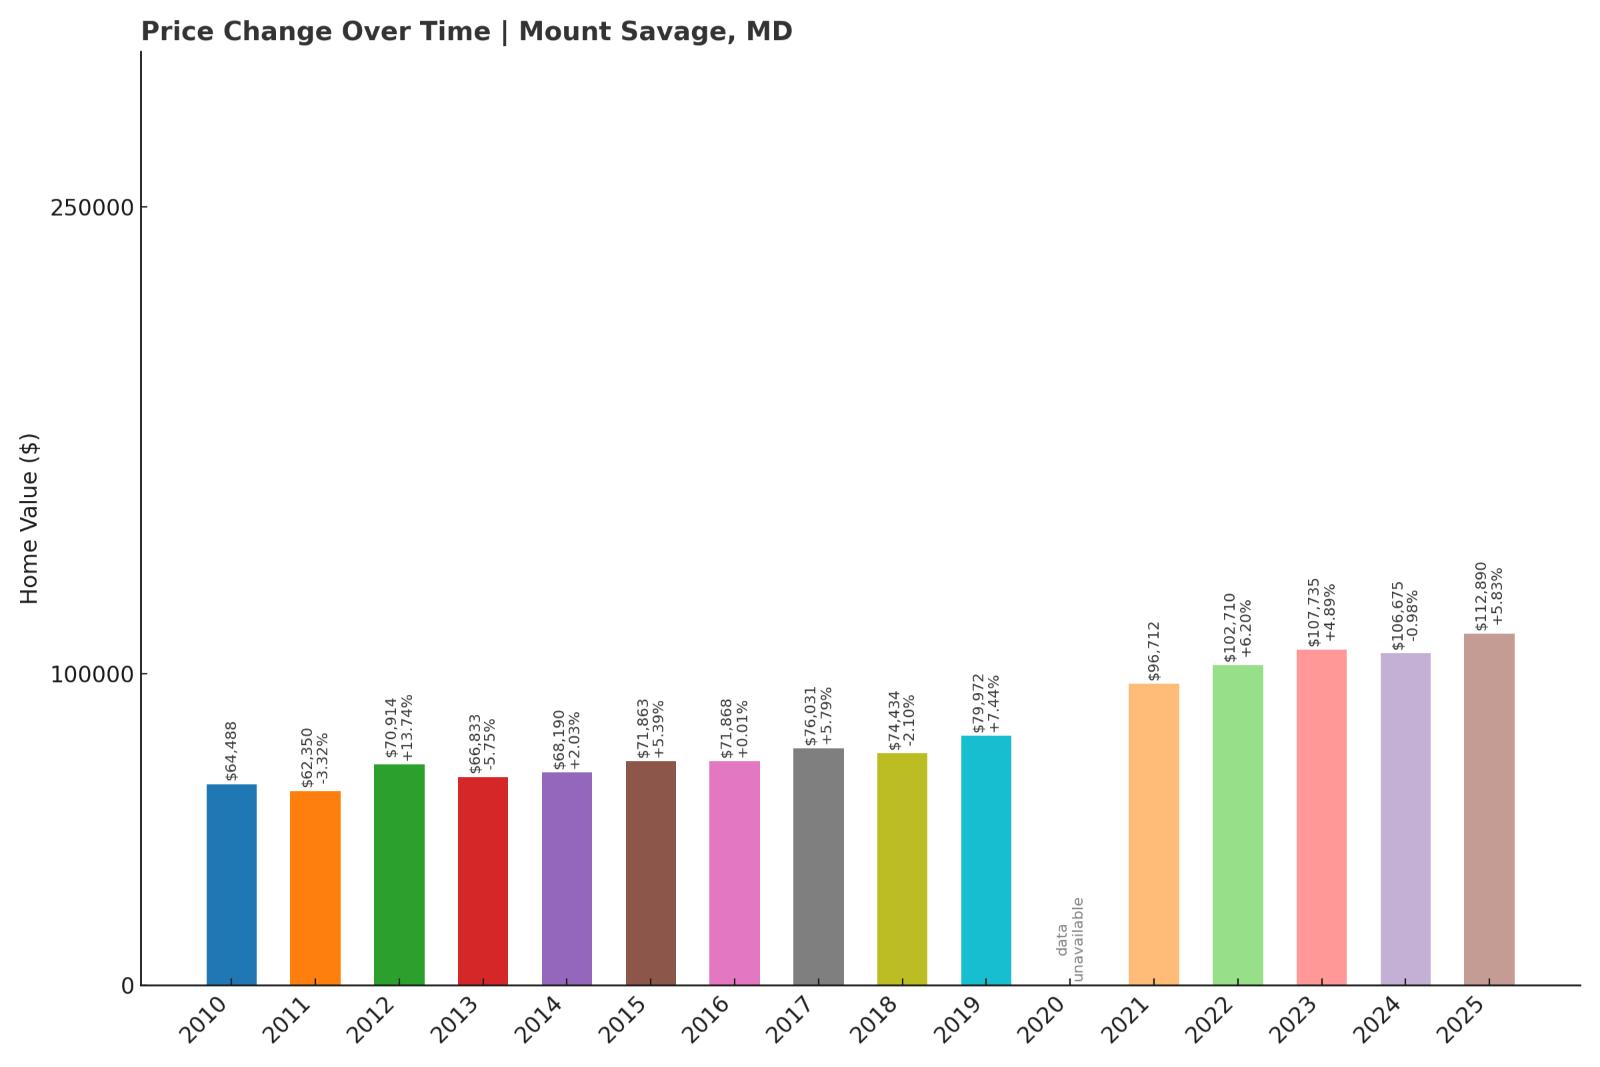
- 2010: $64,488
- 2011: $62,350 (-$2,138, -3.32% from previous year)
- 2012: $70,914 (+$8,564, +13.74% from previous year)
- 2013: $66,833 (-$4,081, -5.75% from previous year)
- 2014: $68,190 (+$1,357, +2.03% from previous year)
- 2015: $71,863 (+$3,673, +5.39% from previous year)
- 2016: $71,868 (+$5, +0.01% from previous year)
- 2017: $76,031 (+$4,162, +5.79% from previous year)
- 2018: $74,434 (-$1,597, -2.10% from previous year)
- 2019: $79,972 (+$5,538, +7.44% from previous year)
- 2020: N/A
- 2021: $96,712
- 2022: $102,710 (+$5,998, +6.20% from previous year)
- 2023: $107,735 (+$5,025, +4.89% from previous year)
- 2024: $106,675 (-$1,059, -0.98% from previous year)
- 2025: $112,890 (+$6,214, +5.83% from previous year)
Mount Savage home prices have grown from just over $64,000 in 2010 to nearly $113,000 in 2025—a 75% increase. There have been a few minor setbacks along the way, but the overall trend has been upward, especially since 2021.
Mount Savage – Historic Infrastructure, Affordable Housing

Mount Savage is a historic community once known for its ironworks and railroad infrastructure. These days, it’s a quiet town with a low cost of living and scenic Appalachian views. Its housing market remains accessible, with slow but steady appreciation.
The town’s charm and location attract buyers seeking a more relaxed pace and low prices. Continued modest growth in the 2020s suggests it’s a consistent option for affordable ownership in Maryland’s western region.
6. Barton – 64.42% Home Price Increase Since 2018

- 2010: N/A
- 2011: N/A
- 2012: N/A
- 2013: N/A
- 2014: N/A
- 2015: N/A
- 2016: N/A
- 2017: N/A
- 2018: $66,528
- 2019: $71,745 (+$5,216, +7.84% from previous year)
- 2020: N/A
- 2021: $87,392
- 2022: $95,729 (+$8,336, +9.54% from previous year)
- 2023: $96,675 (+$947, +0.99% from previous year)
- 2024: $105,667 (+$8,991, +9.30% from previous year)
- 2025: $109,361 (+$3,694, +3.50% from previous year)
Since 2018, Barton has seen a sharp 64% increase in typical home values, climbing from under $67,000 to over $109,000 in 2025. With consistent year-over-year gains, especially between 2021 and 2024, Barton is one of the stronger growth stories among Maryland’s most affordable towns.
Barton – Steady Growth in a Small Mining Town

Located in the heart of the Georges Creek Valley, Barton’s history is rooted in coal mining and working-class resilience. Today, it’s a quiet town where affordability and modest growth coexist. The market isn’t large, but it’s shown healthy signs of appreciation over the past several years.
Buyers are drawn to Barton for its affordable entry point and access to nearby recreation and job centers in western Maryland. Though small, the town’s steady performance offers long-term potential for homeowners seeking value.
5. Bloomington – -2.11% Home Price Decrease Since 2022

- 2010: N/A
- 2011: N/A
- 2012: N/A
- 2013: N/A
- 2014: N/A
- 2015: N/A
- 2016: N/A
- 2017: N/A
- 2018: N/A
- 2019: N/A
- 2020: N/A
- 2021: N/A
- 2022: $108,101
- 2023: $113,042 (+$4,941, +4.57% from previous year)
- 2024: $115,447 (+$2,405, +2.13% from previous year)
- 2025: $105,816 (-$9,632, -8.34% from previous year)
Bloomington is one of the few towns on this list where home values have declined slightly since 2022. After a brief rise in 2023 and 2024, values dropped sharply in 2025, leaving the town with a net loss of just over 2% over the three-year span.
Bloomington – A Market Correction in the Mountains

🔥 Would you like to save this?
Situated near the Savage River and the West Virginia border, Bloomington is a remote community that appeals to those looking for low-cost housing and natural beauty. While prices rose modestly for two years, the 2025 correction suggests that demand may have temporarily outpaced the area’s long-term appeal or inventory constraints eased.
Even with the recent dip, Bloomington remains one of Maryland’s least expensive housing markets, with opportunities for buyers comfortable with rural living and some volatility.
4. Toddville – -12.54% Home Price Decrease Since 2022

- 2010: N/A
- 2011: N/A
- 2012: N/A
- 2013: N/A
- 2014: N/A
- 2015: N/A
- 2016: N/A
- 2017: N/A
- 2018: N/A
- 2019: N/A
- 2020: N/A
- 2021: N/A
- 2022: $115,469
- 2023: $109,228 (-$6,241, -5.41% from previous year)
- 2024: $103,078 (-$6,150, -5.63% from previous year)
- 2025: $100,979 (-$2,098, -2.04% from previous year)
Toddville has seen home prices fall by more than 12% since 2022. After peaking at over $115,000, values have declined each year, settling at just under $101,000 in 2025. It’s the sharpest downturn among all towns on this list.
Toddville – Shrinking Prices in a Shrinking Community

Toddville is a remote, low-lying community in Dorchester County facing both geographic and economic challenges. With limited development and growing climate concerns, the drop in home values may reflect a lack of demand or future risk.
Despite this, it remains a strikingly affordable location for buyers comfortable with isolation and uncertain long-term trends. The market may stabilize in the coming years if new interest in rural waterfront living resumes, but for now, prices remain in decline.
3. Ewell – 1.55% Home Price Increase Since 2022

- 2010: N/A
- 2011: N/A
- 2012: N/A
- 2013: N/A
- 2014: N/A
- 2015: N/A
- 2016: N/A
- 2017: N/A
- 2018: N/A
- 2019: N/A
- 2020: N/A
- 2021: N/A
- 2022: $94,899
- 2023: $89,468 (-$5,431, -5.72% from previous year)
- 2024: $104,721 (+$15,254, +17.05% from previous year)
- 2025: $96,369 (-$8,352, -7.98% from previous year)
Home values in Ewell have barely risen since 2022, with a net gain of just 1.5%. After a big jump in 2024, the market corrected in 2025, erasing most of those gains. The volatility reflects Ewell’s small size and seasonal nature.
Ewell – One of Maryland’s Most Remote Housing Markets

Ewell is located on Smith Island in the Chesapeake Bay, accessible only by boat. Its isolation means limited housing stock, few sales, and big year-to-year swings in pricing. For those seeking solitude and affordability, it offers both in abundance.
While the housing market is hard to predict here, it’s extremely budget-friendly. The town’s price shifts say more about inventory fluctuations than changing demand, and values will likely remain low unless access or amenities improve significantly.
2. Westernport – 84.18% Home Price Increase Since 2010

- 2010: $46,735
- 2011: $44,731 (-$2,005, -4.29% from previous year)
- 2012: $59,747 (+$15,016, +33.57% from previous year)
- 2013: $56,914 (-$2,833, -4.74% from previous year)
- 2014: $61,447 (+$4,533, +7.97% from previous year)
- 2015: $61,845 (+$398, +0.65% from previous year)
- 2016: $60,756 (-$1,089, -1.76% from previous year)
- 2017: $63,747 (+$2,991, +4.92% from previous year)
- 2018: $66,652 (+$2,904, +4.56% from previous year)
- 2019: $73,663 (+$7,011, +10.52% from previous year)
- 2020: N/A
- 2021: $81,672
- 2022: $86,986 (+$5,315, +6.51% from previous year)
- 2023: $85,458 (-$1,528, -1.76% from previous year)
- 2024: $90,839 (+$5,381, +6.30% from previous year)
- 2025: $86,115 (-$4,725, -5.20% from previous year)
Westernport home values have risen over 84% since 2010, starting below $47,000 and ending at just over $86,000 in 2025. Prices have swung up and down, with a sharp gain in 2012 and smaller rises more recently offset by dips in 2023 and 2025.
Westernport – Maryland’s Bargain Entry Point

Located along the North Branch Potomac River, Westernport offers some of the cheapest real estate in the entire state. Despite challenges with population loss and limited economic growth, the town’s housing market has doubled in value over 15 years.
For buyers on a tight budget, Westernport represents the lowest-cost entry into Maryland homeownership. It’s ideal for locals, investors, or retirees seeking a small-town atmosphere and access to outdoor spaces at a fraction of statewide prices.
1. Kitzmiller – -6.57% Home Price Decrease Since 2022

- 2010: N/A
- 2011: N/A
- 2012: N/A
- 2013: N/A
- 2014: N/A
- 2015: N/A
- 2016: N/A
- 2017: N/A
- 2018: N/A
- 2019: N/A
- 2020: N/A
- 2021: N/A
- 2022: $84,434
- 2023: $76,728 (-$7,705, -9.13% from previous year)
- 2024: $83,155 (+$6,426, +8.38% from previous year)
- 2025: $78,885 (-$4,270, -5.13% from previous year)
Kitzmiller is the most affordable town in Maryland, with a typical home value of just $78,885 in 2025. Prices have fluctuated since 2022 and are currently down more than 6.5% from that peak year.
Kitzmiller – Maryland’s Least Expensive Housing Market

Famartin, CC BY-SA 4.0, via Wikimedia Commons
This tiny town in Garrett County near the West Virginia line is home to fewer than 300 residents. Kitzmiller is defined by its isolation, affordability, and Appalachian scenery. It has the lowest typical home price in the entire state, reflecting limited demand and a small housing market.
The fluctuations in home values are likely due to the small number of transactions in a market this size. While not a growth engine, Kitzmiller offers unbeatable prices for buyers seeking peace, space, and a back-to-basics lifestyle in rural Maryland.