🔥 Would you like to save this?
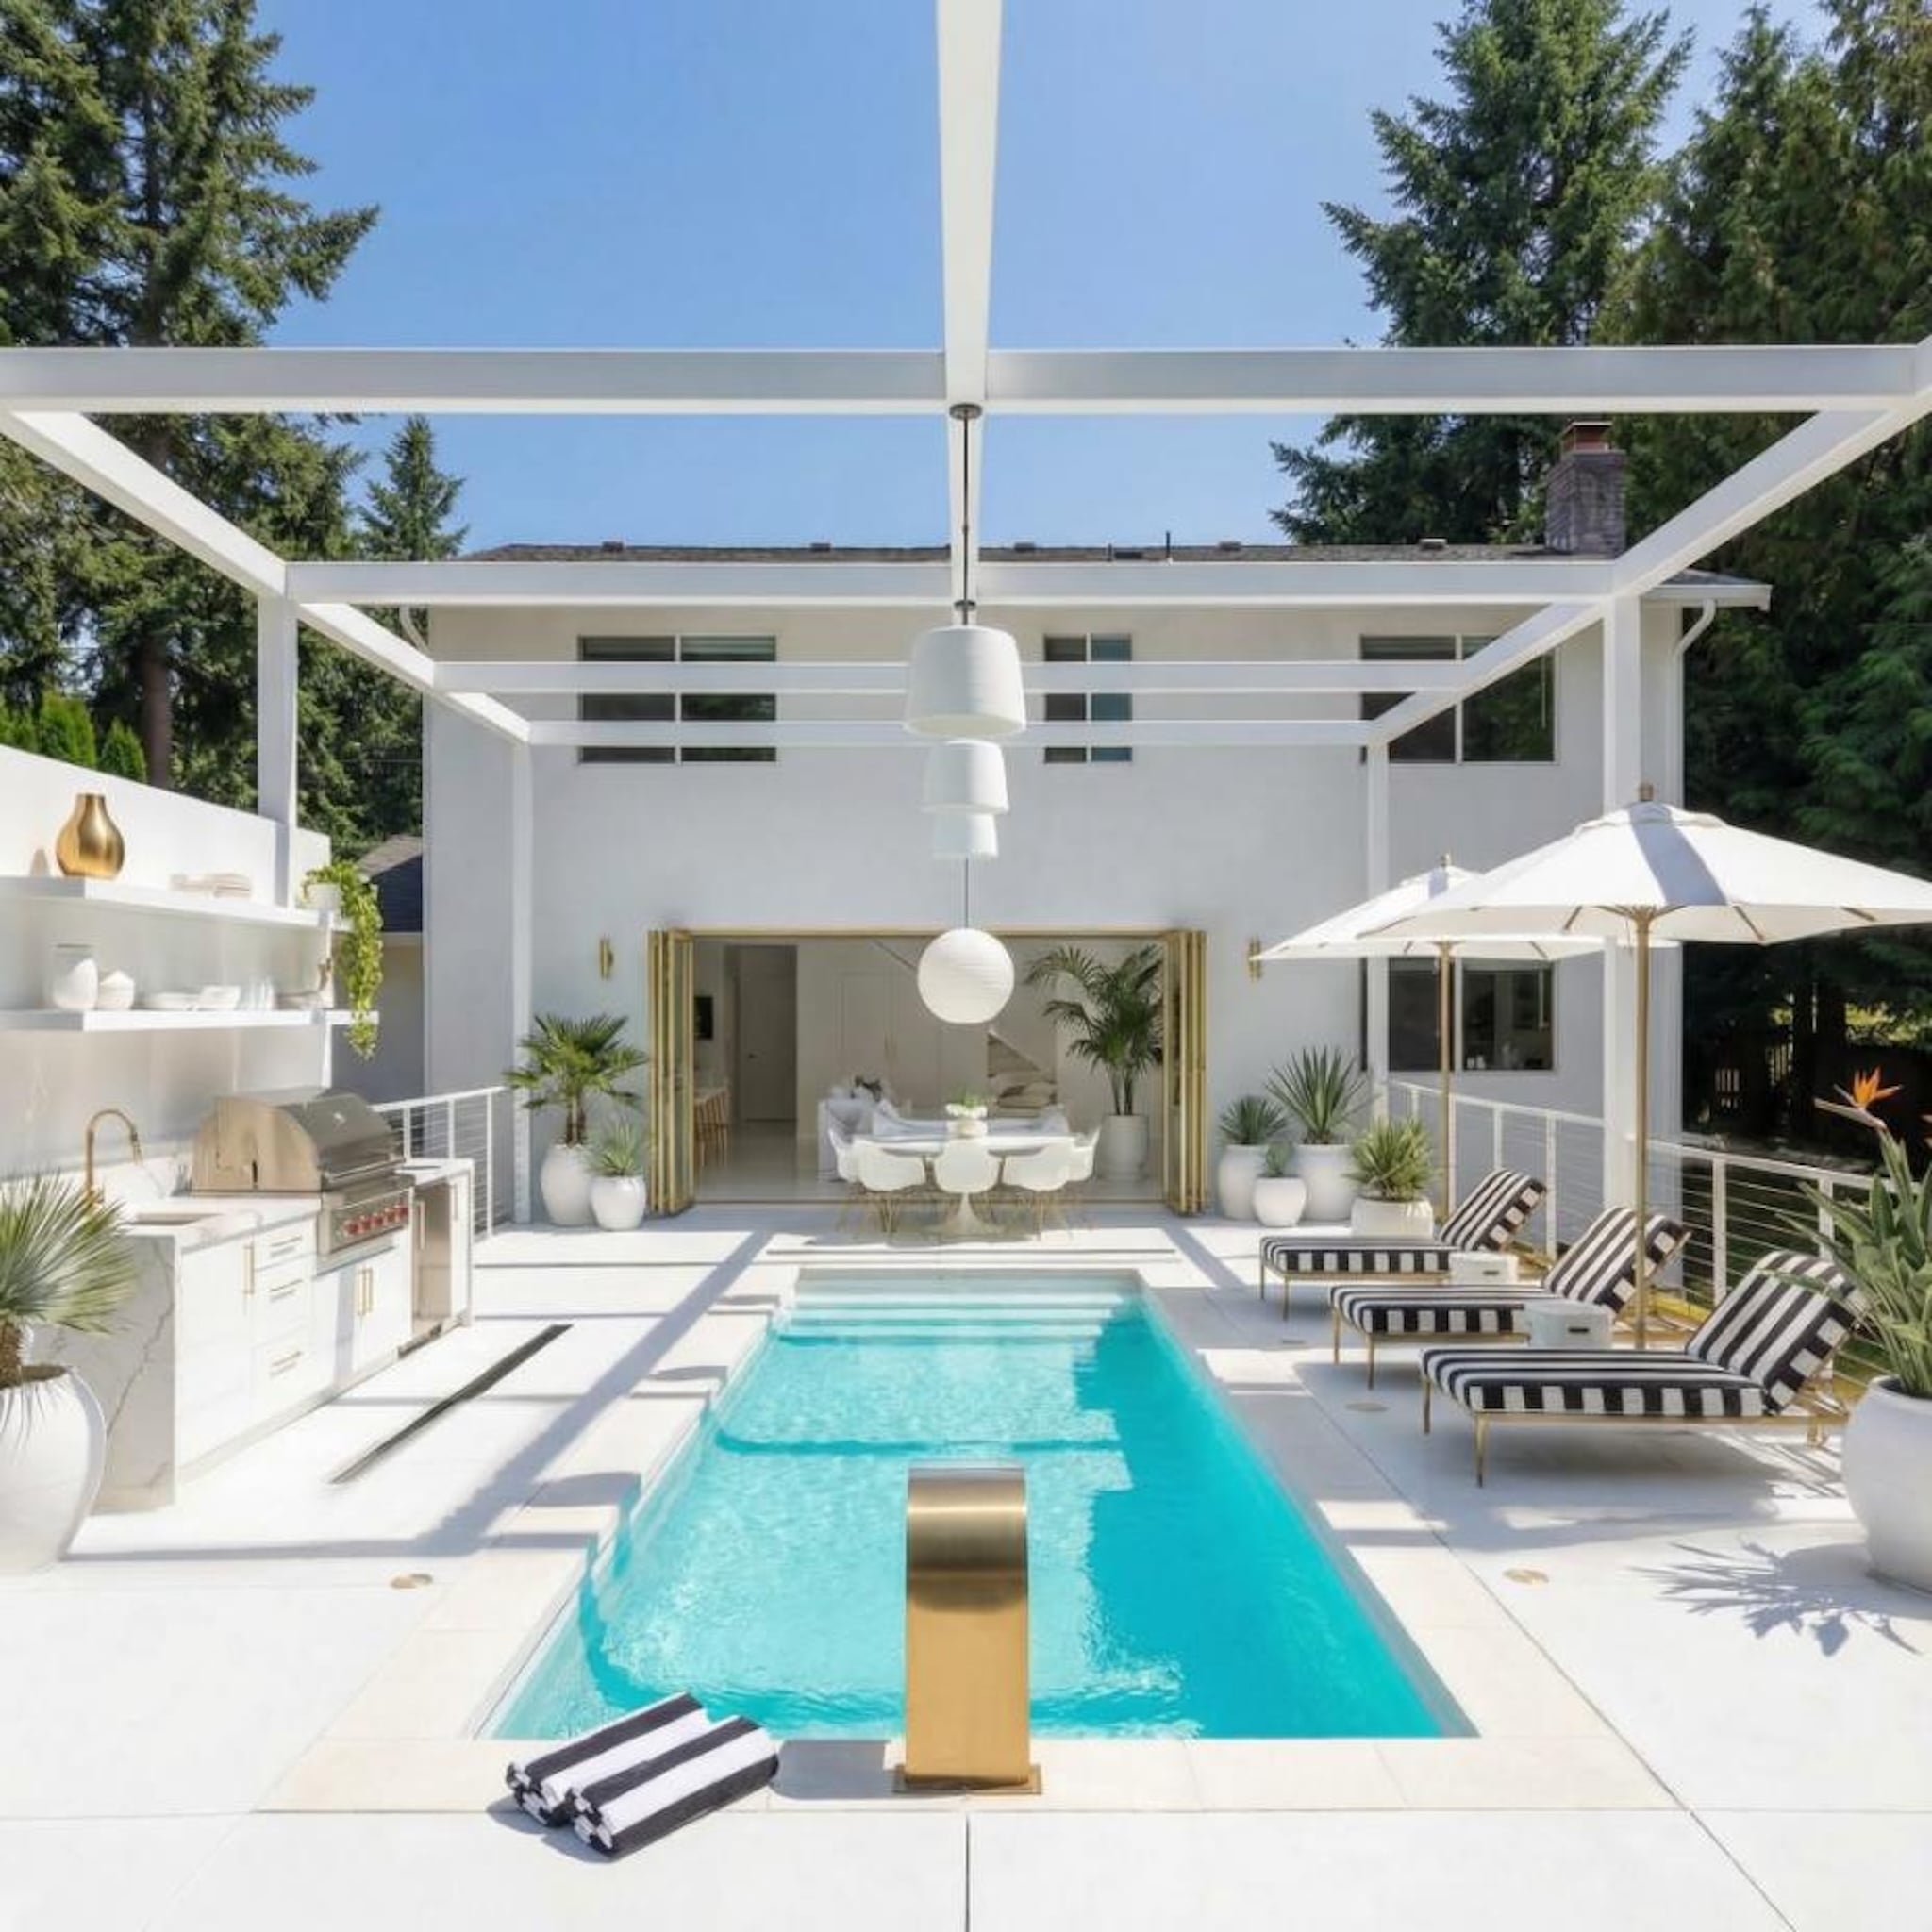
Cities with the most expensive homes in Washington
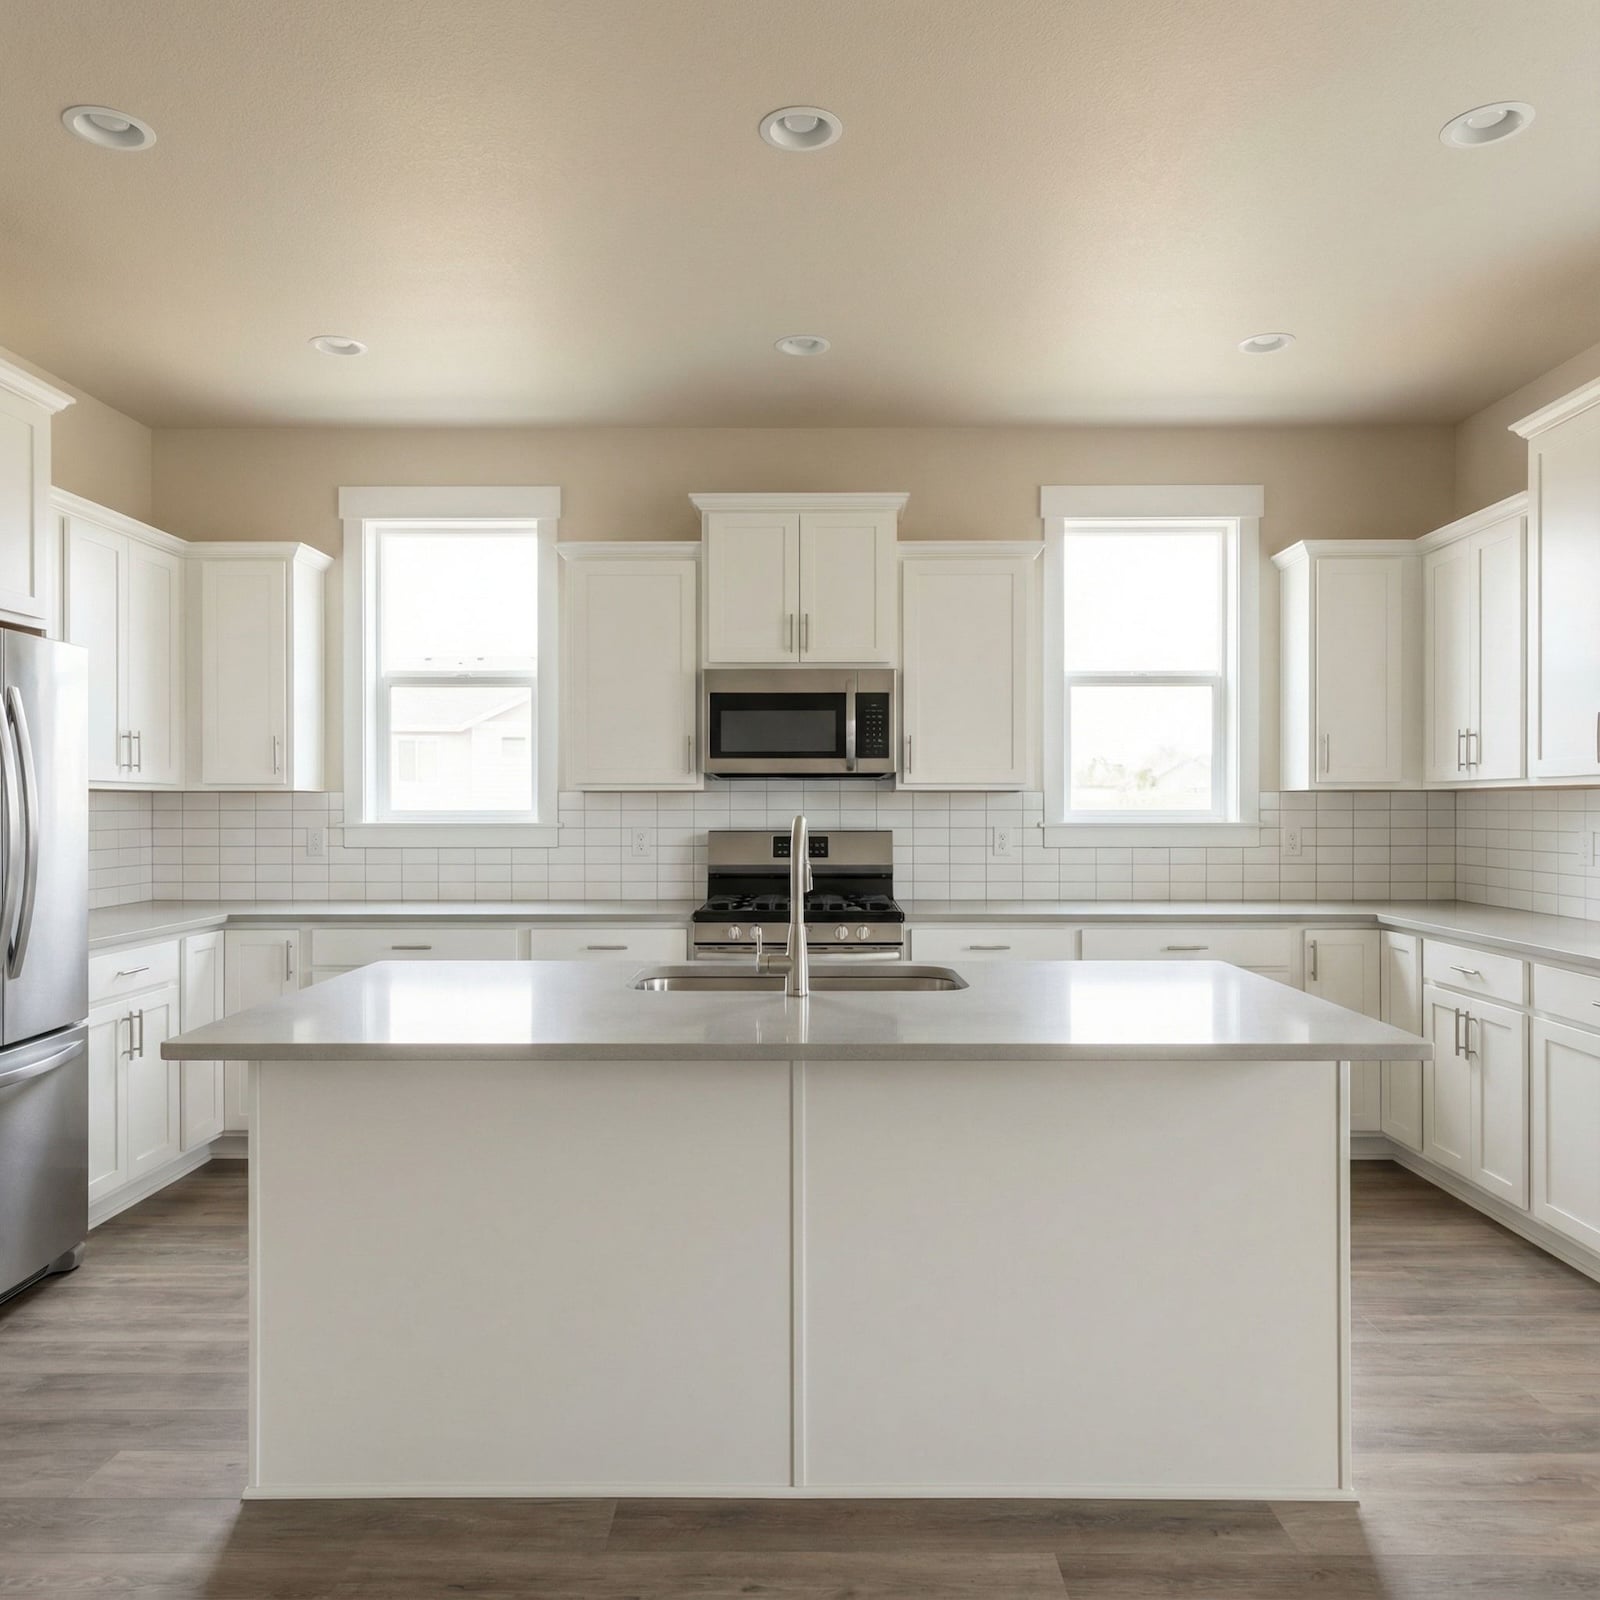
Purchasing a home is one of the most important investments there is. More than a place to live, homeownership is an asset with the potential to tremendously rise in value. But with home prices reaching record heights, affordability plays a huge role for buyers.
The typical home value in the United States was $358,761 in November, 2.3% higher than the year before.
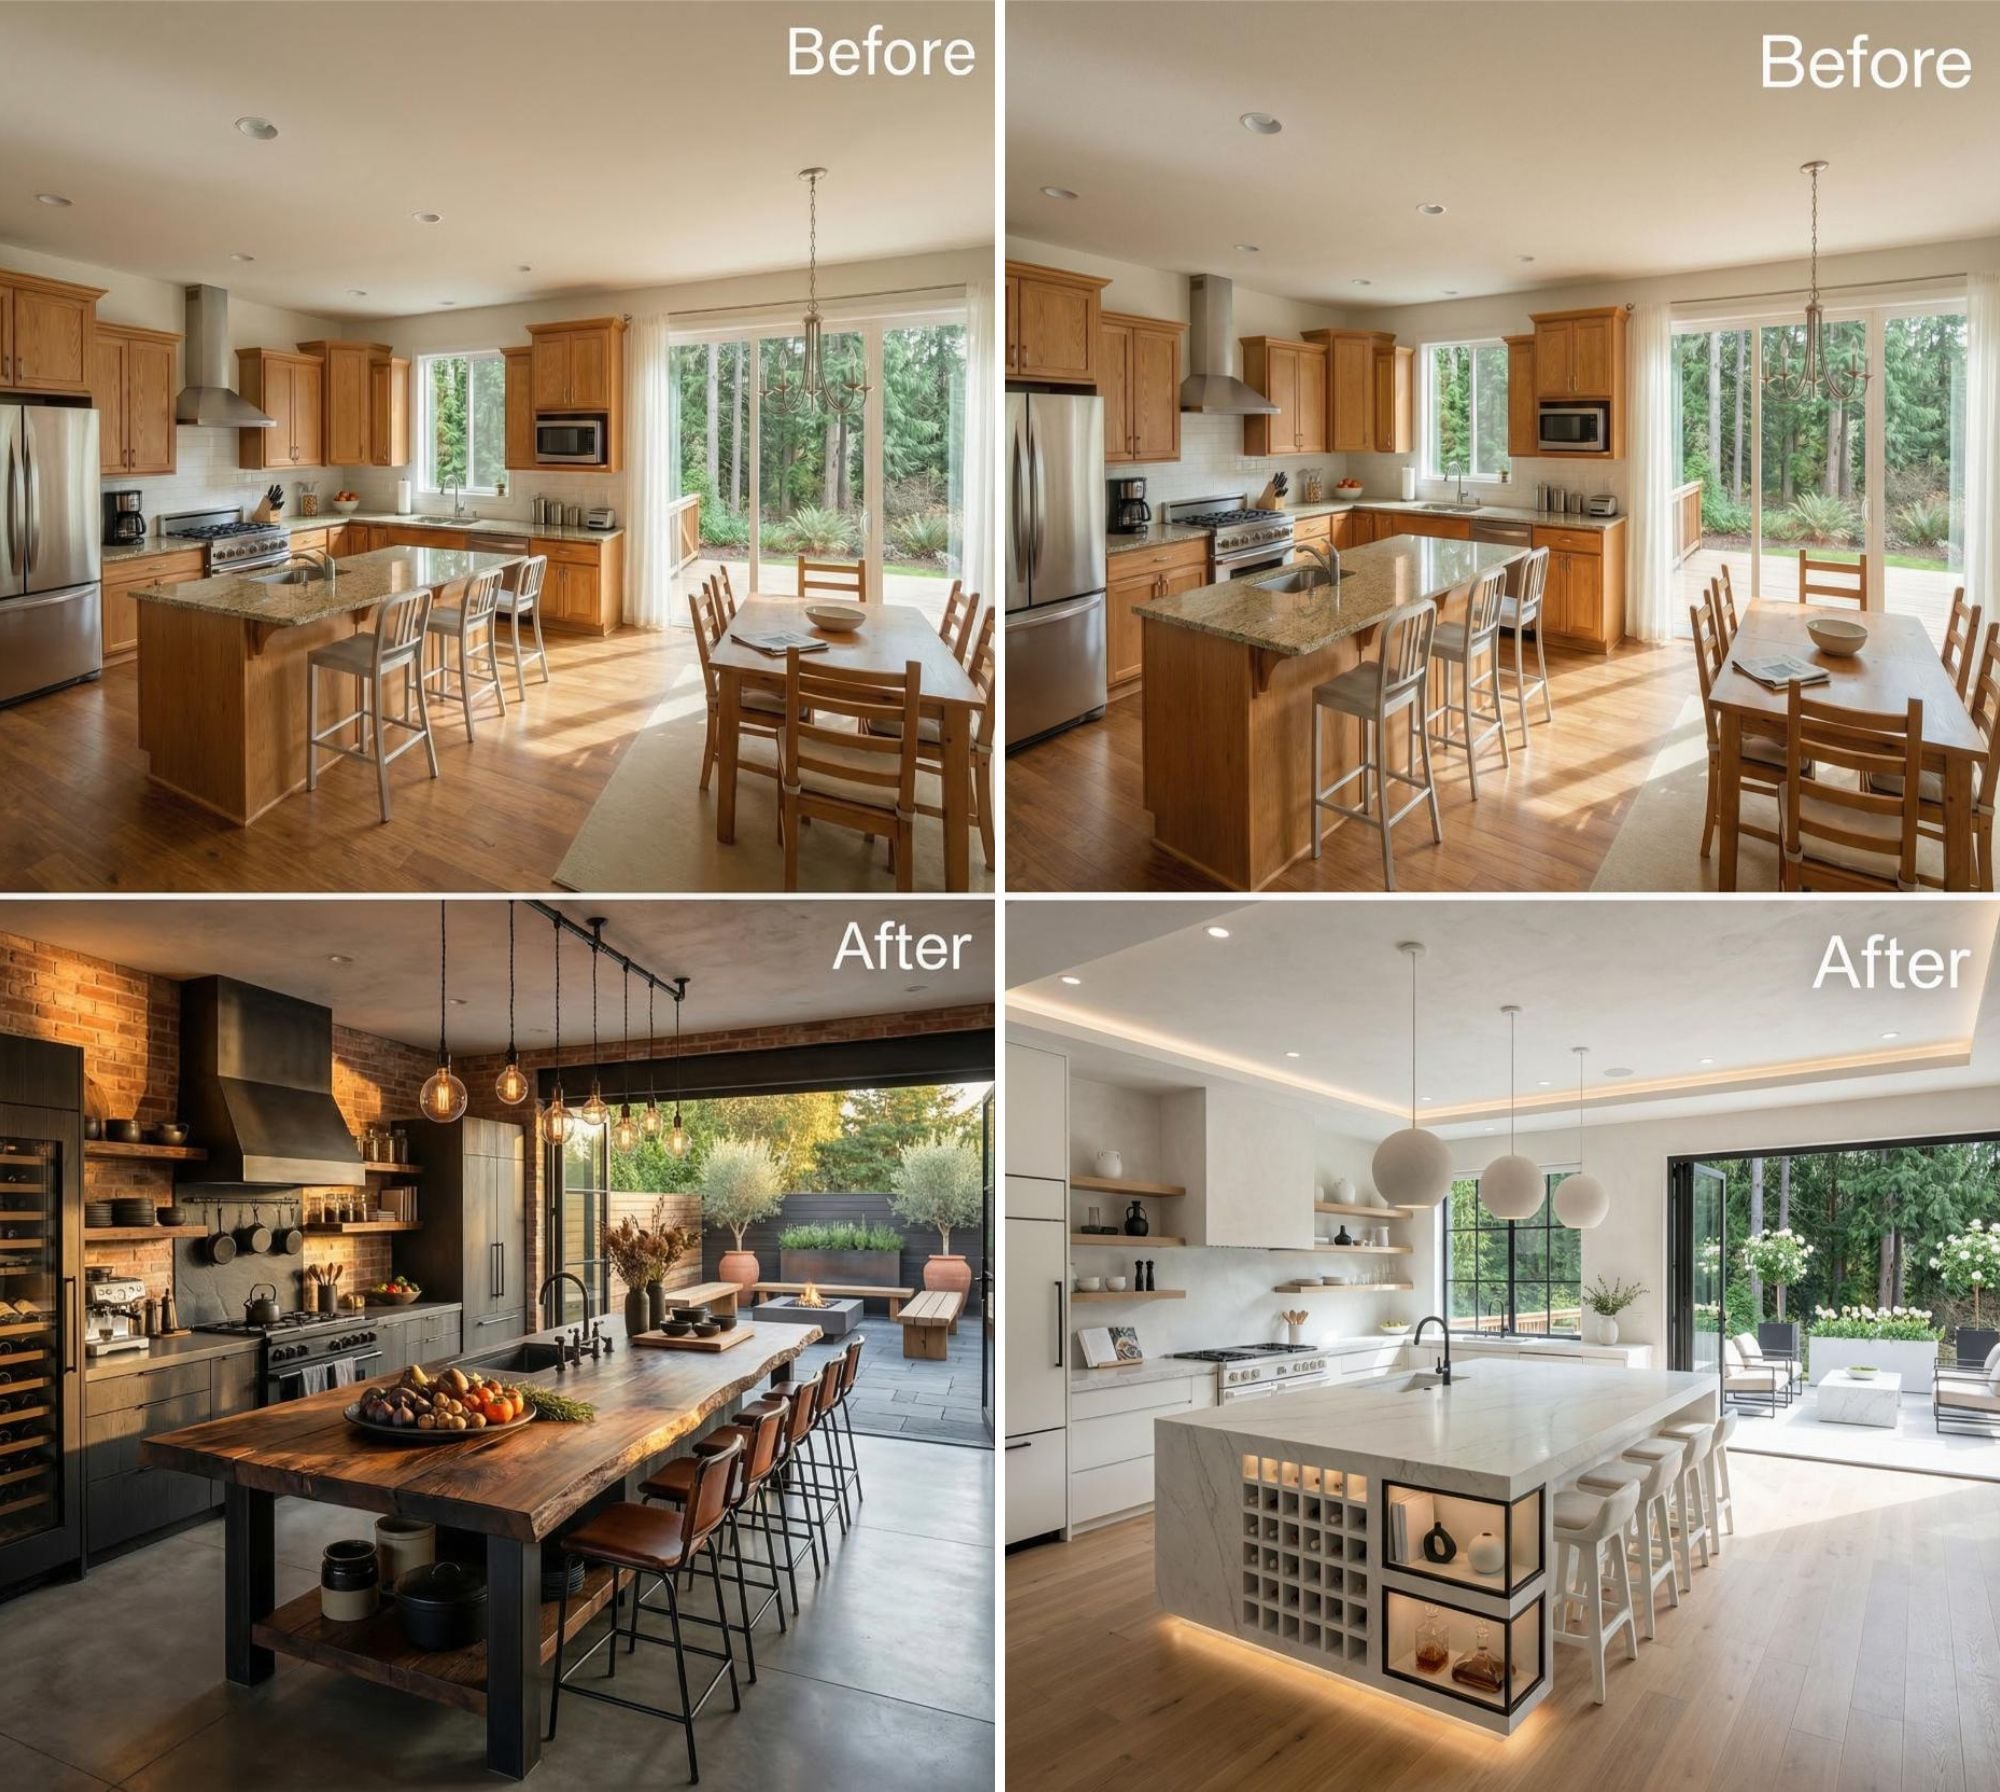
In order to come up with the very specific design ideas, we create most designs with the assistance of state-of-the-art AI interior design software.
High mortgage rates are also making monthly payments more expensive; as of December 19, the 30-year fixed mortgage rate sits at 6.72%.
Although home prices have inflated all across the U.S., there are some cities that command a higher price tag than others. Location, size, age, and condition are all contributing factors to home value.
Stacker compiled a list of cities with the most expensive homes in Washington using data from Zillow. Cities are ranked by the Zillow Home Values Index for all homes as of November 2024. The charts in this story were created automatically using Matplotlib.
Metros with the most cities in the top 30 in Washington
#1. Seattle-Tacoma-Bellevue, WA: 28
#2. Bremerton-Silverdale-Port Orchard, WA: 1
You may also like: Average student loan debt increased in first half of 2024 in Washington
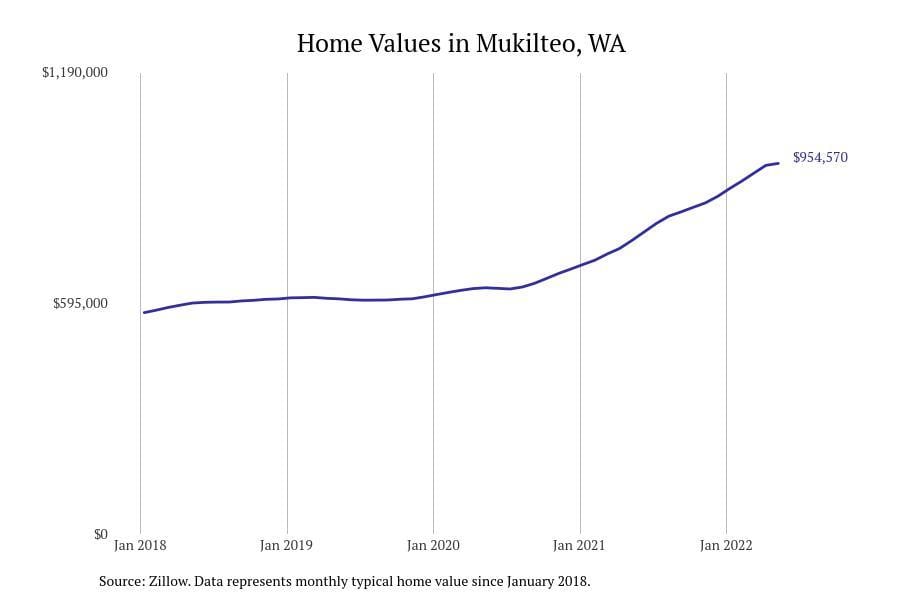
#30. Mukilteo
– Typical home value: $909,349
– 1-year price change: +5.8%
– 5-year price change: +58.7%
– Metro area: Seattle-Tacoma-Bellevue, WA
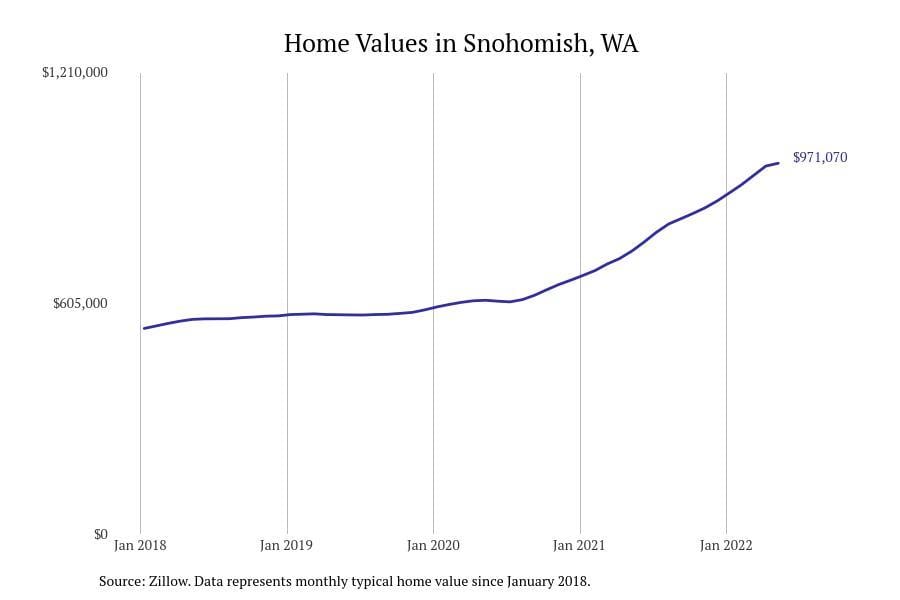
#29. Snohomish
– Typical home value: $922,493
– 1-year price change: +6.5%
– 5-year price change: +65.1%
– Metro area: Seattle-Tacoma-Bellevue, WA
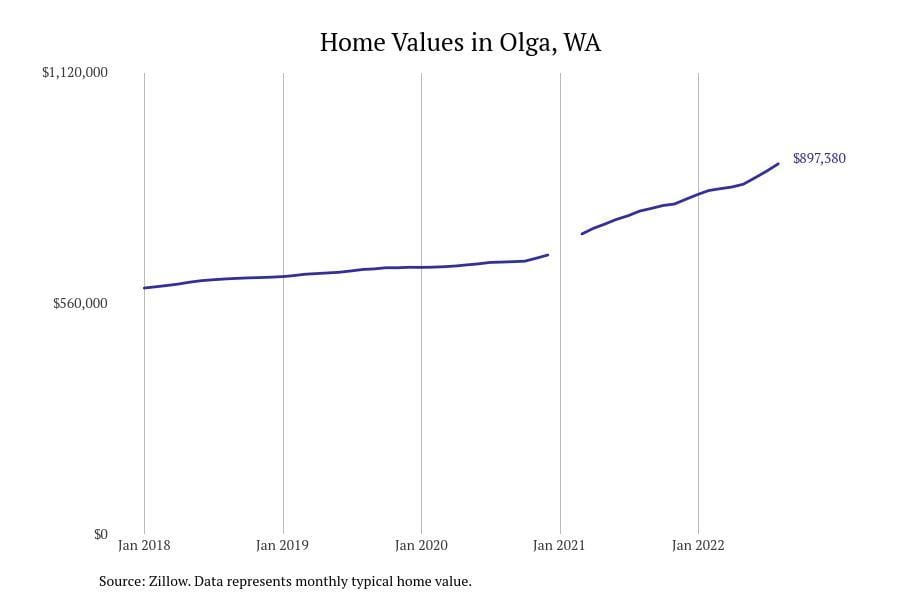
#28. Olga
– Typical home value: $932,789
– 1-year price change: -0.7%
– 5-year price change: +62.7%
– Metro area: not in a metro area
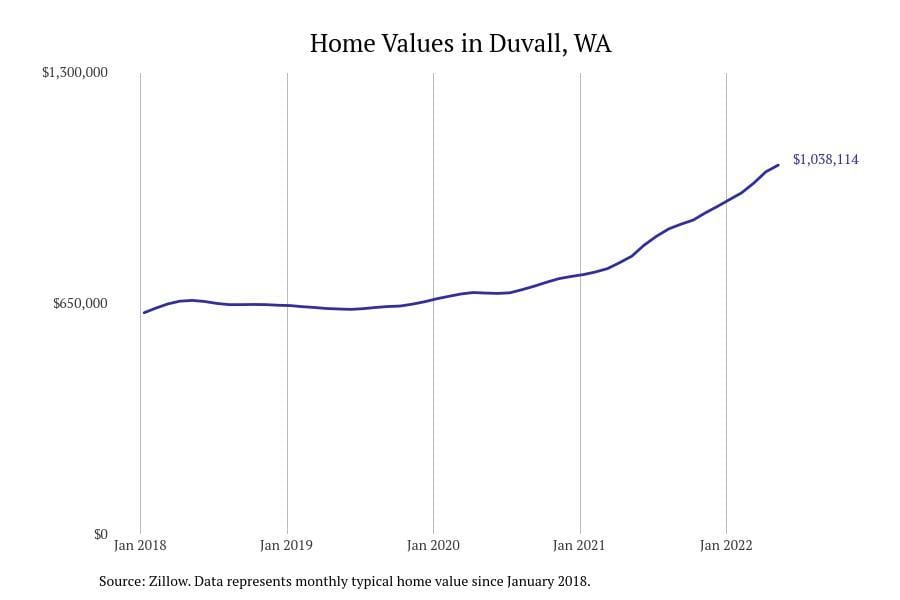
#27. Duvall
– Typical home value: $958,134
– 1-year price change: +5.9%
– 5-year price change: +60.8%
– Metro area: Seattle-Tacoma-Bellevue, WA
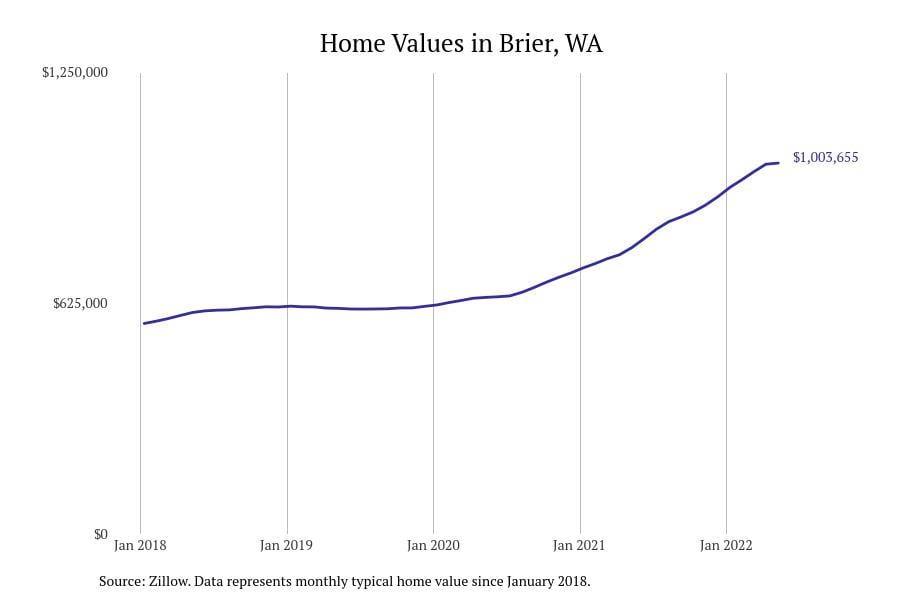
#26. Brier
– Typical home value: $969,039
– 1-year price change: +6.6%
– 5-year price change: +61.9%
– Metro area: Seattle-Tacoma-Bellevue, WA
You may also like: Counties with the highest STI rates in Washington
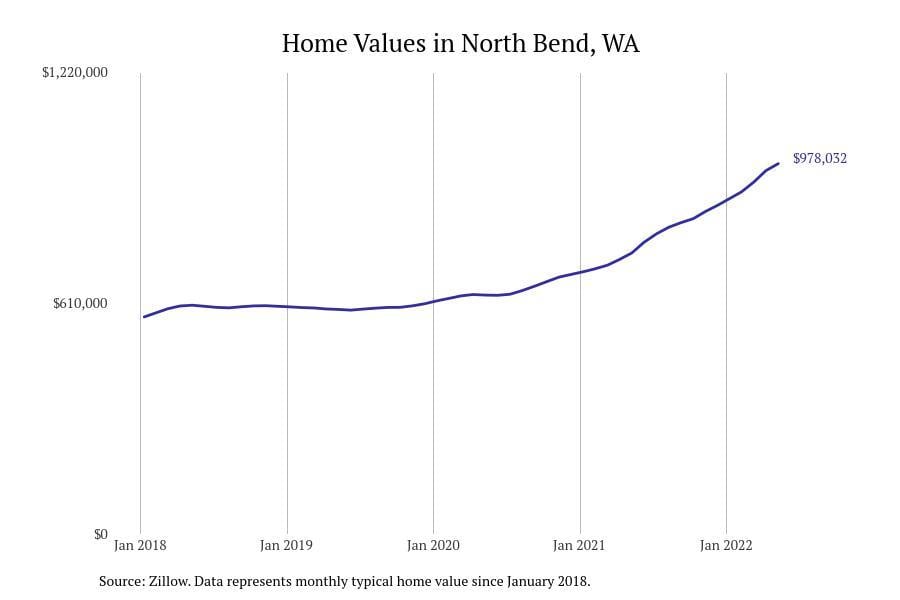
#25. North Bend
– Typical home value: $971,074
– 1-year price change: +6.9%
– 5-year price change: +63.5%
– Metro area: Seattle-Tacoma-Bellevue, WA
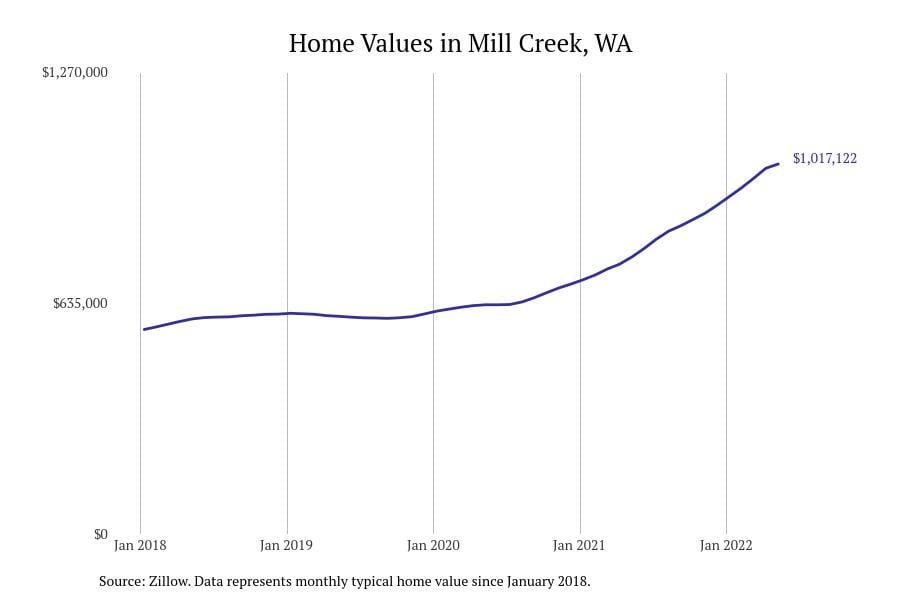
#24. Mill Creek
– Typical home value: $973,507
– 1-year price change: +7.2%
– 5-year price change: +71.6%
– Metro area: Seattle-Tacoma-Bellevue, WA
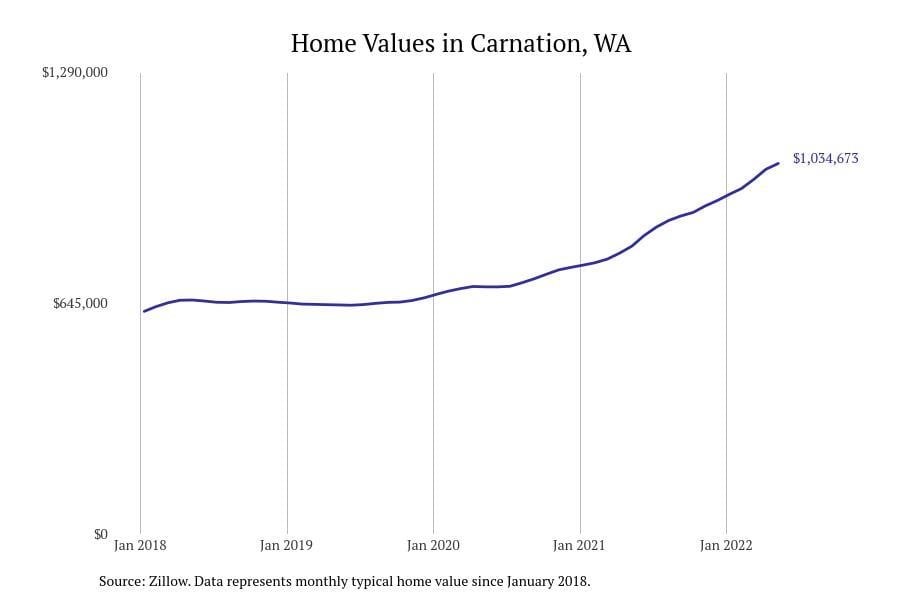
#23. Carnation
– Typical home value: $992,435
– 1-year price change: +6.6%
– 5-year price change: +59.6%
– Metro area: Seattle-Tacoma-Bellevue, WA
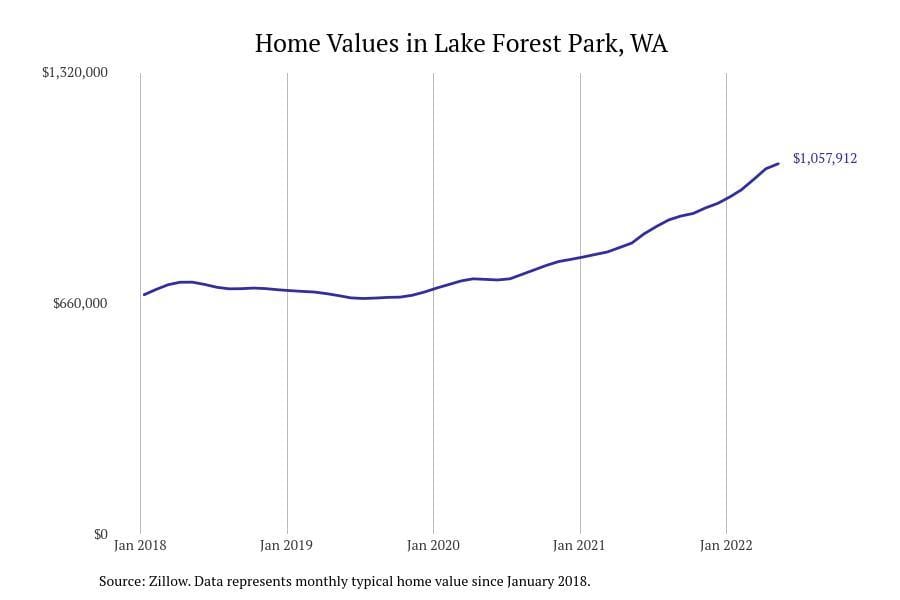
#22. Lake Forest Park
– Typical home value: $1,008,120
– 1-year price change: +6.6%
– 5-year price change: +53.1%
– Metro area: Seattle-Tacoma-Bellevue, WA
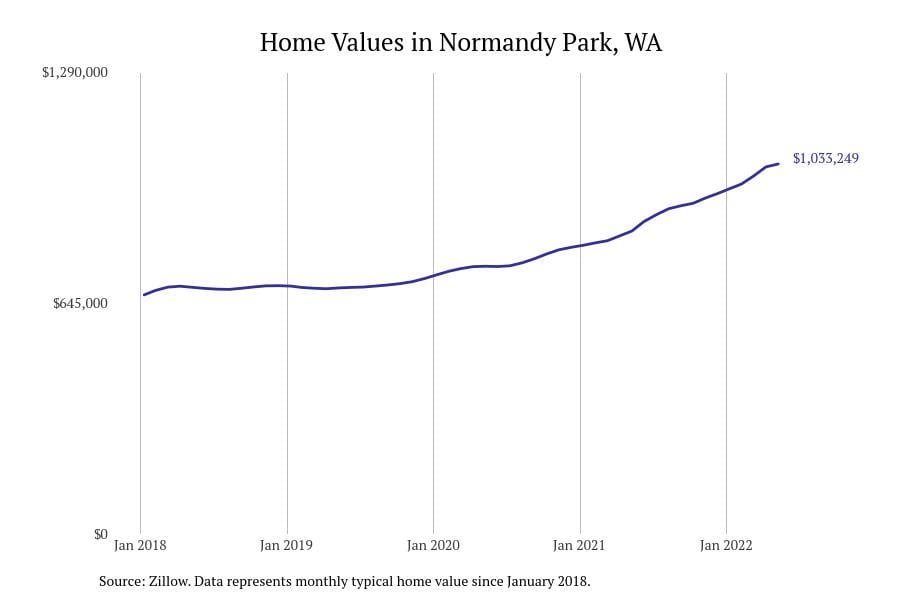
#21. Normandy Park
– Typical home value: $1,021,902
– 1-year price change: +7.4%
– 5-year price change: +55.4%
– Metro area: Seattle-Tacoma-Bellevue, WA
You may also like: Where are all these trucks headed? The top destinations for Washington freight.

#20. Kenmore
– Typical home value: $1,027,174
– 1-year price change: +8.8%
– 5-year price change: +65.1%
– Metro area: Seattle-Tacoma-Bellevue, WA
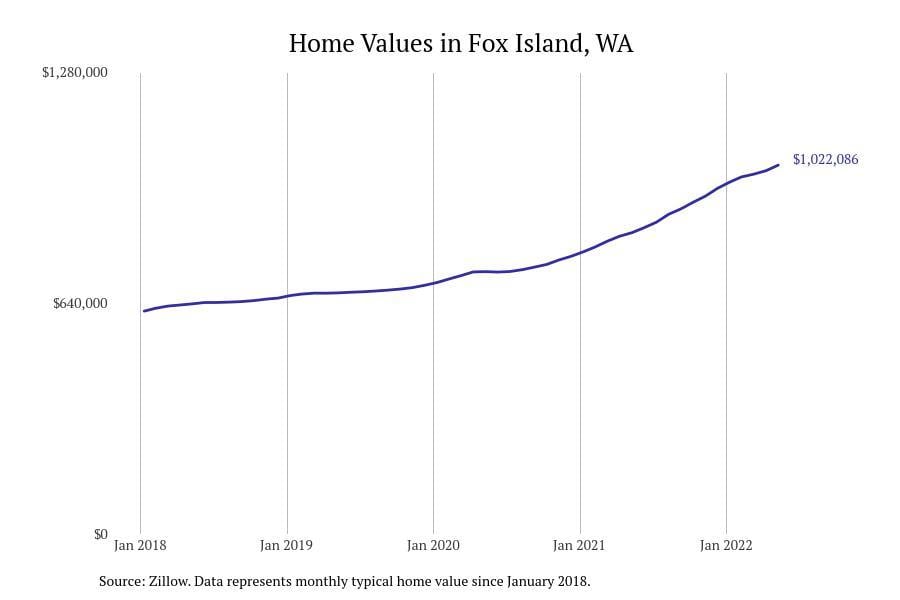
#19. Fox Island
– Typical home value: $1,041,821
– 1-year price change: +5.1%
– 5-year price change: +60.9%
– Metro area: Seattle-Tacoma-Bellevue, WA
🔥 Would you like to save this?
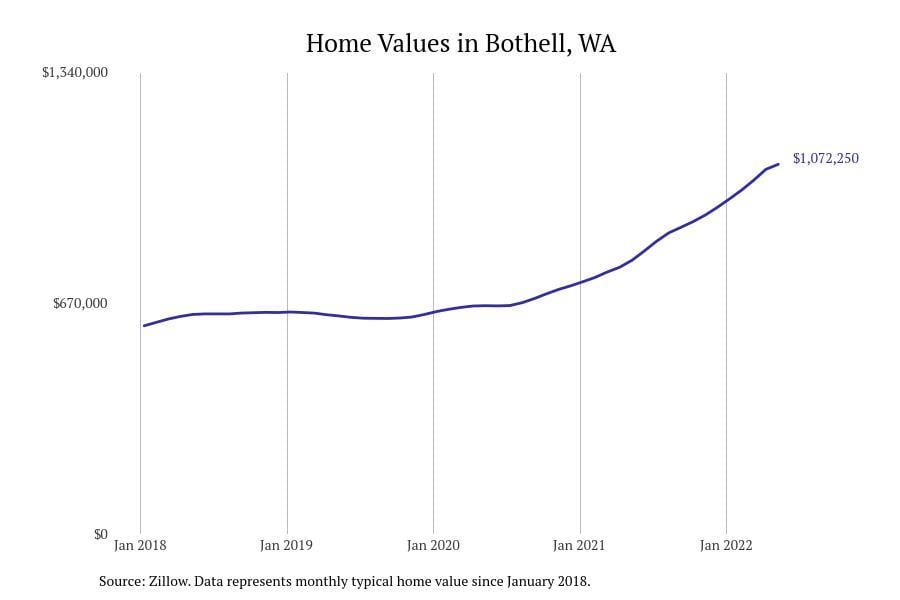
#18. Bothell
– Typical home value: $1,043,118
– 1-year price change: +9.2%
– 5-year price change: +71.2%
– Metro area: Seattle-Tacoma-Bellevue, WA

#17. Snoqualmie
– Typical home value: $1,067,869
– 1-year price change: +7.8%
– 5-year price change: +66.8%
– Metro area: Seattle-Tacoma-Bellevue, WA

#16. Issaquah
– Typical home value: $1,102,506
– 1-year price change: +6.3%
– 5-year price change: +58.5%
– Metro area: Seattle-Tacoma-Bellevue, WA
You may also like: Most common settings for foodborne outbreaks in Washington
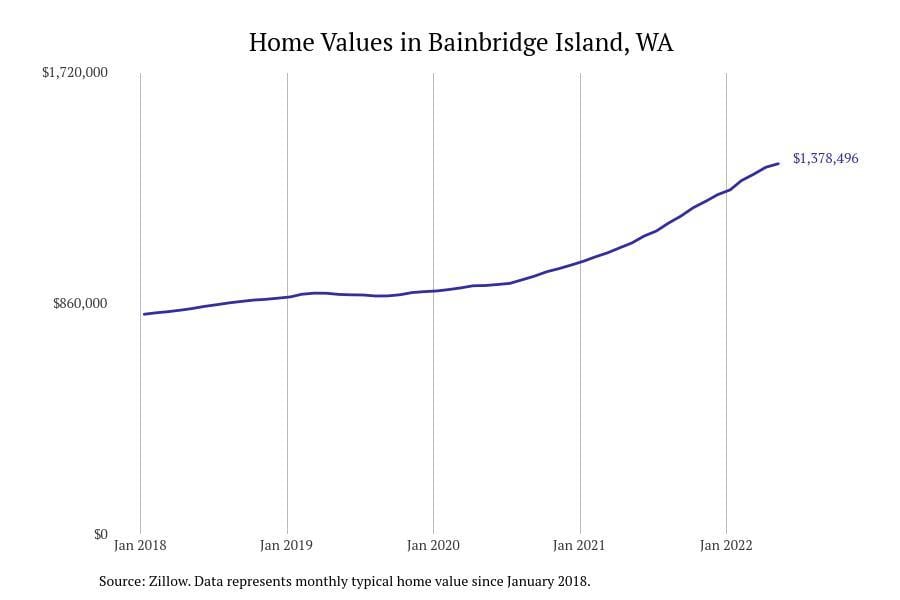
#15. Bainbridge Island
– Typical home value: $1,156,875
– 1-year price change: +2.5%
– 5-year price change: +47.2%
– Metro area: Bremerton-Silverdale-Port Orchard, WA
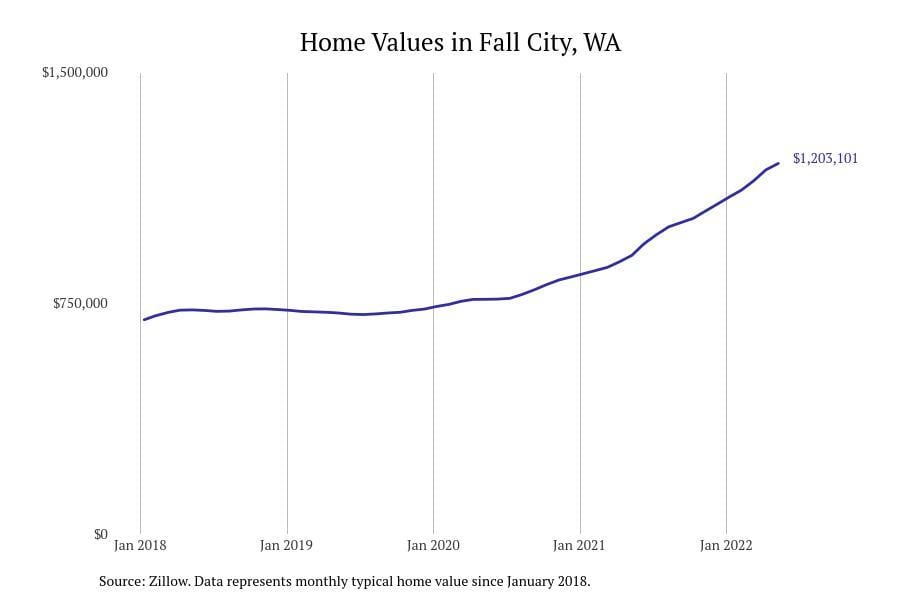
#14. Fall City
– Typical home value: $1,158,335
– 1-year price change: +6.6%
– 5-year price change: +62.6%
– Metro area: Seattle-Tacoma-Bellevue, WA

#13. Kirkland
– Typical home value: $1,226,048
– 1-year price change: +9.4%
– 5-year price change: +67.7%
– Metro area: Seattle-Tacoma-Bellevue, WA
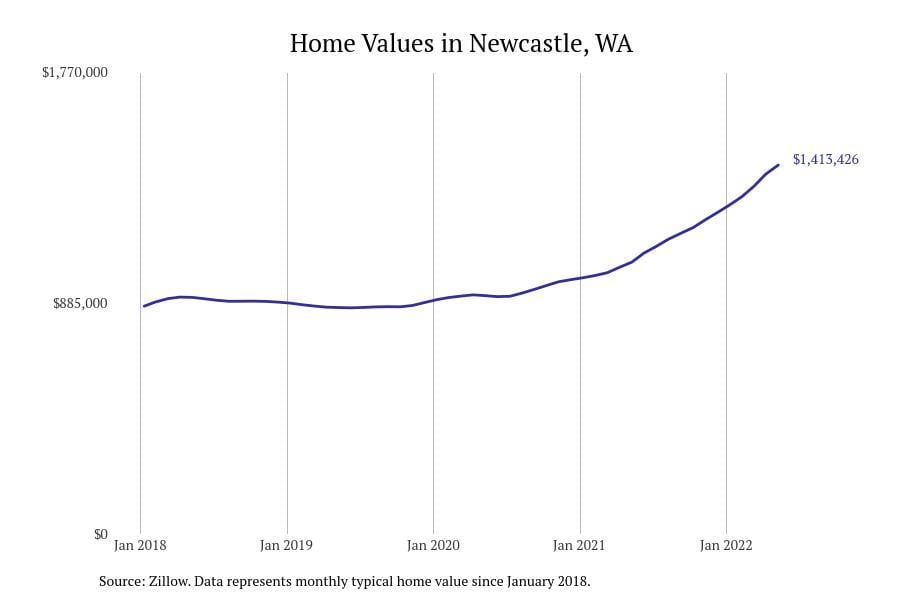
#12. Newcastle
– Typical home value: $1,300,124
– 1-year price change: +8.2%
– 5-year price change: +65.1%
– Metro area: Seattle-Tacoma-Bellevue, WA
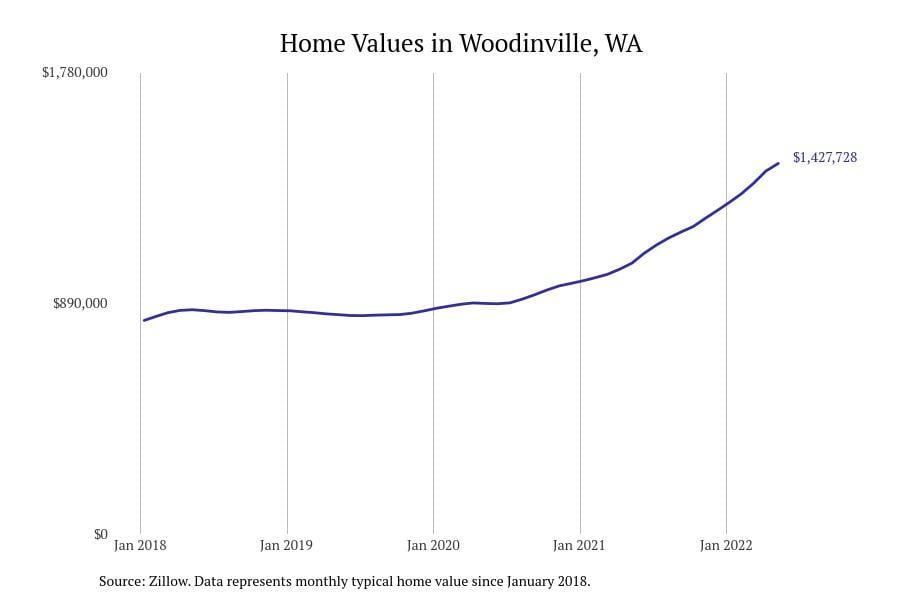
#11. Woodinville
– Typical home value: $1,323,086
– 1-year price change: +8.7%
– 5-year price change: +68.9%
– Metro area: Seattle-Tacoma-Bellevue, WA
You may also like: Highest-rated free things to do in Washington, according to Tripadvisor
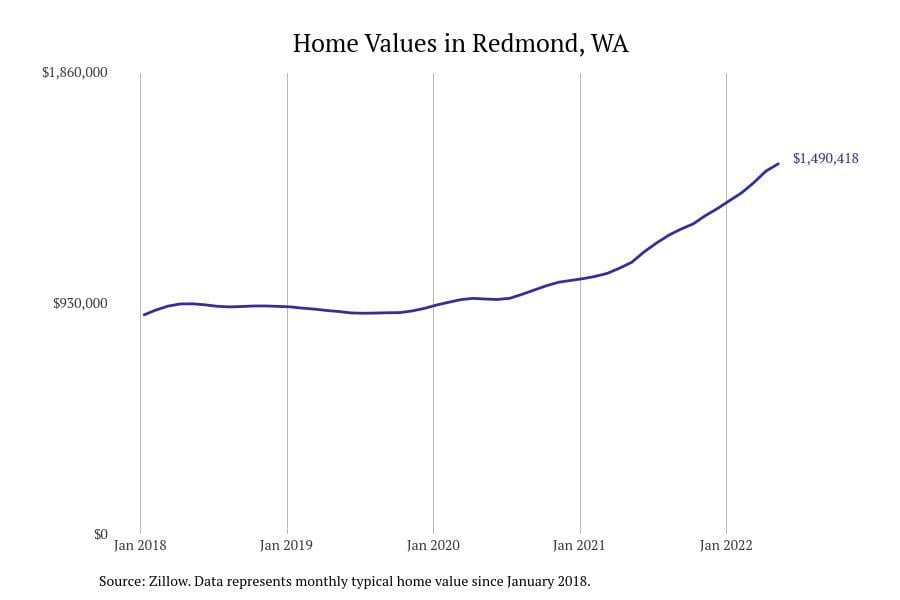
#10. Redmond
– Typical home value: $1,358,195
– 1-year price change: +9.5%
– 5-year price change: +69.7%
– Metro area: Seattle-Tacoma-Bellevue, WA
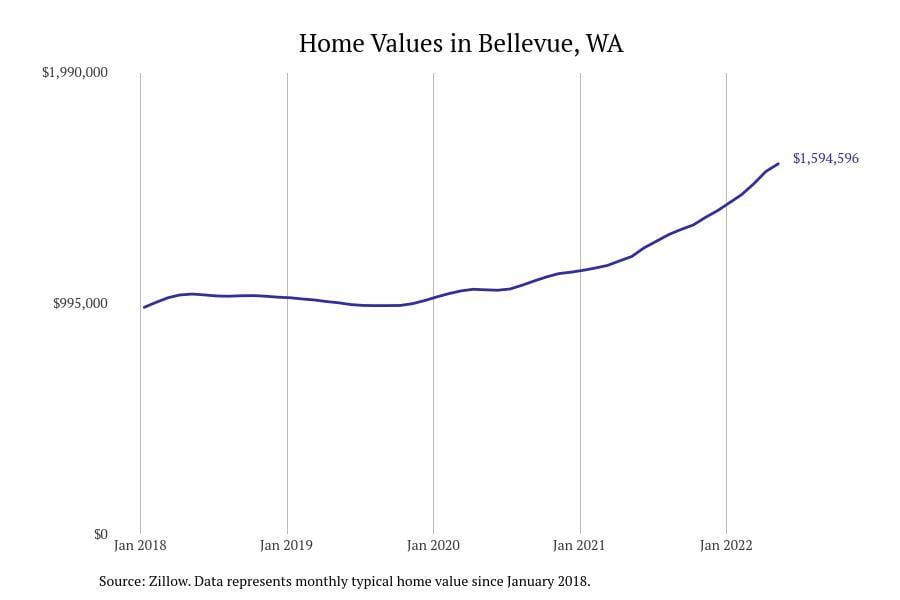
#9. Bellevue
– Typical home value: $1,446,915
– 1-year price change: +9.4%
– 5-year price change: +63.8%
– Metro area: Seattle-Tacoma-Bellevue, WA
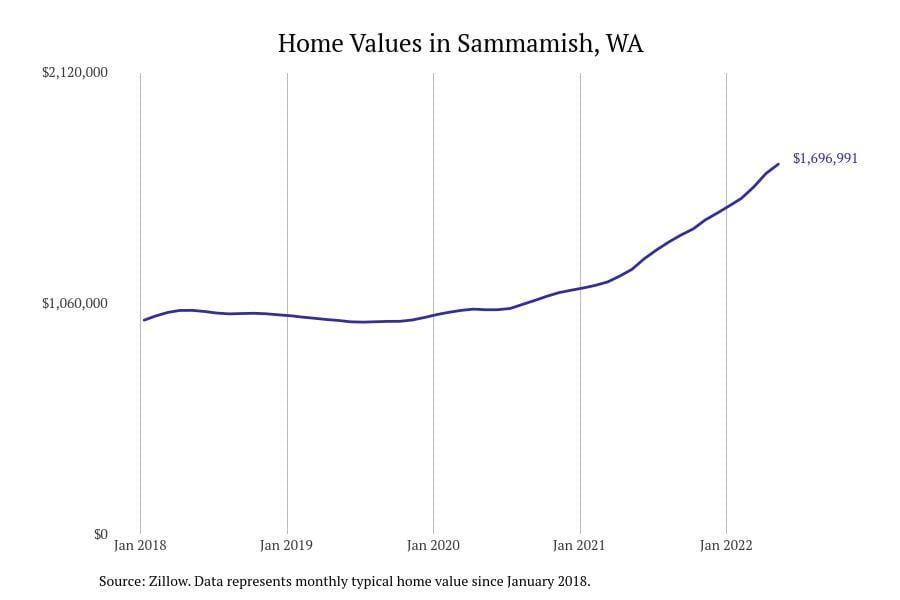
#8. Sammamish
– Typical home value: $1,593,450
– 1-year price change: +10.3%
– 5-year price change: +79.8%
– Metro area: Seattle-Tacoma-Bellevue, WA
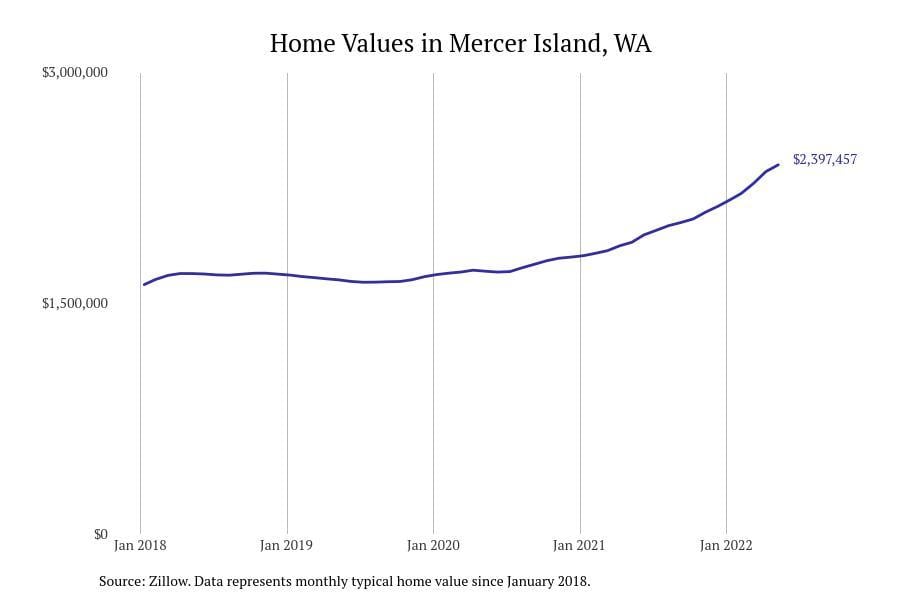
#7. Mercer Island
– Typical home value: $2,242,734
– 1-year price change: +7.8%
– 5-year price change: +56.3%
– Metro area: Seattle-Tacoma-Bellevue, WA
🔥 Would you like to save this?
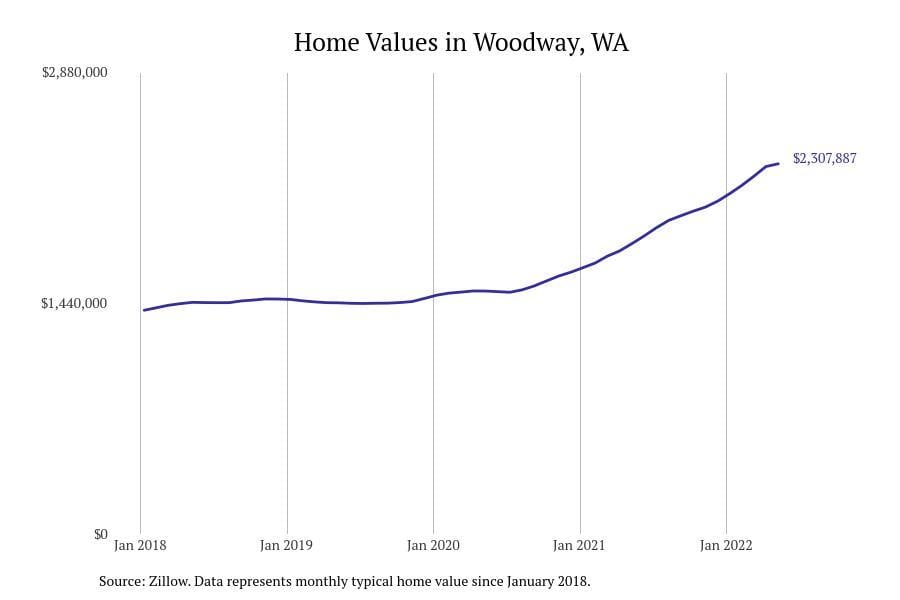
#6. Woodway
– Typical home value: $2,310,496
– 1-year price change: +7.5%
– 5-year price change: +66.7%
– Metro area: Seattle-Tacoma-Bellevue, WA
You may also like: Counties with the longest life expectancy in Washington
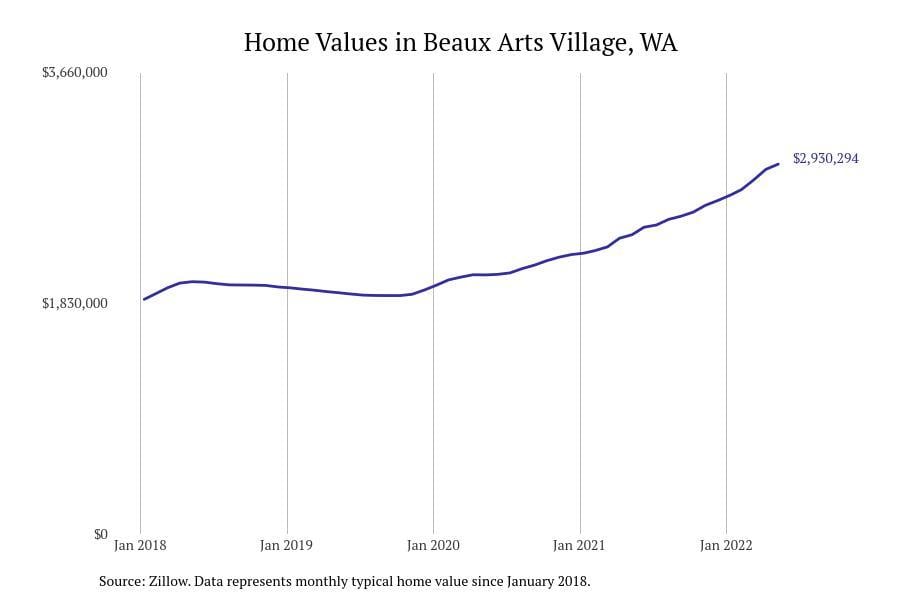
#5. Beaux Arts Village
– Typical home value: $2,822,274
– 1-year price change: +4.9%
– 5-year price change: +51.6%
– Metro area: Seattle-Tacoma-Bellevue, WA
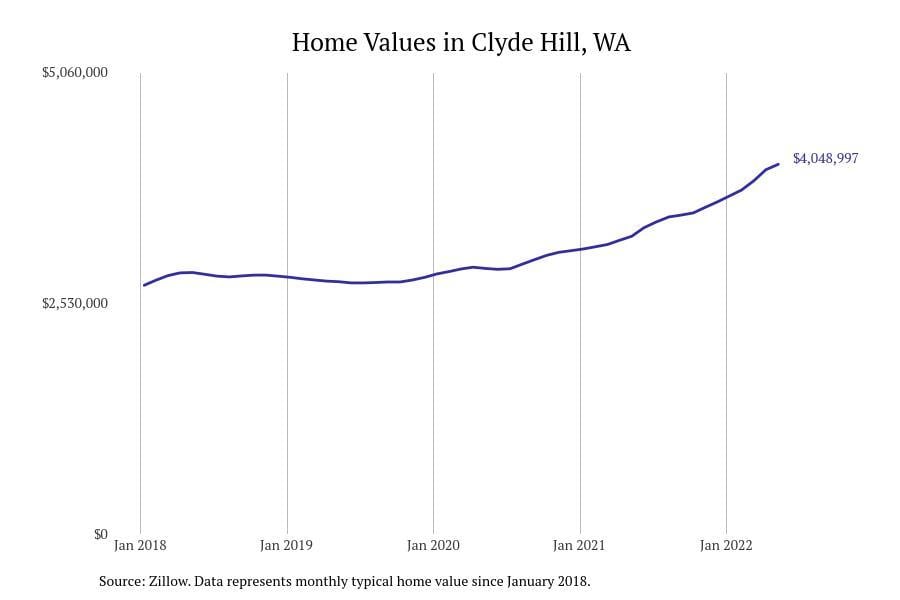
#4. Clyde Hill
– Typical home value: $4,027,772
– 1-year price change: +5.7%
– 5-year price change: +54.6%
– Metro area: Seattle-Tacoma-Bellevue, WA
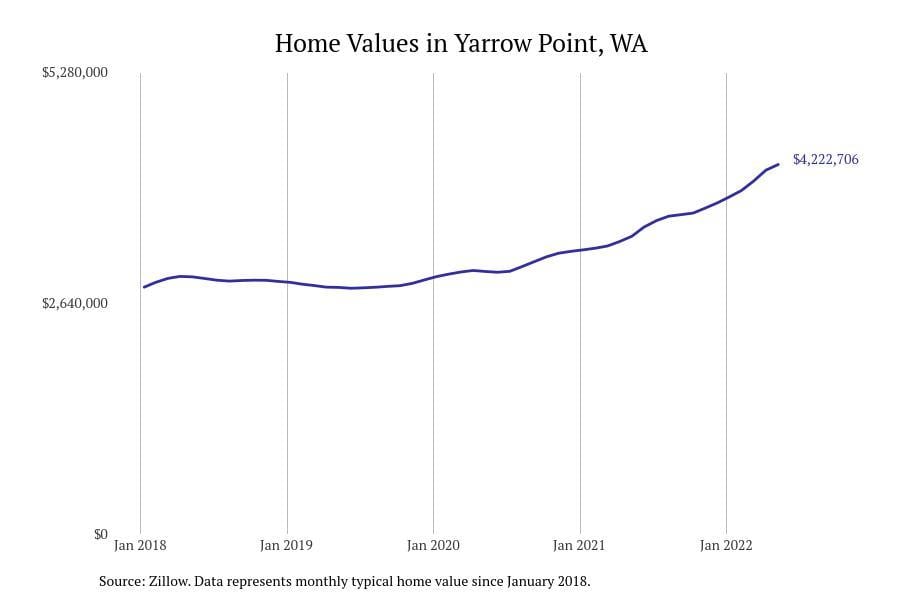
#3. Yarrow Point
– Typical home value: $4,270,557
– 1-year price change: +5.1%
– 5-year price change: +52.5%
– Metro area: Seattle-Tacoma-Bellevue, WA
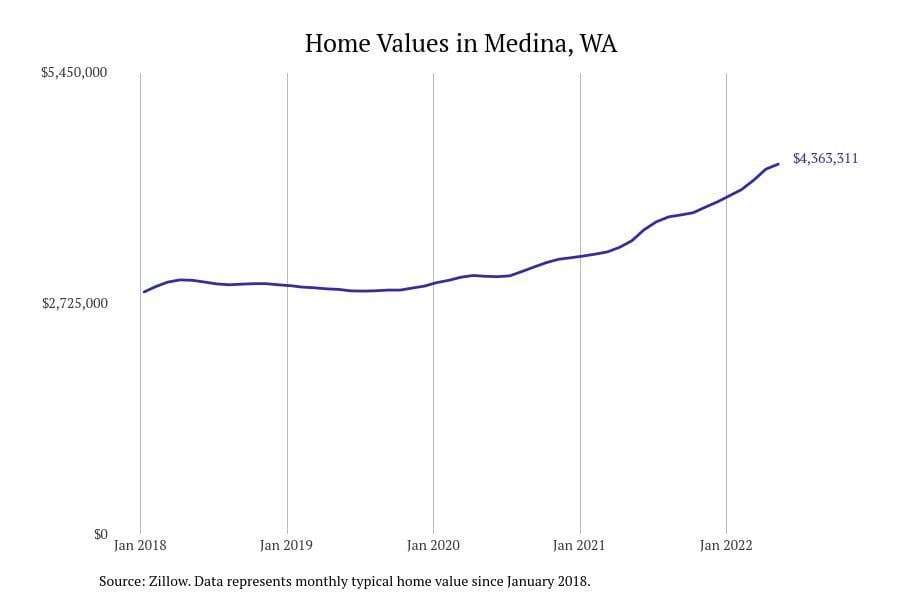
#2. Medina
– Typical home value: $4,435,825
– 1-year price change: +7.2%
– 5-year price change: +56.3%
– Metro area: Seattle-Tacoma-Bellevue, WA
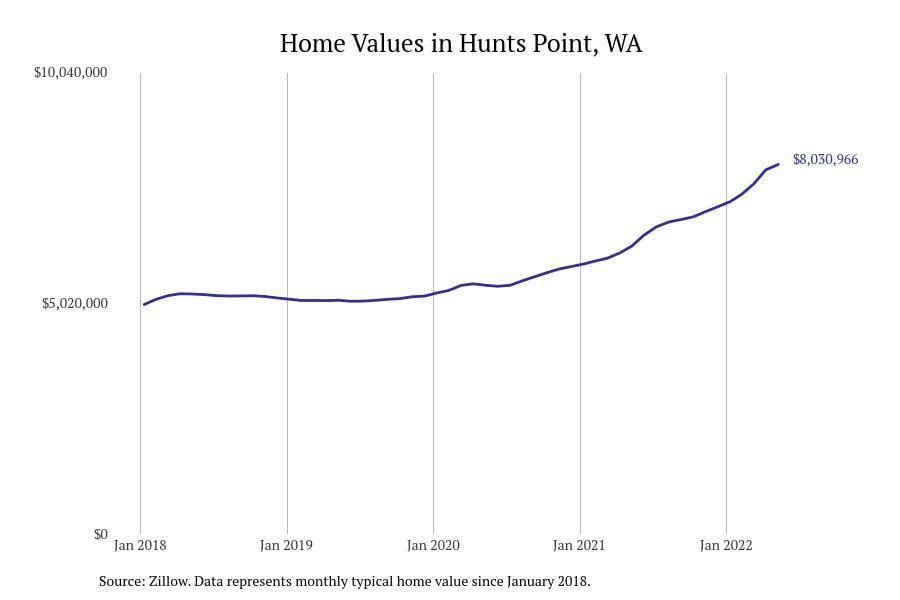
#1. Hunts Point
– Typical home value: $7,384,337
– 1-year price change: +3.0%
– 5-year price change: +54.7%
– Metro area: Seattle-Tacoma-Bellevue, WA
You may also like: How Washington is committing to electric vehicles
By Stacker