🔥 Would you like to save this?
I’ve analyzed the Zillow Home Value Index data to uncover Maine’s neighborhoods with the most impressive home value appreciation from 2016 to 2025. The results reveal fascinating patterns about where capital has flowed in this northeastern coastal state.
What surprised me most was the concentration of high-growth areas around Portland, with neighborhoods like East Deering and Deering Center seeing values more than double in just nine years. The coastal premium is equally striking – communities like Kittery Point and Bailey Island have become investment powerhouses despite their relatively small populations.
In order to come up with the very specific design ideas, we create most designs with the assistance of state-of-the-art AI interior design software. Also, assume links that take you off the site are affiliate links such as links to Amazon. this means we may earn a commission if you buy something.
These 25 neighborhoods tell a compelling story about Maine’s evolving housing landscape. From urban revitalization to coastal demand, these areas represent the leading edge of value creation in a state that continues to draw newcomers seeking both natural beauty and economic opportunity.
25. West Bayside
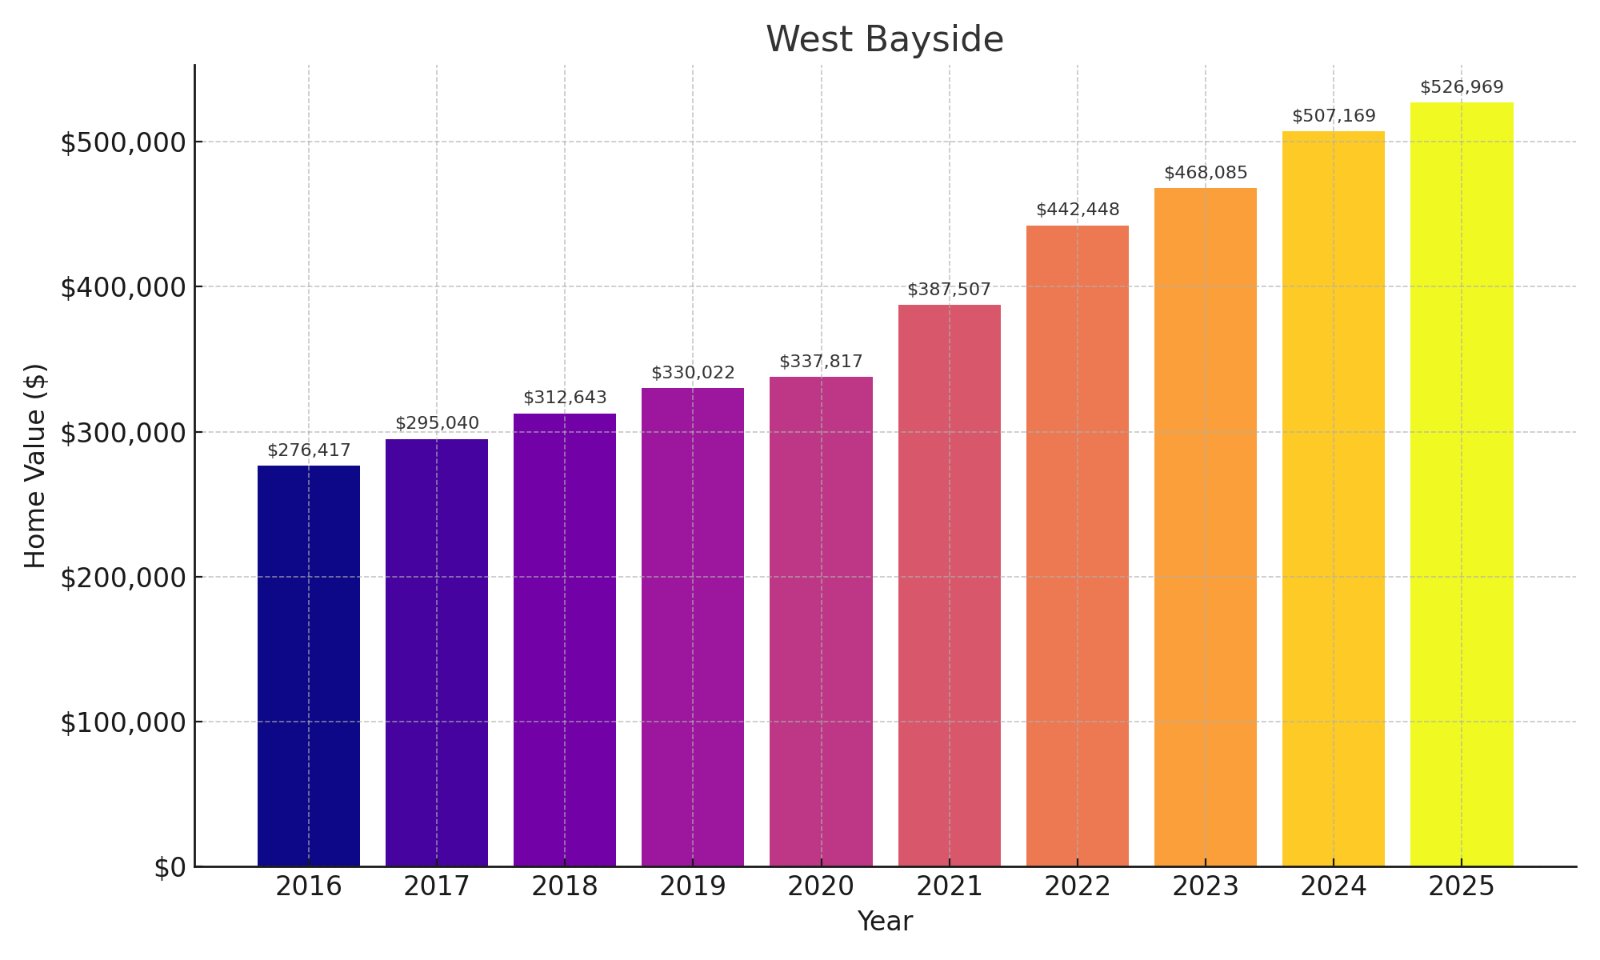
- % change from 2016 to 2025: 90.64%
- 2025: $526,969
- 2024: $507,169
- 2023: $468,085
- 2022: $442,448
- 2021: $387,507
- 2020: $337,817
- 2019: $330,022
- 2018: $312,643
- 2017: $295,040
- 2016: $276,417
Your investment in West Bayside would have nearly doubled over this nine-year period, making it a standout performer in any portfolio. The consistent year-over-year growth suggests this Portland neighborhood has staying power, avoiding the volatility seen in other markets. For buyers, the continued upward trajectory likely means competition will remain fierce, while sellers can command premium prices in this hot urban market.
24. Downtown
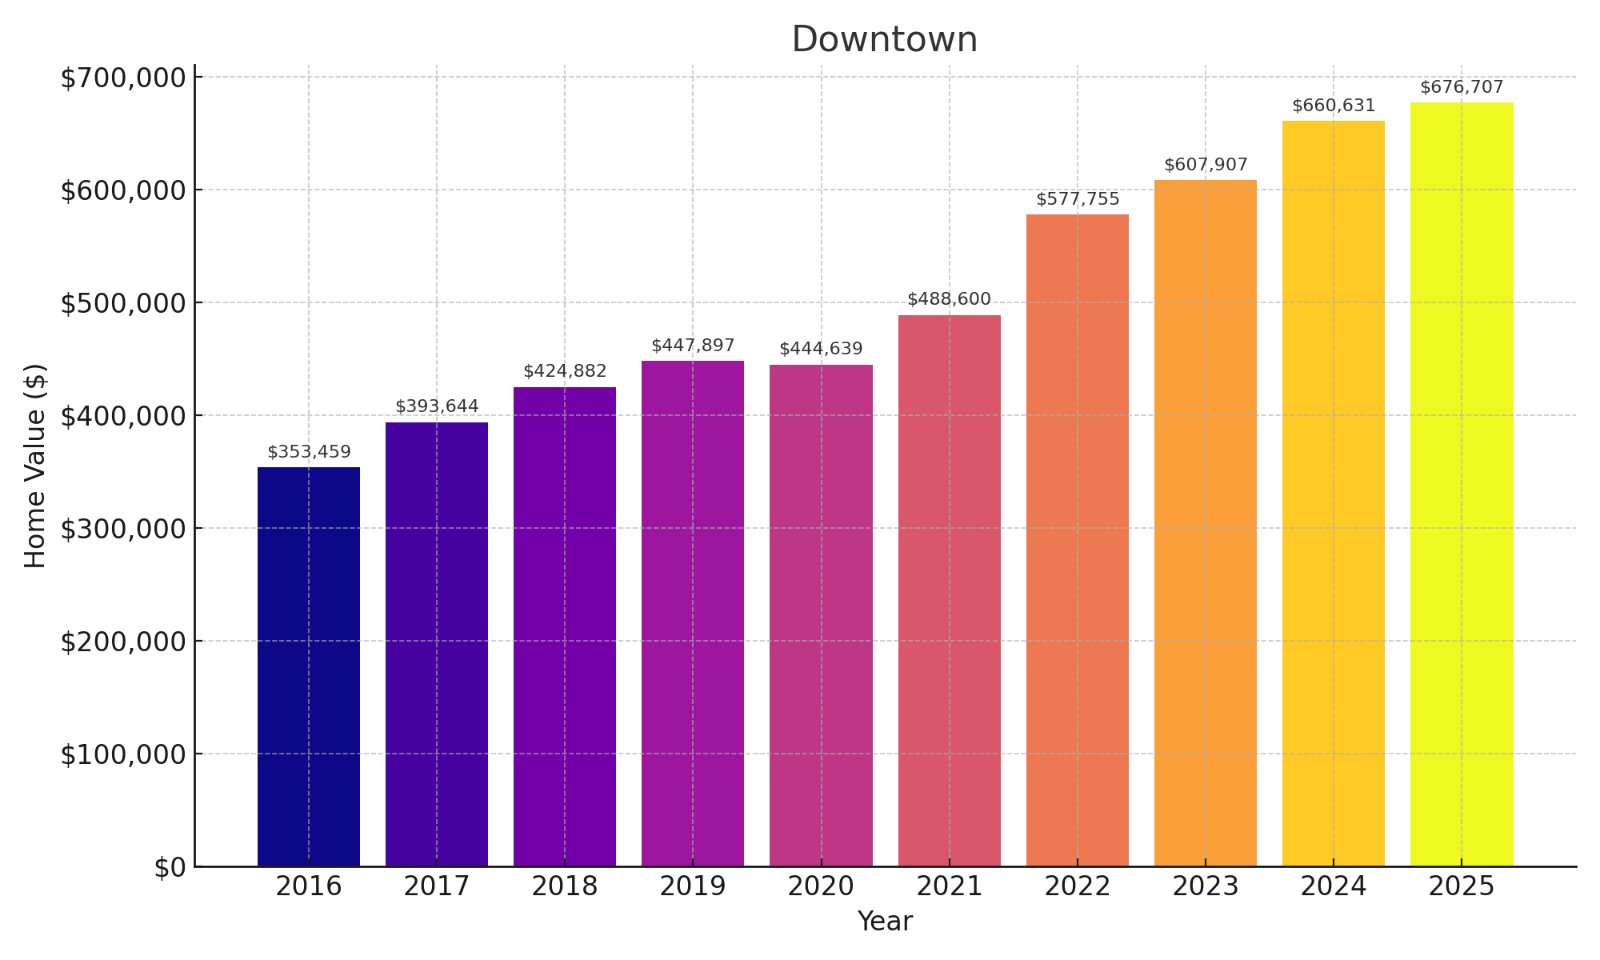
- % change from 2016 to 2025: 91.45%
- 2025: $676,707
- 2024: $660,631
- 2023: $607,907
- 2022: $577,755
- 2021: $488,600
- 2020: $444,639
- 2019: $447,897
- 2018: $424,882
- 2017: $393,644
- 2016: $353,459
The Downtown area has delivered exceptional returns, with property values climbing more than $323,000 in nine years – an annual appreciation rate that outpaces most traditional investments. This urban core’s resilience through market fluctuations indicates strong fundamentals driving demand. For prospective buyers, the high entry price may be offset by continued appreciation potential, while current owners benefit from the area’s desirability at the heart of Portland’s commercial district.
23. Cape Neddick

- % change from 2016 to 2025: 94.32%
- 2025: $695,937
- 2024: $678,884
- 2023: $638,566
- 2022: $605,164
- 2021: $504,403
- 2020: $426,124
- 2019: $414,228
- 2018: $404,624
- 2017: $379,412
- 2016: $358,140
Your investment in Cape Neddick would have yielded exceptional returns, with average property values increasing by over $337,000 since 2016. The stunning 94% appreciation rate far outperforms traditional investment vehicles, highlighting this coastal community’s desirability. The acceleration of growth post-2020 suggests pandemic-driven demand for premium waterfront properties, creating a seller’s advantage that shows no signs of cooling in this picturesque southern Maine hamlet.
22. York Harbor

- % change from 2016 to 2025: 95.54%
- 2025: $761,059
- 2024: $756,944
- 2023: $714,569
- 2022: $653,585
- 2021: $549,932
- 2020: $470,748
- 2019: $450,887
- 2018: $429,310
- 2017: $407,572
- 2016: $389,212
Your capital would have nearly doubled in York Harbor, with property values surging from $389K to over $761K in nine years. This coastal gem shows particularly strong growth acceleration during 2020-2022, indicating pandemic-driven premium for waterfront communities with historic charm. The steady appreciation trend suggests long-term desirability rather than speculative bubbles, making this harbor community both a lifestyle choice and wealth-building opportunity along Maine’s southern coast.
21. West End

- % change from 2016 to 2025: 95.87%
- 2025: $591,663
- 2024: $591,267
- 2023: $542,301
- 2022: $508,673
- 2021: $430,094
- 2020: $389,438
- 2019: $377,477
- 2018: $360,996
- 2017: $335,433
- 2016: $302,077
West End has been a financial powerhouse, with home equity gains approaching six figures annually in recent years. The neighborhood’s consistent appreciation curve indicates sustained demand rather than speculative spikes, suggesting fundamental value drivers at work. For buyers, West End represents both quality of life and strong investment potential in Portland’s historic district, while sellers benefit from a market where prices continue setting new records year after year.
20. East End

- % change from 2016 to 2025: 96.35%
- 2025: $760,485
- 2024: $747,855
- 2023: $710,995
- 2022: $658,126
- 2021: $546,735
- 2020: $492,313
- 2019: $479,420
- 2018: $444,275
- 2017: $418,828
- 2016: $387,310
Your investment in East End would have delivered exceptional returns, nearly doubling in value while generating over $373,000 in wealth creation. The steep appreciation curve accelerated dramatically during 2020-2022, suggesting this Portland peninsula neighborhood benefited significantly from pandemic-related housing preferences. For buyers, the sustained growth trajectory indicates continued upside potential despite high entry costs, while sellers can leverage the area’s premium status in one of Portland’s most sought-after districts.
19. East Boothbay
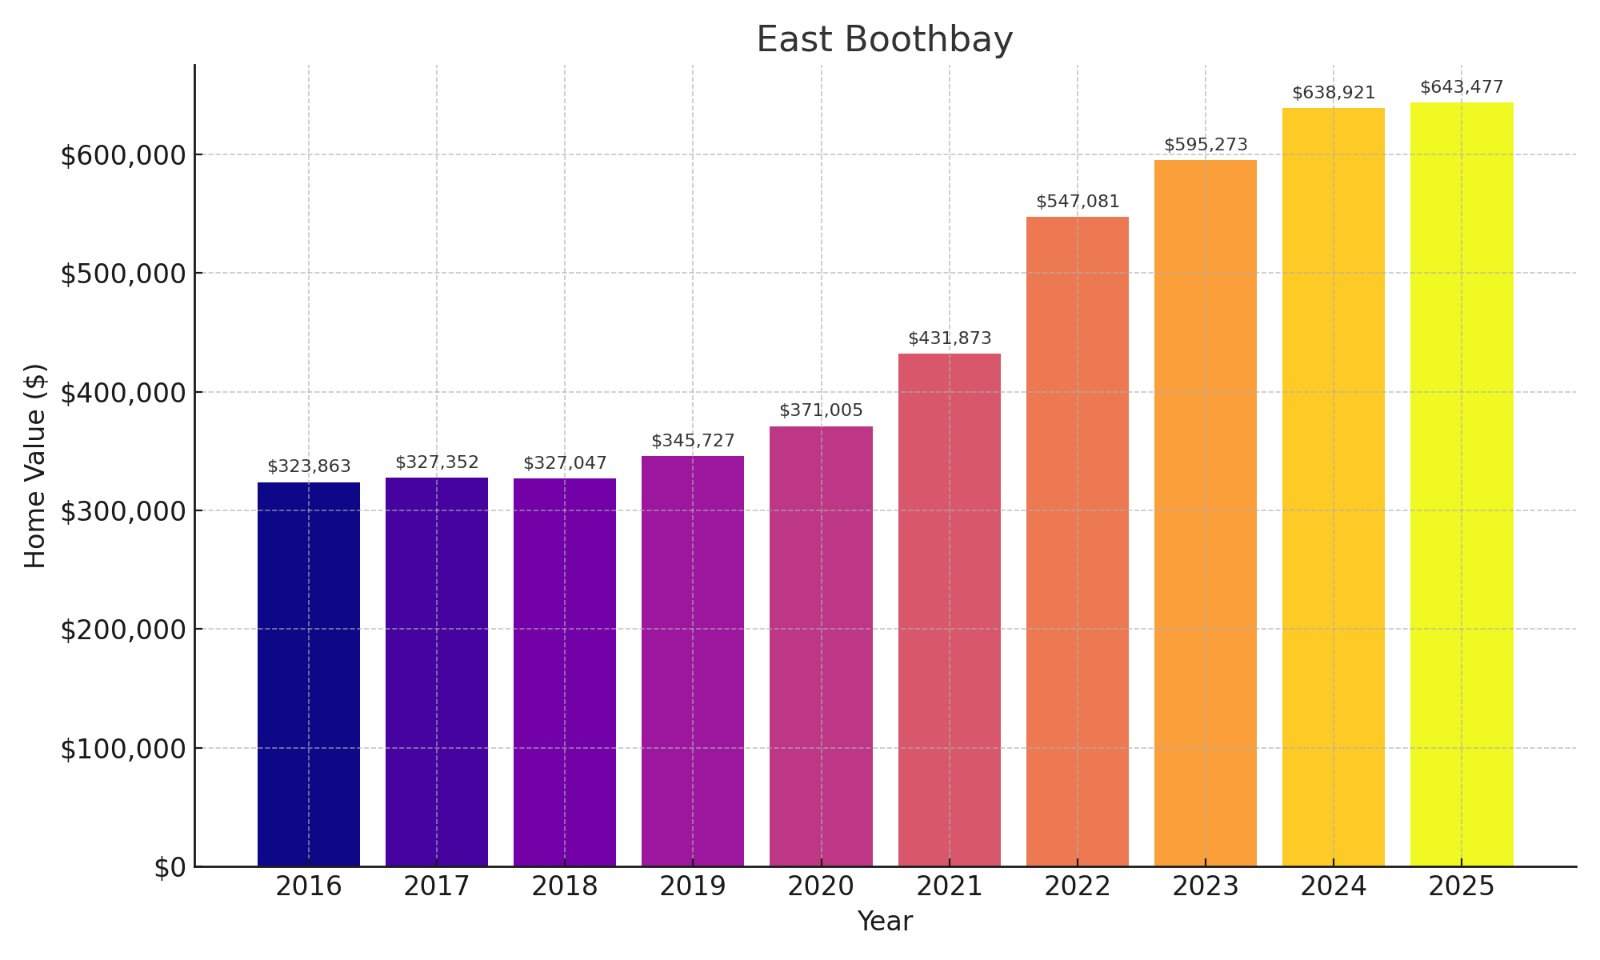
- % change from 2016 to 2025: 98.69%
- 2025: $643,477
- 2024: $638,921
- 2023: $595,273
- 2022: $547,081
- 2021: $431,873
- 2020: $371,005
- 2019: $345,727
- 2018: $327,047
- 2017: $327,352
- 2016: $323,863
Your investment would have virtually doubled in East Boothbay, with exceptional wealth creation of nearly $320,000 in just nine years. The dramatic acceleration after 2020 suggests pandemic-driven demand for this coastal community, with values jumping over $76,000 in a single year (2020-2021). As a waterfront peninsula community with limited housing stock, the supply-demand imbalance favors sellers and suggests continued appreciation potential in this picturesque harbor town renowned for its maritime heritage.
18. Parkside
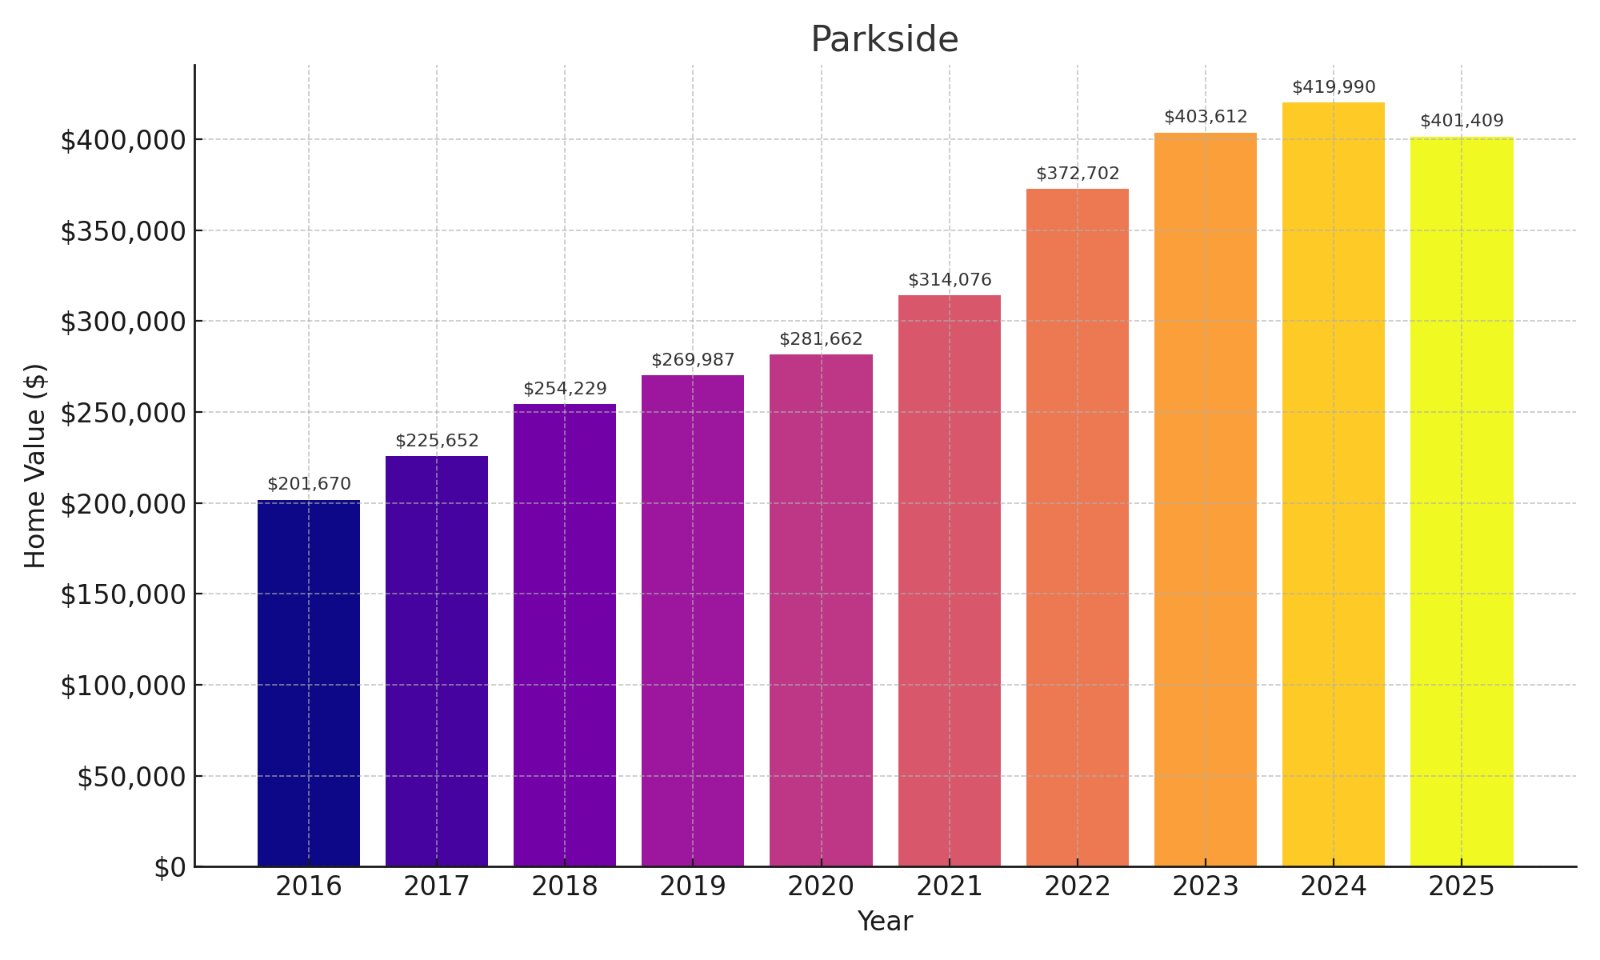
- % change from 2016 to 2025: 99.04%
- 2025: $401,409
- 2024: $419,990
- 2023: $403,612
- 2022: $372,702
- 2021: $314,076
- 2020: $281,662
- 2019: $269,987
- 2018: $254,229
- 2017: $225,652
- 2016: $201,670
Parkside has delivered exceptional investment returns, with values essentially doubling over nine years and generating approximately $200,000 in equity growth. The unusual 2024-2025 price correction suggests market normalization after steep pandemic-era increases, potentially creating a strategic entry point for buyers. This urban Portland neighborhood offers a compelling combination of relative affordability and strong appreciation history, making it an attractive option for both first-time homebuyers and investors seeking growth potential.
17. Bailey Island

- % change from 2016 to 2025: 100.53%
- 2025: $768,096
- 2024: $756,187
- 2023: $673,209
- 2022: $658,290
- 2021: $549,279
- 2020: $472,746
- 2019: $458,998
- 2018: $440,053
- 2017: $401,096
- 2016: $383,039
Your investment in Bailey Island would have precisely doubled, creating over $385,000 in wealth during this nine-year period. The steep appreciation curve accelerated dramatically during 2020-2022, reflecting pandemic-driven demand for scenic island properties with natural isolation. For buyers, the continued strong performance suggests enduring value despite high entry costs, while sellers benefit from limited housing supply on this geographically constrained island connected to the mainland by the historic Cribstone Bridge.
16. Orr’s Island
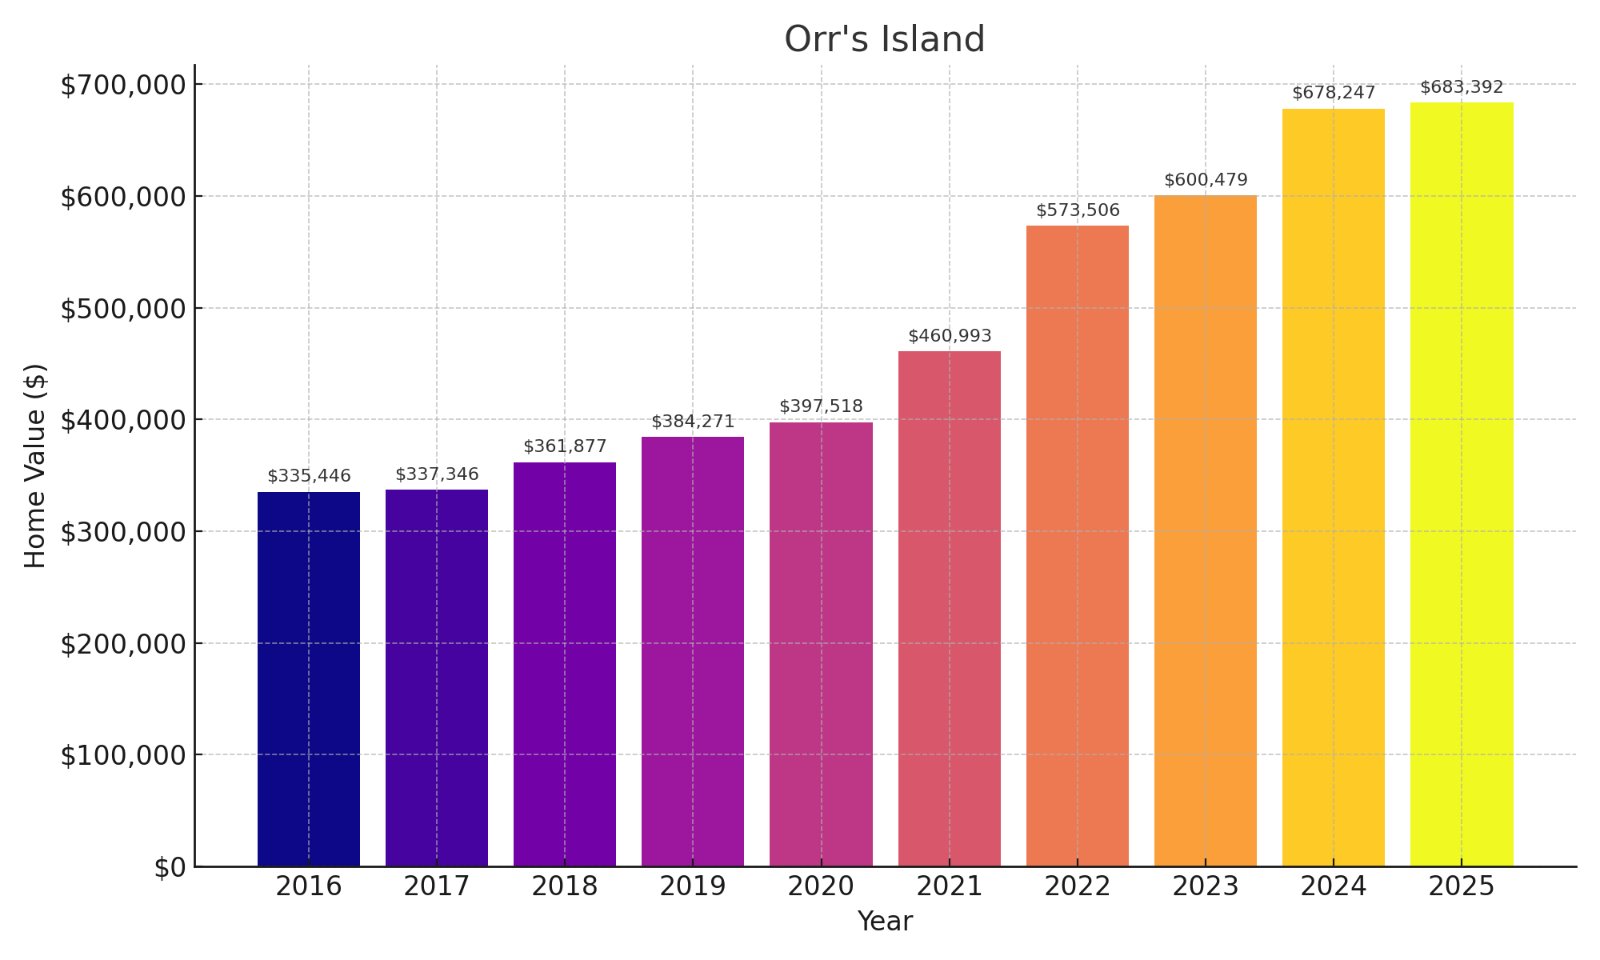
- % change from 2016 to 2025: 103.73%
- 2025: $683,392
- 2024: $678,247
- 2023: $600,479
- 2022: $573,506
- 2021: $460,993
- 2020: $397,518
- 2019: $384,271
- 2018: $361,877
- 2017: $337,346
- 2016: $335,446
Your capital in Orr’s Island would have more than doubled, generating almost $348,000 in wealth over nine years. The dramatic acceleration after 2020 indicates pandemic-driven demand for island properties, with values jumping over $63,000 in a single year (2020-2021). The consistent appreciation trend suggests lasting demand rather than speculation, creating advantageous conditions for sellers while buyers face increasing barriers to entry in this exclusive Casco Bay island community.
15. Peaks Island
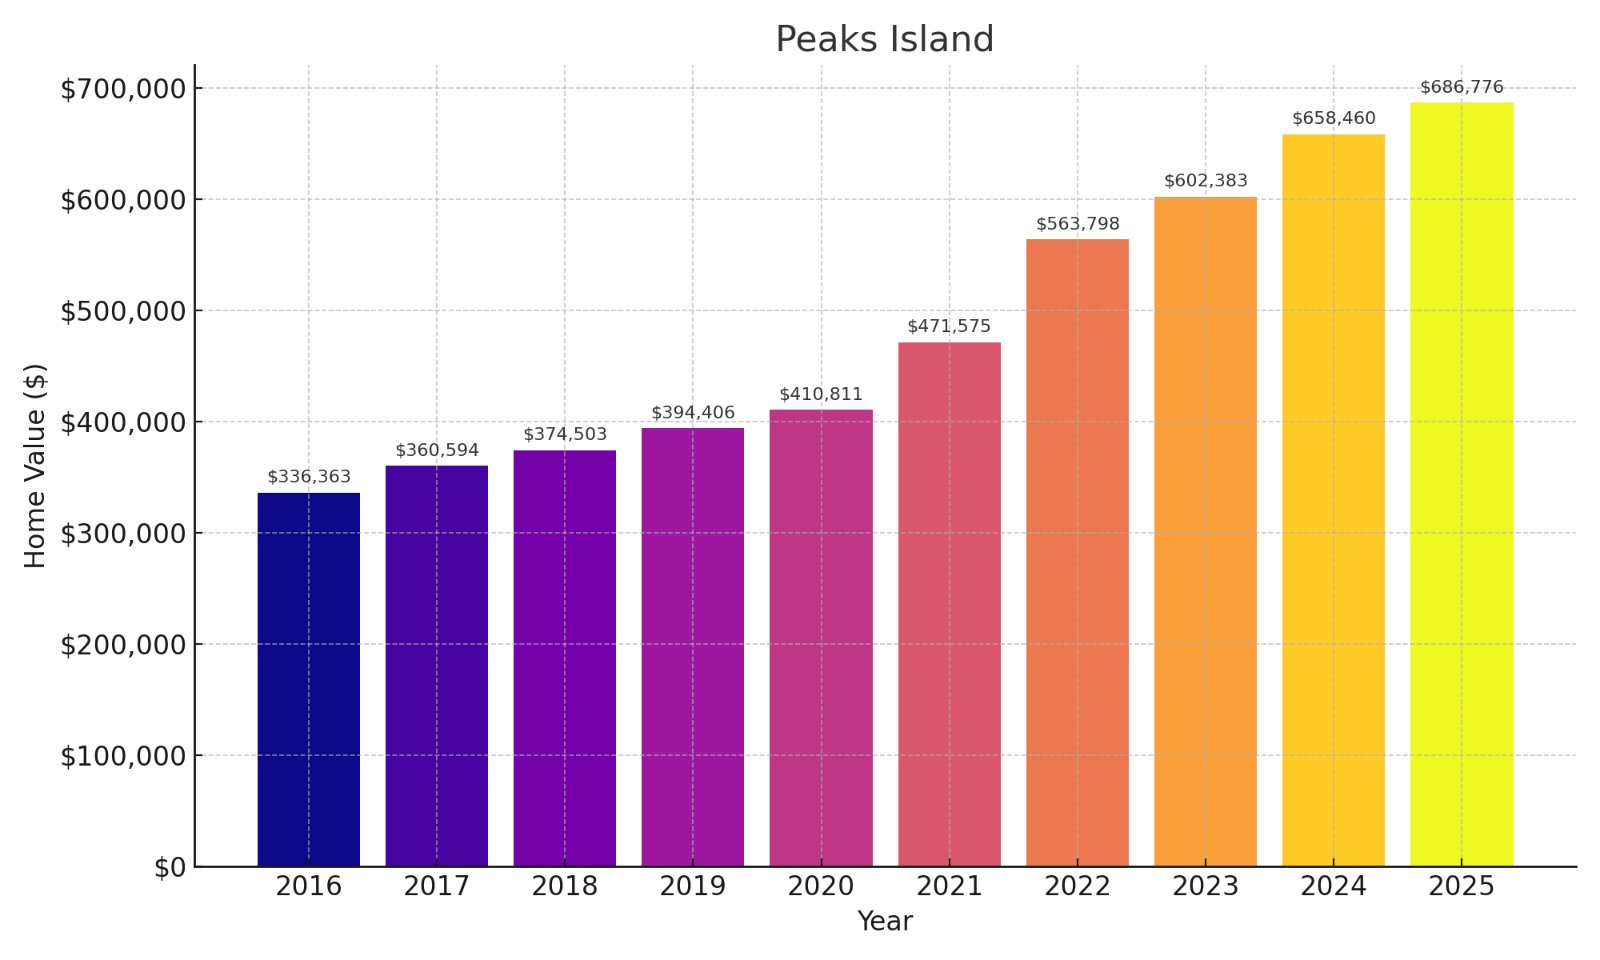
- % change from 2016 to 2025: 104.18%
- 2025: $686,776
- 2024: $658,460
- 2023: $602,383
- 2022: $563,798
- 2021: $471,575
- 2020: $410,811
- 2019: $394,406
- 2018: $374,503
- 2017: $360,594
- 2016: $336,363
Your investment in Peaks Island would have more than doubled, creating approximately $350,000 in equity over nine years. The island experienced its most dramatic growth during 2020-2021, with values jumping nearly $61,000 in a single year as pandemic-era buyers sought scenic island retreats. The ferry-accessible location just minutes from downtown Portland creates a unique value proposition that continues to drive demand, making this a seller’s market with limited inventory and strong upside potential.
14. Stroudwater
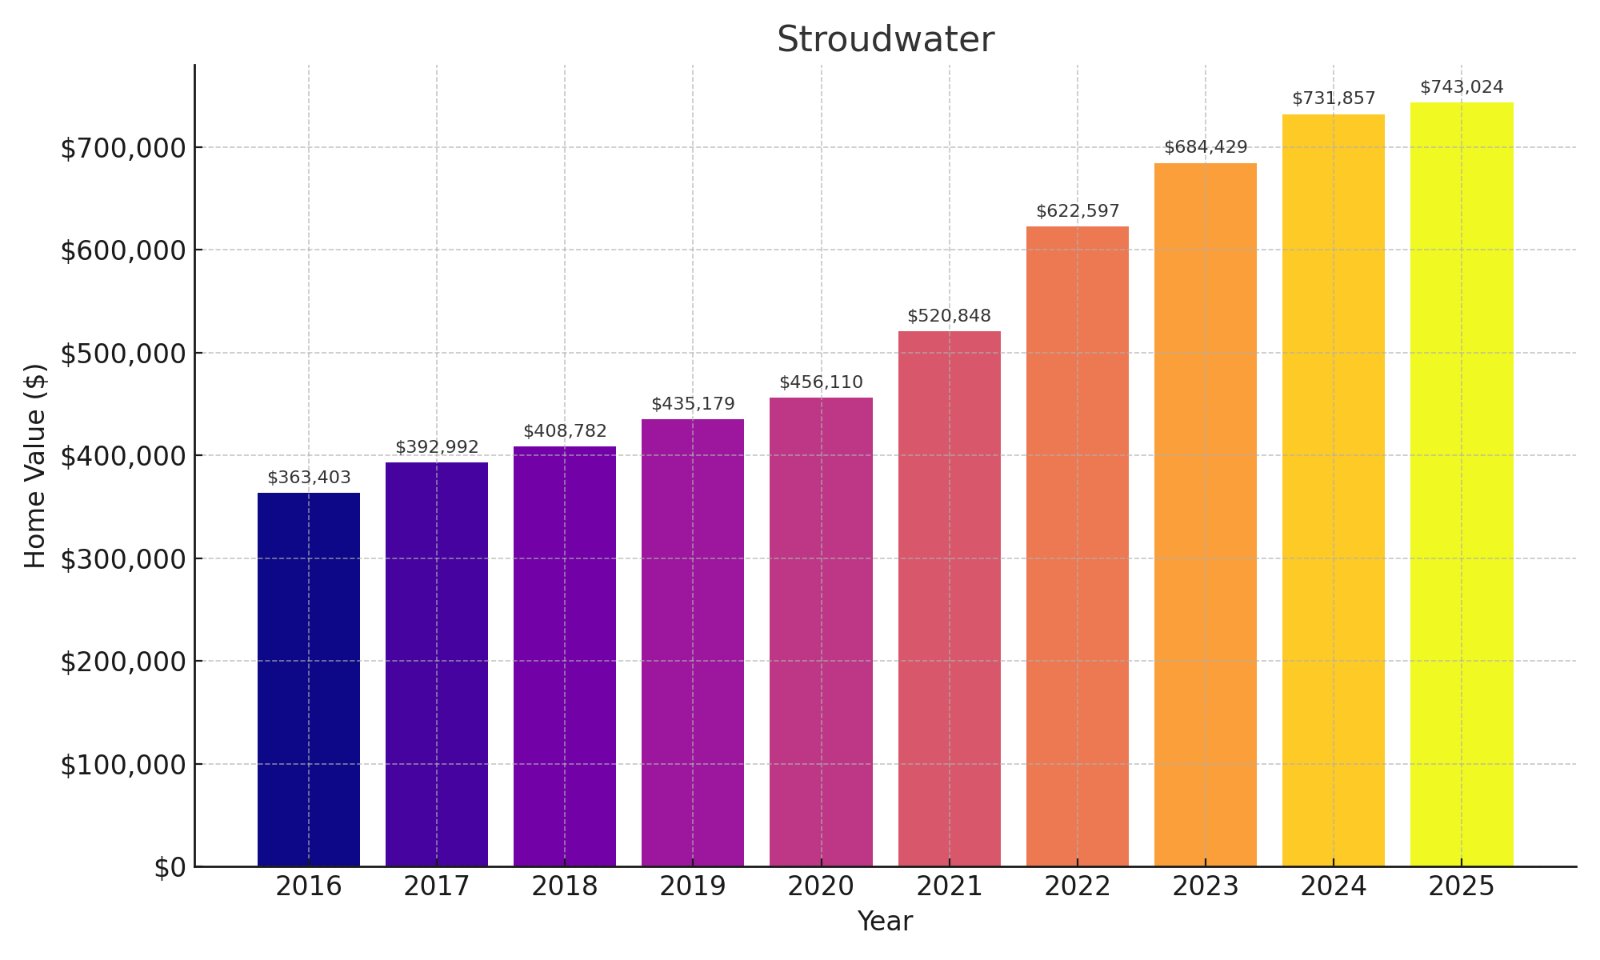
- % change from 2016 to 2025: 104.46%
- 2025: $743,024
- 2024: $731,857
- 2023: $684,429
- 2022: $622,597
- 2021: $520,848
- 2020: $456,110
- 2019: $435,179
- 2018: $408,782
- 2017: $392,992
- 2016: $363,403
Your capital in Stroudwater would have more than doubled, generating nearly $380,000 in wealth creation over this nine-year period. The rapid acceleration after 2020 suggests pandemic-driven demand for this historic western Portland neighborhood with its spacious lots and architectural character. Current trends indicate continued appreciation potential despite high entry costs, creating favorable conditions for sellers while buyers must weigh the substantial investment against the neighborhood’s proven track record of building wealth.
13. Cumberland Center

🔥 Would you like to save this?
- % change from 2016 to 2025: 105.85%
- 2025: $664,852
- 2024: $643,153
- 2023: $591,048
- 2022: $549,820
- 2021: $464,584
- 2020: $396,041
- 2019: $377,478
- 2018: $362,409
- 2017: $346,497
- 2016: $322,984
Your investment in Cumberland Center would have more than doubled, creating almost $342,000 in equity growth since 2016. The dramatic acceleration after 2020 indicates strong pandemic-era demand for this affluent suburb northwest of Portland, with values jumping nearly $69,000 in a single year (2020-2021). The upscale community’s continued appreciation suggests underlying fundamentals supporting long-term value, creating favorable conditions for sellers while offering buyers strong schools and quality of life despite high entry costs.
12. Kittery Point
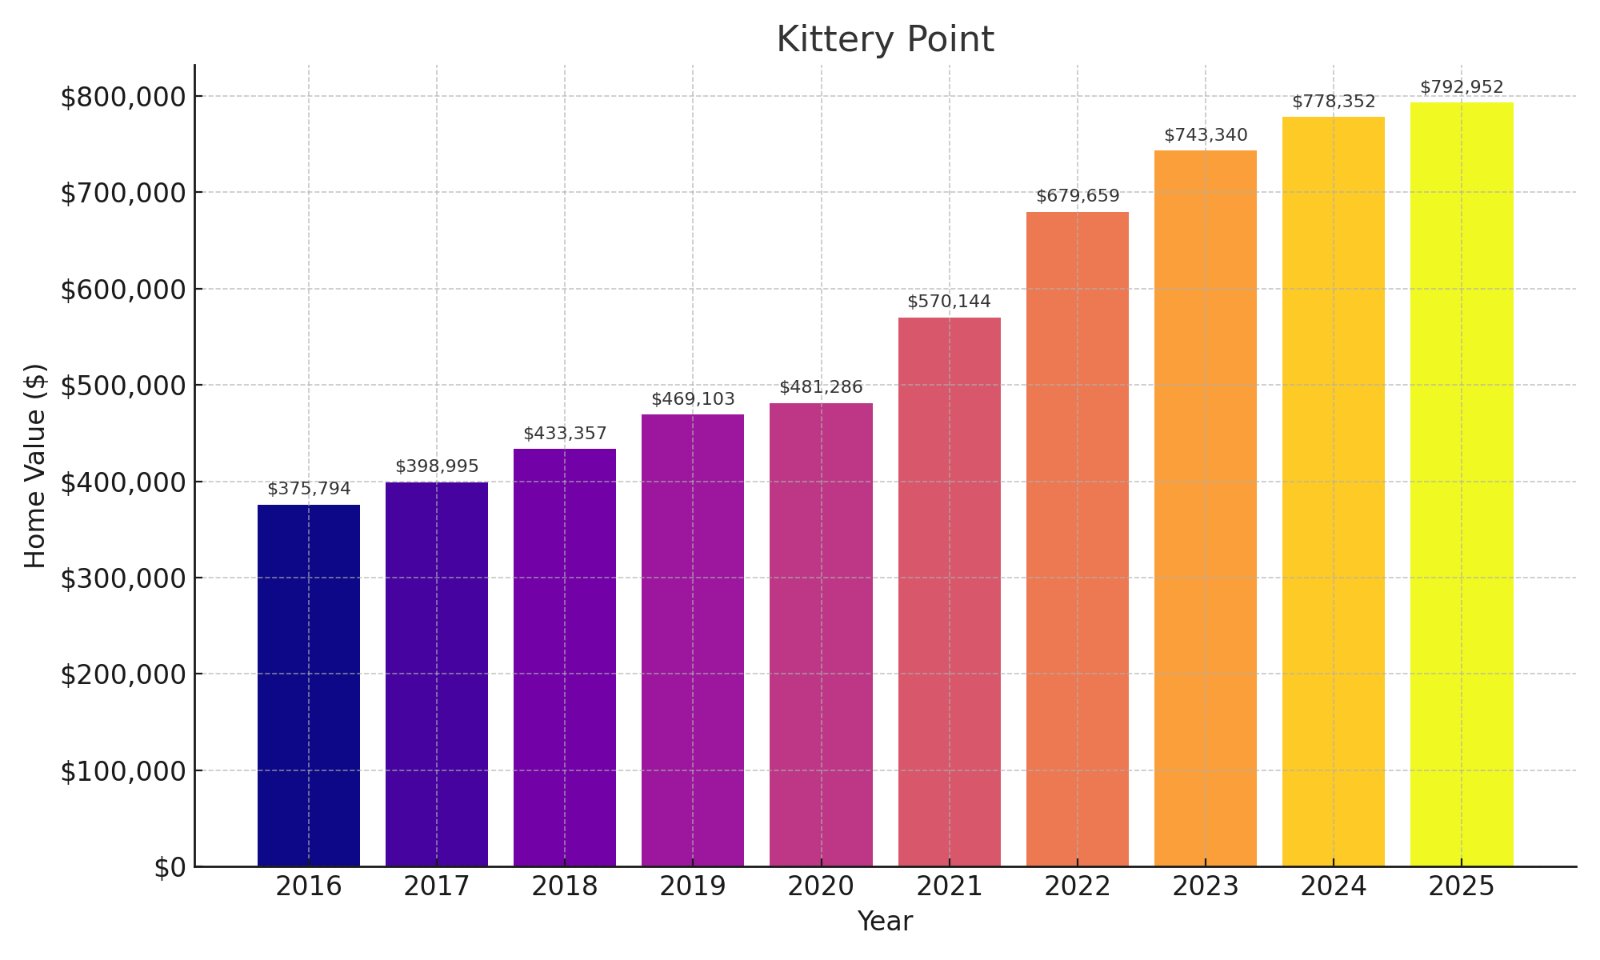
- % change from 2016 to 2025: 111.01%
- 2025: $792,952
- 2024: $778,352
- 2023: $743,340
- 2022: $679,659
- 2021: $570,144
- 2020: $481,286
- 2019: $469,103
- 2018: $433,357
- 2017: $398,995
- 2016: $375,794
Your capital in Kittery Point would have more than doubled, generating over $417,000 in wealth in just nine years. The steep appreciation curve accelerated dramatically during 2020-2022, indicating pandemic-driven demand for this historic waterfront community at Maine’s southern tip. The proximity to Portsmouth, NH creates tax advantage opportunities for residents, while limited housing inventory drives continued price growth, creating favorable conditions for sellers in this picturesque coastal peninsula.
11. Ocean Park
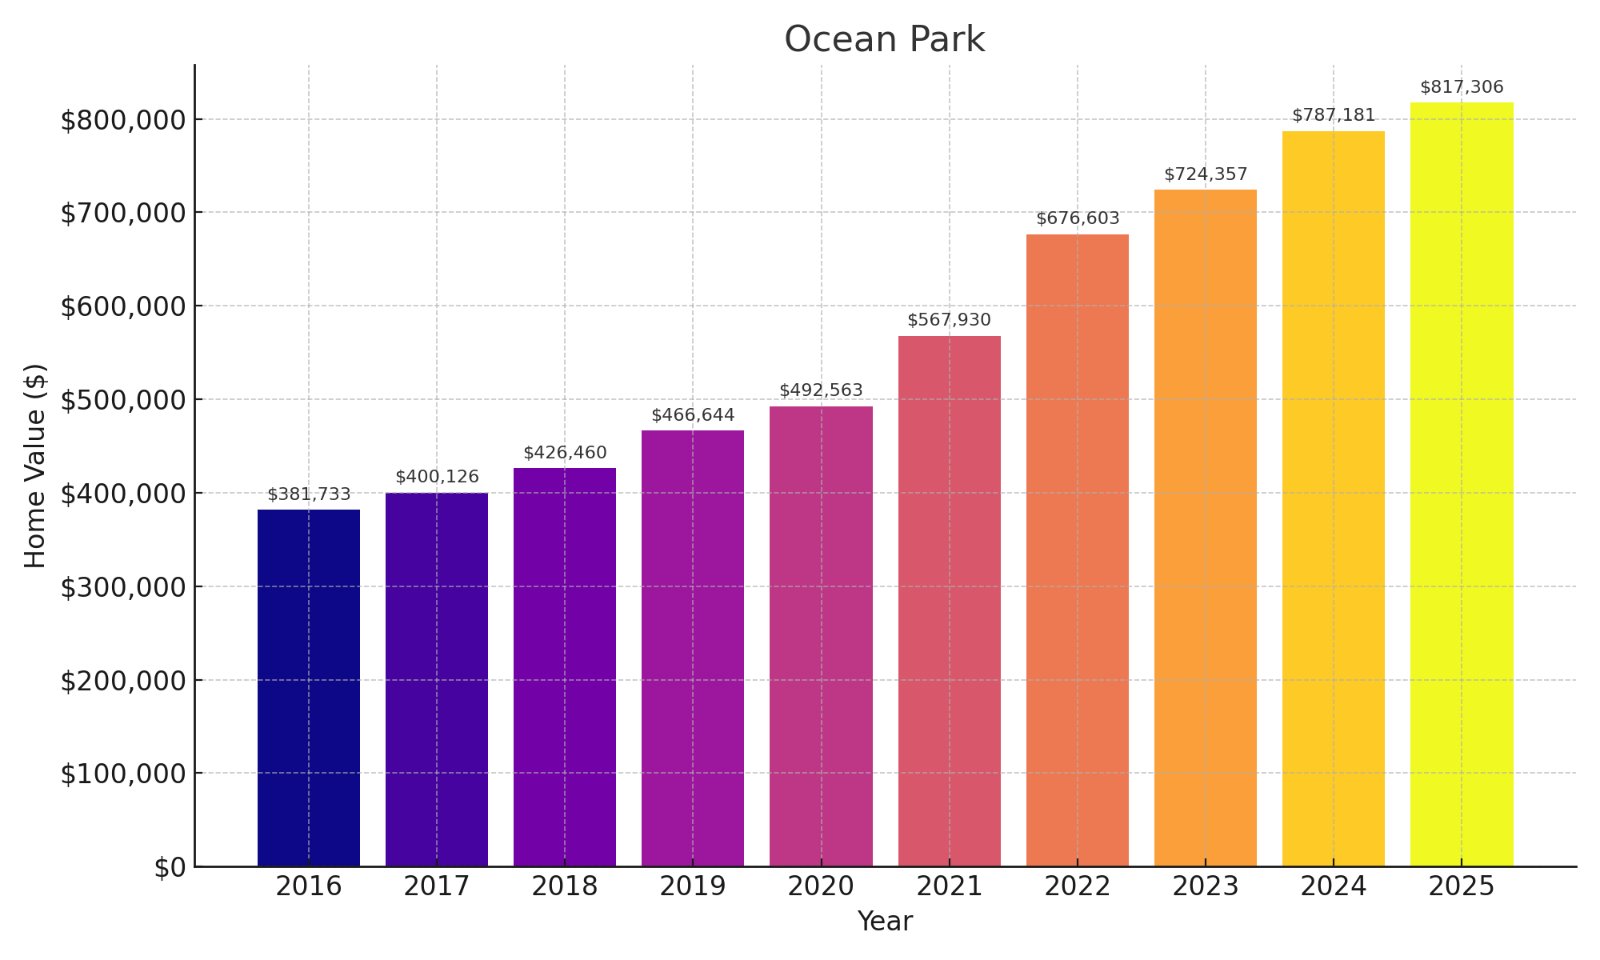
- % change from 2016 to 2025: 114.10%
- 2025: $817,306
- 2024: $787,181
- 2023: $724,357
- 2022: $676,603
- 2021: $567,930
- 2020: $492,563
- 2019: $466,644
- 2018: $426,460
- 2017: $400,126
- 2016: $381,733
Your investment in Ocean Park would have more than doubled, with extraordinary wealth creation exceeding $435,000 since 2016. The dramatic acceleration after 2020 indicates strong pandemic-era demand for this oceanfront community near Old Orchard Beach, with values jumping over $75,000 in a single year (2020-2021). The beachfront location combined with a historic Chautauqua community creates unique value that continues attracting buyers despite high entry costs, maintaining the strong seller’s advantage in this southern Maine coastal destination.
10. North Deering
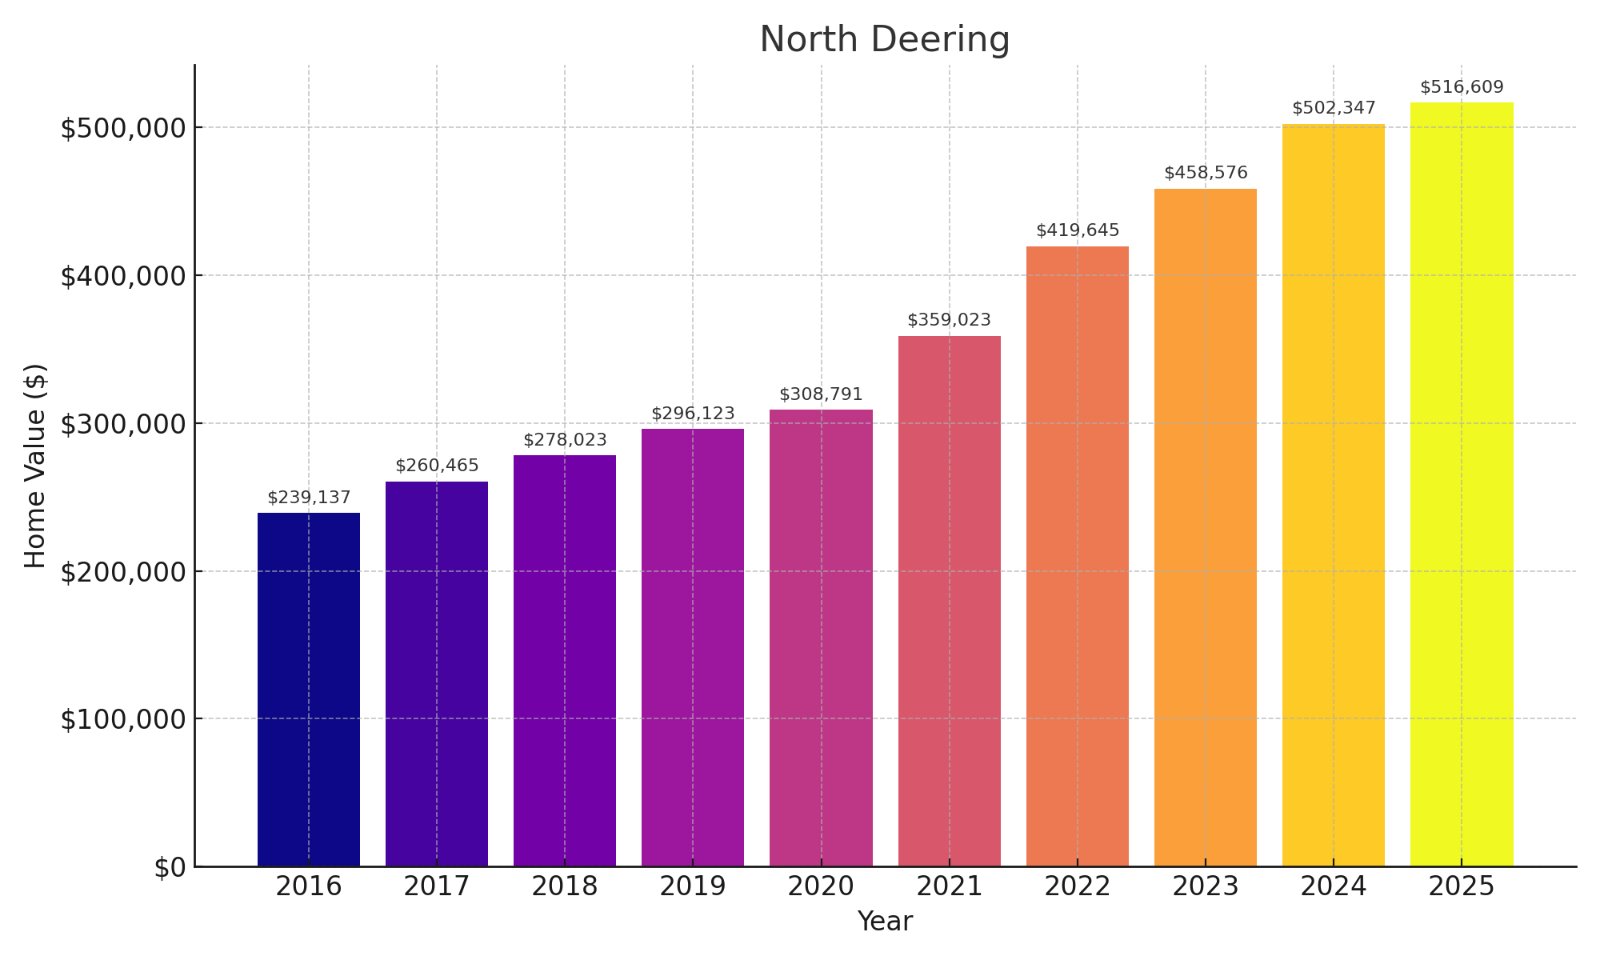
- % change from 2016 to 2025: 116.03%
- 2025: $516,609
- 2024: $502,347
- 2023: $458,576
- 2022: $419,645
- 2021: $359,023
- 2020: $308,791
- 2019: $296,123
- 2018: $278,023
- 2017: $260,465
- 2016: $239,137
Your capital in North Deering would have more than doubled, generating over $277,000 in equity growth in nine years. The steep acceleration curve after 2020 indicates strong pandemic-driven demand for this residential Portland neighborhood with its relative affordability and suburban character. For buyers, the continued strong performance coupled with prices still below many Portland neighborhoods creates an attractive value proposition, while sellers benefit from sustained appreciation in this northern Portland district.
9. Oakdale

- % change from 2016 to 2025: 118.03%
- 2025: $611,643
- 2024: $598,618
- 2023: $543,684
- 2022: $504,643
- 2021: $431,262
- 2020: $379,547
- 2019: $361,000
- 2018: $336,101
- 2017: $307,175
- 2016: $280,535
Your investment in Oakdale would have more than doubled, creating approximately $331,000 in wealth over nine years. The dramatic acceleration after 2020 indicates strong pandemic-era demand for this established neighborhood adjacent to the University of Southern Maine campus. The proximity to both downtown Portland and major educational institutions creates enduring appeal for both investors and homeowners, maintaining a seller’s advantage in this centrally-located Portland neighborhood known for its architectural character.
8. Libbytown

- % change from 2016 to 2025: 120.56%
- 2025: $499,057
- 2024: $489,998
- 2023: $449,921
- 2022: $411,118
- 2021: $356,107
- 2020: $307,911
- 2019: $288,153
- 2018: $270,758
- 2017: $253,935
- 2016: $226,272
Your capital in Libbytown would have more than doubled, generating over $272,000 in wealth creation since 2016. The neighborhood’s remarkable trajectory highlights its transformation from overlooked area to investment hotspot in western Portland. For buyers, the relatively lower entry point compared to other Portland neighborhoods creates opportunity despite rapid appreciation, while sellers benefit from Libbytown’s emergence as a desirable location near major employment centers and transportation corridors.
7. Ocean Avenue
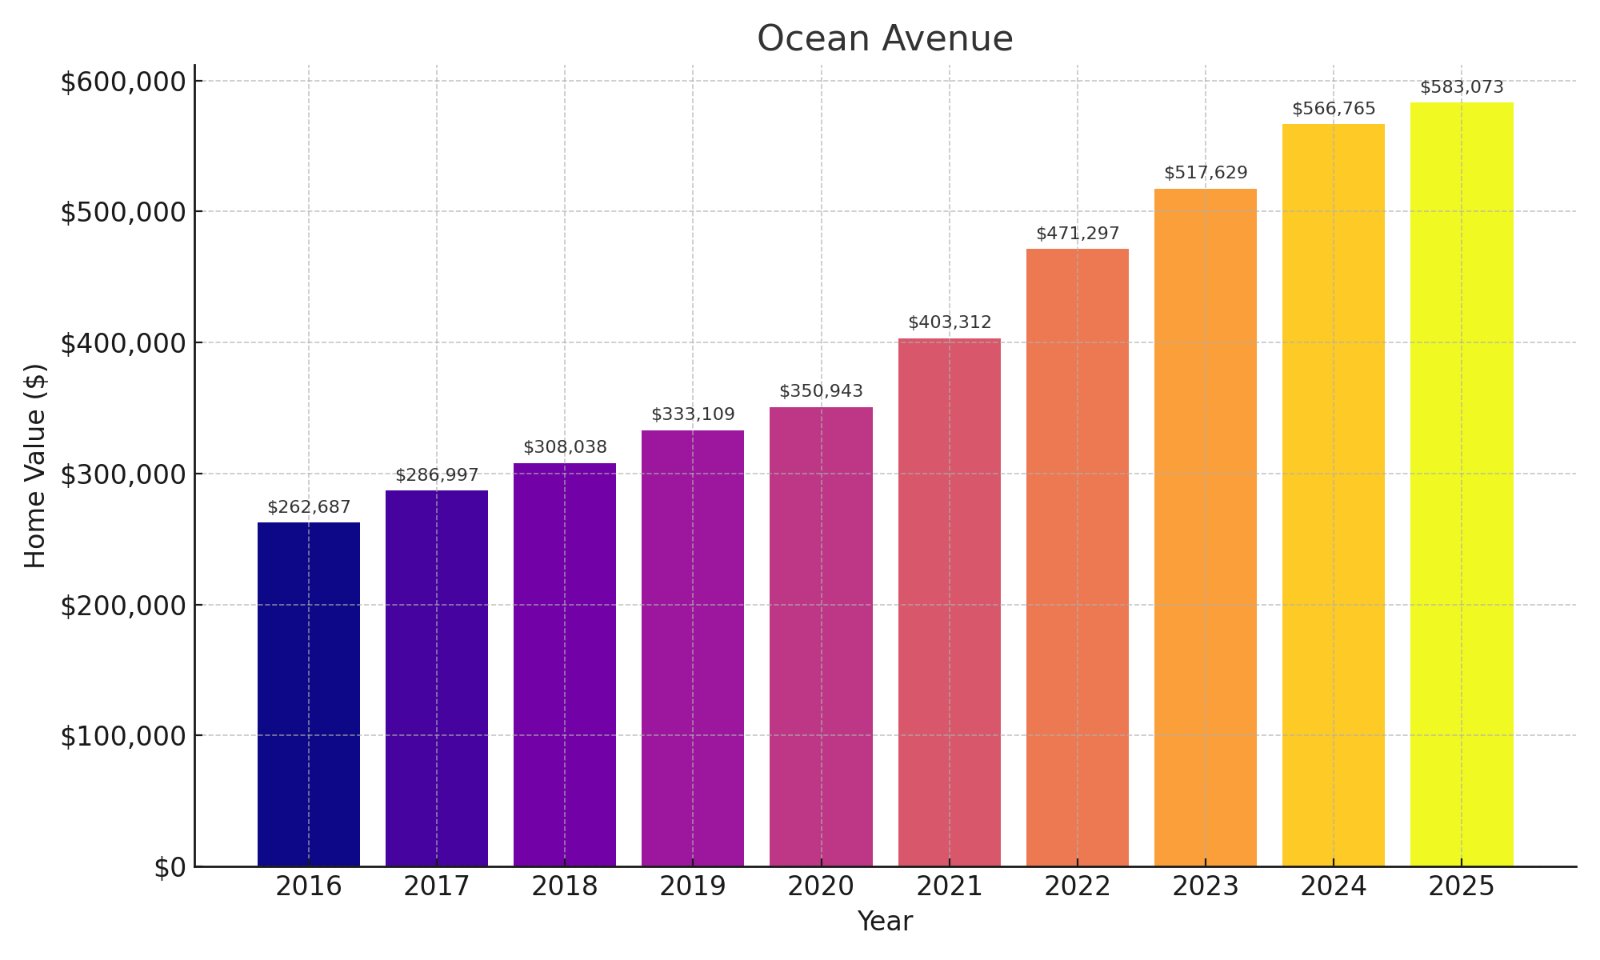
- % change from 2016 to 2025: 121.96%
- 2025: $583,073
- 2024: $566,765
- 2023: $517,629
- 2022: $471,297
- 2021: $403,312
- 2020: $350,943
- 2019: $333,109
- 2018: $308,038
- 2017: $286,997
- 2016: $262,687
Your investment along Ocean Avenue would have more than doubled, creating over $320,000 in equity over nine years. The dramatic price acceleration after 2020 reflects pandemic-era demand for this established Portland neighborhood with its mix of residential styles. For buyers, the continued appreciation trend suggests enduring value despite rising prices, while sellers benefit from Ocean Avenue’s central location connecting Portland’s eastern neighborhoods to the Back Cove area.
6. Riverton
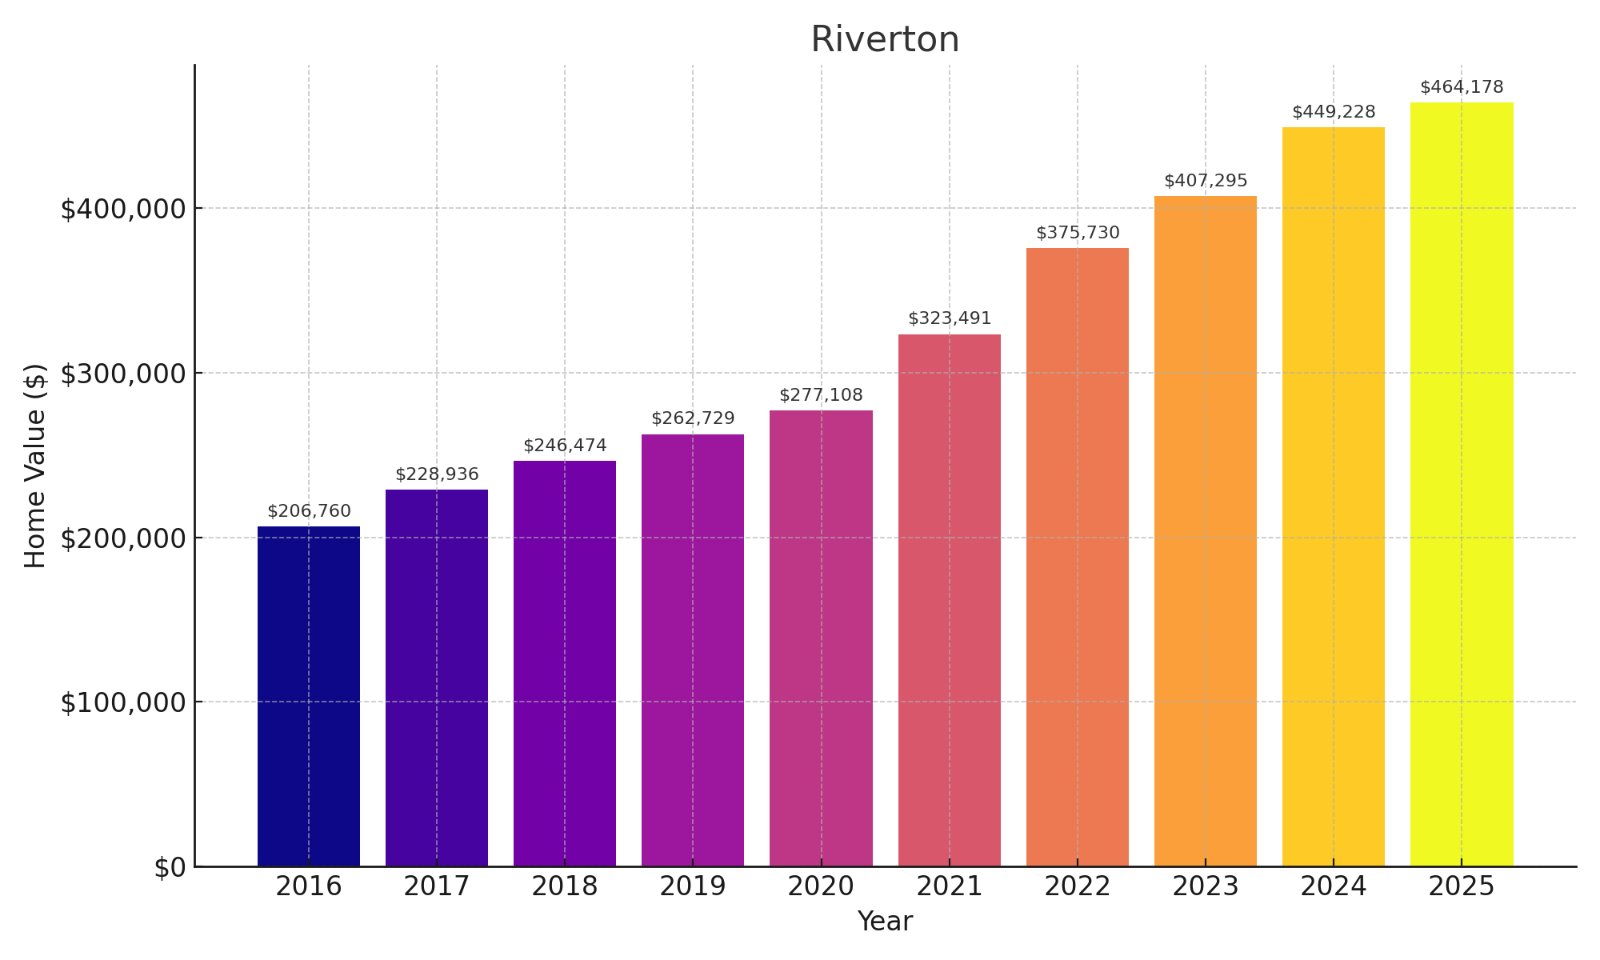
- % change from 2016 to 2025: 124.50%
- 2025: $464,178
- 2024: $449,228
- 2023: $407,295
- 2022: $375,730
- 2021: $323,491
- 2020: $277,108
- 2019: $262,729
- 2018: $246,474
- 2017: $228,936
- 2016: $206,760
Your capital in Riverton would have more than doubled, generating impressive returns of over $257,000 in equity growth. The neighborhood’s steep appreciation curve accelerated dramatically after 2020, with values jumping over $46,000 in a single year (2020-2021). This northwestern Portland district offers a compelling combination of relative affordability and strong growth potential, creating opportunities for buyers seeking value while maintaining a strong advantage for sellers in this evolving residential market.
5. Rosemont

- % change from 2016 to 2025: 124.84%
- 2025: $599,282
- 2024: $578,985
- 2023: $524,533
- 2022: $482,991
- 2021: $408,472
- 2020: $353,684
- 2019: $336,683
- 2018: $318,867
- 2017: $294,561
- 2016: $266,532
Your investment in Rosemont would have more than doubled, creating approximately $333,000 in wealth over nine years. The dramatic acceleration after 2020 reflects pandemic-era demand for this established western Portland neighborhood known for tree-lined streets and architectural character. The neighborhood’s continued strong performance suggests enduring appeal rather than speculative pricing, maintaining favorable conditions for sellers while buyers must weigh rising costs against Rosemont’s proven track record of building equity.
4. Kittery
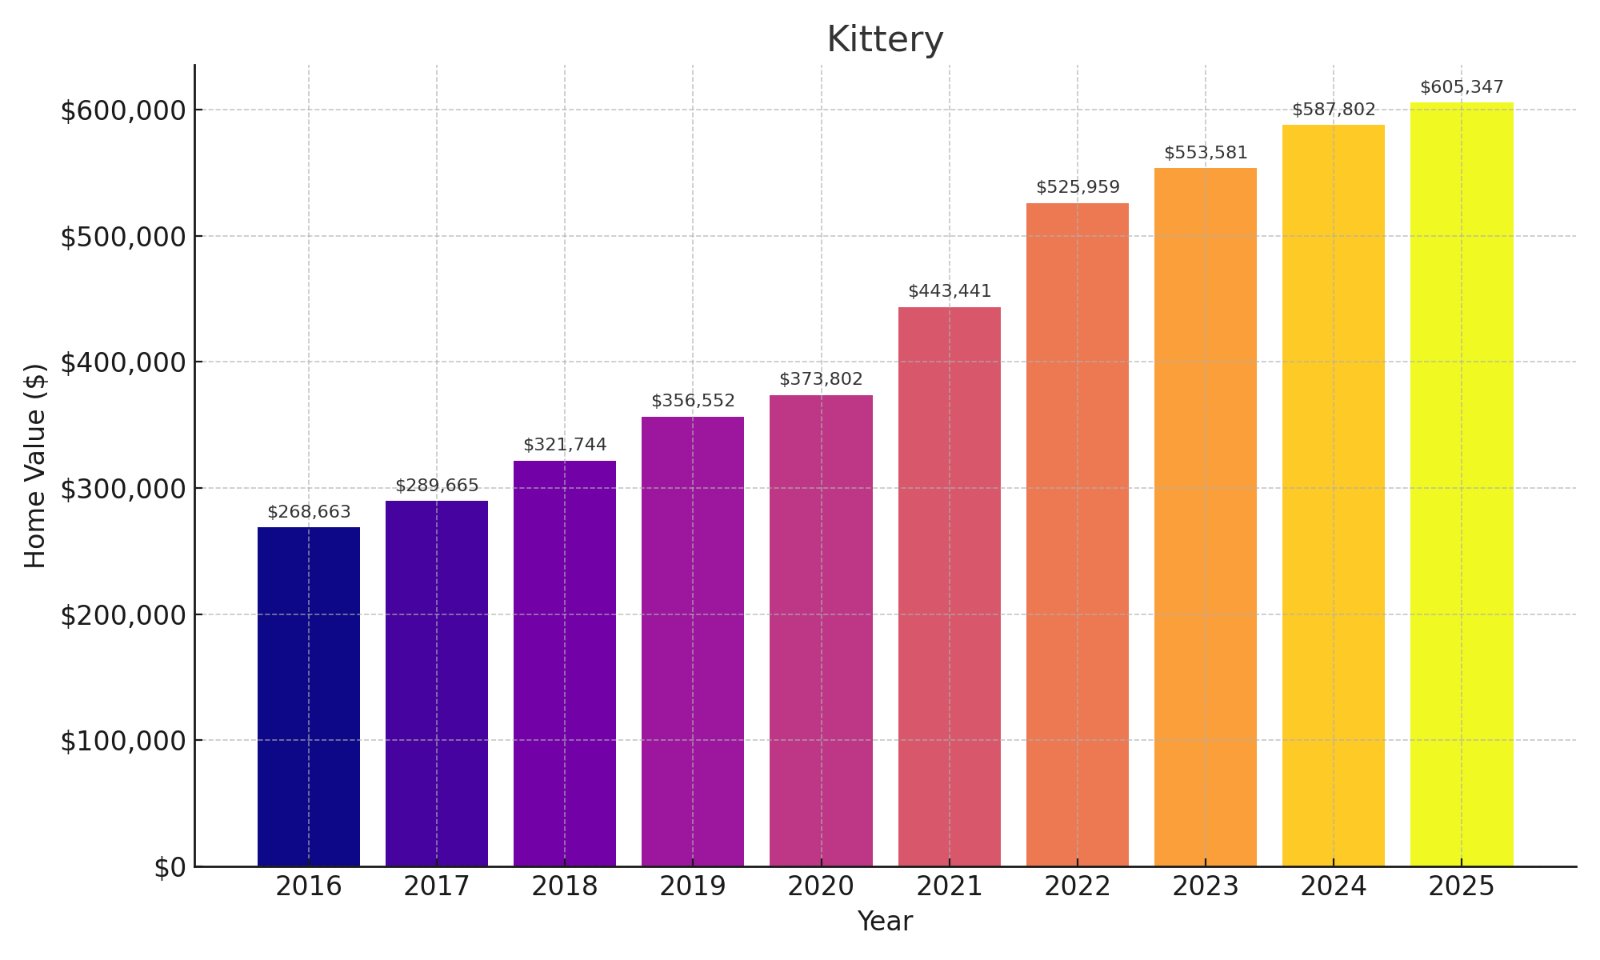
- % change from 2016 to 2025: 125.32%
- 2025: $605,347
- 2024: $587,802
- 2023: $553,581
- 2022: $525,959
- 2021: $443,441
- 2020: $373,802
- 2019: $356,552
- 2018: $321,744
- 2017: $289,665
- 2016: $268,663
Your capital in Kittery would have more than doubled, generating extraordinary returns exceeding $336,000 in equity growth. The strategic location at Maine’s southern gateway, combined with outlet shopping and proximity to Portsmouth, NH, drives continued demand in this border town. For buyers, the strong appreciation trend suggests continued upside despite rising prices, while sellers benefit from Kittery’s unique position offering Maine lifestyle with convenient access to New Hampshire’s tax advantages.
3. Nasons Corner

- % change from 2016 to 2025: 126.15%
- 2025: $501,917
- 2024: $483,863
- 2023: $437,026
- 2022: $400,976
- 2021: $345,690
- 2020: $298,166
- 2019: $283,104
- 2018: $264,720
- 2017: $243,054
- 2016: $221,942
Your investment in Nasons Corner would have more than doubled, yielding approximately $280,000 in wealth creation over nine years. The neighborhood’s exceptional performance accelerated dramatically after 2020, with values jumping over $47,000 in a single year (2020-2021). For buyers, the continued strong appreciation combined with prices still below many Portland neighborhoods creates compelling value, while sellers benefit from Nasons Corner’s emergence as a desirable alternative in western Portland’s evolving real estate landscape.
2. Deering Center

- % change from 2016 to 2025: 126.25%
- 2025: $606,597
- 2024: $583,212
- 2023: $523,726
- 2022: $479,805
- 2021: $410,505
- 2020: $355,594
- 2019: $341,056
- 2018: $316,990
- 2017: $293,775
- 2016: $268,114
Your capital in Deering Center would have more than doubled, generating exceptional returns of almost $339,000 in equity growth. The neighborhood’s stunning performance accelerated dramatically after 2020, with values jumping nearly $55,000 in a single year (2020-2021). The combination of historic homes, tree-lined streets, and proximity to top schools creates enduring appeal in this central Portland district, maintaining a strong seller’s advantage while offering buyers proven appreciation potential despite rising entry costs.
1. East Deering

🔥 Would you like to save this?
- % change from 2016 to 2025: 135.09%
- 2025: $463,029
- 2024: $445,471
- 2023: $405,346
- 2022: $369,655
- 2021: $318,347
- 2020: $267,783
- 2019: $256,504
- 2018: $241,656
- 2017: $220,640
- 2016: $196,956
Your investment in East Deering would have delivered exceptional returns, with property values more than doubling and generating over $266,000 in wealth creation. This waterfront peninsula neighborhood has transformed from hidden gem to investment powerhouse, with values accelerating dramatically after 2020. The combination of water views, relative affordability, and proximity to downtown Portland creates a compelling value proposition that continues driving demand, maintaining East Deering’s position as Maine’s top-performing neighborhood for appreciation.