Would you like to save this?
Texas might still have pockets of affordability, but in dozens of towns across the state, the average home price now rivals what you’d expect in L.A. or Miami. According to the Zillow Home Value Index, housing values in some Texas communities have soared over the past 15 years—fueled by high-end development, limited supply, and a growing wave of out-of-state buyers. From lakeside retreats in the Hill Country to luxury suburbs near Dallas and Houston, these are the 33 most expensive places to own a home in Texas today.
33. Bergheim – 76% Home Price Increase Since 2017
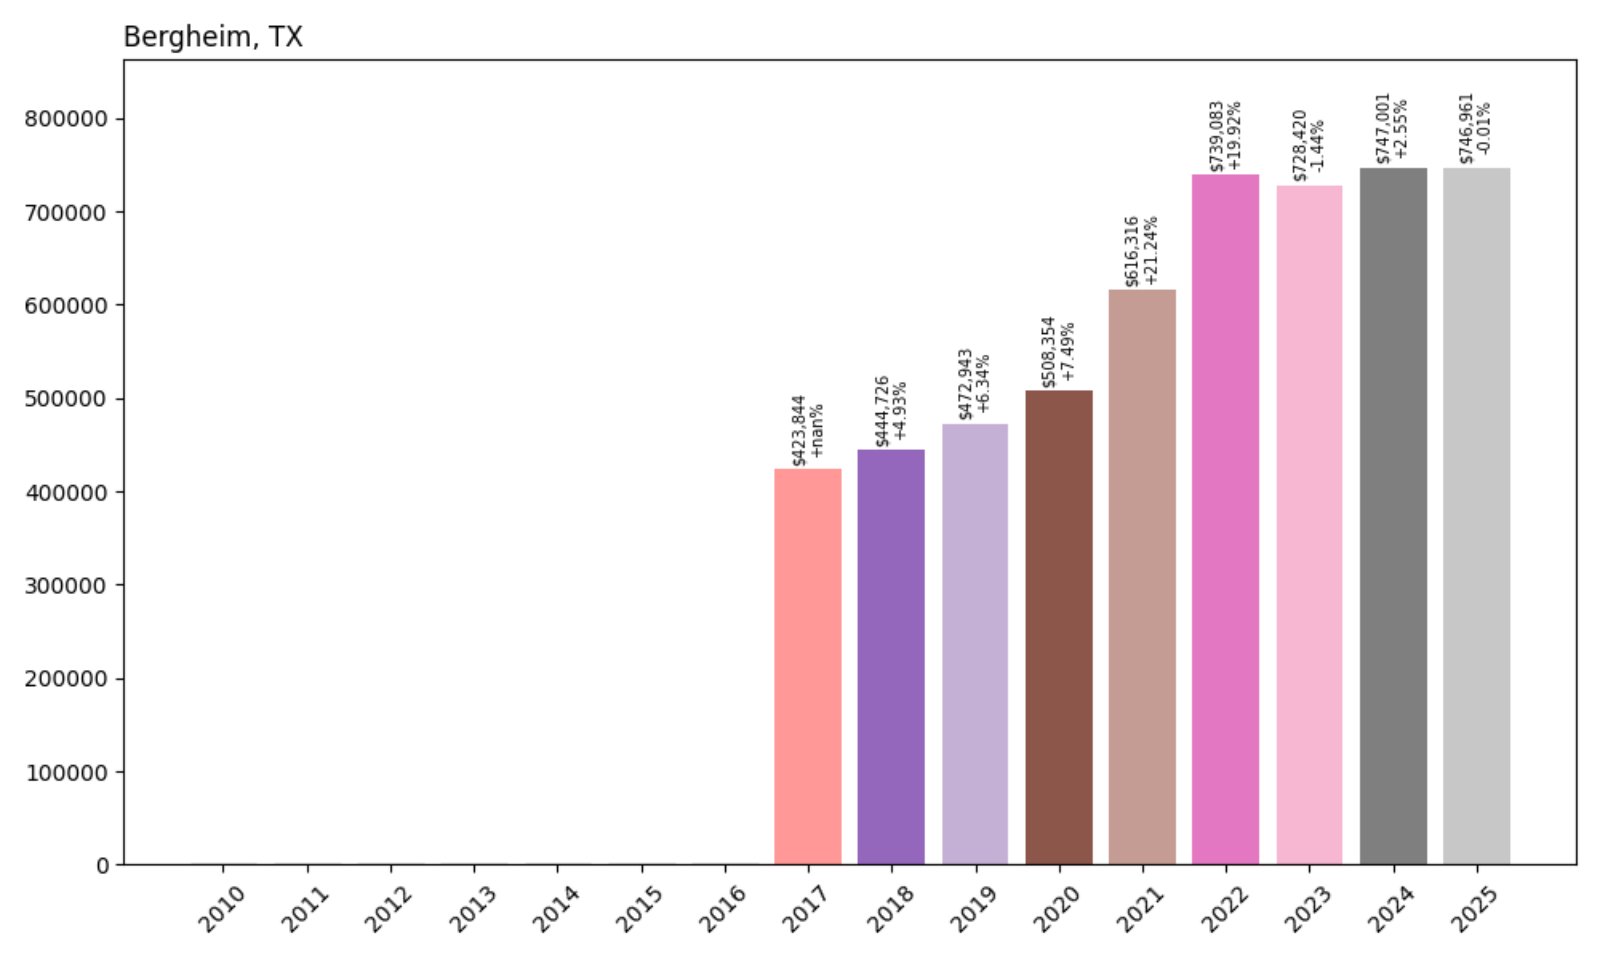
- 2017: $423,844
- 2018: $444,726 (+$20,882, +4.93% from previous year)
- 2019: $472,943 (+$28,217, +6.34% from previous year)
- 2020: $508,354 (+$35,411, +7.49% from previous year)
- 2021: $616,316 (+$107,962, +21.24% from previous year)
- 2022: $739,083 (+$122,767, +19.92% from previous year)
- 2023: $728,420 (−$10,663, −1.44% from previous year)
- 2024: $747,001 (+$18,581, +2.55% from previous year)
- 2025: $746,961 (−$39, −0.01% from previous year)
Home values in Bergheim have surged 76% since 2017, with particularly strong growth between 2020 and 2022. The market cooled slightly after peaking in 2022, with modest declines in 2023 and 2025. Despite this softening, the town remains one of the most expensive in Texas in 2025.
Bergheim – High Growth Amid Hill Country Appeal
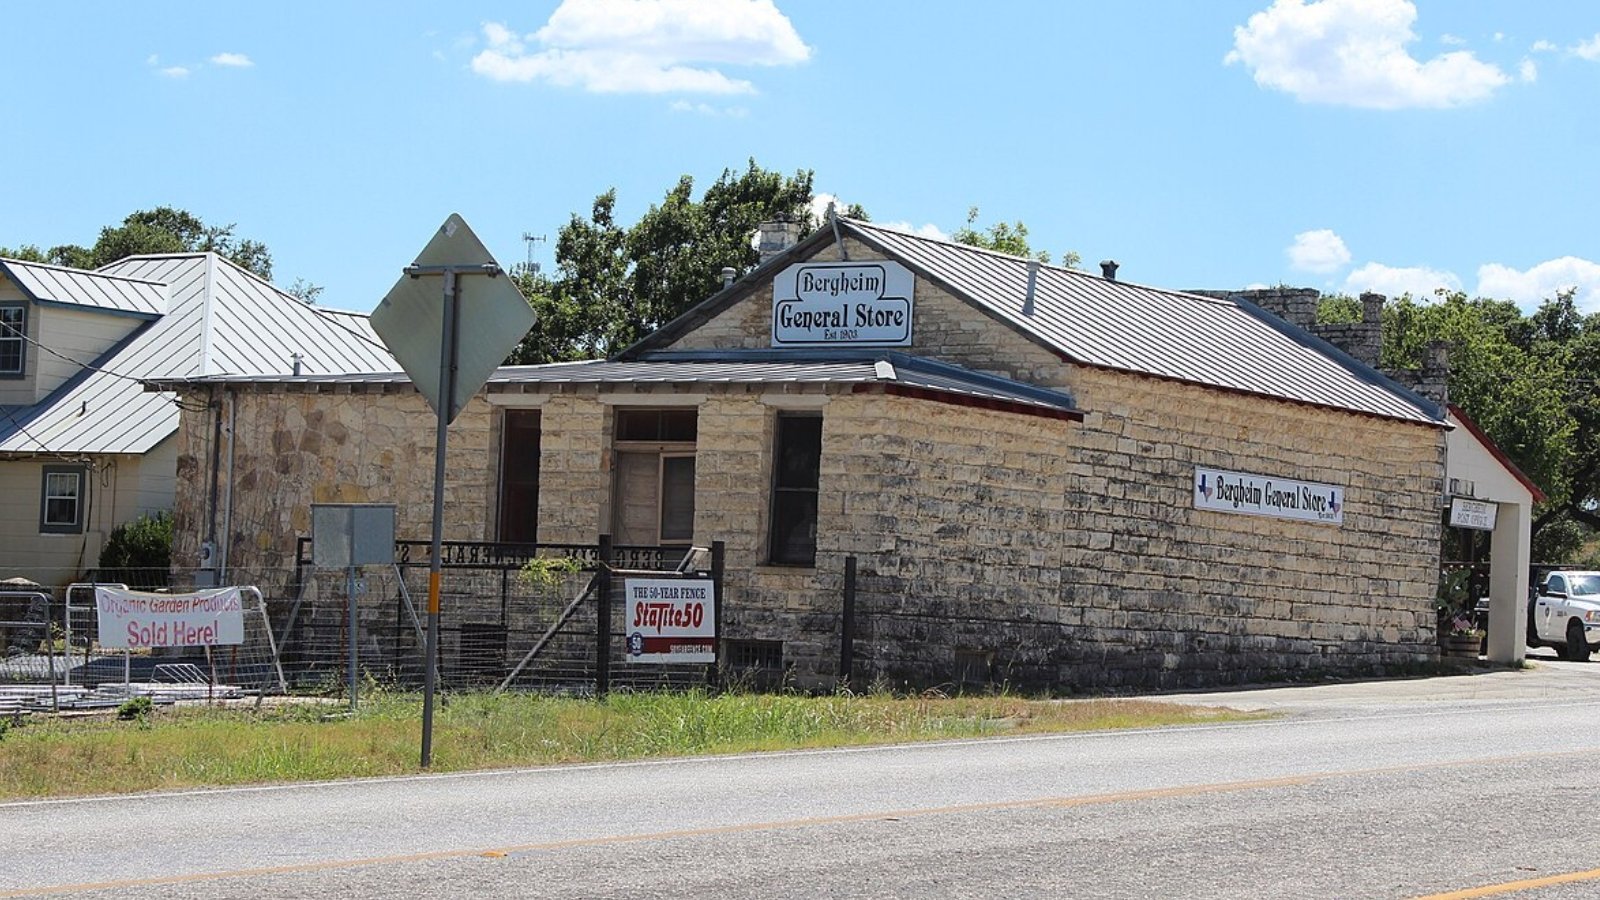
Bergheim sits in Kendall County, about 30 miles northwest of San Antonio. Though it remains unincorporated, its rustic charm, scenic surroundings, and proximity to the Texas Hill Country make it attractive for affluent buyers seeking space and privacy.
The area saw substantial growth during the pandemic-fueled housing boom, likely driven by demand for rural luxury and second homes. While prices have stabilized, limited housing inventory and continued interest in the Hill Country lifestyle keep Bergheim on the map as a high-value market.
32. Horseshoe Bay – 119% Home Price Increase Since 2010
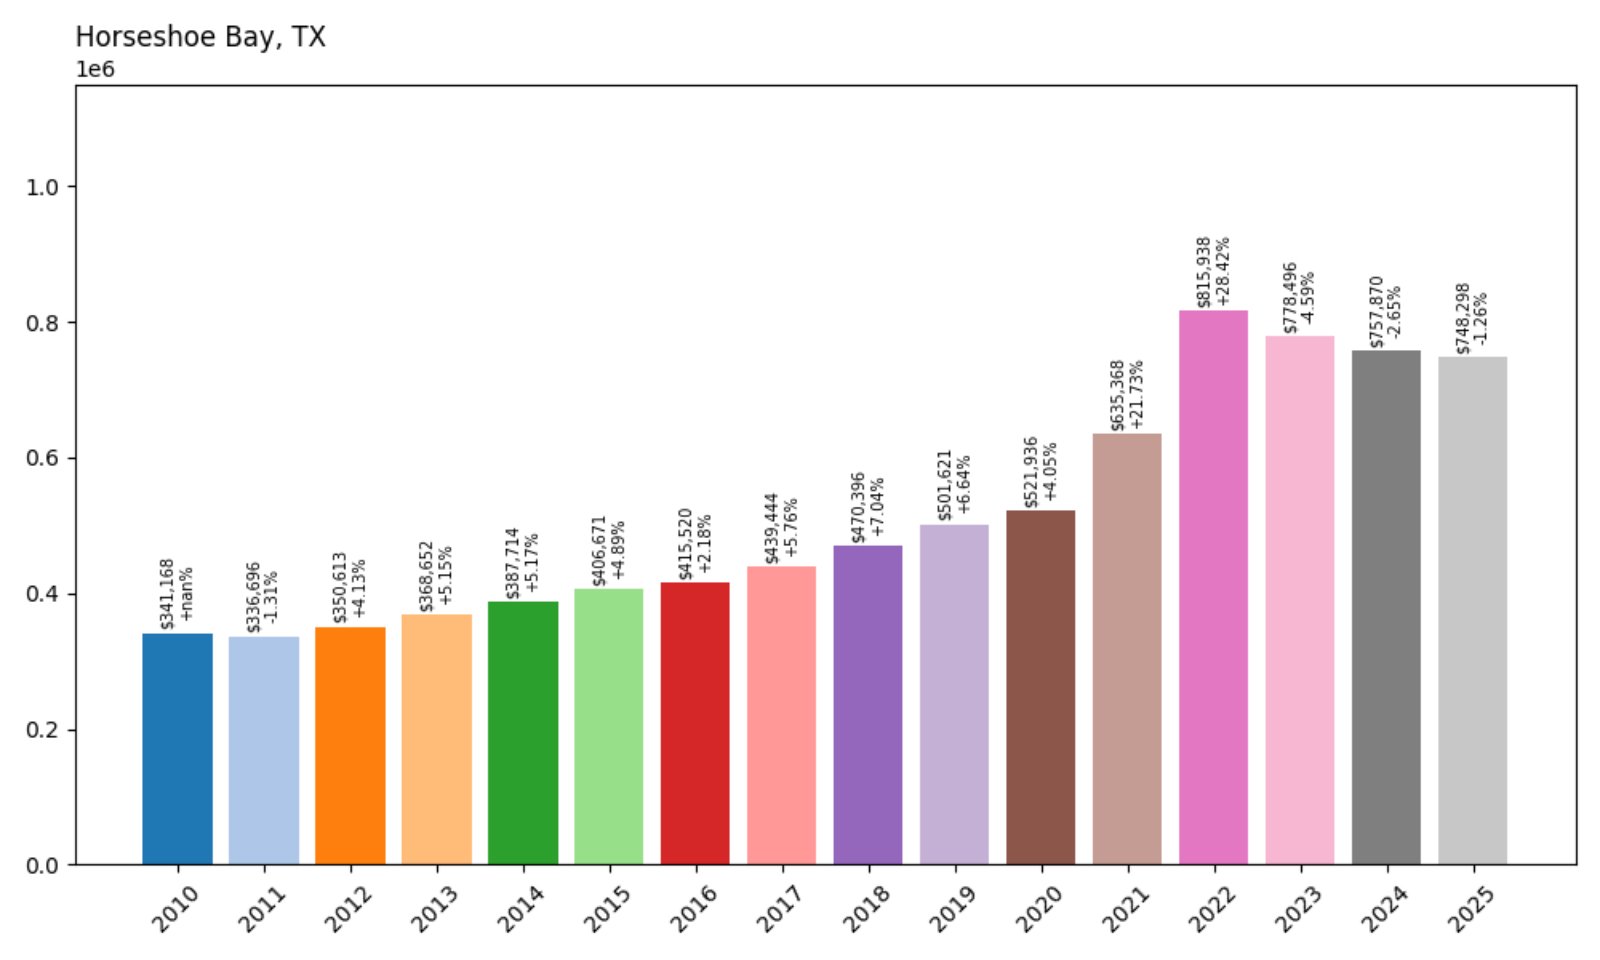
- 2010: $341,168
- 2011: $336,696 (−$4,472, −1.31% from previous year)
- 2012: $350,613 (+$13,917, +4.13% from previous year)
- 2013: $368,652 (+$18,039, +5.15% from previous year)
- 2014: $387,714 (+$19,062, +5.17% from previous year)
- 2015: $406,671 (+$18,957, +4.89% from previous year)
- 2016: $415,520 (+$8,850, +2.18% from previous year)
- 2017: $439,444 (+$23,923, +5.76% from previous year)
- 2018: $470,396 (+$30,952, +7.04% from previous year)
- 2019: $501,621 (+$31,224, +6.64% from previous year)
- 2020: $521,936 (+$20,315, +4.05% from previous year)
- 2021: $635,368 (+$113,432, +21.73% from previous year)
- 2022: $815,938 (+$180,570, +28.42% from previous year)
- 2023: $778,496 (−$37,442, −4.59% from previous year)
- 2024: $757,870 (−$20,625, −2.65% from previous year)
- 2025: $748,298 (−$9,573, −1.26% from previous year)
Home prices in Horseshoe Bay more than doubled since 2010, reaching a peak in 2022 before seeing modest declines in the following years. The town remains a premium lakeside destination despite recent softening.
Horseshoe Bay – Lakefront Luxury at a Premium
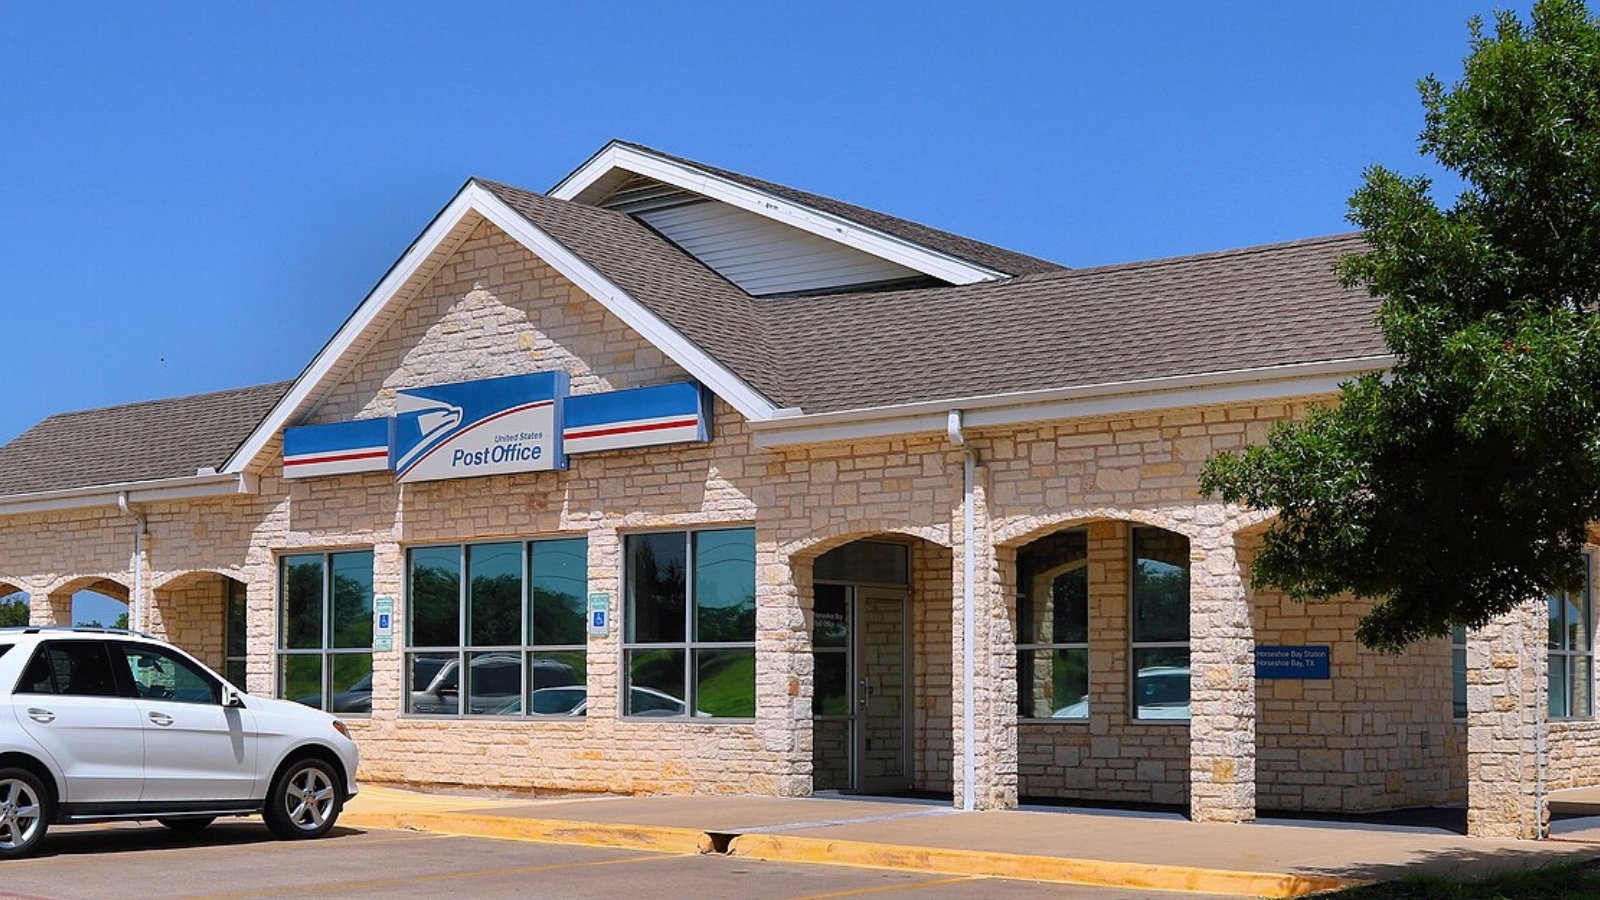
Located on Lake LBJ, Horseshoe Bay is a master-planned resort community known for its upscale amenities, golf courses, and waterfront homes. The town’s rapid growth from 2020 to 2022 coincided with heightened demand for remote work destinations and vacation properties.
While price growth has slowed since its 2022 peak, Horseshoe Bay continues to attract buyers looking for luxury and recreation. Its scenic location in Llano and Burnet counties and access to Austin within 90 minutes help support its high property values.
31. Lakeway – 97% Home Price Increase Since 2010
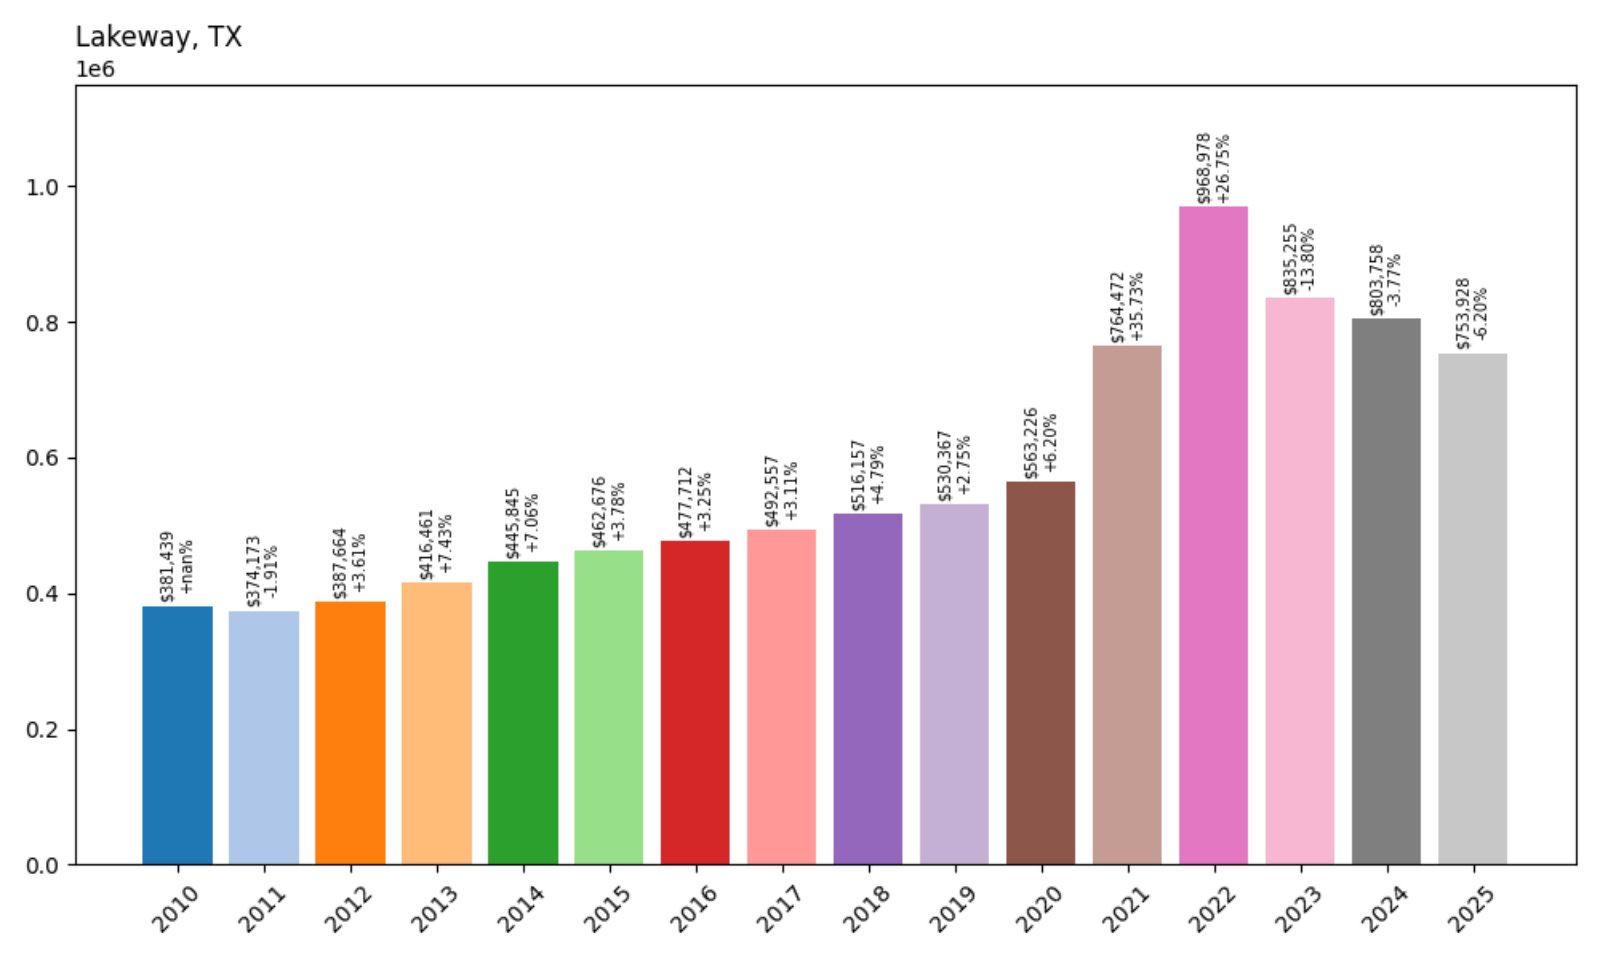
- 2010: $381,439
- 2011: $374,173 (−$7,267, −1.91% from previous year)
- 2012: $387,664 (+$13,492, +3.61% from previous year)
- 2013: $416,461 (+$28,797, +7.43% from previous year)
- 2014: $445,845 (+$29,383, +7.06% from previous year)
- 2015: $462,676 (+$16,831, +3.78% from previous year)
- 2016: $477,712 (+$15,037, +3.25% from previous year)
- 2017: $492,557 (+$14,845, +3.11% from previous year)
- 2018: $516,157 (+$23,599, +4.79% from previous year)
- 2019: $530,367 (+$14,210, +2.75% from previous year)
- 2020: $563,226 (+$32,859, +6.20% from previous year)
- 2021: $764,472 (+$201,246, +35.73% from previous year)
- 2022: $968,978 (+$204,506, +26.75% from previous year)
- 2023: $835,255 (−$133,723, −13.80% from previous year)
- 2024: $803,758 (−$31,497, −3.77% from previous year)
- 2025: $753,928 (−$49,830, −6.20% from previous year)
Lakeway’s home values nearly doubled since 2010, with steep gains during the pandemic years. Since 2022, prices have declined, though they remain among the highest in the state.
Lakeway – Scenic Living with Proximity to Austin
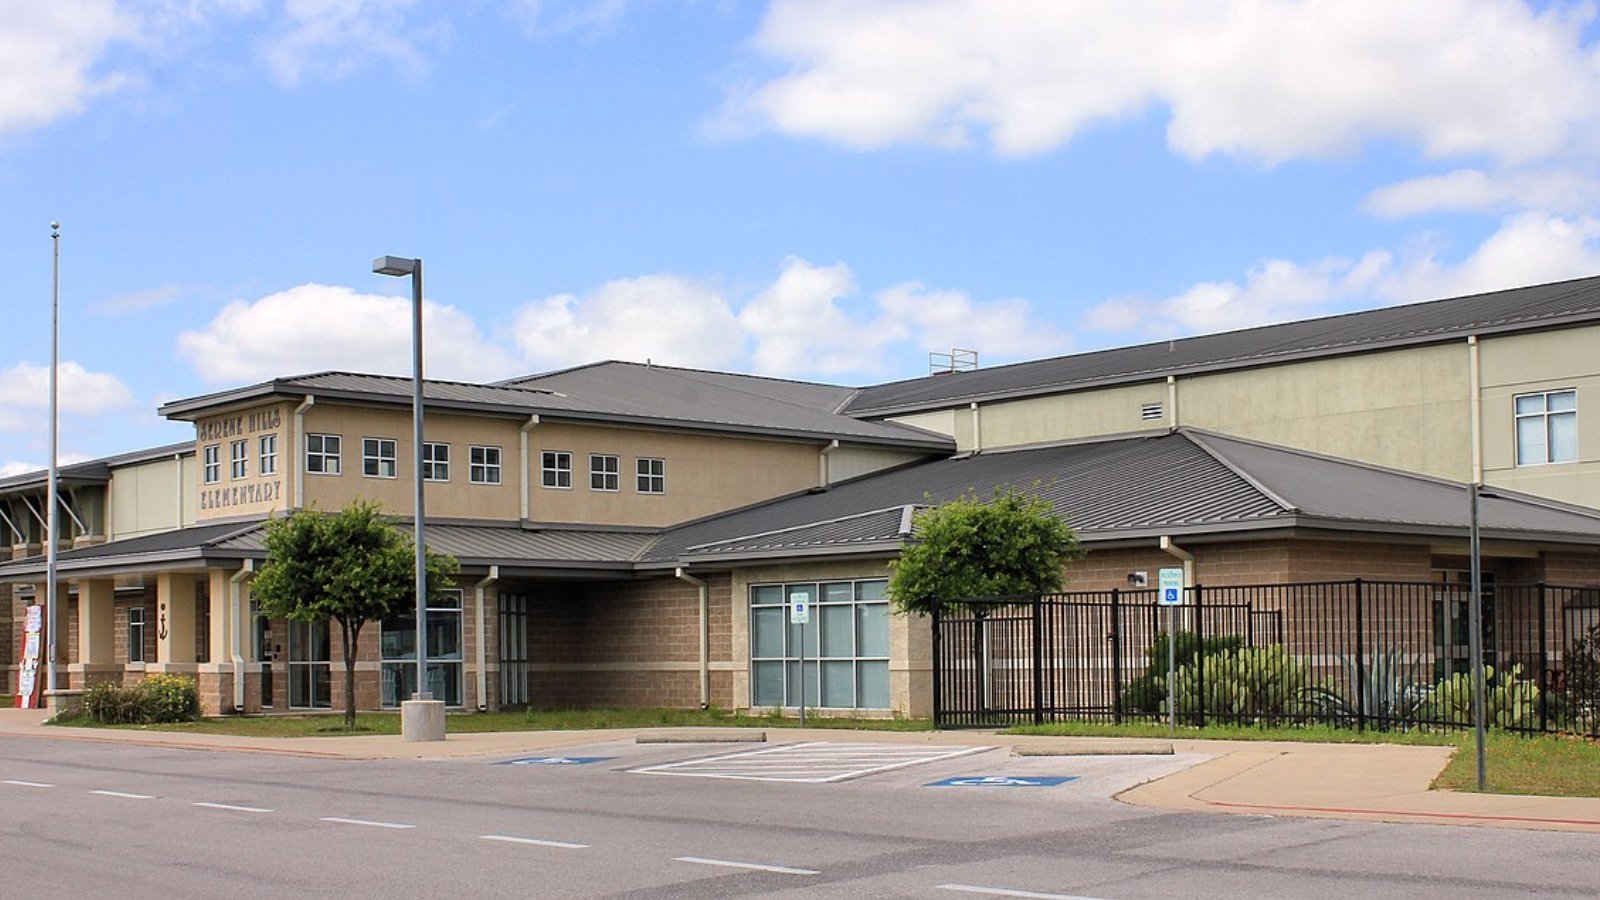
Just 25 miles west of downtown Austin, Lakeway offers rolling hills, golf communities, and views of Lake Travis. These features have helped attract affluent homebuyers, especially during the Austin tech boom of the early 2020s.
The post-pandemic housing correction has brought prices down from their peak, but Lakeway’s strong infrastructure, schools, and recreational access help maintain its status as a top-tier Texas housing market.
30. Annetta North – 2.17% Home Price Decrease Since 2024
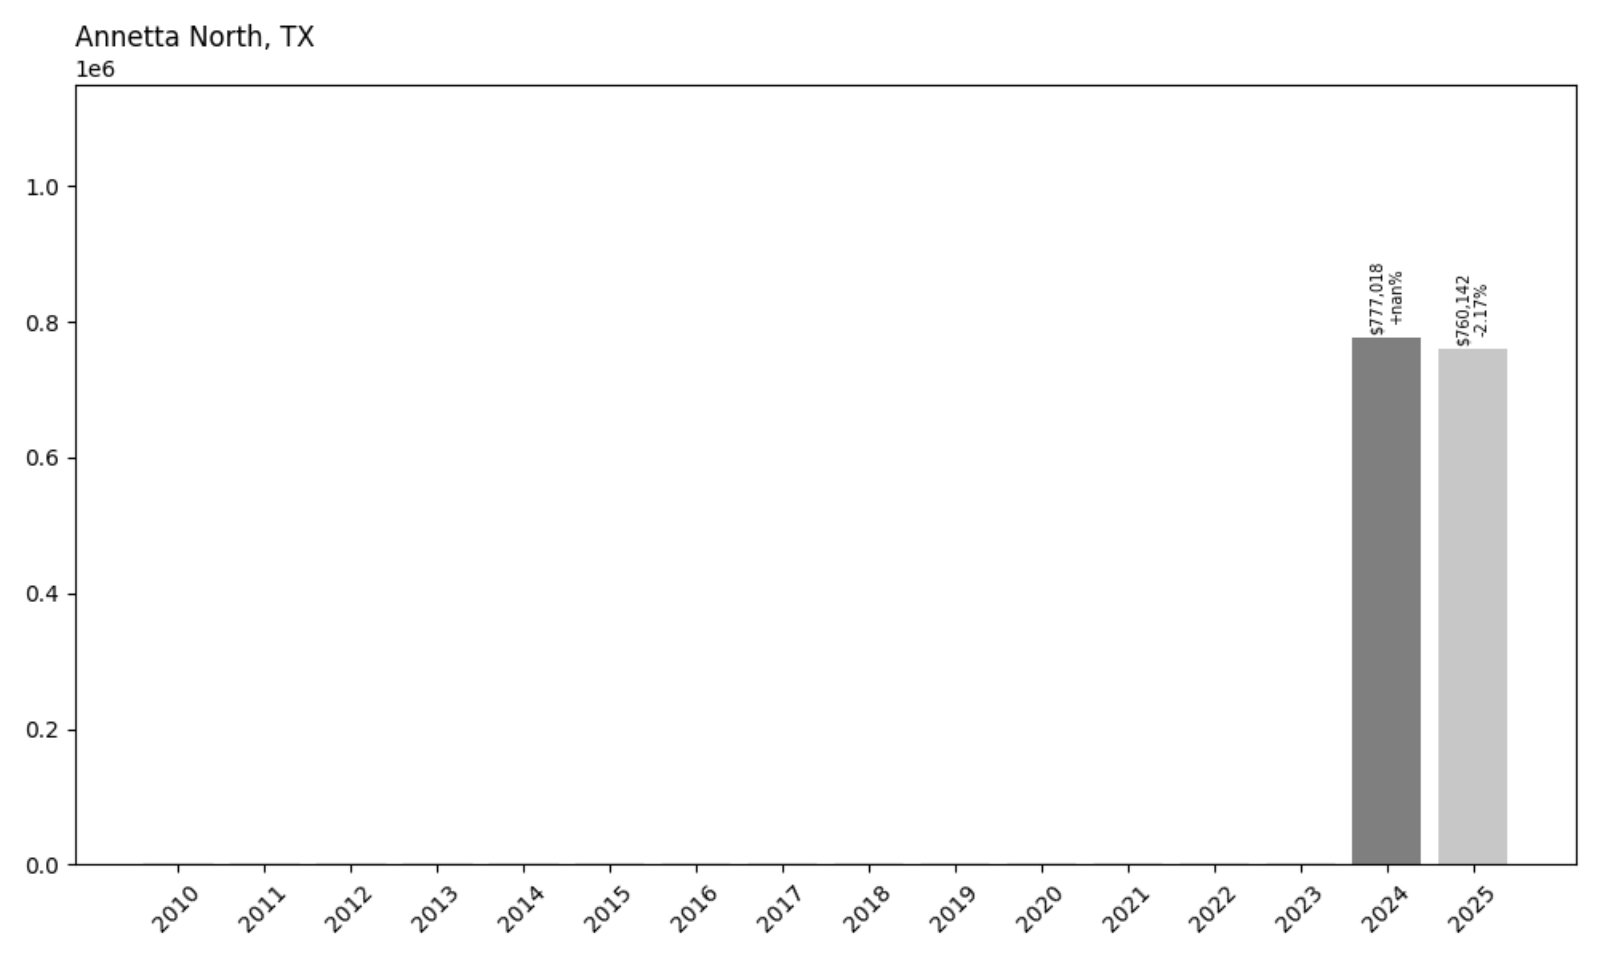
- 2024: $777,018
- 2025: $760,142 (−$16,875, −2.17% from previous year)
Limited historical data is available for Annetta North, but from 2024 to 2025, prices declined by just over 2%. Despite this dip, home values remain among the highest in Texas.
Annetta North – A Small Town with Big Numbers
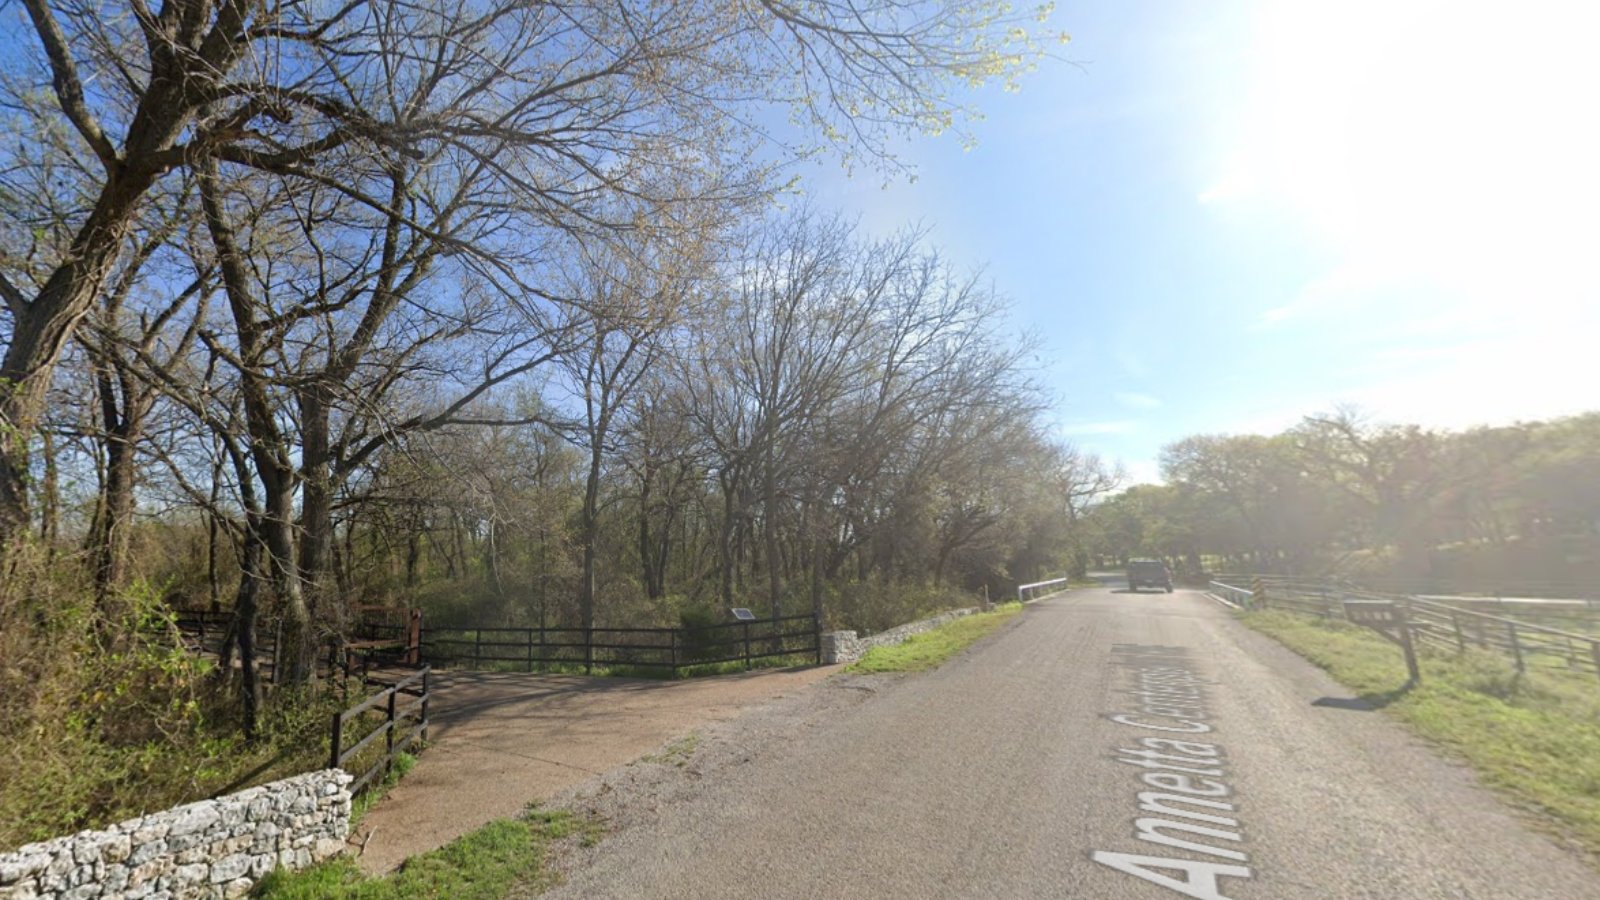
Annetta North is a quiet residential community in Parker County, west of Fort Worth. Known for its large lots and semi-rural charm, it’s popular with buyers looking for privacy and custom-built homes in a tranquil setting.
The limited housing stock and desirable location contribute to its high average home values. As suburban growth continues westward from Fort Worth, Annetta North is likely to remain a high-value area even if prices fluctuate slightly year to year.
29. Kendalia – 126% Home Price Increase Since 2012
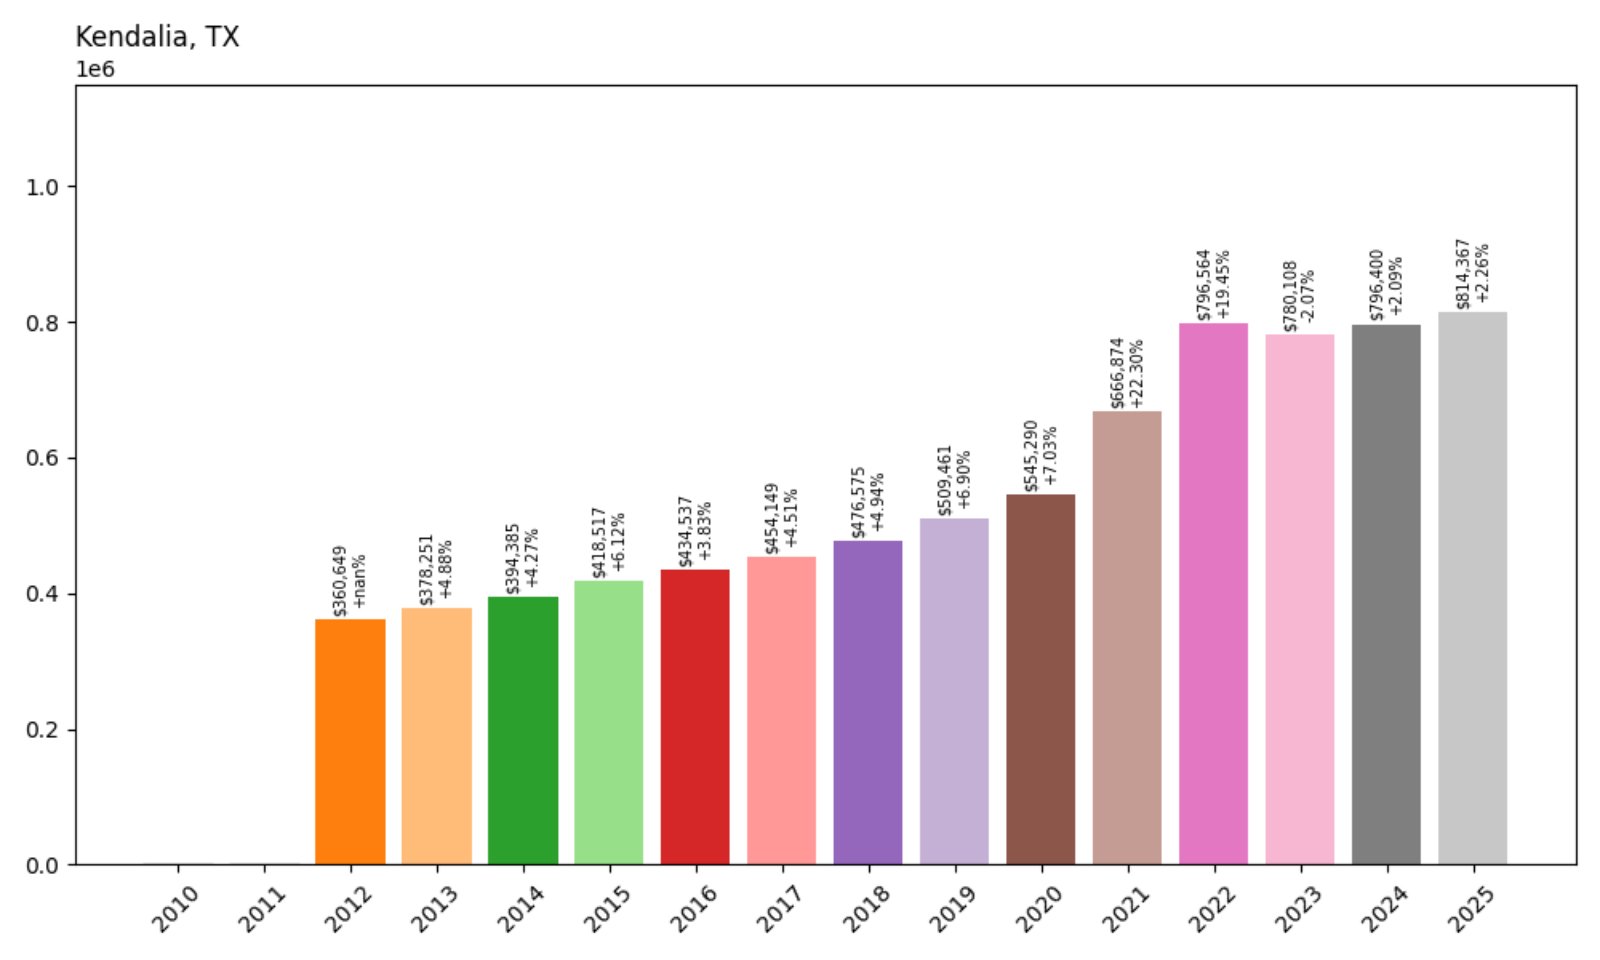
- 2012: $360,649
- 2013: $378,251 (+$17,602, +4.88% from previous year)
- 2014: $394,385 (+$16,134, +4.27% from previous year)
- 2015: $418,517 (+$24,132, +6.12% from previous year)
- 2016: $434,537 (+$16,021, +3.83% from previous year)
- 2017: $454,149 (+$19,612, +4.51% from previous year)
- 2018: $476,575 (+$22,426, +4.94% from previous year)
- 2019: $509,461 (+$32,885, +6.90% from previous year)
- 2020: $545,290 (+$35,829, +7.03% from previous year)
- 2021: $666,874 (+$121,585, +22.30% from previous year)
- 2022: $796,564 (+$129,690, +19.45% from previous year)
- 2023: $780,108 (−$16,457, −2.07% from previous year)
- 2024: $796,400 (+$16,292, +2.09% from previous year)
- 2025: $814,367 (+$17,967, +2.26% from previous year)
Kendalia has experienced a 126% increase in home prices since 2012, driven by consistent year-over-year growth with brief dips. The town continues to maintain upward momentum through 2025.
Kendalia – Growth in the Heart of Hill Country
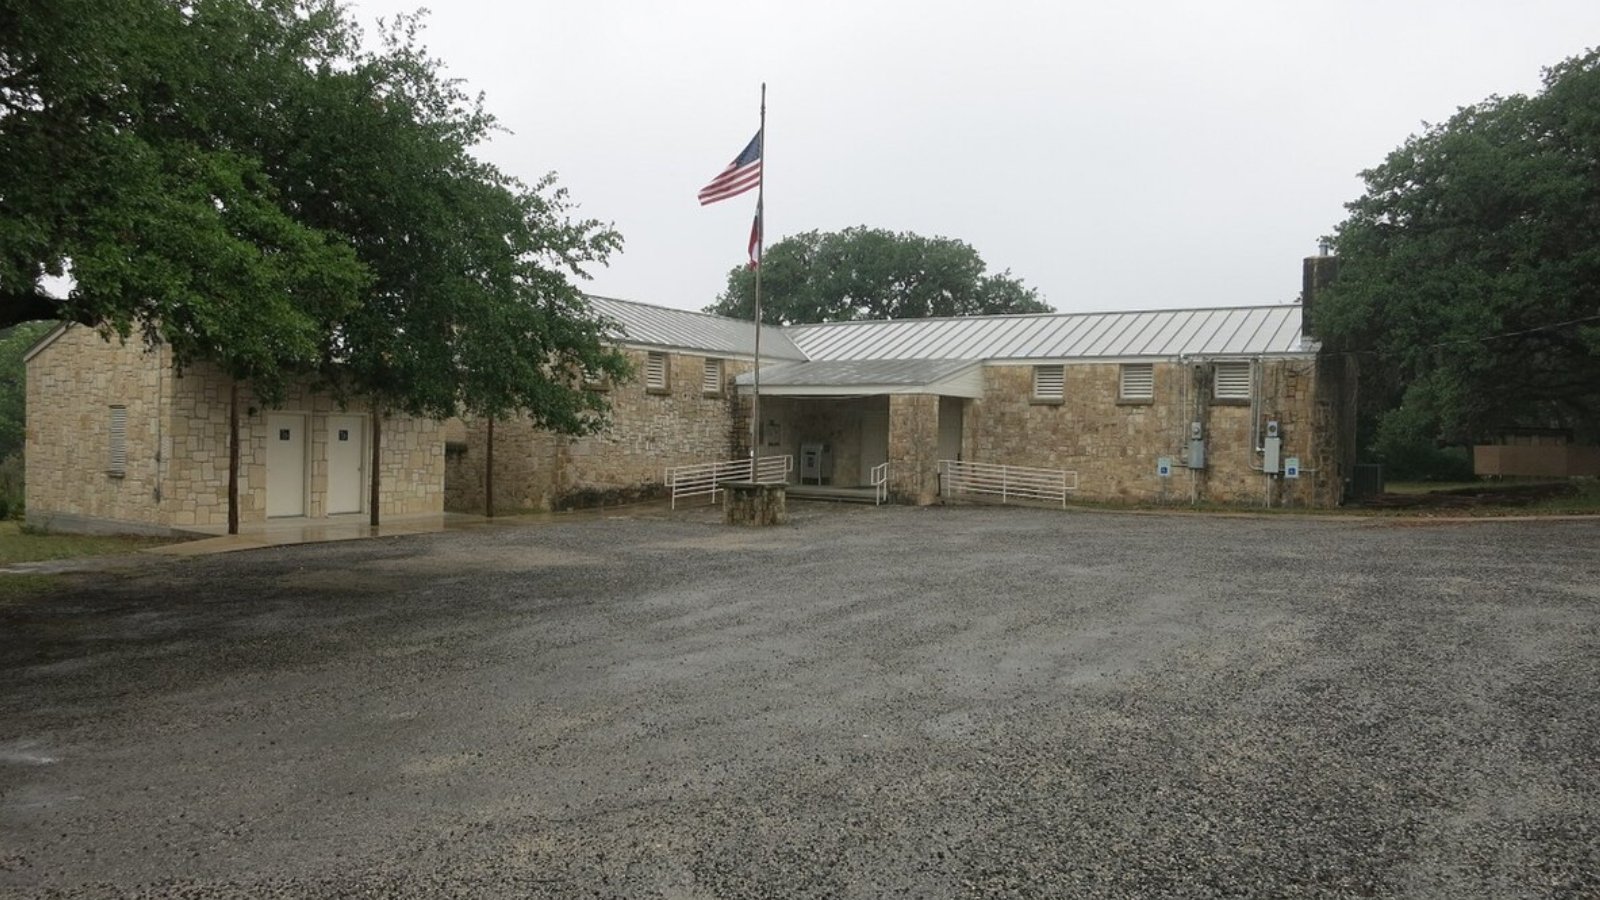
Kendalia, located in Kendall County near Boerne, offers a rural lifestyle with easy access to major cities like San Antonio and Austin. Its appeal lies in its open landscapes, peaceful surroundings, and growing interest from buyers looking for country living with proximity to metro amenities.
Large parcels of land and scenic hilltop properties have helped boost values. As demand for semi-rural luxury continues, Kendalia’s home prices are likely to remain strong.
28. Prosper – 153% Home Price Increase Since 2010
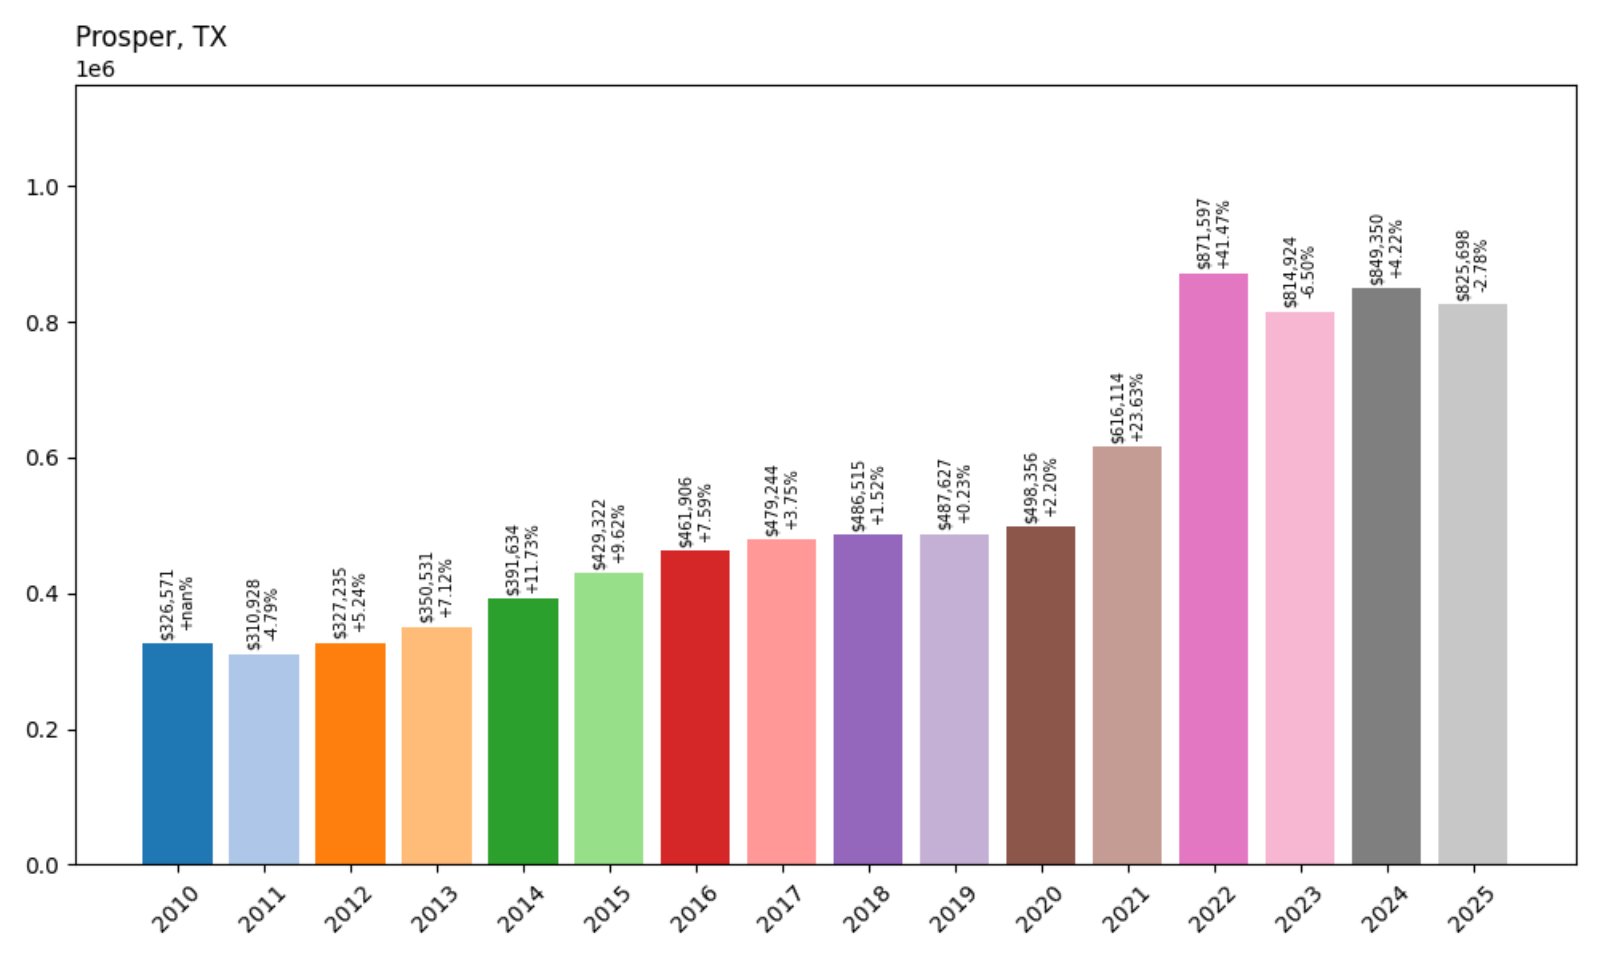
- 2010: $326,571
- 2011: $310,928 (−$15,643, −4.79% from previous year)
- 2012: $327,235 (+$16,308, +5.24% from previous year)
- 2013: $350,531 (+$23,296, +7.12% from previous year)
- 2014: $391,634 (+$41,104, +11.73% from previous year)
- 2015: $429,322 (+$37,688, +9.62% from previous year)
- 2016: $461,906 (+$32,584, +7.59% from previous year)
- 2017: $479,244 (+$17,338, +3.75% from previous year)
- 2018: $486,515 (+$7,271, +1.52% from previous year)
- 2019: $487,627 (+$1,112, +0.23% from previous year)
- 2020: $498,356 (+$10,730, +2.20% from previous year)
- 2021: $616,114 (+$117,758, +23.63% from previous year)
- 2022: $871,597 (+$255,483, +41.47% from previous year)
- 2023: $814,924 (−$56,673, −6.50% from previous year)
- 2024: $849,350 (+$34,426, +4.22% from previous year)
- 2025: $825,698 (−$23,652, −2.78% from previous year)
Prosper’s home values climbed over 150% since 2010, thanks to explosive suburban growth. While there have been some recent dips, long-term demand has kept prices high in this popular North Texas town.
Prosper – Booming Suburb with Lasting Appeal
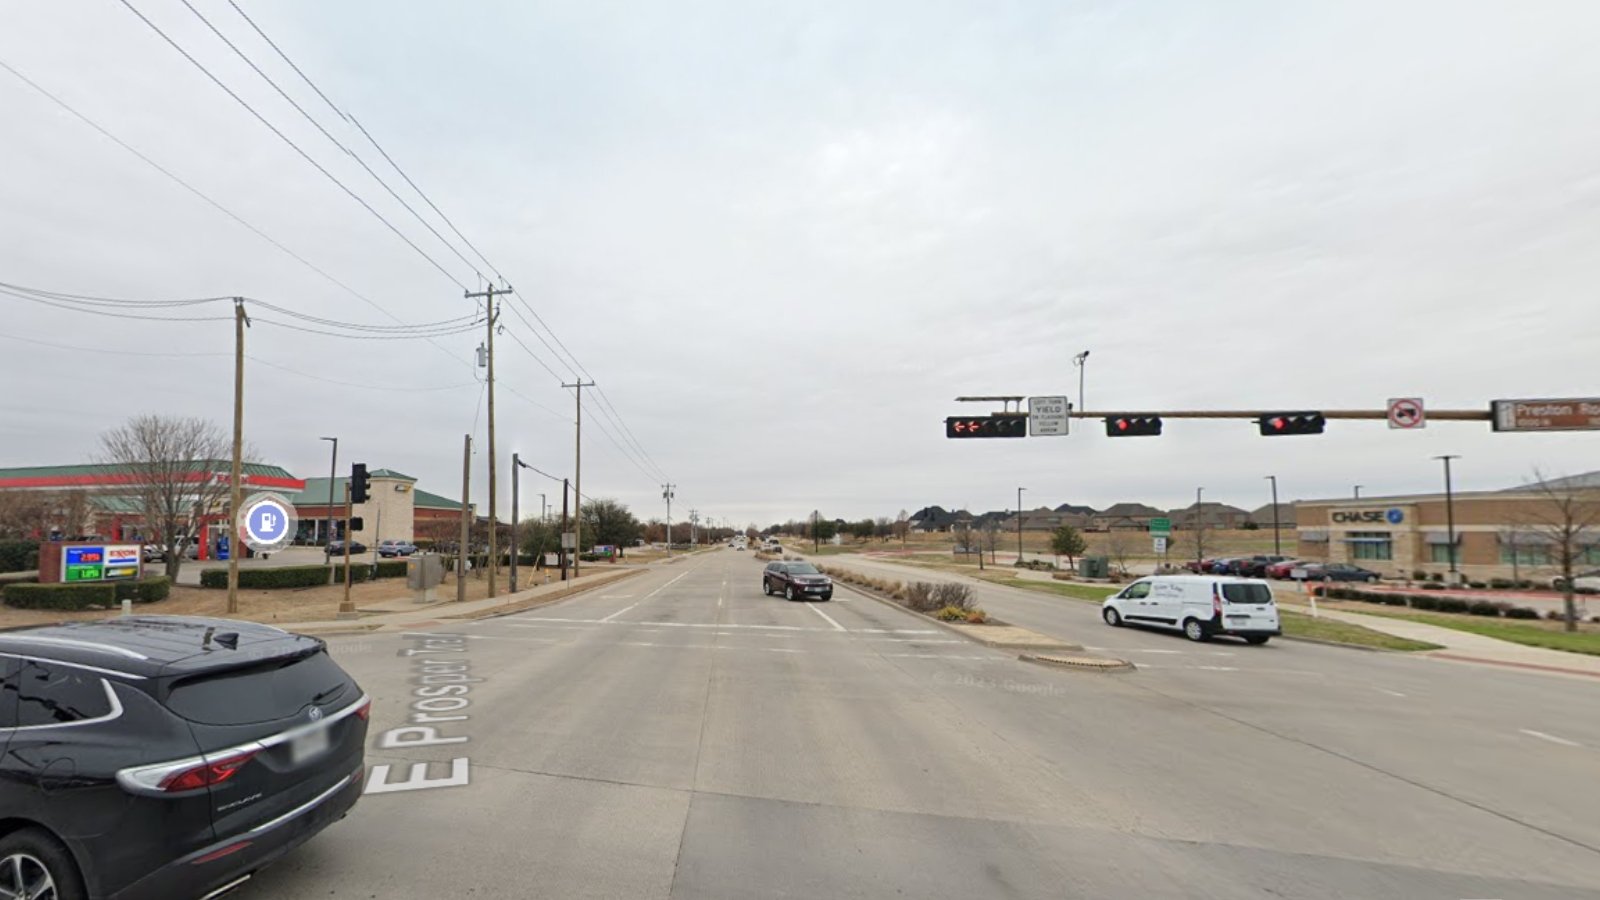
Located just north of Frisco in Collin and Denton counties, Prosper has transformed from a small farming town into a high-growth suburb with luxury developments and top-rated schools. The arrival of corporate campuses and highway expansions fueled a property surge in the early 2020s.
Even as the market cools slightly, Prosper continues to draw families and professionals looking for space, amenities, and strong community infrastructure. High-end new construction homes help support its place among Texas’s most expensive markets.
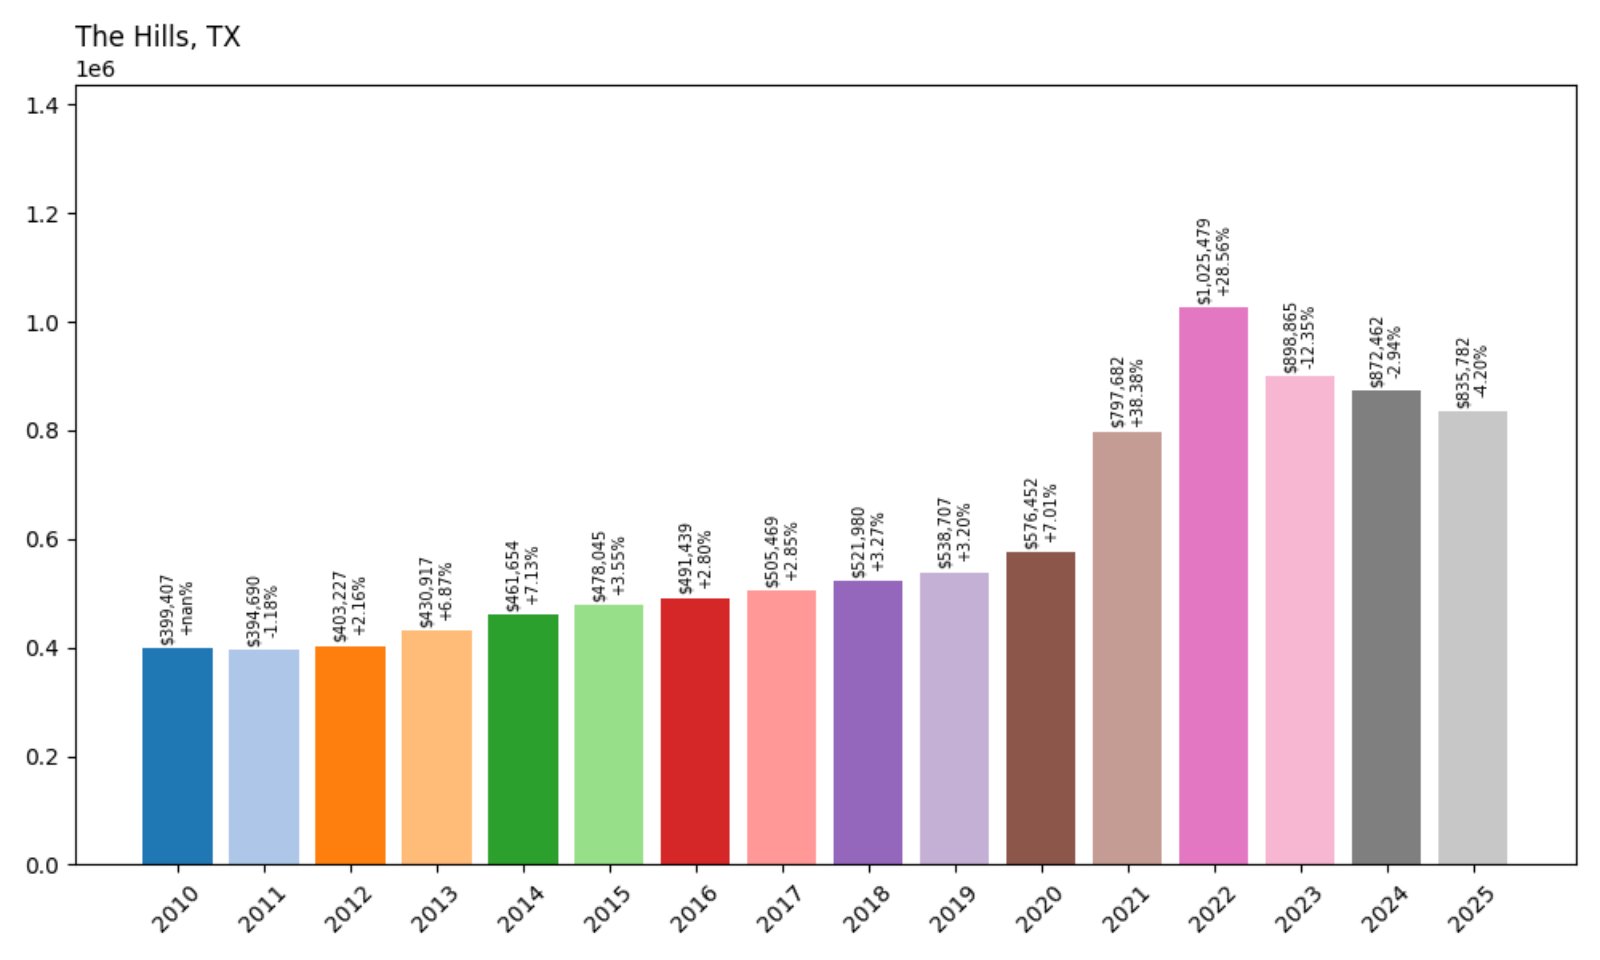
27. The Hills – 109% Home Price Increase Since 2010
Would you like to save this?
- 2010: $399,407
- 2011: $394,690 (−$4,716, −1.18% from previous year)
- 2012: $403,227 (+$8,537, +2.16% from previous year)
- 2013: $430,917 (+$27,690, +6.87% from previous year)
- 2014: $461,654 (+$30,737, +7.13% from previous year)
- 2015: $478,045 (+$16,391, +3.55% from previous year)
- 2016: $491,439 (+$13,394, +2.80% from previous year)
- 2017: $505,469 (+$14,030, +2.85% from previous year)
- 2018: $521,980 (+$16,511, +3.27% from previous year)
- 2019: $538,707 (+$16,726, +3.20% from previous year)
- 2020: $576,452 (+$37,746, +7.01% from previous year)
- 2021: $797,682 (+$221,230, +38.38% from previous year)
- 2022: $1,025,479 (+$227,797, +28.56% from previous year)
- 2023: $898,865 (−$126,614, −12.35% from previous year)
- 2024: $872,462 (−$26,403, −2.94% from previous year)
- 2025: $835,782 (−$36,681, −4.20% from previous year)
Home values in The Hills more than doubled since 2010, with rapid gains in the early 2020s. Prices peaked in 2022 and have declined moderately since, though the town still ranks among the state’s priciest.
The Hills – Lake Travis Luxury with Staying Power
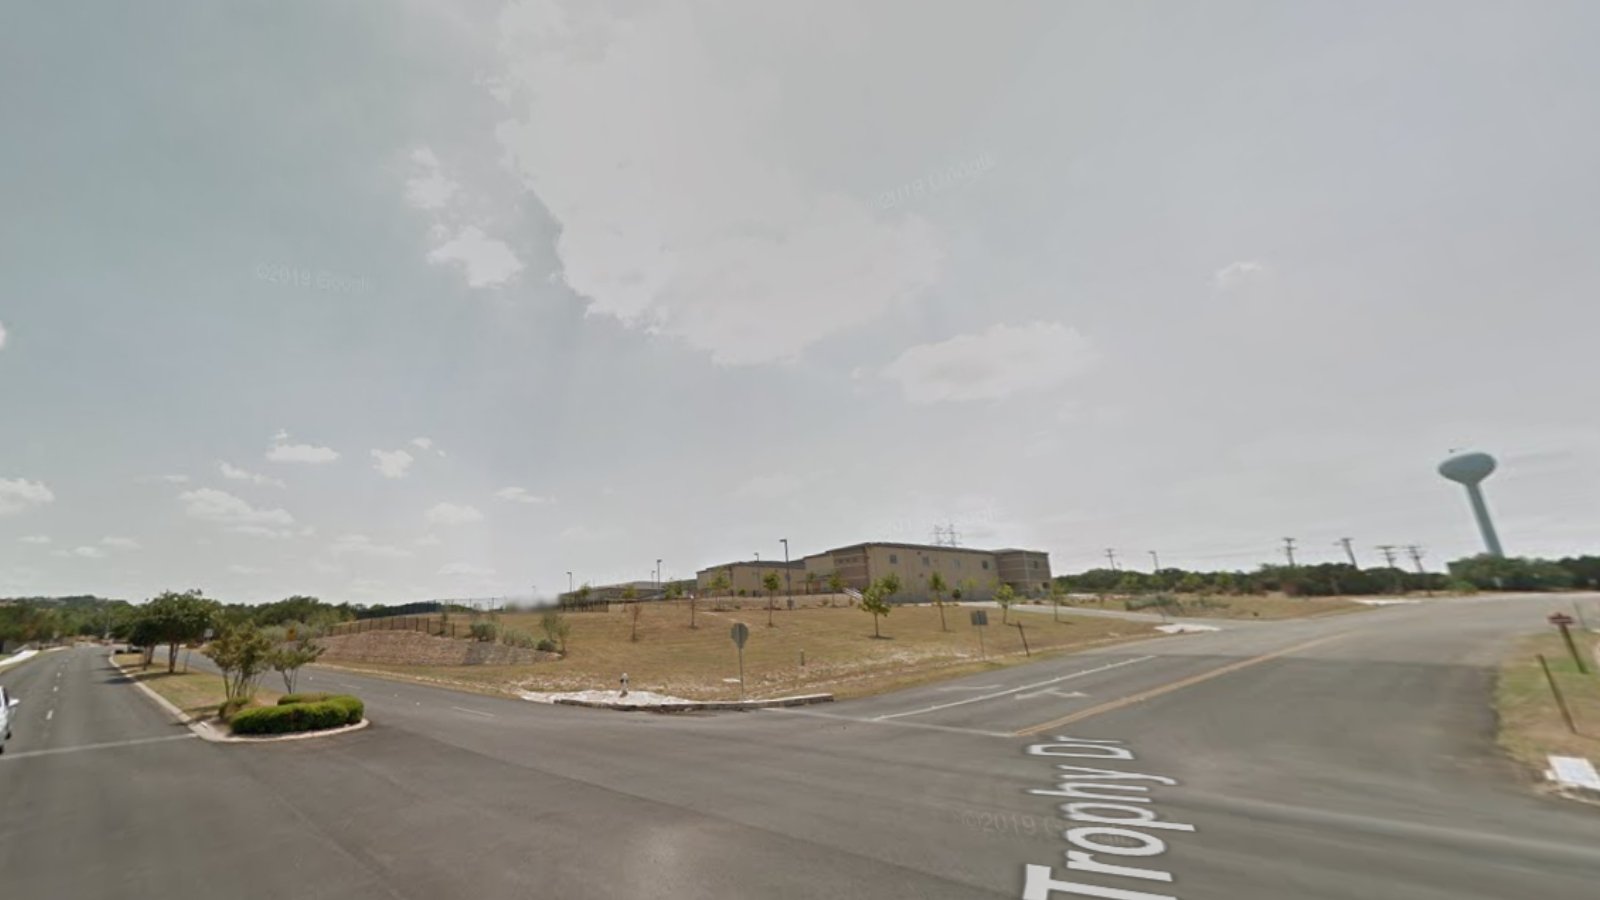
The Hills is a gated community on the south shore of Lake Travis, just outside Austin. Known for its golf courses, lake views, and exclusivity, it became a magnet for high-end buyers during the housing boom of 2020–2022.
Though values have softened, the town’s appeal remains strong. With limited inventory and demand for lakefront access, The Hills is likely to remain a premium address in Central Texas.
26. Double Oak – 147% Home Price Increase Since 2010
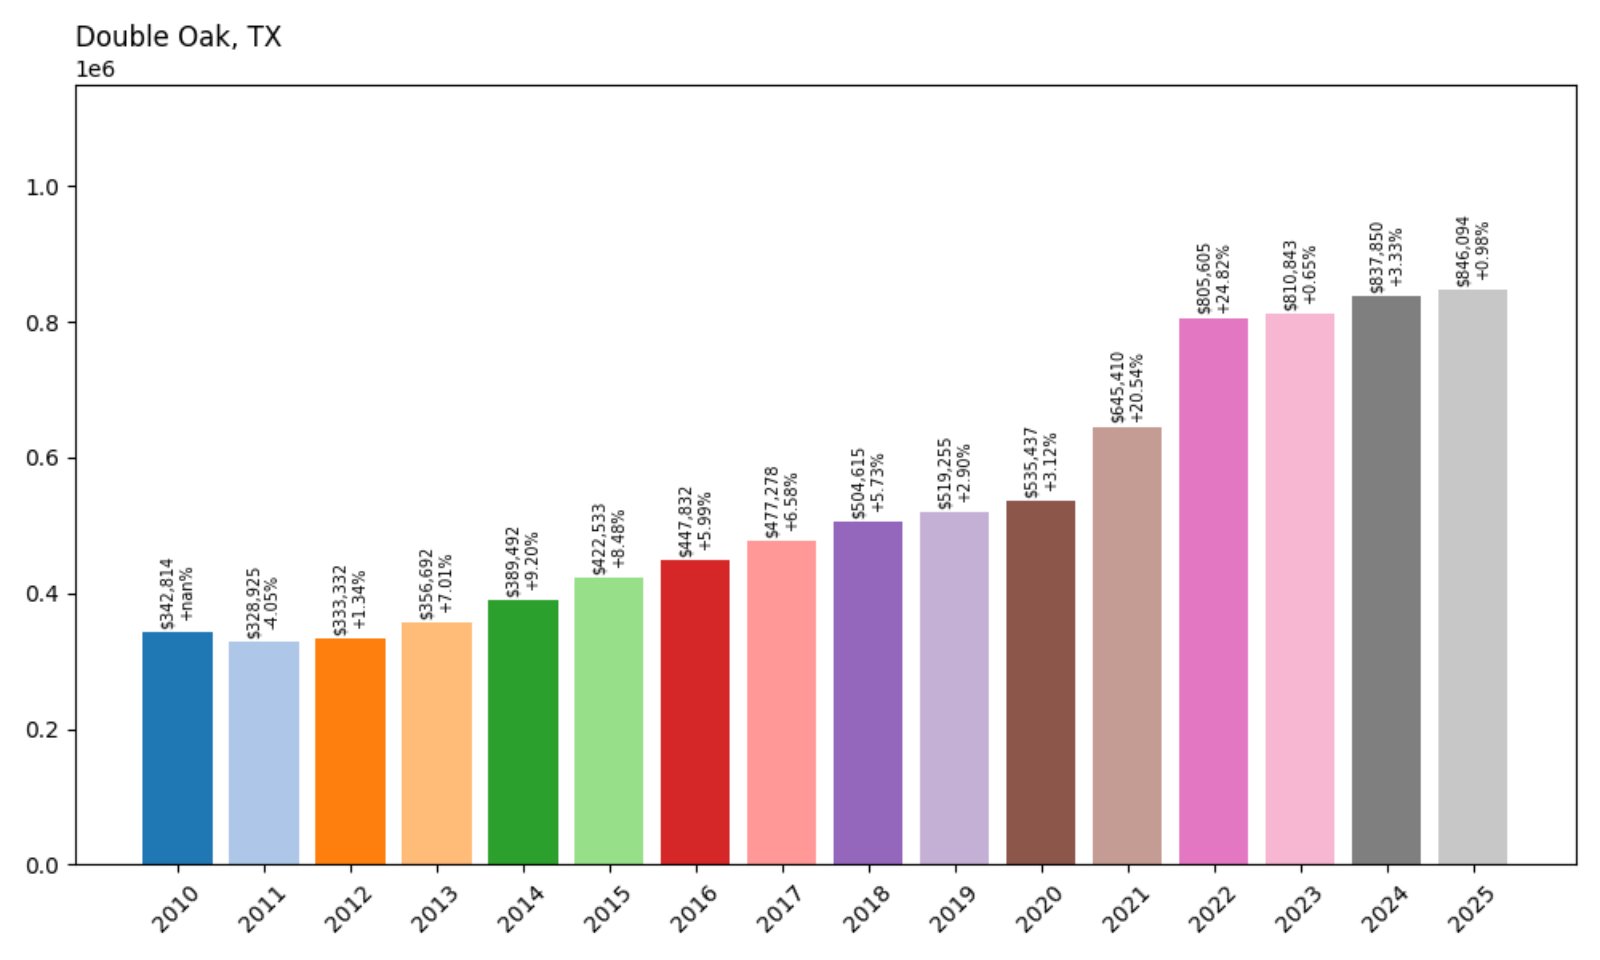
- 2010: $342,814
- 2011: $328,925 (−$13,889, −4.05% from previous year)
- 2012: $333,332 (+$4,406, +1.34% from previous year)
- 2013: $356,692 (+$23,360, +7.01% from previous year)
- 2014: $389,492 (+$32,800, +9.20% from previous year)
- 2015: $422,533 (+$33,041, +8.48% from previous year)
- 2016: $447,832 (+$25,299, +5.99% from previous year)
- 2017: $477,278 (+$29,445, +6.58% from previous year)
- 2018: $504,615 (+$27,337, +5.73% from previous year)
- 2019: $519,255 (+$14,640, +2.90% from previous year)
- 2020: $535,437 (+$16,182, +3.12% from previous year)
- 2021: $645,410 (+$109,972, +20.54% from previous year)
- 2022: $805,605 (+$160,196, +24.82% from previous year)
- 2023: $810,843 (+$5,237, +0.65% from previous year)
- 2024: $837,850 (+$27,008, +3.33% from previous year)
- 2025: $846,094 (+$8,243, +0.98% from previous year)
Double Oak’s home prices jumped nearly 150% since 2010, with particularly sharp increases from 2020 onward. Growth has slowed recently, but values continue to edge up each year.
Double Oak – Suburban Peace, Premium Price
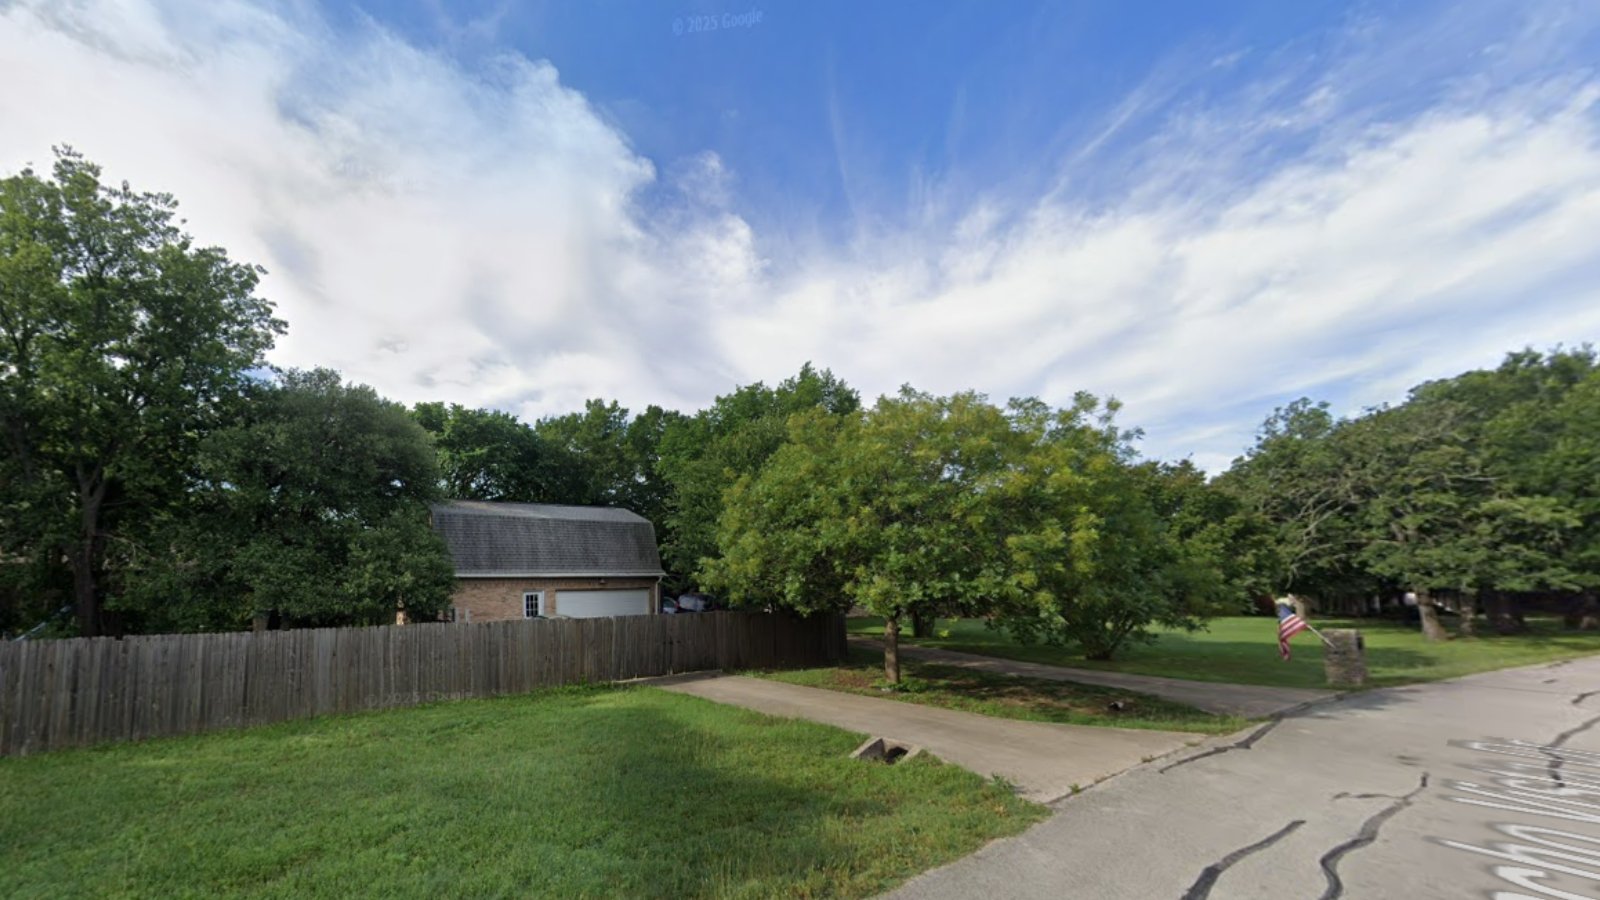
Nestled in Denton County, Double Oak is a semi-rural suburb with large lots and quiet neighborhoods. It’s close to Flower Mound and Highland Village, yet offers more space and privacy—key features that attracted buyers during the work-from-home era.
Despite its low profile, Double Oak’s appeal lies in its limited development and strong demand for single-family homes. It remains a high-value enclave for those seeking serenity near the Dallas-Fort Worth metroplex.
25. Sunrise Beach – 140% Home Price Increase Since 2010
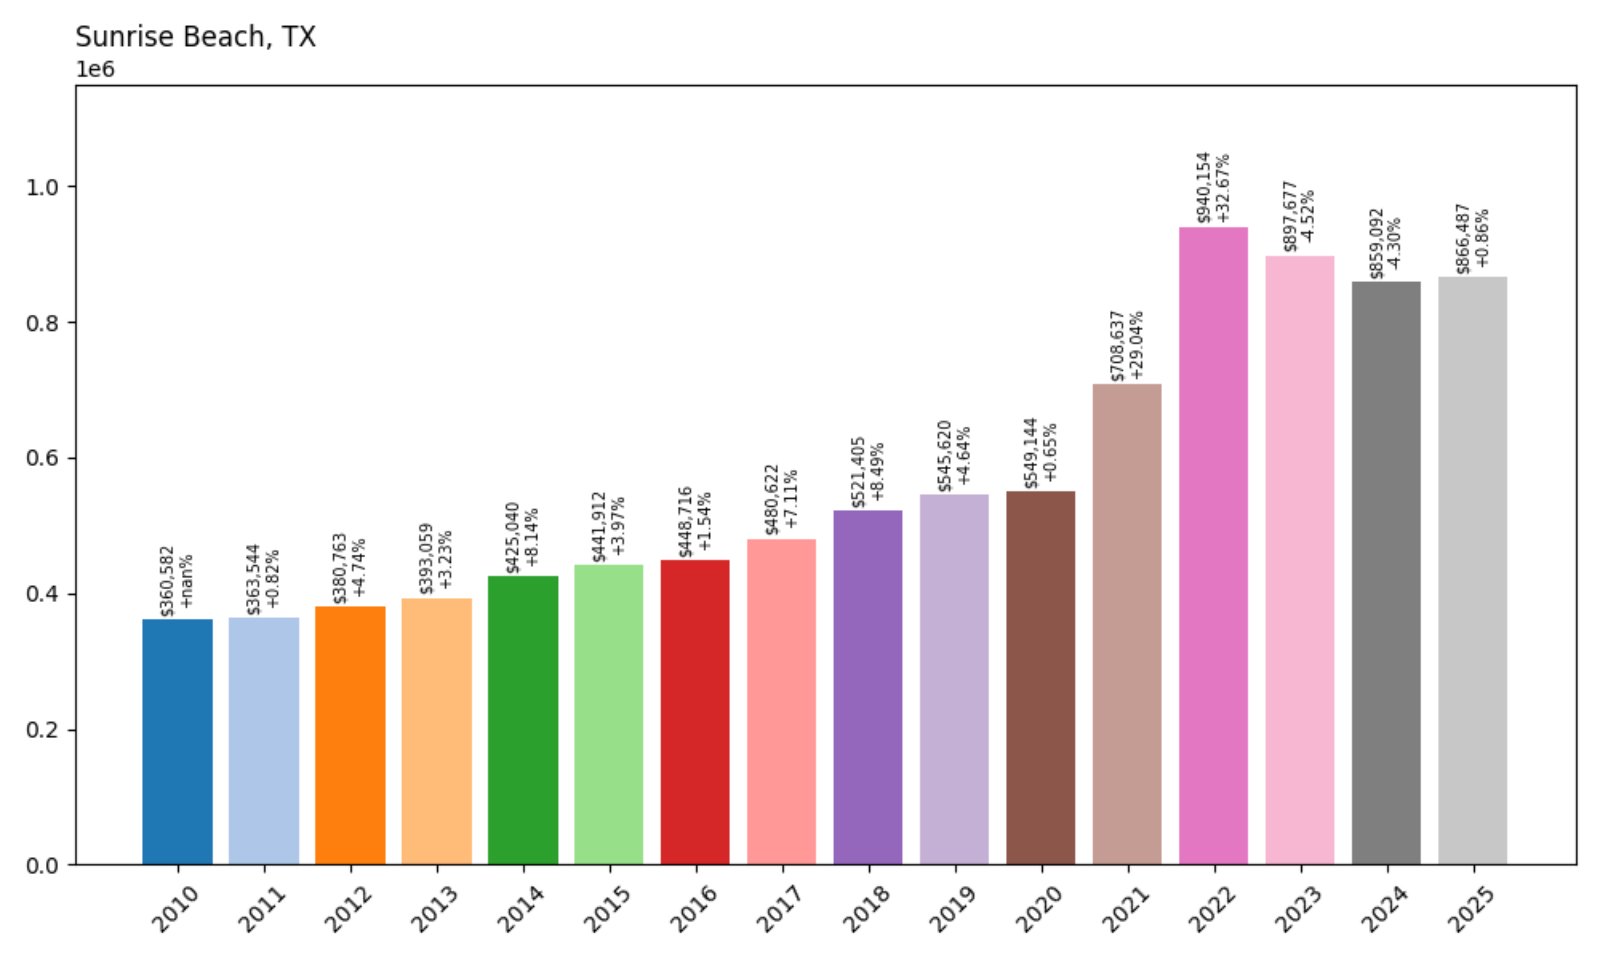
- 2010: $360,582
- 2011: $363,544 (+$2,962, +0.82% from previous year)
- 2012: $380,763 (+$17,220, +4.74% from previous year)
- 2013: $393,059 (+$12,295, +3.23% from previous year)
- 2014: $425,040 (+$31,981, +8.14% from previous year)
- 2015: $441,912 (+$16,872, +3.97% from previous year)
- 2016: $448,716 (+$6,804, +1.54% from previous year)
- 2017: $480,622 (+$31,906, +7.11% from previous year)
- 2018: $521,405 (+$40,783, +8.49% from previous year)
- 2019: $545,620 (+$24,215, +4.64% from previous year)
- 2020: $549,144 (+$3,524, +0.65% from previous year)
- 2021: $708,637 (+$159,493, +29.04% from previous year)
- 2022: $940,154 (+$231,518, +32.67% from previous year)
- 2023: $897,677 (−$42,477, −4.52% from previous year)
- 2024: $859,092 (−$38,585, −4.30% from previous year)
- 2025: $866,487 (+$7,395, +0.86% from previous year)
Sunrise Beach saw a 140% increase in home values since 2010, thanks in part to a surge during the 2021–2022 housing boom. Prices have dipped slightly but remain high in 2025.
Sunrise Beach – Quiet Waterfront Living with Strong Demand
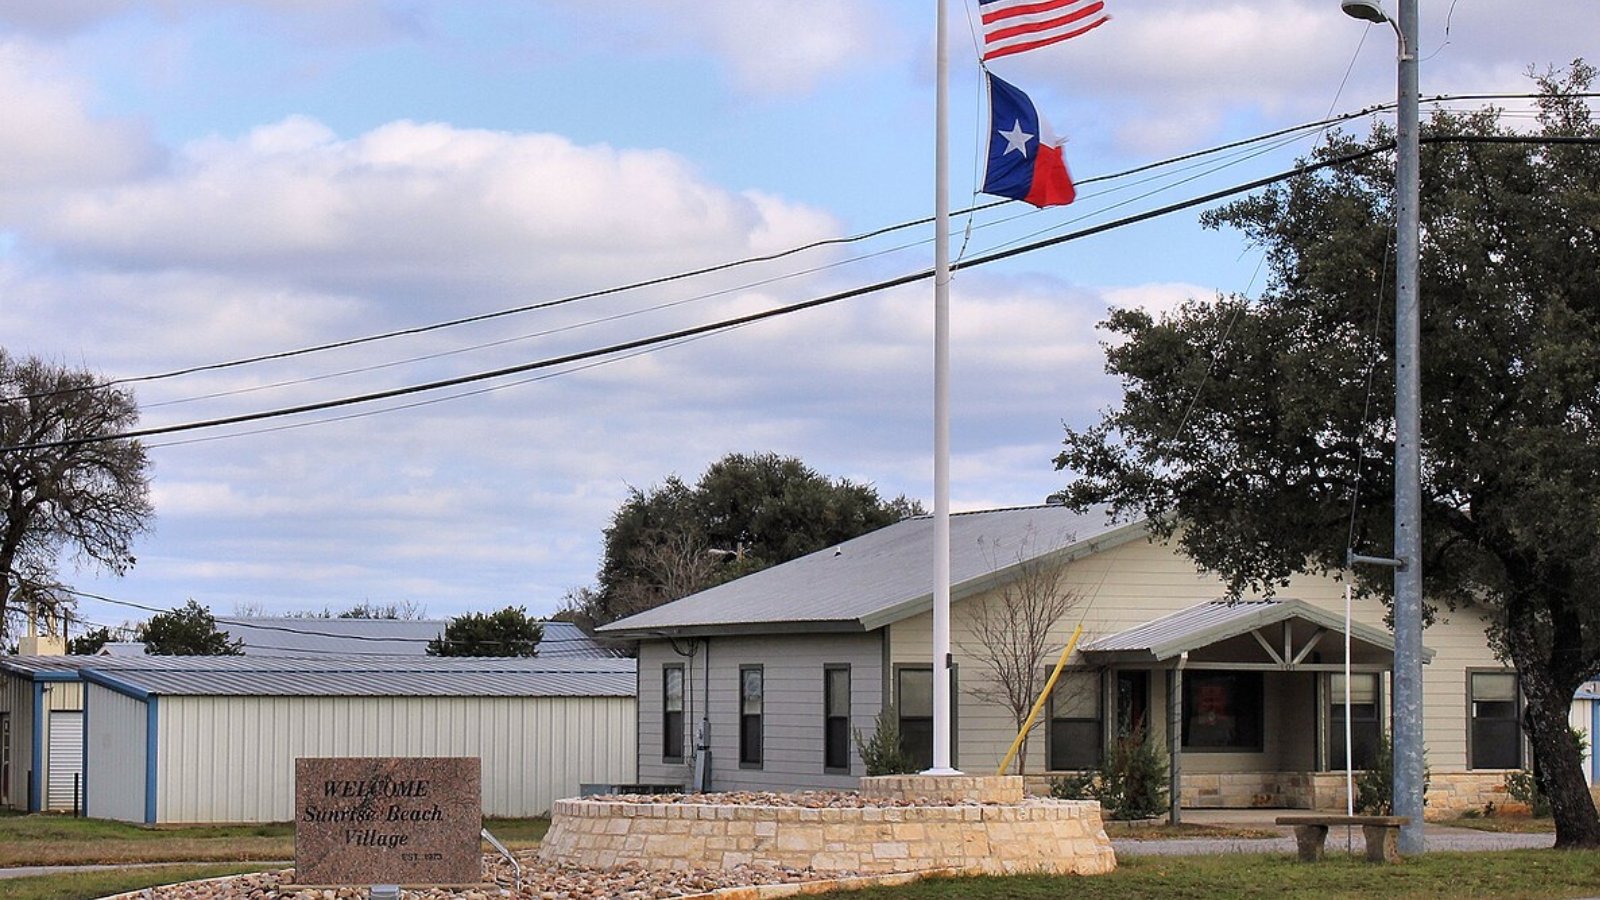
Situated on the western shore of Lake LBJ in Llano County, Sunrise Beach Village offers lakefront access, boating, and scenic vistas. Its low population and desirable location make it a hidden luxury retreat for second-home buyers and retirees alike.


The pandemic drove a wave of interest in remote lakefront communities, sending prices soaring. Though recent years have seen slight declines, Sunrise Beach remains a premium lake town in Central Texas.
24. Round Mountain – 26% Home Price Increase Since 2021
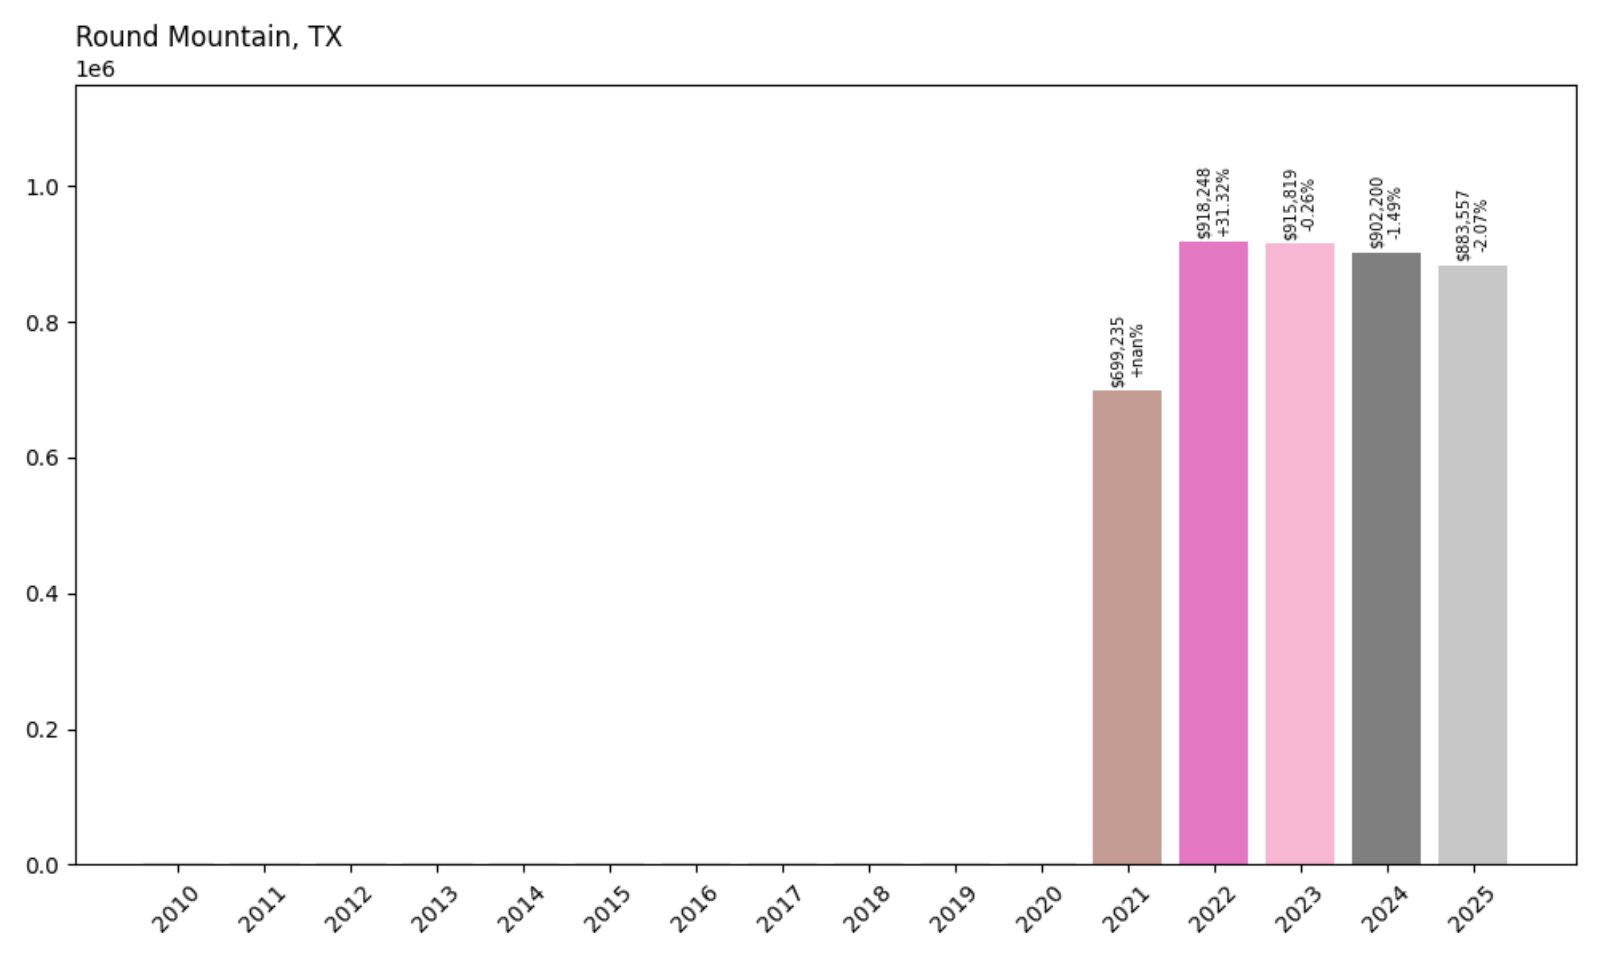
- 2021: $699,235
- 2022: $918,248 (+$219,013, +31.32% from previous year)
- 2023: $915,819 (−$2,429, −0.26% from previous year)
- 2024: $902,200 (−$13,619, −1.49% from previous year)
- 2025: $883,557 (−$18,642, −2.07% from previous year)
Though data is only available from 2021, Round Mountain experienced a sharp 31% increase between 2021 and 2022. Since then, home values have slipped slightly each year but remain substantially higher than four years ago.
Round Mountain – Short-Term Surge, Long-Term Appeal
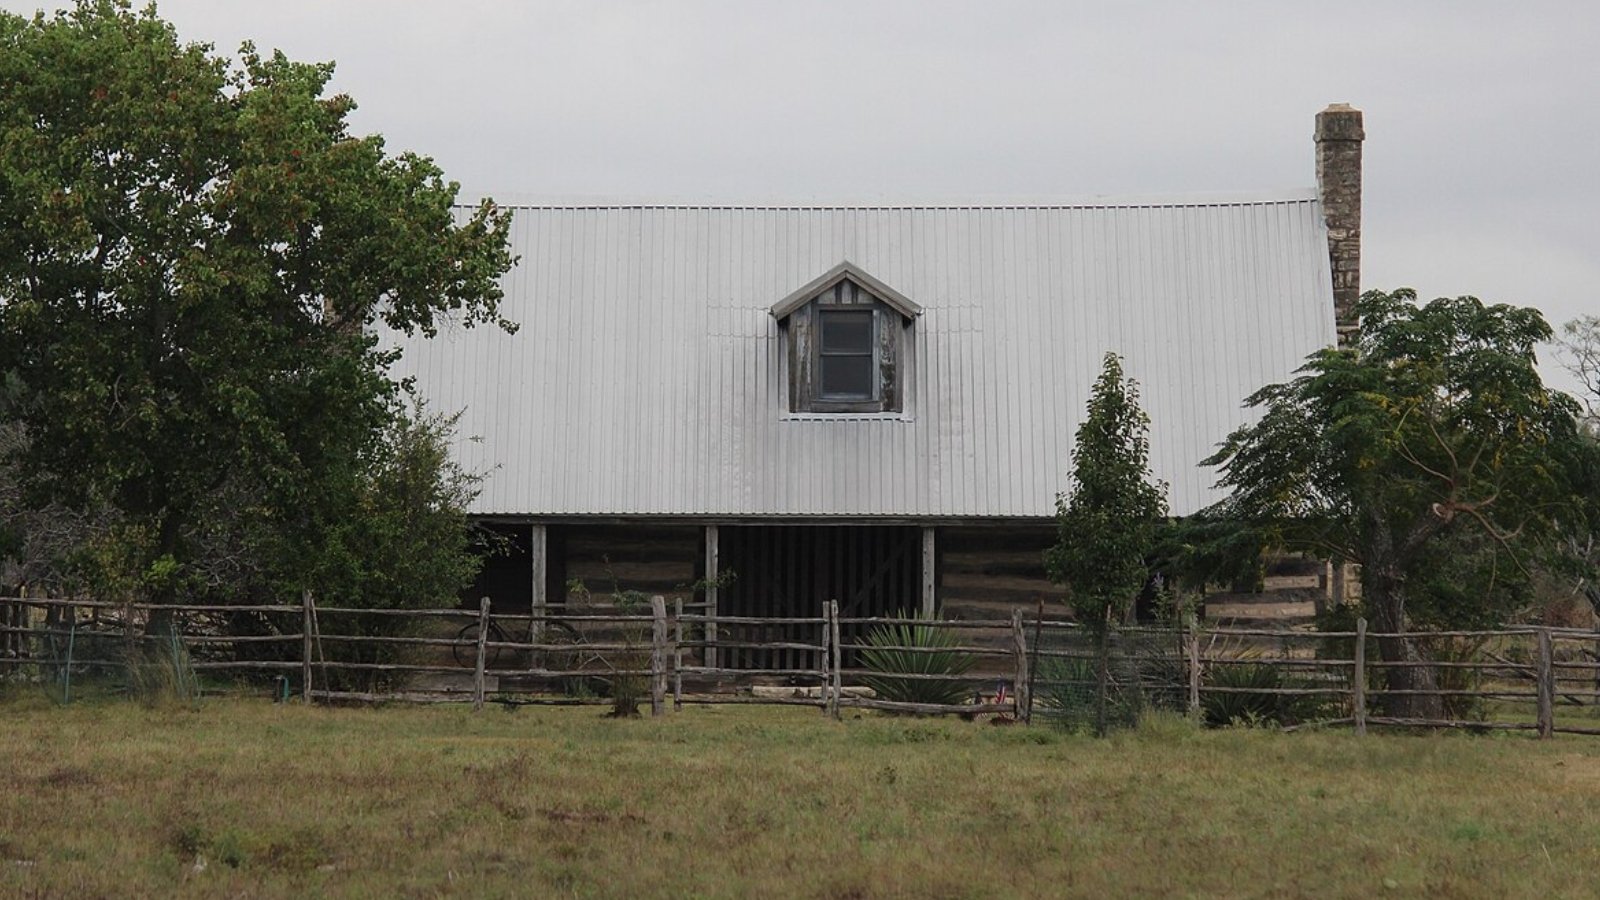
Round Mountain, located in Blanco County, is a rural Hill Country town with wide-open land and peaceful scenery. Its proximity to Johnson City and Marble Falls offers access to the conveniences of small-town life while maintaining a remote, country feel.
The sharp jump in 2022 likely reflects a rush of buyers seeking land and privacy during the post-pandemic real estate boom. Though prices have softened, the town’s appeal for buyers seeking space away from urban centers keeps values well above pre-2021 levels.
23. Colleyville – 121% Home Price Increase Since 2010
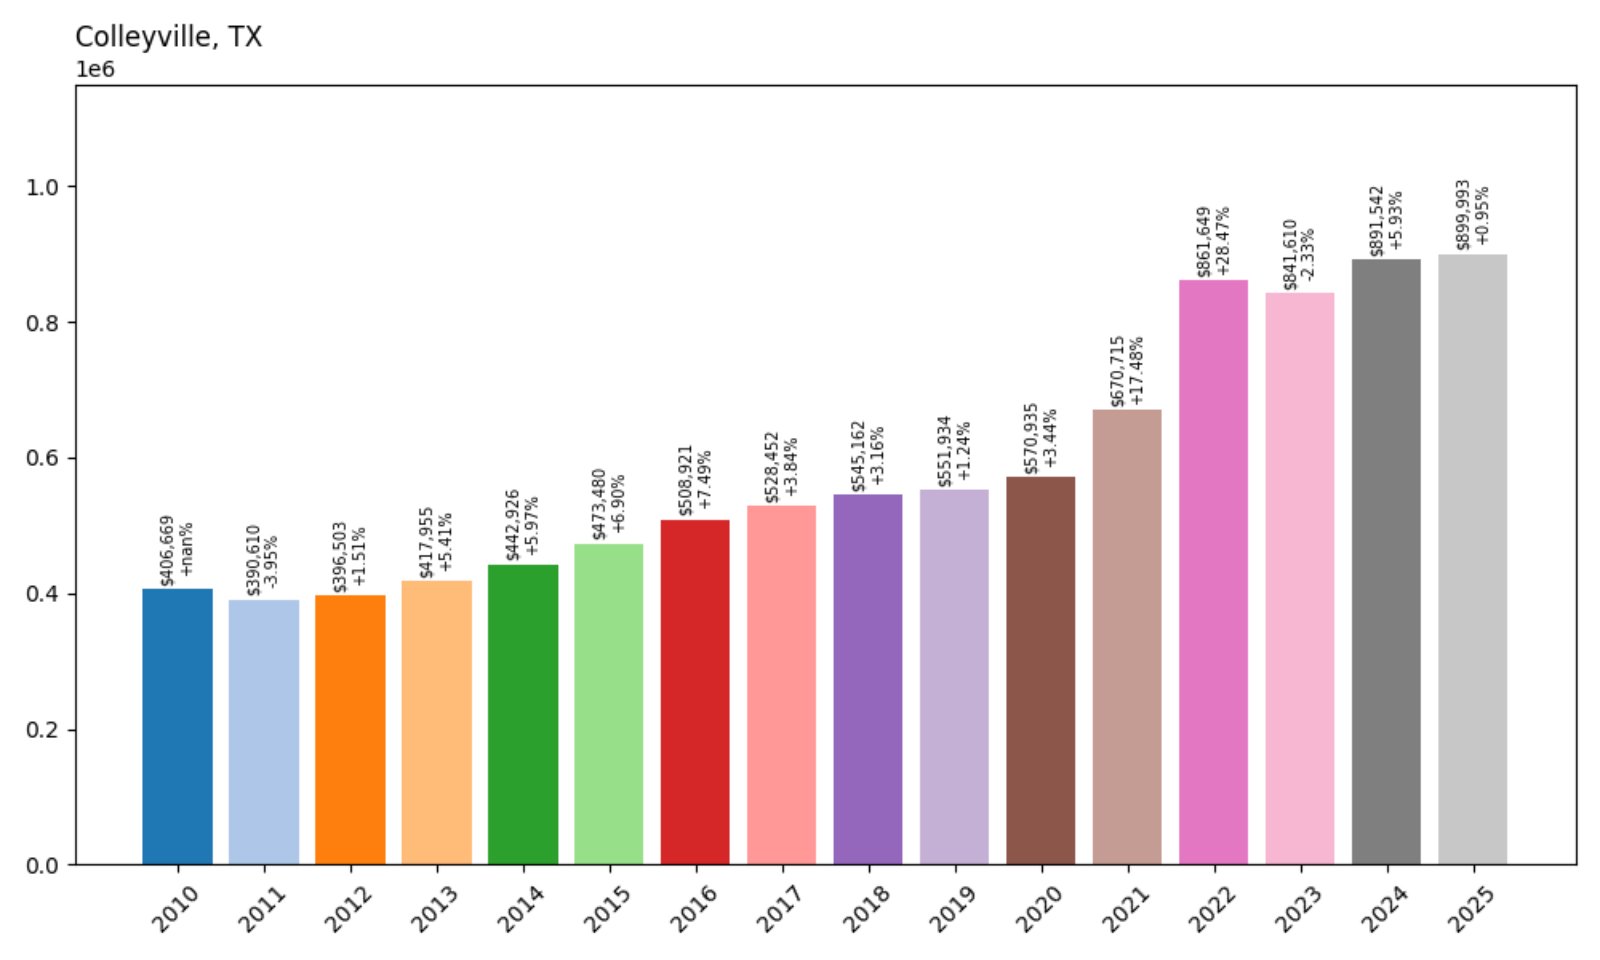
- 2010: $406,669
- 2011: $390,610 (−$16,059, −3.95% from previous year)
- 2012: $396,503 (+$5,893, +1.51% from previous year)
- 2013: $417,955 (+$21,452, +5.41% from previous year)
- 2014: $442,926 (+$24,971, +5.97% from previous year)
- 2015: $473,480 (+$30,554, +6.90% from previous year)
- 2016: $508,921 (+$35,441, +7.49% from previous year)
- 2017: $528,452 (+$19,532, +3.84% from previous year)
- 2018: $545,162 (+$16,709, +3.16% from previous year)
- 2019: $551,934 (+$6,772, +1.24% from previous year)
- 2020: $570,935 (+$19,001, +3.44% from previous year)
- 2021: $670,715 (+$99,780, +17.48% from previous year)
- 2022: $861,649 (+$190,934, +28.47% from previous year)
- 2023: $841,610 (−$20,040, −2.33% from previous year)
- 2024: $891,542 (+$49,933, +5.93% from previous year)
- 2025: $899,993 (+$8,450, +0.95% from previous year)
Colleyville’s home prices surged more than 120% since 2010, with particularly strong increases from 2020 through 2022. Prices have remained relatively stable since then, with small year-over-year gains.
Colleyville – Elegant Living in the DFW Suburbs
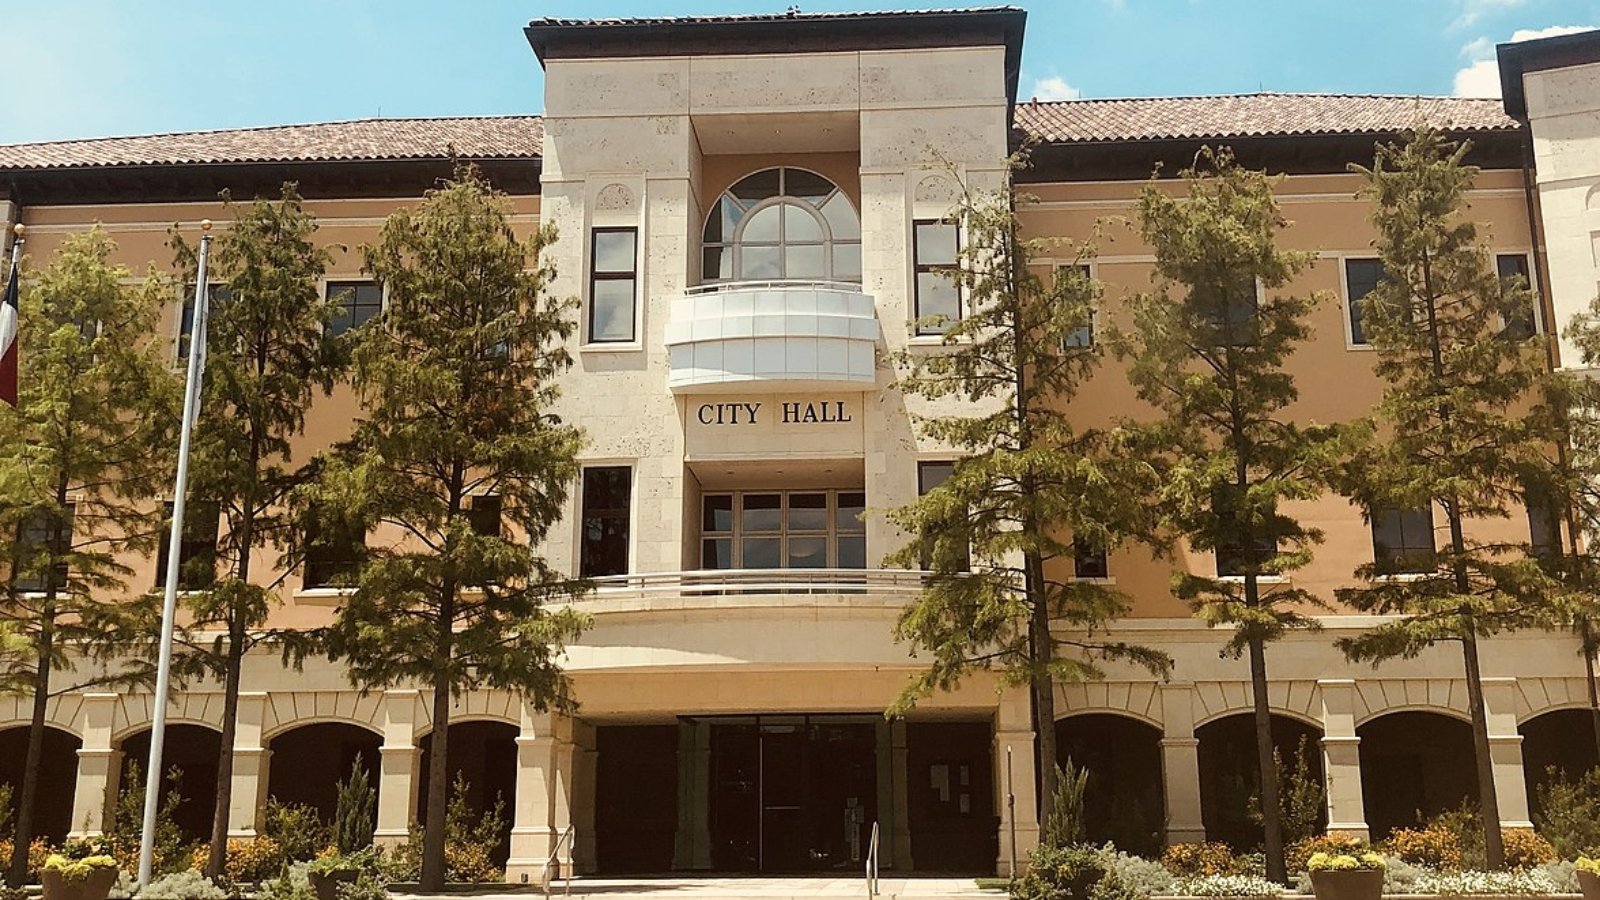
Colleyville sits between Dallas and Fort Worth in Tarrant County and is known for its upscale neighborhoods, top-tier schools, and boutique shopping. It has long been one of the most desirable addresses in the Metroplex.
The town’s real estate boom during the pandemic years reflected increased demand for suburban luxury with city access. Even in a cooling market, Colleyville continues to attract affluent homebuyers looking for space and prestige in the heart of North Texas.
22. Terrell Hills – 87% Home Price Increase Since 2010
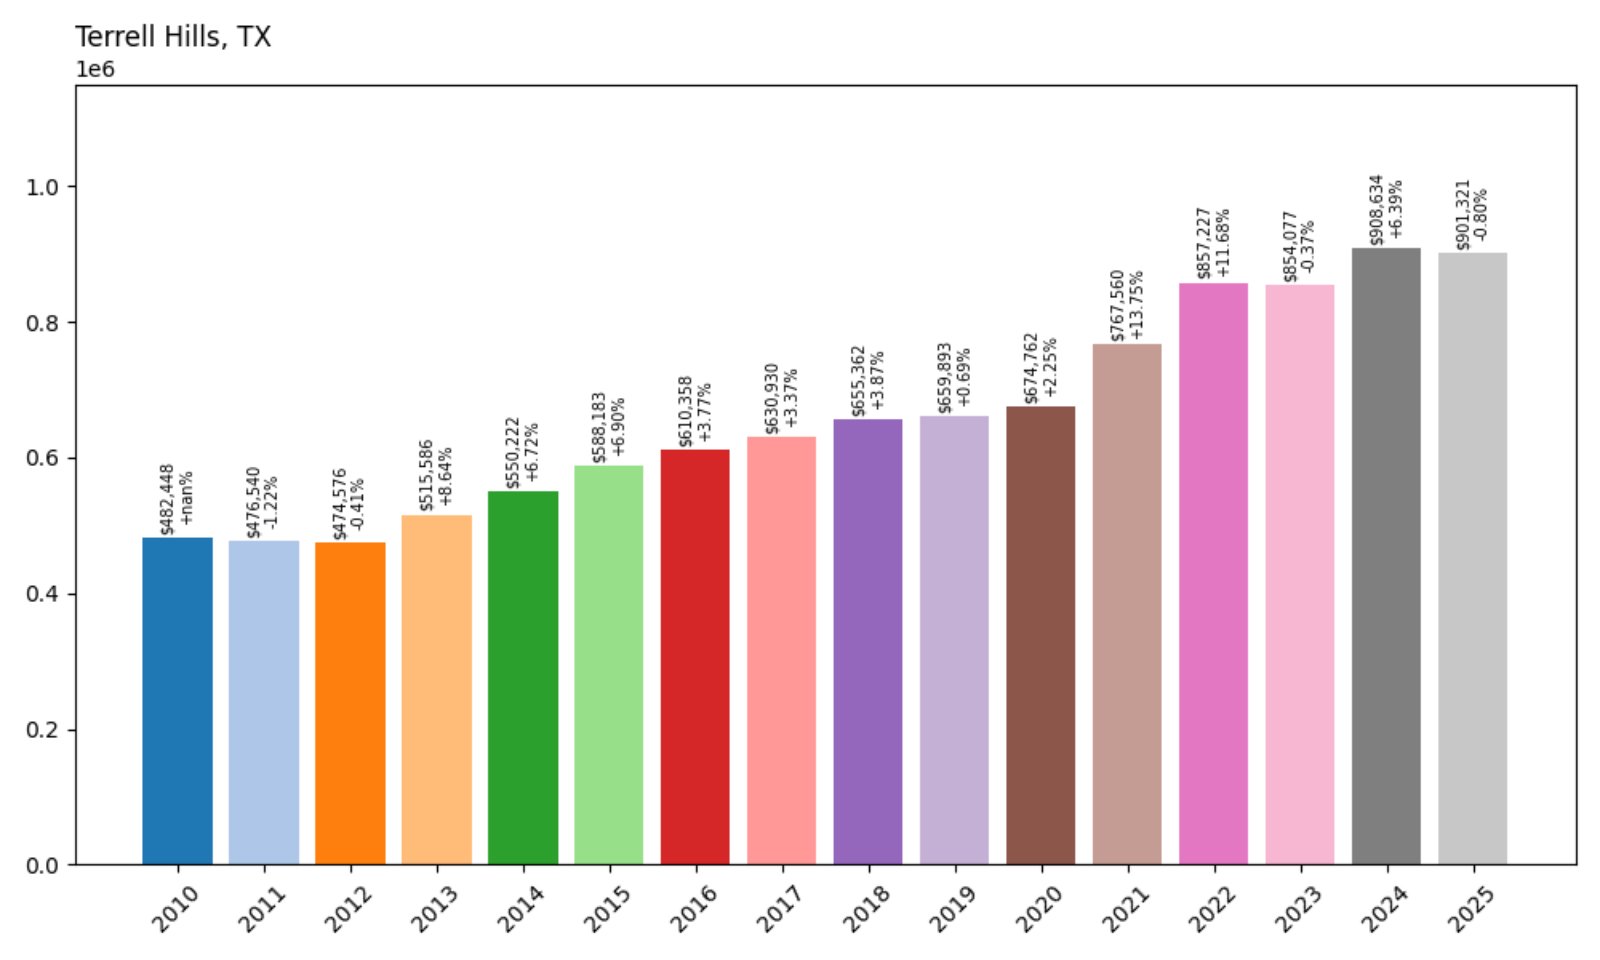
- 2010: $482,448
- 2011: $476,540 (−$5,908, −1.22% from previous year)
- 2012: $474,576 (−$1,965, −0.41% from previous year)
- 2013: $515,586 (+$41,010, +8.64% from previous year)
- 2014: $550,222 (+$34,636, +6.72% from previous year)
- 2015: $588,183 (+$37,961, +6.90% from previous year)
- 2016: $610,358 (+$22,174, +3.77% from previous year)
- 2017: $630,930 (+$20,572, +3.37% from previous year)
- 2018: $655,362 (+$24,432, +3.87% from previous year)
- 2019: $659,893 (+$4,531, +0.69% from previous year)
- 2020: $674,762 (+$14,869, +2.25% from previous year)
- 2021: $767,560 (+$92,798, +13.75% from previous year)
- 2022: $857,227 (+$89,667, +11.68% from previous year)
- 2023: $854,077 (−$3,150, −0.37% from previous year)
- 2024: $908,634 (+$54,557, +6.39% from previous year)
- 2025: $901,321 (−$7,314, −0.80% from previous year)
Terrell Hills has seen a steady increase in home values since 2010, rising by nearly 90%. While recent years show minor fluctuations, the town’s high average price reflects strong long-term growth.
Terrell Hills – Classic San Antonio Prestige
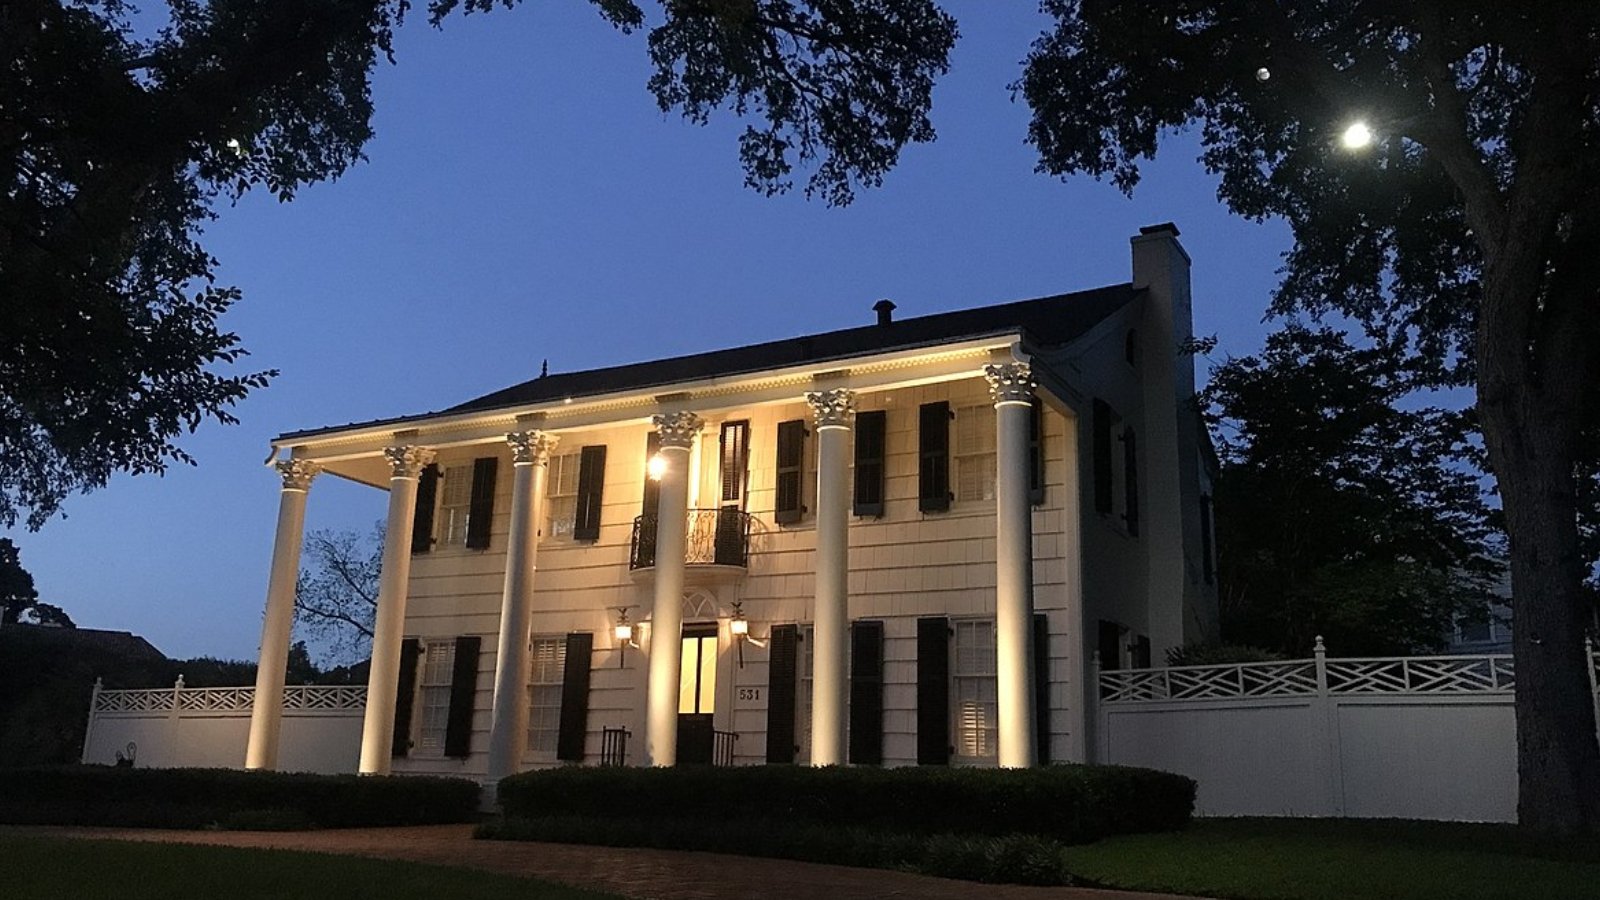
Terrell Hills is a historic enclave east of downtown San Antonio, bordered by Alamo Heights and Fort Sam Houston. With tree-lined streets and elegant homes, it has long been a top choice for military officers and professionals.
Its desirability has kept prices high even as nearby markets have cooled. Historic architecture, tight inventory, and proximity to key institutions make Terrell Hills a mainstay on Texas’s luxury housing map.
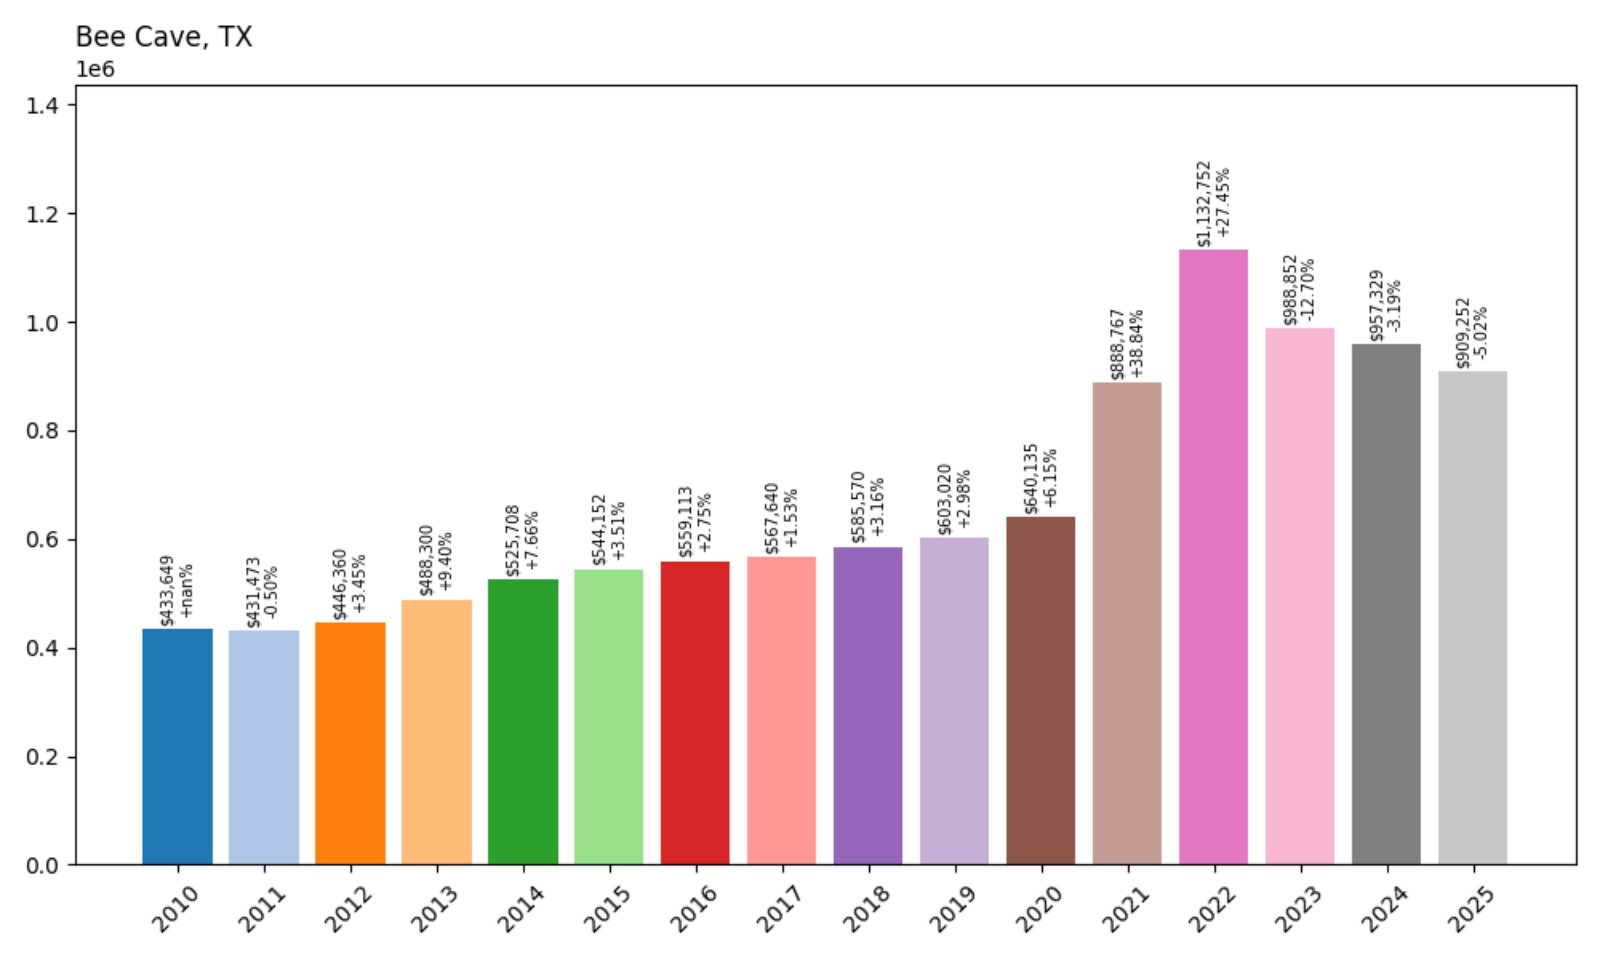
21. Bee Cave – 110% Home Price Increase Since 2010
Would you like to save this?
- 2010: $433,649
- 2011: $431,473 (−$2,177, −0.50% from previous year)
- 2012: $446,360 (+$14,887, +3.45% from previous year)
- 2013: $488,300 (+$41,940, +9.40% from previous year)
- 2014: $525,708 (+$37,408, +7.66% from previous year)
- 2015: $544,152 (+$18,445, +3.51% from previous year)
- 2016: $559,113 (+$14,961, +2.75% from previous year)
- 2017: $567,640 (+$8,527, +1.53% from previous year)
- 2018: $585,570 (+$17,930, +3.16% from previous year)
- 2019: $603,020 (+$17,450, +2.98% from previous year)
- 2020: $640,135 (+$37,115, +6.15% from previous year)
- 2021: $888,767 (+$248,632, +38.84% from previous year)
- 2022: $1,132,752 (+$243,985, +27.45% from previous year)
- 2023: $988,852 (−$143,900, −12.70% from previous year)
- 2024: $957,329 (−$31,523, −3.19% from previous year)
- 2025: $909,252 (−$48,077, −5.02% from previous year)
Bee Cave saw its home prices more than double since 2010, with massive jumps during the early 2020s. Recent years show a correction, but values remain well above pre-pandemic levels.
Bee Cave – West Austin Growth Hotspot
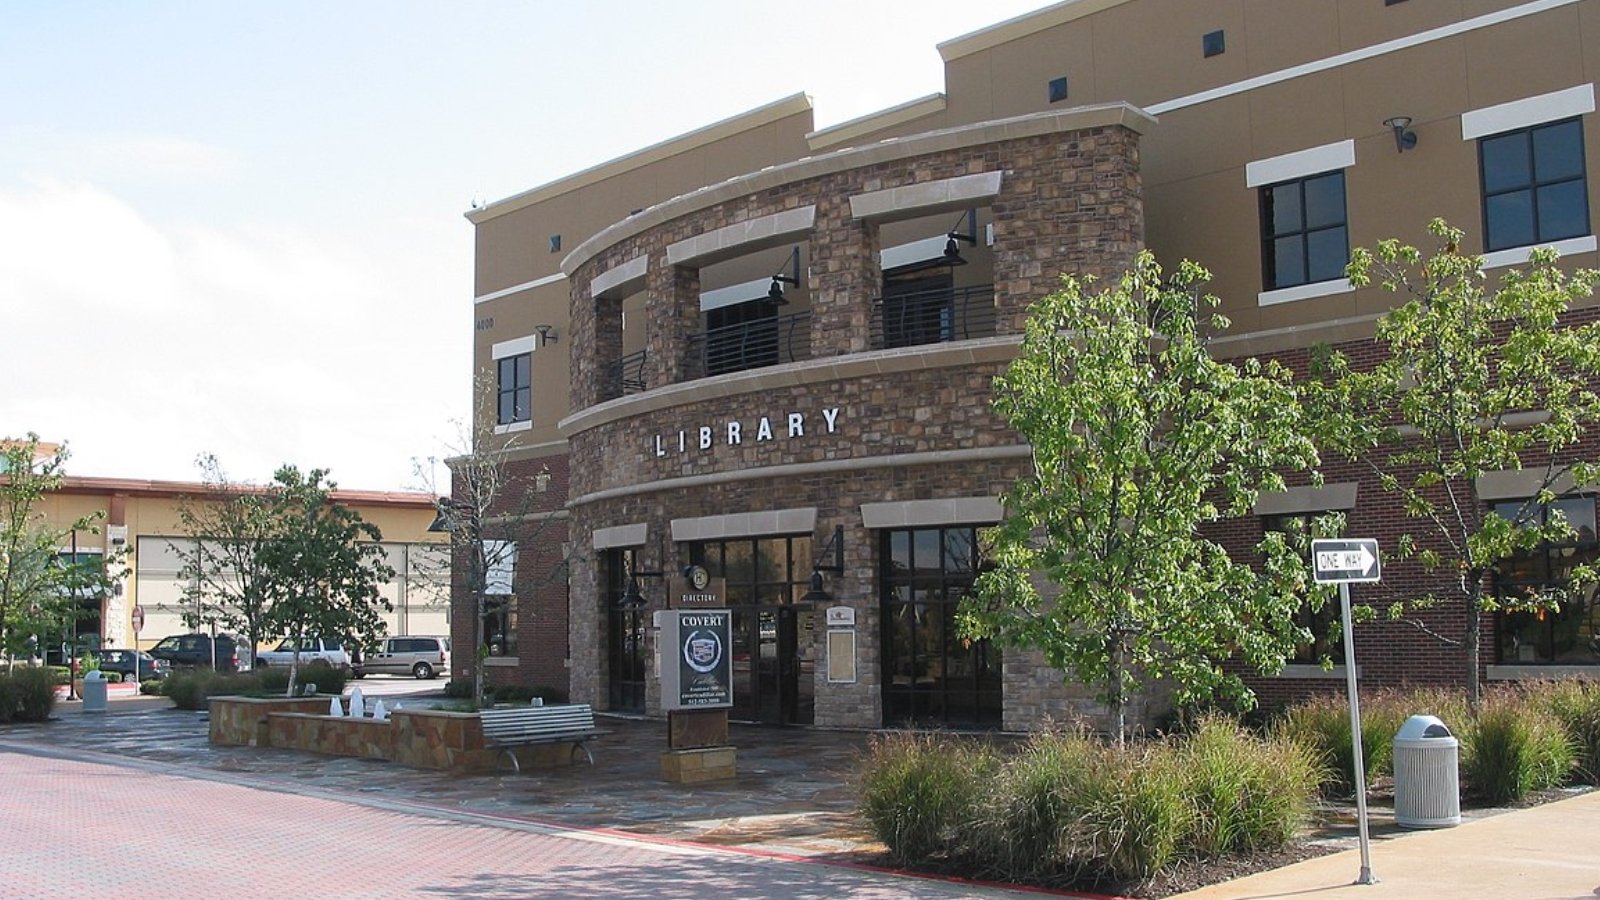
Bee Cave lies just west of Austin and is part of the scenic Texas Hill Country. It offers a mix of master-planned communities, upscale retail at the Hill Country Galleria, and strong school districts.
The town experienced dramatic appreciation during the post-COVID boom, as buyers rushed to the suburbs. While values are adjusting, Bee Cave’s location and lifestyle amenities continue to support its spot among Texas’s most expensive markets.
20. Olmos Park – 82% Home Price Increase Since 2010
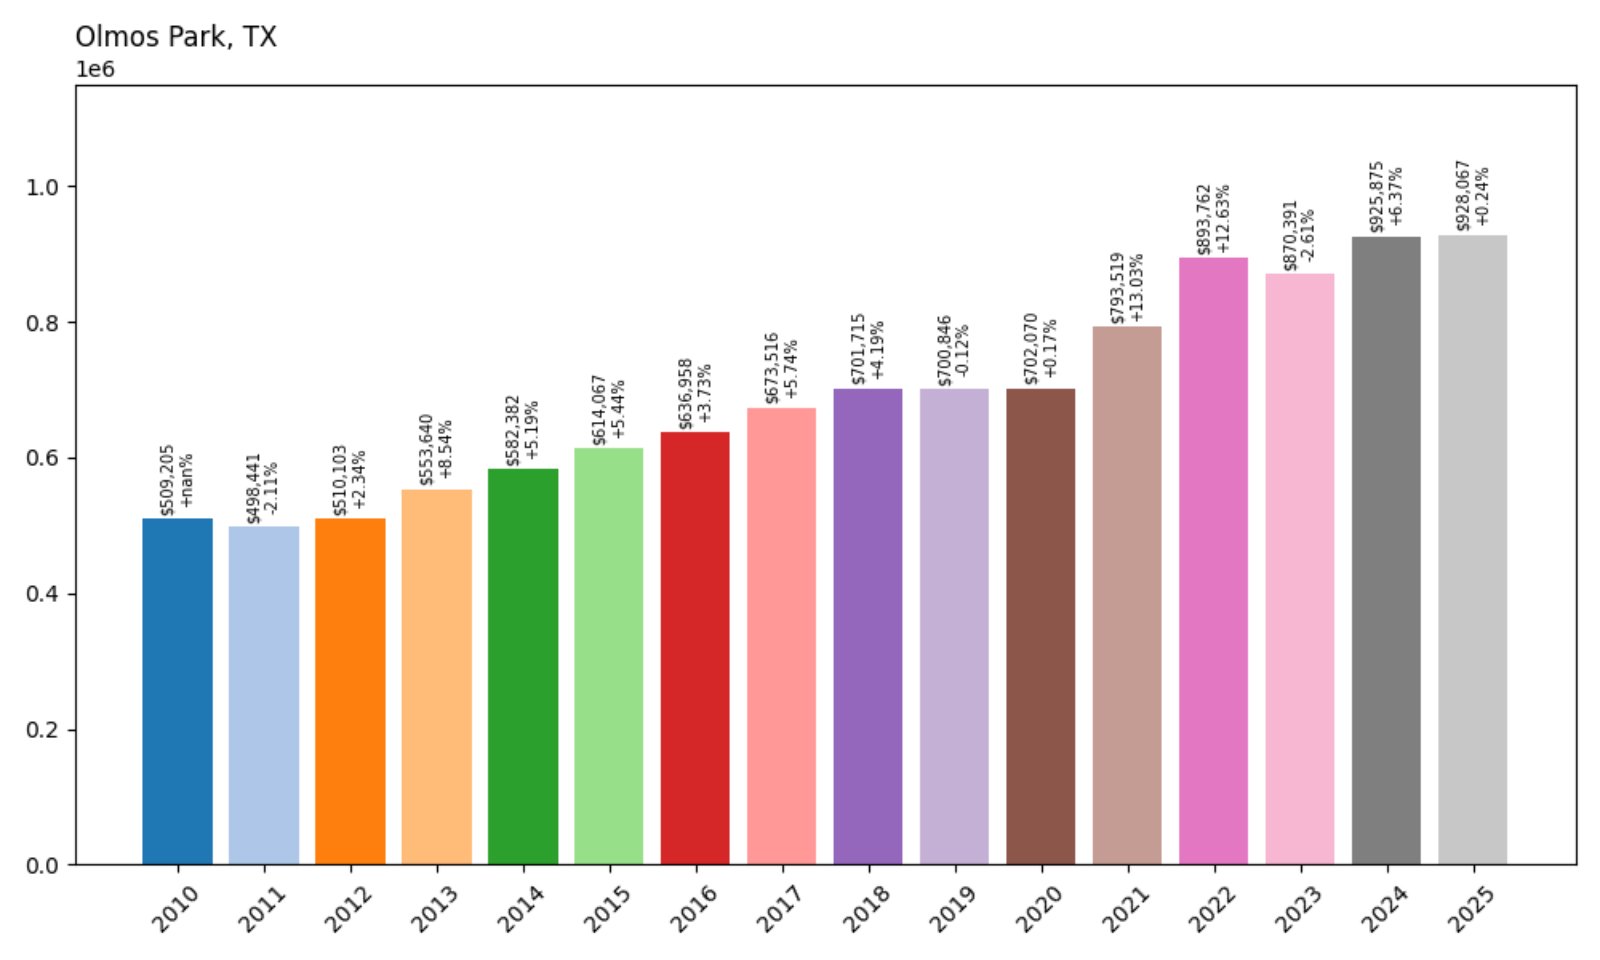
- 2010: $509,205
- 2011: $498,441 (−$10,763, −2.11% from previous year)
- 2012: $510,103 (+$11,661, +2.34% from previous year)
- 2013: $553,640 (+$43,538, +8.54% from previous year)
- 2014: $582,382 (+$28,742, +5.19% from previous year)
- 2015: $614,067 (+$31,685, +5.44% from previous year)
- 2016: $636,958 (+$22,890, +3.73% from previous year)
- 2017: $673,516 (+$36,558, +5.74% from previous year)
- 2018: $701,715 (+$28,199, +4.19% from previous year)
- 2019: $700,846 (−$868, −0.12% from previous year)
- 2020: $702,070 (+$1,224, +0.17% from previous year)
- 2021: $793,519 (+$91,449, +13.03% from previous year)
- 2022: $893,762 (+$100,242, +12.63% from previous year)
- 2023: $870,391 (−$23,371, −2.61% from previous year)
- 2024: $925,875 (+$55,484, +6.37% from previous year)
- 2025: $928,067 (+$2,191, +0.24% from previous year)
Olmos Park has seen a steady and consistent rise in home values, growing over 80% since 2010. After modest cooling in 2023, prices have resumed growth, securing its place among the state’s top-tier real estate markets.
Olmos Park – Timeless Elegance in Central San Antonio
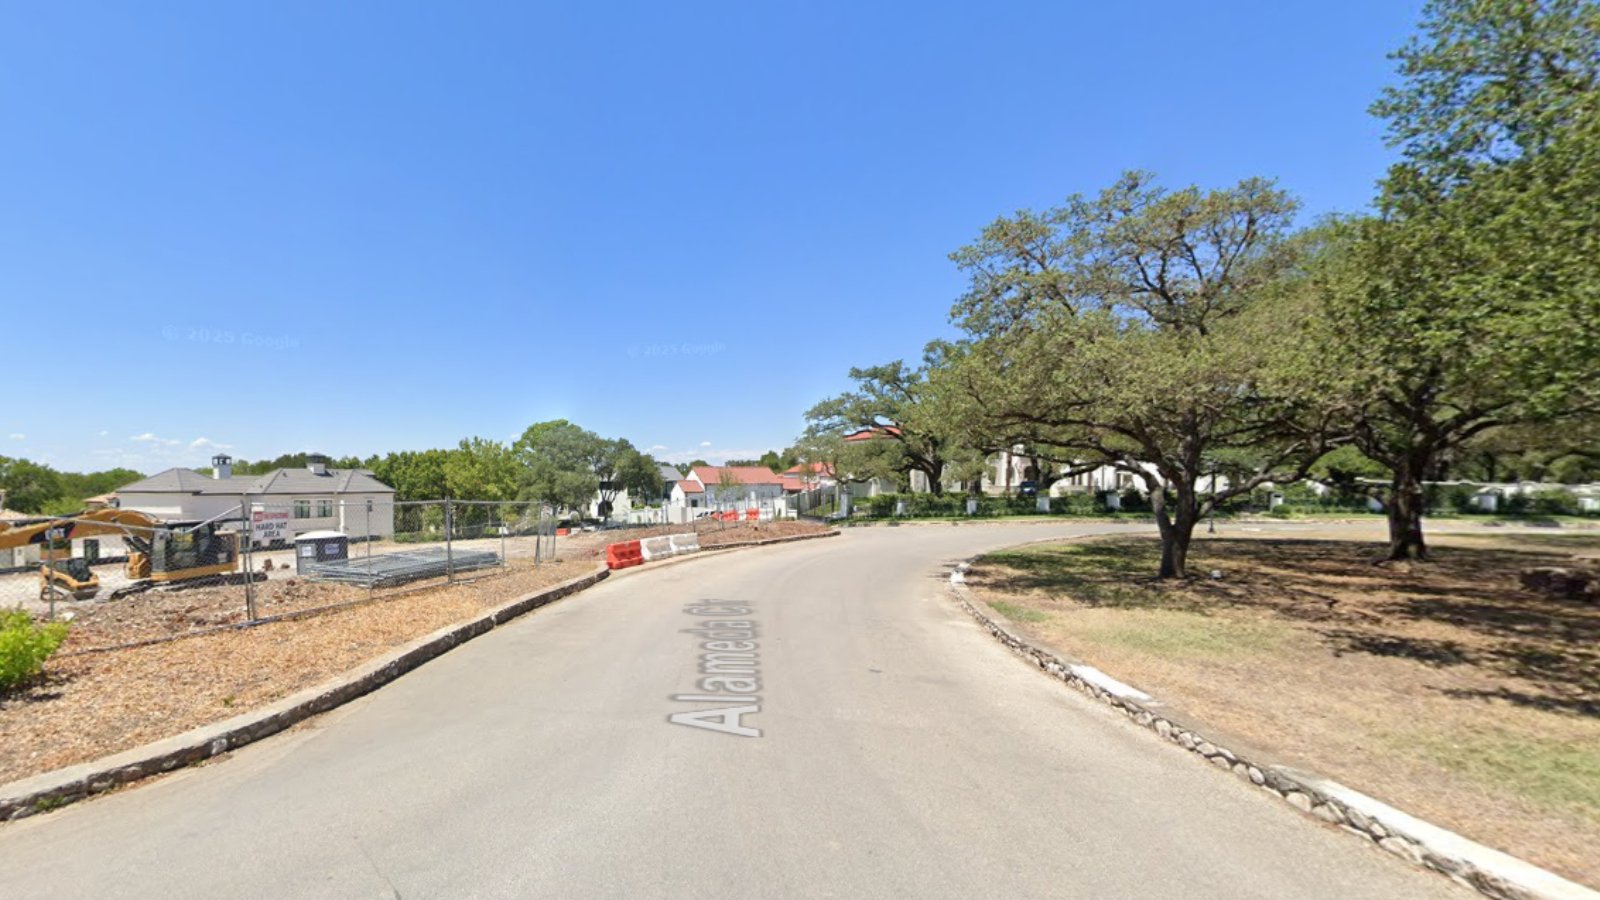
Olmos Park is a historic, affluent community just five miles north of downtown San Antonio. Known for its stately homes, tree-lined boulevards, and early 20th-century architecture, it offers both charm and central convenience.
The city’s strong location near cultural institutions, respected private schools, and thriving businesses continues to drive demand. With strict zoning and limited turnover, Olmos Park has maintained high values and remains a symbol of enduring affluence in South Texas.
19. Driftwood – 148% Home Price Increase Since 2010
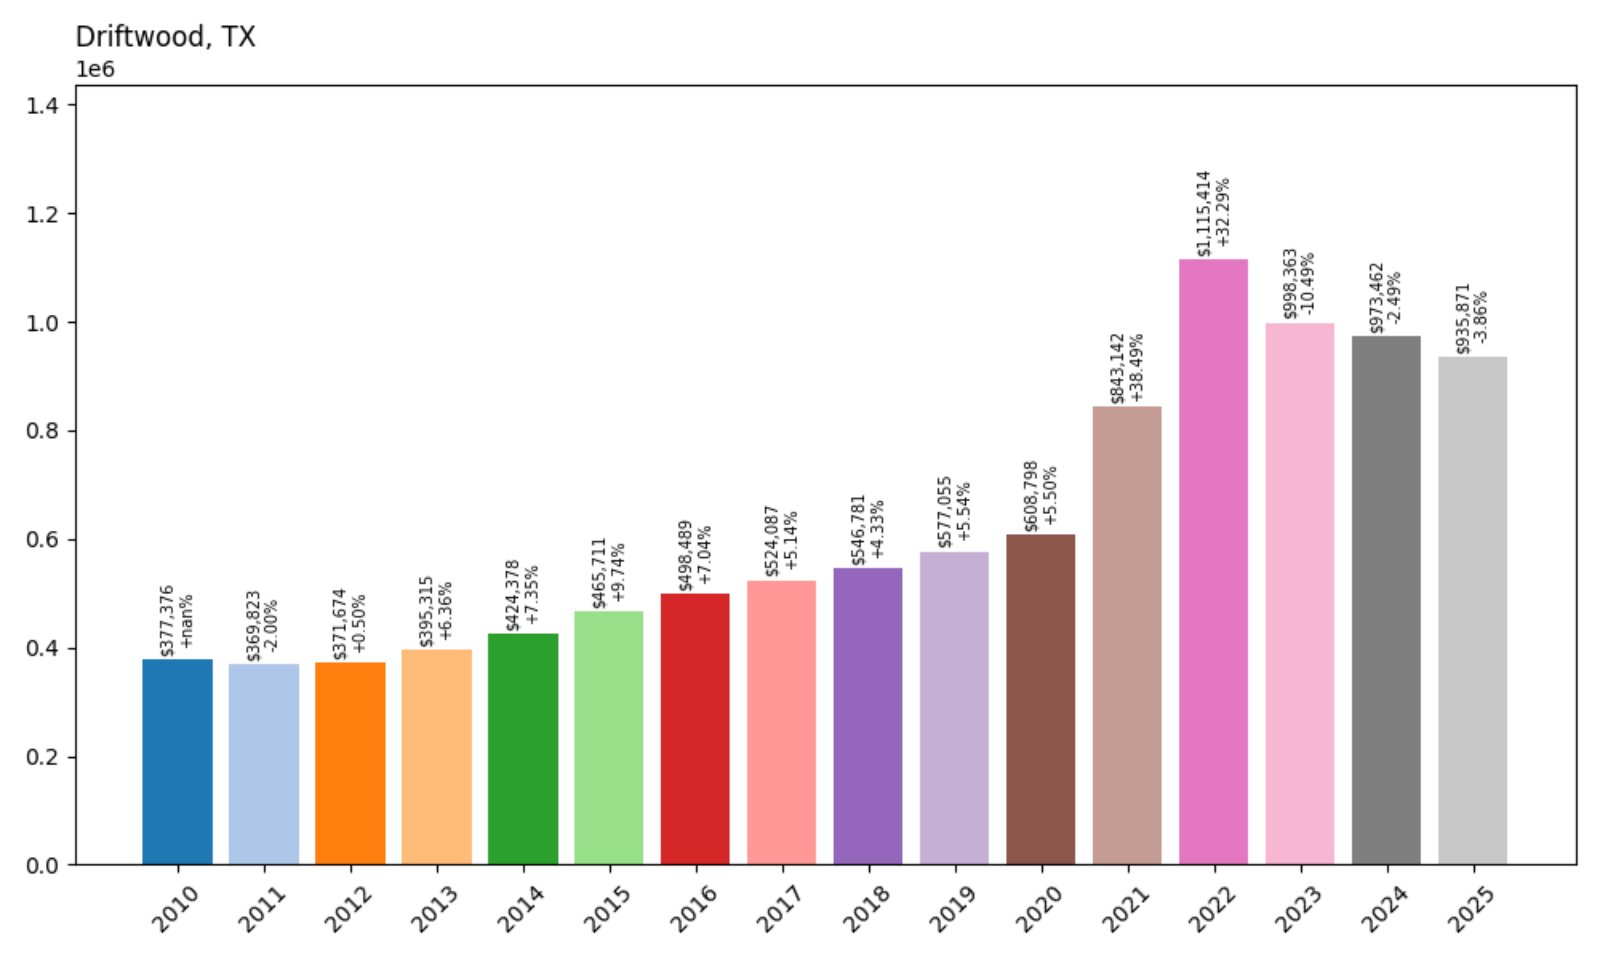
- 2010: $377,376
- 2011: $369,823 (−$7,553, −2.00% from previous year)
- 2012: $371,674 (+$1,852, +0.50% from previous year)
- 2013: $395,315 (+$23,641, +6.36% from previous year)
- 2014: $424,378 (+$29,063, +7.35% from previous year)
- 2015: $465,711 (+$41,333, +9.74% from previous year)
- 2016: $498,489 (+$32,778, +7.04% from previous year)
- 2017: $524,087 (+$25,598, +5.14% from previous year)
- 2018: $546,781 (+$22,694, +4.33% from previous year)
- 2019: $577,055 (+$30,274, +5.54% from previous year)
- 2020: $608,798 (+$31,743, +5.50% from previous year)
- 2021: $843,142 (+$234,344, +38.49% from previous year)
- 2022: $1,115,414 (+$272,272, +32.29% from previous year)
- 2023: $998,363 (−$117,051, −10.49% from previous year)
- 2024: $973,462 (−$24,902, −2.49% from previous year)
- 2025: $935,871 (−$37,591, −3.86% from previous year)
Home values in Driftwood nearly tripled between 2010 and 2022, but have declined modestly in the last three years. Despite recent dips, prices remain far above pre-pandemic levels.
Driftwood – Country Charm Meets Million-Dollar Views
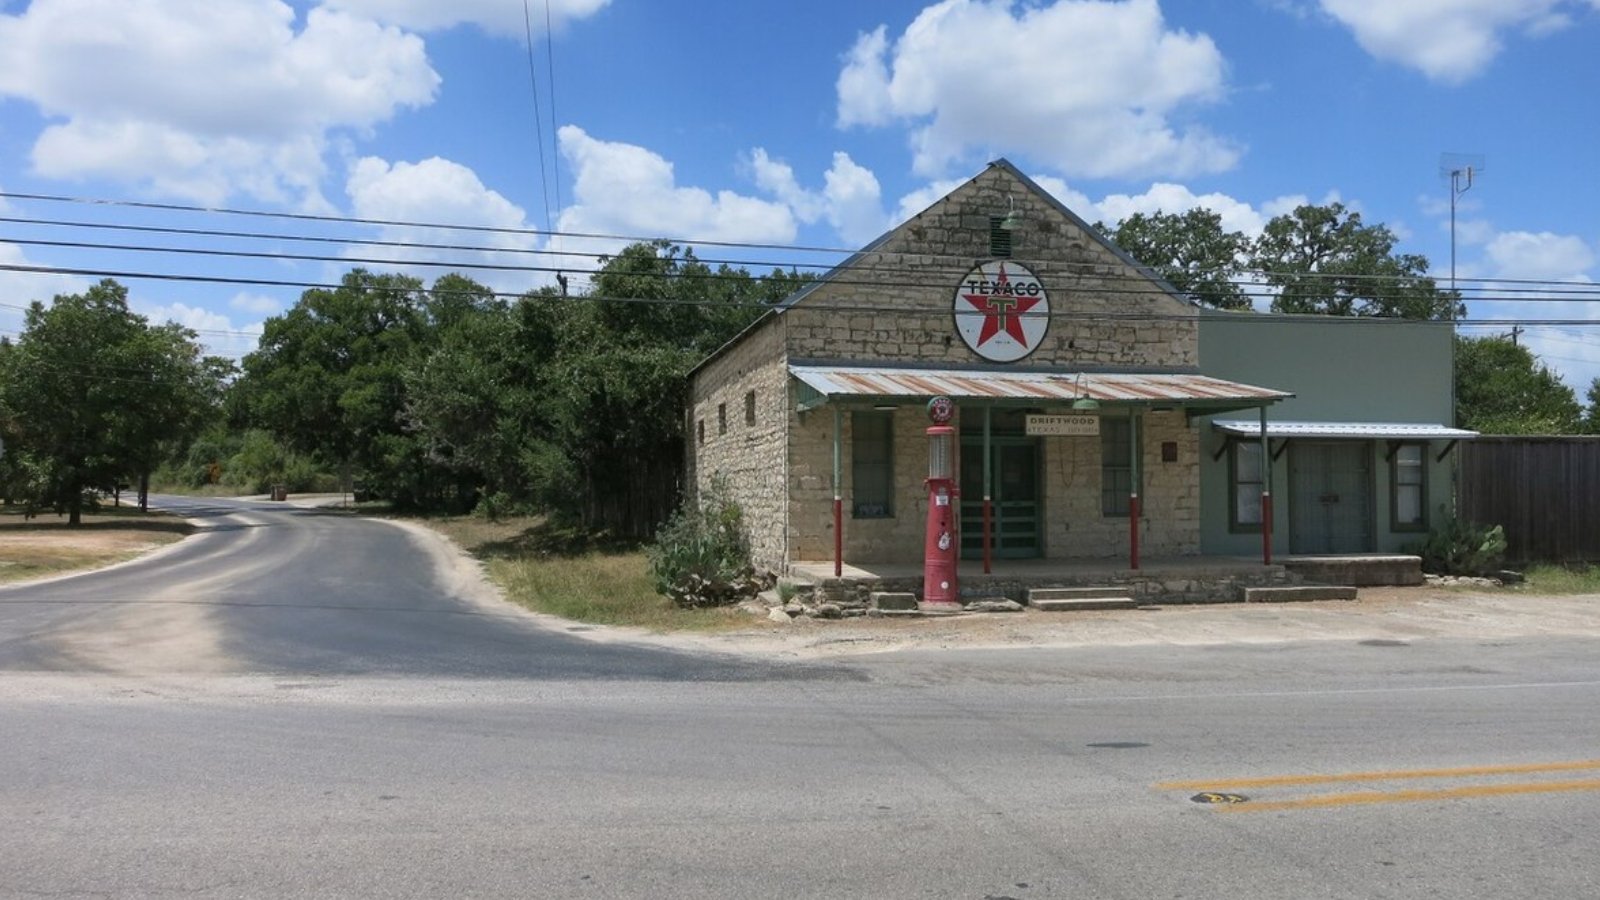
Located southwest of Austin in Hays County, Driftwood is best known for its Hill Country landscapes, vineyards, and high-end rural estates. Buyers flocked here during the remote work shift, driving major price growth between 2020 and 2022.
While prices have cooled slightly, the area remains attractive for those seeking acreage, privacy, and scenic beauty close to Austin. With popular destinations like Salt Lick BBQ and boutique wineries, Driftwood blends luxury with lifestyle appeal.
18. Shavano Park – 77% Home Price Increase Since 2010
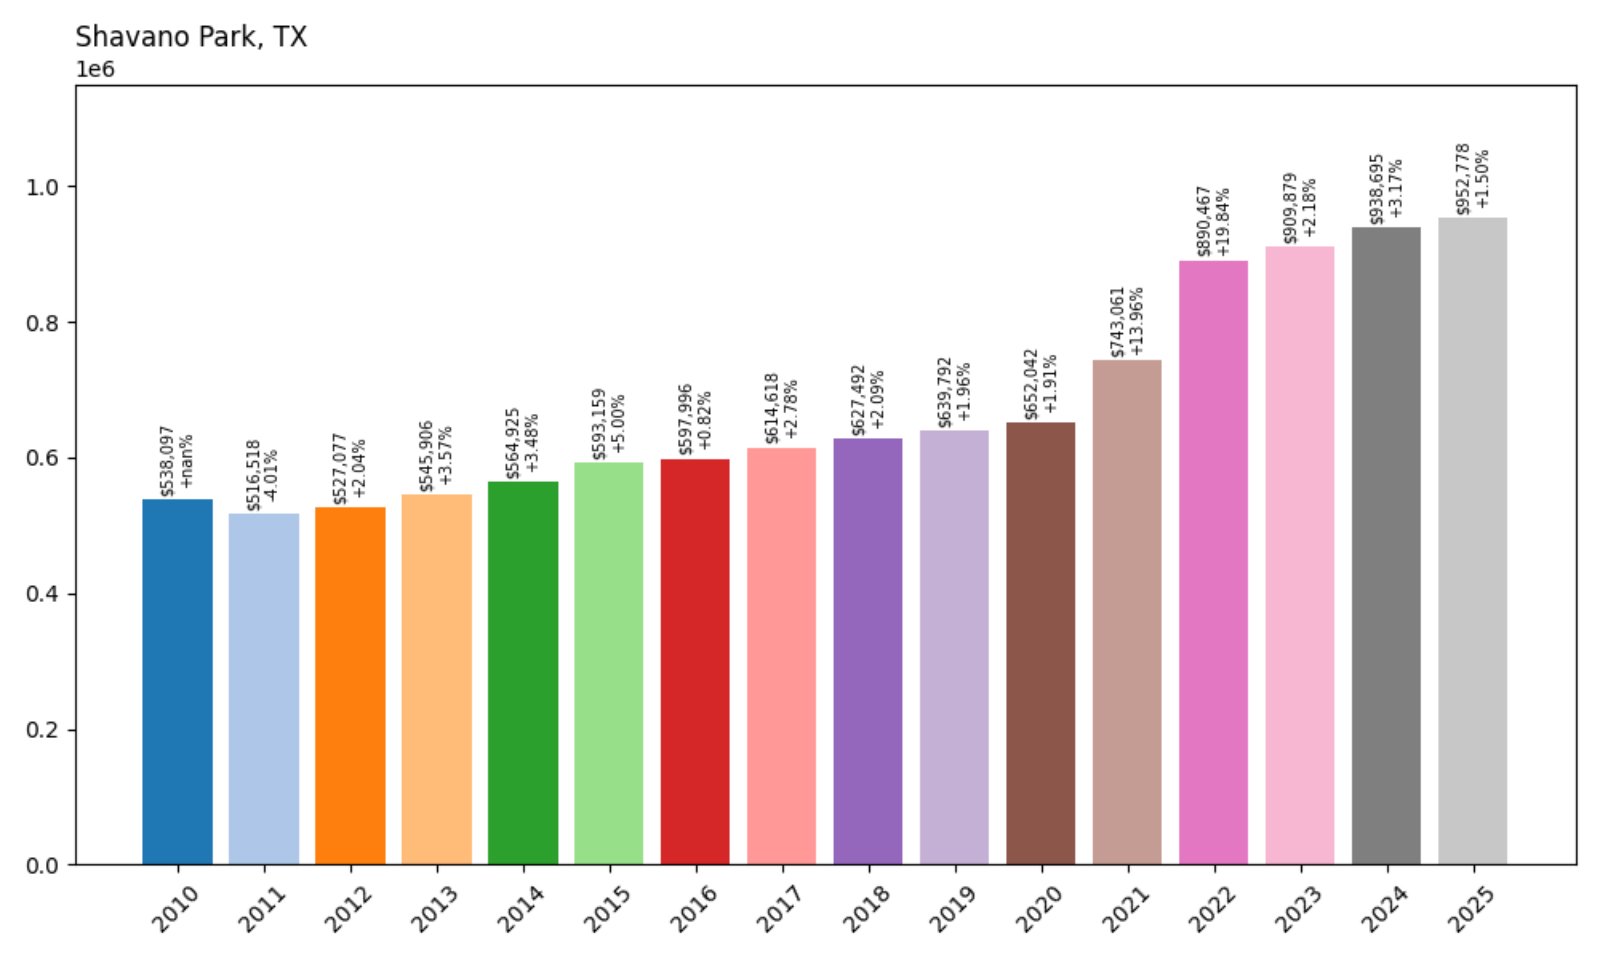
- 2010: $538,097
- 2011: $516,518 (−$21,579, −4.01% from previous year)
- 2012: $527,077 (+$10,559, +2.04% from previous year)
- 2013: $545,906 (+$18,829, +3.57% from previous year)
- 2014: $564,925 (+$19,019, +3.48% from previous year)
- 2015: $593,159 (+$28,234, +5.00% from previous year)
- 2016: $597,996 (+$4,837, +0.82% from previous year)
- 2017: $614,618 (+$16,623, +2.78% from previous year)
- 2018: $627,492 (+$12,874, +2.09% from previous year)
- 2019: $639,792 (+$12,300, +1.96% from previous year)
- 2020: $652,042 (+$12,249, +1.91% from previous year)
- 2021: $743,061 (+$91,019, +13.96% from previous year)
- 2022: $890,467 (+$147,406, +19.84% from previous year)
- 2023: $909,879 (+$19,412, +2.18% from previous year)
- 2024: $938,695 (+$28,816, +3.17% from previous year)
- 2025: $952,778 (+$14,083, +1.50% from previous year)
Shavano Park home prices are up 77% since 2010. The market has seen consistent, incremental growth each year, with notable increases during the 2021–2022 housing surge.
Shavano Park – Quiet Growth in a Private Enclave
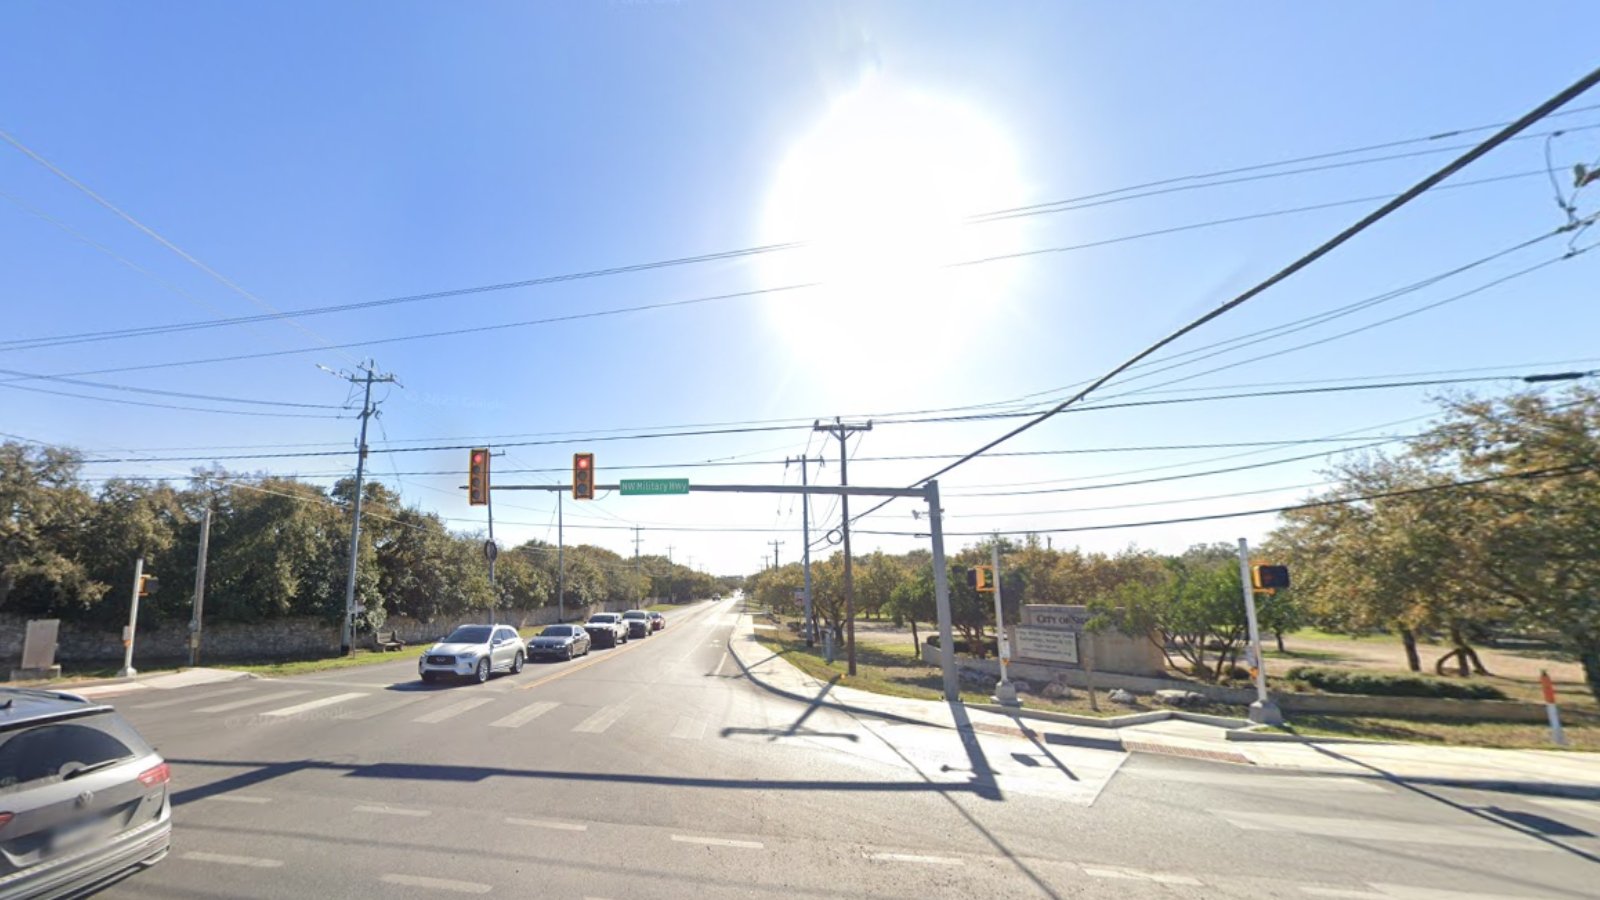
Shavano Park is a well-established, affluent suburb just north of San Antonio. Known for its large, wooded lots and gated communities, it offers a quiet, private lifestyle while staying close to city conveniences.
Unlike some markets that saw volatility, Shavano Park’s growth has been stable and steady. Its appeal lies in upscale housing, respected schools, and a strong community identity, making it a consistently high-value area.
17. Sunset Valley – 151% Home Price Increase Since 2010
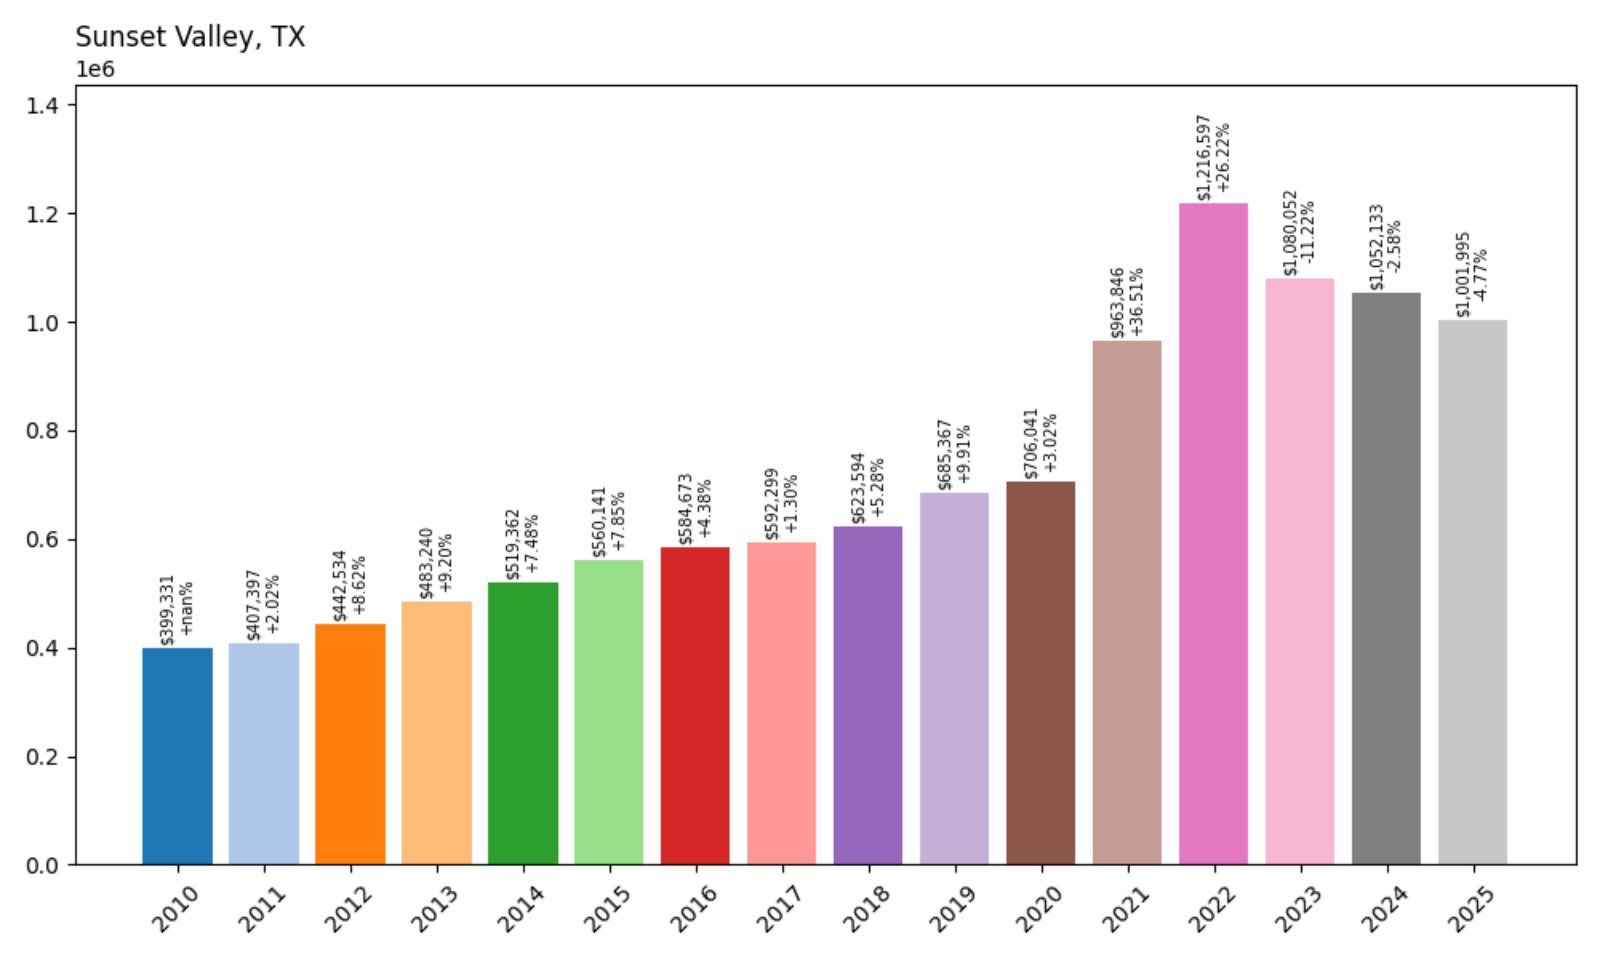
- 2010: $399,331
- 2011: $407,397 (+$8,066, +2.02% from previous year)
- 2012: $442,534 (+$35,137, +8.62% from previous year)
- 2013: $483,240 (+$40,706, +9.20% from previous year)
- 2014: $519,362 (+$36,122, +7.48% from previous year)
- 2015: $560,141 (+$40,779, +7.85% from previous year)
- 2016: $584,673 (+$24,532, +4.38% from previous year)
- 2017: $592,299 (+$7,626, +1.30% from previous year)
- 2018: $623,594 (+$31,295, +5.28% from previous year)
- 2019: $685,367 (+$61,774, +9.91% from previous year)
- 2020: $706,041 (+$20,674, +3.02% from previous year)
- 2021: $963,846 (+$257,805, +36.51% from previous year)
- 2022: $1,216,597 (+$252,751, +26.22% from previous year)
- 2023: $1,080,052 (−$136,545, −11.22% from previous year)
- 2024: $1,052,133 (−$27,919, −2.58% from previous year)
- 2025: $1,001,995 (−$50,138, −4.77% from previous year)
Sunset Valley’s home prices more than doubled since 2010, peaking in 2022 before moderating. Despite a slight recent decline, values remain among the highest in the Austin metro area.
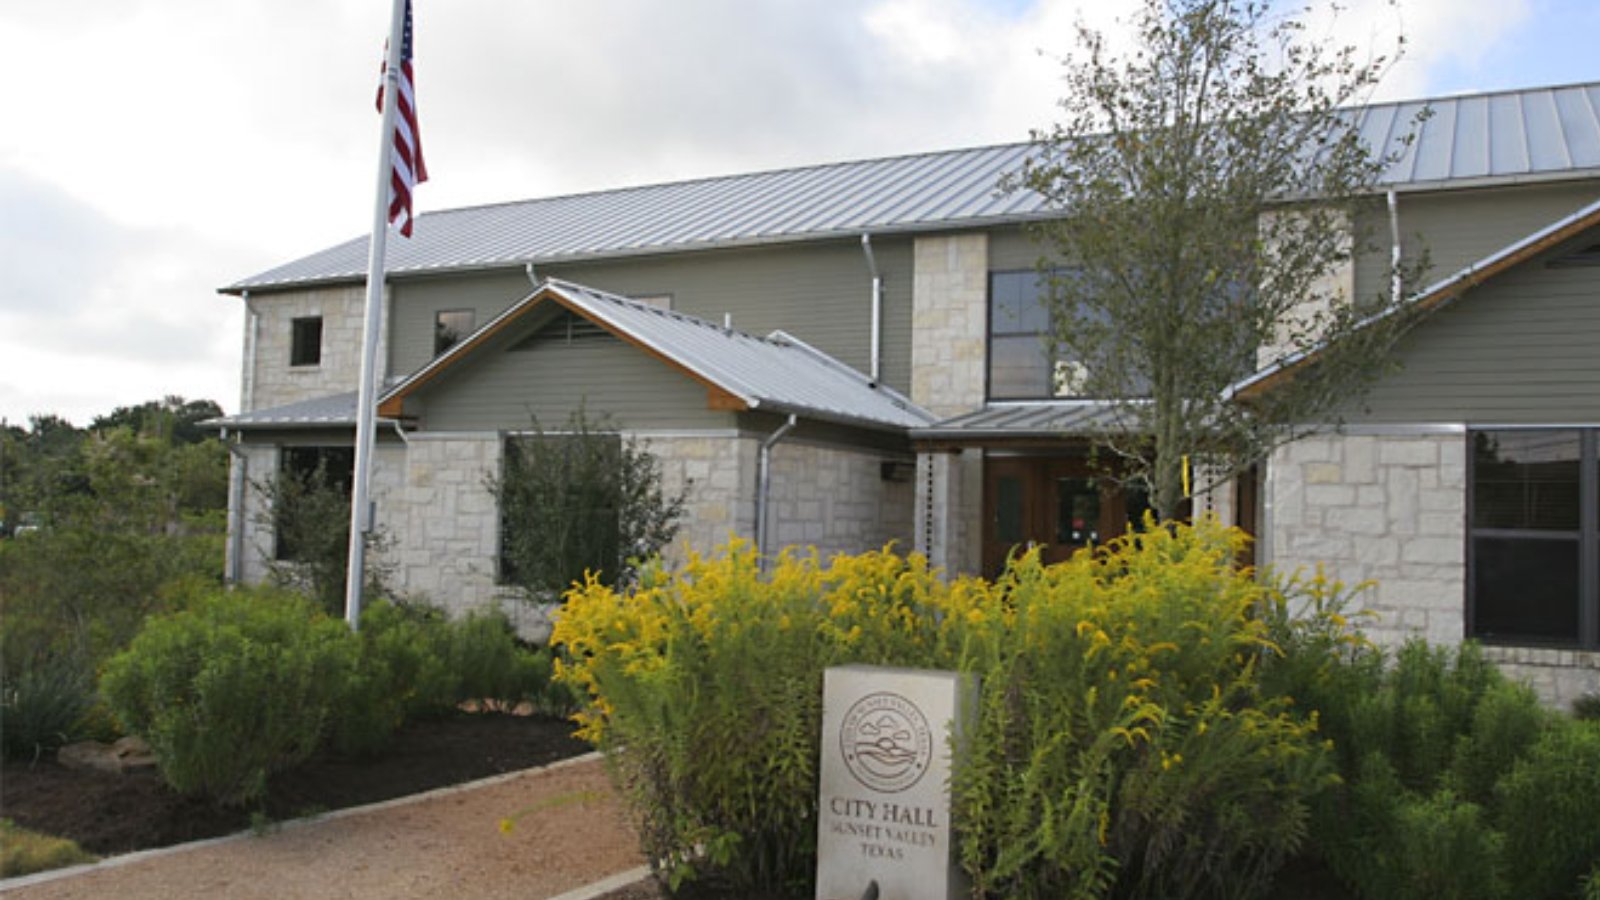
Sunset Valley – Central Austin Access, Suburban Feel
Would you like to save this?
Sunset Valley is a tiny city within the Austin city limits, offering the rare mix of urban proximity and small-town governance. Its tax advantages, spacious lots, and commercial developments have made it a unique hotspot.
Home values surged during Austin’s housing boom and have since stabilized. The town’s strategic location and low property taxes make it especially attractive to high-income buyers seeking central convenience with fewer restrictions.
16. Volente – 137% Home Price Increase Since 2010
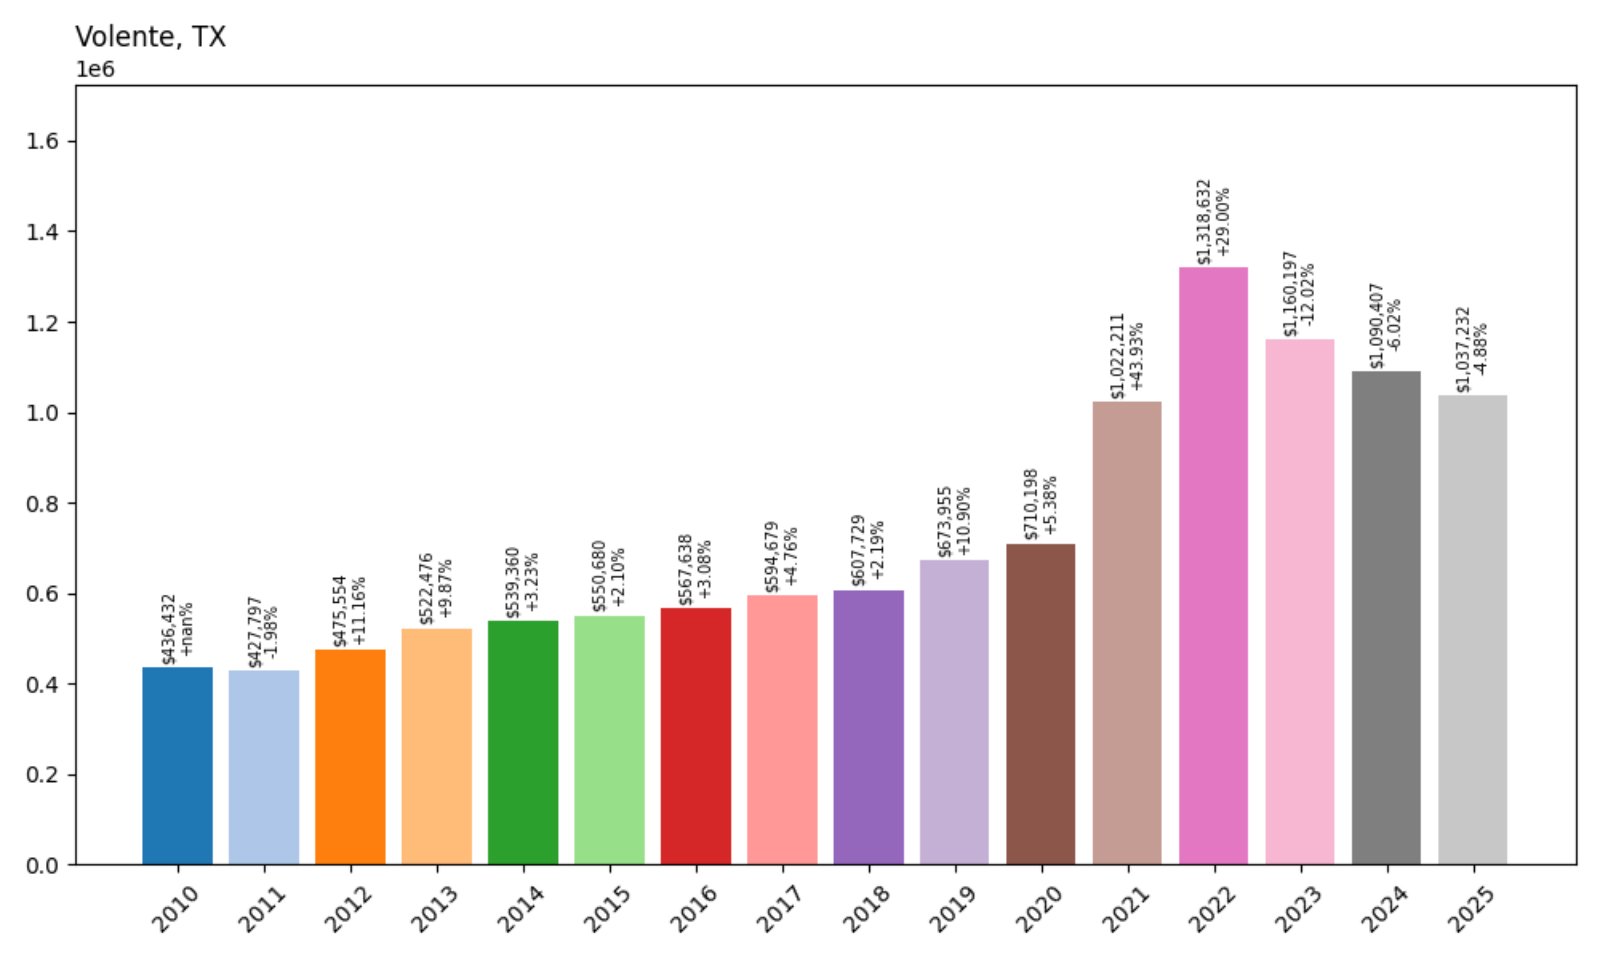
- 2010: $436,432
- 2011: $427,797 (−$8,635, −1.98% from previous year)
- 2012: $475,554 (+$47,757, +11.16% from previous year)
- 2013: $522,476 (+$46,923, +9.87% from previous year)
- 2014: $539,360 (+$16,884, +3.23% from previous year)
- 2015: $550,680 (+$11,320, +2.10% from previous year)
- 2016: $567,638 (+$16,958, +3.08% from previous year)
- 2017: $594,679 (+$27,041, +4.76% from previous year)
- 2018: $607,729 (+$13,050, +2.19% from previous year)
- 2019: $673,955 (+$66,226, +10.90% from previous year)
- 2020: $710,198 (+$36,243, +5.38% from previous year)
- 2021: $1,022,211 (+$312,013, +43.93% from previous year)
- 2022: $1,318,632 (+$296,422, +29.00% from previous year)
- 2023: $1,160,197 (−$158,436, −12.02% from previous year)
- 2024: $1,090,407 (−$69,789, −6.02% from previous year)
- 2025: $1,037,232 (−$53,175, −4.88% from previous year)
Volente’s home prices have risen 137% since 2010, with large gains in the early 2020s. Recent years show a gentle retreat from its 2022 peak, but values remain among the highest in the Austin area.
Volente – Hill Country Views, Lake Travis Access
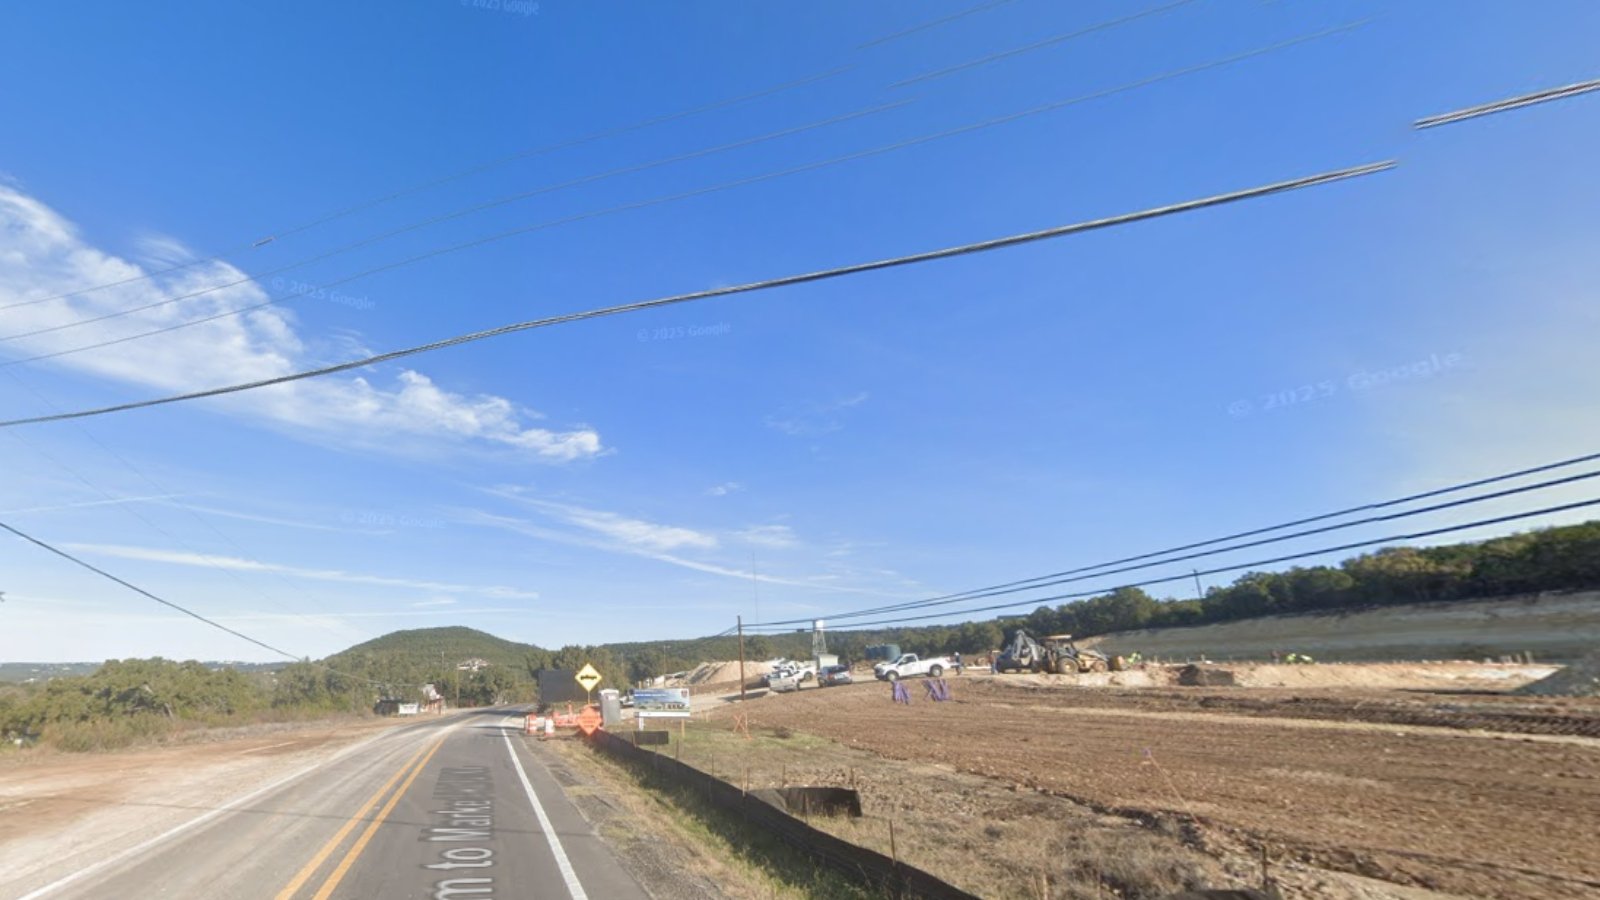
Volente is a small village along the north shore of Lake Travis in Travis County. Its appeal stems from panoramic lake views, hilly terrain, and low-density development. Despite being just 30 minutes from downtown Austin, it feels worlds away.
The pandemic-era migration to lake and nature-adjacent areas led to a sharp rise in Volente’s property values. While some heat has come off, the area’s exclusivity and natural beauty ensure it remains a top-tier market for luxury buyers.
15. Lucas – 174% Home Price Increase Since 2010

- 2010: $395,297
- 2011: $388,337 (−$6,959, −1.76% from previous year)
- 2012: $401,891 (+$13,553, +3.49% from previous year)
- 2013: $441,318 (+$39,427, +9.81% from previous year)
- 2014: $482,057 (+$40,739, +9.23% from previous year)
- 2015: $532,716 (+$50,659, +10.51% from previous year)
- 2016: $570,222 (+$37,507, +7.04% from previous year)
- 2017: $602,613 (+$32,390, +5.68% from previous year)
- 2018: $635,914 (+$33,302, +5.53% from previous year)
- 2019: $642,839 (+$6,925, +1.09% from previous year)
- 2020: $666,383 (+$23,543, +3.66% from previous year)
- 2021: $819,375 (+$152,992, +22.96% from previous year)
- 2022: $1,111,901 (+$292,526, +35.70% from previous year)
- 2023: $1,052,372 (−$59,529, −5.35% from previous year)
- 2024: $1,091,748 (+$39,376, +3.74% from previous year)
- 2025: $1,083,245 (−$8,502, −0.78% from previous year)
Lucas saw its home prices rise by a remarkable 174% since 2010. Though there’s been slight fluctuation since the 2022 peak, prices remain high thanks to long-term growth and ongoing demand.
Lucas – Space, Schools, and Suburban Prestige
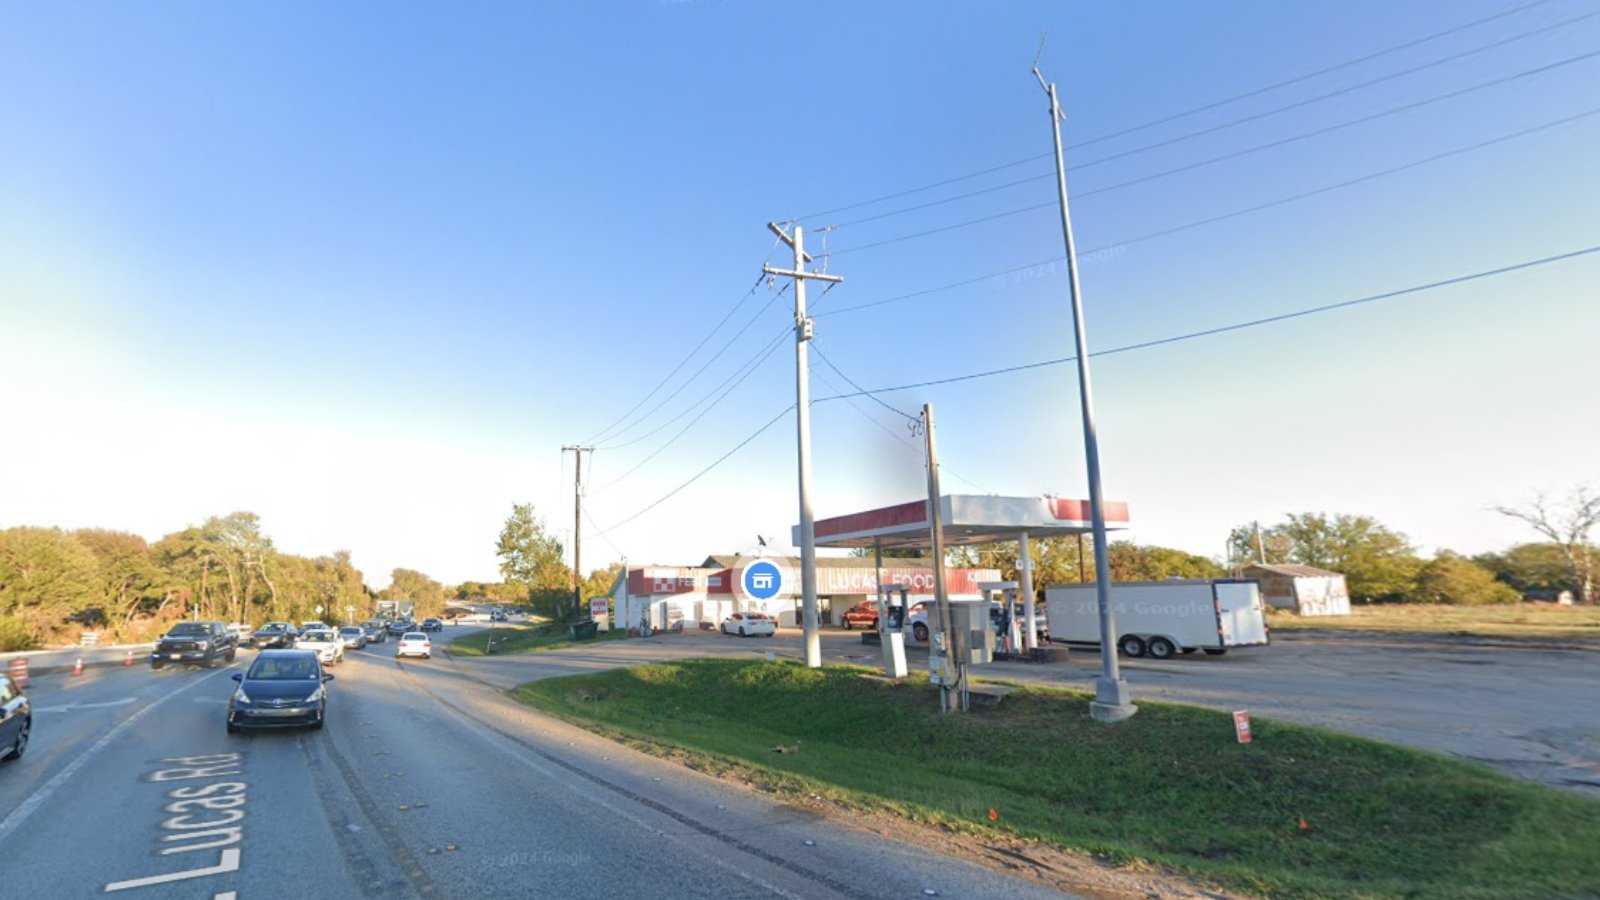
Located in Collin County, Lucas has become one of the Dallas area’s most desirable suburbs. Known for large-lot zoning, equestrian properties, and top-ranked Lovejoy ISD, it offers a luxury lifestyle just minutes from Allen and Plano.
Much of the price appreciation occurred during the work-from-home boom when buyers sought more space without sacrificing proximity to city jobs. With limited new development and high-income households, Lucas continues to command premium prices.
14. Copper Canyon – 173% Home Price Increase Since 2010
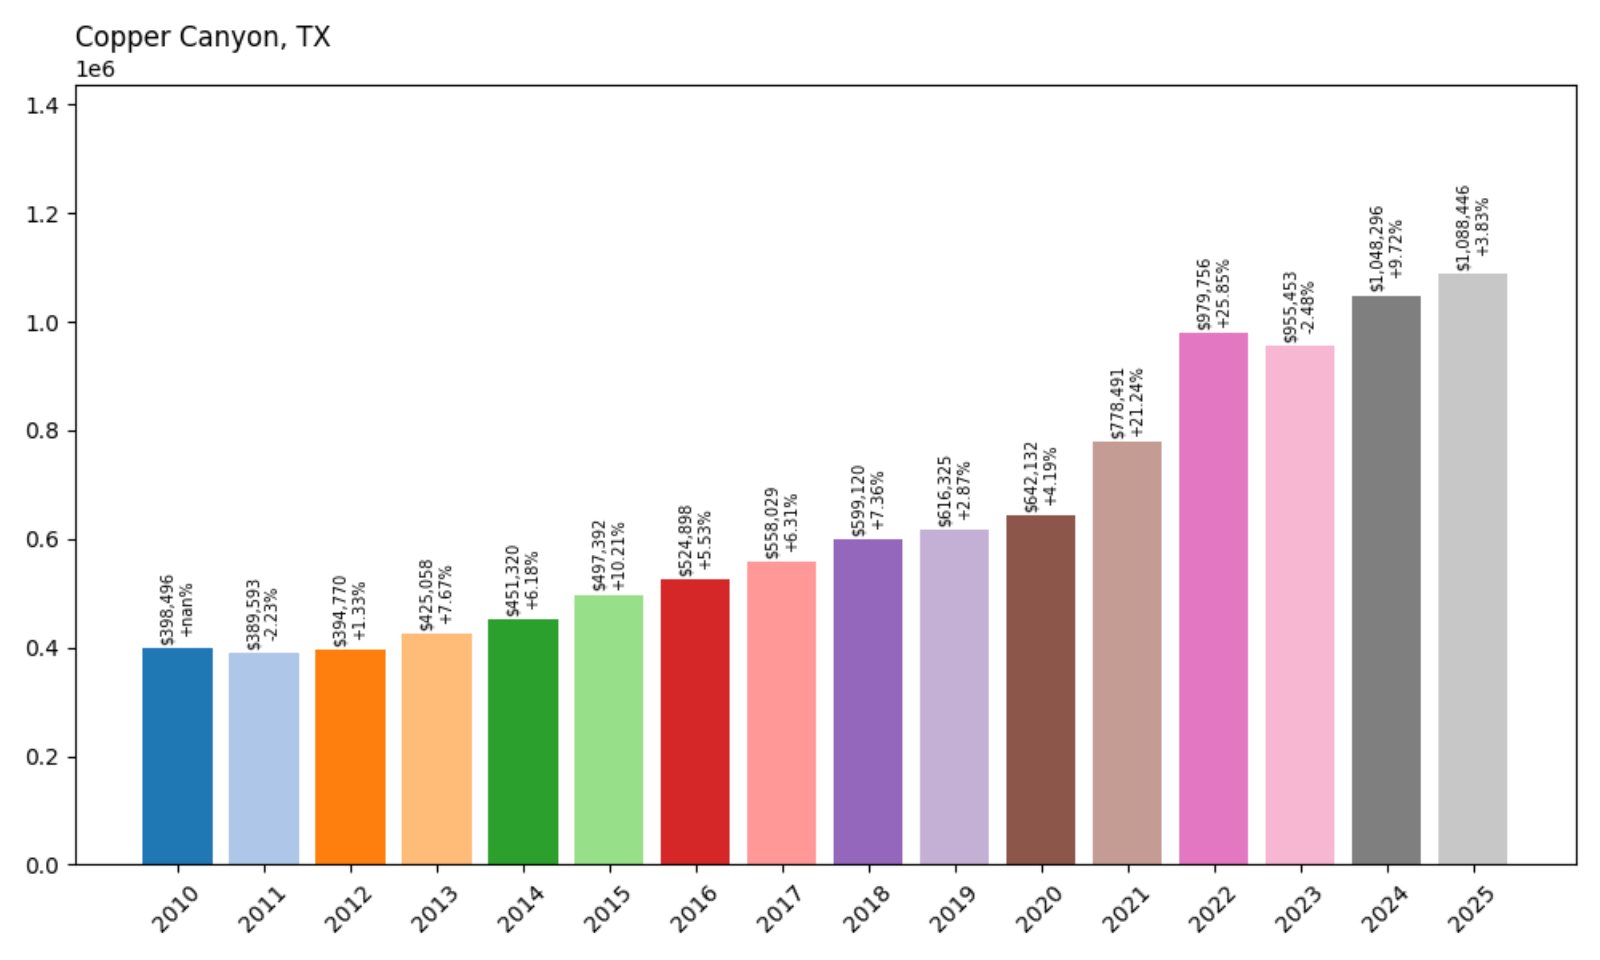
- 2010: $398,496
- 2011: $389,593 (−$8,903, −2.23% from previous year)
- 2012: $394,770 (+$5,177, +1.33% from previous year)
- 2013: $425,058 (+$30,288, +7.67% from previous year)
- 2014: $451,320 (+$26,262, +6.18% from previous year)
- 2015: $497,392 (+$46,072, +10.21% from previous year)
- 2016: $524,898 (+$27,506, +5.53% from previous year)
- 2017: $558,029 (+$33,131, +6.31% from previous year)
- 2018: $599,120 (+$41,090, +7.36% from previous year)
- 2019: $616,325 (+$17,205, +2.87% from previous year)
- 2020: $642,132 (+$25,807, +4.19% from previous year)
- 2021: $778,491 (+$136,359, +21.24% from previous year)
- 2022: $979,756 (+$201,265, +25.85% from previous year)
- 2023: $955,453 (−$24,303, −2.48% from previous year)
- 2024: $1,048,296 (+$92,844, +9.72% from previous year)
- 2025: $1,088,446 (+$40,150, +3.83% from previous year)
Copper Canyon’s prices have nearly tripled since 2010, with especially strong growth from 2020 to 2022. Despite a small decline in 2023, values recovered and rose again in 2024 and 2025.
Copper Canyon – Rural Feel, Rapid Growth
Copper Canyon is a small town in Denton County offering a rural lifestyle with quick access to Flower Mound and Highland Village. Known for its spacious lots and horse-friendly zoning, it appeals to high-income buyers who want space without sacrificing access to amenities.
Major infrastructure improvements nearby and demand for larger homes drove its price growth. Continued residential interest and proximity to top schools have made Copper Canyon one of the state’s priciest small towns.
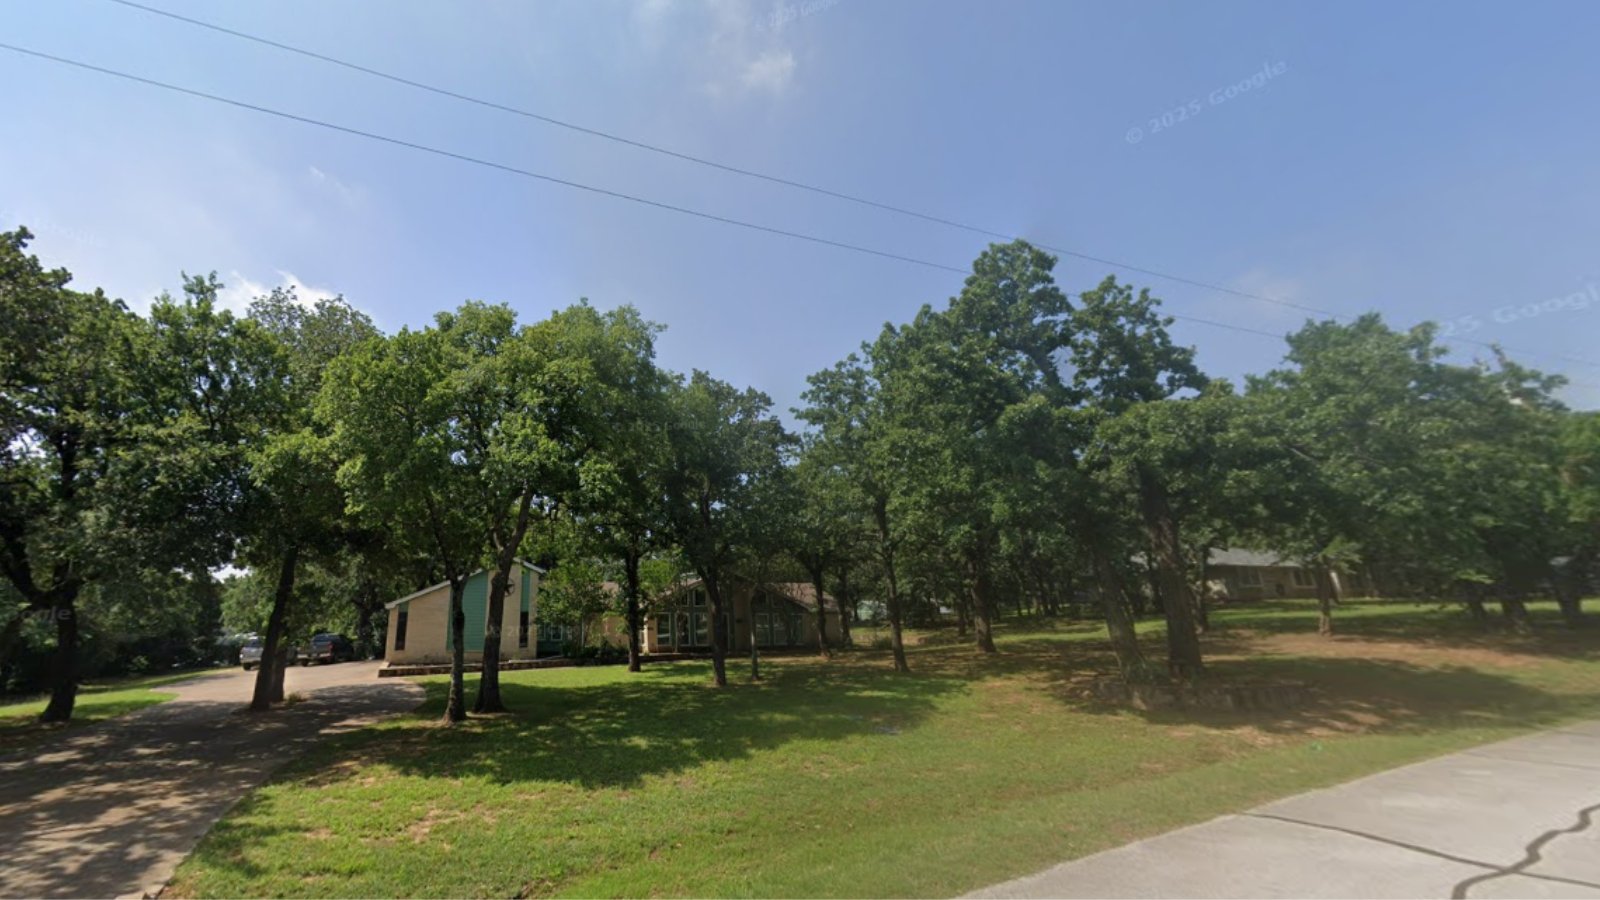
13. Parker – 151% Home Price Increase Since 2010
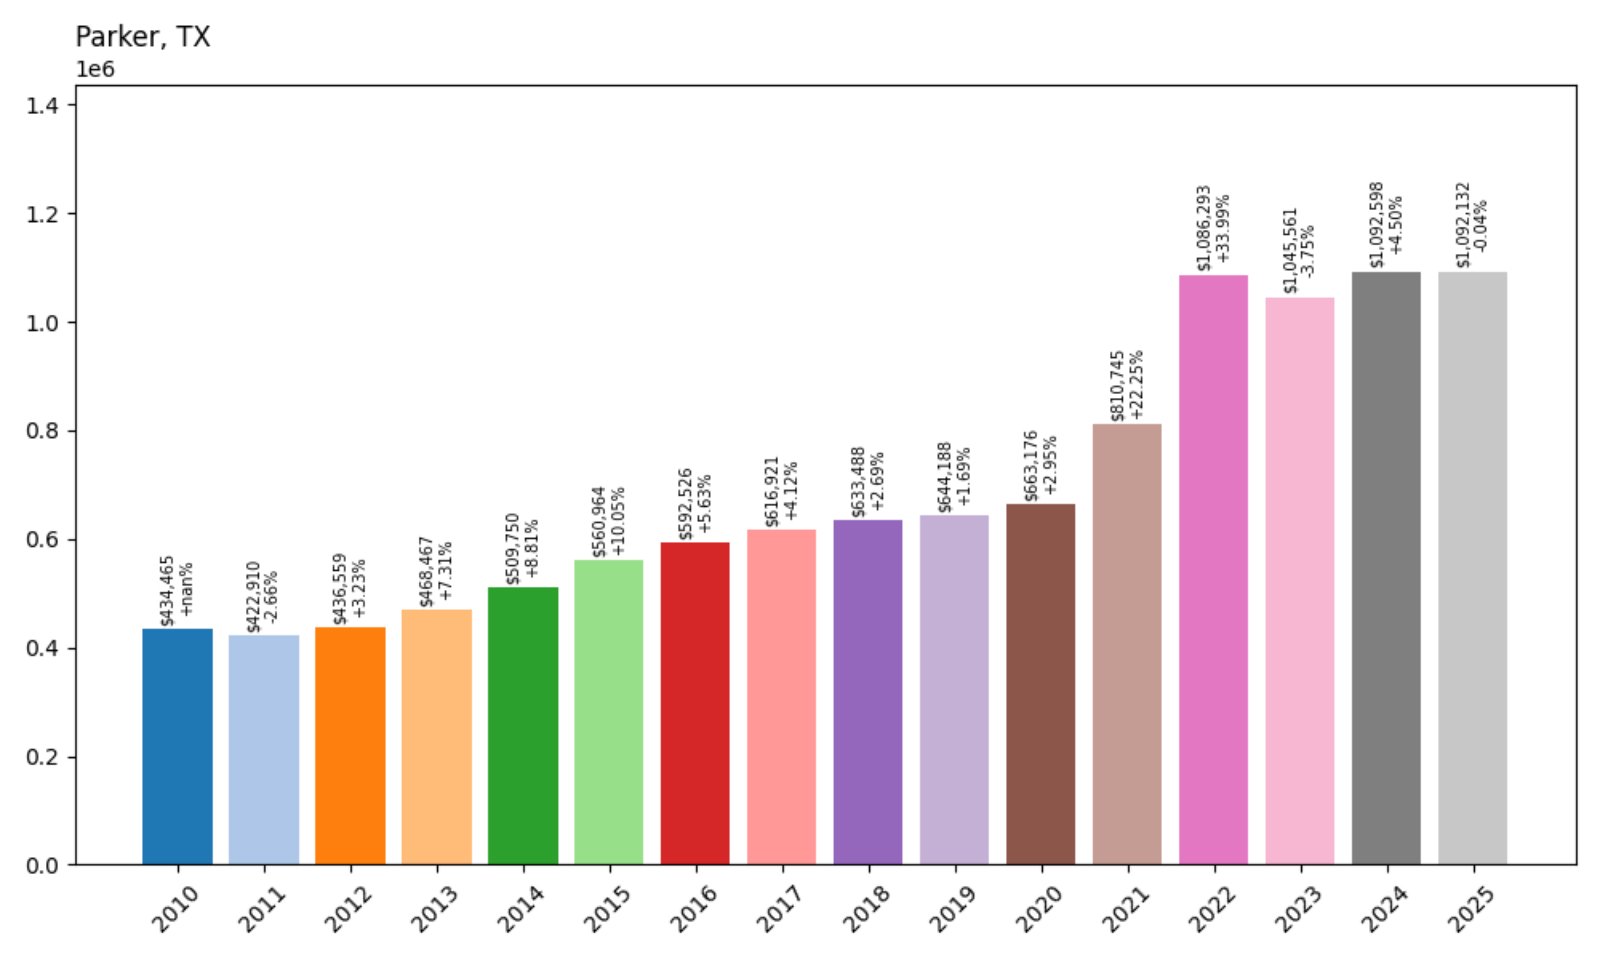
- 2010: $434,465
- 2011: $422,910 (−$11,555, −2.66% from previous year)
- 2012: $436,559 (+$13,649, +3.23% from previous year)
- 2013: $468,467 (+$31,908, +7.31% from previous year)
- 2014: $509,750 (+$41,284, +8.81% from previous year)
- 2015: $560,964 (+$51,214, +10.05% from previous year)
- 2016: $592,526 (+$31,562, +5.63% from previous year)
- 2017: $616,921 (+$24,395, +4.12% from previous year)
- 2018: $633,488 (+$16,567, +2.69% from previous year)
- 2019: $644,188 (+$10,700, +1.69% from previous year)
- 2020: $663,176 (+$18,987, +2.95% from previous year)
- 2021: $810,745 (+$147,569, +22.25% from previous year)
- 2022: $1,086,293 (+$275,548, +33.99% from previous year)
- 2023: $1,045,561 (−$40,732, −3.75% from previous year)
- 2024: $1,092,598 (+$47,037, +4.50% from previous year)
- 2025: $1,092,132 (−$466, −0.04% from previous year)
Parker’s home values surged over 150% since 2010, with massive increases in 2021 and 2022. Though prices dipped in 2023, they’ve stabilized since and remain among the highest in the region.
Parker – Large Homes and Country Comfort
Parker is located in Collin County, northeast of Plano, and is known for its estate-style homes and wide-open lots. Many homes in the area span over an acre, making it especially attractive to those who want luxury with room to spread out.
The city benefits from its proximity to DFW tech hubs while retaining a more relaxed pace. Strong schools, upscale housing, and limited commercial development have helped Parker hold onto its high real estate values.
12. Bellaire – 68% Home Price Increase Since 2010
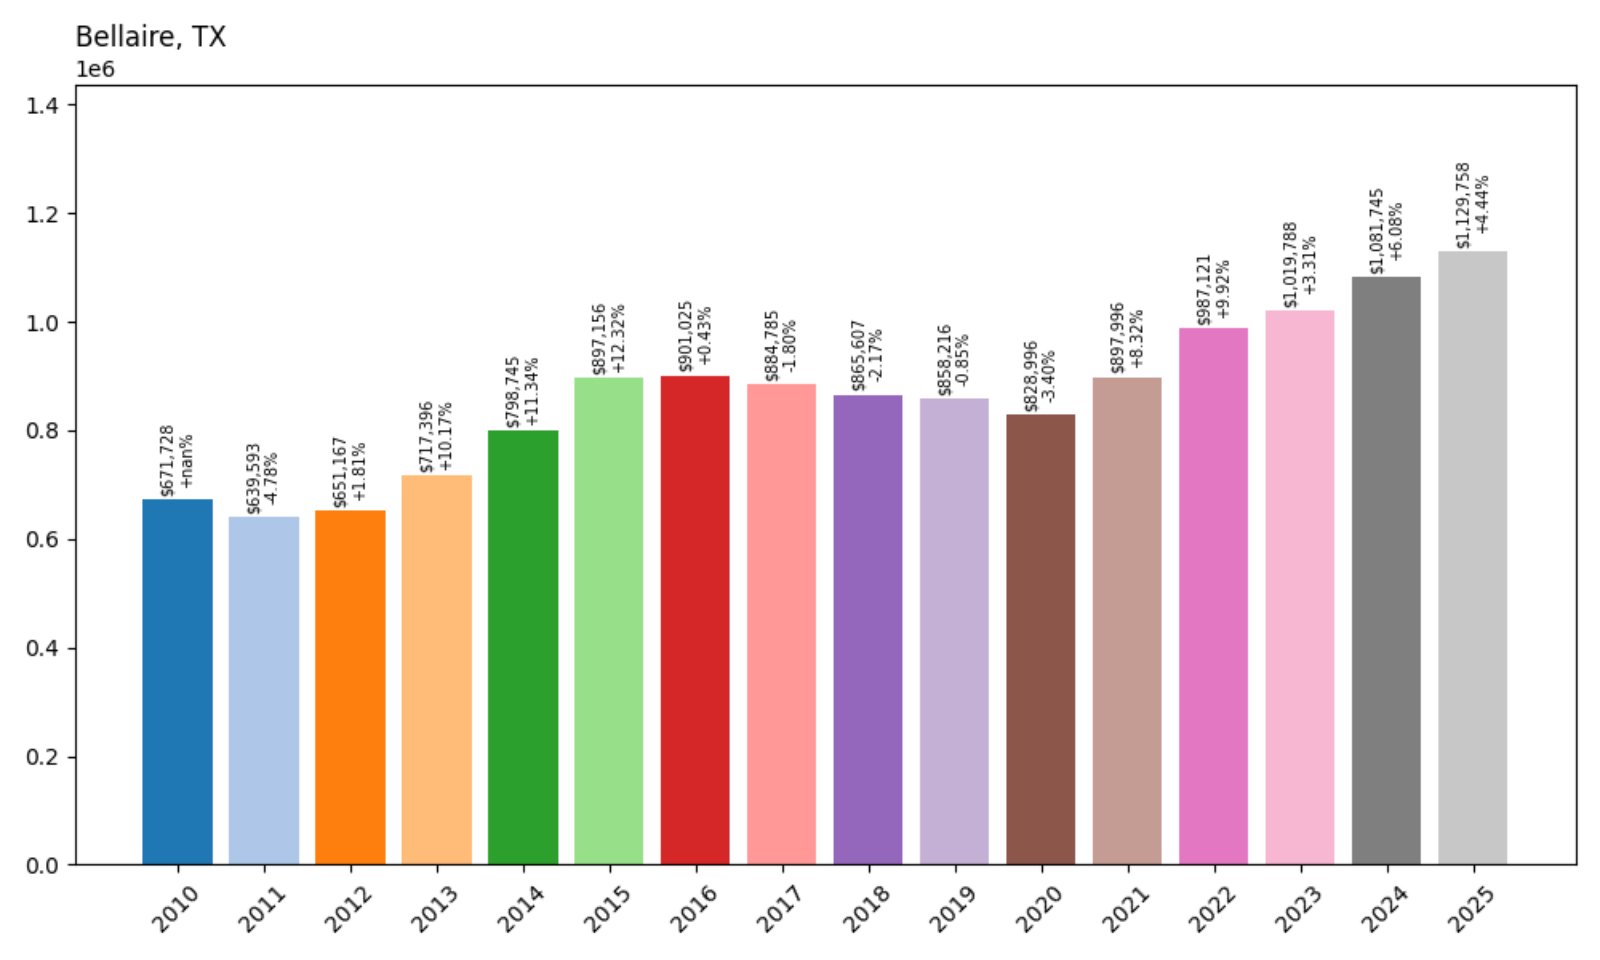
- 2010: $671,728
- 2011: $639,593 (−$32,135, −4.78% from previous year)
- 2012: $651,167 (+$11,574, +1.81% from previous year)
- 2013: $717,396 (+$66,229, +10.17% from previous year)
- 2014: $798,745 (+$81,349, +11.34% from previous year)
- 2015: $897,156 (+$98,410, +12.32% from previous year)
- 2016: $901,025 (+$3,869, +0.43% from previous year)
- 2017: $884,785 (−$16,240, −1.80% from previous year)
- 2018: $865,607 (−$19,178, −2.17% from previous year)
- 2019: $858,216 (−$7,392, −0.85% from previous year)
- 2020: $828,996 (−$29,220, −3.40% from previous year)
- 2021: $897,996 (+$69,000, +8.32% from previous year)
- 2022: $987,121 (+$89,125, +9.92% from previous year)
- 2023: $1,019,788 (+$32,667, +3.31% from previous year)
- 2024: $1,081,745 (+$61,957, +6.08% from previous year)
- 2025: $1,129,758 (+$48,013, +4.44% from previous year)
Bellaire’s home values increased 68% over the past 15 years. After a soft period from 2016 to 2020, the market rebounded with steady growth into 2025, putting it firmly in the top tier of Texas home values.
Bellaire – High-End Living Inside the Loop
Bellaire is a sought-after residential enclave within Houston’s I-610 loop, known for its well-rated schools, tree-lined streets, and proximity to the Texas Medical Center and Galleria area. It blends suburban serenity with big-city access.
Though prices dipped slightly in the late 2010s, a resurgence in demand and limited inventory helped values climb again post-2020. Bellaire remains one of the most desirable and affluent communities in the Houston area.
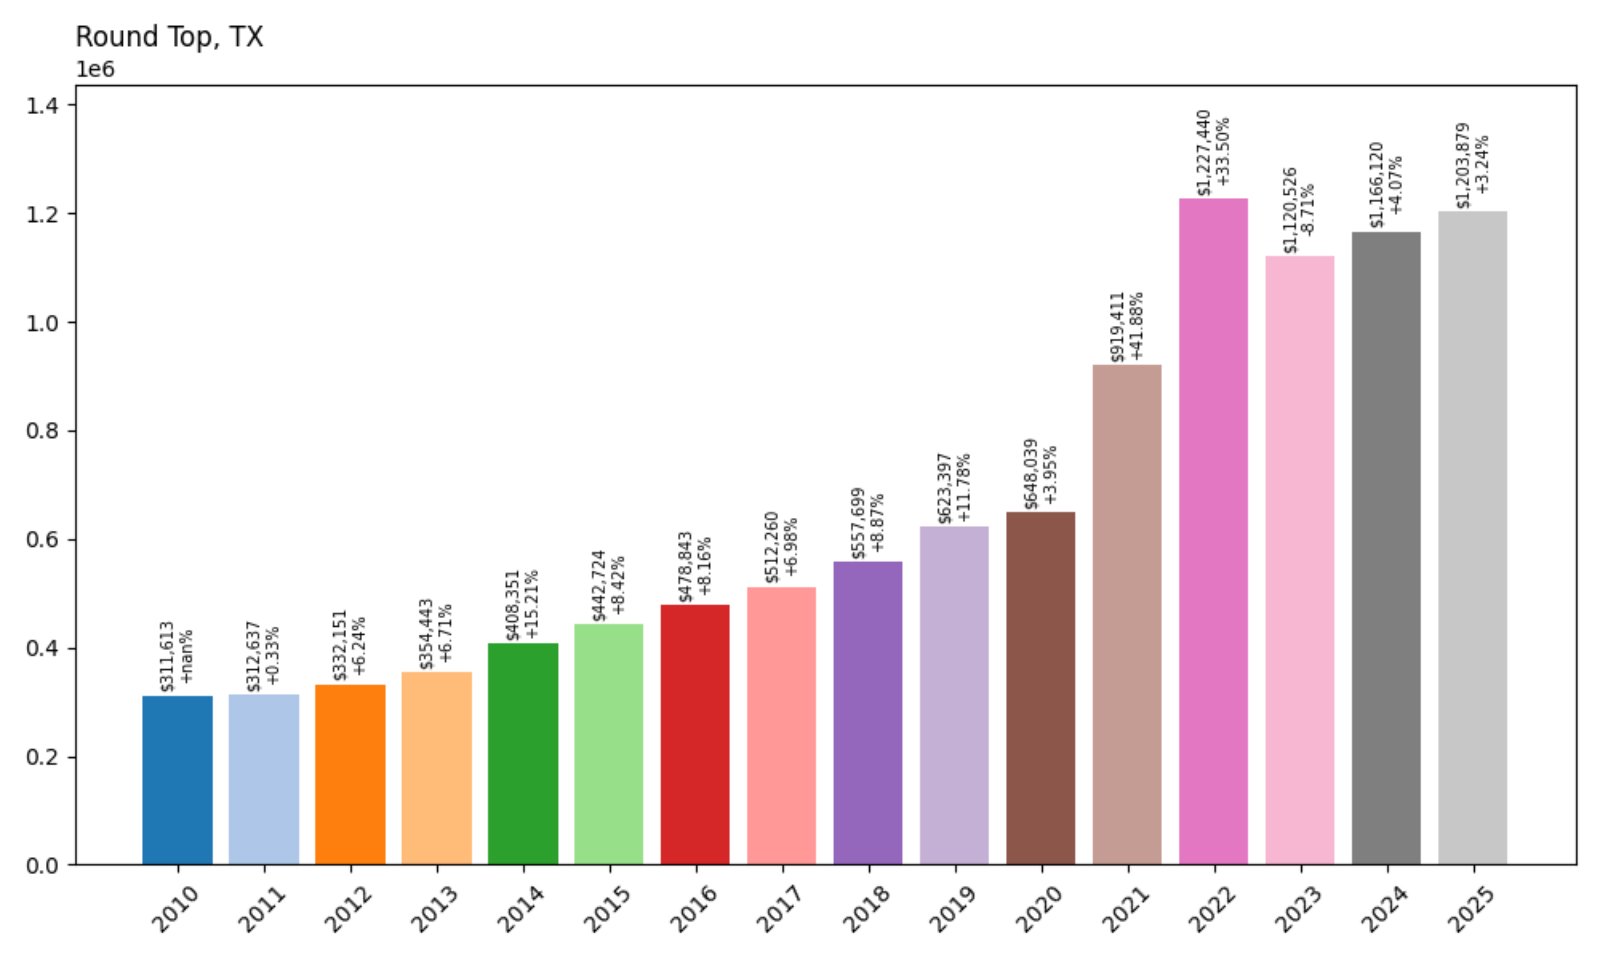
11. Round Top – 286% Home Price Increase Since 2010
- 2010: $311,613
- 2011: $312,637 (+$1,024, +0.33% from previous year)
- 2012: $332,151 (+$19,513, +6.24% from previous year)
- 2013: $354,443 (+$22,293, +6.71% from previous year)
- 2014: $408,351 (+$53,907, +15.21% from previous year)
- 2015: $442,724 (+$34,374, +8.42% from previous year)
- 2016: $478,843 (+$36,119, +8.16% from previous year)
- 2017: $512,260 (+$33,417, +6.98% from previous year)
- 2018: $557,699 (+$45,438, +8.87% from previous year)
- 2019: $623,397 (+$65,699, +11.78% from previous year)
- 2020: $648,039 (+$24,642, +3.95% from previous year)
- 2021: $919,411 (+$271,372, +41.88% from previous year)
- 2022: $1,227,440 (+$308,029, +33.50% from previous year)
- 2023: $1,120,526 (−$106,915, −8.71% from previous year)
- 2024: $1,166,120 (+$45,595, +4.07% from previous year)
- 2025: $1,203,879 (+$37,759, +3.24% from previous year)
Round Top’s home prices have nearly tripled since 2010, boosted by a major surge during the pandemic years. The town remains a top-tier market for buyers seeking charm, land, and exclusivity.
Round Top – Tiny Town, Big Real Estate
Round Top in Fayette County is famed for its antique fairs and historic charm. Despite a population under 100, the town draws thousands of visitors annually and attracts buyers from across Texas and beyond looking for luxury ranches and quiet retreats.
Its housing market reflects this exclusivity: limited inventory, sprawling properties, and significant out-of-town investment. High demand for second homes and rural luxury has kept prices consistently strong even as the broader market cools.
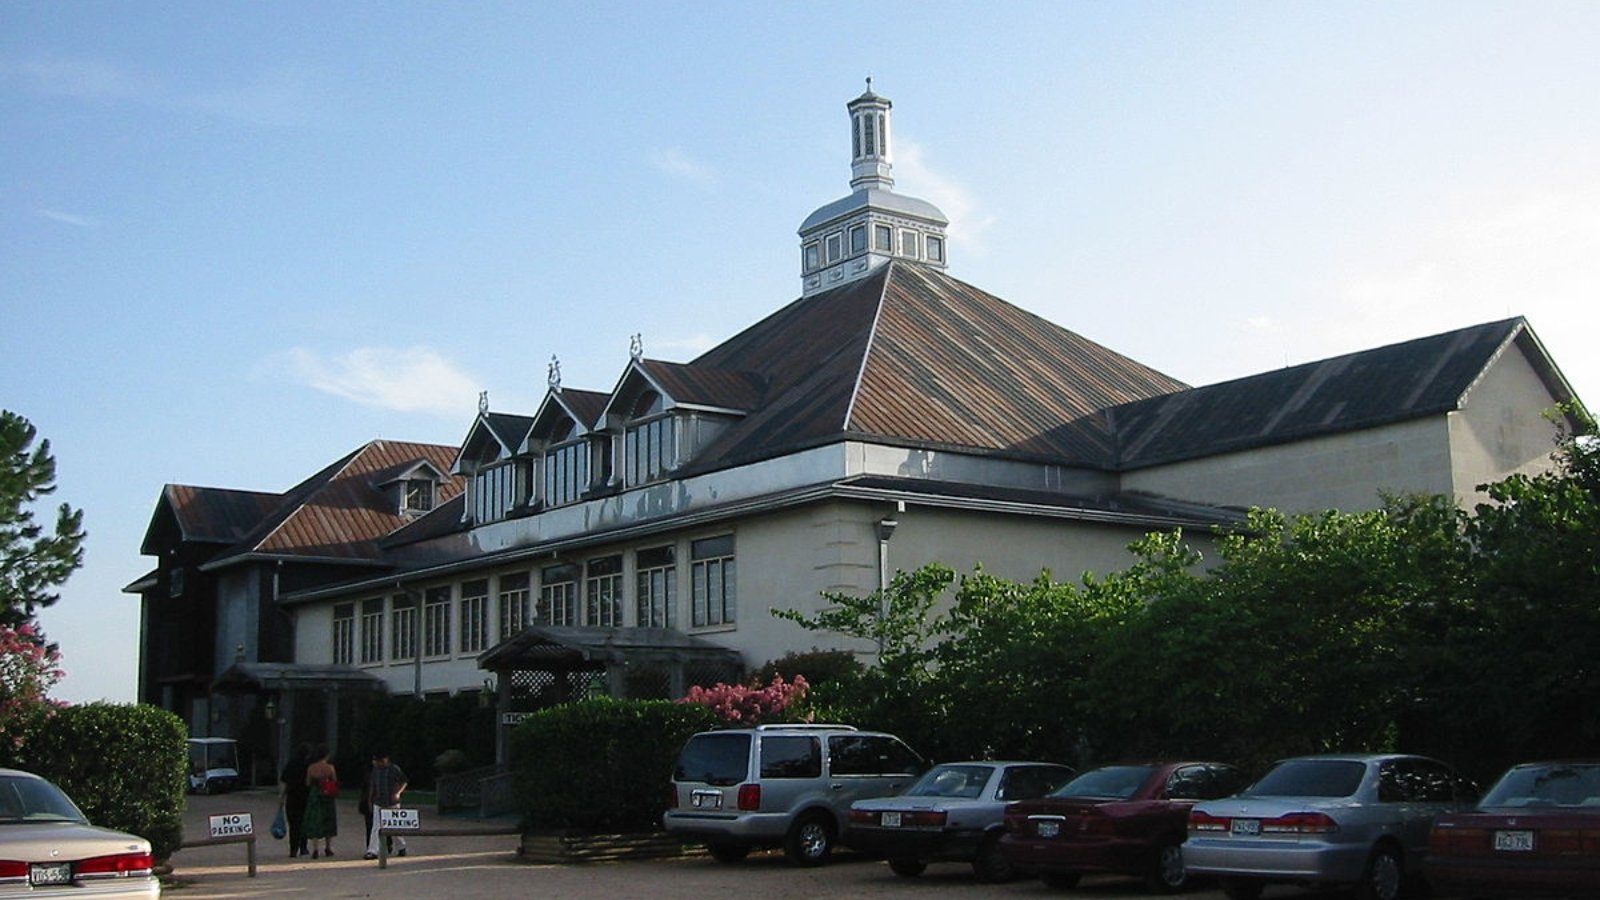
10. Hill Country Village – 85% Home Price Increase Since 2010
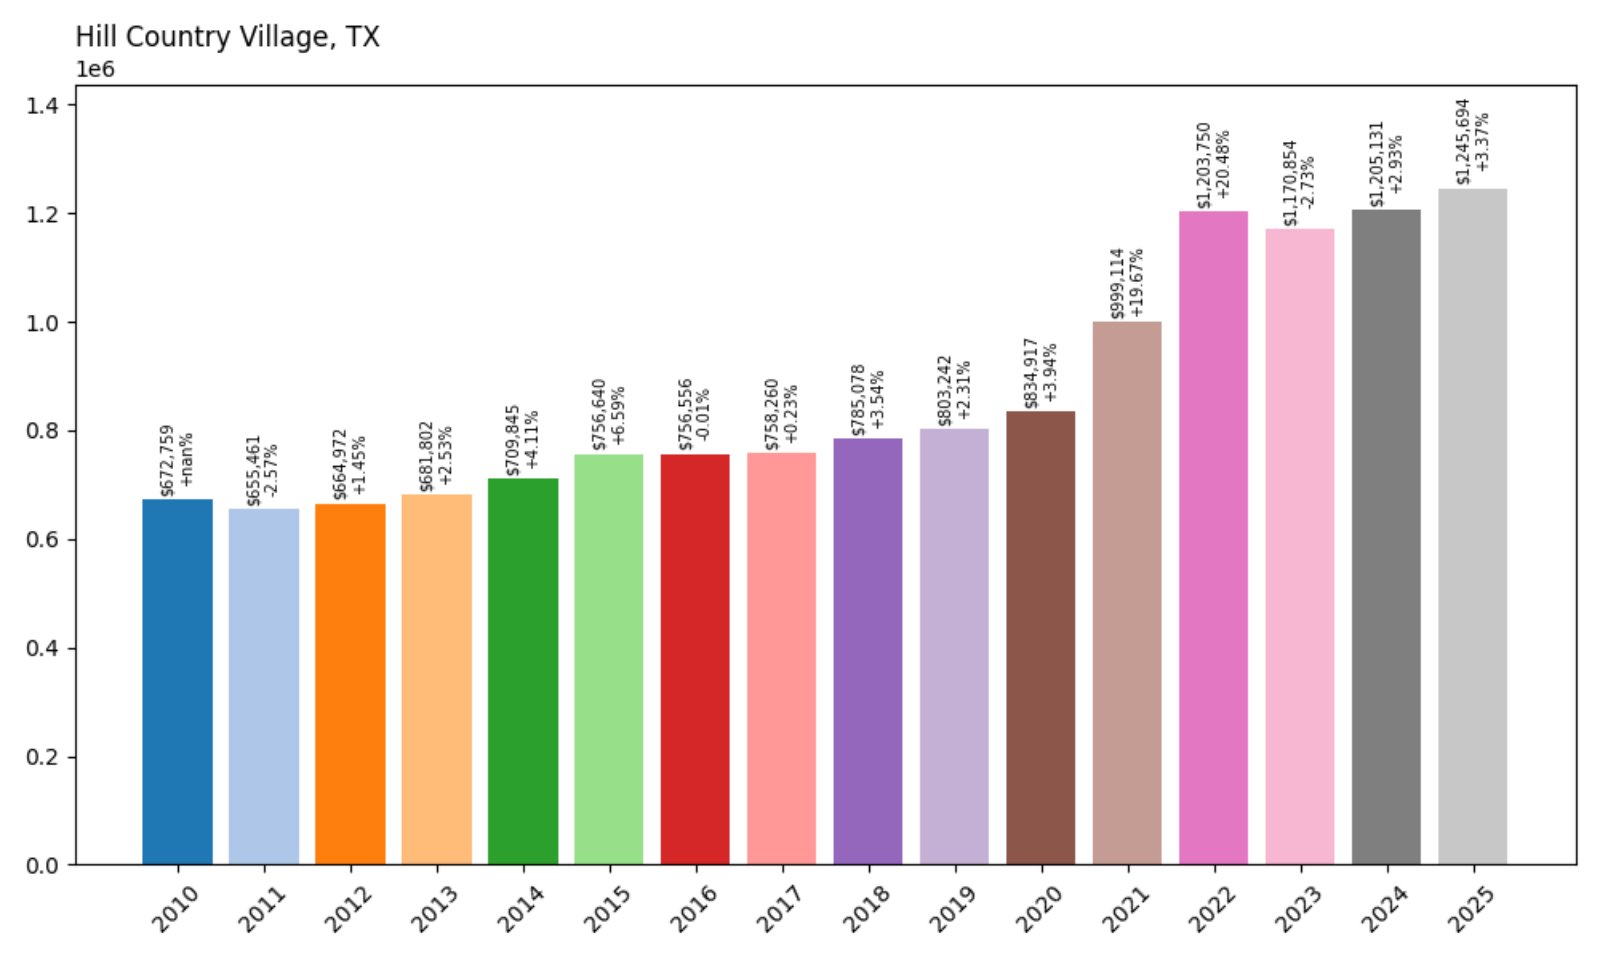
- 2010: $672,759
- 2011: $655,461 (−$17,298, −2.57% from previous year)
- 2012: $664,972 (+$9,512, +1.45% from previous year)
- 2013: $681,802 (+$16,829, +2.53% from previous year)
- 2014: $709,845 (+$28,043, +4.11% from previous year)
- 2015: $756,640 (+$46,795, +6.59% from previous year)
- 2016: $756,556 (−$84, −0.01% from previous year)
- 2017: $758,260 (+$1,704, +0.23% from previous year)
- 2018: $785,078 (+$26,818, +3.54% from previous year)
- 2019: $803,242 (+$18,164, +2.31% from previous year)
- 2020: $834,917 (+$31,675, +3.94% from previous year)
- 2021: $999,114 (+$164,197, +19.67% from previous year)
- 2022: $1,203,750 (+$204,637, +20.48% from previous year)
- 2023: $1,170,854 (−$32,897, −2.73% from previous year)
- 2024: $1,205,131 (+$34,277, +2.93% from previous year)
- 2025: $1,245,694 (+$40,563, +3.37% from previous year)
Hill Country Village has maintained steady growth in home prices, gaining 85% since 2010. While values fluctuated slightly in recent years, they remain on an upward trend as of 2025.
Hill Country Village – Estate Living Near San Antonio
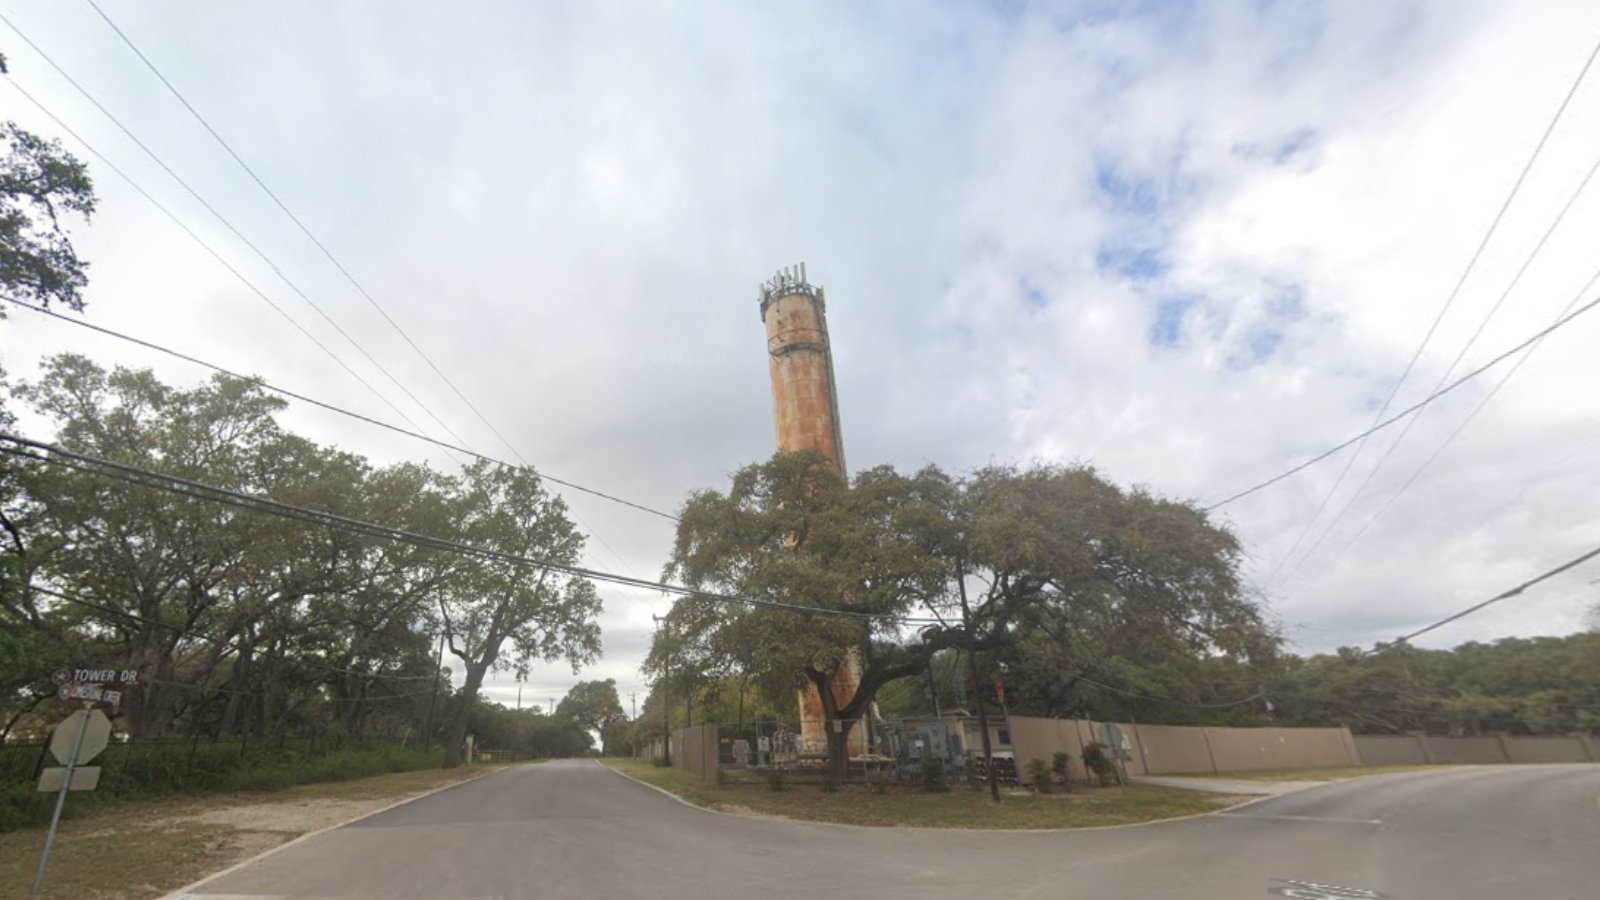
Located just north of downtown San Antonio, Hill Country Village offers large lots, private estates, and wooded acreage in an exclusive setting. It’s one of the smallest cities in Bexar County but consistently ranks among the wealthiest.
Strict zoning and limited development preserve its character and drive long-term value. The combination of space, seclusion, and proximity to city services continues to make Hill Country Village one of Texas’s most elite housing markets.
9. Southlake – 149% Home Price Increase Since 2010

- 2010: $508,152
- 2011: $492,515 (−$15,637, −3.08% from previous year)
- 2012: $501,454 (+$8,939, +1.81% from previous year)
- 2013: $534,320 (+$32,867, +6.55% from previous year)
- 2014: $570,798 (+$36,477, +6.83% from previous year)
- 2015: $613,035 (+$42,238, +7.40% from previous year)
- 2016: $647,100 (+$34,065, +5.56% from previous year)
- 2017: $671,882 (+$24,782, +3.83% from previous year)
- 2018: $697,160 (+$25,278, +3.76% from previous year)
- 2019: $717,411 (+$20,251, +2.90% from previous year)
- 2020: $740,622 (+$23,211, +3.24% from previous year)
- 2021: $894,377 (+$153,755, +20.76% from previous year)
- 2022: $1,189,976 (+$295,599, +33.05% from previous year)
- 2023: $1,159,918 (−$30,058, −2.53% from previous year)
- 2024: $1,237,006 (+$77,087, +6.65% from previous year)
- 2025: $1,264,194 (+$27,188, +2.20% from previous year)
Southlake home prices have climbed nearly 150% since 2010, driven by steady growth and dramatic surges in the early 2020s. The market remains strong as of 2025, with continued upward movement in prices.
Southlake – Affluent and Always in Demand
Southlake is one of the most prestigious suburbs in North Texas, known for its excellent schools, high-end retail, and large custom homes. Located between Dallas and Fort Worth, it attracts executives and professionals from across the metroplex.
The strong job market, spacious neighborhoods, and renowned Carroll ISD help sustain demand. Even during market slowdowns, Southlake remains a beacon of long-term home value appreciation in the state.
8. Lost Creek – 198% Home Price Increase Since 2010
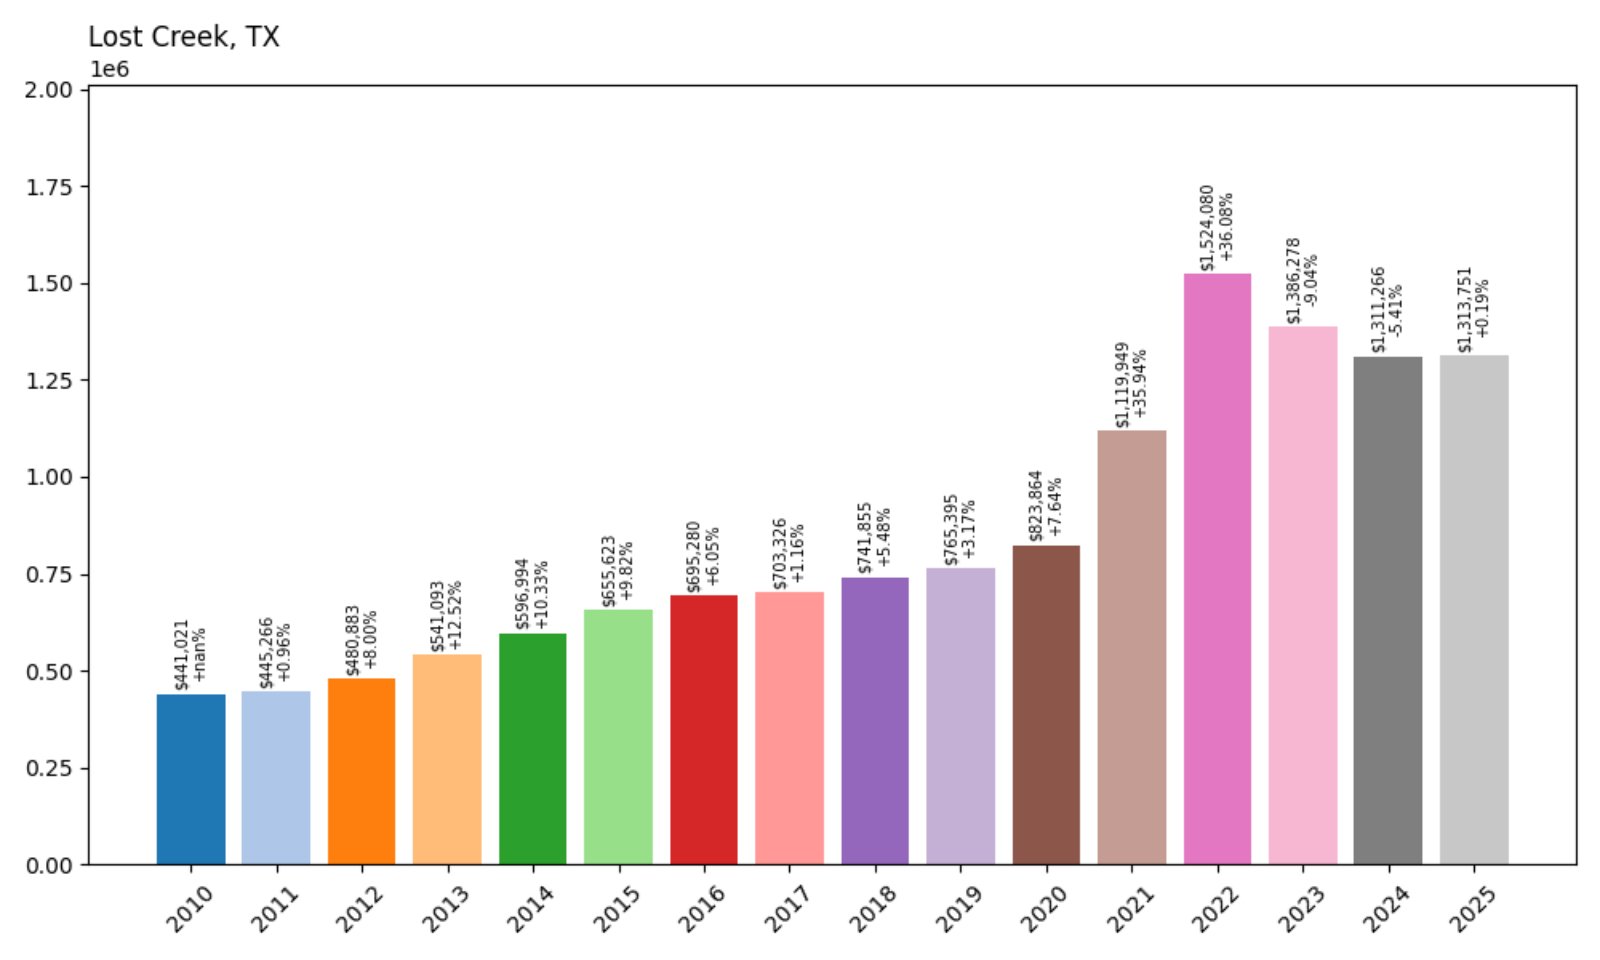
- 2010: $441,021
- 2011: $445,266 (+$4,245, +0.96% from previous year)
- 2012: $480,883 (+$35,617, +8.00% from previous year)
- 2013: $541,093 (+$60,210, +12.52% from previous year)
- 2014: $596,994 (+$55,901, +10.33% from previous year)
- 2015: $655,623 (+$58,629, +9.82% from previous year)
- 2016: $695,280 (+$39,657, +6.05% from previous year)
- 2017: $703,326 (+$8,045, +1.16% from previous year)
- 2018: $741,855 (+$38,529, +5.48% from previous year)
- 2019: $765,395 (+$23,540, +3.17% from previous year)
- 2020: $823,864 (+$58,469, +7.64% from previous year)
- 2021: $1,119,949 (+$296,085, +35.94% from previous year)
- 2022: $1,524,080 (+$404,132, +36.08% from previous year)
- 2023: $1,386,278 (−$137,802, −9.04% from previous year)
- 2024: $1,311,266 (−$75,013, −5.41% from previous year)
- 2025: $1,313,751 (+$2,486, +0.19% from previous year)
Lost Creek has nearly tripled in value since 2010. Although the market cooled after a peak in 2022, home prices remain very high and have stabilized in 2025.
Lost Creek – Austin’s Quiet Luxury Pocket
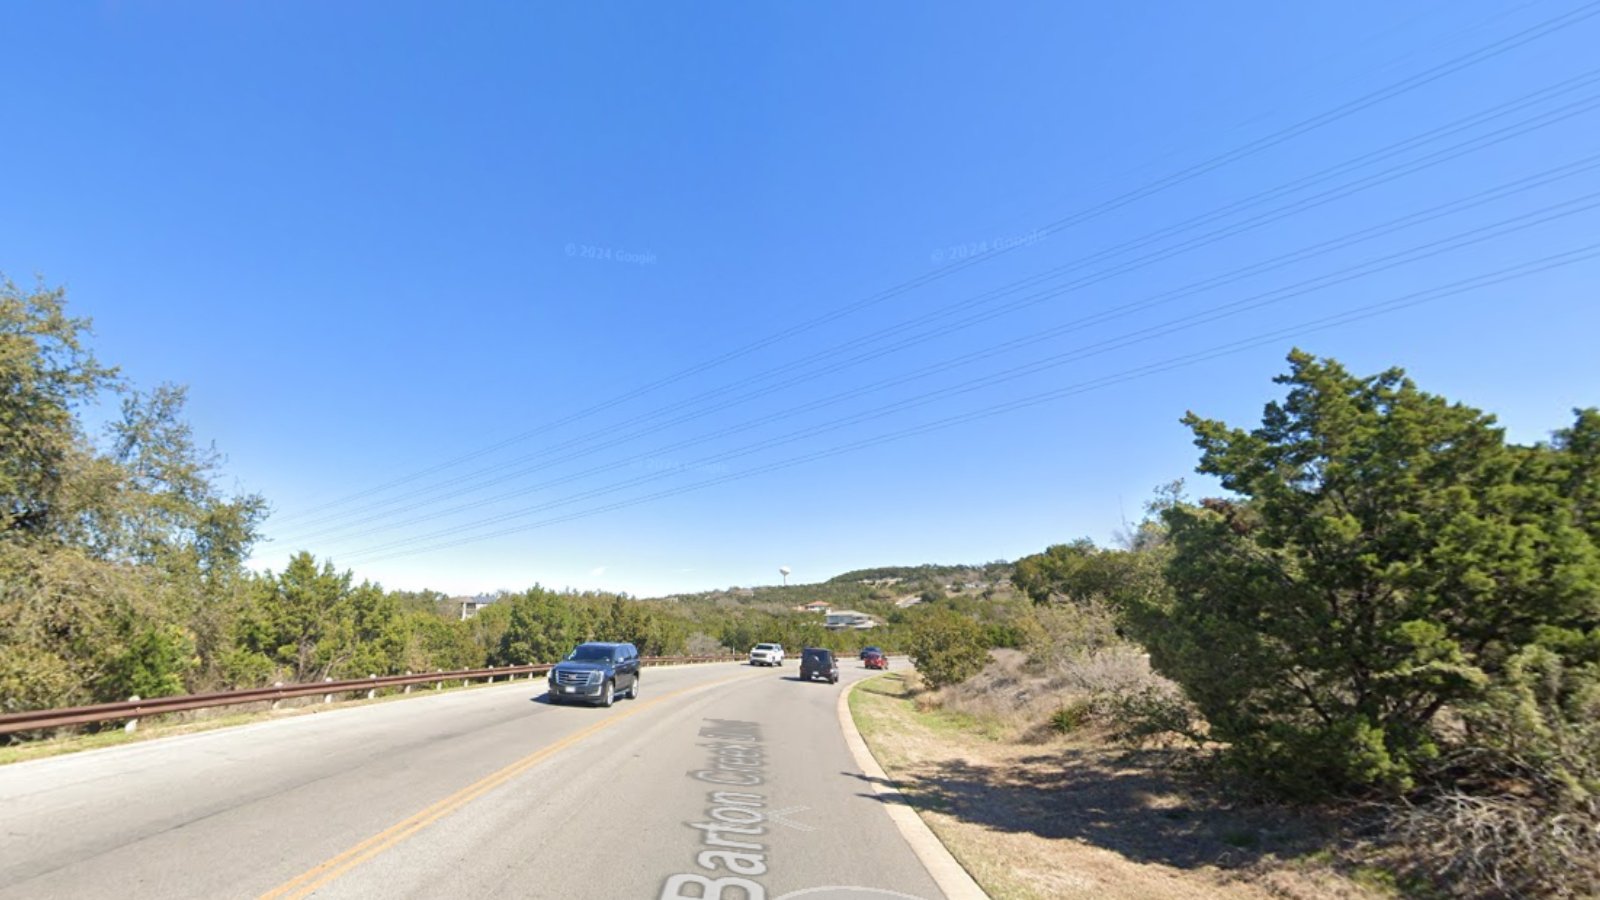
Lost Creek, tucked into the hills west of Austin, is an upscale, family-friendly neighborhood known for greenbelts, excellent schools, and proximity to downtown. It’s often favored by professionals seeking space and natural surroundings within city reach.
The area experienced explosive growth during Austin’s real estate boom. Though prices dipped in recent years, the neighborhood’s desirable location and community amenities continue to keep values elevated.
7. Bartonville – 182% Home Price Increase Since 2010
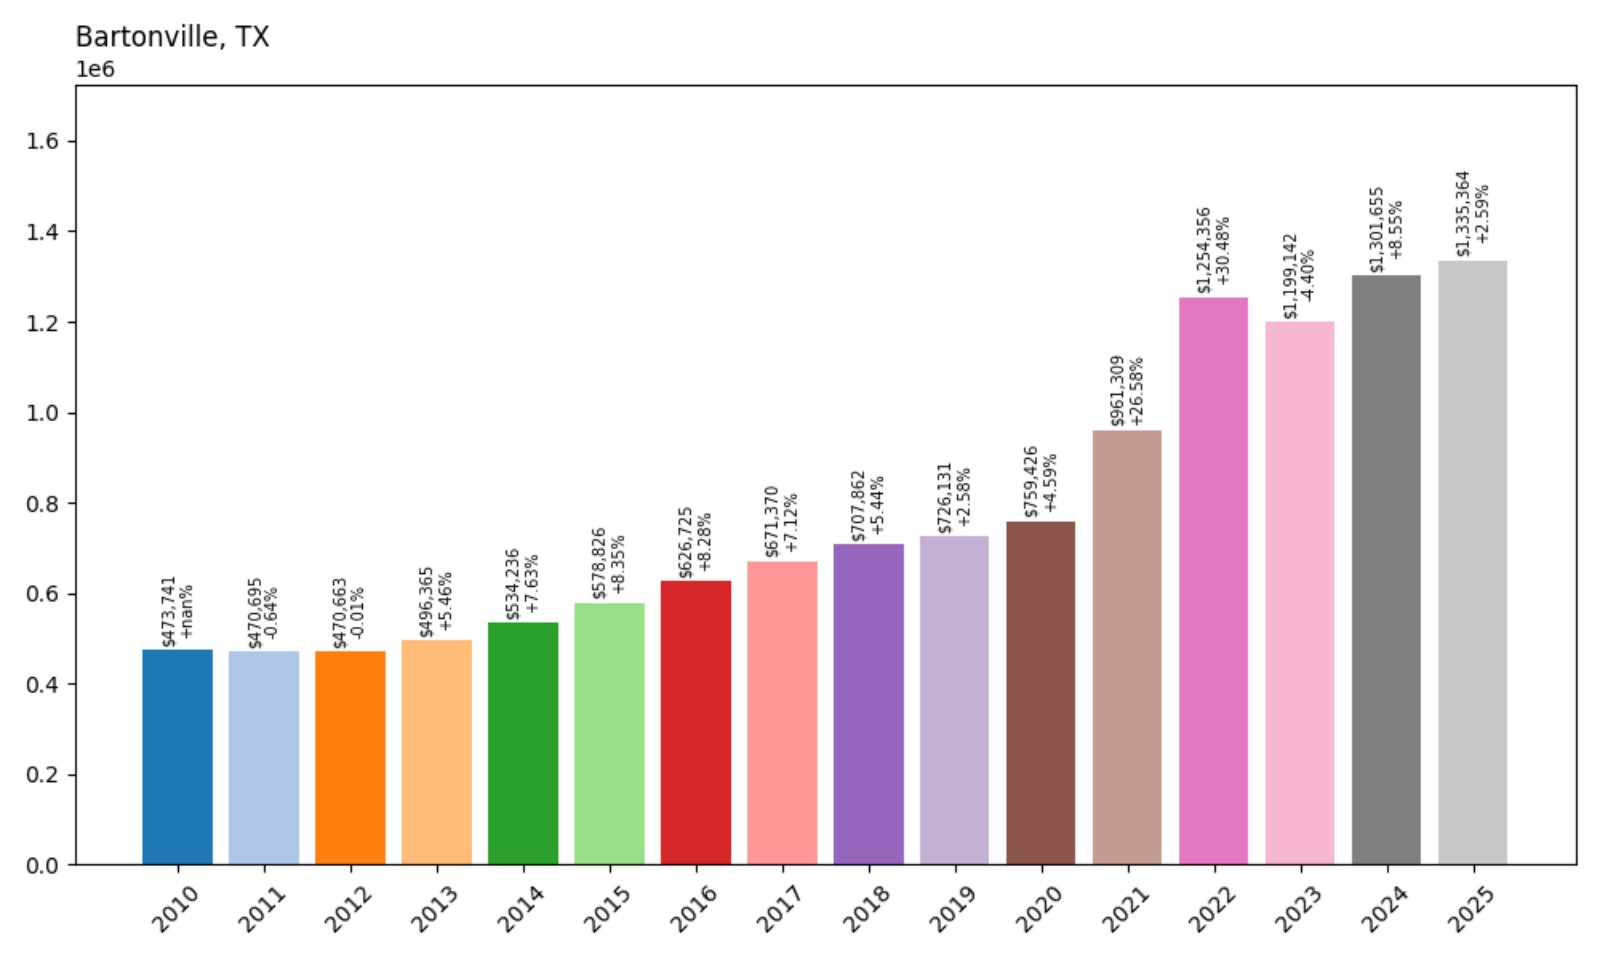
- 2010: $473,741
- 2011: $470,695 (−$3,046, −0.64% from previous year)
- 2012: $470,663 (−$32, −0.01% from previous year)
- 2013: $496,365 (+$25,702, +5.46% from previous year)
- 2014: $534,236 (+$37,871, +7.63% from previous year)
- 2015: $578,826 (+$44,590, +8.35% from previous year)
- 2016: $626,725 (+$47,899, +8.28% from previous year)
- 2017: $671,370 (+$44,645, +7.12% from previous year)
- 2018: $707,862 (+$36,492, +5.44% from previous year)
- 2019: $726,131 (+$18,269, +2.58% from previous year)
- 2020: $759,426 (+$33,295, +4.59% from previous year)
- 2021: $961,309 (+$201,884, +26.58% from previous year)
- 2022: $1,254,356 (+$293,047, +30.48% from previous year)
- 2023: $1,199,142 (−$55,215, −4.40% from previous year)
- 2024: $1,301,655 (+$102,514, +8.55% from previous year)
- 2025: $1,335,364 (+$33,709, +2.59% from previous year)
Home values in Bartonville have surged from under $475,000 in 2010 to over $1.3 million in 2025 — a stunning 182% increase. Growth was especially steep between 2020 and 2022, when values jumped more than $490,000 in just two years. Although the market cooled slightly in 2023, it rebounded again in 2024 and 2025 with steady increases.
Bartonville – A Scenic Escape Near DFW
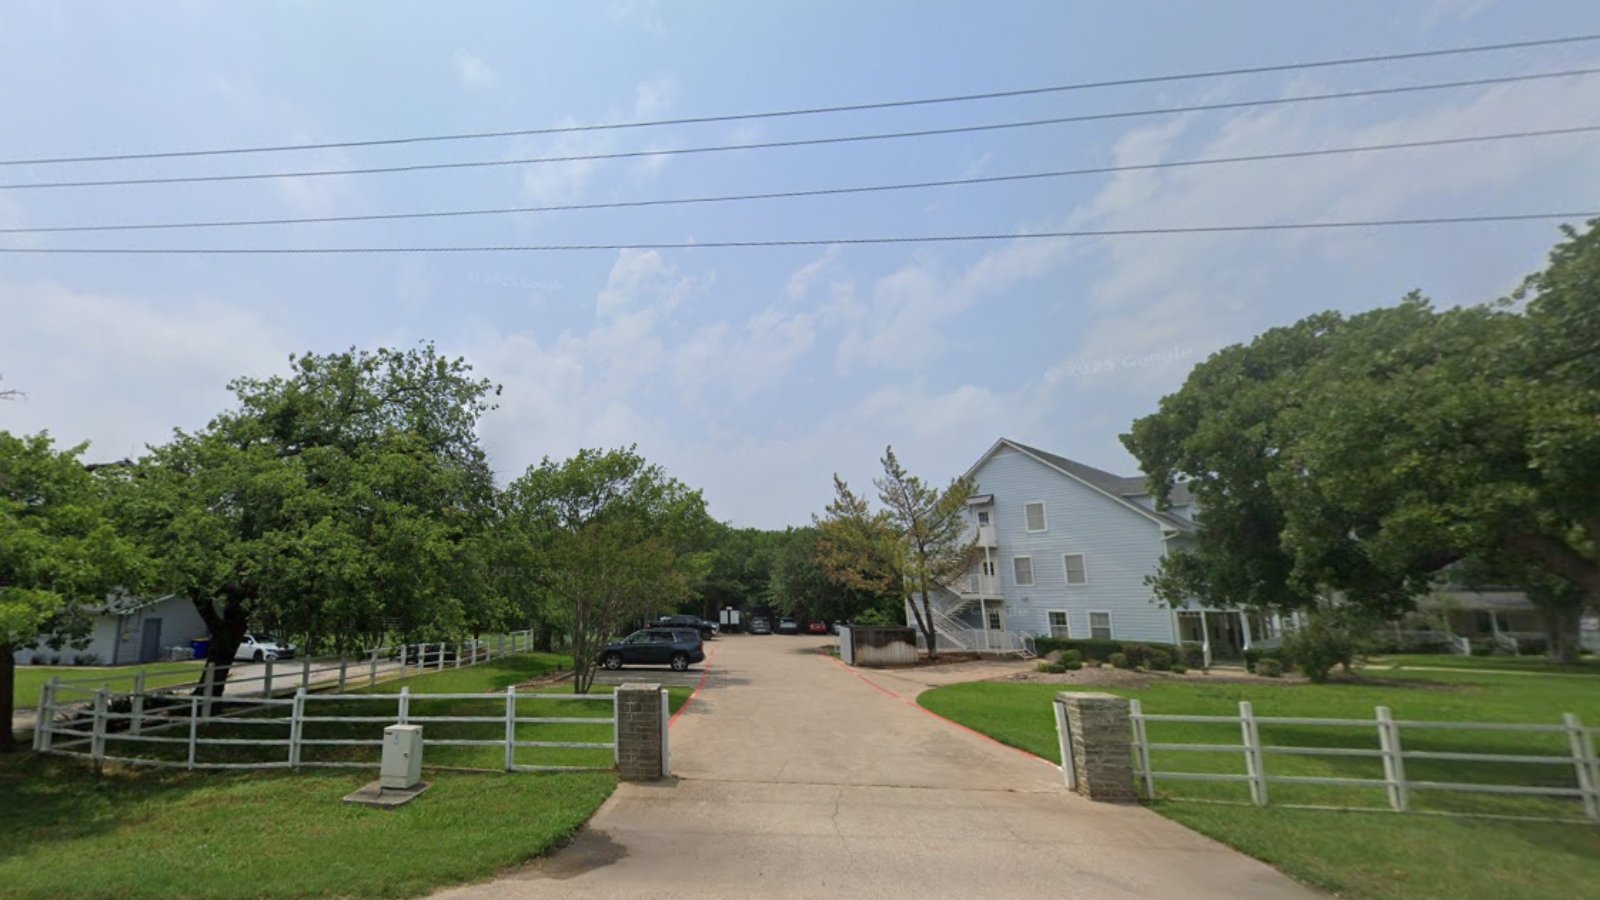
Nestled in Denton County, Bartonville offers a quiet, semi-rural lifestyle just 30 miles northwest of downtown Dallas. The town is known for its large estate lots, horse-friendly properties, and winding country roads — features that have contributed to steadily rising real estate demand. With zoning that favors space and privacy, Bartonville stands in contrast to the dense development common elsewhere in the region.
Its proximity to high-end retail and private schools, plus access to employment hubs in Flower Mound and Southlake, makes Bartonville especially attractive to affluent professionals. Though prices have dipped slightly in some years, the long-term trend shows consistent growth driven by limited housing inventory and strong local appeal.
6. West Lake Hills – 193% Home Price Increase Since 2010
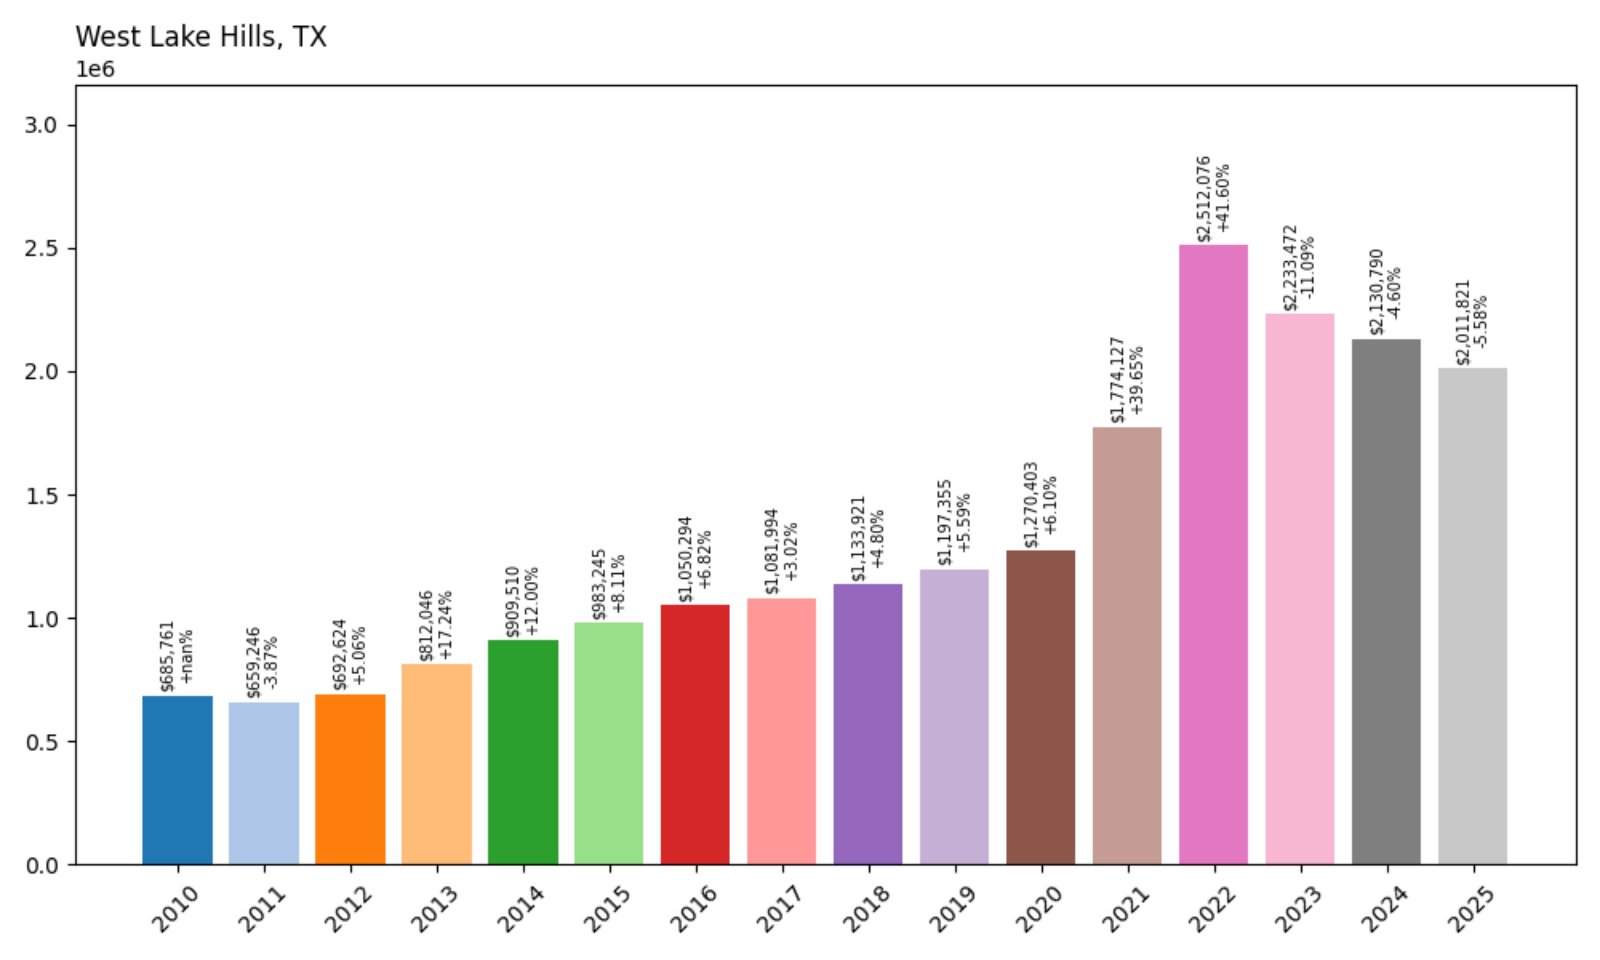
- 2010: $685,761
- 2011: $659,246 (−$26,515, −3.87% from previous year)
- 2012: $692,624 (+$33,378, +5.06% from previous year)
- 2013: $812,046 (+$119,422, +17.24% from previous year)
- 2014: $909,510 (+$97,464, +12.00% from previous year)
- 2015: $983,245 (+$73,735, +8.11% from previous year)
- 2016: $1,050,294 (+$67,049, +6.82% from previous year)
- 2017: $1,081,994 (+$31,700, +3.02% from previous year)
- 2018: $1,133,921 (+$51,928, +4.80% from previous year)
- 2019: $1,197,355 (+$63,434, +5.59% from previous year)
- 2020: $1,270,403 (+$73,048, +6.10% from previous year)
- 2021: $1,774,127 (+$503,725, +39.65% from previous year)
- 2022: $2,512,076 (+$737,949, +41.60% from previous year)
- 2023: $2,233,472 (−$278,605, −11.09% from previous year)
- 2024: $2,130,790 (−$102,682, −4.60% from previous year)
- 2025: $2,011,821 (−$118,969, −5.58% from previous year)
West Lake Hills home prices nearly tripled over the past 15 years, peaking at over $2.5 million in 2022. Although values have declined since then, the current median still reflects a nearly $1.3 million increase since 2010. Notably, 2021 and 2022 saw extraordinary double-digit gains.
West Lake Hills – Hill Country Prestige Near Austin
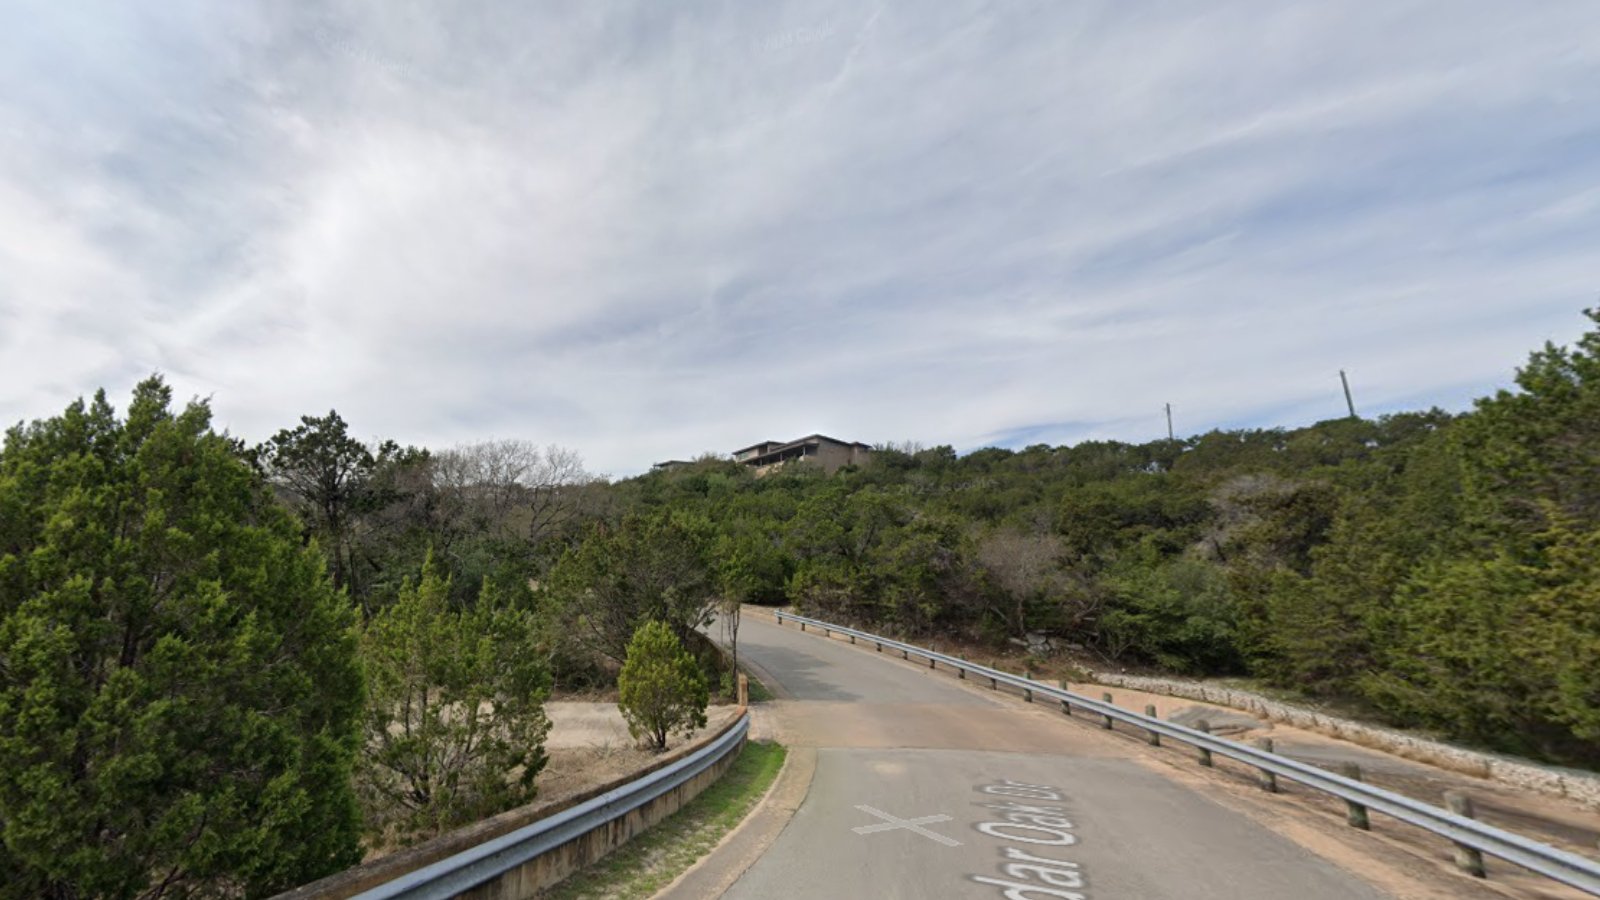
Just minutes from downtown Austin, West Lake Hills is one of the state’s most prestigious addresses. Perched in the Texas Hill Country, it combines panoramic views with top-rated Eanes ISD schools — consistently ranked among the best in Texas. These features have long fueled demand for homes here, and inventory remains tight.
Despite a cooling market over the past few years, prices remain extremely high by Texas standards. Many homes feature custom architecture and lush landscaping, often on large wooded lots. West Lake Hills also boasts one of the highest per capita incomes in the state, adding to its elite status.
5. Rollingwood – 241% Home Price Increase Since 2011
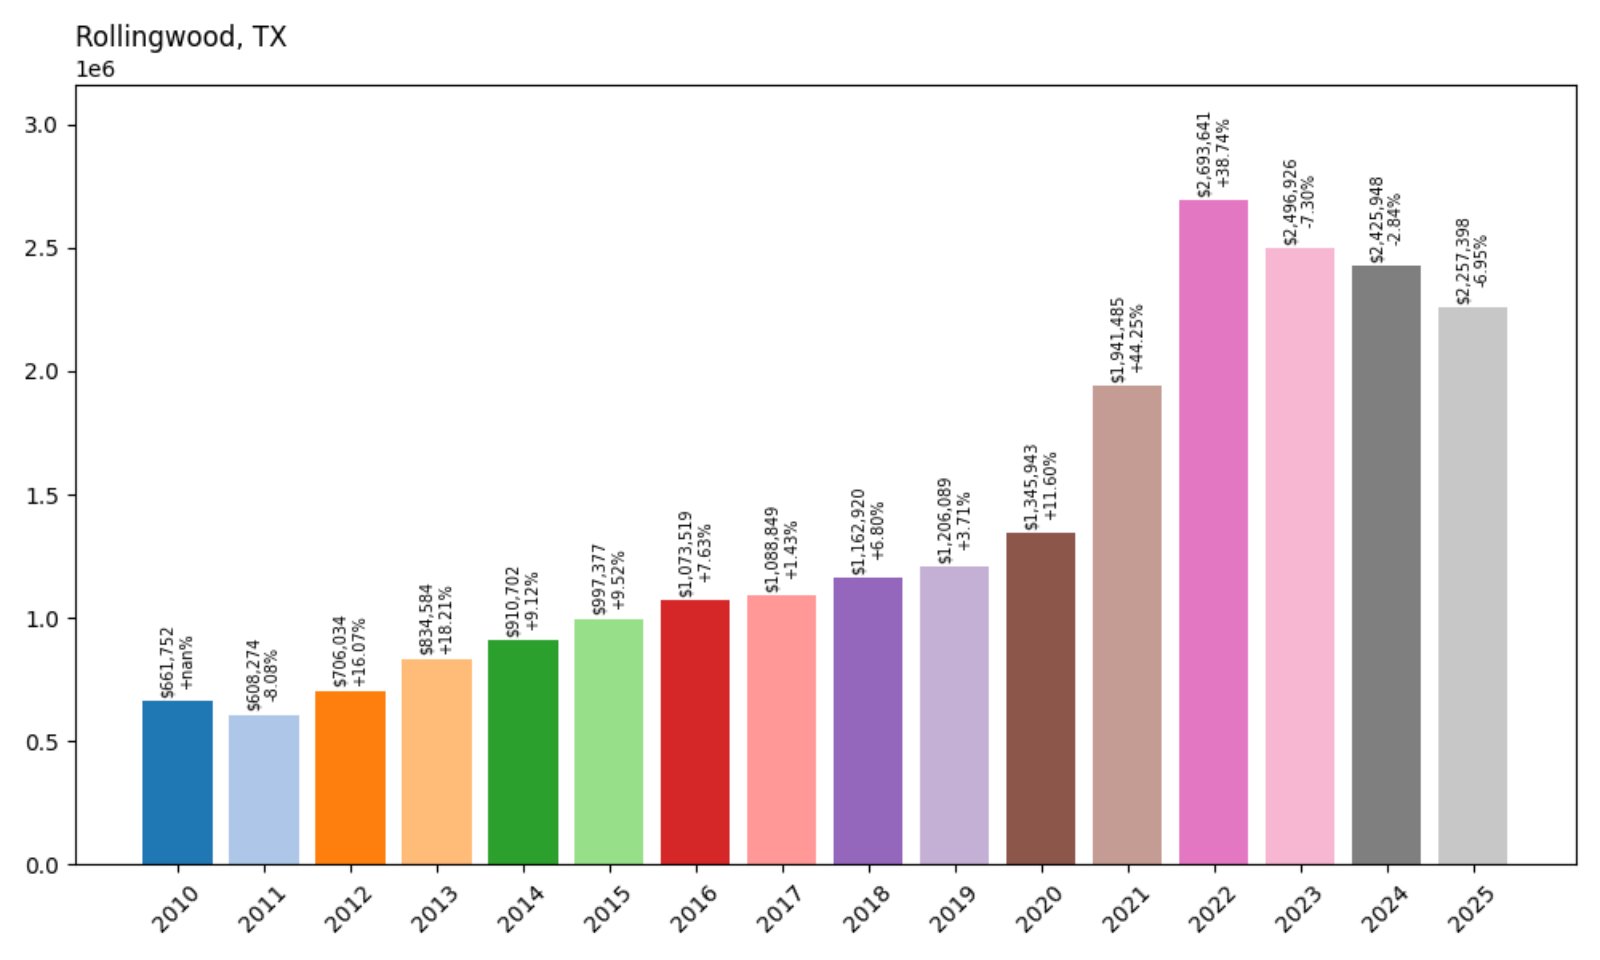
- 2011: $608,274
- 2012: $706,034 (+$97,760, +16.07% from previous year)
- 2013: $834,584 (+$128,550, +18.21% from previous year)
- 2014: $910,702 (+$76,119, +9.12% from previous year)
- 2015: $997,377 (+$86,674, +9.52% from previous year)
- 2016: $1,073,519 (+$76,142, +7.63% from previous year)
- 2017: $1,088,849 (+$15,330, +1.43% from previous year)
- 2018: $1,162,920 (+$74,071, +6.80% from previous year)
- 2019: $1,206,089 (+$43,168, +3.71% from previous year)
- 2020: $1,345,943 (+$139,854, +11.60% from previous year)
- 2021: $1,941,485 (+$595,542, +44.25% from previous year)
- 2022: $2,693,641 (+$752,155, +38.74% from previous year)
- 2023: $2,496,926 (−$196,714, −7.30% from previous year)
- 2024: $2,425,948 (−$70,978, −2.84% from previous year)
- 2025: $2,257,398 (−$168,550, −6.95% from previous year)
Rollingwood’s home prices jumped by over $1.6 million between 2011 and 2022, followed by moderate losses over the past three years. Even after those corrections, prices are still up 241% from their 2011 levels — one of the steepest increases in Texas.
Rollingwood – Affluent and Convenient Inside Austin
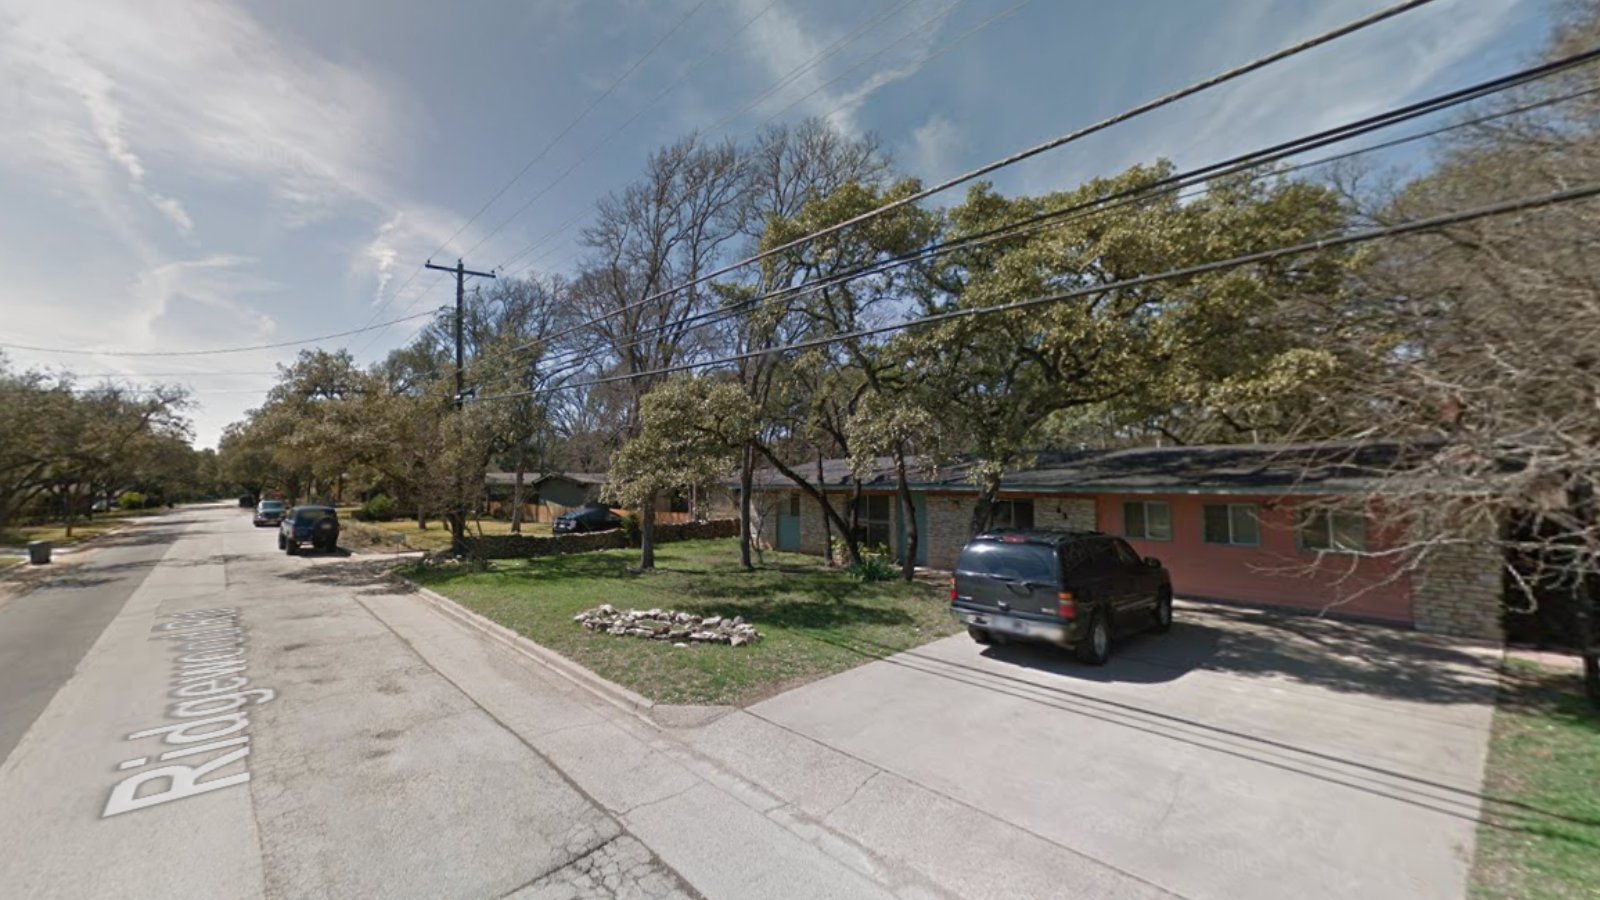
Tucked just southwest of downtown Austin, Rollingwood is a small and affluent enclave that offers quick access to Zilker Park, Lady Bird Lake, and the city’s downtown core. Its prime location and suburban charm make it a perennial favorite among executives and tech workers.
The area is characterized by upscale homes, tree-lined streets, and strong community involvement. While prices have dipped from their 2022 peak, the market remains among the priciest in Texas. Limited inventory and a highly desirable school district continue to support high property values.
4. University Park – 158% Home Price Increase Since 2010
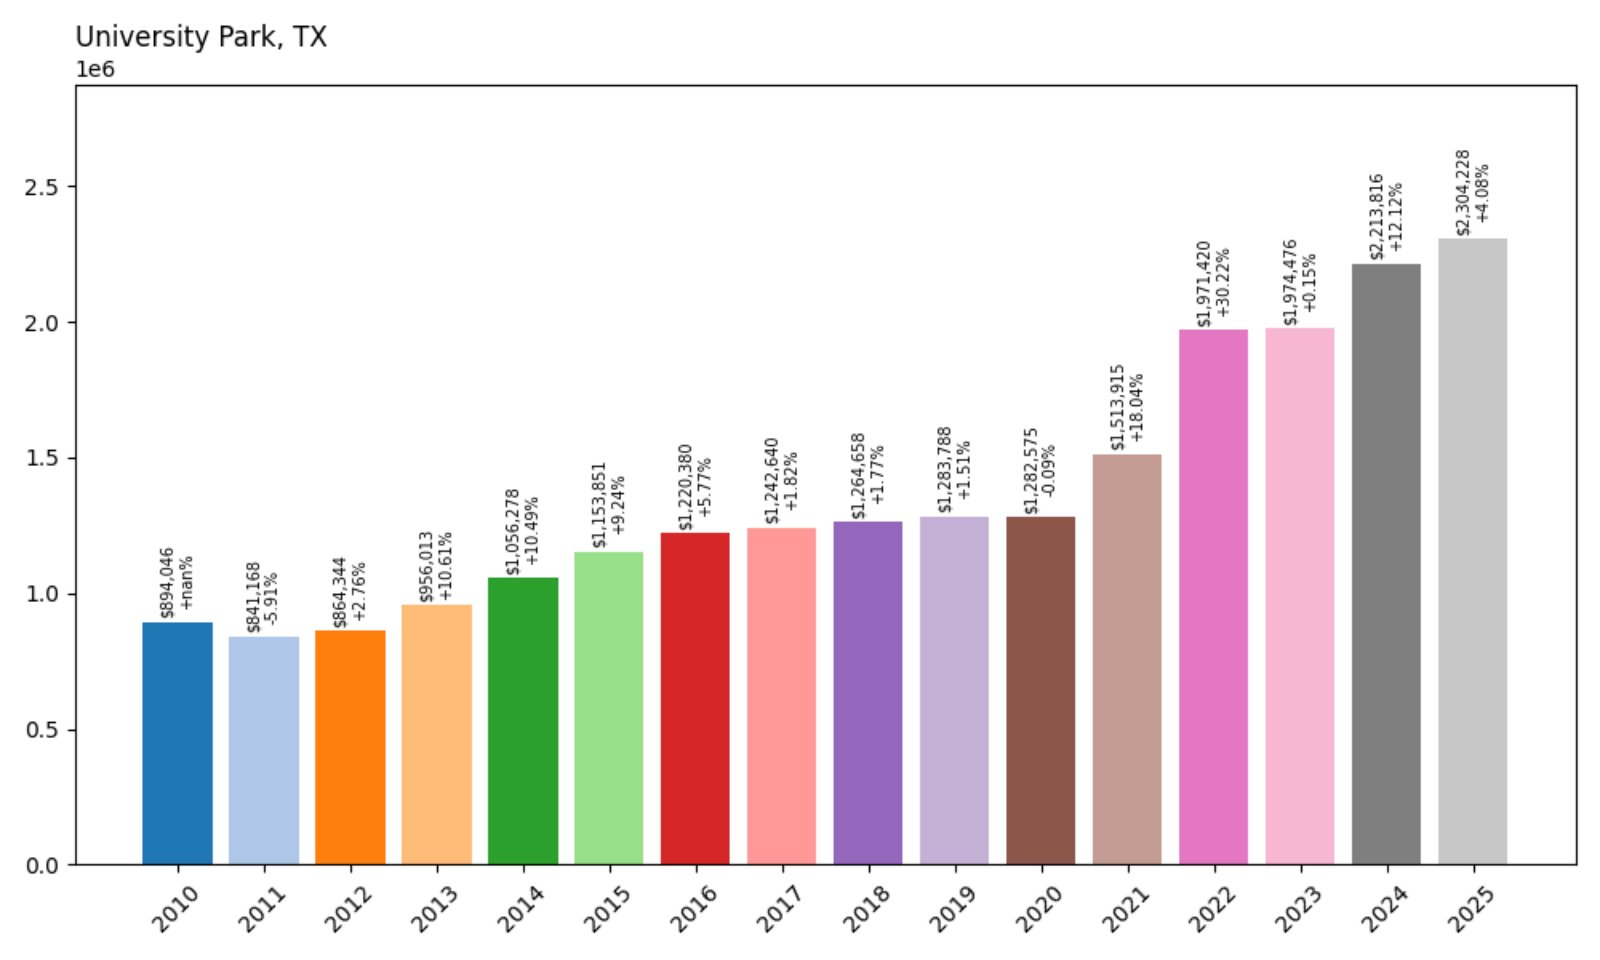
- 2010: $894,046
- 2011: $841,168 (−$52,878, −5.91% from previous year)
- 2012: $864,344 (+$23,175, +2.76% from previous year)
- 2013: $956,013 (+$91,670, +10.61% from previous year)
- 2014: $1,056,278 (+$100,265, +10.49% from previous year)
- 2015: $1,153,851 (+$97,573, +9.24% from previous year)
- 2016: $1,220,380 (+$66,529, +5.77% from previous year)
- 2017: $1,242,640 (+$22,261, +1.82% from previous year)
- 2018: $1,264,658 (+$22,018, +1.77% from previous year)
- 2019: $1,283,788 (+$19,129, +1.51% from previous year)
- 2020: $1,282,575 (−$1,213, −0.09% from previous year)
- 2021: $1,513,915 (+$231,340, +18.04% from previous year)
- 2022: $1,971,420 (+$457,505, +30.22% from previous year)
- 2023: $1,974,476 (+$3,055, +0.15% from previous year)
- 2024: $2,213,816 (+$239,340, +12.12% from previous year)
- 2025: $2,304,228 (+$90,412, +4.08% from previous year)
From just under $900,000 in 2010, University Park’s home values have climbed to over $2.3 million in 2025. Prices remained relatively stable through the 2010s before surging after 2020 — with 2022 alone seeing a 30% jump.
University Park – A Classic Dallas Enclave
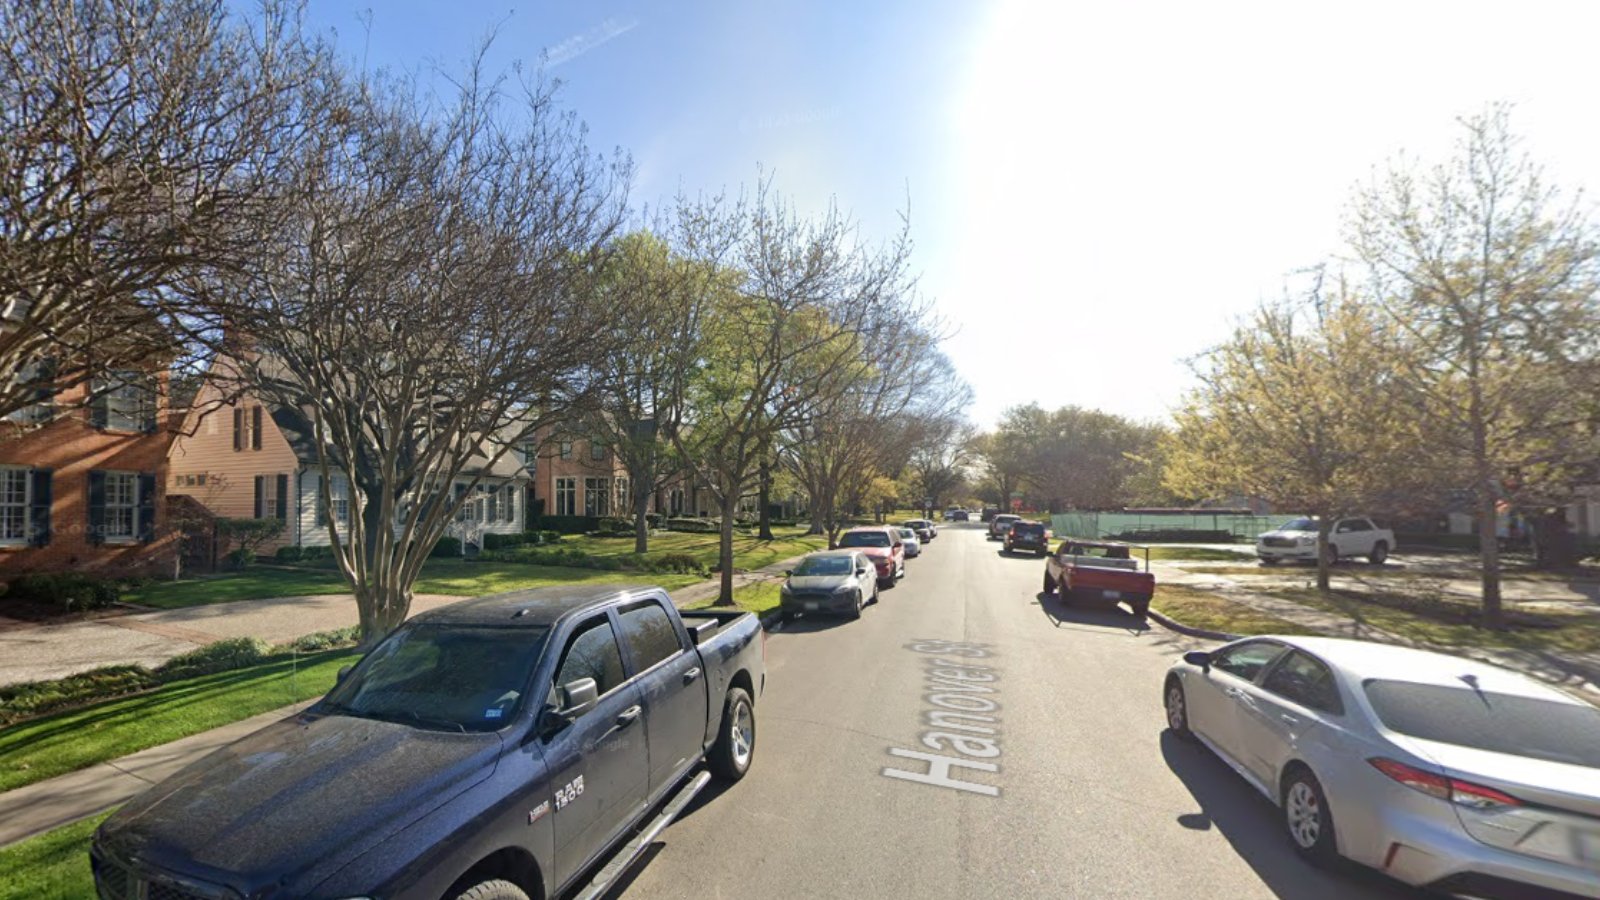
Located just north of downtown Dallas, University Park is one of the city’s most sought-after neighborhoods. It’s home to Southern Methodist University and is known for its stately homes, manicured streets, and upscale boutiques. The area’s appeal is enhanced by strong schools, including the Highland Park ISD, and access to cultural institutions.
Home values surged in the early 2020s, driven by increased demand from buyers seeking proximity to both education and luxury amenities. Despite already sky-high prices, the upward trajectory has continued, though at a slower pace in recent years.
3. Westover Hills – 145% Home Price Increase Since 2010
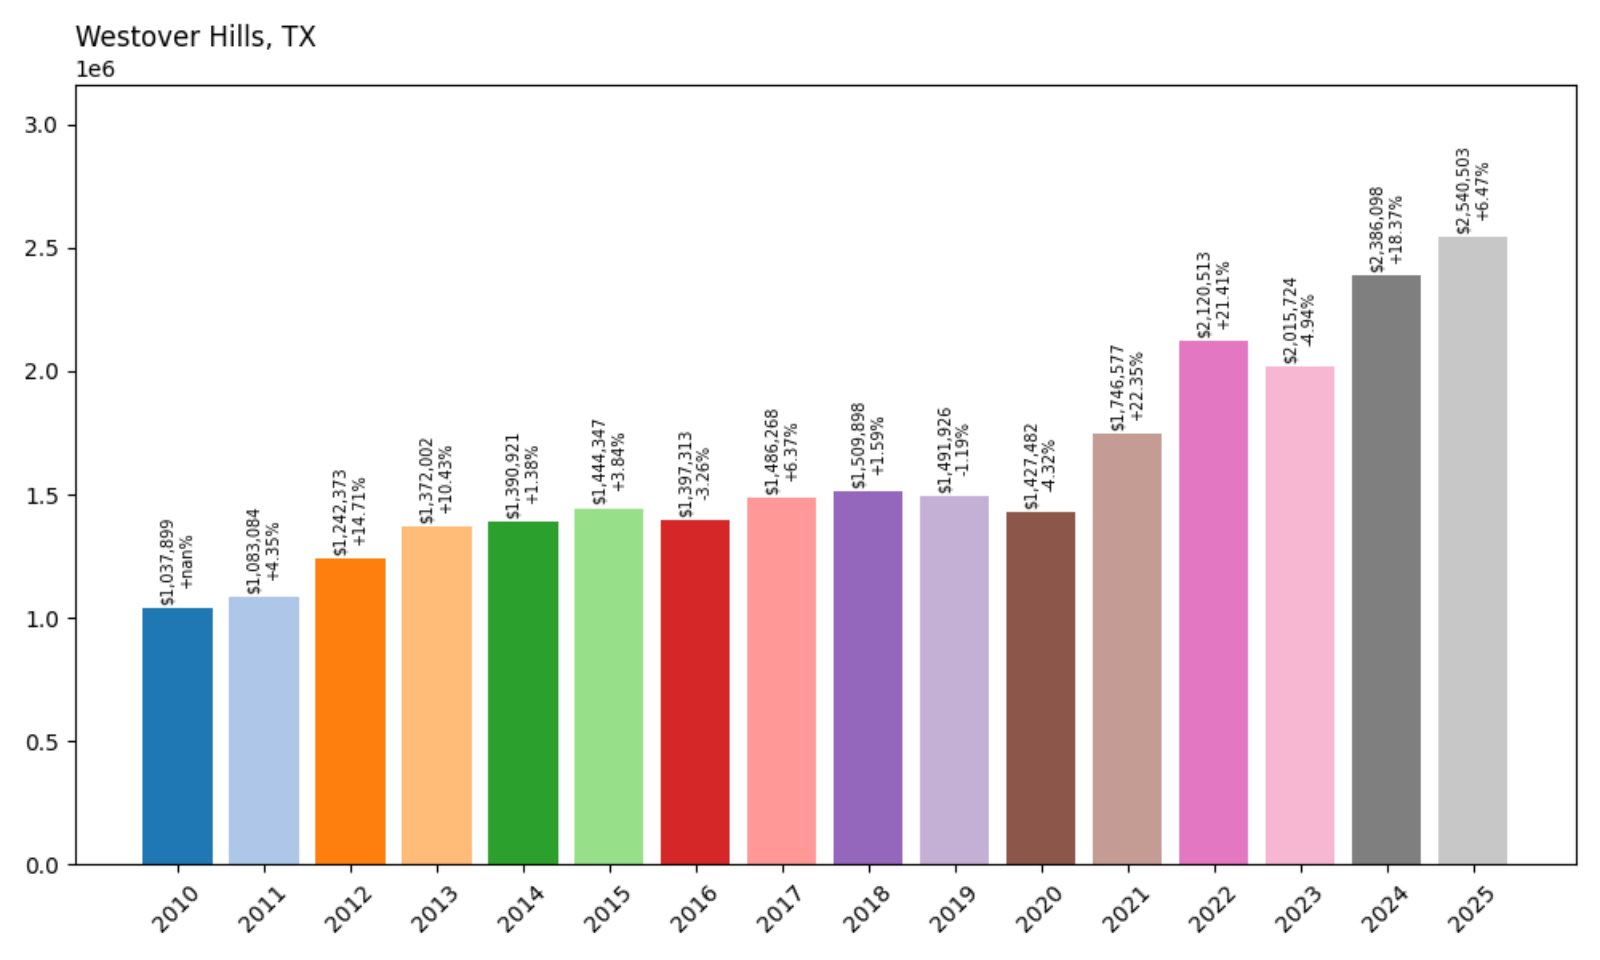
- 2010: $1,037,899
- 2011: $1,083,084 (+$45,185, +4.35% from previous year)
- 2012: $1,242,373 (+$159,290, +14.71% from previous year)
- 2013: $1,372,002 (+$129,629, +10.43% from previous year)
- 2014: $1,390,921 (+$18,918, +1.38% from previous year)
- 2015: $1,444,347 (+$53,426, +3.84% from previous year)
- 2016: $1,397,313 (−$47,034, −3.26% from previous year)
- 2017: $1,486,268 (+$88,955, +6.37% from previous year)
- 2018: $1,509,898 (+$23,630, +1.59% from previous year)
- 2019: $1,491,926 (−$17,972, −1.19% from previous year)
- 2020: $1,427,482 (−$64,444, −4.32% from previous year)
- 2021: $1,746,577 (+$319,096, +22.35% from previous year)
- 2022: $2,120,513 (+$373,936, +21.41% from previous year)
- 2023: $2,015,724 (−$104,789, −4.94% from previous year)
- 2024: $2,386,098 (+$370,374, +18.37% from previous year)
- 2025: $2,540,503 (+$154,405, +6.47% from previous year)
Westover Hills has seen a 145% increase in home prices since 2010, with particularly sharp rises in the early 2010s and again from 2021 to 2022. While the market dipped slightly in 2023, prices quickly rebounded in the following two years, reaching over $2.5 million in 2025.
Westover Hills – Fort Worth’s Elite Residential Enclave
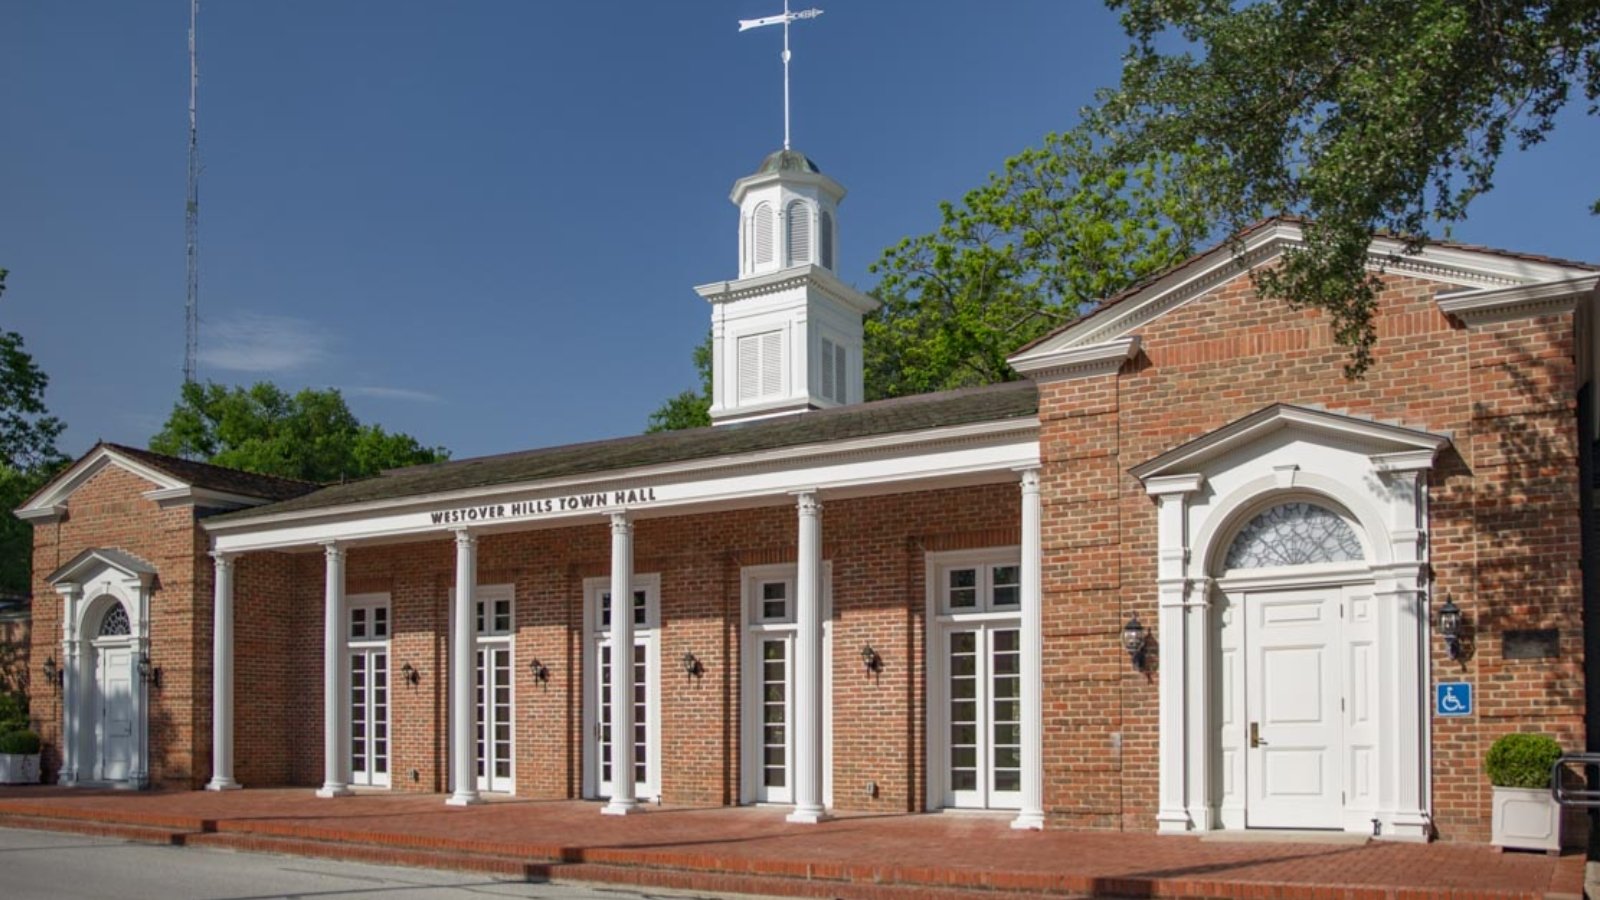
Westover Hills is an exclusive suburb of Fort Worth, known for its tree-lined streets, large estate properties, and secluded atmosphere. One of the wealthiest communities in Texas by income per capita, it’s home to long-established families and top business leaders.
Unlike rapidly growing suburbs, Westover Hills maintains a deliberately small footprint with strict zoning that preserves its character. The limited housing supply combined with consistent demand has kept home prices among the highest in the state, even during market slowdowns. This quiet, prestigious community continues to attract high-end buyers looking for privacy and luxury close to the city.
2. Highland Park – 171% Home Price Increase Since 2010

- 2010: $1,025,075
- 2011: $973,175 (−$51,900, −5.06% from previous year)
- 2012: $998,249 (+$25,074, +2.58% from previous year)
- 2013: $1,108,537 (+$110,287, +11.05% from previous year)
- 2014: $1,234,618 (+$126,082, +11.37% from previous year)
- 2015: $1,349,437 (+$114,819, +9.30% from previous year)
- 2016: $1,431,384 (+$81,947, +6.07% from previous year)
- 2017: $1,430,330 (−$1,054, −0.07% from previous year)
- 2018: $1,457,987 (+$27,657, +1.93% from previous year)
- 2019: $1,463,957 (+$5,970, +0.41% from previous year)
- 2020: $1,445,702 (−$18,255, −1.25% from previous year)
- 2021: $1,712,119 (+$266,417, +18.43% from previous year)
- 2022: $2,264,775 (+$552,656, +32.28% from previous year)
- 2023: $2,347,190 (+$82,416, +3.64% from previous year)
- 2024: $2,668,532 (+$321,342, +13.69% from previous year)
- 2025: $2,778,678 (+$110,145, +4.13% from previous year)
Home prices in Highland Park have climbed from just over $1 million in 2010 to nearly $2.8 million in 2025 — a 171% increase. Price growth was especially strong in 2021 and 2022, when values rose by over $800,000 across two years.
Highland Park – Old Money and Enduring Prestige
Highland Park is synonymous with luxury in Texas. Situated just north of downtown Dallas, this historic enclave is known for its elegant estates, lush parks, and iconic shopping at Highland Park Village. It’s long been home to Dallas’s wealthiest families and maintains some of the highest property values in the South.
The town’s enduring appeal lies in its established charm and premier location within the Highland Park Independent School District, one of the most sought-after in Texas. Although growth in home prices has slowed in recent years, Highland Park remains a top-tier market where properties often exceed seven figures with ease.
1. Westlake – 136% Home Price Increase Since 2010
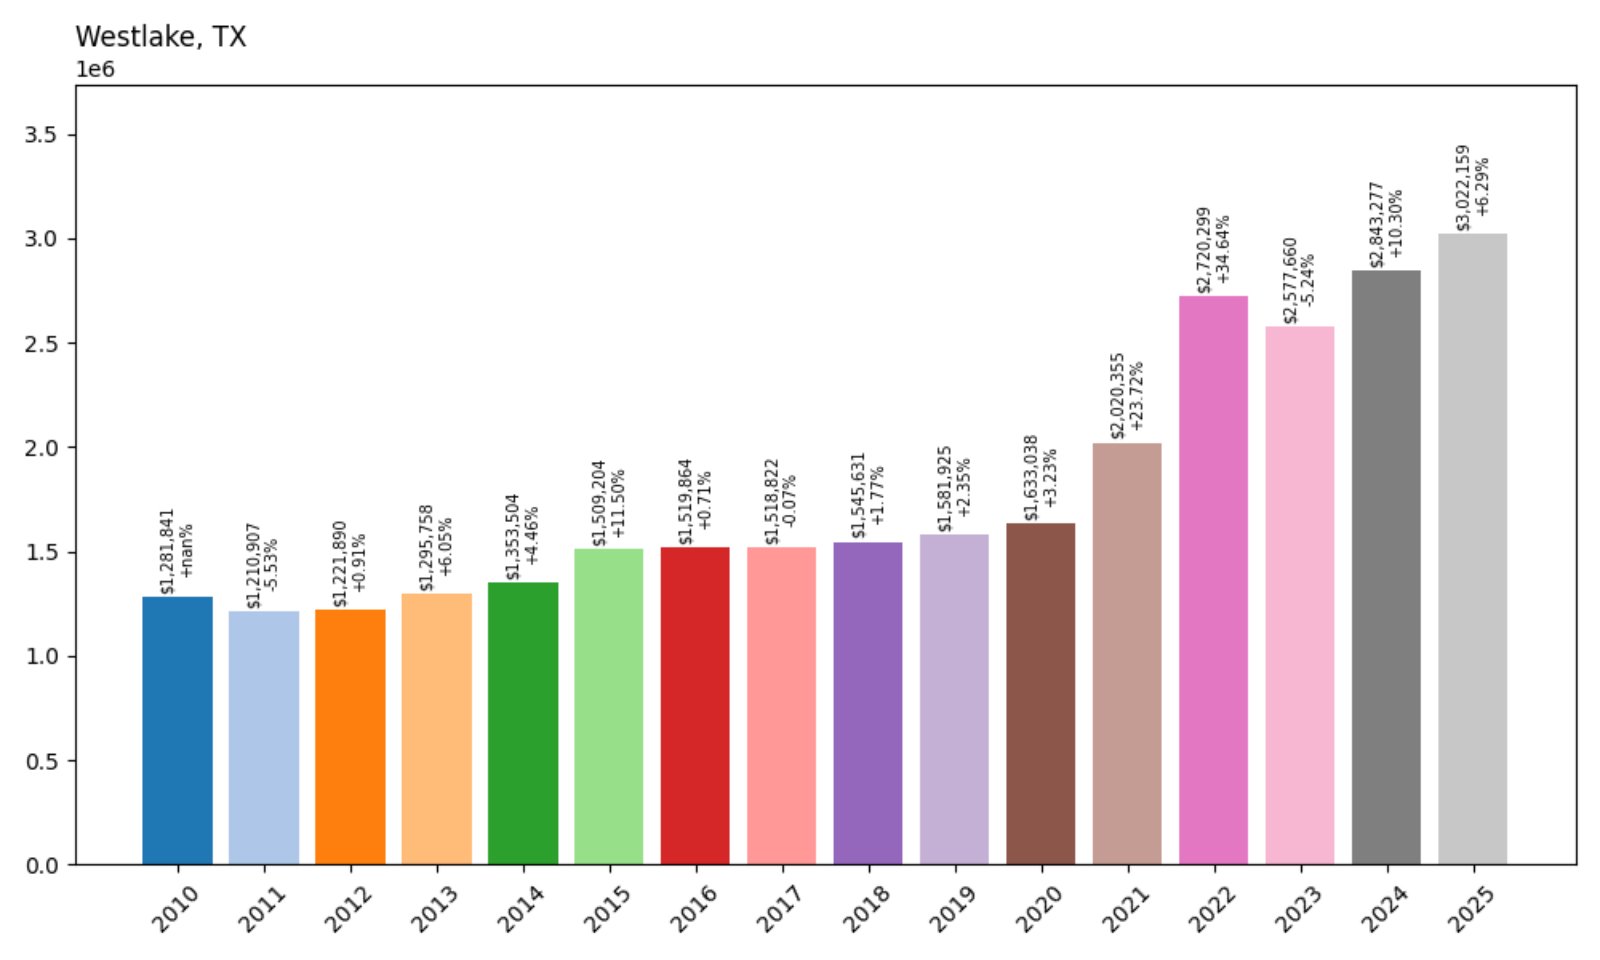
- 2010: $1,281,841
- 2011: $1,210,907 (−$70,934, −5.53% from previous year)
- 2012: $1,221,890 (+$10,982, +0.91% from previous year)
- 2013: $1,295,758 (+$73,868, +6.05% from previous year)
- 2014: $1,353,504 (+$57,746, +4.46% from previous year)
- 2015: $1,509,204 (+$155,701, +11.50% from previous year)
- 2016: $1,519,864 (+$10,660, +0.71% from previous year)
- 2017: $1,518,822 (−$1,042, −0.07% from previous year)
- 2018: $1,545,631 (+$26,810, +1.77% from previous year)
- 2019: $1,581,925 (+$36,294, +2.35% from previous year)
- 2020: $1,633,038 (+$51,113, +3.23% from previous year)
- 2021: $2,020,355 (+$387,317, +23.72% from previous year)
- 2022: $2,720,299 (+$699,944, +34.64% from previous year)
- 2023: $2,577,660 (−$142,638, −5.24% from previous year)
- 2024: $2,843,277 (+$265,616, +10.30% from previous year)
- 2025: $3,022,159 (+$178,883, +6.29% from previous year)
Westlake tops the list with home prices rising from $1.28 million in 2010 to just over $3 million in 2025 — an increase of 136%. The most dramatic growth came between 2020 and 2022, when prices jumped by nearly $1.1 million. Even after a slight correction in 2023, values surged again in 2024 and 2025.
Westlake – Texas’s Premier Luxury Address
Located in the Dallas-Fort Worth metroplex, Westlake is a magnet for luxury buyers drawn to its exclusivity, manicured landscapes, and elite school options — including Westlake Academy, a rare public charter IB school. With a population under 2,000, the town has carved out a niche as one of the wealthiest ZIP codes in the state.
Westlake blends modern estates, gated communities, and world-class golf amenities. Proximity to corporate headquarters, high-end retail in Southlake and Trophy Club, and DFW Airport adds to its desirability. Despite minor fluctuations in recent years, demand has remained sky-high, cementing Westlake’s place at the pinnacle of Texas real estate in 2025.