🔥 Would you like to save this?
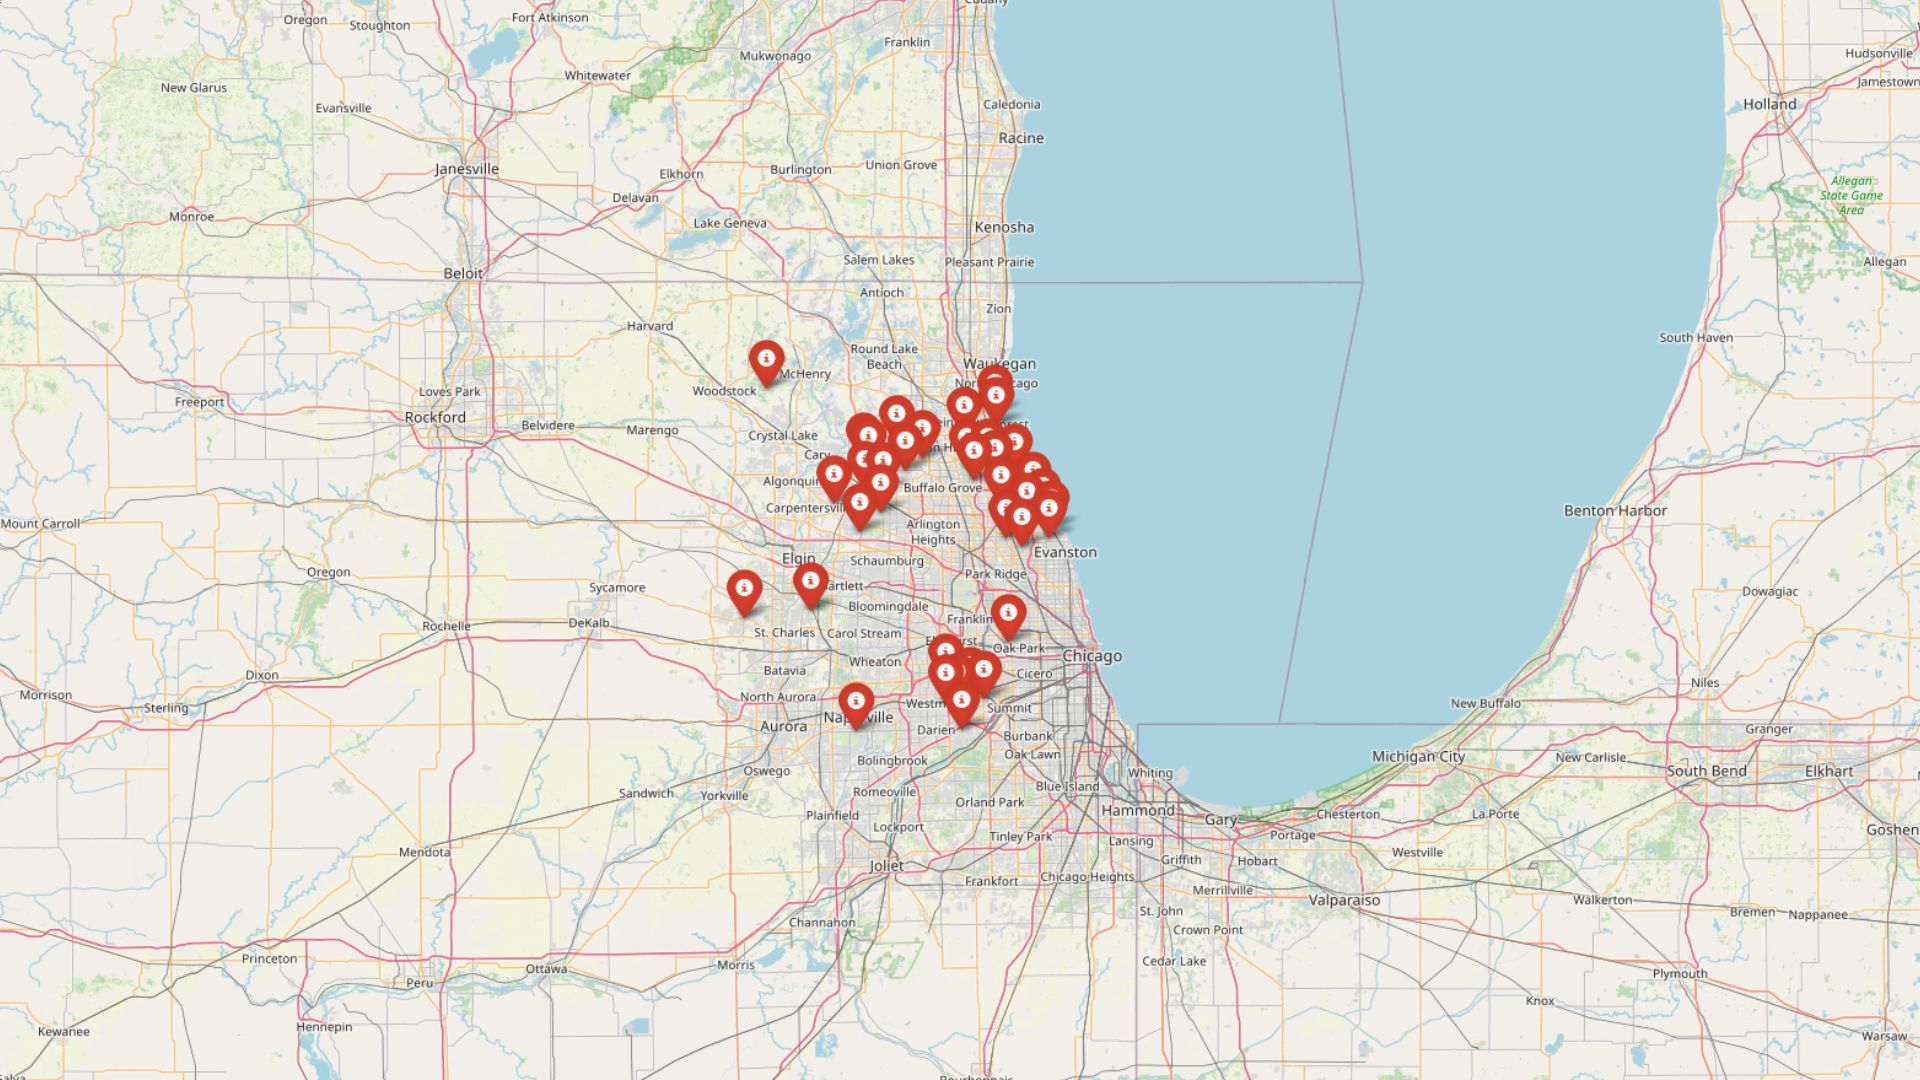
According to the Zillow Home Value Index, 37 Illinois towns now have median home prices in the seven figures—and in many cases, they’re still climbing. From lakefront estates in Kenilworth to luxury suburbs on Chicago’s North Shore, these markets have surged well beyond state and national averages. Limited inventory, elite schools, and proximity to Chicago’s financial core continue to draw wealthy buyers, reshaping what used to be quiet towns into high-stakes property markets.
37. Naperville – 65.1% Home Price Increase Since 2010
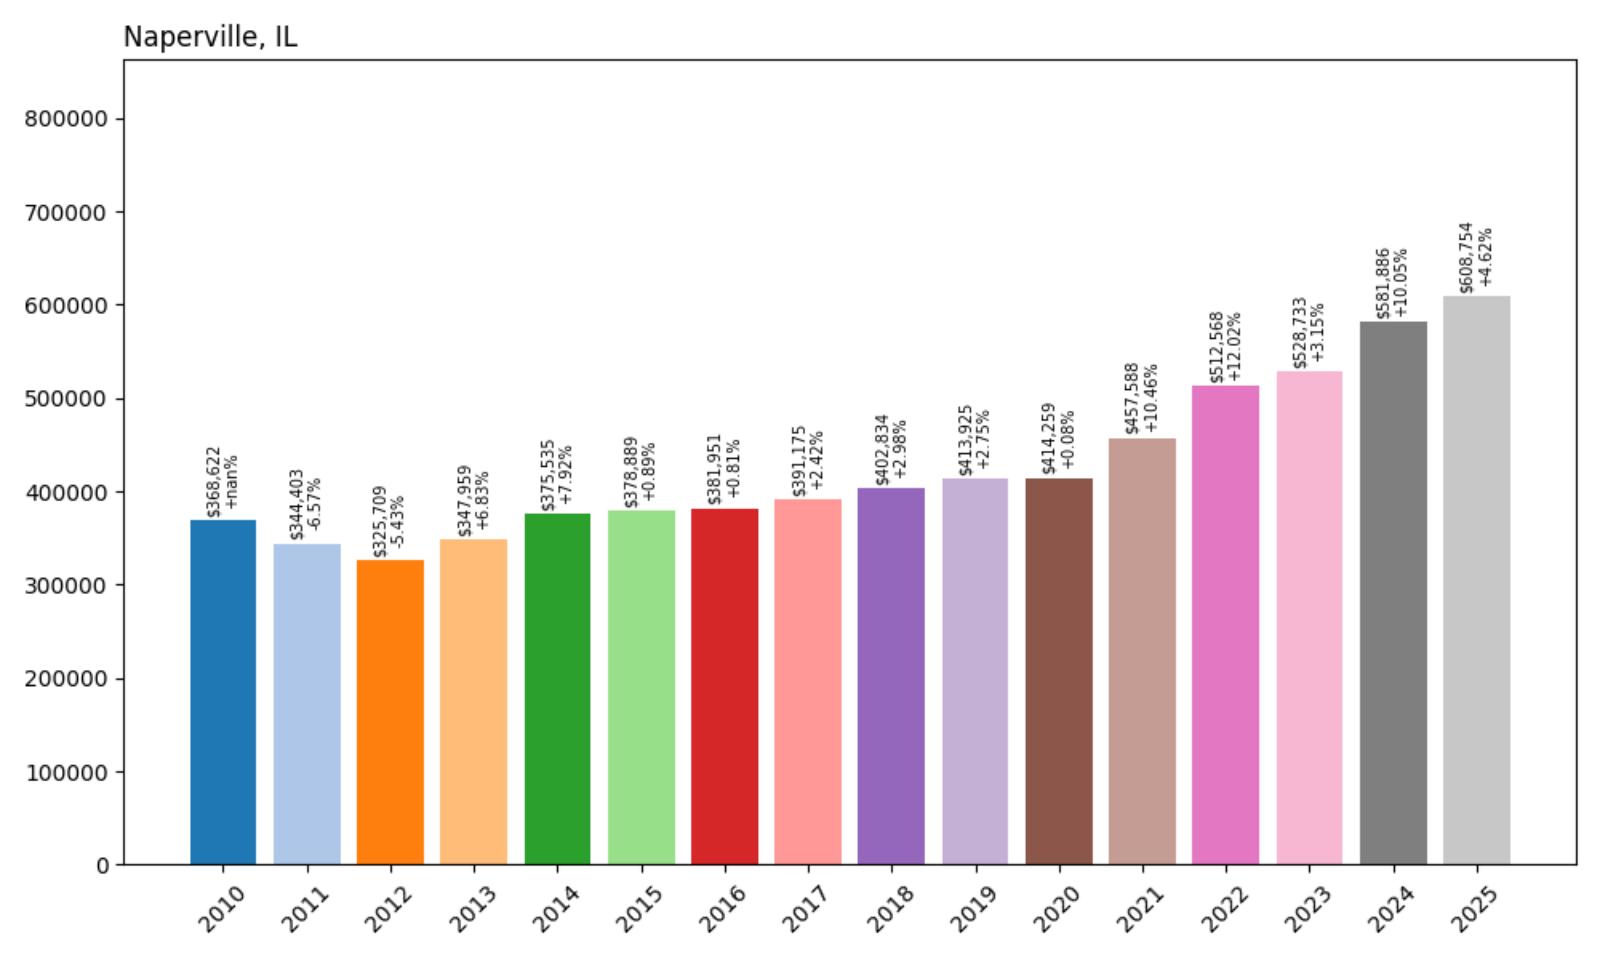
- 2010: $368,622
- 2011: $344,403 (−$24,220, −6.57% from previous year)
- 2012: $325,709 (−$18,693, −5.43% from previous year)
- 2013: $347,959 (+$22,250, +6.83% from previous year)
- 2014: $375,535 (+$27,576, +7.92% from previous year)
- 2015: $378,889 (+$3,354, +0.89% from previous year)
- 2016: $381,951 (+$3,062, +0.81% from previous year)
- 2017: $391,175 (+$9,225, +2.42% from previous year)
- 2018: $402,834 (+$11,659, +2.98% from previous year)
- 2019: $413,925 (+$11,092, +2.75% from previous year)
- 2020: $414,259 (+$334, +0.08% from previous year)
- 2021: $457,588 (+$43,329, +10.46% from previous year)
- 2022: $512,568 (+$54,980, +12.02% from previous year)
- 2023: $528,733 (+$16,165, +3.15% from previous year)
- 2024: $581,886 (+$53,152, +10.05% from previous year)
- 2025: $608,754 (+$26,869, +4.62% from previous year)
Naperville stands out as Illinois’s most affordable option among expensive communities, with current median home values at $608,754 representing a solid 65.1% appreciation since 2010. The data shows remarkable consistency in growth patterns, with only one year of decline during the entire 15-year period. The most significant gains occurred during the post-pandemic surge from 2021-2022, when values jumped nearly 20% in just two years, reflecting the broader suburban migration trend that benefited communities like Naperville.
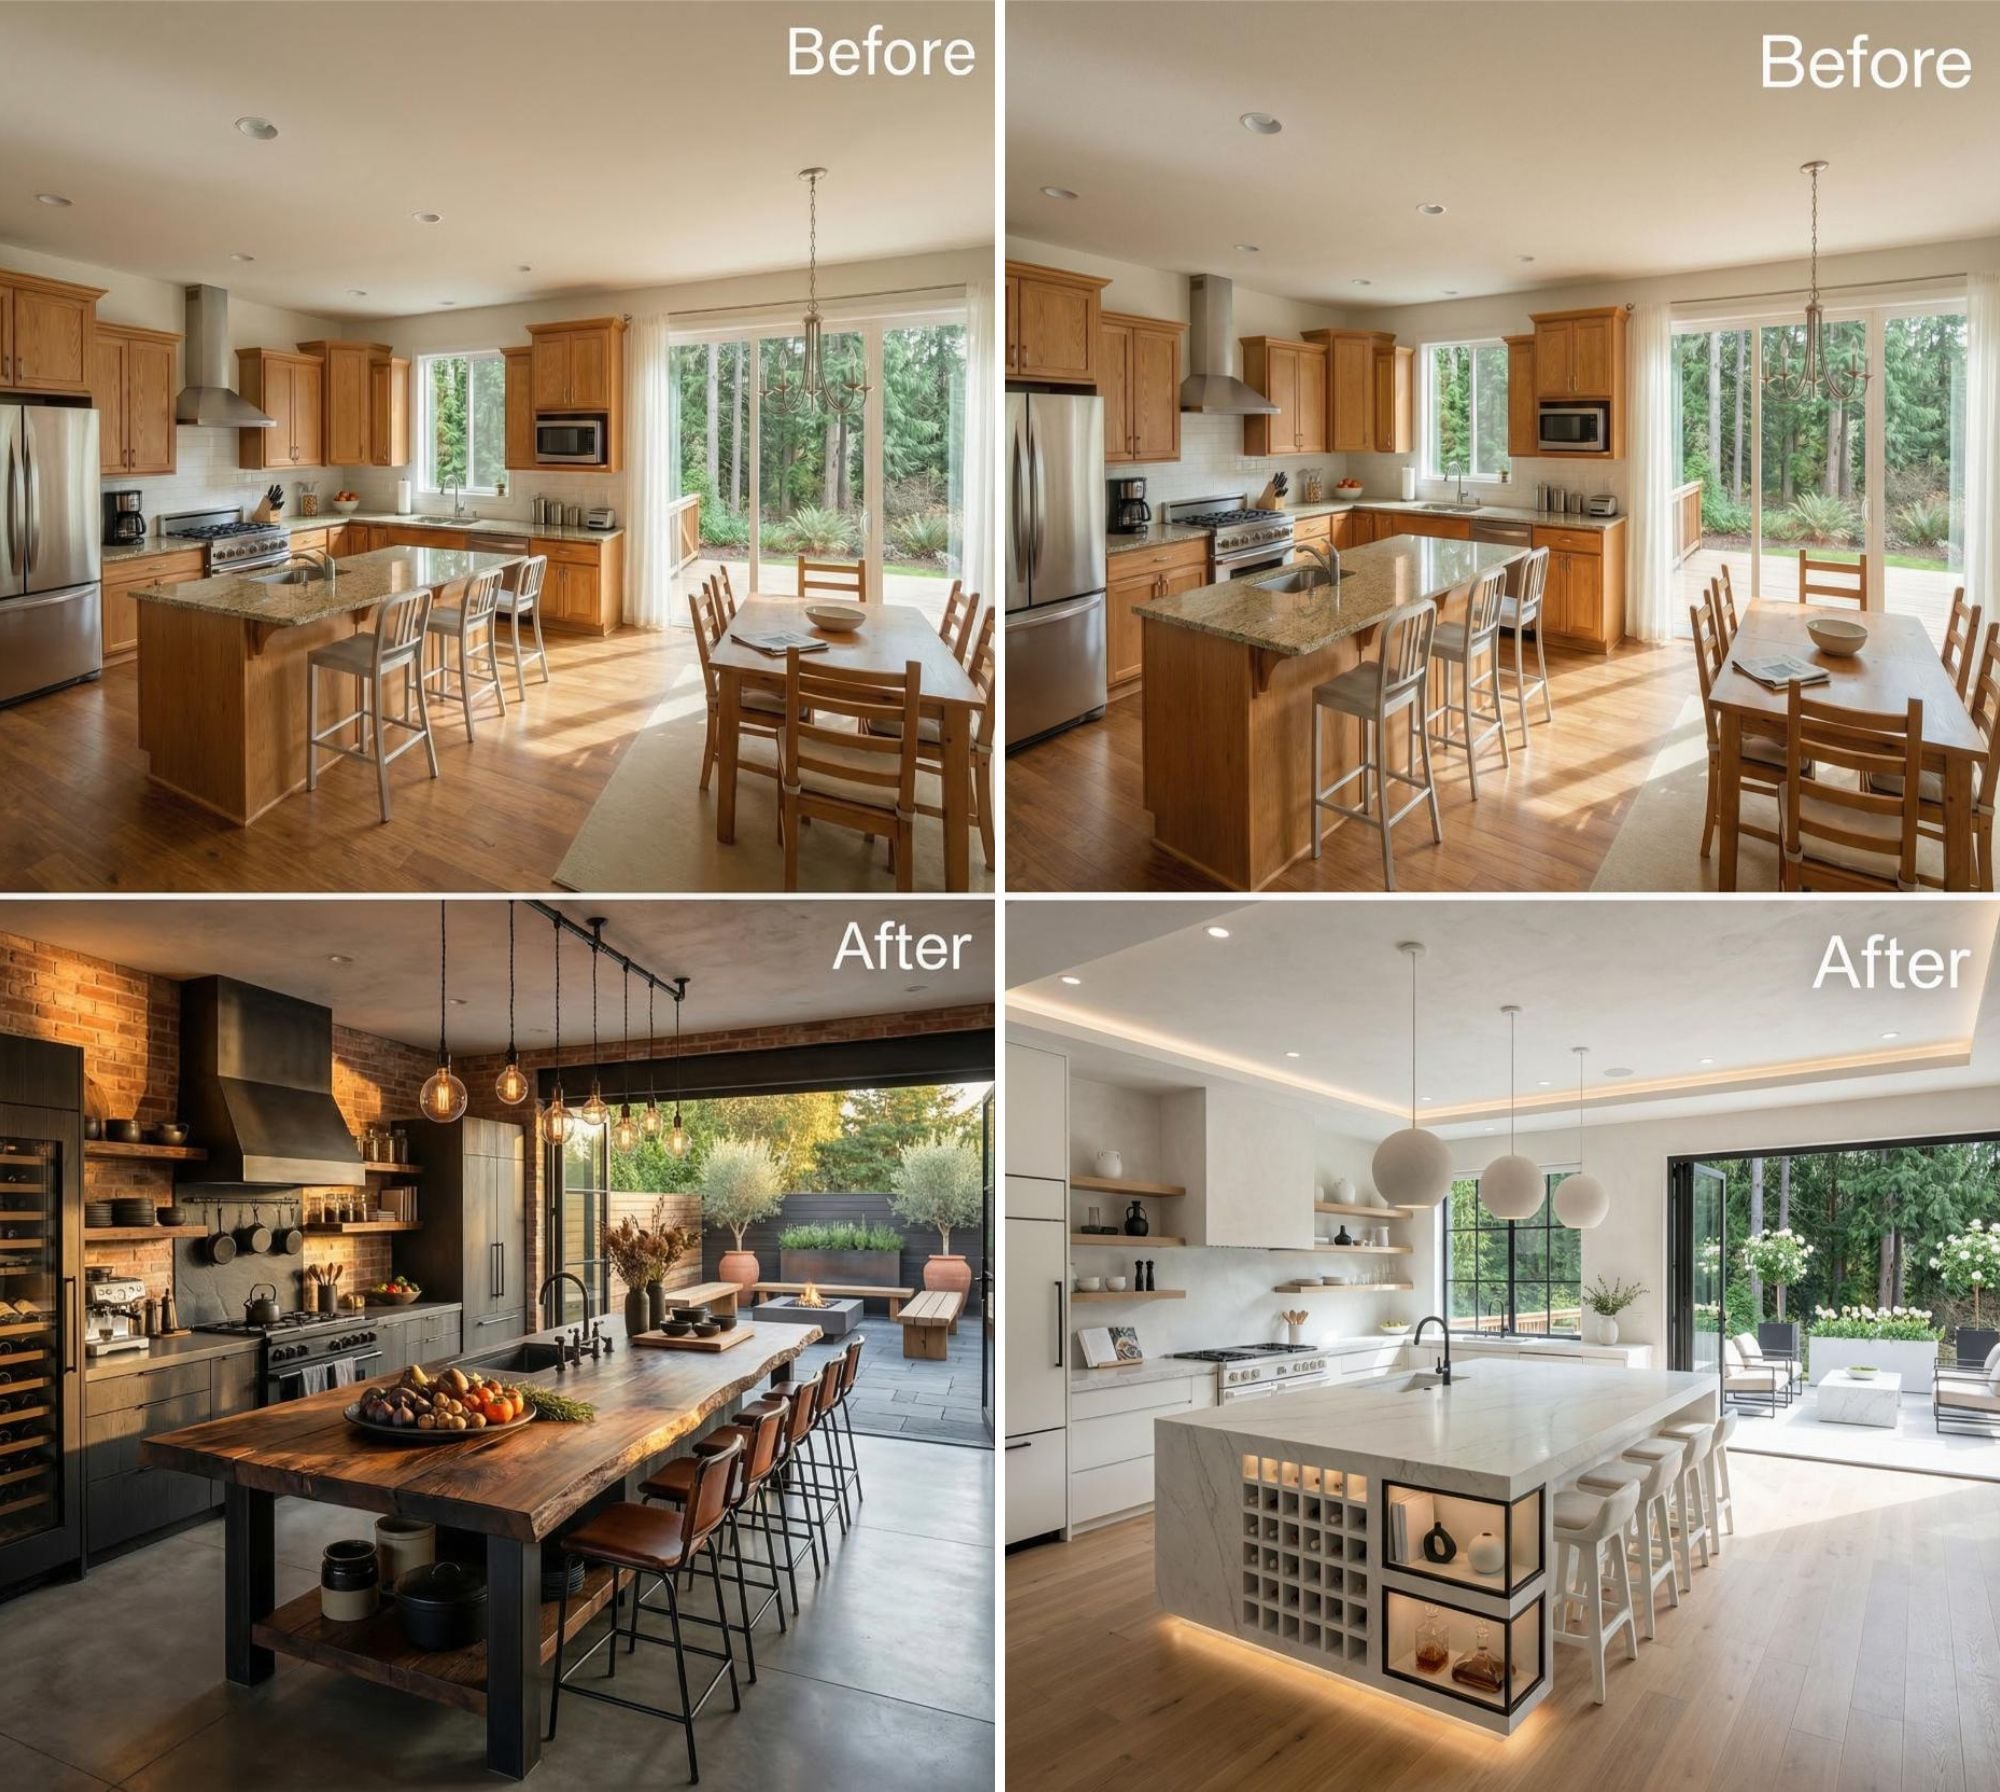
In order to come up with the very specific design ideas, we create most designs with the assistance of state-of-the-art AI interior design software.
Naperville – Tech Hub Appeal Drives Sustained Growth
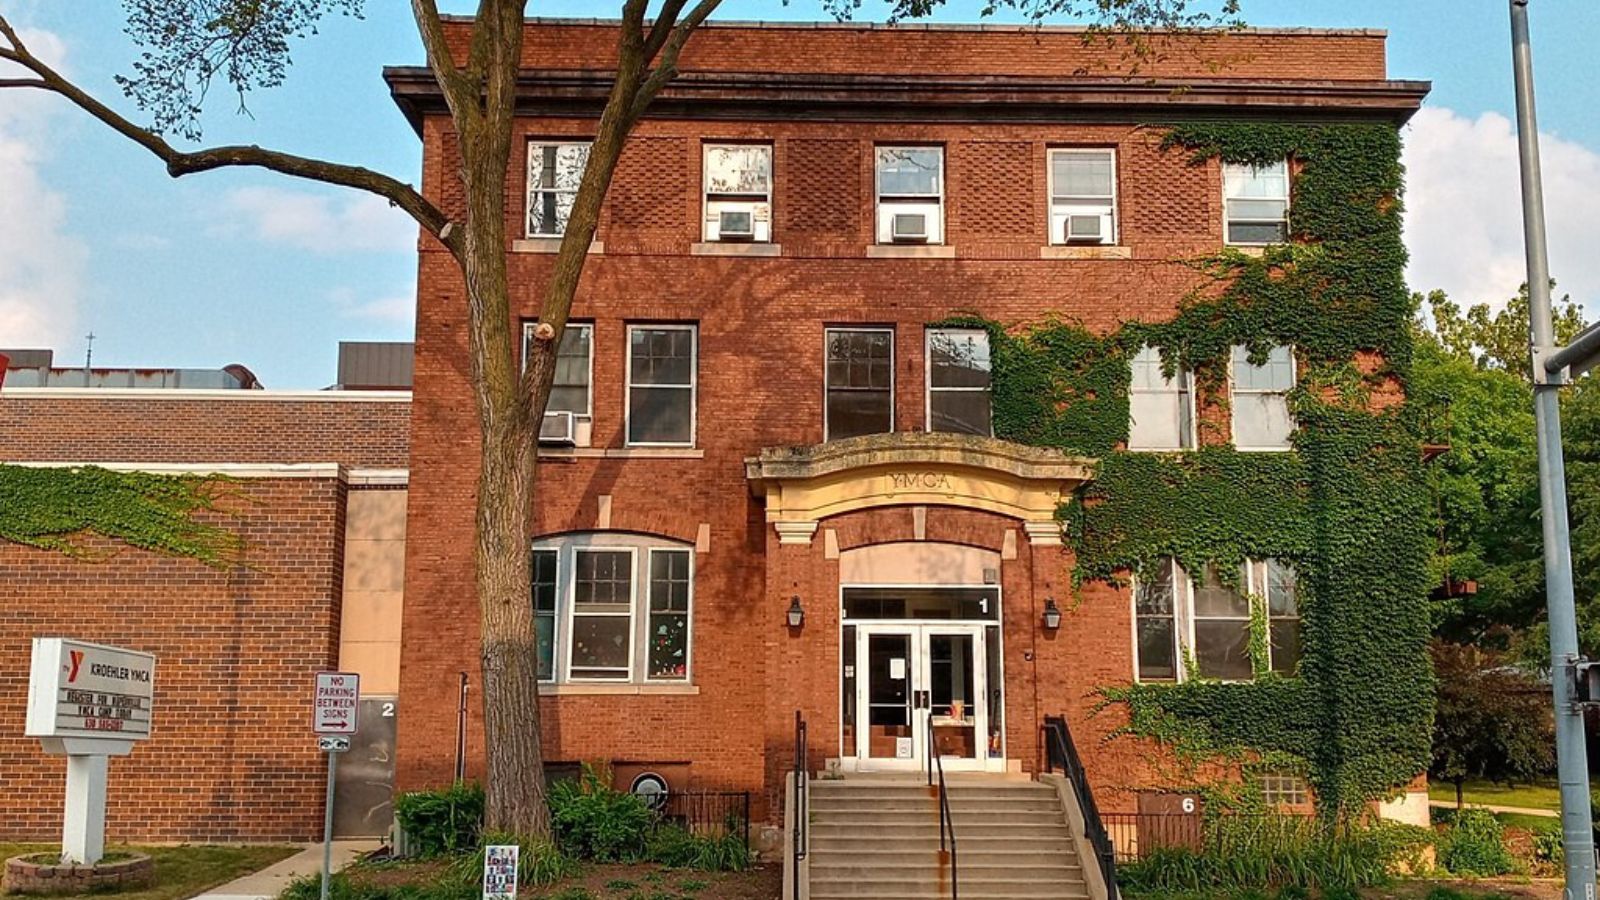
Located 28 miles west of downtown Chicago, Naperville has earned recognition as one of the nation’s best places to live, combining suburban charm with urban sophistication. The city’s proximity to major corporate headquarters and its position along critical transportation corridors make it particularly attractive to professionals working in Chicago’s Loop or the western suburbs’ technology corridor. Major employers like Bell Labs, BP America, and numerous Fortune 500 companies have operations in or near Naperville, creating a stable employment base that supports housing demand.
Housing data shows Naperville weathered the 2008-2012 recession better than many Illinois communities, with relatively modest declines followed by steady recovery. The 10.05% jump in 2024 reflects renewed confidence in the market, driven by the community’s strong fundamentals and continued corporate investment in the western suburbs. With median values still well below the $700,000+ range of Chicago’s most exclusive suburbs, Naperville represents relative value in Illinois’s premium market.
36. Barrington – 47.2% Home Price Increase Since 2010
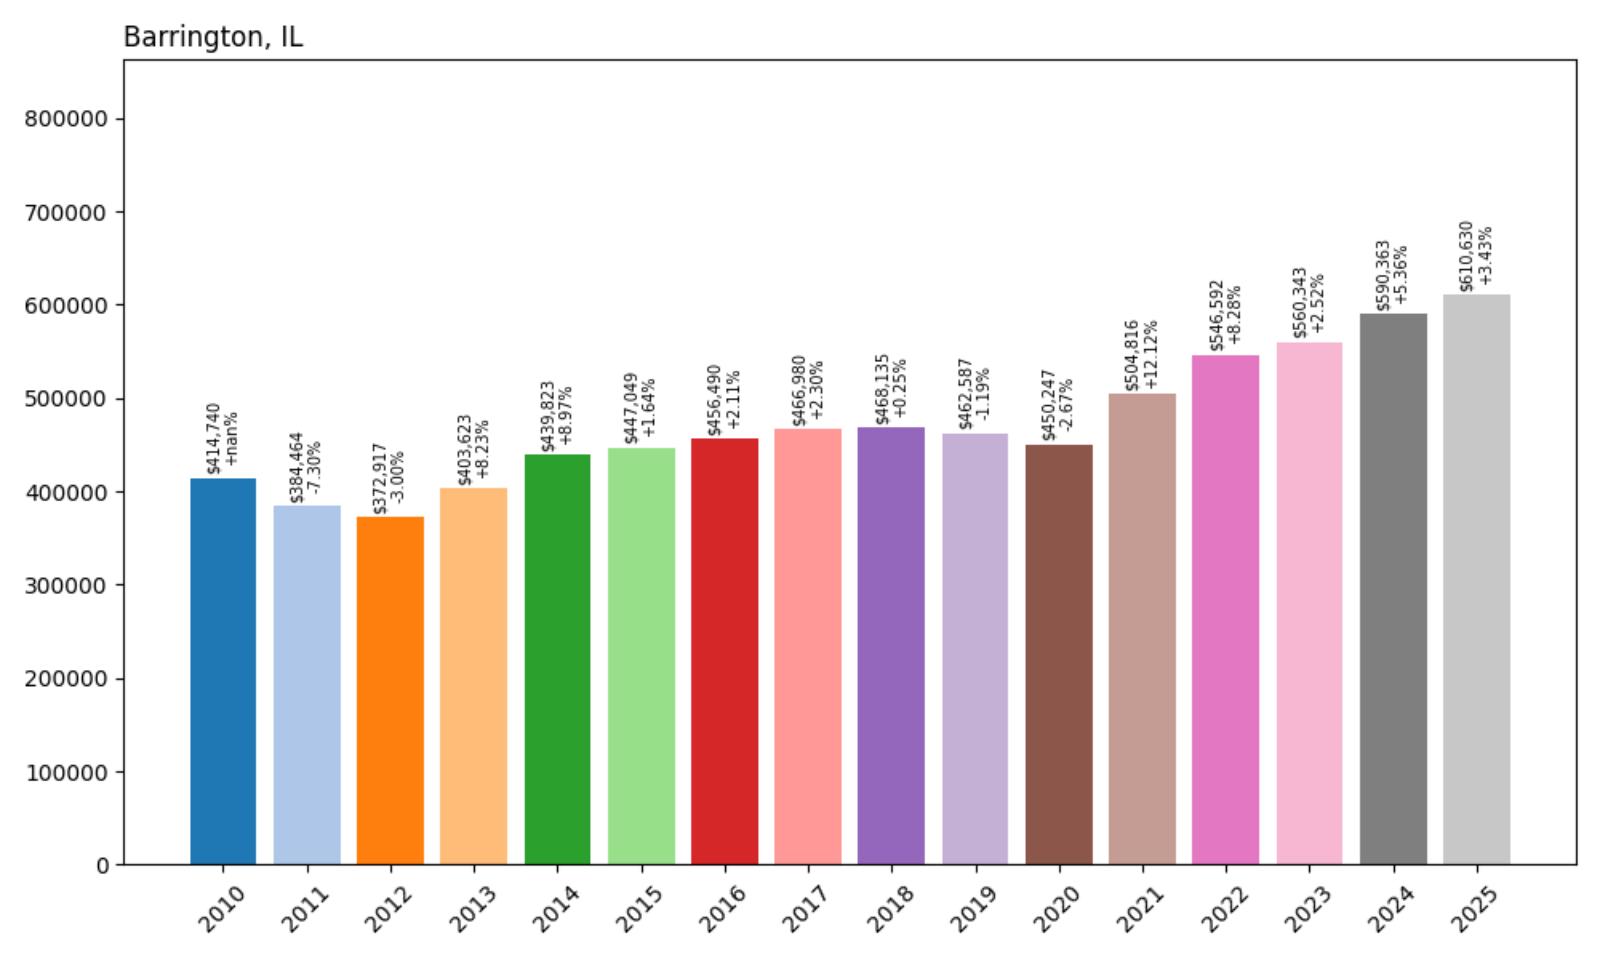
- 2010: $414,740
- 2011: $384,464 (−$30,276, −7.30% from previous year)
- 2012: $372,917 (−$11,547, −3.00% from previous year)
- 2013: $403,623 (+$30,707, +8.23% from previous year)
- 2014: $439,823 (+$36,200, +8.97% from previous year)
- 2015: $447,049 (+$7,226, +1.64% from previous year)
- 2016: $456,490 (+$9,441, +2.11% from previous year)
- 2017: $466,980 (+$10,489, +2.30% from previous year)
- 2018: $468,135 (+$1,156, +0.25% from previous year)
- 2019: $462,587 (−$5,549, −1.19% from previous year)
- 2020: $450,247 (−$12,340, −2.67% from previous year)
- 2021: $504,816 (+$54,569, +12.12% from previous year)
- 2022: $546,592 (+$41,776, +8.28% from previous year)
- 2023: $560,343 (+$13,751, +2.52% from previous year)
- 2024: $590,363 (+$30,020, +5.36% from previous year)
- 2025: $610,630 (+$20,267, +3.43% from previous year)
Barrington’s median home value of $610,630 reflects a 47.2% increase since 2010, showing more moderate appreciation compared to many Illinois luxury markets. The community experienced meaningful declines during 2018-2020, losing over 3% of its value, before rebounding strongly with a 12.12% surge in 2021. This pattern suggests a market that responds more sensitively to economic cycles while maintaining underlying strength through its desirable suburban characteristics and proximity to major employment centers.
Barrington – Rural Character Meets Modern Amenities
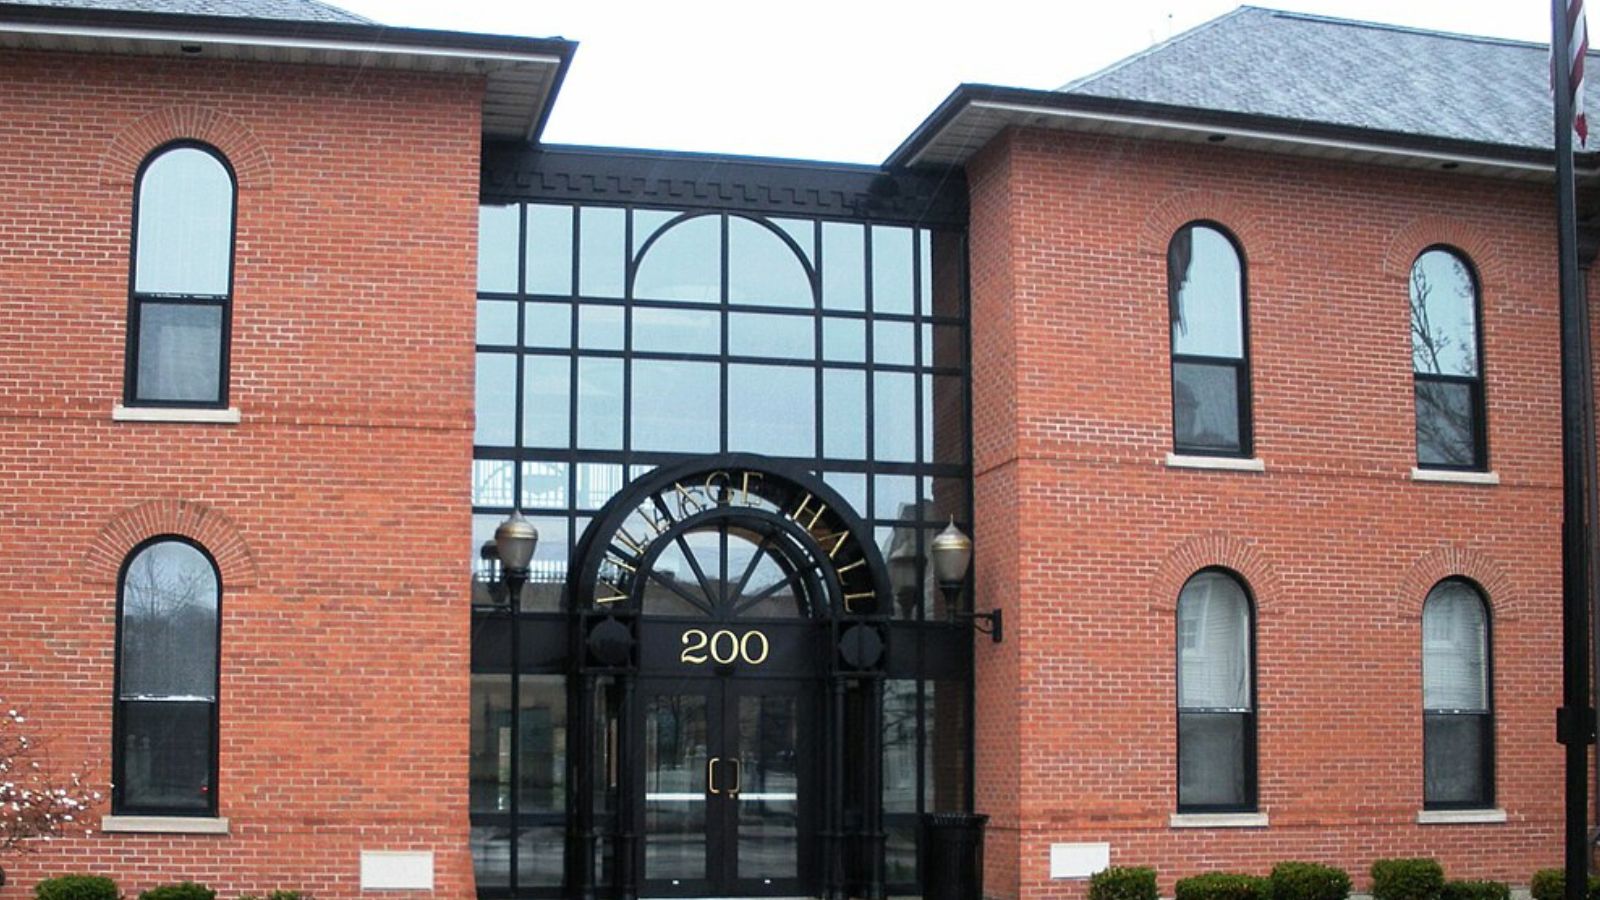
Situated in northwestern Cook County, Barrington offers a unique blend of rural atmosphere and suburban convenience that attracts buyers seeking space and privacy while maintaining access to Chicago’s economic opportunities. The community is known for its equestrian facilities, large residential lots, and preserved open spaces that create a country club lifestyle just 40 miles from downtown Chicago. This rural character, combined with excellent schools and low crime rates, appeals to affluent families looking to escape urban density.
Market data shows Barrington’s sensitivity to broader economic trends, with the 2018-2020 decline likely reflecting concerns about property tax burdens and changing commuting patterns. However, the strong rebound beginning in 2021 demonstrates the enduring appeal of the community’s lifestyle offering. Current median values around $610,000 position Barrington as accessible luxury compared to North Shore communities, while still delivering the space and amenities that define premium Illinois living.
35. La Grange – 44.2% Home Price Increase Since 2010
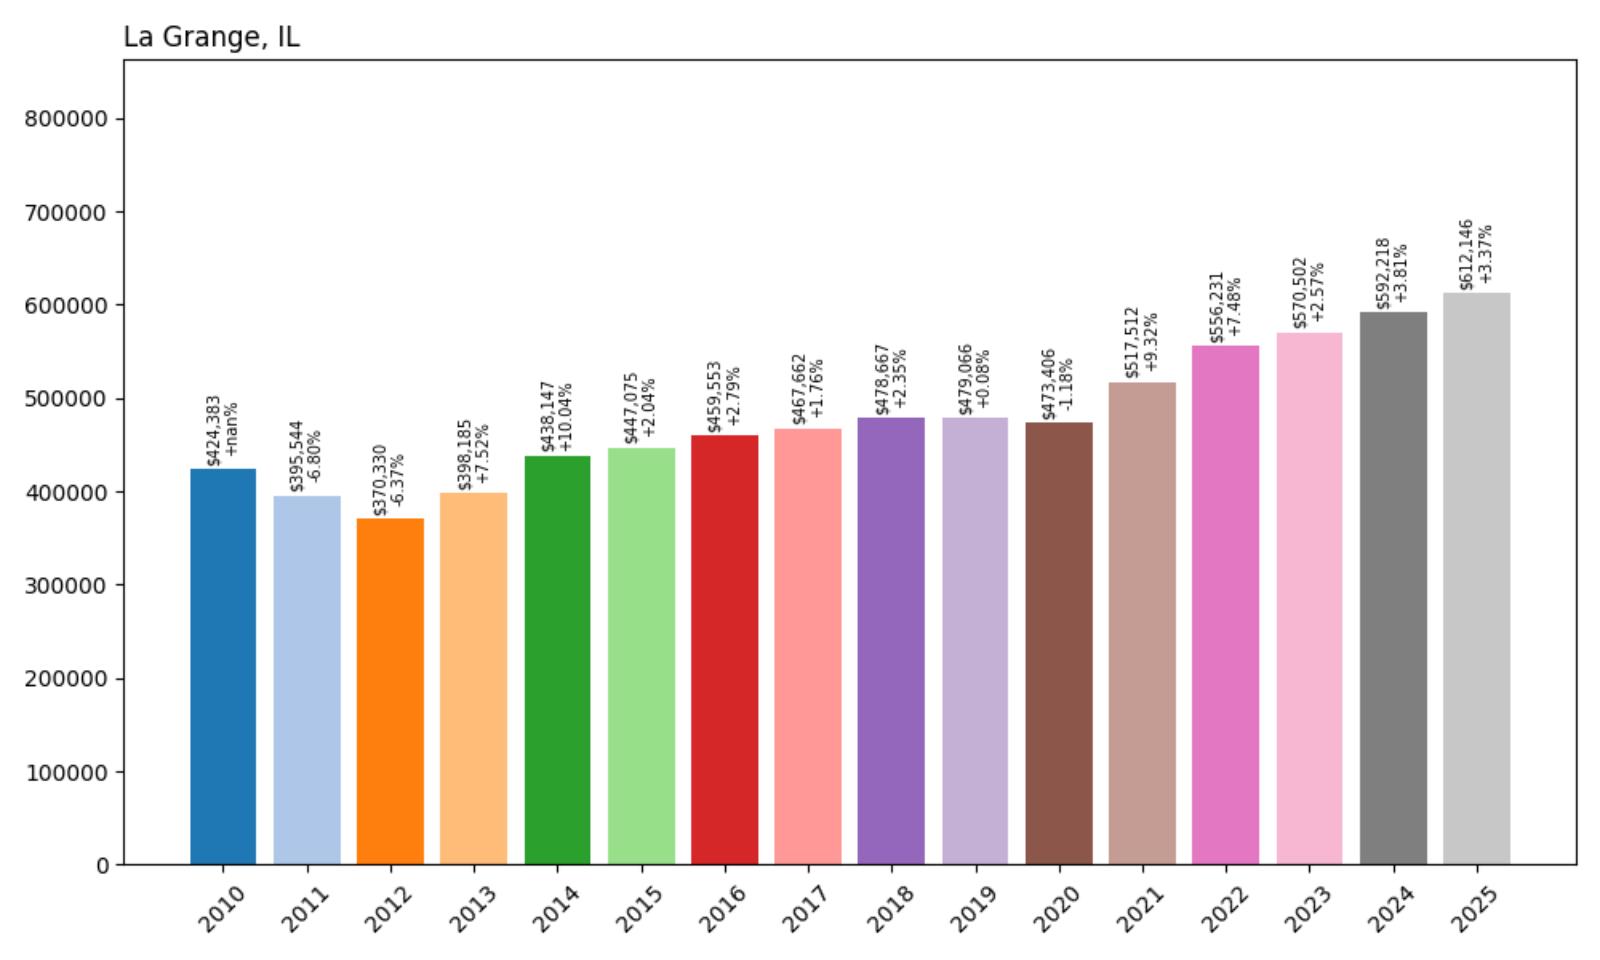
- 2010: $424,383
- 2011: $395,544 (−$28,839, −6.80% from previous year)
- 2012: $370,330 (−$25,215, −6.37% from previous year)
- 2013: $398,185 (+$27,856, +7.52% from previous year)
- 2014: $438,147 (+$39,961, +10.04% from previous year)
- 2015: $447,075 (+$8,929, +2.04% from previous year)
- 2016: $459,553 (+$12,478, +2.79% from previous year)
- 2017: $467,662 (+$8,109, +1.76% from previous year)
- 2018: $478,667 (+$11,005, +2.35% from previous year)
- 2019: $479,066 (+$399, +0.08% from previous year)
- 2020: $473,406 (−$5,660, −1.18% from previous year)
- 2021: $517,512 (+$44,106, +9.32% from previous year)
- 2022: $556,231 (+$38,720, +7.48% from previous year)
- 2023: $570,502 (+$14,270, +2.57% from previous year)
- 2024: $592,218 (+$21,716, +3.81% from previous year)
- 2025: $612,146 (+$19,928, +3.37% from previous year)
La Grange’s current median home value of $612,146 represents a steady 44.2% appreciation since 2010, demonstrating consistent but measured growth throughout the period. The community showed remarkable resilience during the pandemic, with only a minor 1.18% decline in 2020 before resuming steady growth. The most impressive performance came during 2013-2014 when values jumped nearly 18% over two years, reflecting renewed confidence in the western suburbs market following the financial crisis recovery.
La Grange – Historic Charm With Modern Appeal
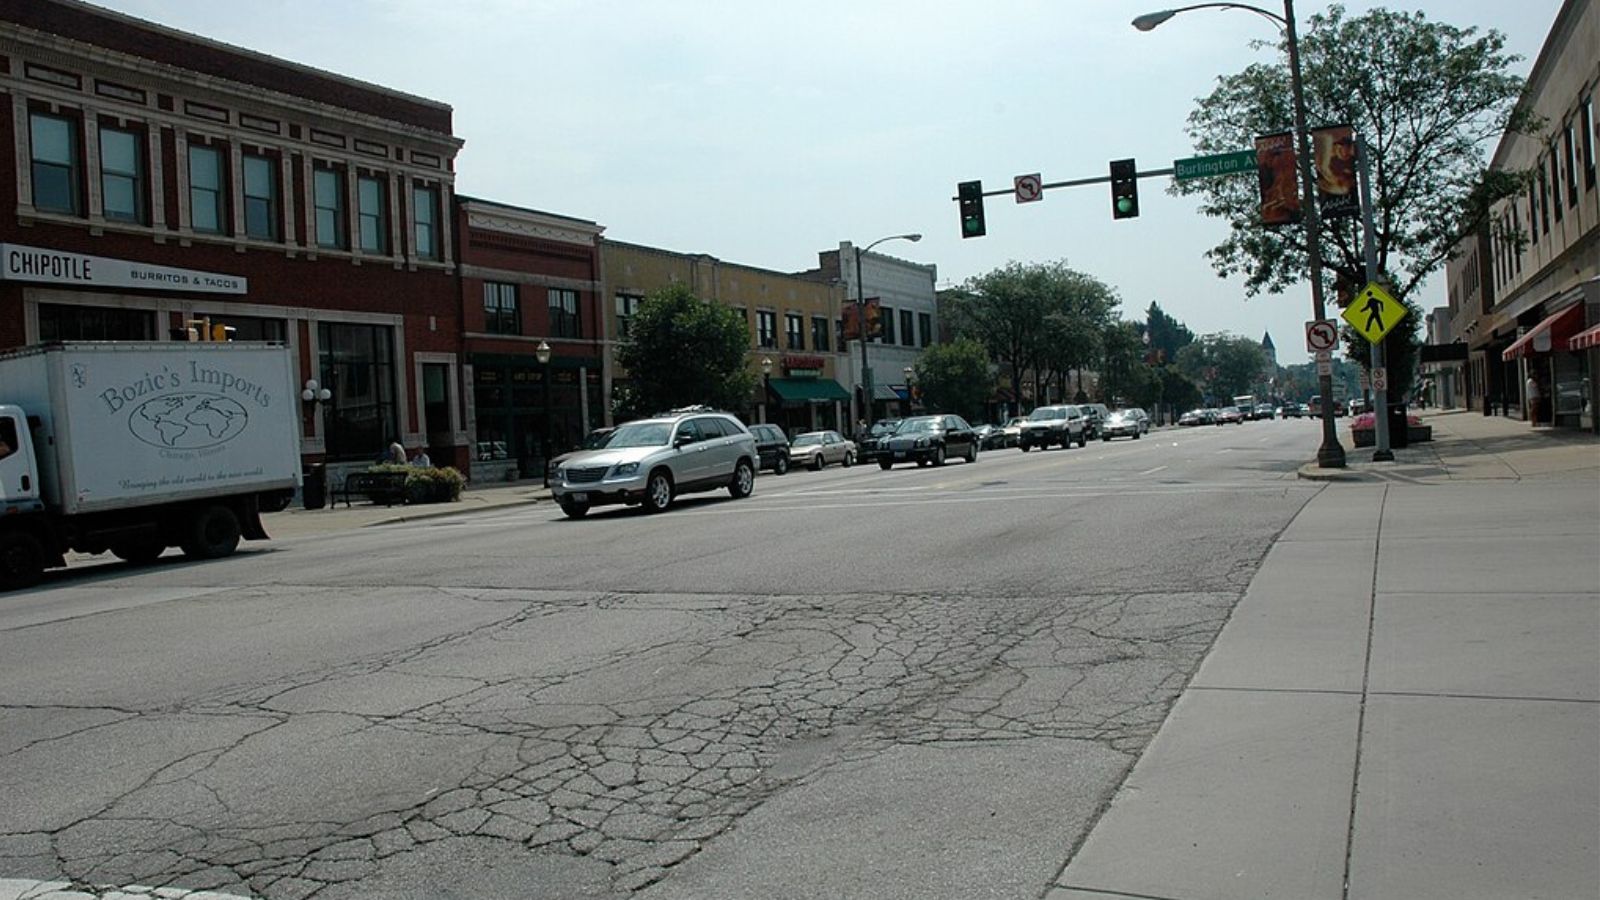
Located just 13 miles west of downtown Chicago, La Grange combines small-town charm with big-city access, making it a premier destination for families and professionals. The community is renowned for its well-preserved historic architecture, tree-lined streets, and walkable downtown district that features unique shops, restaurants, and community events. The village’s commitment to historic preservation while accommodating modern needs creates a distinctive character that sets it apart from other western suburbs.
Market performance shows La Grange’s stability as a residential investment, with consistent appreciation that reflects steady demand rather than speculative bubbles. The recent growth trajectory suggests the community continues to attract buyers who value its combination of historic character, excellent schools, and convenient location. With median home values now exceeding $612,000, La Grange represents the premium end of accessible luxury in Chicago’s western suburbs.
34. Lake Bluff – 58.5% Home Price Increase Since 2010
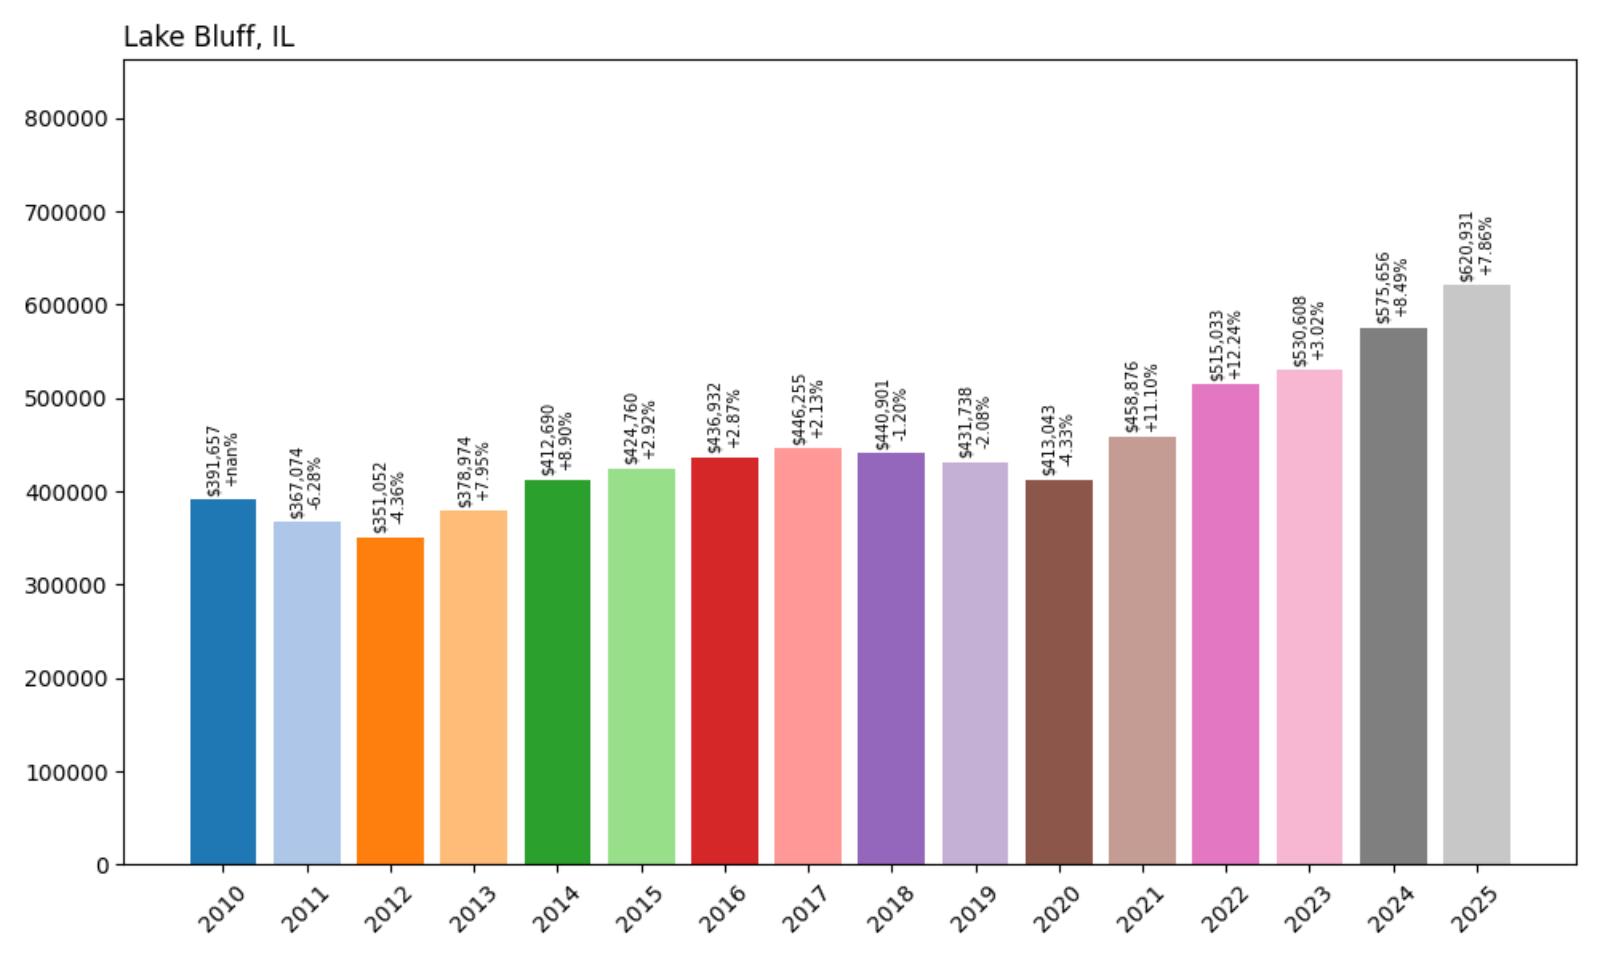
- 2010: $391,657
- 2011: $367,074 (−$24,582, −6.28% from previous year)
- 2012: $351,052 (−$16,022, −4.36% from previous year)
- 2013: $378,974 (+$27,922, +7.95% from previous year)
- 2014: $412,690 (+$33,717, +8.90% from previous year)
- 2015: $424,760 (+$12,070, +2.92% from previous year)
- 2016: $436,932 (+$12,172, +2.87% from previous year)
- 2017: $446,255 (+$9,323, +2.13% from previous year)
- 2018: $440,901 (−$5,355, −1.20% from previous year)
- 2019: $431,738 (−$9,163, −2.08% from previous year)
- 2020: $413,043 (−$18,694, −4.33% from previous year)
- 2021: $458,876 (+$45,832, +11.10% from previous year)
- 2022: $515,033 (+$56,157, +12.24% from previous year)
- 2023: $530,608 (+$15,575, +3.02% from previous year)
- 2024: $575,656 (+$45,048, +8.49% from previous year)
- 2025: $620,931 (+$45,275, +7.86% from previous year)
Lake Bluff’s median home value of $620,931 represents a robust 58.5% increase since 2010, with particularly strong performance in recent years following a challenging 2018-2020 period. The community experienced a notable decline during those years, losing over 6% of its value, before staging a dramatic recovery with consecutive double-digit gains in 2021-2022. The 7.86% increase in 2025 continues this upward trajectory, suggesting renewed confidence in this North Shore market.
Lake Bluff – Lakefront Living At Its Finest
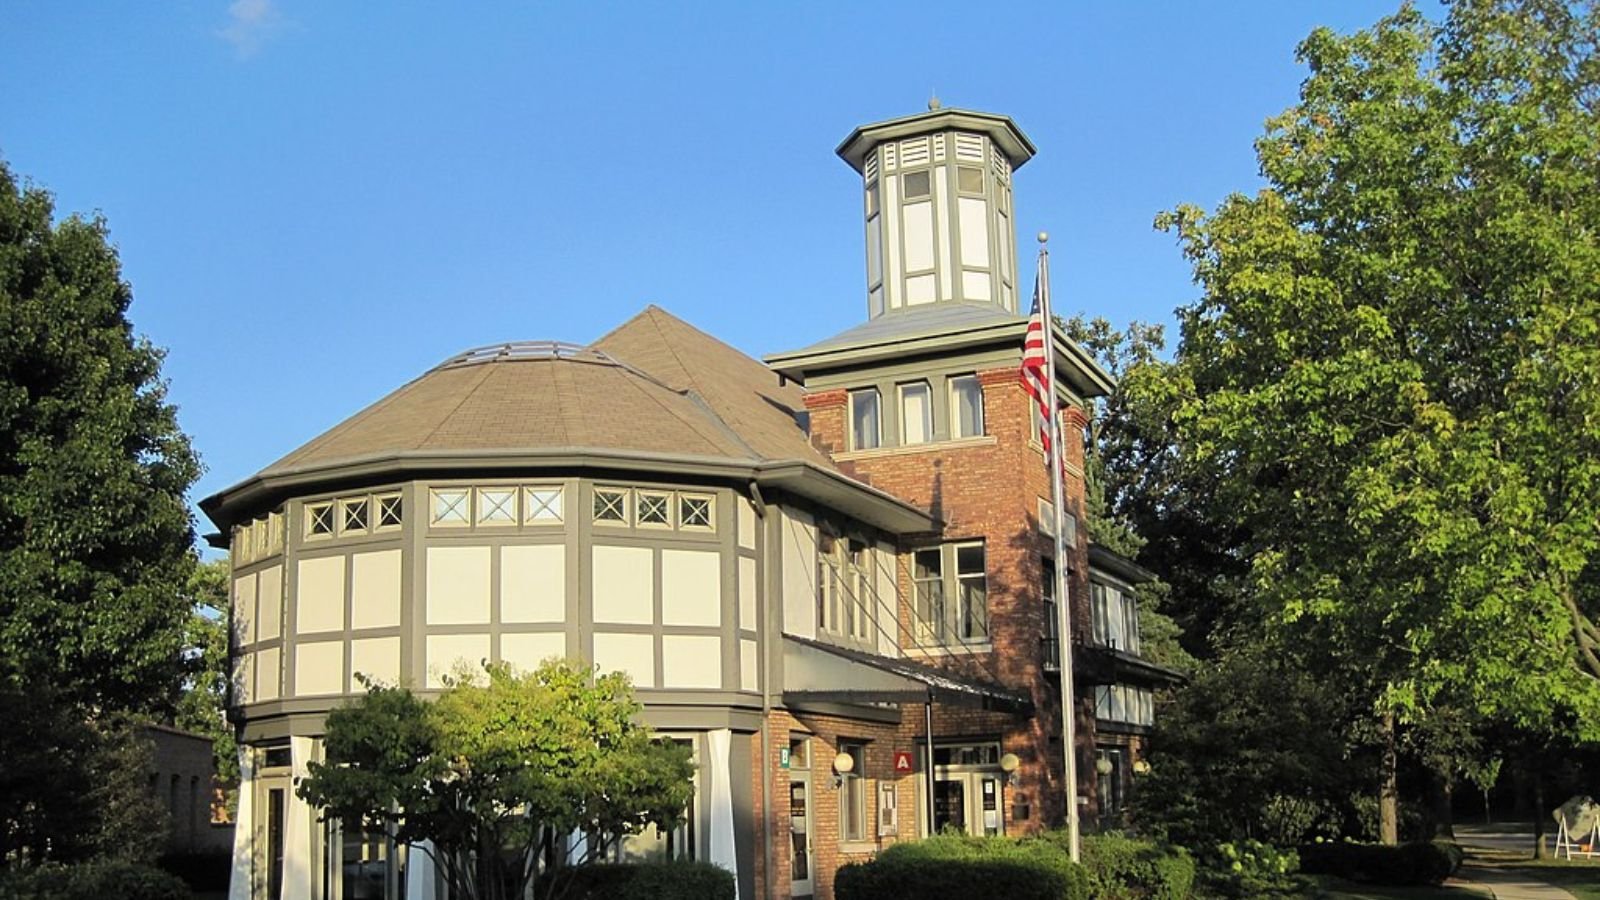
Positioned along Lake Michigan’s shoreline in Lake County, Lake Bluff offers residents exclusive access to pristine beaches, bluff-top parks, and some of the most scenic real estate in the Chicago metropolitan area. The community’s location approximately 35 miles north of downtown Chicago provides a perfect balance of lakefront recreation and urban accessibility via the Union Pacific North Metra line. The village’s compact size and lakefront orientation create an intimate, resort-like atmosphere that distinguishes it from larger North Shore communities.
The recent market recovery reflects growing appreciation for Lake Bluff’s unique combination of natural beauty, small-town character, and proximity to Chicago. The strong performance in 2024-2025, with values increasing over 15% in just two years, indicates that buyers are recognizing the community’s value proposition. Current median prices around $621,000 position Lake Bluff as relatively accessible among North Shore lakefront communities while delivering the lifestyle amenities that define premium Illinois living.
33. Bull Valley – 51.9% Home Price Increase Since 2010
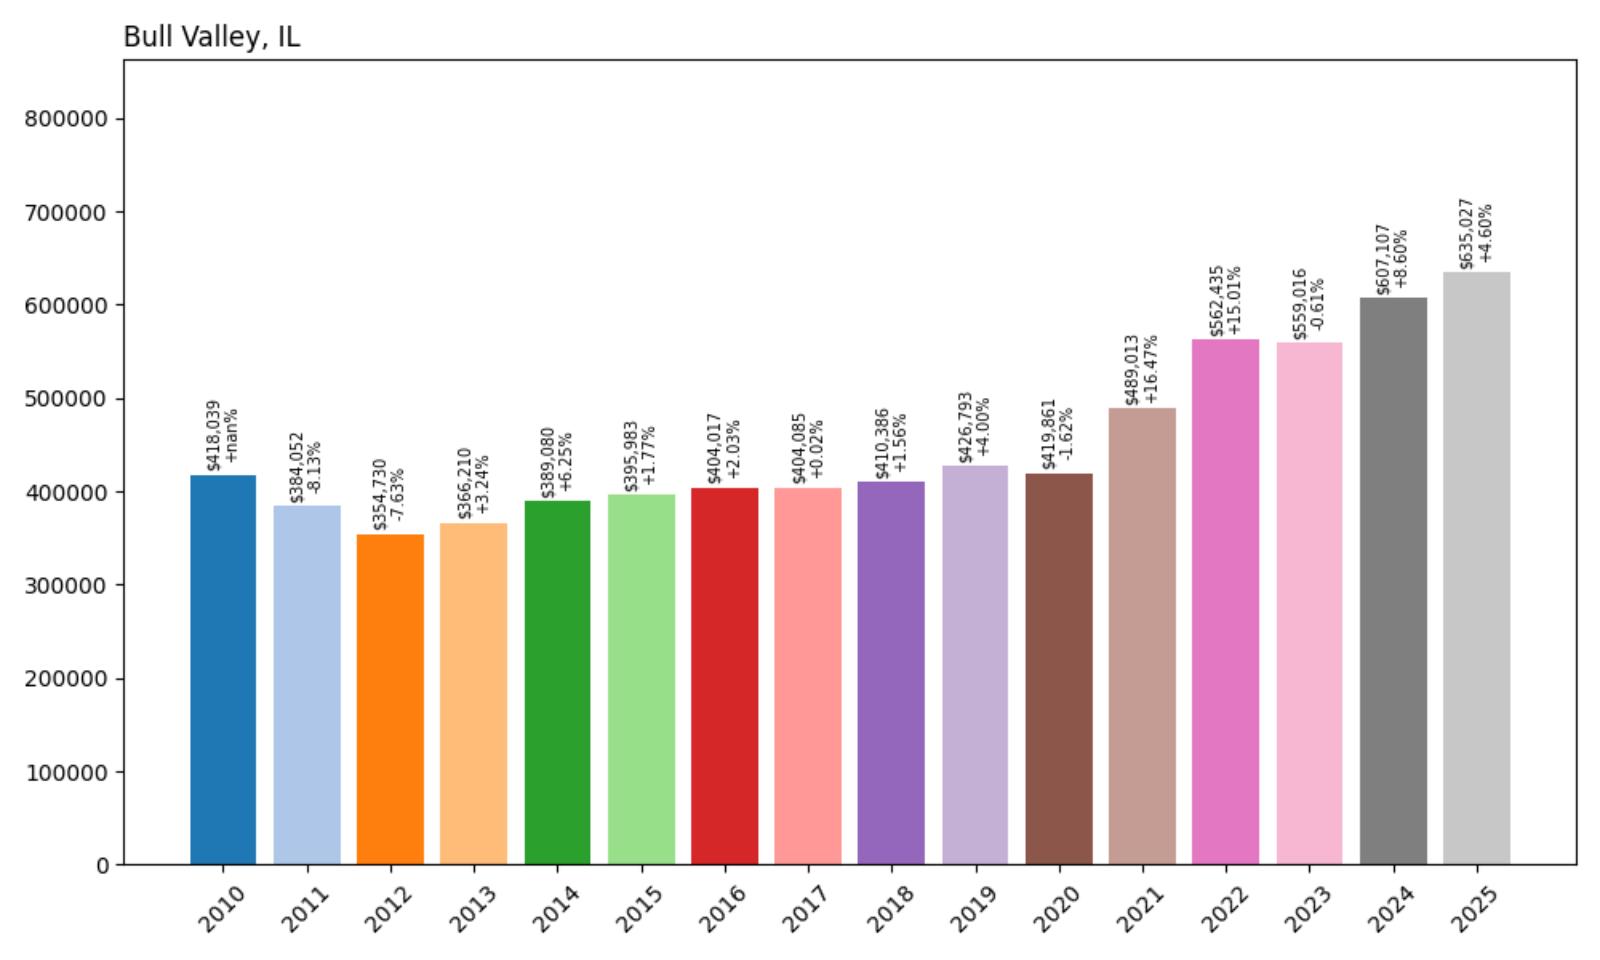
- 2010: $418,039
- 2011: $384,052 (−$33,987, −8.13% from previous year)
- 2012: $354,730 (−$29,322, −7.63% from previous year)
- 2013: $366,210 (+$11,480, +3.24% from previous year)
- 2014: $389,080 (+$22,870, +6.25% from previous year)
- 2015: $395,983 (+$6,903, +1.77% from previous year)
- 2016: $404,017 (+$8,035, +2.03% from previous year)
- 2017: $404,085 (+$67, +0.02% from previous year)
- 2018: $410,386 (+$6,301, +1.56% from previous year)
- 2019: $426,793 (+$16,407, +4.00% from previous year)
- 2020: $419,861 (−$6,932, −1.62% from previous year)
- 2021: $489,013 (+$69,153, +16.47% from previous year)
- 2022: $562,435 (+$73,422, +15.01% from previous year)
- 2023: $559,016 (−$3,419, −0.61% from previous year)
- 2024: $607,107 (+$48,091, +8.60% from previous year)
- 2025: $635,027 (+$27,920, +4.60% from previous year)
Bull Valley’s median home value of $635,027 reflects a strong 51.9% appreciation since 2010, with particularly dramatic gains during the pandemic period. The community experienced significant declines during 2011-2012, losing over 15% of its value, before beginning a slow but steady recovery. The most remarkable performance came during 2021-2022 when values surged over 31% in just two years, representing one of the strongest appreciation periods among Illinois’s expensive communities.
Bull Valley – Rural Luxury In The Northwest Suburbs
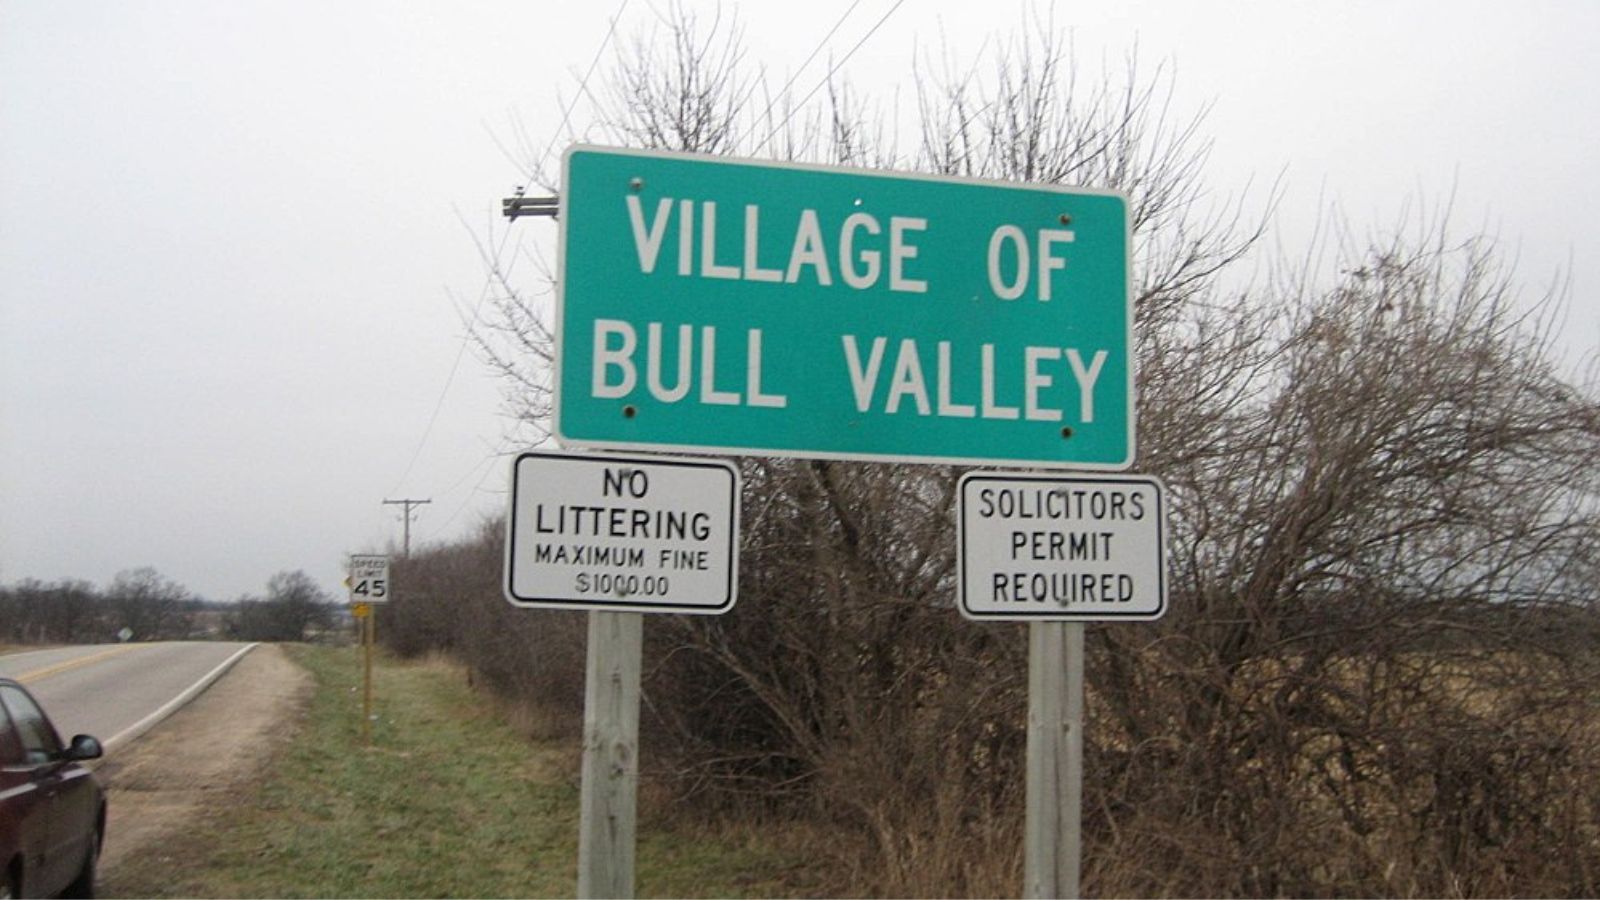
Located in northwestern McHenry County, Bull Valley offers residents a unique rural lifestyle while maintaining proximity to Chicago and the northwest suburbs’ major employment centers. The community is characterized by large residential lots, equestrian facilities, and preserved natural areas that create a country estate atmosphere just 45 miles from downtown Chicago. This rural character, combined with low population density and strict zoning controls, appeals to buyers seeking privacy and space while remaining connected to urban amenities.
Market data shows Bull Valley’s sensitivity to economic cycles, with the sharp declines following the 2008 financial crisis giving way to exceptional growth during the recent real estate boom. The 16.47% gain in 2021 was among the highest recorded in Illinois that year, reflecting pent-up demand for rural properties and changing lifestyle preferences. Current values approaching $635,000 represent significant appreciation potential while still offering relative value compared to more established luxury markets in Illinois.
32. Deerfield – 47.9% Home Price Increase Since 2010
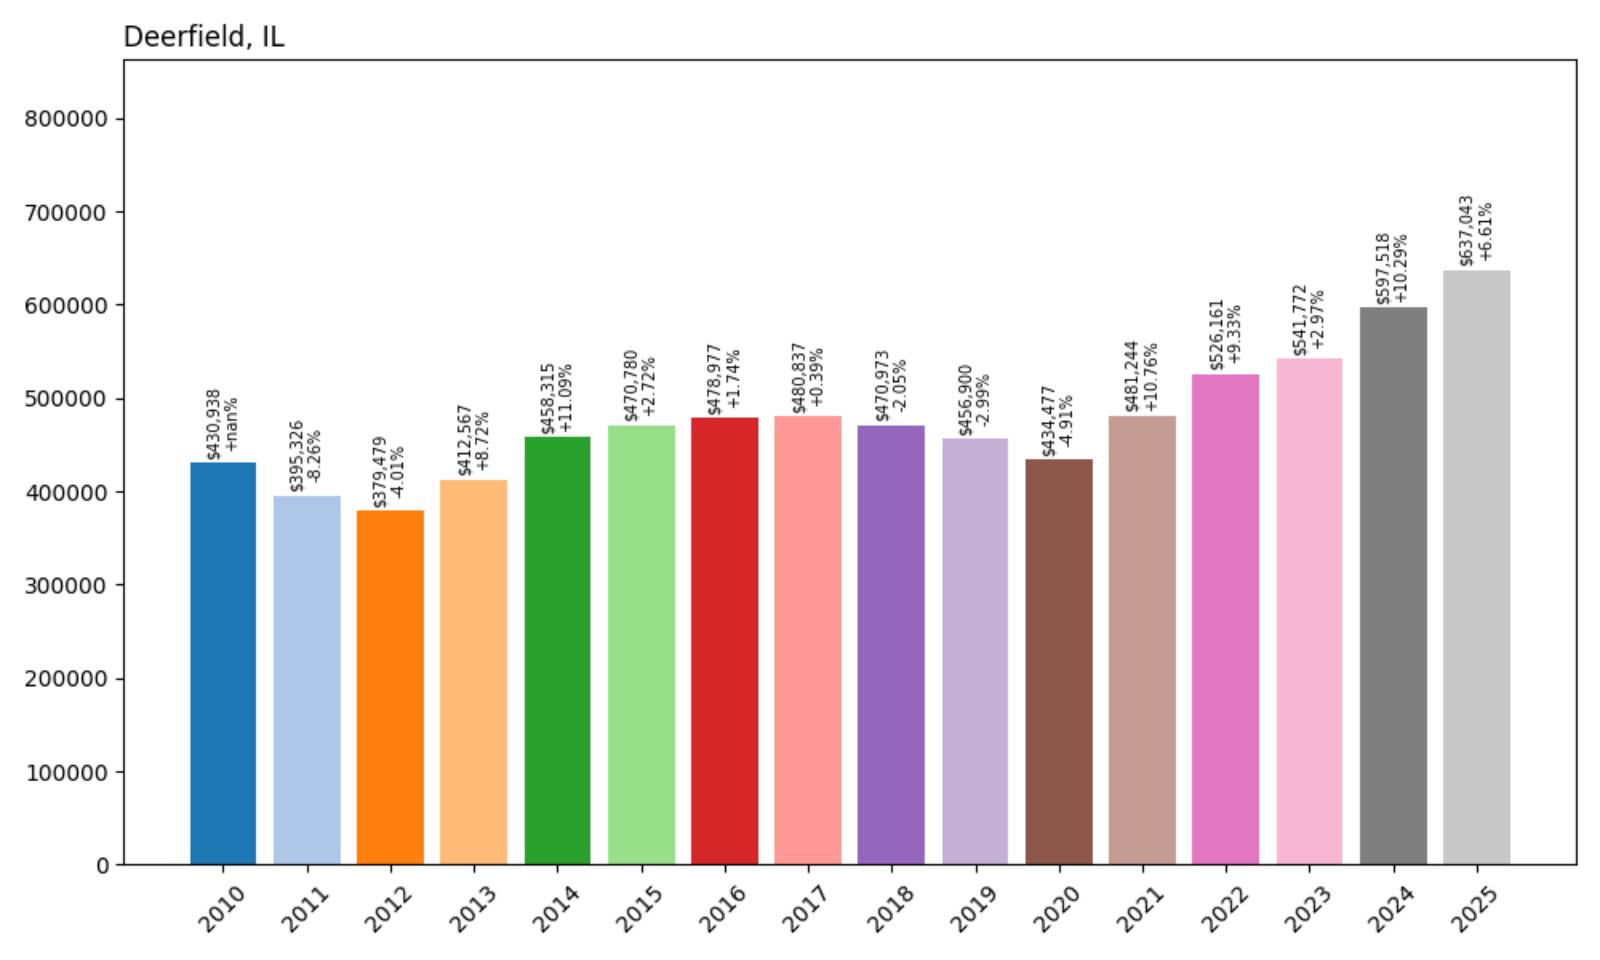
- 2010: $430,938
- 2011: $395,326 (−$35,613, −8.26% from previous year)
- 2012: $379,479 (−$15,847, −4.01% from previous year)
- 2013: $412,567 (+$33,088, +8.72% from previous year)
- 2014: $458,315 (+$45,748, +11.09% from previous year)
- 2015: $470,780 (+$12,465, +2.72% from previous year)
- 2016: $478,977 (+$8,197, +1.74% from previous year)
- 2017: $480,837 (+$1,860, +0.39% from previous year)
- 2018: $470,973 (−$9,864, −2.05% from previous year)
- 2019: $456,900 (−$14,073, −2.99% from previous year)
- 2020: $434,477 (−$22,422, −4.91% from previous year)
- 2021: $481,244 (+$46,767, +10.76% from previous year)
- 2022: $526,161 (+$44,917, +9.33% from previous year)
- 2023: $541,772 (+$15,611, +2.97% from previous year)
- 2024: $597,518 (+$55,746, +10.29% from previous year)
- 2025: $637,043 (+$39,525, +6.61% from previous year)
Deerfield’s current median home value of $637,043 represents a 47.9% increase since 2010, showing strong recovery following a challenging period from 2018-2020 when values declined nearly 10%. The community demonstrated remarkable resilience with consecutive strong gains beginning in 2021, culminating in an exceptional 10.29% increase in 2024. This recent performance suggests renewed confidence in Deerfield’s market fundamentals and its position within the competitive North Shore landscape.
Deerfield – Corporate Hub Meets Residential Excellence
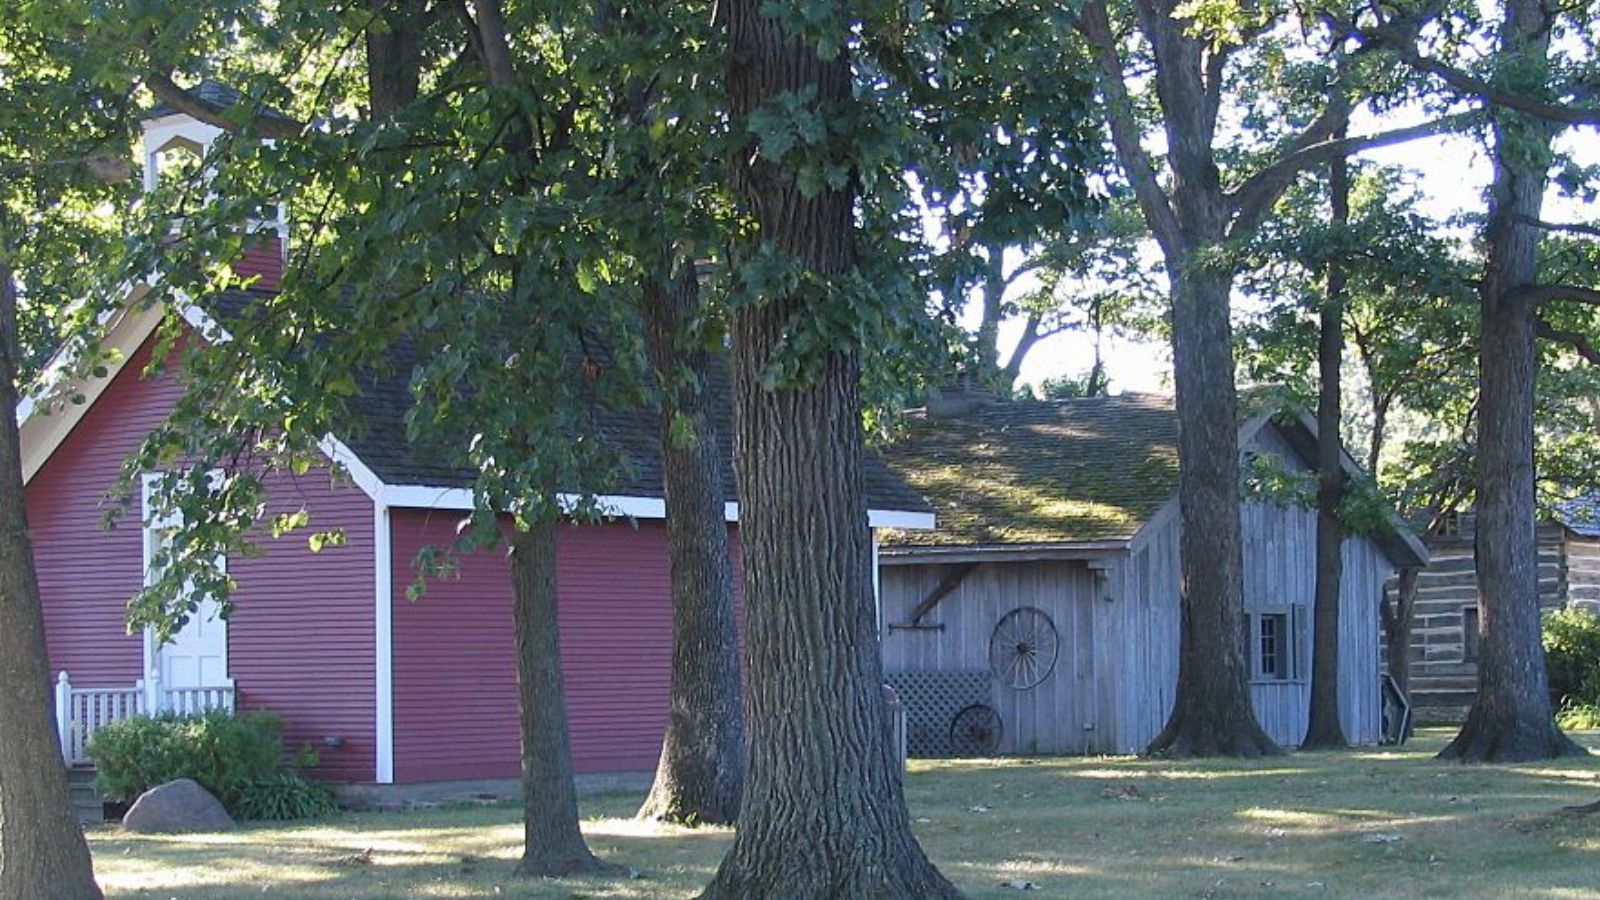
Strategically located in northern Cook County, Deerfield combines residential excellence with significant commercial development, creating a unique dynamic that supports both lifestyle and property values. The community serves as a major corporate center, hosting headquarters for companies like Walgreens, Baxter International, and Fortune Brands, providing a strong employment base and tax revenue stream that benefits residents. This corporate presence, combined with excellent transportation access via Interstate 94 and the Metra North Central Service, makes Deerfield attractive to both executives and families.
Recent market performance reflects Deerfield’s emergence from a period of adjustment as the community adapted to changing economic conditions and corporate relocations. The strong rebound beginning in 2021, with values increasing over 32% in four years, demonstrates the underlying strength of the market and its appeal to buyers seeking both residential quality and economic stability. Current median values around $637,000 position Deerfield competitively within the North Shore market while offering proximity to major employment centers.
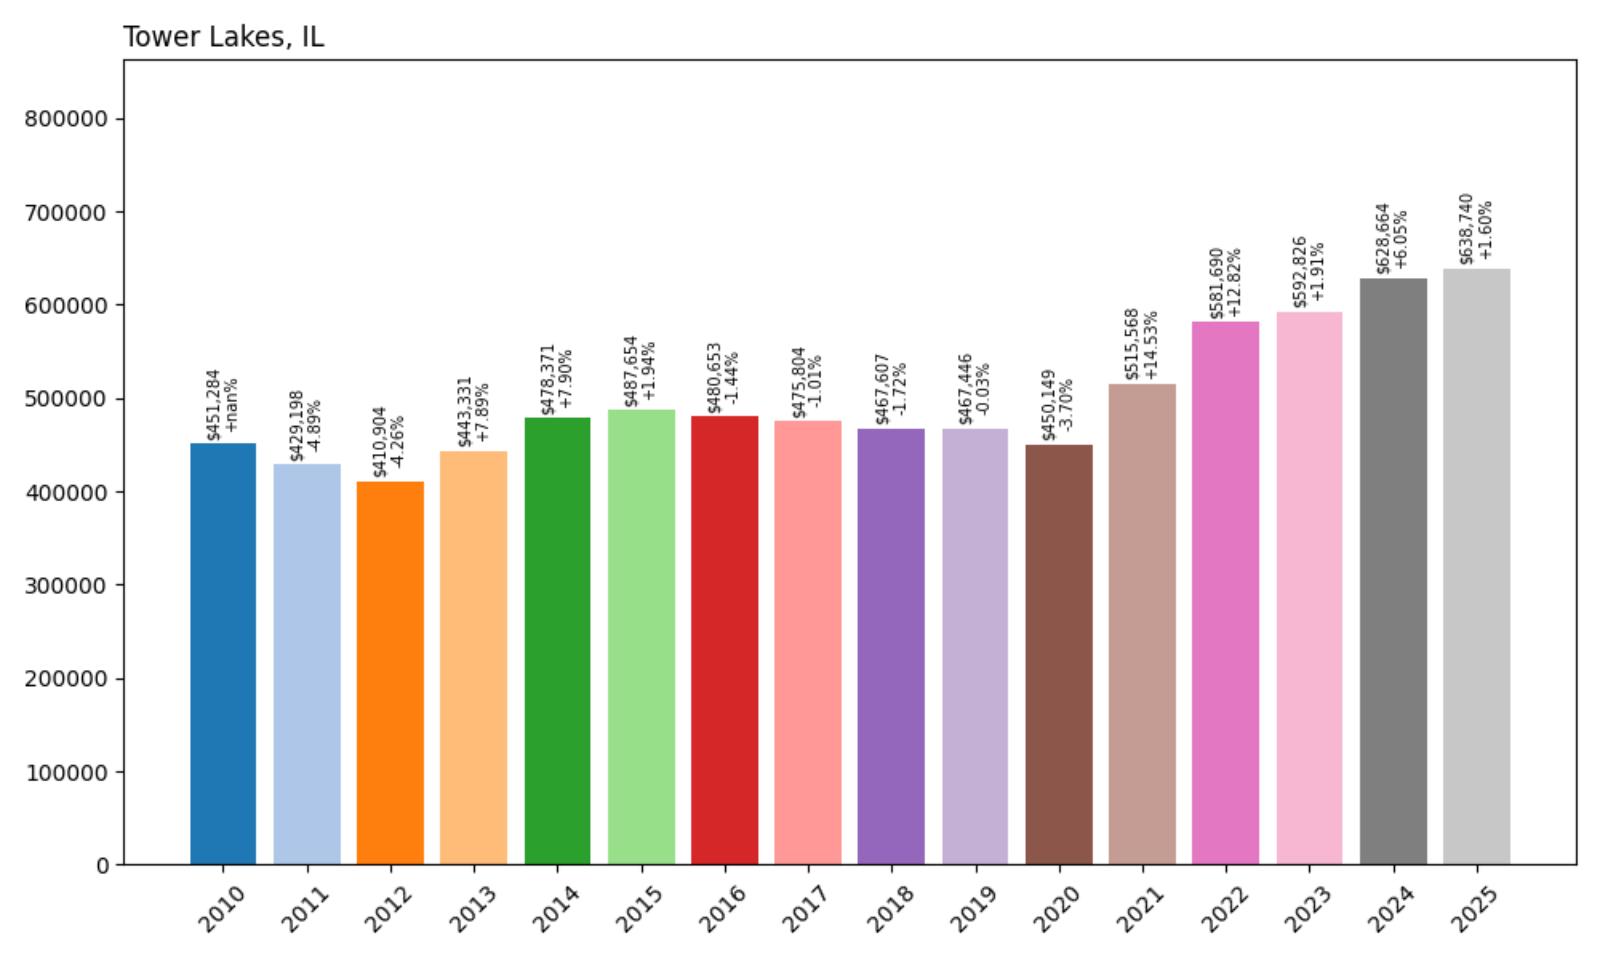
31. Tower Lakes – 41.5% Home Price Increase Since 2010
🔥 Would you like to save this?
- 2010: $451,284
- 2011: $429,198 (−$22,086, −4.89% from previous year)
- 2012: $410,904 (−$18,294, −4.26% from previous year)
- 2013: $443,331 (+$32,427, +7.89% from previous year)
- 2014: $478,371 (+$35,041, +7.90% from previous year)
- 2015: $487,654 (+$9,283, +1.94% from previous year)
- 2016: $480,653 (−$7,002, −1.44% from previous year)
- 2017: $475,804 (−$4,848, −1.01% from previous year)
- 2018: $467,607 (−$8,197, −1.72% from previous year)
- 2019: $467,446 (−$161, −0.03% from previous year)
- 2020: $450,149 (−$17,297, −3.70% from previous year)
- 2021: $515,568 (+$65,419, +14.53% from previous year)
- 2022: $581,690 (+$66,121, +12.82% from previous year)
- 2023: $592,826 (+$11,137, +1.91% from previous year)
- 2024: $628,664 (+$35,837, +6.05% from previous year)
- 2025: $638,740 (+$10,077, +1.60% from previous year)
Tower Lakes’ median home value of $638,740 represents a 41.5% increase since 2010, showing a pattern of extended decline from 2015-2020 followed by dramatic recovery. The community lost nearly 8% of its value over five years before experiencing one of Illinois’s strongest rebounds, with consecutive double-digit gains in 2021-2022 totaling over 27%. This performance reflects the unique appeal of lakefront living and the community’s recovery from earlier market challenges.
Tower Lakes – Exclusive Lakefront Community
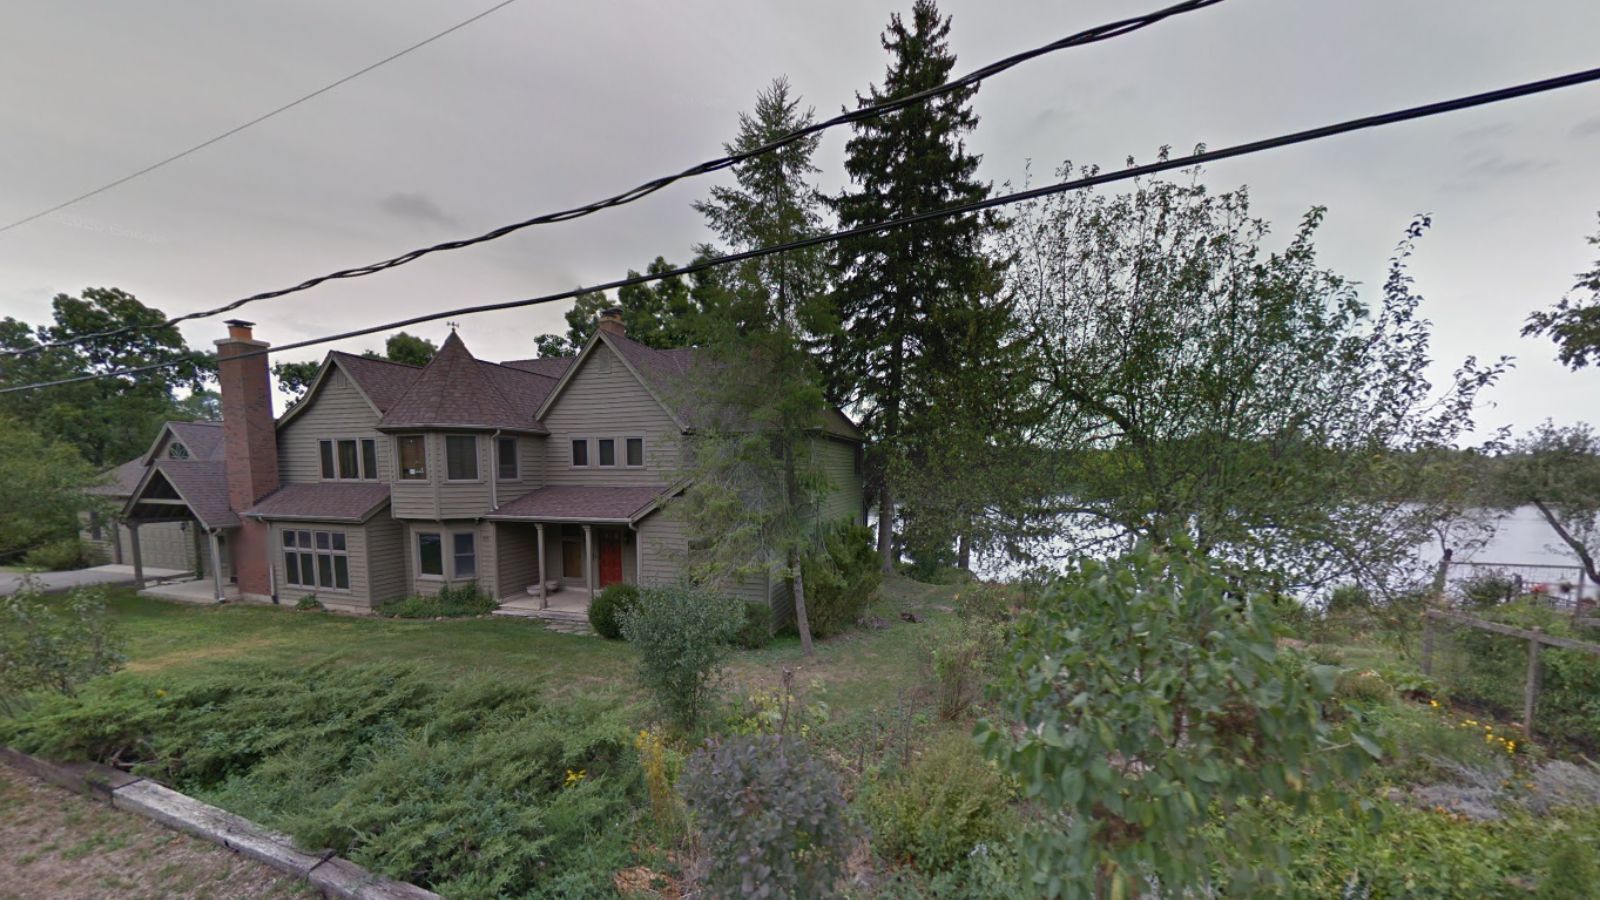
Nestled around several pristine lakes in northern Lake County, Tower Lakes offers residents an exclusive lakefront lifestyle that combines natural beauty with suburban convenience. The community is built around a series of interconnected lakes that provide residents with private boating, fishing, and water recreation opportunities right in their backyards. This unique geographic setting, combined with large lots and custom homes, creates one of Illinois’s most distinctive residential environments just 40 miles northwest of downtown Chicago.
Market data shows Tower Lakes’ sensitivity to broader economic trends, with the extended decline from 2015-2020 likely reflecting concerns about luxury home markets and changing buyer preferences. However, the dramatic recovery beginning in 2021 demonstrates the enduring appeal of lakefront living and the community’s unique value proposition. Current median values approaching $639,000 represent significant appreciation potential while delivering lifestyle amenities that few Illinois communities can match.
30. Glenview – 41.2% Home Price Increase Since 2010
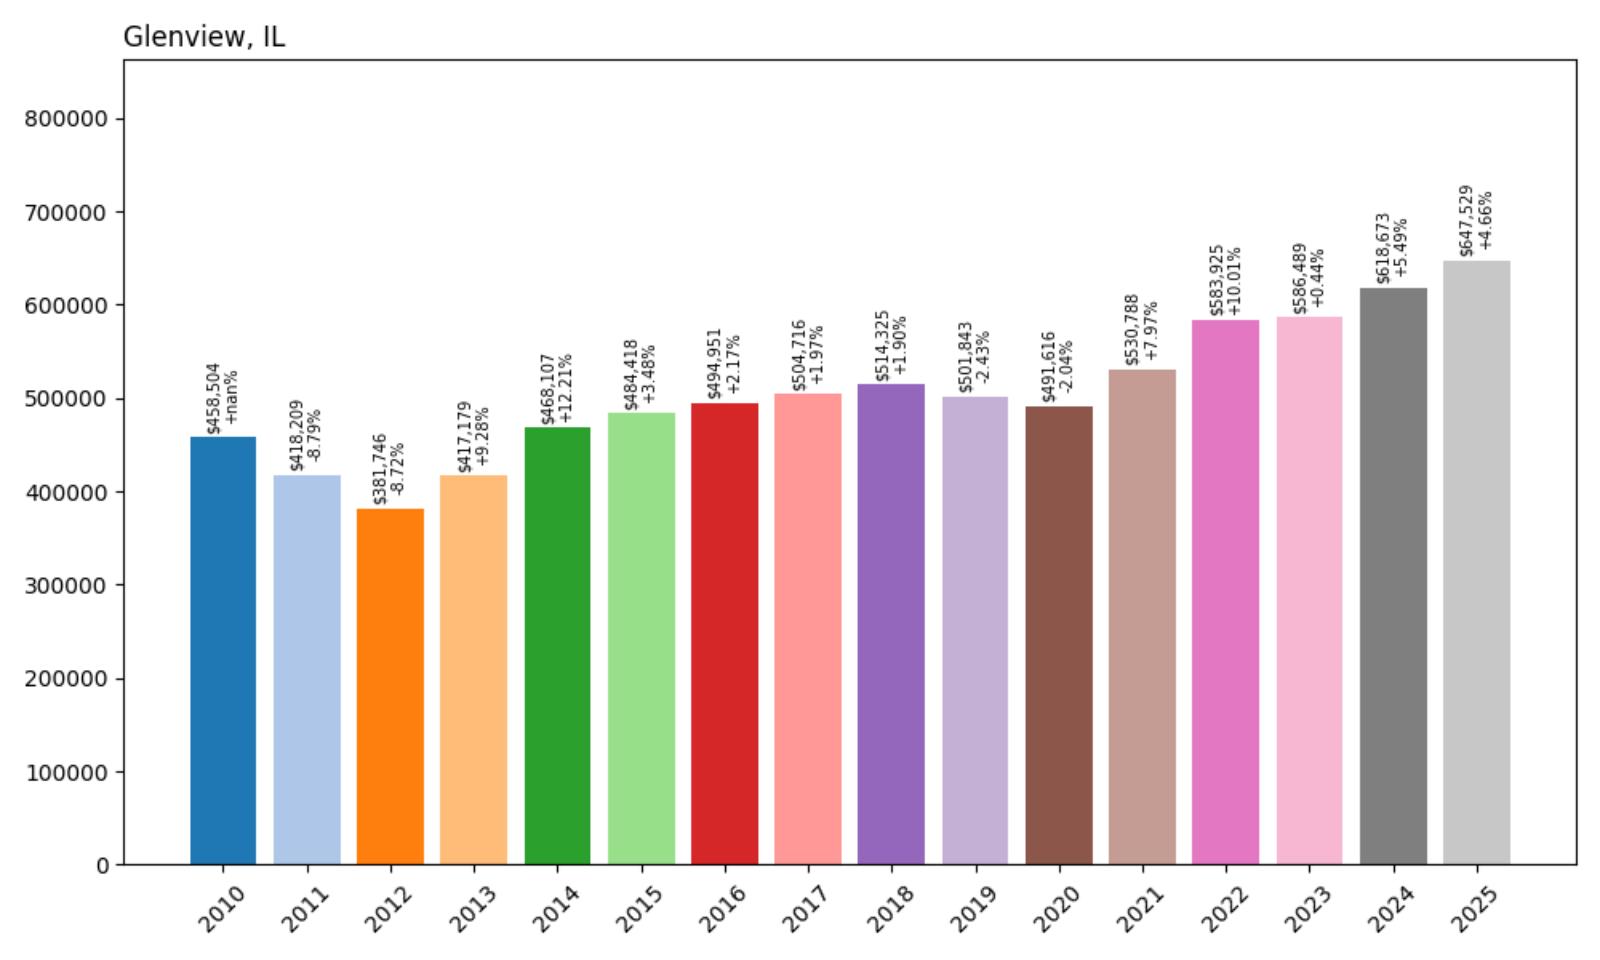
- 2010: $458,504
- 2011: $418,209 (−$40,295, −8.79% from previous year)
- 2012: $381,746 (−$36,463, −8.72% from previous year)
- 2013: $417,179 (+$35,433, +9.28% from previous year)
- 2014: $468,107 (+$50,927, +12.21% from previous year)
- 2015: $484,418 (+$16,312, +3.48% from previous year)
- 2016: $494,951 (+$10,532, +2.17% from previous year)
- 2017: $504,716 (+$9,765, +1.97% from previous year)
- 2018: $514,325 (+$9,609, +1.90% from previous year)
- 2019: $501,843 (−$12,482, −2.43% from previous year)
- 2020: $491,616 (−$10,227, −2.04% from previous year)
- 2021: $530,788 (+$39,171, +7.97% from previous year)
- 2022: $583,925 (+$53,137, +10.01% from previous year)
- 2023: $586,489 (+$2,564, +0.44% from previous year)
- 2024: $618,673 (+$32,184, +5.49% from previous year)
- 2025: $647,529 (+$28,856, +4.66% from previous year)
Glenview’s current median home value of $647,529 reflects a steady 41.2% appreciation since 2010, with the community showing remarkable resilience through various market cycles. After experiencing significant declines during 2011-2012, losing nearly 17% of value, Glenview staged a strong recovery with particularly impressive gains during 2013-2014. The recent performance shows continued strength, with consistent growth that demonstrates the community’s stable market fundamentals and enduring appeal to homebuyers.
Glenview – Strategic Location Meets Family Appeal
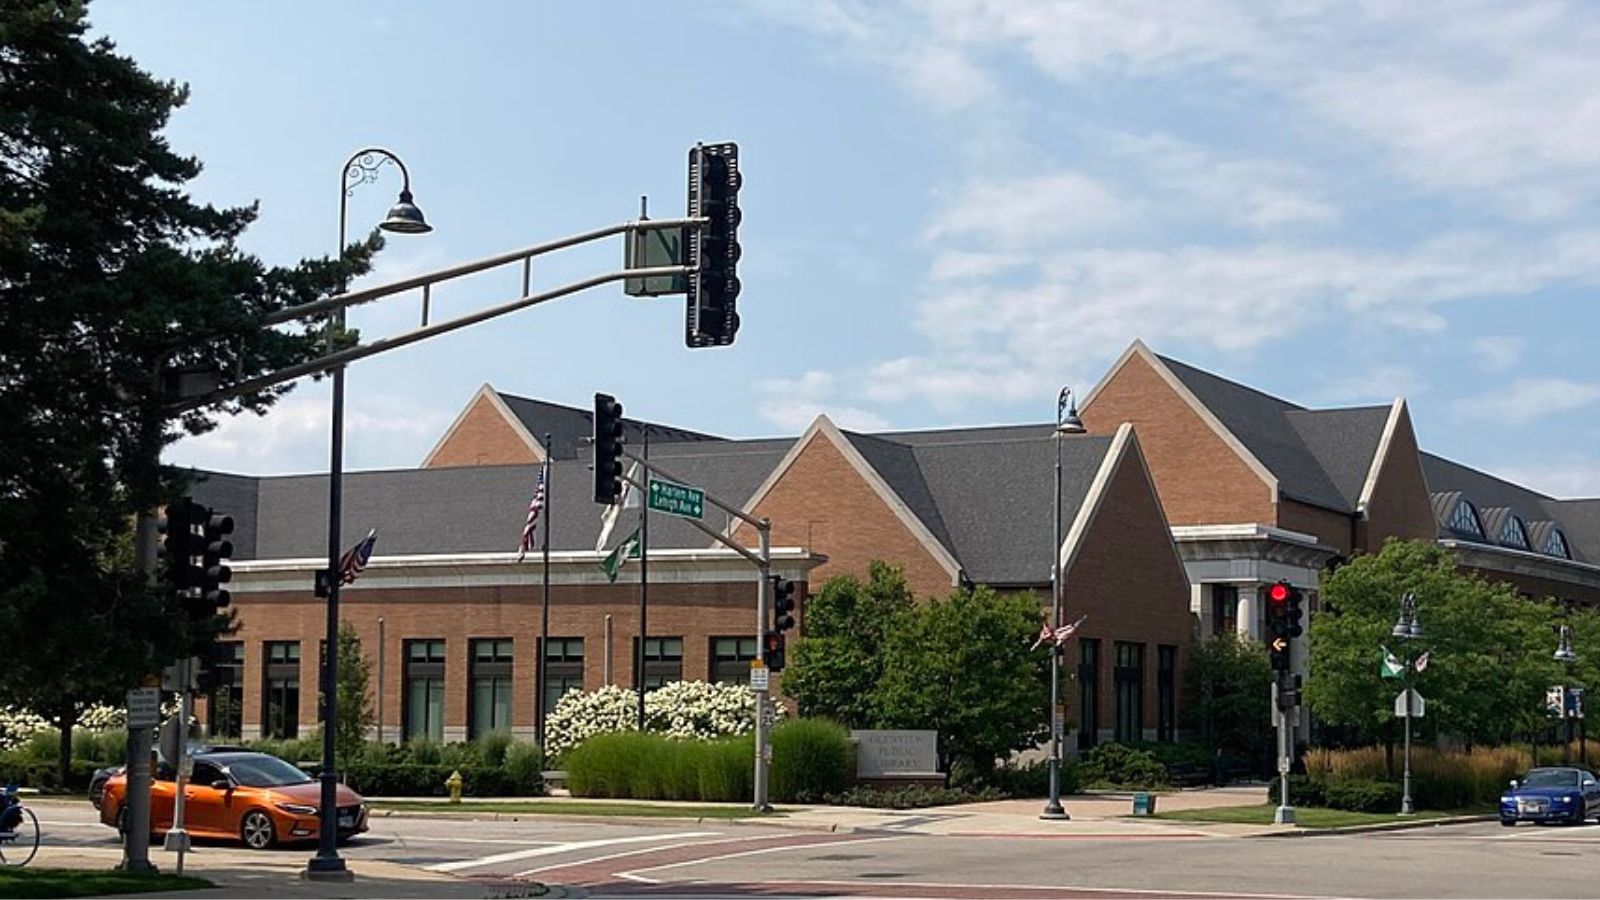
Positioned in northern Cook County with convenient access to both Chicago and the North Shore, Glenview offers residents an ideal combination of suburban tranquility and urban accessibility. The community benefits from exceptional transportation infrastructure, including multiple Metra lines and proximity to major highways, making it particularly attractive to commuters. Glenview’s location near O’Hare International Airport also appeals to business travelers and professionals who value convenient air travel access.
Market performance demonstrates Glenview’s position as a stable, family-oriented community that maintains its value through economic cycles. The consistent appreciation pattern, with only minor declines during challenging periods, reflects steady demand from buyers who value the community’s combination of excellent schools, convenient location, and quality amenities. Current median values around $648,000 position Glenview competitively within the North Shore market while offering relative accessibility compared to more exclusive lakefront communities.
29. Clarendon Hills – 47.0% Home Price Increase Since 2010
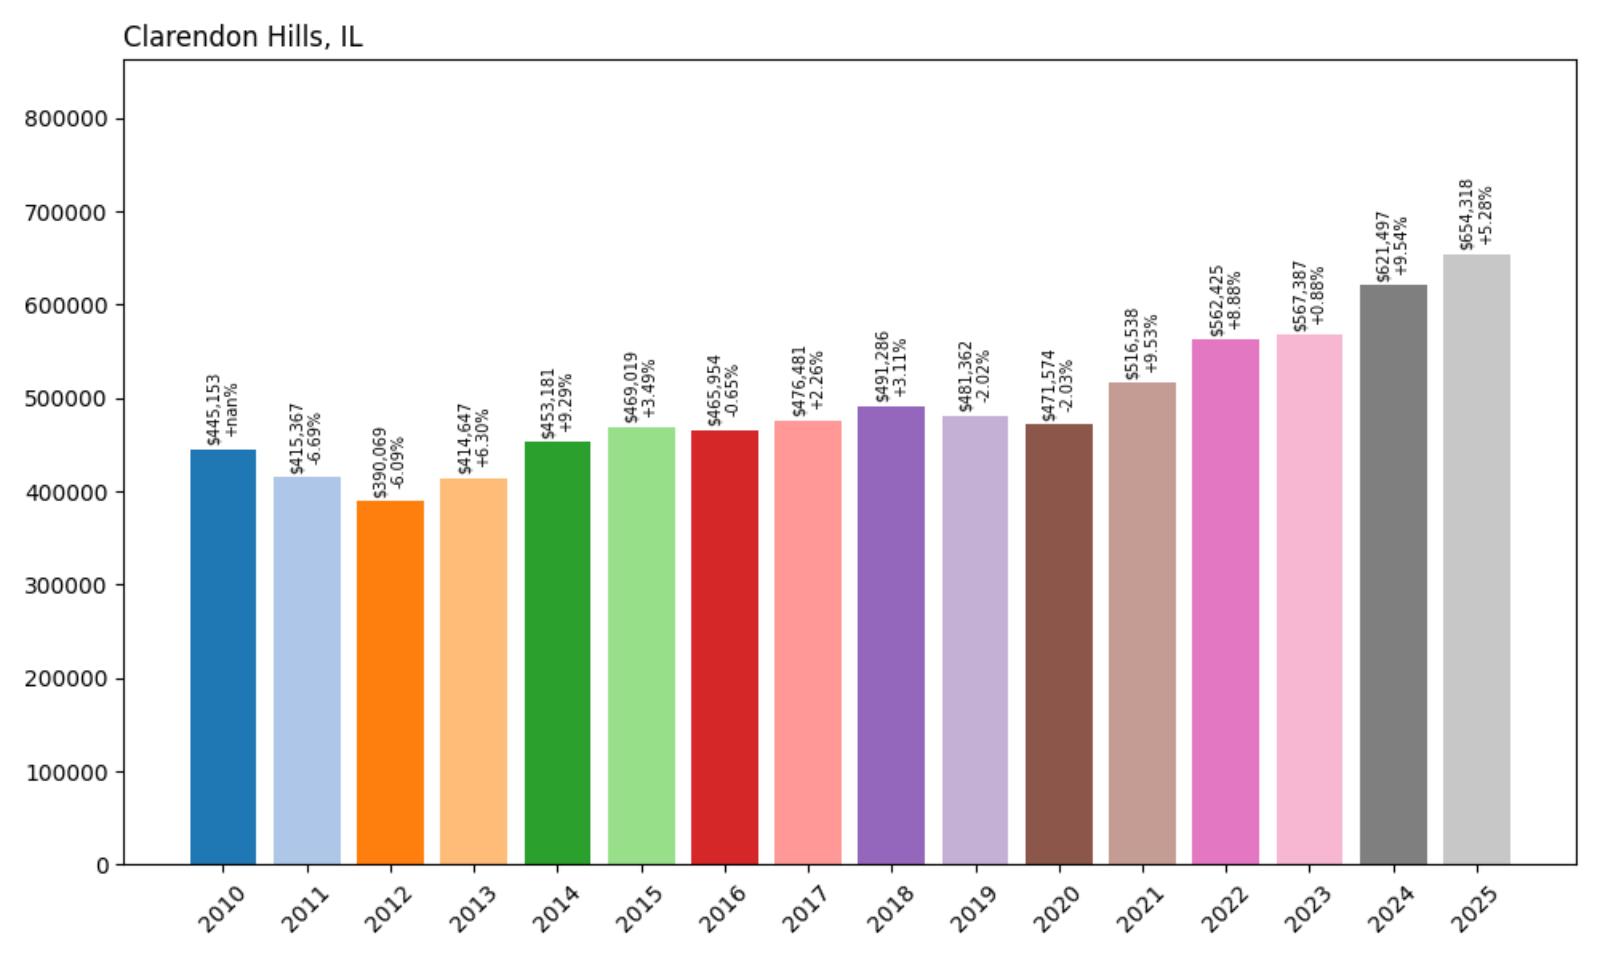
- 2010: $445,153
- 2011: $415,367 (−$29,786, −6.69% from previous year)
- 2012: $390,069 (−$25,298, −6.09% from previous year)
- 2013: $414,647 (+$24,577, +6.30% from previous year)
- 2014: $453,181 (+$38,535, +9.29% from previous year)
- 2015: $469,019 (+$15,838, +3.49% from previous year)
- 2016: $465,954 (−$3,065, −0.65% from previous year)
- 2017: $476,481 (+$10,526, +2.26% from previous year)
- 2018: $491,286 (+$14,805, +3.11% from previous year)
- 2019: $481,362 (−$9,924, −2.02% from previous year)
- 2020: $471,574 (−$9,787, −2.03% from previous year)
- 2021: $516,538 (+$44,964, +9.53% from previous year)
- 2022: $562,425 (+$45,887, +8.88% from previous year)
- 2023: $567,387 (+$4,962, +0.88% from previous year)
- 2024: $621,497 (+$54,110, +9.54% from previous year)
- 2025: $654,318 (+$32,821, +5.28% from previous year)
Clarendon Hills’ median home value of $654,318 represents a solid 47.0% increase since 2010, demonstrating consistent performance with notable strength in recent years. The community weathered the post-financial crisis period well, with relatively modest declines followed by steady recovery. The most impressive recent performance came in 2024 with a 9.54% jump, reflecting renewed buyer confidence and the community’s competitive position within the western suburbs market.
Clarendon Hills – Historic Charm In The Western Suburbs
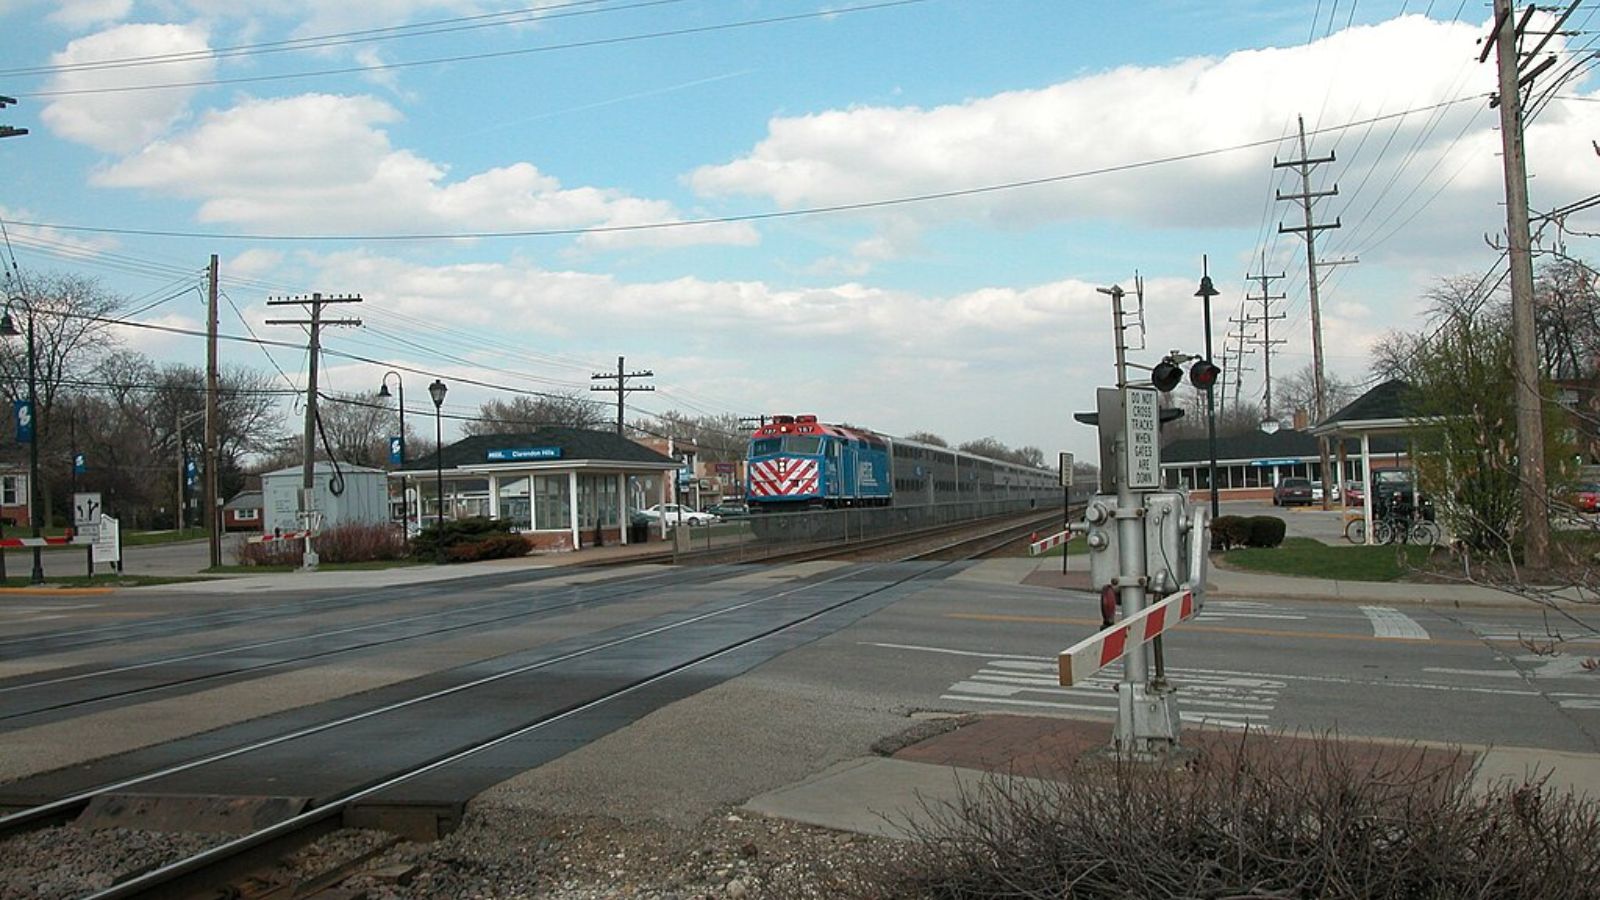
Located in DuPage County just 18 miles west of downtown Chicago, Clarendon Hills combines small-town charm with convenient urban access, making it a highly sought-after community for families and professionals. The village is known for its tree-lined streets, well-preserved historic architecture, and walkable downtown district that features unique shops, restaurants, and community events. This intimate scale and historic character create a distinctive identity that sets Clarendon Hills apart from larger suburban communities.
Market data shows Clarendon Hills’ appeal as a stable residential investment, with appreciation that reflects steady demand rather than speculative activity. The strong performance in 2024, with values jumping over $54,000 in a single year, suggests the community continues to attract buyers who value its combination of historic character, excellent schools, and convenient commuter access. Current median values around $654,000 represent the premium associated with DuPage County’s most desirable small communities.
28. Campton Hills – 59.8% Home Price Increase Since 2010
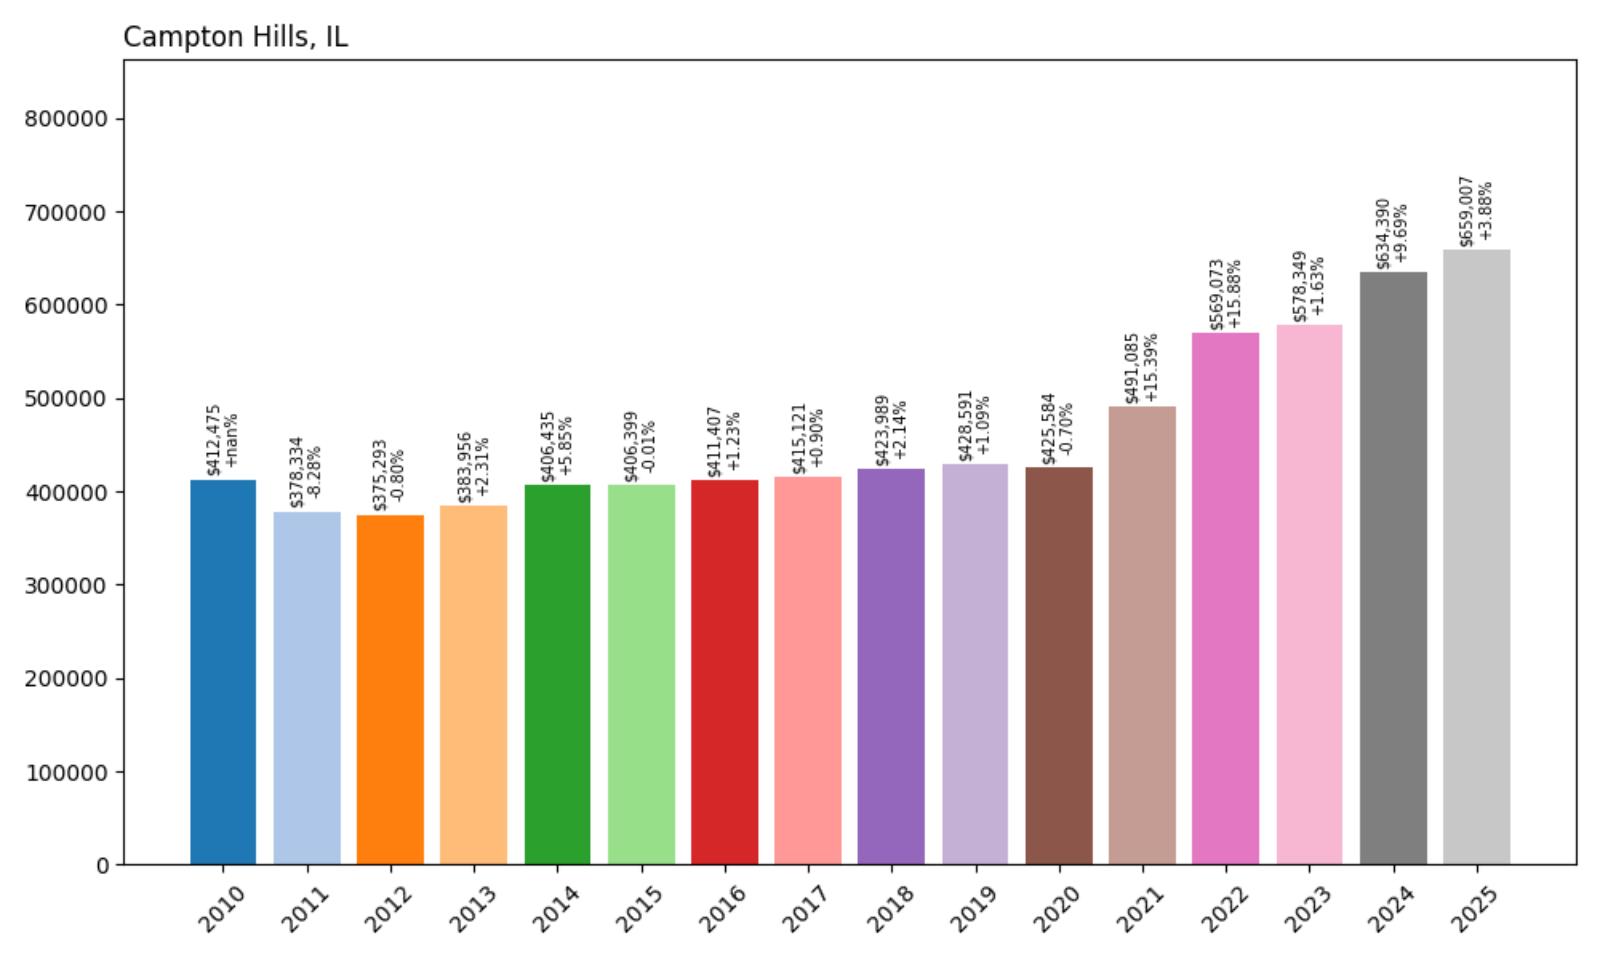
- 2010: $412,475
- 2011: $378,334 (−$34,141, −8.28% from previous year)
- 2012: $375,293 (−$3,041, −0.80% from previous year)
- 2013: $383,956 (+$8,663, +2.31% from previous year)
- 2014: $406,435 (+$22,479, +5.85% from previous year)
- 2015: $406,399 (−$36, −0.01% from previous year)
- 2016: $411,407 (+$5,008, +1.23% from previous year)
- 2017: $415,121 (+$3,715, +0.90% from previous year)
- 2018: $423,989 (+$8,867, +2.14% from previous year)
- 2019: $428,591 (+$4,602, +1.09% from previous year)
- 2020: $425,584 (−$3,007, −0.70% from previous year)
- 2021: $491,085 (+$65,500, +15.39% from previous year)
- 2022: $569,073 (+$77,988, +15.88% from previous year)
- 2023: $578,349 (+$9,276, +1.63% from previous year)
- 2024: $634,390 (+$56,040, +9.69% from previous year)
- 2025: $659,007 (+$24,618, +3.88% from previous year)
Campton Hills’ median home value of $659,007 reflects an impressive 59.8% appreciation since 2010, with particularly extraordinary performance during the pandemic period. The community showed minimal volatility through most of the 2010s before experiencing dramatic gains of over 31% during 2021-2022 alone. This surge, followed by continued strong growth in 2024, demonstrates Campton Hills’ emergence as one of the western suburbs’ most dynamic luxury markets.
Campton Hills – Rural Luxury Meets Modern Growth
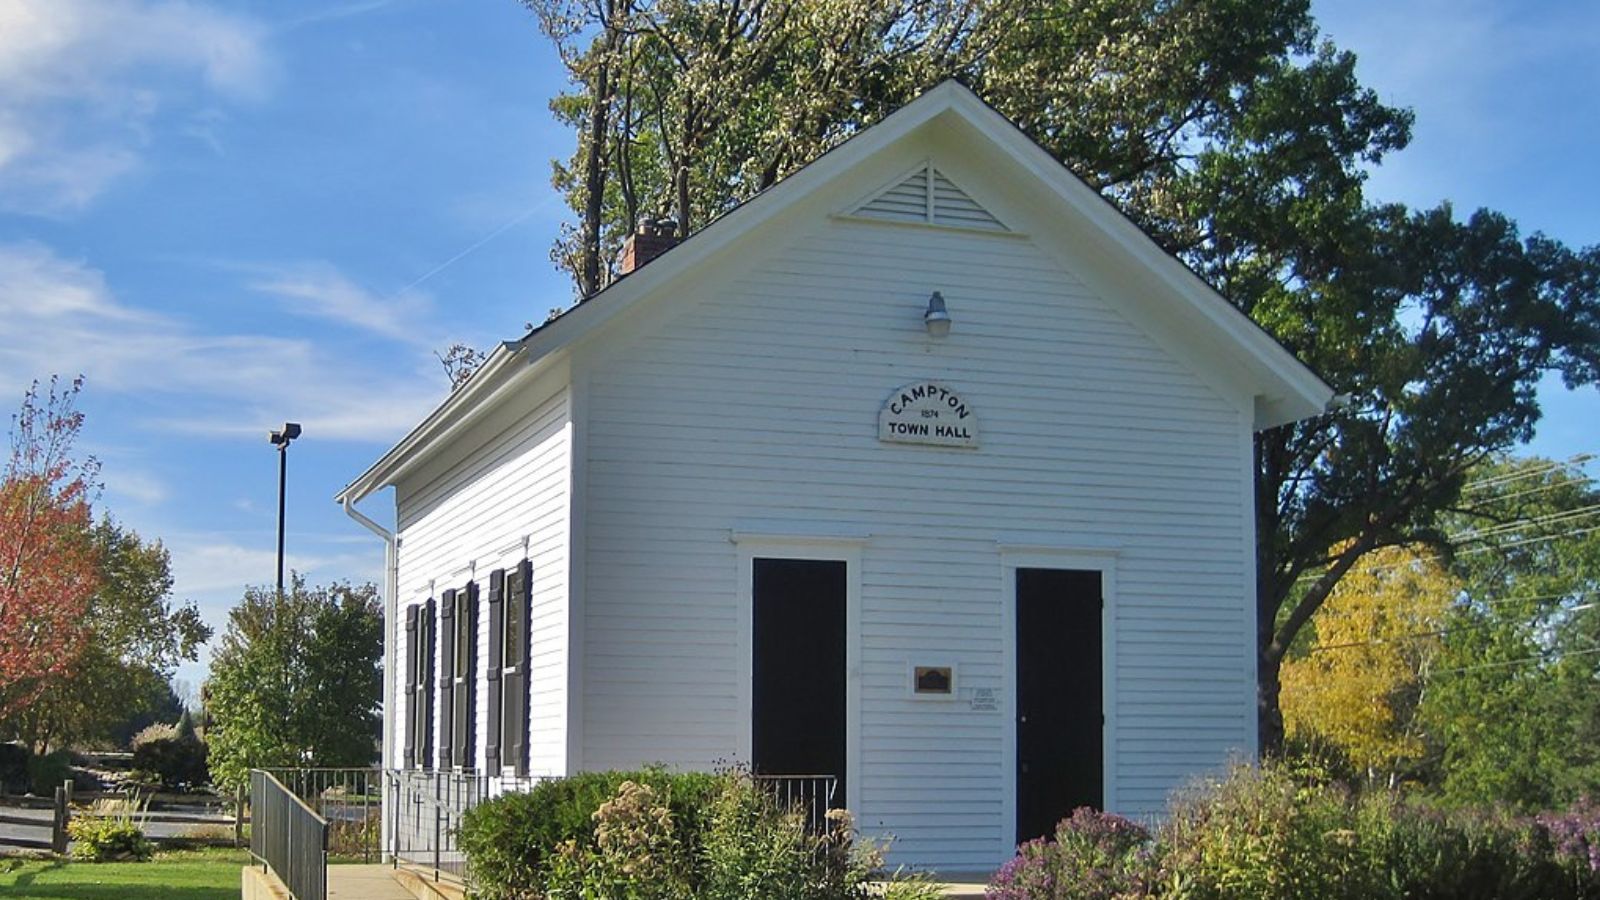
Situated in Kane County approximately 45 miles west of Chicago, Campton Hills offers residents a unique combination of rural character and modern amenities that has attracted significant attention from affluent buyers seeking space and privacy. The community is characterized by large residential lots, rolling terrain, and preserved natural areas that create an estate-like atmosphere while maintaining access to the western suburbs’ employment centers and recreational opportunities. This rural luxury positioning appeals to buyers looking to escape suburban density while remaining connected to urban conveniences.
Market performance shows Campton Hills’ evolution from a stable rural community to one of Illinois’s fastest-growing luxury markets. The exceptional gains during 2021-2022, when values increased by over $143,000 in just two years, reflect both pent-up demand for rural properties and the community’s growing reputation among affluent buyers. Current median values approaching $659,000 represent significant appreciation while still offering relative value compared to more established luxury markets closer to Chicago.
27. Northbrook – 44.3% Home Price Increase Since 2010

- 2010: $465,117
- 2011: $421,973 (−$43,144, −9.28% from previous year)
- 2012: $398,658 (−$23,315, −5.53% from previous year)
- 2013: $442,532 (+$43,874, +11.01% from previous year)
- 2014: $489,742 (+$47,210, +10.67% from previous year)
- 2015: $505,658 (+$15,917, +3.25% from previous year)
- 2016: $513,944 (+$8,286, +1.64% from previous year)
- 2017: $514,996 (+$1,052, +0.20% from previous year)
- 2018: $518,399 (+$3,403, +0.66% from previous year)
- 2019: $506,648 (−$11,751, −2.27% from previous year)
- 2020: $496,978 (−$9,670, −1.91% from previous year)
- 2021: $533,577 (+$36,599, +7.36% from previous year)
- 2022: $592,305 (+$58,728, +11.01% from previous year)
- 2023: $592,396 (+$91, +0.02% from previous year)
- 2024: $636,119 (+$43,723, +7.38% from previous year)
- 2025: $671,350 (+$35,232, +5.54% from previous year)
Northbrook’s current median home value of $671,350 represents a 44.3% increase since 2010, showing steady long-term appreciation despite some volatility during the 2010s. The community experienced significant early declines, losing over 14% of its value by 2012, before staging a strong recovery through 2015. After a period of modest growth and slight declines, Northbrook has shown renewed strength since 2021, with particularly impressive gains in 2022 and 2024 that demonstrate its competitive position in the North Shore market.
Northbrook – Educational Excellence Drives Market Strength
Located in northern Cook County with excellent access to both Chicago and the North Shore, Northbrook has built its reputation as one of Illinois’s premier family-oriented communities. The village is renowned for its exceptional educational system, including the highly-rated Northbrook Elementary School District 28 and access to prestigious Glenbrook North High School, which consistently ranks among the state’s top public high schools. This educational excellence, combined with extensive recreational facilities and well-maintained neighborhoods, creates a family-friendly environment that justifies premium housing costs.
Market data reflects Northbrook’s stability as a residential investment, with long-term appreciation driven by consistent demand from buyers who prioritize educational quality and community amenities. The recent strong performance, with values increasing over $135,000 since 2021, suggests renewed confidence in the community’s market fundamentals. Current median values around $671,000 position Northbrook competitively within the North Shore market while offering the educational and lifestyle advantages that define premium suburban living in Illinois.
26. River Forest – 48.7% Home Price Increase Since 2010
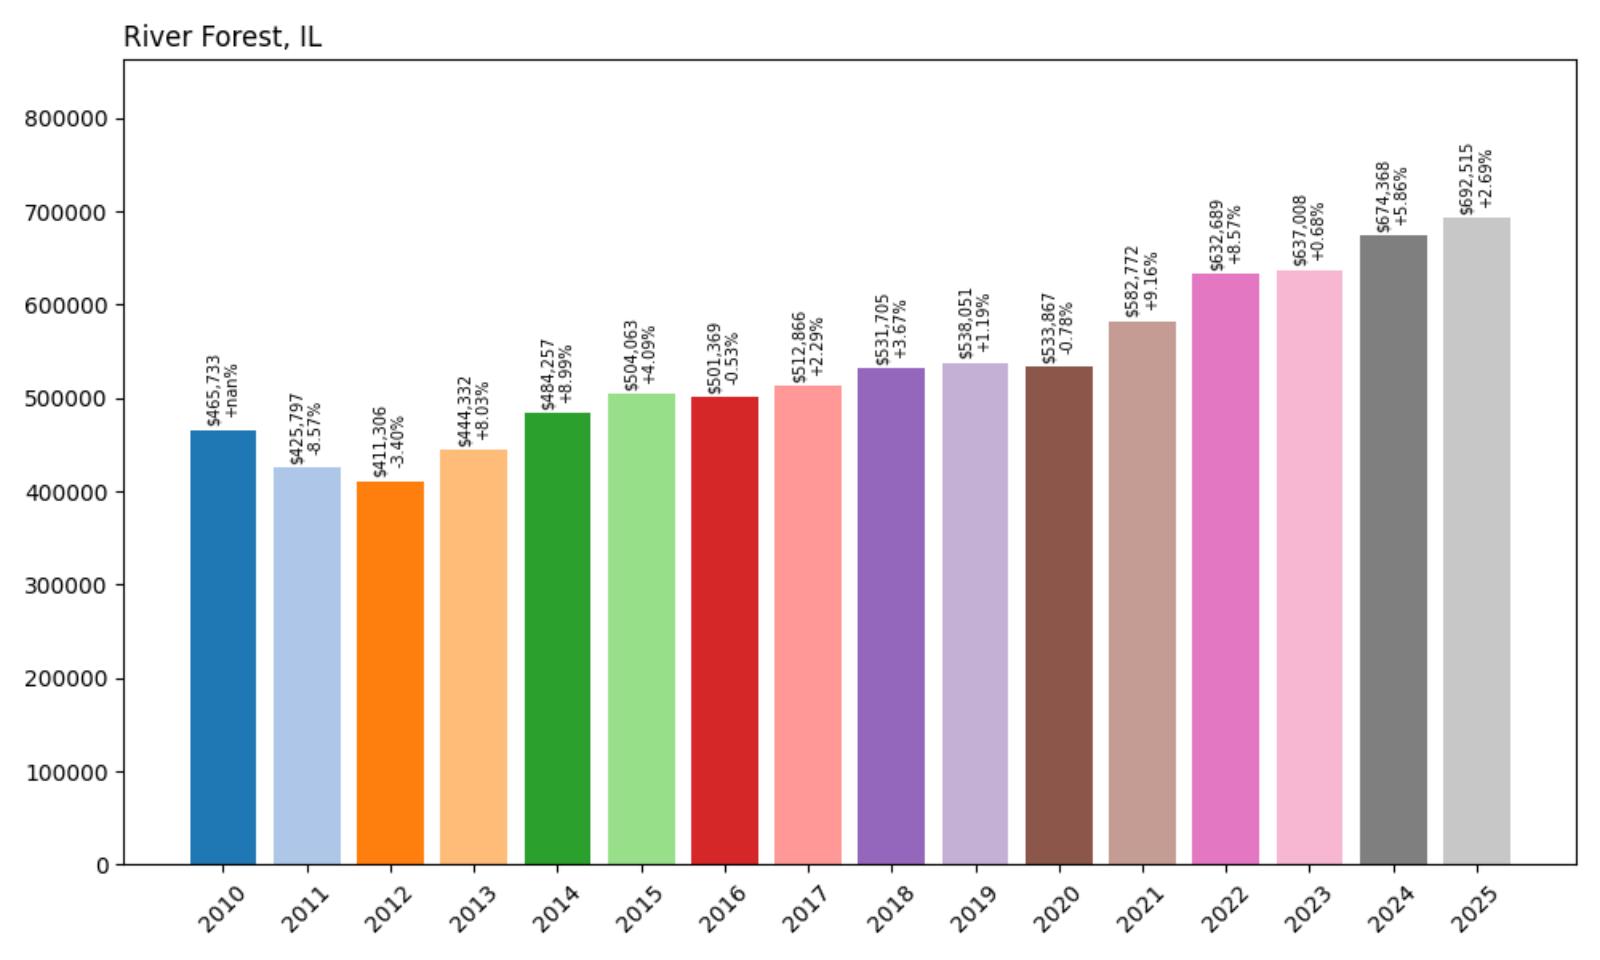
- 2010: $465,733
- 2011: $425,797 (−$39,936, −8.57% from previous year)
- 2012: $411,306 (−$14,491, −3.40% from previous year)
- 2013: $444,332 (+$33,027, +8.03% from previous year)
- 2014: $484,257 (+$39,925, +8.99% from previous year)
- 2015: $504,063 (+$19,806, +4.09% from previous year)
- 2016: $501,369 (−$2,694, −0.53% from previous year)
- 2017: $512,866 (+$11,497, +2.29% from previous year)
- 2018: $531,705 (+$18,839, +3.67% from previous year)
- 2019: $538,051 (+$6,346, +1.19% from previous year)
- 2020: $533,867 (−$4,184, −0.78% from previous year)
- 2021: $582,772 (+$48,905, +9.16% from previous year)
- 2022: $632,689 (+$49,917, +8.57% from previous year)
- 2023: $637,008 (+$4,319, +0.68% from previous year)
- 2024: $674,368 (+$37,360, +5.86% from previous year)
- 2025: $692,515 (+$18,147, +2.69% from previous year)
River Forest’s median home value of $692,515 represents a solid 48.7% increase since 2010, demonstrating consistent long-term appreciation with particularly strong performance during the recent market cycle. The community showed remarkable resilience during the pandemic, with minimal decline in 2020 followed by consecutive strong gains in 2021-2022. The steady growth pattern reflects River Forest’s established position as one of Chicago’s most desirable western suburbs, with values that have appreciated consistently across multiple market cycles.
River Forest – Historic Elegance Meets Modern Appeal
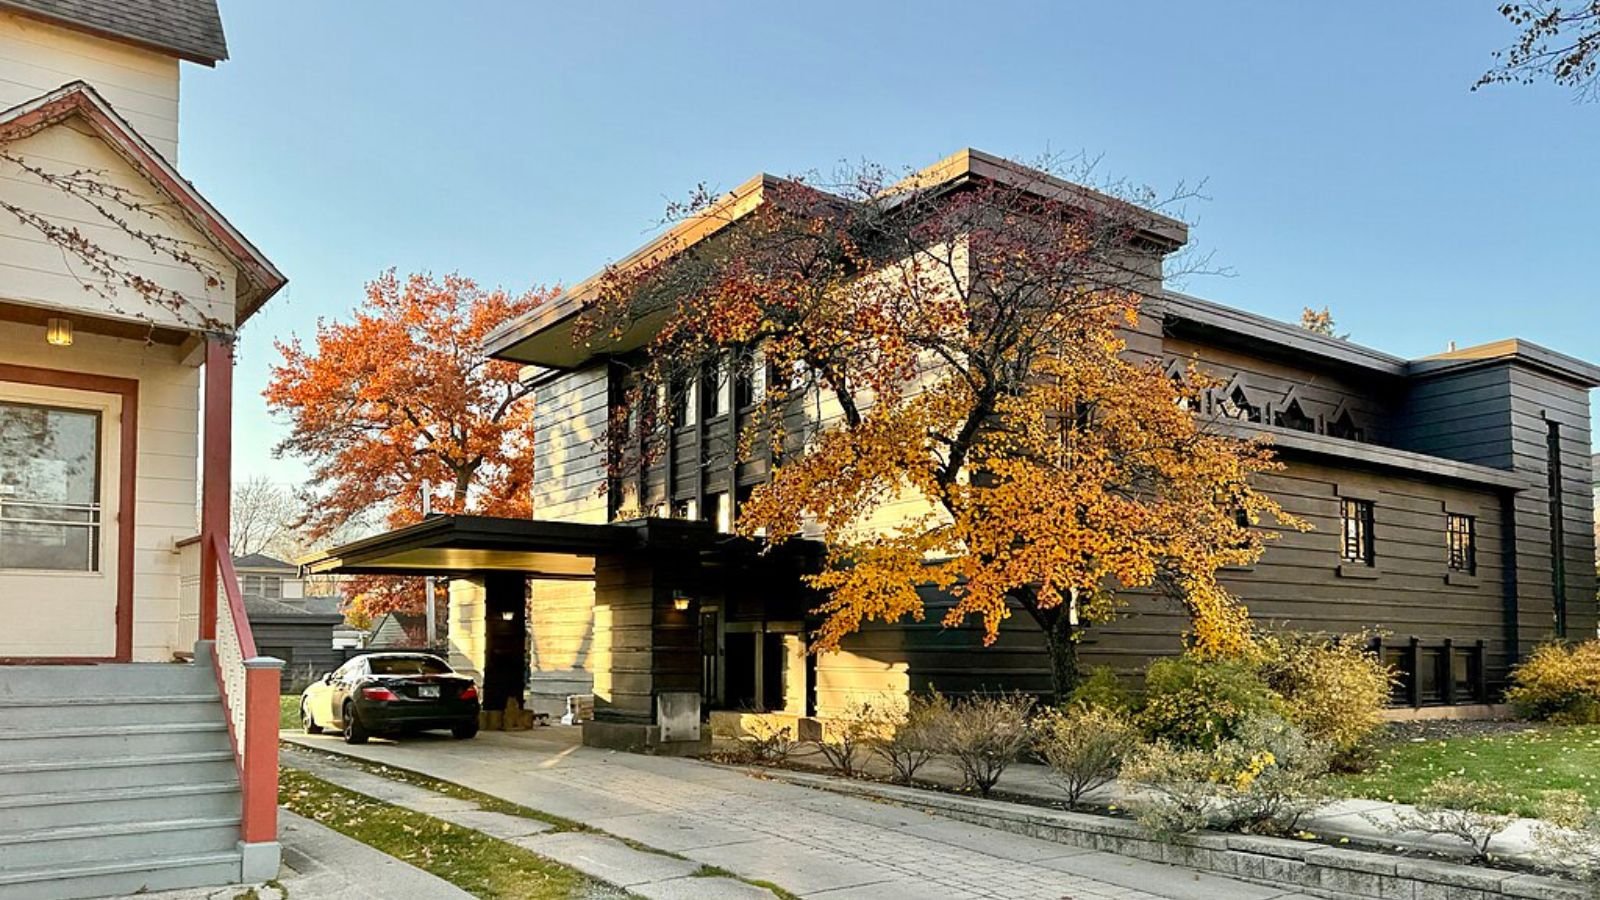
Situated in Cook County just 10 miles west of downtown Chicago, River Forest combines historic architectural significance with modern suburban convenience, creating one of Illinois’s most prestigious residential communities. The village is renowned for its collection of Frank Lloyd Wright homes and other Prairie School architecture, giving it a distinctive character that attracts buyers who appreciate both historical significance and architectural excellence. This unique heritage, combined with tree-lined streets and well-preserved neighborhoods, creates an atmosphere of refined elegance that sets River Forest apart from other western suburbs.
Market performance demonstrates River Forest’s appeal as a stable, high-quality residential investment that maintains its value through various economic conditions. The consistent appreciation pattern, with only minor fluctuations during challenging periods, reflects steady demand from buyers who value the community’s combination of historic character, architectural significance, and urban accessibility. Current median values approaching $693,000 represent the premium associated with one of Chicago’s most distinguished suburban communities.
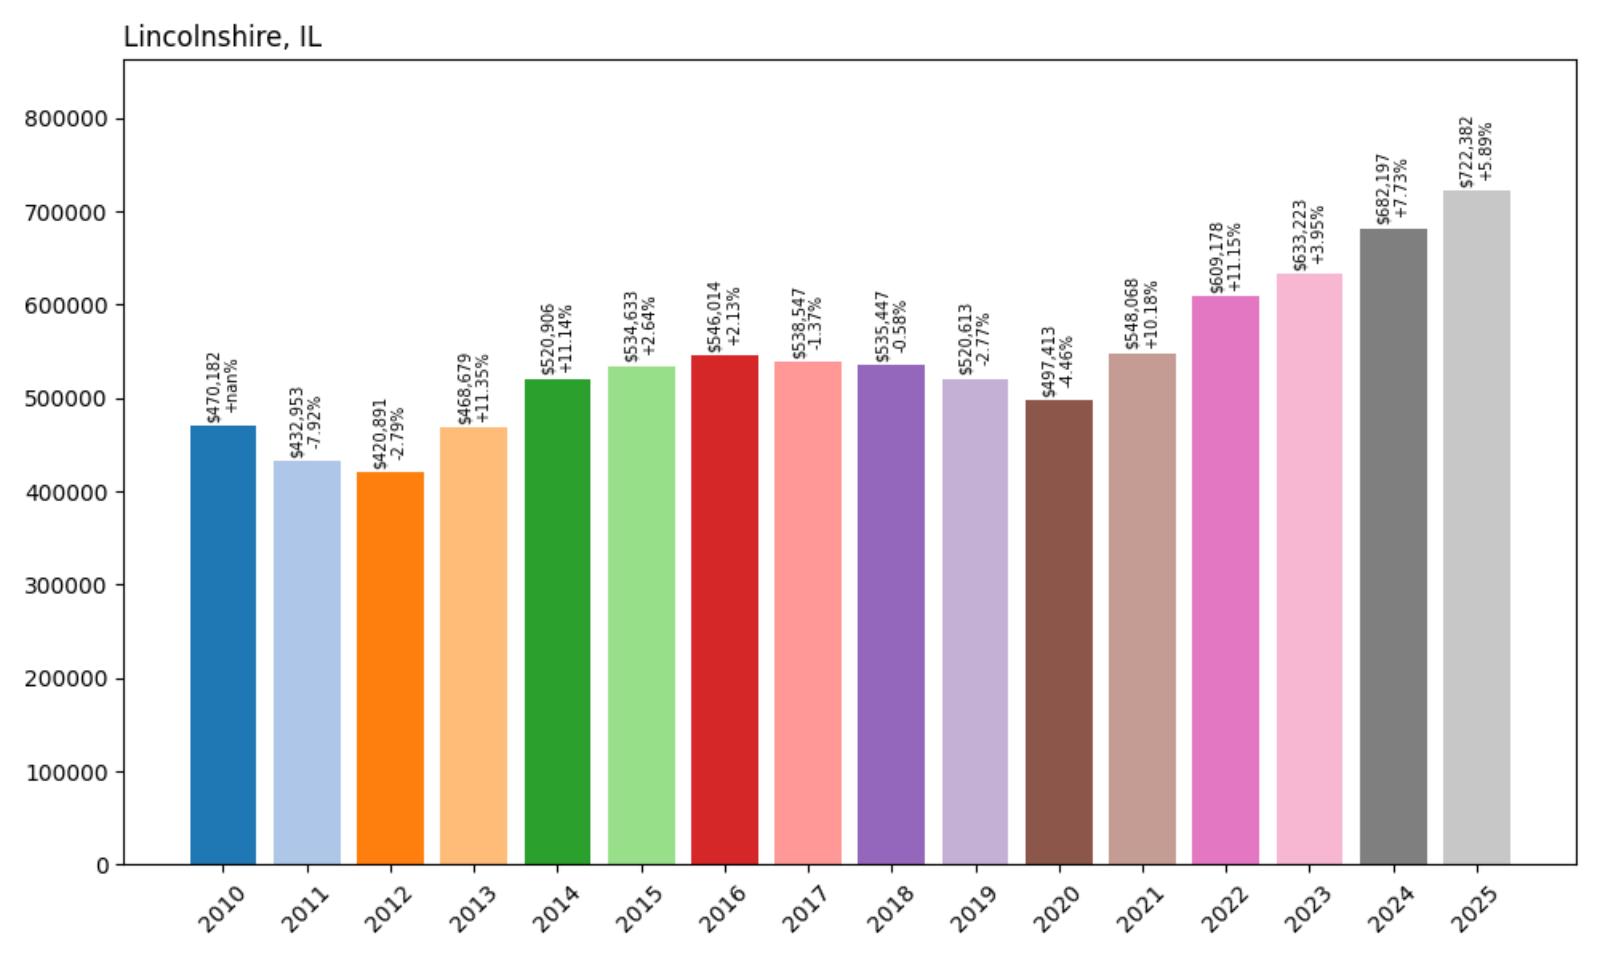
25. Lincolnshire – 53.6% Home Price Increase Since 2010
🔥 Would you like to save this?
- 2010: $470,182
- 2011: $432,953 (−$37,229, −7.92% from previous year)
- 2012: $420,891 (−$12,062, −2.79% from previous year)
- 2013: $468,679 (+$47,788, +11.35% from previous year)
- 2014: $520,906 (+$52,227, +11.14% from previous year)
- 2015: $534,633 (+$13,727, +2.64% from previous year)
- 2016: $546,014 (+$11,381, +2.13% from previous year)
- 2017: $538,547 (−$7,467, −1.37% from previous year)
- 2018: $535,447 (−$3,101, −0.58% from previous year)
- 2019: $520,613 (−$14,834, −2.77% from previous year)
- 2020: $497,413 (−$23,200, −4.46% from previous year)
- 2021: $548,068 (+$50,655, +10.18% from previous year)
- 2022: $609,178 (+$61,110, +11.15% from previous year)
- 2023: $633,223 (+$24,045, +3.95% from previous year)
- 2024: $682,197 (+$48,974, +7.73% from previous year)
- 2025: $722,382 (+$40,186, +5.89% from previous year)
Lincolnshire’s current median home value of $722,382 reflects a robust 53.6% appreciation since 2010, with particularly impressive performance following the challenging 2017-2020 period when values declined over 9%. The community’s recovery has been exceptional, with values increasing over $225,000 since 2020, representing one of the strongest rebounds among Illinois’s expensive communities. This dramatic turnaround demonstrates Lincolnshire’s underlying market strength and renewed buyer confidence in the community’s long-term prospects.
Lincolnshire – Corporate Center Meets Residential Excellence
Located in northern Lake County, Lincolnshire uniquely combines a significant corporate presence with high-quality residential living, creating a dynamic community that appeals to both business executives and families. The village serves as headquarters for major corporations including Hewitt Associates and CDW Corporation, providing a strong employment base and substantial commercial tax revenue that helps keep residential property taxes competitive. This corporate concentration, combined with proximity to other major employers throughout the North Shore corridor, makes Lincolnshire particularly attractive to business professionals.
Market data shows Lincolnshire’s resilience and growth potential, with the recent recovery period demonstrating the community’s ability to attract buyers despite previous volatility. The strong performance since 2020, with consecutive years of significant gains, reflects renewed recognition of Lincolnshire’s value proposition combining corporate convenience, residential quality, and recreational amenities. Current median values over $722,000 position Lincolnshire among Illinois’s premier residential markets while offering the employment proximity that many affluent buyers prioritize.
24. Hawthorn Woods – 48.5% Home Price Increase Since 2010
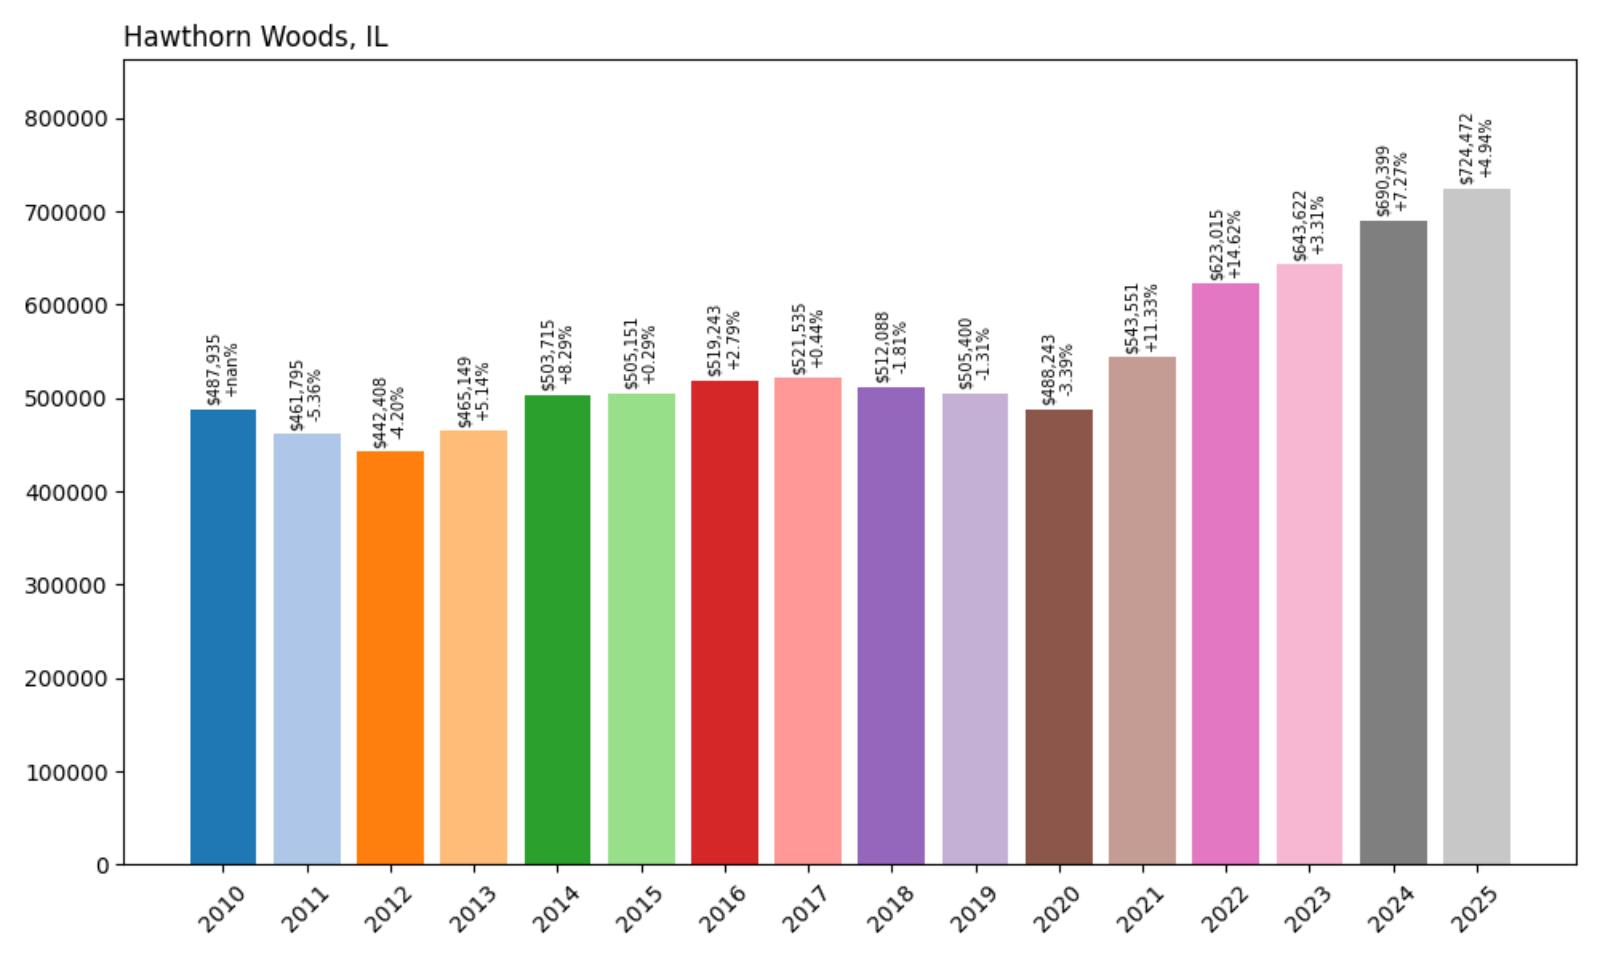
- 2010: $487,935
- 2011: $461,795 (−$26,140, −5.36% from previous year)
- 2012: $442,408 (−$19,388, −4.20% from previous year)
- 2013: $465,149 (+$22,741, +5.14% from previous year)
- 2014: $503,715 (+$38,566, +8.29% from previous year)
- 2015: $505,151 (+$1,436, +0.29% from previous year)
- 2016: $519,243 (+$14,092, +2.79% from previous year)
- 2017: $521,535 (+$2,291, +0.44% from previous year)
- 2018: $512,088 (−$9,447, −1.81% from previous year)
- 2019: $505,400 (−$6,688, −1.31% from previous year)
- 2020: $488,243 (−$17,157, −3.39% from previous year)
- 2021: $543,551 (+$55,308, +11.33% from previous year)
- 2022: $623,015 (+$79,464, +14.62% from previous year)
- 2023: $643,622 (+$20,607, +3.31% from previous year)
- 2024: $690,399 (+$46,777, +7.27% from previous year)
- 2025: $724,472 (+$34,073, +4.94% from previous year)
Hawthorn Woods’ median home value of $724,472 represents a strong 48.5% increase since 2010, with particularly dramatic gains during the recent market cycle. After experiencing declines from 2018-2020 that reduced values by over 6%, the community staged one of Illinois’s most impressive recoveries with a remarkable 14.62% surge in 2022. This exceptional performance, followed by continued strong growth, demonstrates Hawthorn Woods’ emergence as a premier destination in the northwest suburbs’ luxury market.
Hawthorn Woods – Nature Preserve Living
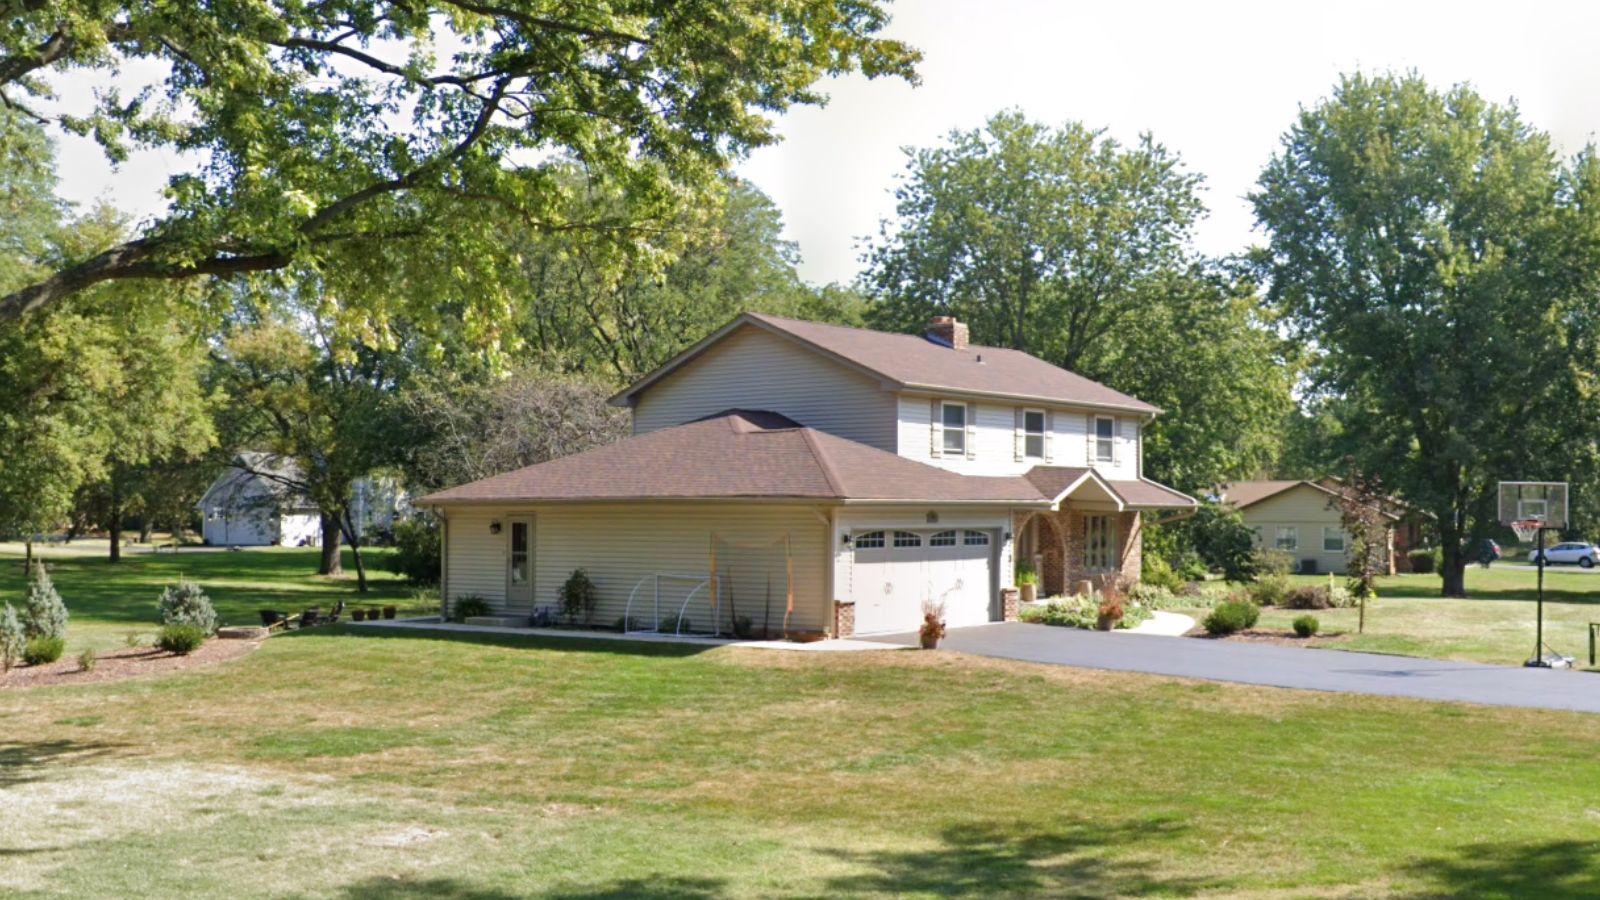
Nestled in southern Lake County, Hawthorn Woods offers residents a unique lifestyle that combines suburban convenience with extensive natural preservation, creating one of Illinois’s most environmentally conscious luxury communities. The village is distinguished by its commitment to maintaining large green spaces, nature preserves, and tree-lined streets that create a park-like atmosphere throughout the community. This environmental focus, combined with large residential lots and custom homes, appeals to affluent buyers seeking both luxury and natural beauty in their residential setting.
Market performance reflects Hawthorn Woods’ growing reputation as a premier residential destination, with the exceptional gains during 2021-2022 representing over $134,000 in value increases in just two years. This dramatic appreciation demonstrates the community’s appeal to buyers seeking luxury homes in a natural setting, while the continued growth in 2024-2025 suggests sustained market confidence. Current median values over $724,000 position Hawthorn Woods among the northwest suburbs’ most exclusive communities while offering the environmental amenities that increasingly drive luxury home purchases.
23. Deer Park – 45.4% Home Price Increase Since 2010

- 2010: $508,179
- 2011: $469,171 (−$39,008, −7.68% from previous year)
- 2012: $458,366 (−$10,806, −2.30% from previous year)
- 2013: $489,110 (+$30,745, +6.71% from previous year)
- 2014: $530,939 (+$41,828, +8.55% from previous year)
- 2015: $525,599 (−$5,340, −1.01% from previous year)
- 2016: $531,365 (+$5,766, +1.10% from previous year)
- 2017: $536,658 (+$5,293, +1.00% from previous year)
- 2018: $527,890 (−$8,769, −1.63% from previous year)
- 2019: $526,075 (−$1,815, −0.34% from previous year)
- 2020: $508,139 (−$17,936, −3.41% from previous year)
- 2021: $575,099 (+$66,960, +13.18% from previous year)
- 2022: $646,761 (+$71,662, +12.46% from previous year)
- 2023: $668,167 (+$21,406, +3.31% from previous year)
- 2024: $709,222 (+$41,055, +6.14% from previous year)
- 2025: $739,036 (+$29,814, +4.20% from previous year)
Deer Park’s current median home value of $739,036 represents a solid 45.4% increase since 2010, with exceptional performance during the recent market cycle following a challenging period from 2015-2020. The community experienced extended stagnation and declines that brought values back to 2010 levels before staging a dramatic recovery with consecutive double-digit gains in 2021-2022. This rebound, totaling over $138,000 in just two years, demonstrates Deer Park’s underlying market strength and renewed buyer appeal.
Deer Park – Exclusive Northwest Enclave
Located in northwestern Lake County, Deer Park offers residents an exclusive suburban lifestyle characterized by large lots, custom homes, and preserved natural areas that create a secluded, upscale atmosphere. The community is known for its low population density and commitment to maintaining its rural character while providing modern amenities and convenient access to both Chicago and the northern suburbs. This combination of exclusivity and accessibility appeals to affluent buyers seeking privacy and space without sacrificing urban conveniences.
Market data shows Deer Park’s evolution from a period of adjustment to renewed growth, with the exceptional recovery beginning in 2021 reflecting changing buyer preferences toward spacious, private residential settings. The strong continued performance through 2025, with values now approaching $740,000, suggests sustained market confidence in the community’s long-term prospects. Current pricing positions Deer Park among Lake County’s most exclusive residential markets while offering the space and privacy that define luxury suburban living.
22. Wayne – 46.9% Home Price Increase Since 2010
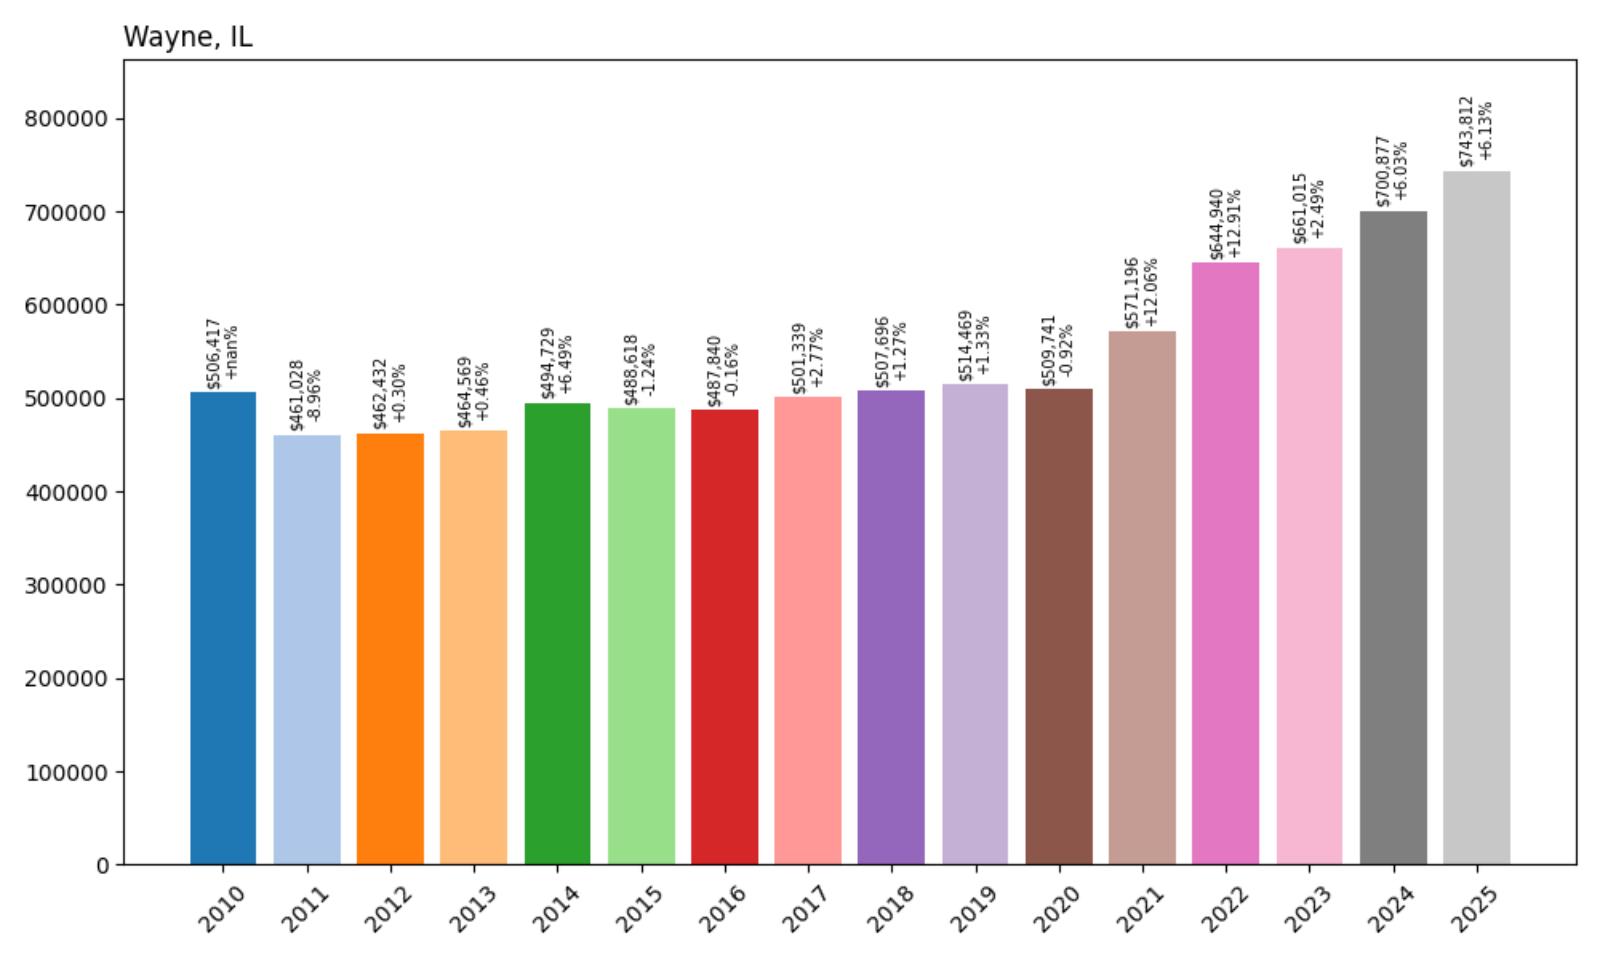
- 2010: $506,417
- 2011: $461,028 (−$45,389, −8.96% from previous year)
- 2012: $462,432 (+$1,404, +0.30% from previous year)
- 2013: $464,569 (+$2,137, +0.46% from previous year)
- 2014: $494,729 (+$30,159, +6.49% from previous year)
- 2015: $488,618 (−$6,110, −1.24% from previous year)
- 2016: $487,840 (−$778, −0.16% from previous year)
- 2017: $501,339 (+$13,499, +2.77% from previous year)
- 2018: $507,696 (+$6,357, +1.27% from previous year)
- 2019: $514,469 (+$6,773, +1.33% from previous year)
- 2020: $509,741 (−$4,728, −0.92% from previous year)
- 2021: $571,196 (+$61,455, +12.06% from previous year)
- 2022: $644,940 (+$73,744, +12.91% from previous year)
- 2023: $661,015 (+$16,075, +2.49% from previous year)
- 2024: $700,877 (+$39,862, +6.03% from previous year)
- 2025: $743,812 (+$42,935, +6.13% from previous year)
Wayne’s median home value of $743,812 reflects a 46.9% increase since 2010, showing remarkable consistency through the 2010s followed by exceptional growth during the recent market cycle. The community demonstrated unusual stability from 2012-2020, with values fluctuating within a narrow range before experiencing dramatic gains of nearly 25% during 2021-2022. This recent surge, followed by continued strong appreciation, positions Wayne among the fastest-growing luxury markets in the western suburbs.
Wayne – Rural Estates Meet Modern Luxury
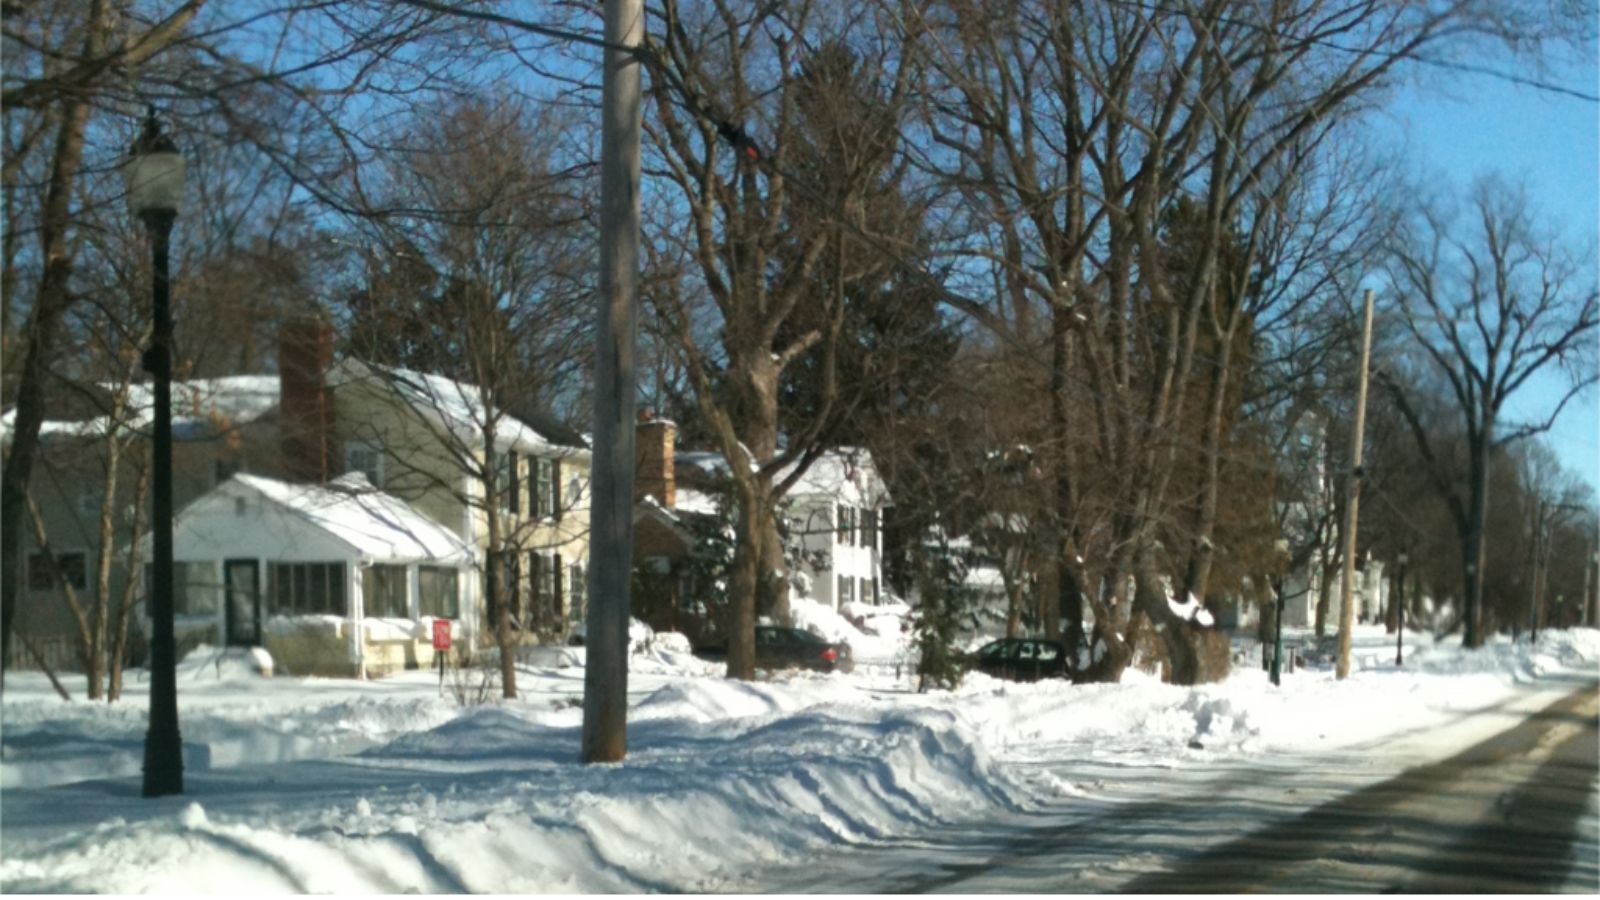
Situated in DuPage County approximately 35 miles west of Chicago, Wayne offers residents a unique rural estate lifestyle that combines country living with proximity to major employment centers and urban amenities. The community is characterized by large residential properties, many featuring equestrian facilities, private lakes, and extensive grounds that create a countryside atmosphere while maintaining convenient access to the western suburbs’ corporate corridor. This rural luxury positioning appeals to executives and affluent professionals who seek space, privacy, and recreational opportunities.
Market performance demonstrates Wayne’s emergence as a premier destination for luxury estate living, with the exceptional gains during 2021-2022 reflecting increased demand for spacious, private properties following changing lifestyle preferences. The continued strong appreciation through 2025, with values increasing over $40,000 annually, suggests sustained buyer interest in Wayne’s unique combination of rural character and suburban convenience. Current median values approaching $744,000 represent significant appreciation potential while delivering the estate lifestyle that defines luxury living in Illinois’s western suburbs.
21. Highland Park – 60.8% Home Price Increase Since 2010
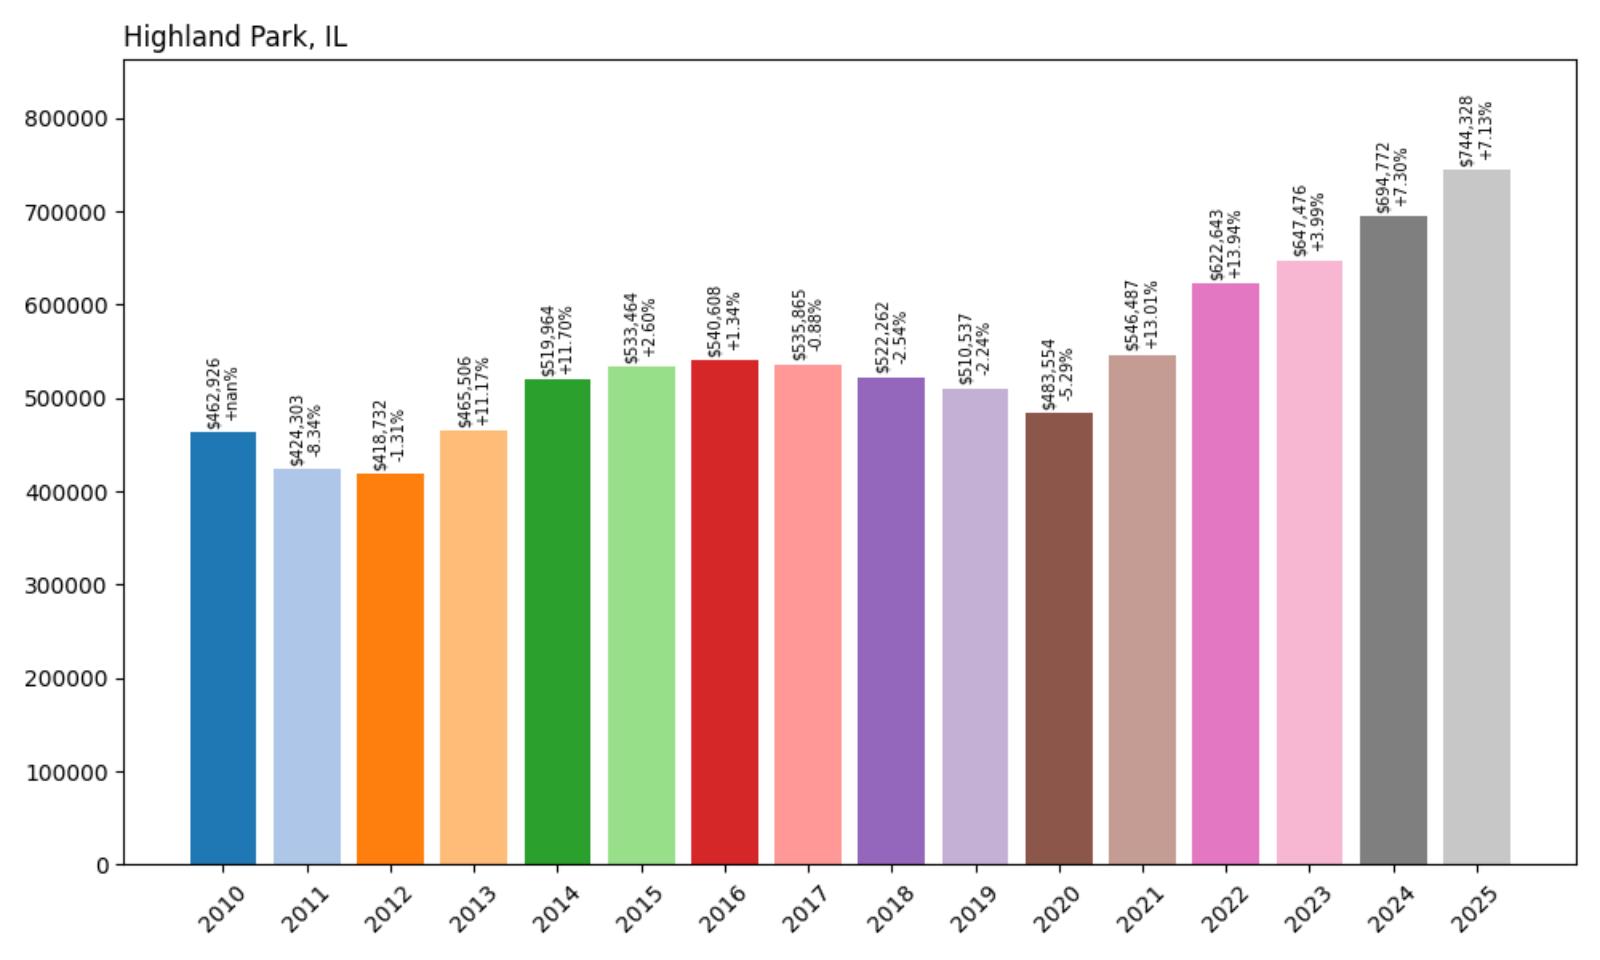
- 2010: $462,926
- 2011: $424,303 (−$38,623, −8.34% from previous year)
- 2012: $418,732 (−$5,571, −1.31% from previous year)
- 2013: $465,506 (+$46,774, +11.17% from previous year)
- 2014: $519,964 (+$54,458, +11.70% from previous year)
- 2015: $533,464 (+$13,500, +2.60% from previous year)
- 2016: $540,608 (+$7,144, +1.34% from previous year)
- 2017: $535,865 (−$4,742, −0.88% from previous year)
- 2018: $522,262 (−$13,604, −2.54% from previous year)
- 2019: $510,537 (−$11,724, −2.24% from previous year)
- 2020: $483,554 (−$26,983, −5.29% from previous year)
- 2021: $546,487 (+$62,933, +13.01% from previous year)
- 2022: $622,643 (+$76,156, +13.94% from previous year)
- 2023: $647,476 (+$24,833, +3.99% from previous year)
- 2024: $694,772 (+$47,296, +7.30% from previous year)
- 2025: $744,328 (+$49,555, +7.13% from previous year)
Highland Park’s median home value of $744,328 represents an impressive 60.8% increase since 2010, with particularly strong performance following a challenging period from 2017-2020 when values declined over 10%. The community’s recovery has been exceptional, with values increasing over $260,000 since 2020, representing one of the most dramatic rebounds among North Shore communities. This surge demonstrates Highland Park’s enduring appeal and market resilience in one of Illinois’s most prestigious residential areas.
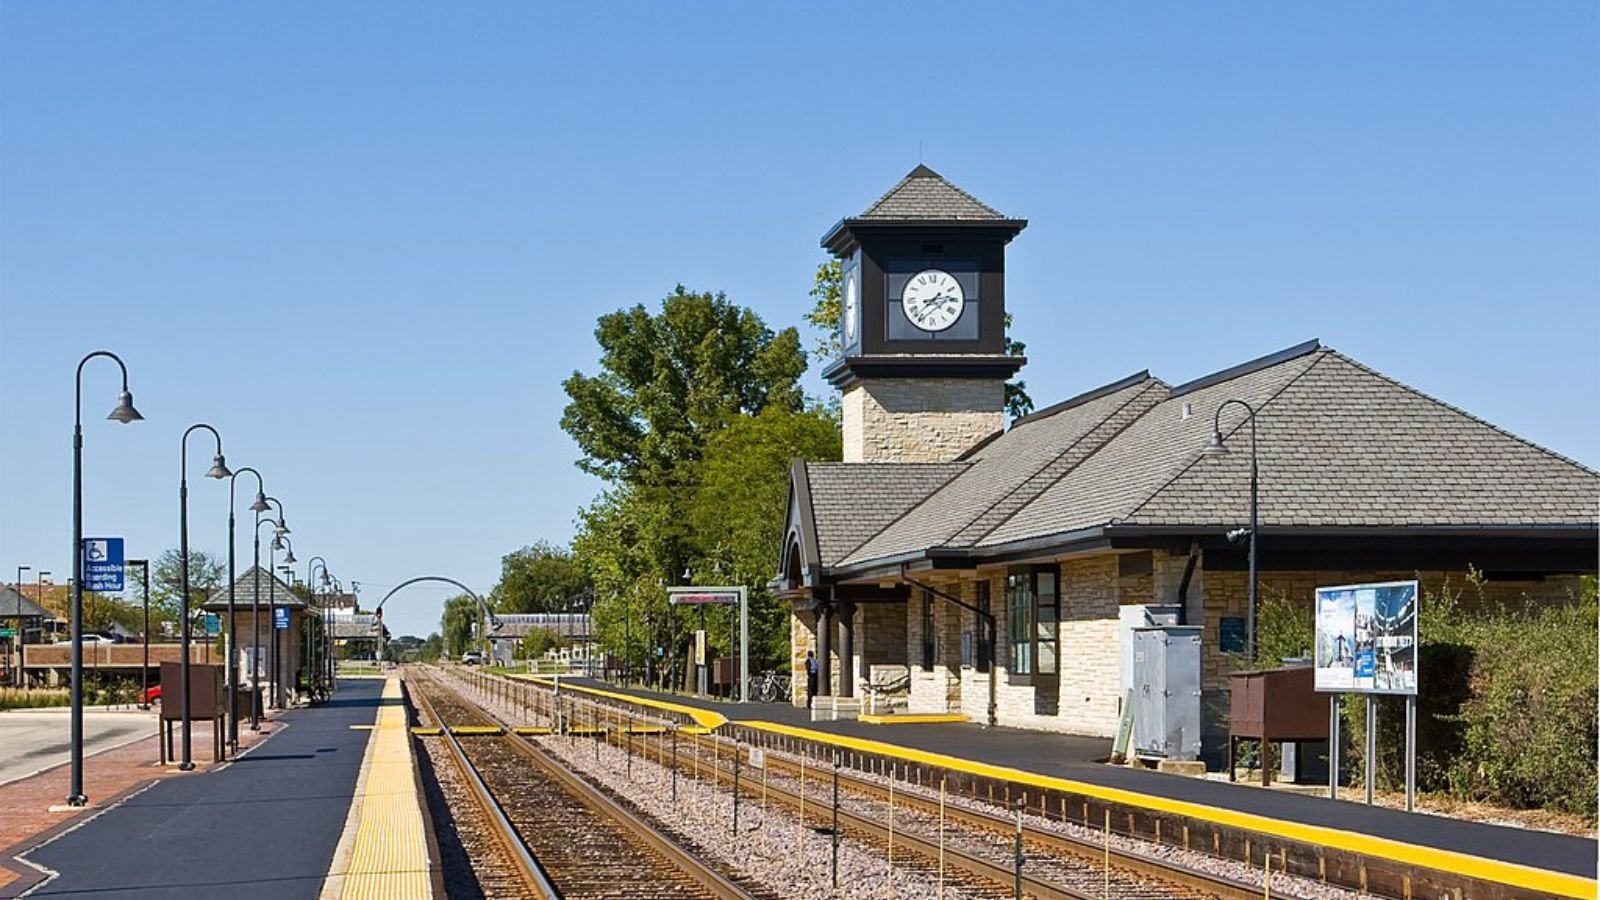
Highland Park – North Shore Legacy And Modern Appeal
🔥 Would you like to save this?
Positioned along Lake Michigan’s shoreline in Lake County, Highland Park combines historic North Shore prestige with modern amenities and cultural sophistication, creating one of Illinois’s most distinguished residential communities. The city is renowned for its beautiful lakefront parks, including the scenic Rosewood Beach and extensive ravine system that provides residents with unique natural beauty and recreational opportunities. Highland Park’s location approximately 25 miles north of downtown Chicago offers an ideal balance of suburban tranquility and urban accessibility via excellent Metra rail service.
Market data reflects Highland Park’s position as a premier North Shore destination, with the recent recovery demonstrating the community’s fundamental strength and buyer confidence in its long-term prospects. The exceptional appreciation since 2020, with values increasing over 50% in just five years, suggests Highland Park has regained its competitive position among Chicago’s most desirable suburbs. Current median values approaching $745,000 represent significant value relative to comparable North Shore communities while delivering the cultural amenities, educational excellence, and lakefront lifestyle that define premium Illinois living.
20. Inverness – 27.6% Home Price Increase Since 2010
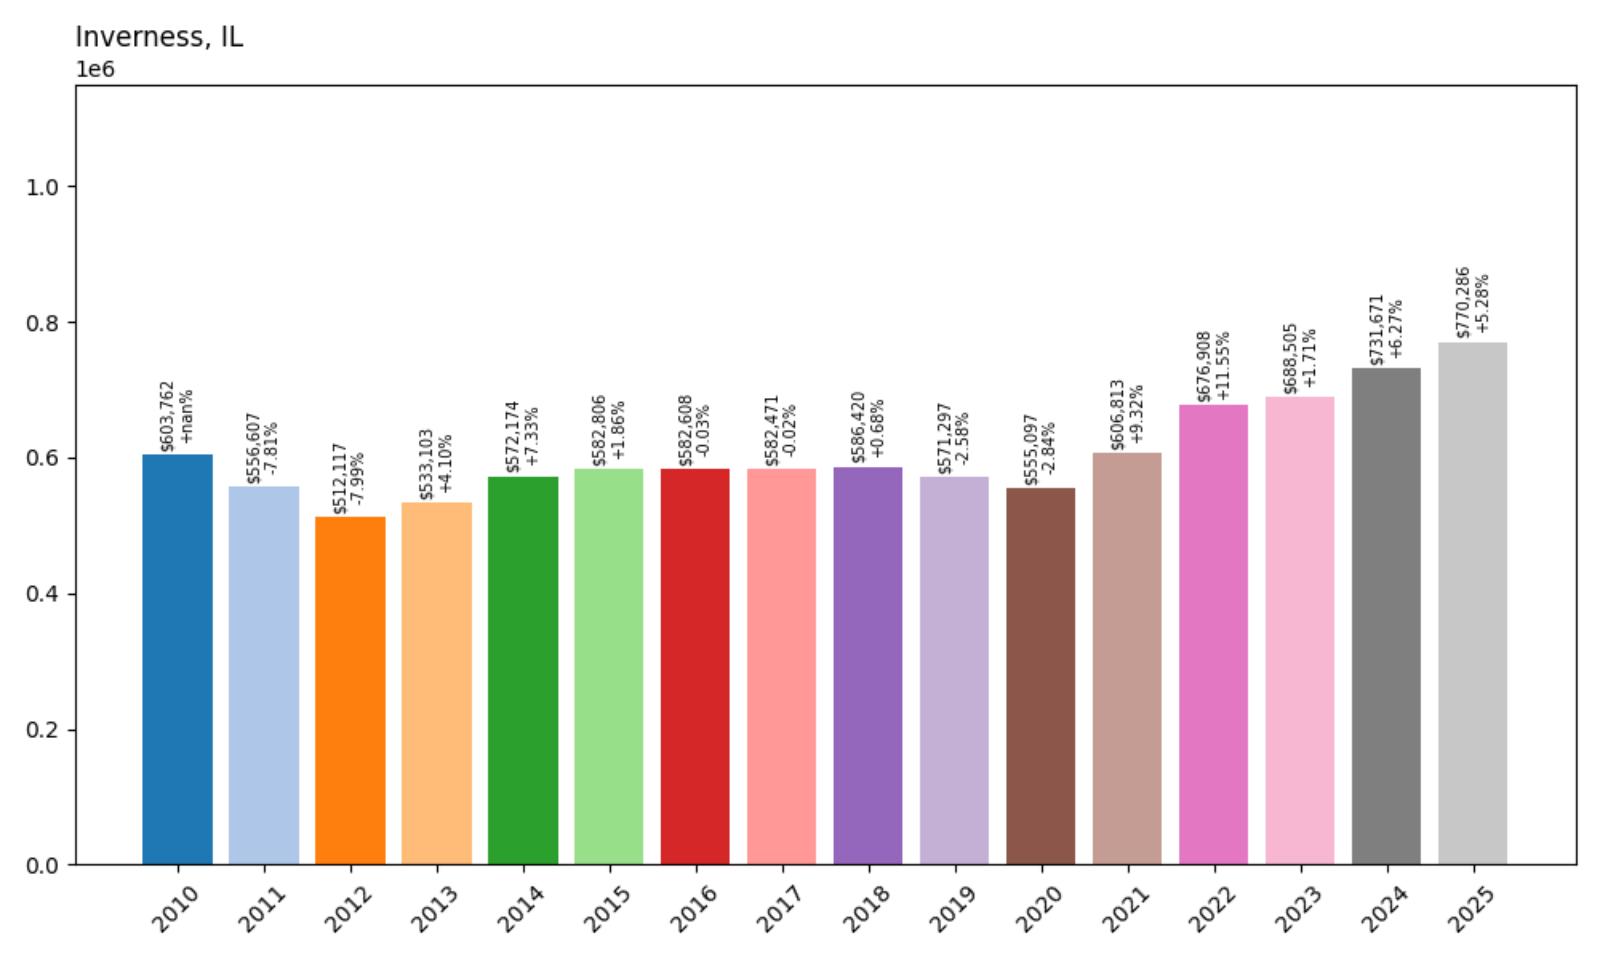
- 2010: $603,762
- 2011: $556,607 (−$47,155, −7.81% from previous year)
- 2012: $512,117 (−$44,490, −7.99% from previous year)
- 2013: $533,103 (+$20,987, +4.10% from previous year)
- 2014: $572,174 (+$39,070, +7.33% from previous year)
- 2015: $582,806 (+$10,632, +1.86% from previous year)
- 2016: $582,608 (−$197, −0.03% from previous year)
- 2017: $582,471 (−$137, −0.02% from previous year)
- 2018: $586,420 (+$3,949, +0.68% from previous year)
- 2019: $571,297 (−$15,124, −2.58% from previous year)
- 2020: $555,097 (−$16,199, −2.84% from previous year)
- 2021: $606,813 (+$51,715, +9.32% from previous year)
- 2022: $676,908 (+$70,096, +11.55% from previous year)
- 2023: $688,505 (+$11,597, +1.71% from previous year)
- 2024: $731,671 (+$43,166, +6.27% from previous year)
- 2025: $770,286 (+$38,615, +5.28% from previous year)
Inverness’ current median home value of $770,286 reflects a modest 27.6% increase since 2010, representing the lowest appreciation rate among Illinois’s most expensive communities. The community experienced significant early declines, losing nearly 15% of its value by 2012, followed by extended stagnation through 2020. However, Inverness has shown renewed strength since 2021, with consecutive years of solid gains that have brought values to new highs, suggesting a market recovery that recognizes the community’s underlying quality and appeal.
Inverness – Corporate Proximity Meets Residential Excellence
Located in northwestern Cook County, Inverness offers residents a unique combination of corporate convenience and upscale residential living, positioned near major business centers while maintaining a distinctly suburban character. The community benefits from its proximity to Schaumburg’s corporate corridor and other northwest suburban employment centers, making it particularly attractive to business executives and professionals who value short commutes to major employers. This strategic location, combined with large residential lots and custom homes, creates an executive-oriented lifestyle that appeals to affluent professionals.
Market performance shows Inverness’s gradual recovery from earlier challenges, with the recent appreciation reflecting renewed recognition of the community’s value proposition. The strong gains since 2021, totaling over $215,000 in just four years, demonstrate growing buyer confidence in Inverness’s market fundamentals. Current median values over $770,000 position the community among Illinois’s most expensive markets while offering the corporate proximity and residential quality that appeal to executive-level buyers seeking both convenience and luxury.
19. Northfield – 36.7% Home Price Increase Since 2010

- 2010: $585,341
- 2011: $527,477 (−$57,864, −9.89% from previous year)
- 2012: $506,309 (−$21,168, −4.01% from previous year)
- 2013: $544,511 (+$38,202, +7.55% from previous year)
- 2014: $597,695 (+$53,184, +9.77% from previous year)
- 2015: $621,346 (+$23,650, +3.96% from previous year)
- 2016: $628,338 (+$6,993, +1.13% from previous year)
- 2017: $630,161 (+$1,823, +0.29% from previous year)
- 2018: $635,187 (+$5,026, +0.80% from previous year)
- 2019: $596,862 (−$38,325, −6.03% from previous year)
- 2020: $589,403 (−$7,459, −1.25% from previous year)
- 2021: $638,163 (+$48,760, +8.27% from previous year)
- 2022: $719,330 (+$81,167, +12.72% from previous year)
- 2023: $727,295 (+$7,966, +1.11% from previous year)
- 2024: $766,386 (+$39,091, +5.37% from previous year)
- 2025: $799,857 (+$33,471, +4.37% from previous year)
Northfield’s median home value of $799,857 represents a 36.7% increase since 2010, with moderate long-term appreciation punctuated by a significant decline in 2019 followed by strong recovery. The community lost over 6% of its value in a single year before rebounding with exceptional gains, particularly the remarkable 12.72% surge in 2022. This volatile pattern reflects Northfield’s position in the competitive North Shore market, where buyer preferences and market conditions can create significant value fluctuations.
Northfield – Village Atmosphere In Premium Location
Situated in Cook County along the North Shore corridor, Northfield offers residents a unique village atmosphere that combines small-town charm with access to one of Illinois’s most prestigious residential areas. The community is known for its tree-lined streets, well-maintained neighborhoods, and commitment to preserving its intimate scale while providing modern amenities and services. This village character, combined with proximity to Lake Michigan and excellent transportation access, creates a distinctive residential environment that appeals to buyers seeking both community feel and luxury amenities.
Market data demonstrates Northfield’s volatility within the premium North Shore segment, with significant fluctuations reflecting the community’s sensitivity to broader luxury market trends. The strong recovery since 2020, with values increasing nearly $180,000 in five years, suggests renewed buyer confidence in Northfield’s market position. Current median values approaching $800,000 position the community among Illinois’s most expensive markets while offering the village atmosphere and North Shore amenities that define premium suburban living.
18. North Barrington – 40.5% Home Price Increase Since 2010
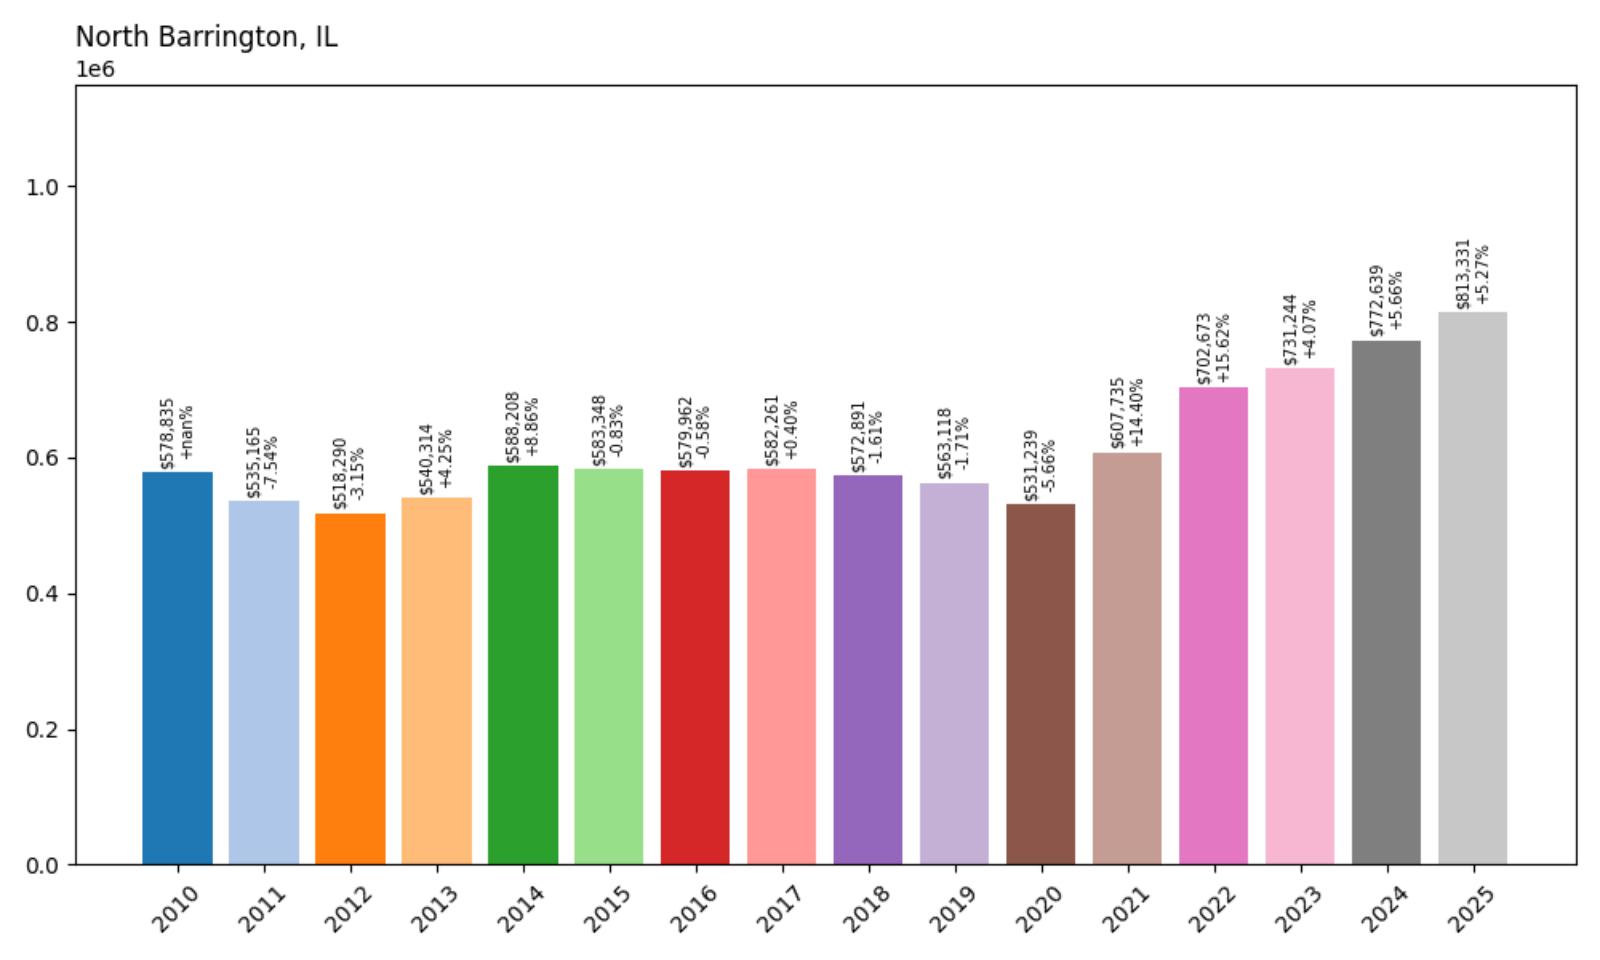
- 2010: $578,835
- 2011: $535,165 (−$43,670, −7.54% from previous year)
- 2012: $518,290 (−$16,874, −3.15% from previous year)
- 2013: $540,314 (+$22,024, +4.25% from previous year)
- 2014: $588,208 (+$47,893, +8.86% from previous year)
- 2015: $583,348 (−$4,860, −0.83% from previous year)
- 2016: $579,962 (−$3,386, −0.58% from previous year)
- 2017: $582,261 (+$2,299, +0.40% from previous year)
- 2018: $572,891 (−$9,370, −1.61% from previous year)
- 2019: $563,118 (−$9,773, −1.71% from previous year)
- 2020: $531,239 (−$31,879, −5.66% from previous year)
- 2021: $607,735 (+$76,496, +14.40% from previous year)
- 2022: $702,673 (+$94,938, +15.62% from previous year)
- 2023: $731,244 (+$28,571, +4.07% from previous year)
- 2024: $772,639 (+$41,395, +5.66% from previous year)
- 2025: $813,331 (+$40,692, +5.27% from previous year)
North Barrington’s median home value of $813,331 reflects a 40.5% increase since 2010, with particularly dramatic performance during the recent market cycle following an extended period of decline. The community experienced consistent value erosion from 2015-2020, losing over 9% of its value, before staging one of Illinois’s most impressive recoveries with consecutive double-digit gains in 2021-2022. This exceptional rebound, totaling over 30% in just two years, demonstrates North Barrington’s underlying market strength and renewed buyer appeal.
North Barrington – Equestrian Lifestyle Meets Modern Luxury
Located in Lake County’s northwestern region, North Barrington offers residents a distinctive equestrian-oriented lifestyle that combines rural character with modern luxury amenities. The community is renowned for its horse properties, riding trails, and preserved open spaces that create a countryside atmosphere while maintaining convenient access to Chicago and the northwest suburbs’ major employment centers. This unique positioning appeals to affluent buyers seeking both recreational opportunities and residential sophistication in a semi-rural setting.
Market performance demonstrates North Barrington’s dramatic transformation from a period of adjustment to exceptional growth, with the recovery beginning in 2021 reflecting changing lifestyle preferences toward spacious, recreational properties. The strong continued appreciation through 2025, with values now exceeding $813,000, suggests sustained market confidence in the community’s unique value proposition. Current pricing positions North Barrington among Lake County’s most exclusive residential markets while delivering the equestrian lifestyle and space that define luxury rural-suburban living.
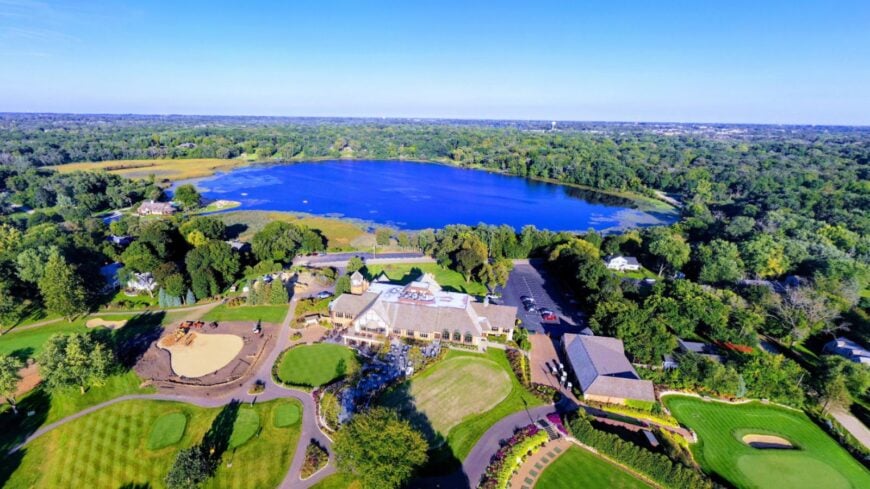
17. Western Springs – 42.2% Home Price Increase Since 2010
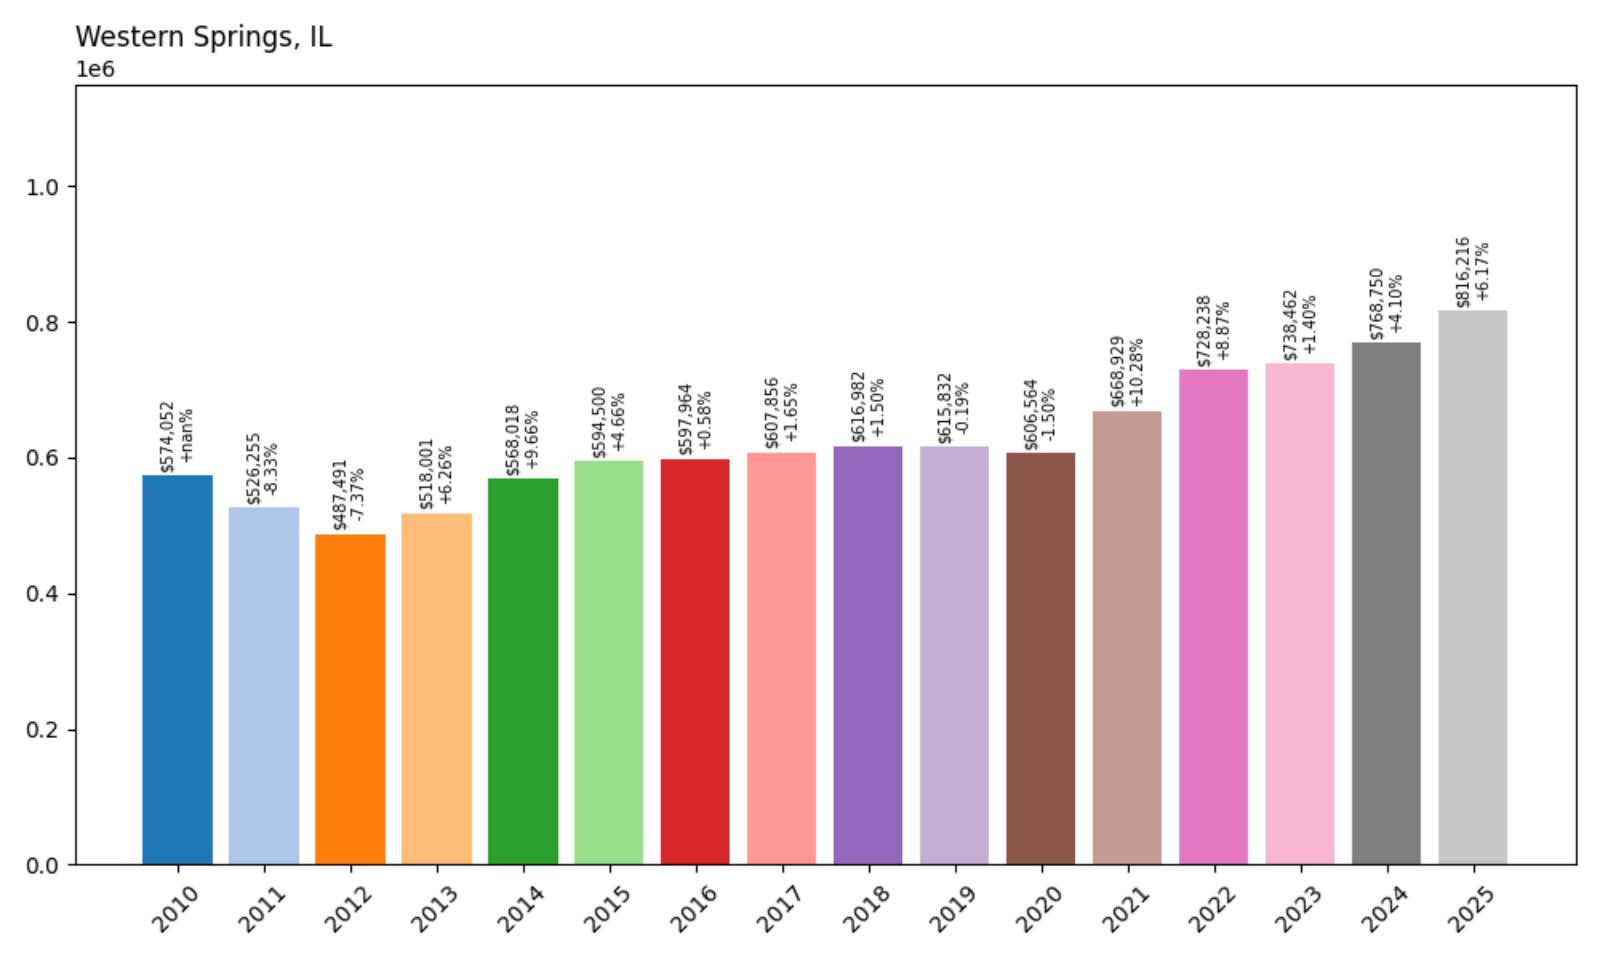
- 2010: $574,052
- 2011: $526,255 (−$47,797, −8.33% from previous year)
- 2012: $487,491 (−$38,764, −7.37% from previous year)
- 2013: $518,001 (+$30,510, +6.26% from previous year)
- 2014: $568,018 (+$50,018, +9.66% from previous year)
- 2015: $594,500 (+$26,481, +4.66% from previous year)
- 2016: $597,964 (+$3,464, +0.58% from previous year)
- 2017: $607,856 (+$9,892, +1.65% from previous year)
- 2018: $616,982 (+$9,126, +1.50% from previous year)
- 2019: $615,832 (−$1,150, −0.19% from previous year)
- 2020: $606,564 (−$9,268, −1.50% from previous year)
- 2021: $668,929 (+$62,366, +10.28% from previous year)
- 2022: $728,238 (+$59,308, +8.87% from previous year)
- 2023: $738,462 (+$10,224, +1.40% from previous year)
- 2024: $768,750 (+$30,288, +4.10% from previous year)
- 2025: $816,216 (+$47,466, +6.17% from previous year)
Western Springs’ current median home value of $816,216 represents a solid 42.2% increase since 2010, demonstrating consistent long-term appreciation with particularly strong performance during the recent market cycle. The community showed remarkable stability through most economic cycles, with only modest declines during challenging periods before experiencing strong recovery growth. The impressive 6.17% gain in 2025 continues the upward trajectory that has brought values to historic highs, reflecting sustained buyer confidence in this premium western suburb.
Western Springs – Small Town Perfection
Situated in Cook County just 16 miles west of downtown Chicago, Western Springs epitomizes the ideal suburban community with its charming downtown district, tree-lined residential streets, and strong sense of community identity. The village is renowned for its well-preserved historic character, excellent municipal services, and commitment to maintaining its small-town atmosphere while providing sophisticated amenities and cultural opportunities. This combination of intimacy and quality creates a residential environment that consistently attracts families and professionals seeking the perfect balance of suburban living and urban accessibility.
Market data reflects Western Springs’ reputation as one of the most desirable communities in the western suburbs, with steady appreciation that demonstrates consistent buyer demand and market confidence. The recent strong performance, with values increasing over $150,000 since 2021, suggests the community continues to attract premium buyers who value its combination of historic charm, educational excellence, and community amenities. Current median values exceeding $816,000 represent the premium associated with one of Illinois’s most perfectly executed suburban communities.
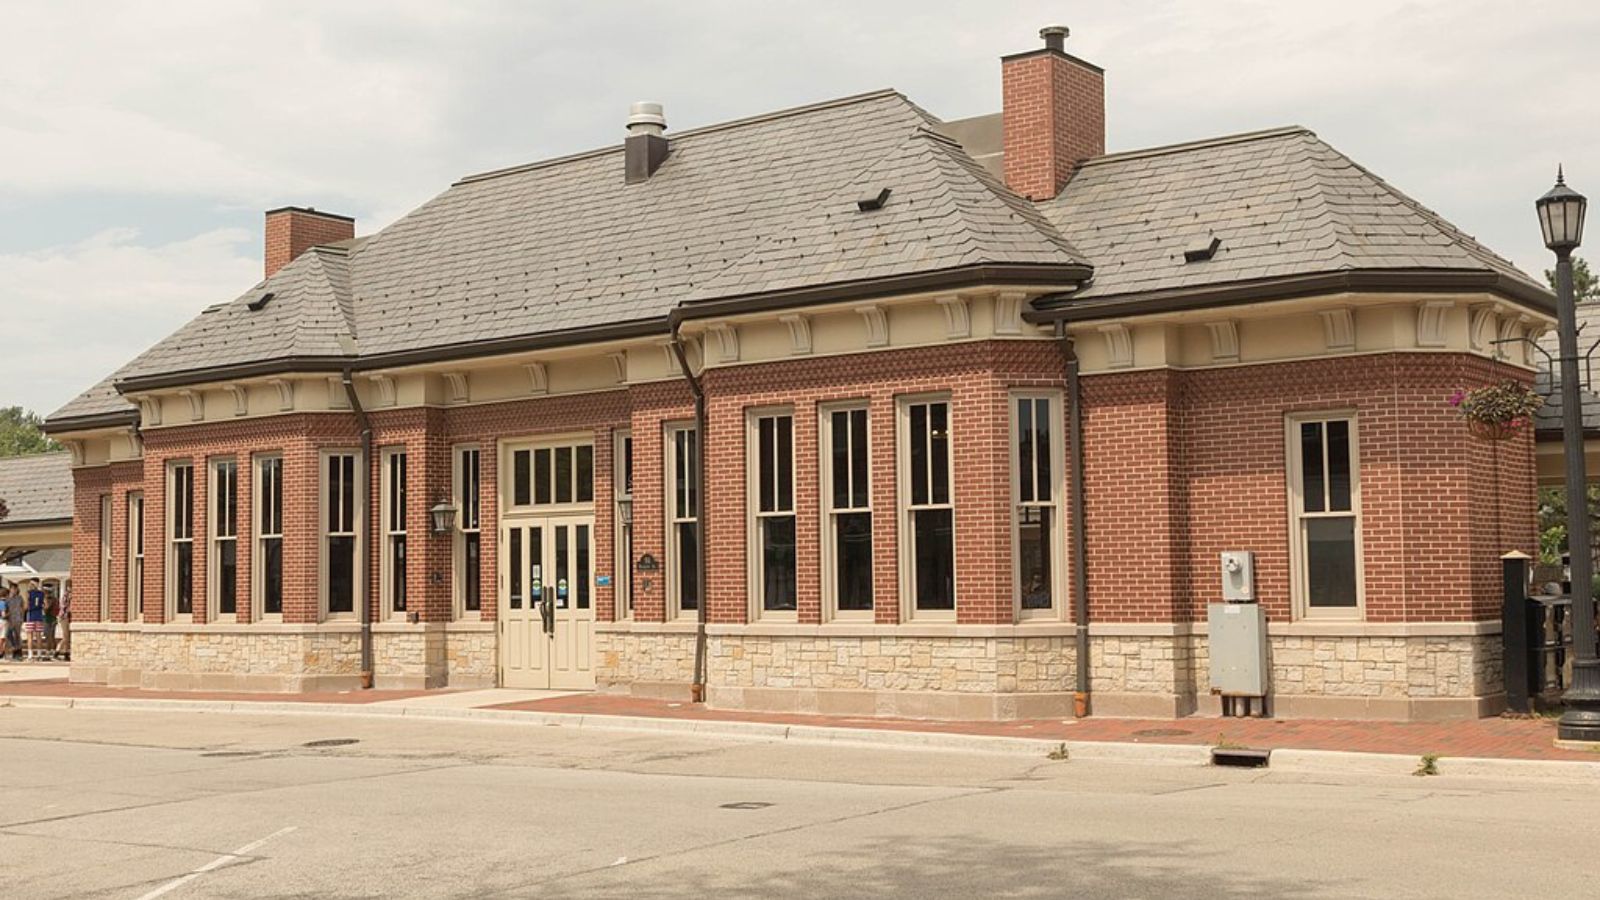
16. Burr Ridge – 29.2% Home Price Increase Since 2010
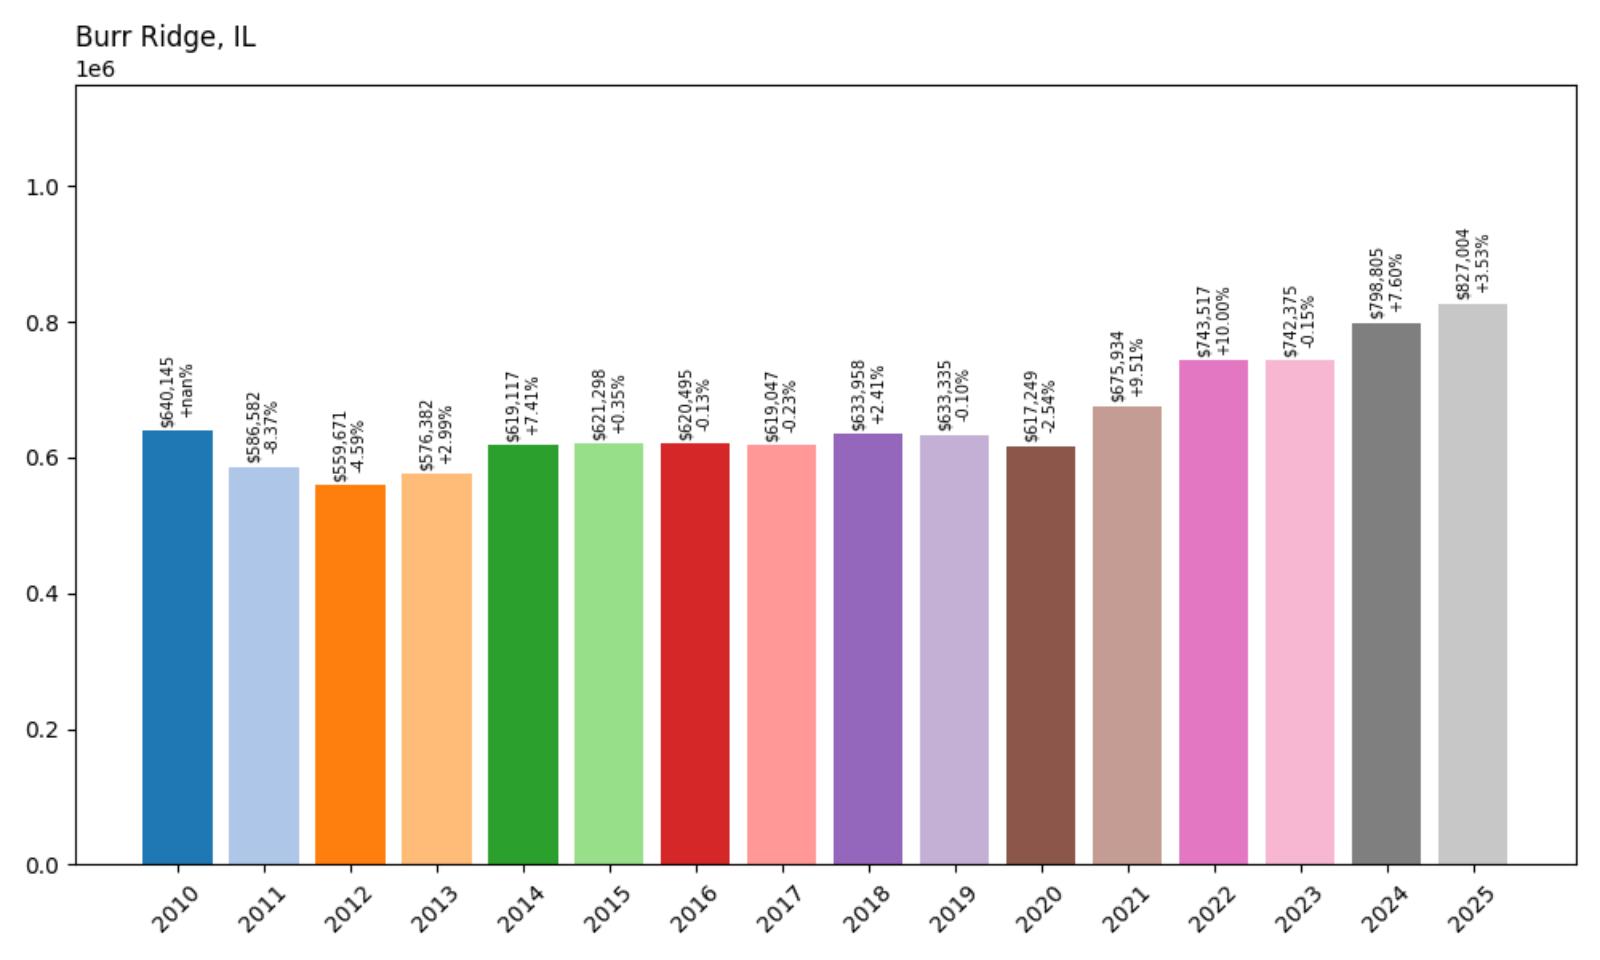
- 2010: $640,145
- 2011: $586,582 (−$53,562, −8.37% from previous year)
- 2012: $559,671 (−$26,912, −4.59% from previous year)
- 2013: $576,382 (+$16,711, +2.99% from previous year)
- 2014: $619,117 (+$42,736, +7.41% from previous year)
- 2015: $621,298 (+$2,180, +0.35% from previous year)
- 2016: $620,495 (−$802, −0.13% from previous year)
- 2017: $619,047 (−$1,448, −0.23% from previous year)
- 2018: $633,958 (+$14,911, +2.41% from previous year)
- 2019: $633,335 (−$623, −0.10% from previous year)
- 2020: $617,249 (−$16,086, −2.54% from previous year)
- 2021: $675,934 (+$58,685, +9.51% from previous year)
- 2022: $743,517 (+$67,583, +10.00% from previous year)
- 2023: $742,375 (−$1,141, −0.15% from previous year)
- 2024: $798,805 (+$56,430, +7.60% from previous year)
- 2025: $827,004 (+$28,199, +3.53% from previous year)
Burr Ridge’s median home value of $827,004 represents a modest 29.2% increase since 2010, reflecting the community’s higher starting values and more moderate appreciation compared to other expensive Illinois markets. The community experienced significant early declines, losing over 12% of its value by 2012, followed by extended stagnation through 2020. However, Burr Ridge has demonstrated strong recovery since 2021, with values increasing over $150,000 in four years, suggesting renewed market confidence in this established western suburb.
Burr Ridge – Executive Living In The Southwest Suburbs
Located in DuPage County approximately 20 miles southwest of downtown Chicago, Burr Ridge offers residents an upscale suburban lifestyle characterized by custom homes, rolling terrain, and preserved natural areas. The community is known for its large residential lots, executive-style housing, and proximity to major corporate centers including the Oakbrook Terrace and Westmont business districts. This positioning makes Burr Ridge particularly attractive to business executives and professionals who value both residential luxury and convenient access to suburban employment centers.
Market performance demonstrates Burr Ridge’s gradual recovery from earlier market challenges, with the recent appreciation reflecting renewed recognition of the community’s executive appeal and lifestyle amenities. The strong gains since 2021, particularly the impressive 7.60% increase in 2024, suggest growing buyer confidence in Burr Ridge’s market fundamentals. Current median values over $827,000 position the community among Illinois’s most expensive markets while offering the space, luxury, and corporate proximity that appeal to executive-level buyers.
15. Kildeer – 37.9% Home Price Increase Since 2010
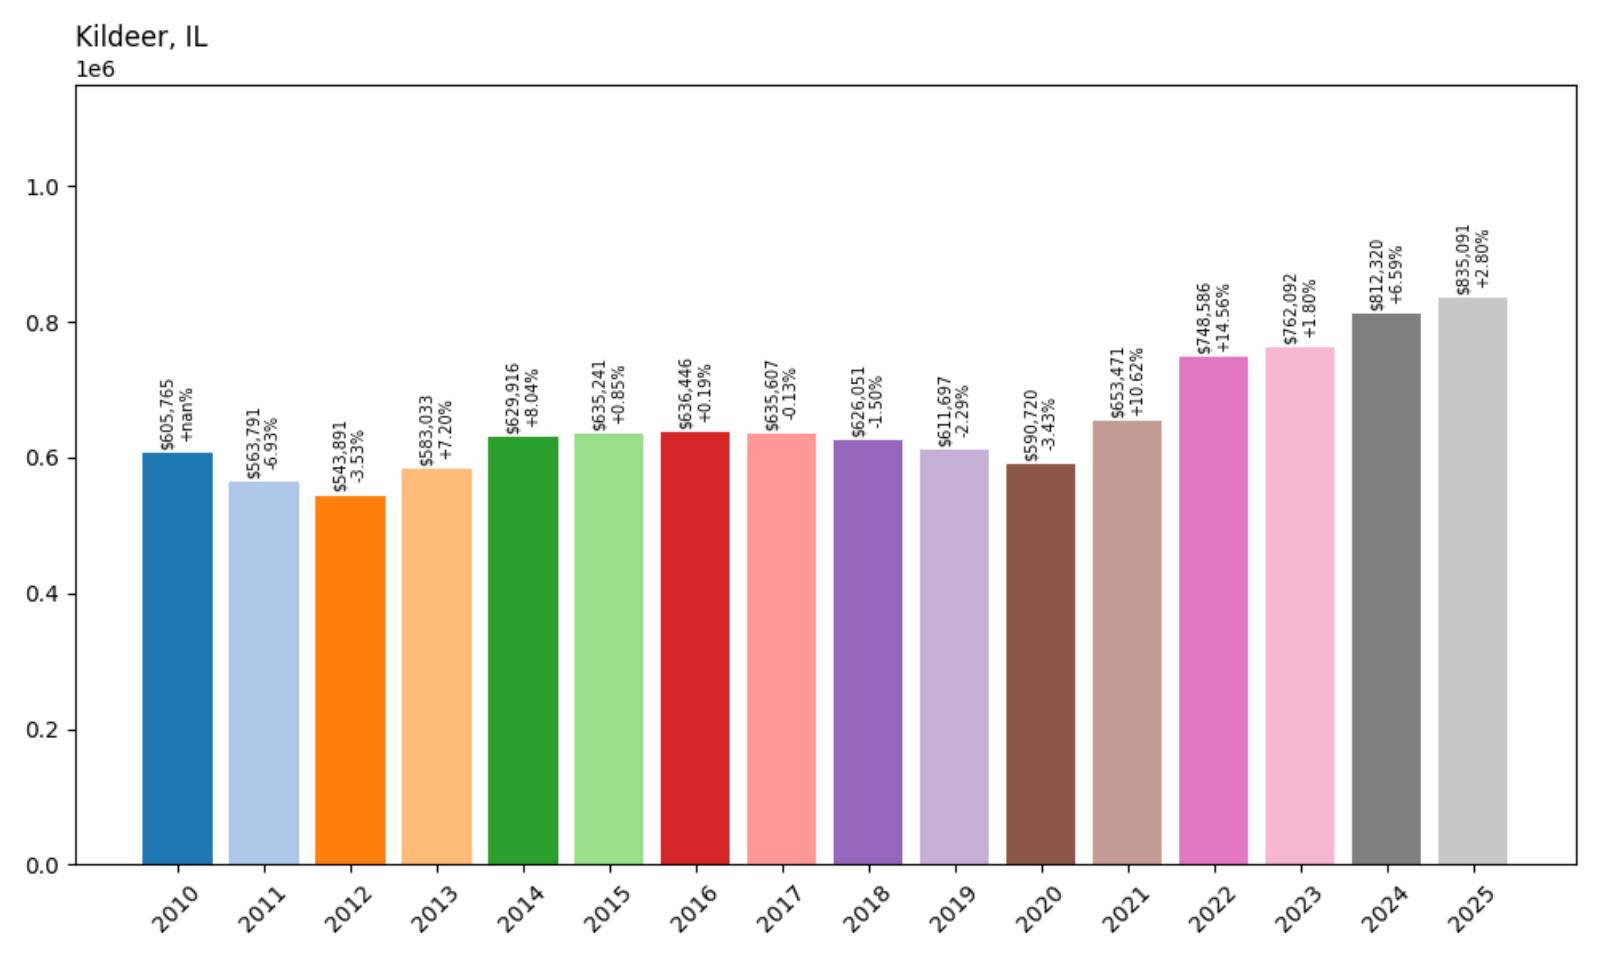
- 2010: $605,765
- 2011: $563,791 (−$41,974, −6.93% from previous year)
- 2012: $543,891 (−$19,900, −3.53% from previous year)
- 2013: $583,033 (+$39,142, +7.20% from previous year)
- 2014: $629,916 (+$46,883, +8.04% from previous year)
- 2015: $635,241 (+$5,325, +0.85% from previous year)
- 2016: $636,446 (+$1,205, +0.19% from previous year)
- 2017: $635,607 (−$839, −0.13% from previous year)
- 2018: $626,051 (−$9,556, −1.50% from previous year)
- 2019: $611,697 (−$14,354, −2.29% from previous year)
- 2020: $590,720 (−$20,977, −3.43% from previous year)
- 2021: $653,471 (+$62,751, +10.62% from previous year)
- 2022: $748,586 (+$95,115, +14.56% from previous year)
- 2023: $762,092 (+$13,506, +1.80% from previous year)
- 2024: $812,320 (+$50,227, +6.59% from previous year)
- 2025: $835,091 (+$22,771, +2.80% from previous year)
Kildeer’s current median home value of $835,091 reflects a 37.9% increase since 2010, with particularly impressive performance during the recent market cycle following several years of decline. The community experienced consistent value erosion from 2016-2020, losing nearly 7% of its value, before staging a dramatic recovery highlighted by an exceptional 14.56% surge in 2022. This rebound demonstrates Kildeer’s underlying market strength and its appeal to buyers seeking luxury living in the northwest suburbs.
Kildeer – Private Estate Living
Nestled in Lake County’s scenic landscape, Kildeer offers residents an exclusive estate-style lifestyle characterized by large properties, custom homes, and preserved natural areas that create a private, upscale residential environment. The community is distinguished by its commitment to maintaining low population density and rural character while providing modern luxury amenities and convenient access to major employment centers. This unique positioning appeals to affluent buyers seeking privacy, space, and recreational opportunities in a sophisticated suburban setting.
Market data shows Kildeer’s dramatic transformation from a period of market adjustment to exceptional growth, with the recovery beginning in 2021 reflecting changing buyer preferences toward spacious, private properties. The strong performance since 2021, with values increasing over $244,000 in four years, suggests sustained market confidence in Kildeer’s luxury positioning. Current median values exceeding $835,000 position the community among Lake County’s most exclusive residential markets while delivering the estate lifestyle and privacy that define premium suburban living.
14. Wilmette – 39.1% Home Price Increase Since 2010
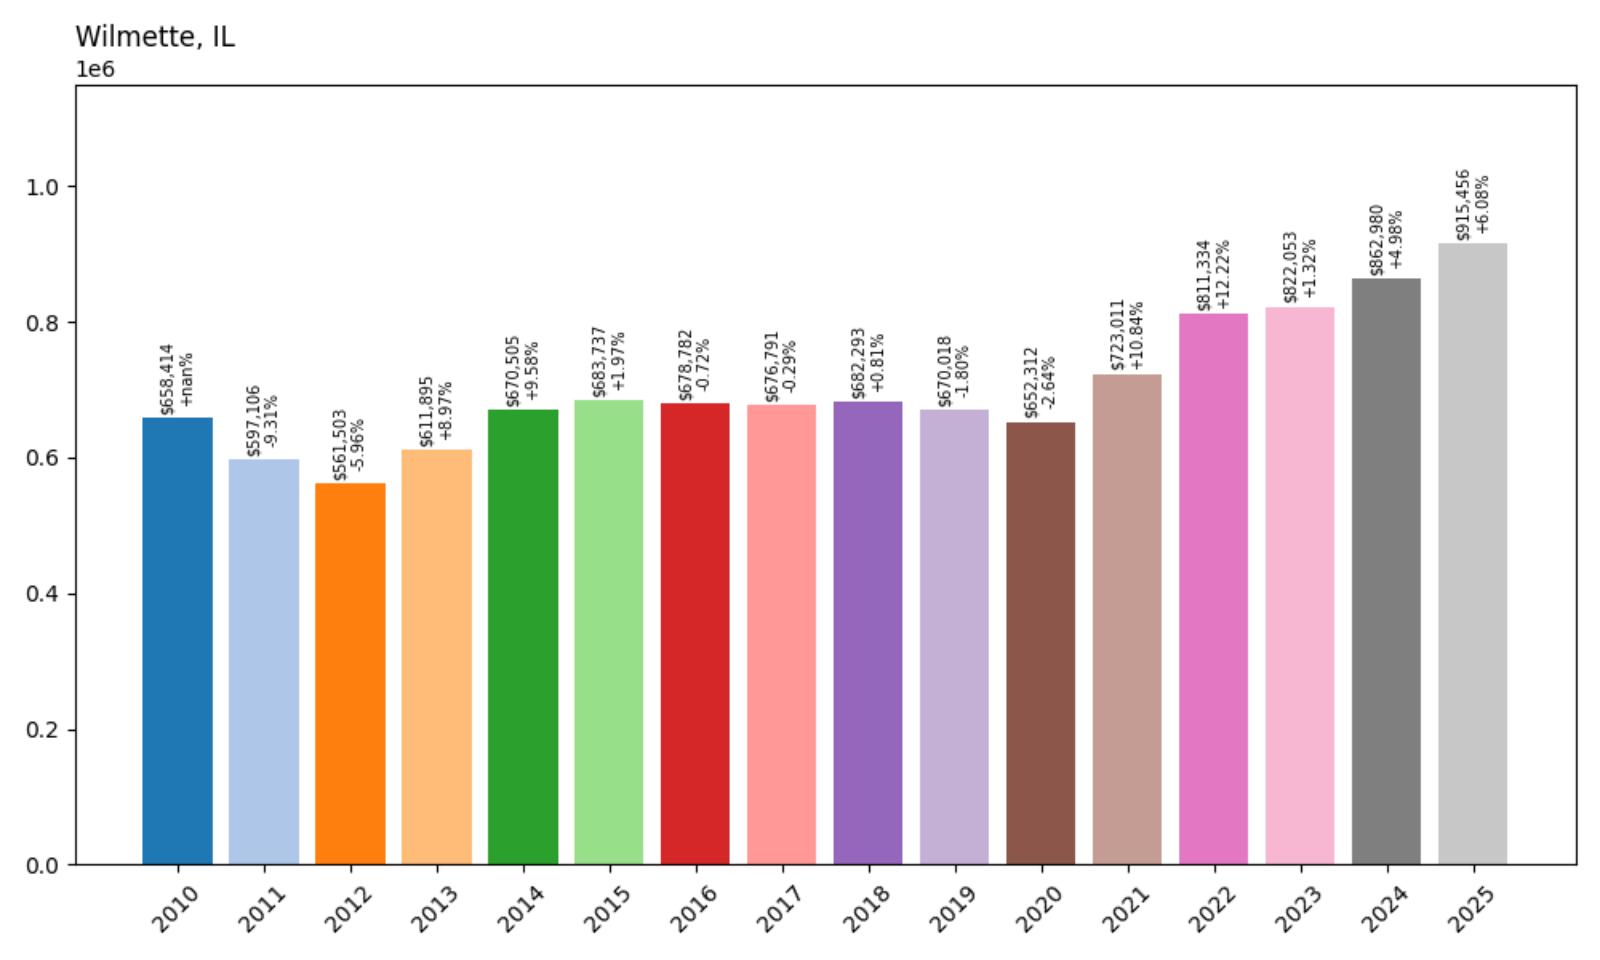
- 2010: $658,414
- 2011: $597,106 (−$61,308, −9.31% from previous year)
- 2012: $561,503 (−$35,603, −5.96% from previous year)
- 2013: $611,895 (+$50,392, +8.97% from previous year)
- 2014: $670,505 (+$58,610, +9.58% from previous year)
- 2015: $683,737 (+$13,232, +1.97% from previous year)
- 2016: $678,782 (−$4,955, −0.72% from previous year)
- 2017: $676,791 (−$1,991, −0.29% from previous year)
- 2018: $682,293 (+$5,502, +0.81% from previous year)
- 2019: $670,018 (−$12,275, −1.80% from previous year)
- 2020: $652,312 (−$17,706, −2.64% from previous year)
- 2021: $723,011 (+$70,699, +10.84% from previous year)
- 2022: $811,334 (+$88,323, +12.22% from previous year)
- 2023: $822,053 (+$10,719, +1.32% from previous year)
- 2024: $862,980 (+$40,927, +4.98% from previous year)
- 2025: $915,456 (+$52,477, +6.08% from previous year)
Wilmette’s median home value of $915,456 represents a 39.1% increase since 2010, demonstrating the community’s established position in the North Shore luxury market. After experiencing significant early declines that reduced values by over 14% through 2012, Wilmette showed strong recovery followed by extended stagnation through 2020. The recent market cycle has been exceptional, with consecutive double-digit gains in 2021-2022 bringing values to historic highs and establishing Wilmette’s position among Illinois’s most expensive communities.
Wilmette – North Shore Sophistication
Positioned along Lake Michigan’s shoreline in Cook County, Wilmette represents the epitome of North Shore sophistication with its beautiful lakefront parks, historic neighborhoods, and cultural amenities that create one of Illinois’s most prestigious residential environments. The community is renowned for its tree-lined streets, diverse architectural styles ranging from historic mansions to modern custom homes, and extensive recreational facilities including Gillson Park Beach and harbor. Wilmette’s location just 14 miles north of downtown Chicago provides residents with an ideal combination of lakefront living and urban accessibility.
Market performance demonstrates Wilmette’s resilience and growth potential within the competitive North Shore market, with the exceptional recovery since 2020 reflecting renewed buyer confidence in the community’s fundamental strengths. The impressive appreciation of over $263,000 in just four years suggests Wilmette has regained its competitive position among Chicago’s most desirable suburbs. Current median values approaching $916,000 represent significant value relative to comparable North Shore communities while delivering the lakefront lifestyle, educational excellence, and cultural sophistication that define premium Illinois living.
13. Long Grove – 47.5% Home Price Increase Since 2010
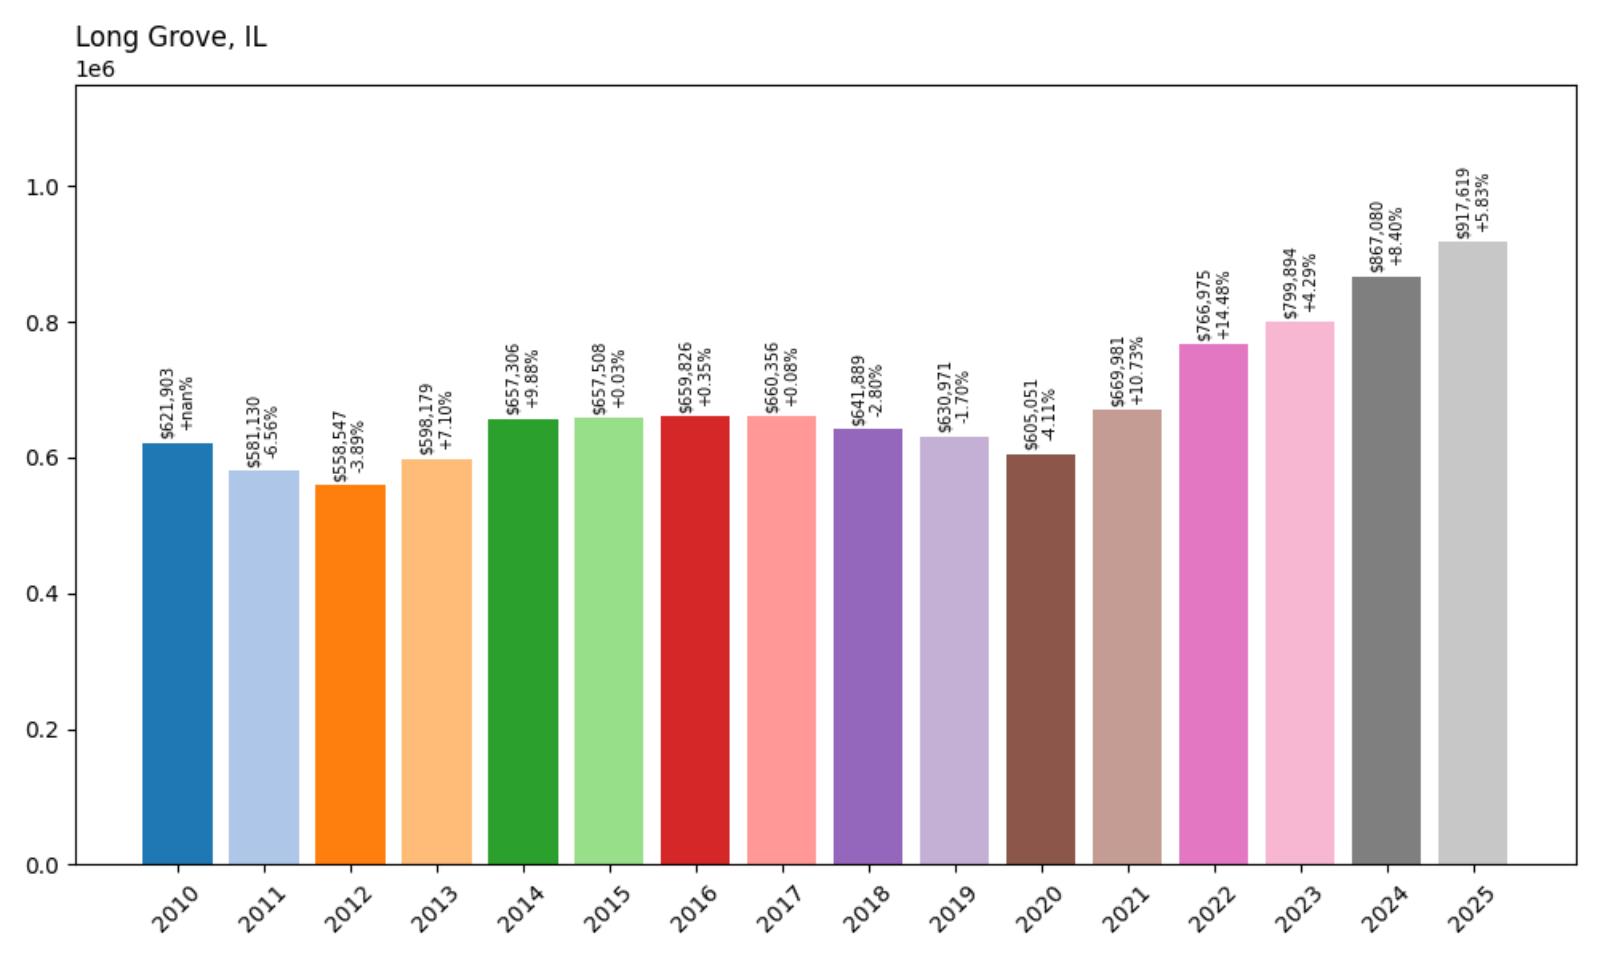
- 2010: $621,903
- 2011: $581,130 (−$40,773, −6.56% from previous year)
- 2012: $558,547 (−$22,584, −3.89% from previous year)
- 2013: $598,179 (+$39,632, +7.10% from previous year)
- 2014: $657,306 (+$59,127, +9.88% from previous year)
- 2015: $657,508 (+$202, +0.03% from previous year)
- 2016: $659,826 (+$2,319, +0.35% from previous year)
- 2017: $660,356 (+$530, +0.08% from previous year)
- 2018: $641,889 (−$18,468, −2.80% from previous year)
- 2019: $630,971 (−$10,917, −1.70% from previous year)
- 2020: $605,051 (−$25,921, −4.11% from previous year)
- 2021: $669,981 (+$64,930, +10.73% from previous year)
- 2022: $766,975 (+$96,994, +14.48% from previous year)
- 2023: $799,894 (+$32,919, +4.29% from previous year)
- 2024: $867,080 (+$67,186, +8.40% from previous year)
- 2025: $917,619 (+$50,538, +5.83% from previous year)
Long Grove’s median home value of $917,619 reflects a solid 47.5% increase since 2010, with particularly dramatic performance during the recent market cycle following an extended period of stagnation and decline. The community experienced minimal growth from 2015-2020, actually losing value during several years, before staging one of Illinois’s most impressive recoveries with a remarkable 14.48% surge in 2022. This exceptional rebound, followed by continued strong appreciation, has propelled Long Grove into the exclusive $900,000+ median home value tier.
Long Grove – Historic Village Charm
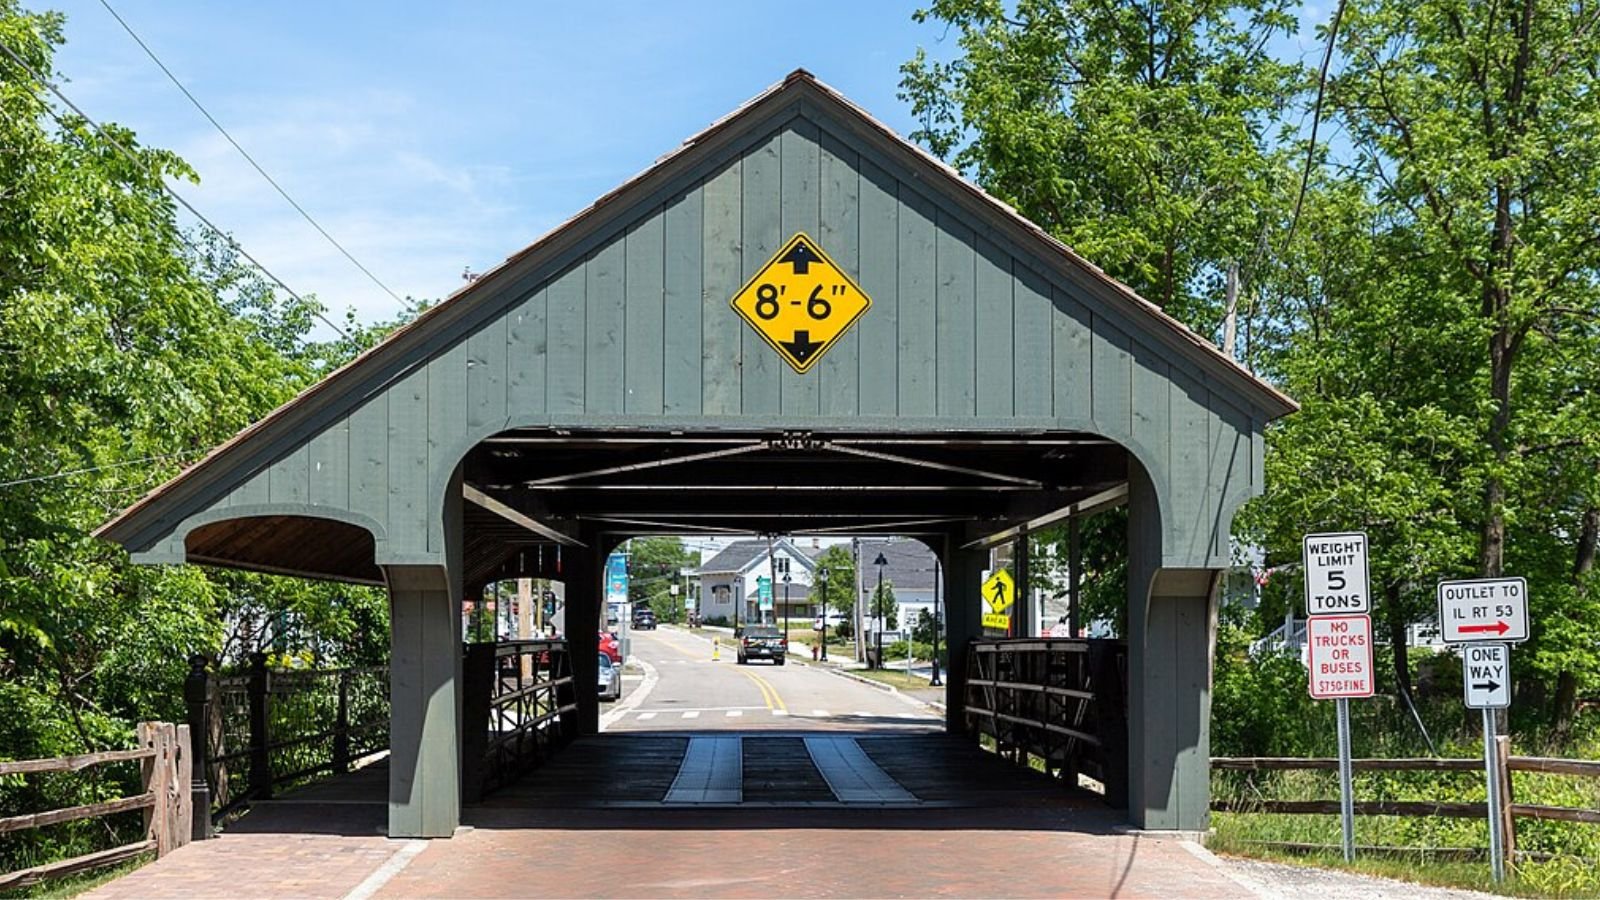
Located in Lake County approximately 30 miles northwest of Chicago, Long Grove offers residents a unique combination of historic village atmosphere and modern luxury living that creates one of Illinois’s most distinctive residential communities. The village is renowned for its preserved 19th-century downtown district, complete with covered bridges, historic buildings, and specialty shops that create an authentic small-town experience. This historic character, combined with large residential lots and custom homes throughout the surrounding countryside, appeals to buyers seeking both cultural charm and upscale suburban living.
Market data shows Long Grove’s remarkable transformation from a period of market adjustment to exceptional growth, with the recovery beginning in 2021 reflecting increased appreciation for historic character and rural-suburban lifestyle. The outstanding performance since 2020, with values increasing over $312,000 in five years, demonstrates sustained buyer confidence in Long Grove’s unique market position. Current median values exceeding $917,000 establish the community among Illinois’s most exclusive markets while delivering the historic charm and lifestyle amenities that define luxury living in the northwest suburbs.
12. Oak Brook – 40.1% Home Price Increase Since 2010
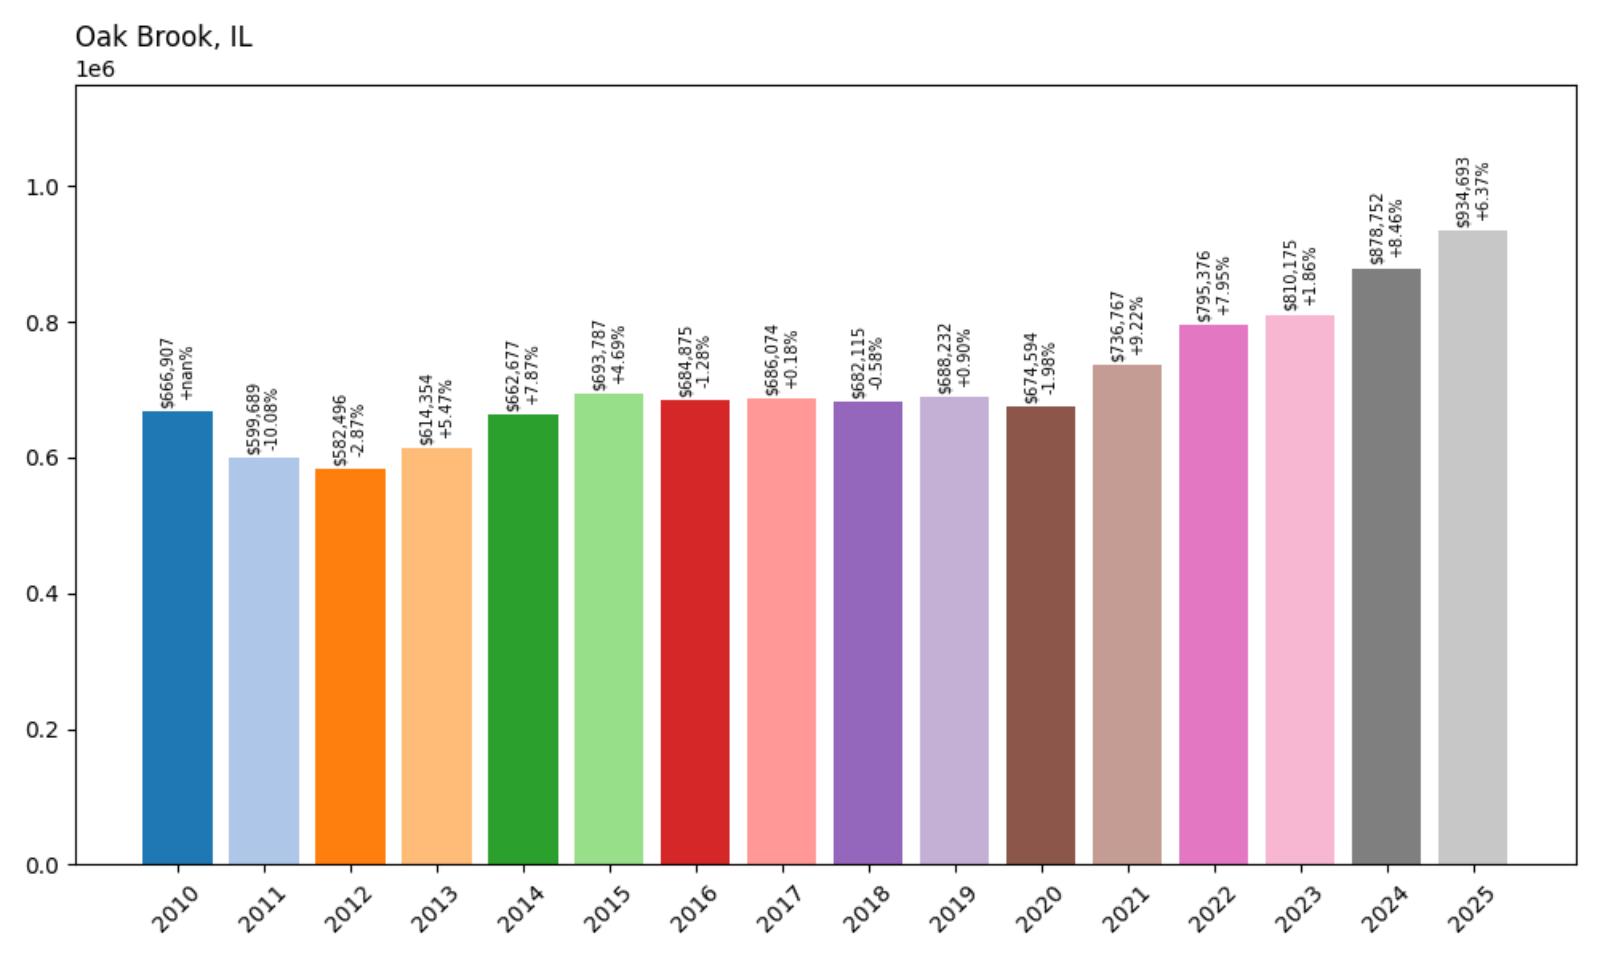
- 2010: $666,907
- 2011: $599,689 (−$67,218, −10.08% from previous year)
- 2012: $582,496 (−$17,193, −2.87% from previous year)
- 2013: $614,354 (+$31,858, +5.47% from previous year)
- 2014: $662,677 (+$48,323, +7.87% from previous year)
- 2015: $693,787 (+$31,109, +4.69% from previous year)
- 2016: $684,875 (−$8,912, −1.28% from previous year)
- 2017: $686,074 (+$1,199, +0.18% from previous year)
- 2018: $682,115 (−$3,958, −0.58% from previous year)
- 2019: $688,232 (+$6,117, +0.90% from previous year)
- 2020: $674,594 (−$13,638, −1.98% from previous year)
- 2021: $736,767 (+$62,173, +9.22% from previous year)
- 2022: $795,376 (+$58,609, +7.95% from previous year)
- 2023: $810,175 (+$14,799, +1.86% from previous year)
- 2024: $878,752 (+$68,577, +8.46% from previous year)
- 2025: $934,693 (+$55,941, +6.37% from previous year)
Oak Brook’s current median home value of $934,693 represents a 40.1% increase since 2010, reflecting steady long-term appreciation with strong recent performance. The community experienced significant early declines, losing nearly 13% of its value by 2012, followed by gradual recovery and extended stability through 2020. The recent market cycle has been impressive, with consecutive years of solid gains bringing values to historic highs and establishing Oak Brook’s position among Illinois’s most expensive communities.
Oak Brook – Corporate Headquarters Meet Residential Luxury
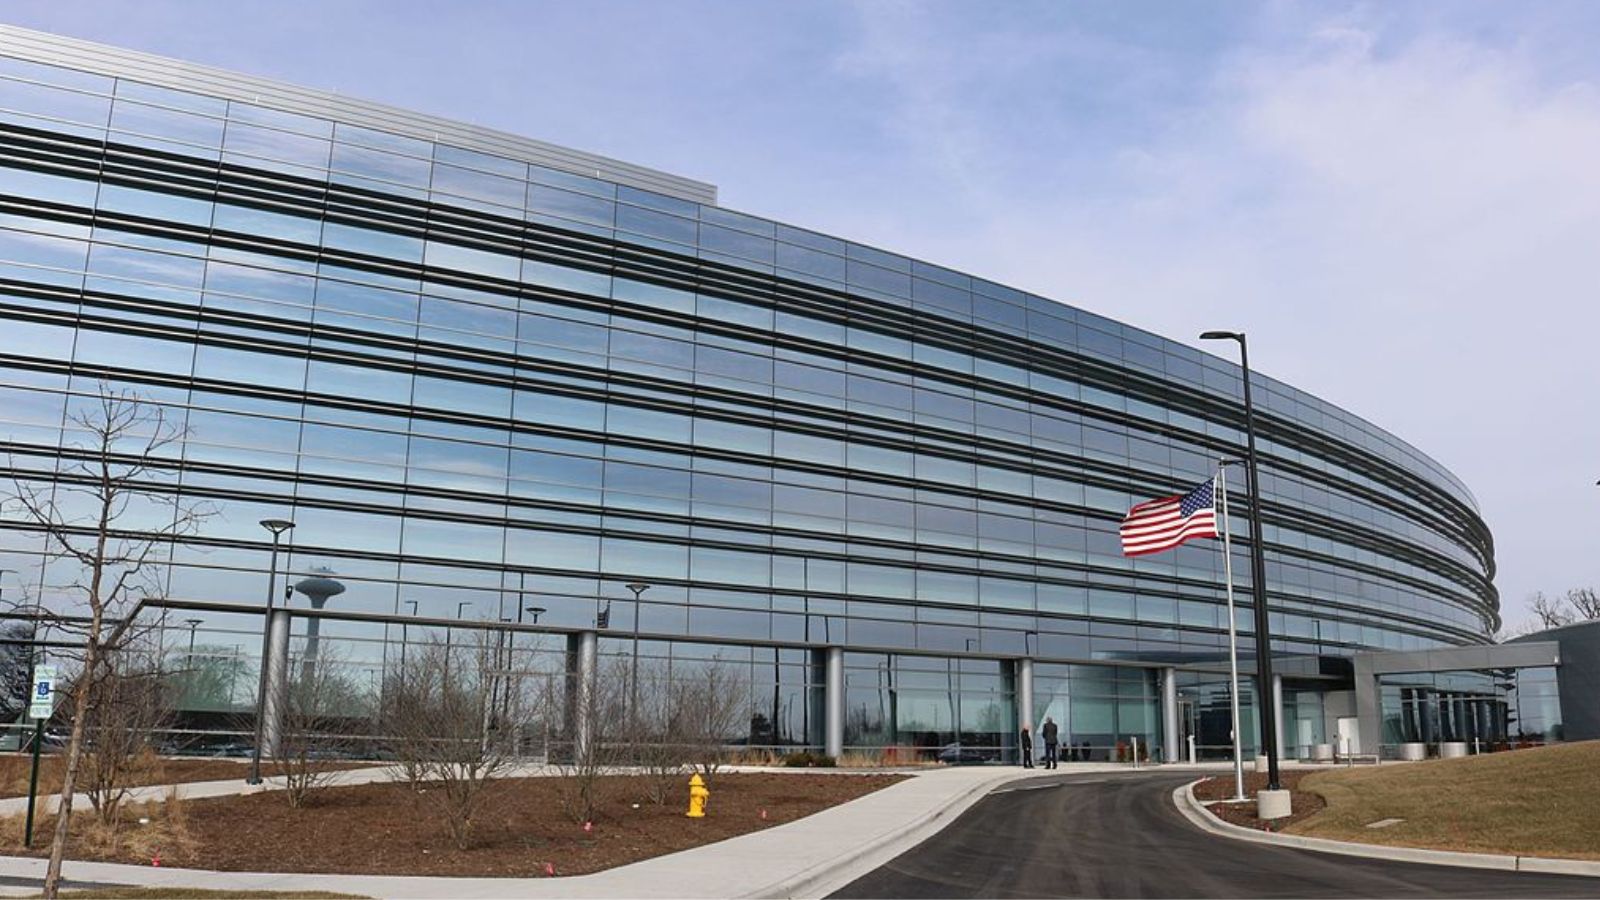
Chamberlain Group, CC BY-SA 4.0, via Wikimedia Commons
Strategically positioned in DuPage County, Oak Brook represents a unique fusion of major corporate presence and upscale residential living, hosting headquarters for Fortune 500 companies while maintaining some of Illinois’s most prestigious neighborhoods. The community is home to corporate giants including McDonald’s Corporation, Ace Hardware, and Federal Signal, creating a substantial employment base and tax revenue stream that supports exceptional municipal services and amenities. This corporate concentration, combined with luxury residential developments and championship golf courses, creates an executive-oriented lifestyle that appeals to business leaders and affluent professionals.
Market performance demonstrates Oak Brook’s evolution into one of Illinois’s premier luxury markets, with the strong appreciation since 2021 reflecting renewed confidence in the community’s corporate advantages and residential quality. The impressive gains totaling over $260,000 in four years suggest sustained buyer interest in Oak Brook’s unique combination of business convenience and luxury living. Current median values approaching $935,000 position the community among the state’s most exclusive markets while offering the corporate proximity and lifestyle amenities that appeal to executive-level buyers.
11. Mettawa – 50.2% Home Price Increase Since 2010
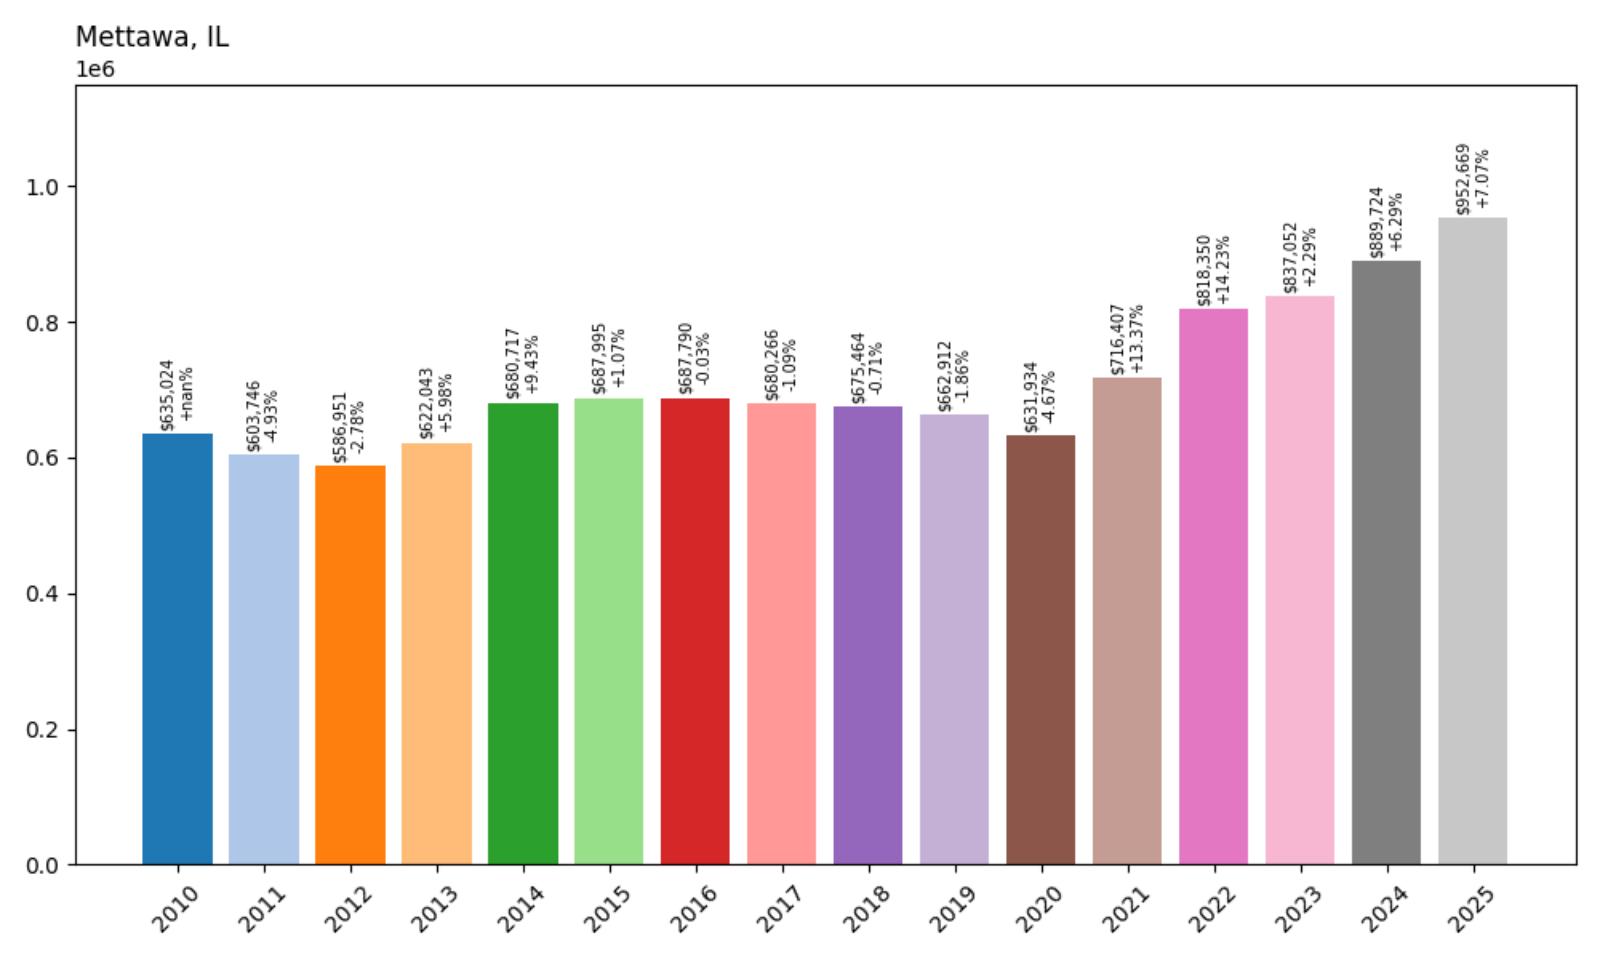
- 2010: $635,024
- 2011: $603,746 (−$31,277, −4.93% from previous year)
- 2012: $586,951 (−$16,796, −2.78% from previous year)
- 2013: $622,043 (+$35,092, +5.98% from previous year)
- 2014: $680,717 (+$58,674, +9.43% from previous year)
- 2015: $687,995 (+$7,278, +1.07% from previous year)
- 2016: $687,790 (−$204, −0.03% from previous year)
- 2017: $680,266 (−$7,524, −1.09% from previous year)
- 2018: $675,464 (−$4,802, −0.71% from previous year)
- 2019: $662,912 (−$12,553, −1.86% from previous year)
- 2020: $631,934 (−$30,978, −4.67% from previous year)
- 2021: $716,407 (+$84,474, +13.37% from previous year)
- 2022: $818,350 (+$101,943, +14.23% from previous year)
- 2023: $837,052 (+$18,702, +2.29% from previous year)
- 2024: $889,724 (+$52,672, +6.29% from previous year)
- 2025: $952,669 (+$62,945, +7.07% from previous year)
Mettawa’s median home value of $952,669 represents a strong 50.2% increase since 2010, with exceptional performance during the recent market cycle following several years of decline. The community experienced consistent value erosion from 2016-2020, losing over 8% of its value, before staging one of Illinois’s most dramatic recoveries with consecutive double-digit gains in 2021-2022. This remarkable rebound, totaling over 27% in just two years, has propelled Mettawa into the exclusive sub-$1 million tier among Illinois’s most expensive communities.
Mettawa – Equestrian Estate Excellence
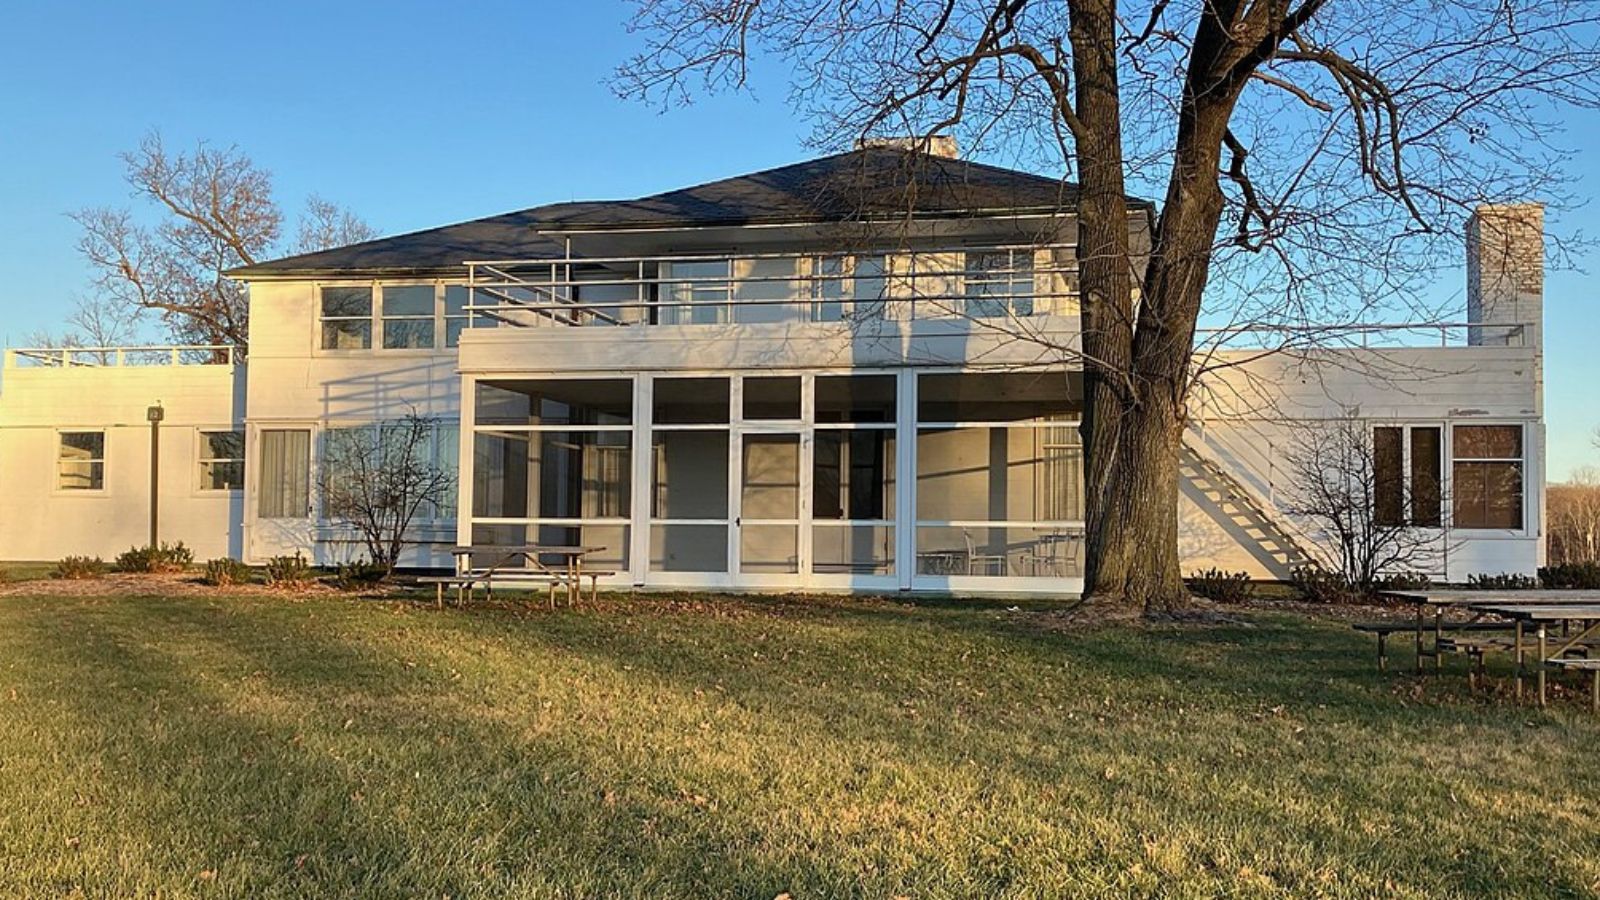
Situated in Lake County’s pristine landscape, Mettawa offers residents an exclusive equestrian-oriented lifestyle that combines rural estate living with modern luxury amenities. The community is renowned for its horse properties, expansive lots, and preserved natural areas that create a countryside atmosphere while maintaining convenient access to Chicago and the North Shore’s major employment centers. This unique positioning as Illinois’s premier equestrian community appeals to affluent buyers seeking both recreational opportunities and residential sophistication in a semi-rural setting that prioritizes privacy and space.
Market data demonstrates Mettawa’s transformation from a period of market adjustment to exceptional growth, with the recovery beginning in 2021 reflecting changing lifestyle preferences toward spacious, recreational properties following the pandemic. The outstanding performance since 2020, with values increasing over $320,000 in five years, suggests sustained market confidence in Mettawa’s unique equestrian lifestyle offering. Current median values approaching $953,000 position the community among Illinois’s most exclusive residential markets while delivering the equestrian amenities and estate lifestyle that define luxury rural-suburban living in the Chicago metropolitan area.
10. Riverwoods – 46.1% Home Price Increase Since 2010

- 2010: $654,743
- 2011: $605,159 (−$49,584, −7.57% from previous year)
- 2012: $602,326 (−$2,833, −0.47% from previous year)
- 2013: $654,662 (+$52,336, +8.69% from previous year)
- 2014: $706,598 (+$51,936, +7.93% from previous year)
- 2015: $711,073 (+$4,476, +0.63% from previous year)
- 2016: $724,003 (+$12,929, +1.82% from previous year)
- 2017: $717,765 (−$6,238, −0.86% from previous year)
- 2018: $707,805 (−$9,960, −1.39% from previous year)
- 2019: $686,731 (−$21,074, −2.98% from previous year)
- 2020: $651,628 (−$35,102, −5.11% from previous year)
- 2021: $723,596 (+$71,968, +11.04% from previous year)
- 2022: $813,229 (+$89,633, +12.39% from previous year)
- 2023: $838,008 (+$24,779, +3.05% from previous year)
- 2024: $897,695 (+$59,687, +7.12% from previous year)
- 2025: $956,811 (+$59,116, +6.59% from previous year)
Riverwoods’ current median home value of $956,811 reflects a 46.1% increase since 2010, with particularly impressive performance during the recent market cycle following a challenging period from 2017-2020. The community experienced consistent value erosion during those years, losing over 10% of its value, before staging a dramatic recovery with consecutive double-digit gains in 2021-2022. This exceptional rebound, combined with continued strong appreciation through 2025, has established Riverwoods among Illinois’s most exclusive residential communities with median values approaching $1 million.
Riverwoods – Forest Preserve Living
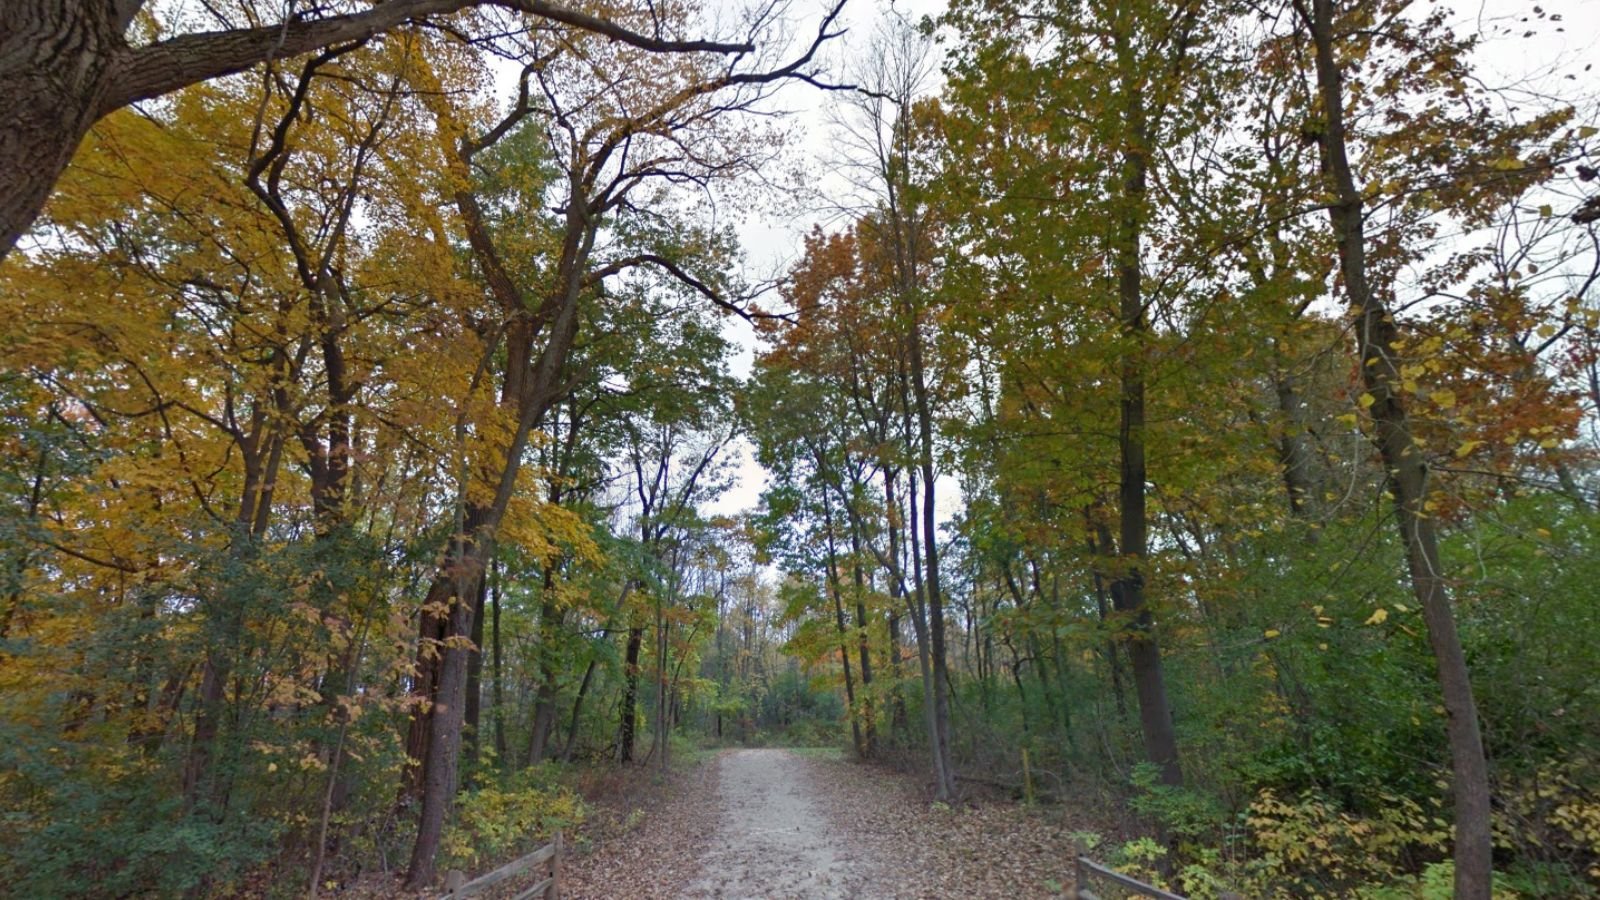
Nestled among pristine forest preserves in Lake County, Riverwoods offers residents an extraordinary lifestyle that combines natural beauty with upscale suburban amenities, creating one of Illinois’s most environmentally distinctive luxury communities. The village is surrounded by thousands of acres of protected forest land, including the Des Plaines River Trail system, providing residents with unparalleled access to hiking, biking, and nature recreation right outside their doors. This unique setting appeals to affluent buyers who prioritize both luxury living and environmental preservation in a community that successfully balances development with conservation.
Market performance demonstrates Riverwoods’ emergence as a premier destination for luxury nature-oriented living, with the exceptional recovery since 2020 reflecting increased appreciation for communities that offer both sophistication and environmental quality. The outstanding appreciation of over $305,000 in five years suggests sustained buyer confidence in Riverwoods’ unique market position. Current median values approaching $957,000 establish the community among Illinois’s most exclusive markets while delivering the natural amenities and privacy that increasingly drive luxury home purchases in the post-pandemic era.
9. Barrington Hills – 26.9% Home Price Increase Since 2010
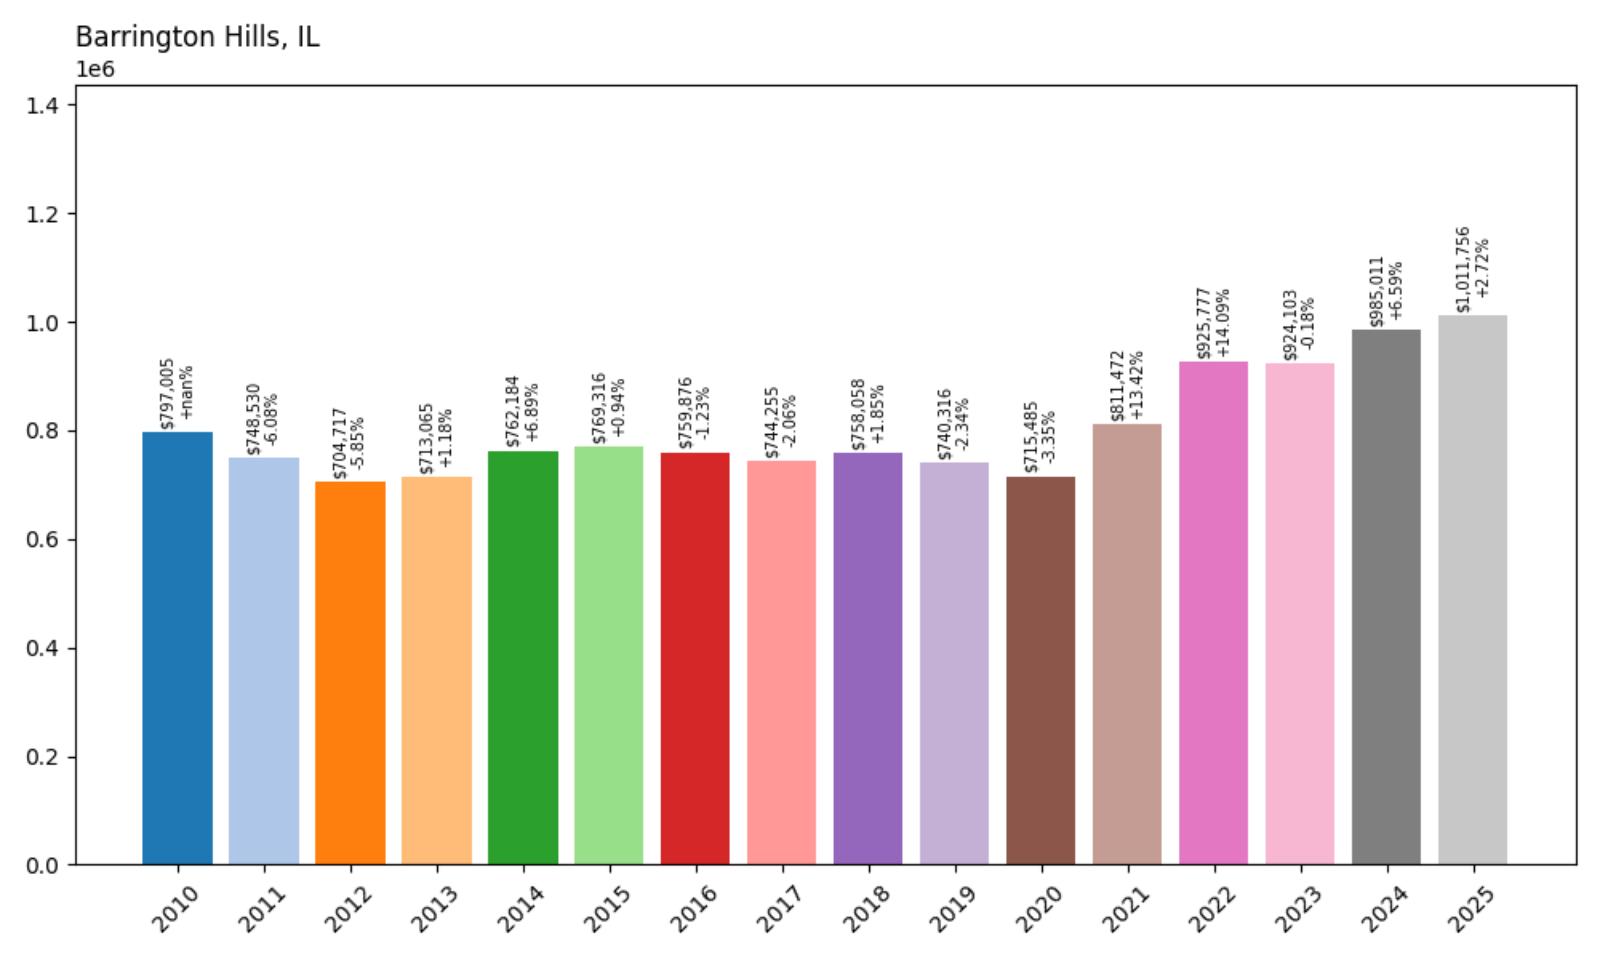
- 2010: $797,005
- 2011: $748,530 (−$48,475, −6.08% from previous year)
- 2012: $704,717 (−$43,812, −5.85% from previous year)
- 2013: $713,065 (+$8,347, +1.18% from previous year)
- 2014: $762,184 (+$49,120, +6.89% from previous year)
- 2015: $769,316 (+$7,131, +0.94% from previous year)
- 2016: $759,876 (−$9,439, −1.23% from previous year)
- 2017: $744,255 (−$15,621, −2.06% from previous year)
- 2018: $758,058 (+$13,803, +1.85% from previous year)
- 2019: $740,316 (−$17,742, −2.34% from previous year)
- 2020: $715,485 (−$24,831, −3.35% from previous year)
- 2021: $811,472 (+$95,987, +13.42% from previous year)
- 2022: $925,777 (+$114,304, +14.09% from previous year)
- 2023: $924,103 (−$1,674, −0.18% from previous year)
- 2024: $985,011 (+$60,908, +6.59% from previous year)
- 2025: $1,011,756 (+$26,745, +2.72% from previous year)
Barrington Hills’ median home value of $1,011,756 represents a modest 26.9% increase since 2010, reflecting the community’s higher starting values and more measured appreciation compared to other expensive Illinois markets. The community experienced extended stagnation and declines through 2020, losing nearly 10% of its value from peak levels, before staging an impressive recovery with exceptional gains in 2021-2022. This dramatic rebound has established Barrington Hills as the first community in our rankings to cross the $1 million median threshold, demonstrating its position among Illinois’s most exclusive residential markets.
Barrington Hills – Estate Living At Its Finest
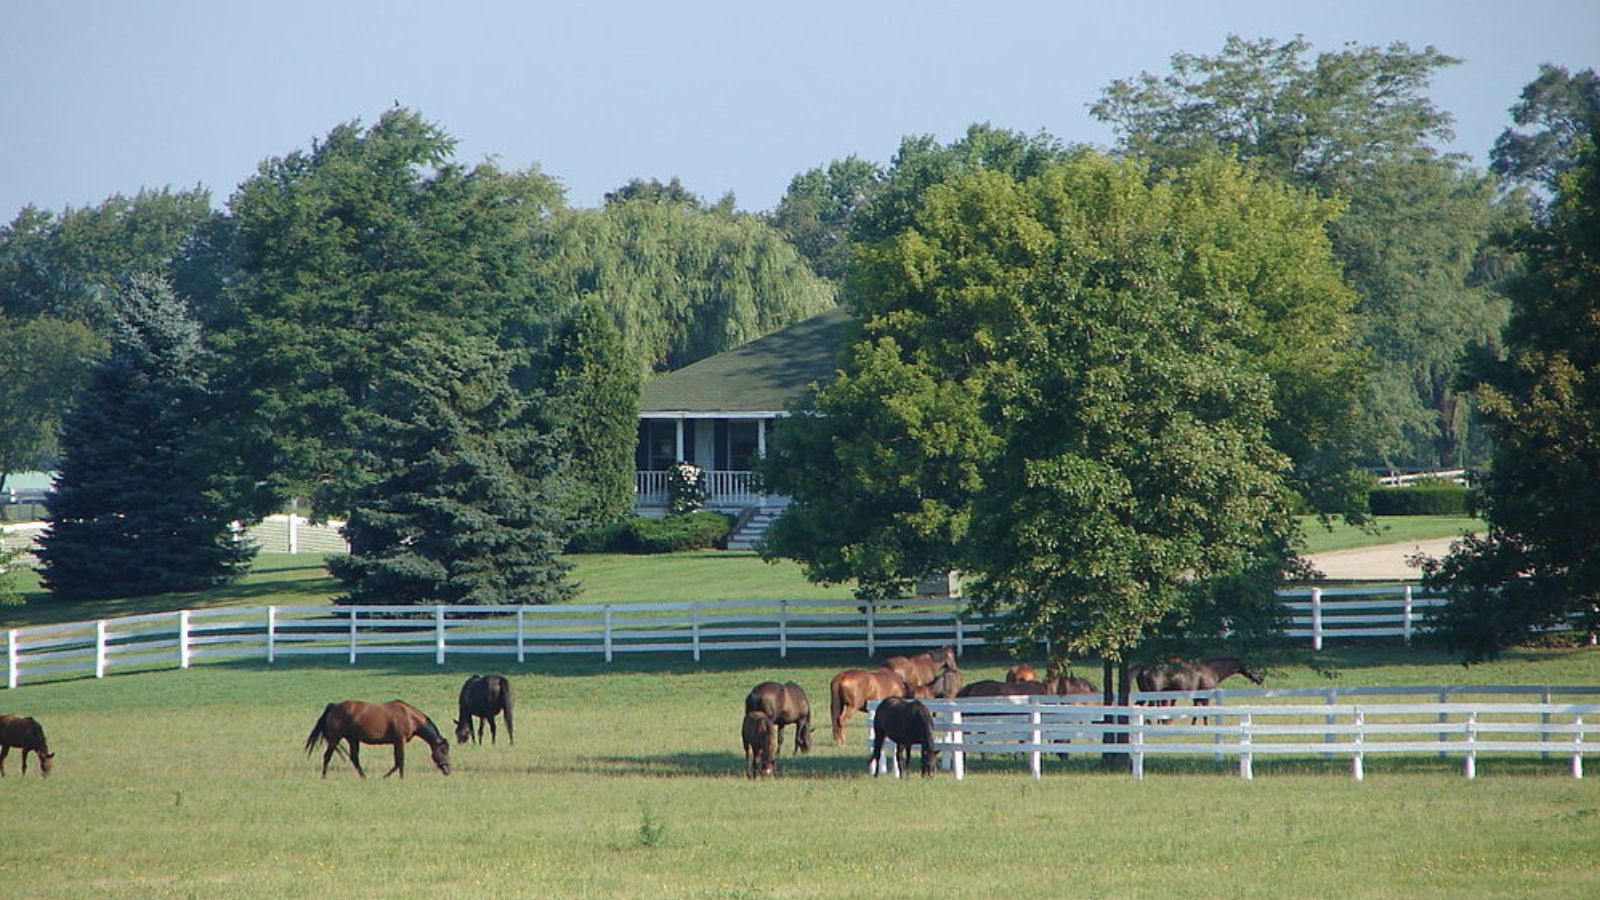
Located in Cook and Lake counties approximately 40 miles northwest of Chicago, Barrington Hills represents the pinnacle of rural estate living in the Chicago metropolitan area, offering residents expansive properties, equestrian facilities, and preserved natural landscapes that create a countryside atmosphere while maintaining urban accessibility. The village is renowned for its commitment to maintaining rural character through large-lot zoning requirements, with many properties spanning multiple acres and featuring custom estates, horse barns, and private recreational amenities. This exclusive rural lifestyle appeals to ultra-affluent buyers seeking maximum privacy, space, and recreational opportunities.
Market performance reflects Barrington Hills’ status as a luxury estate market that operates somewhat independently from broader suburban trends, with the recent recovery demonstrating renewed interest in rural luxury living following changing lifestyle preferences. The exceptional gains since 2020, with values increasing over $296,000 in five years, suggest sustained demand from buyers seeking the ultimate in private estate living. Current median values exceeding $1 million establish Barrington Hills among Illinois’s most exclusive communities while offering the space, privacy, and rural amenities that define the highest level of luxury residential living in the state.
8. South Barrington – 19.7% Home Price Increase Since 2010
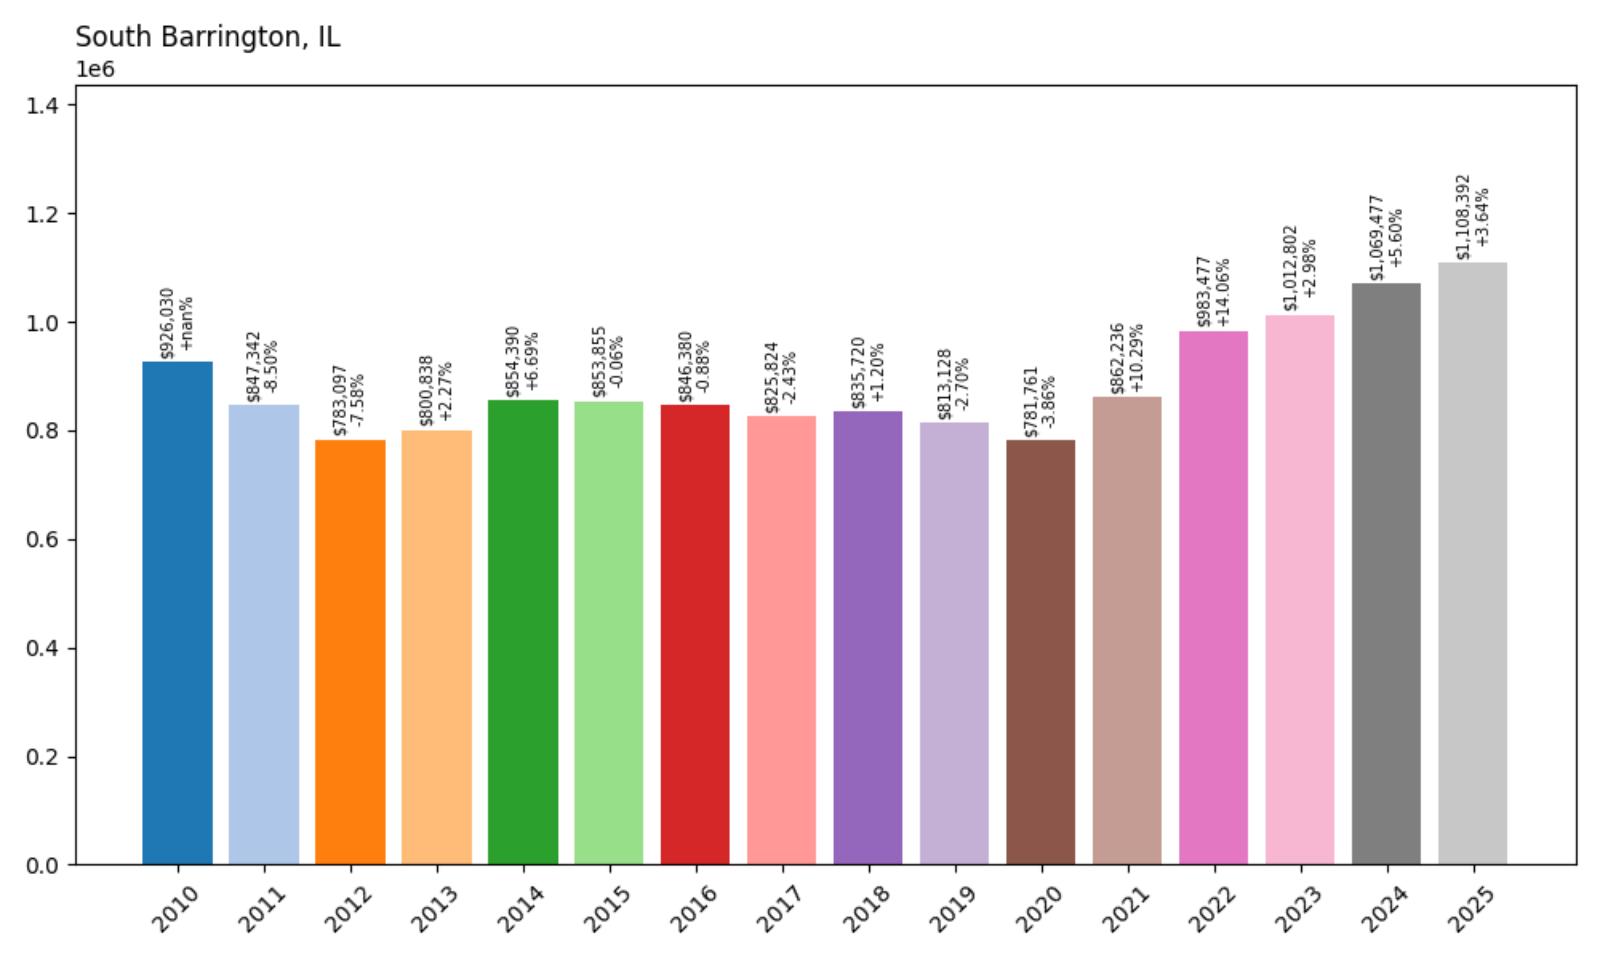
- 2010: $926,030
- 2011: $847,342 (−$78,689, −8.50% from previous year)
- 2012: $783,097 (−$64,244, −7.58% from previous year)
- 2013: $800,838 (+$17,741, +2.27% from previous year)
- 2014: $854,390 (+$53,551, +6.69% from previous year)
- 2015: $853,855 (−$535, −0.06% from previous year)
- 2016: $846,380 (−$7,474, −0.88% from previous year)
- 2017: $825,824 (−$20,556, −2.43% from previous year)
- 2018: $835,720 (+$9,896, +1.20% from previous year)
- 2019: $813,128 (−$22,592, −2.70% from previous year)
- 2020: $781,761 (−$31,367, −3.86% from previous year)
- 2021: $862,236 (+$80,475, +10.29% from previous year)
- 2022: $983,477 (+$121,242, +14.06% from previous year)
- 2023: $1,012,802 (+$29,325, +2.98% from previous year)
- 2024: $1,069,477 (+$56,675, +5.60% from previous year)
- 2025: $1,108,392 (+$38,915, +3.64% from previous year)
South Barrington’s median home value of $1,108,392 represents a modest 19.7% increase since 2010, reflecting the community’s exceptionally high starting values and the challenges faced by ultra-luxury markets during various economic cycles. The community experienced significant declines through 2020, losing over 15% of its value from 2010 levels, before staging one of the most dramatic recoveries in Illinois real estate history. The exceptional rebound since 2021, with values increasing over $326,000 in four years, has established South Barrington firmly in the exclusive seven-figure median home value category.
South Barrington – Corporate Executive Haven
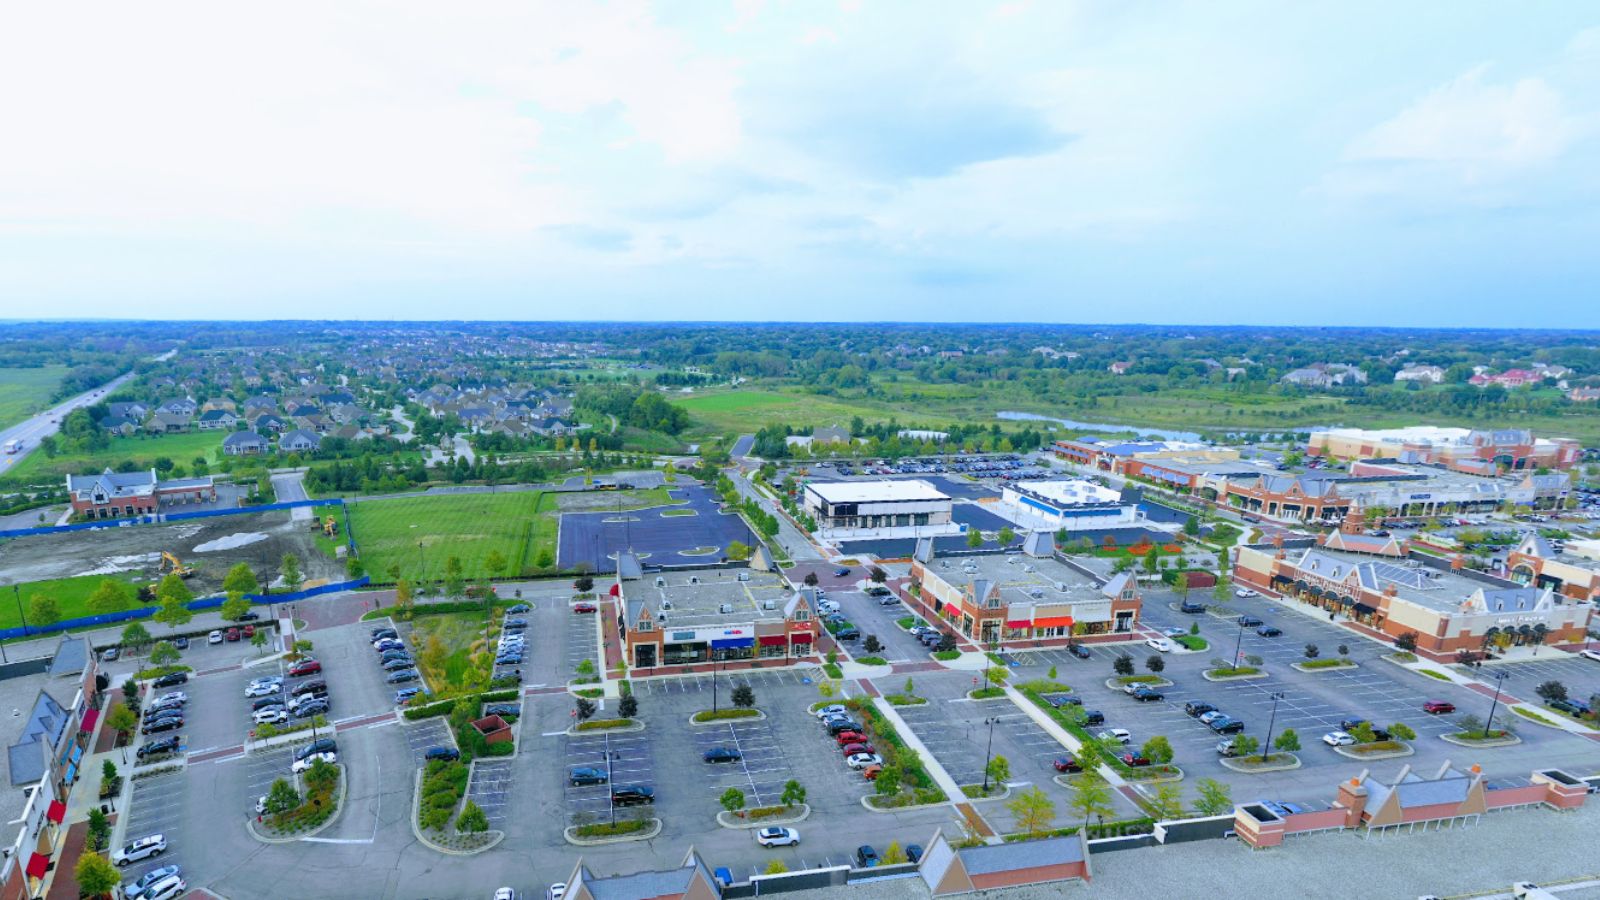
Strategically positioned in Cook County’s northwest corridor, South Barrington offers residents an exclusive suburban lifestyle that combines luxury residential living with proximity to major corporate headquarters and business centers. The community is particularly renowned for housing executives from nearby Fortune 500 companies, creating a concentration of affluent professionals who value both residential sophistication and business convenience. This executive-oriented character, combined with custom homes on large lots and championship recreational facilities, appeals to business leaders seeking the highest level of suburban luxury while maintaining short commutes to major employment centers.
Market performance demonstrates South Barrington’s resilience as an ultra-luxury market, with the dramatic recovery since 2020 reflecting renewed confidence among high-net-worth buyers in the community’s executive appeal and lifestyle amenities. The exceptional appreciation of over 40% in just four years suggests sustained demand from affluent buyers who prioritize both luxury living and business convenience. Current median values exceeding $1.1 million position South Barrington among Illinois’s most exclusive communities while offering the corporate proximity and executive amenities that define the highest tier of suburban luxury living.
7. Lake Forest – 40.0% Home Price Increase Since 2010
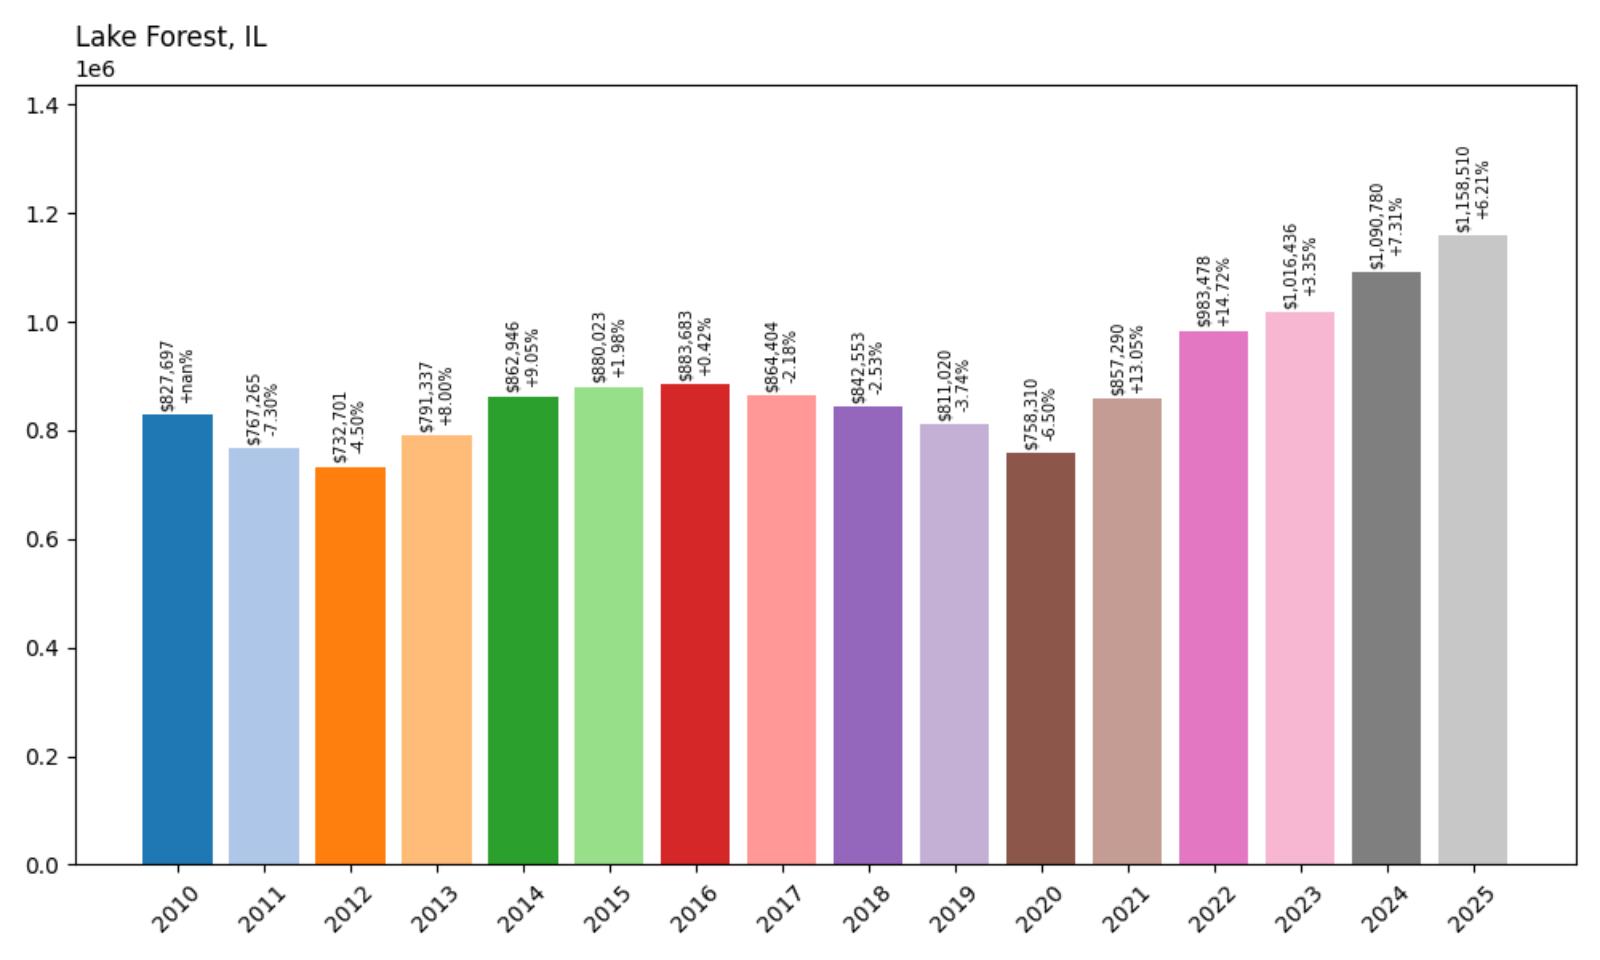
- 2010: $827,697
- 2011: $767,265 (−$60,433, −7.30% from previous year)
- 2012: $732,701 (−$34,564, −4.50% from previous year)
- 2013: $791,337 (+$58,636, +8.00% from previous year)
- 2014: $862,946 (+$71,609, +9.05% from previous year)
- 2015: $880,023 (+$17,077, +1.98% from previous year)
- 2016: $883,683 (+$3,660, +0.42% from previous year)
- 2017: $864,404 (−$19,280, −2.18% from previous year)
- 2018: $842,553 (−$21,851, −2.53% from previous year)
- 2019: $811,020 (−$31,533, −3.74% from previous year)
- 2020: $758,310 (−$52,710, −6.50% from previous year)
- 2021: $857,290 (+$98,980, +13.05% from previous year)
- 2022: $983,478 (+$126,188, +14.72% from previous year)
- 2023: $1,016,436 (+$32,959, +3.35% from previous year)
- 2024: $1,090,780 (+$74,343, +7.31% from previous year)
- 2025: $1,158,510 (+$67,730, +6.21% from previous year)
Lake Forest’s current median home value of $1,158,510 represents a solid 40.0% increase since 2010, with particularly impressive performance during the recent market cycle following a challenging period from 2017-2020. The community experienced significant value erosion during those years, losing over 14% of its value, before staging one of the most dramatic recoveries among North Shore communities. The exceptional rebound since 2021, with consecutive double-digit gains bringing values to historic highs, has firmly established Lake Forest among Illinois’s most exclusive seven-figure markets.
Lake Forest – North Shore Prestige Redefined
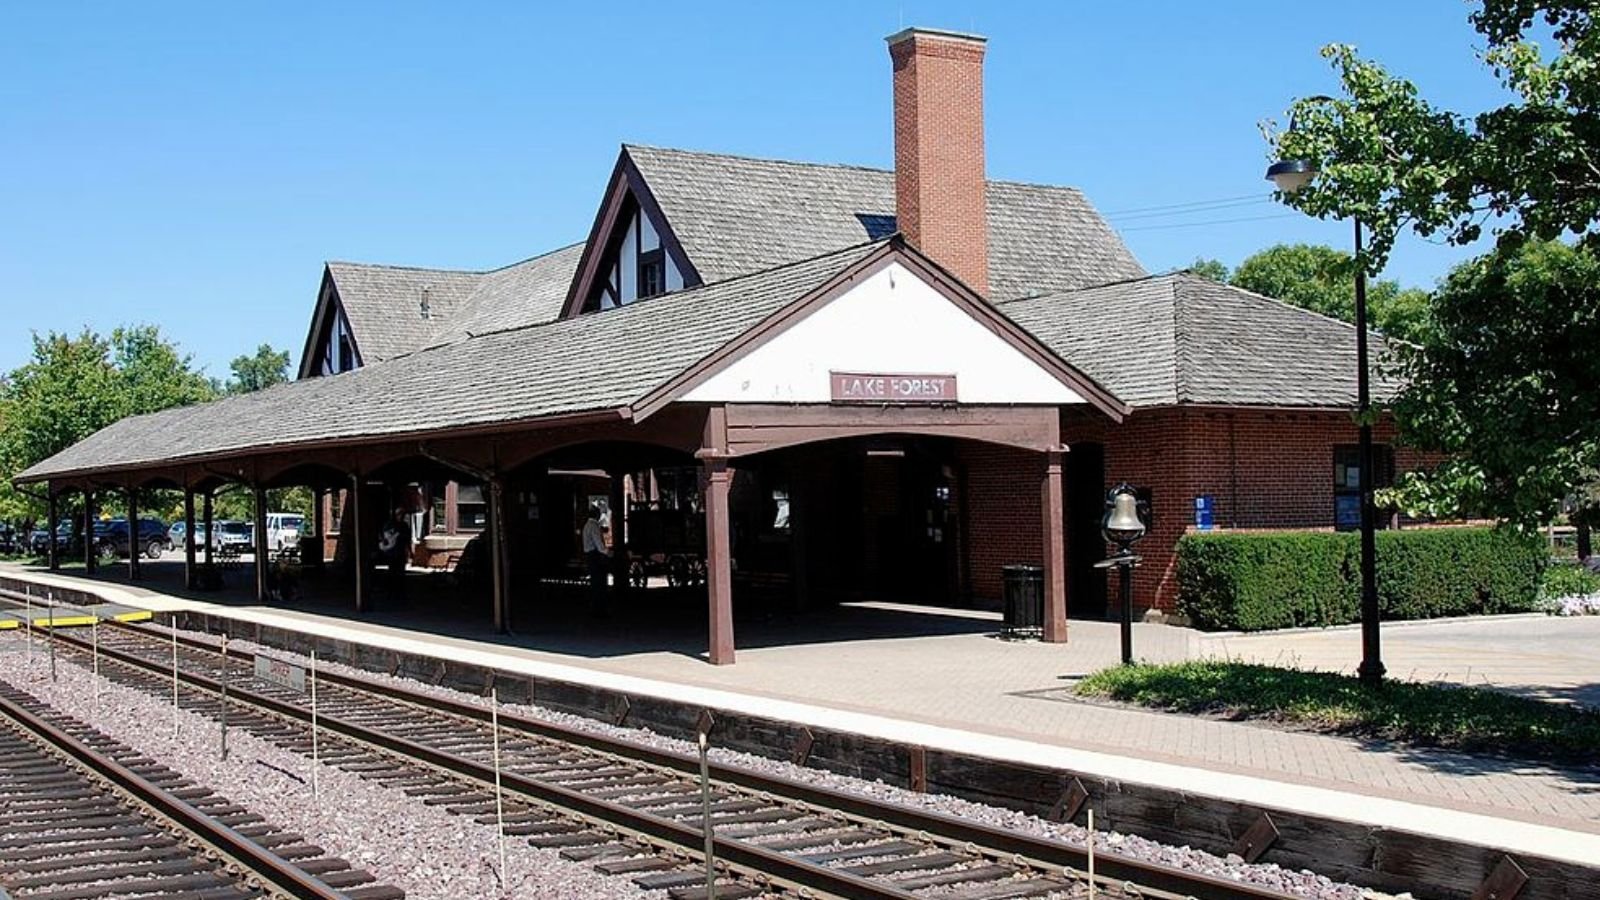
Situated along Lake Michigan’s pristine shoreline in Lake County, Lake Forest represents the historic heart of North Shore prestige, combining century-old traditions of wealth and sophistication with modern luxury amenities. The city is renowned for its magnificent lakefront estates, tree-lined streets designed by Frederick Law Olmsted, and architectural treasures that include some of the Midwest’s most significant historic mansions. This combination of natural beauty, architectural heritage, and cultural sophistication creates one of America’s most distinguished residential communities, consistently attracting buyers who value both luxury and legacy.
Market performance demonstrates Lake Forest’s resilience and enduring appeal as one of Illinois’s premier luxury destinations, with the remarkable recovery since 2020 reflecting renewed confidence in the community’s fundamental strengths and historic prestige. The exceptional appreciation of over $400,000 in just four years suggests Lake Forest has regained its competitive position among America’s most desirable suburban communities. Current median values exceeding $1.15 million represent the premium associated with North Shore legacy while delivering the lakefront lifestyle, educational excellence, and cultural sophistication that have defined Lake Forest for over a century.
6. Hinsdale – 29.6% Home Price Increase Since 2010
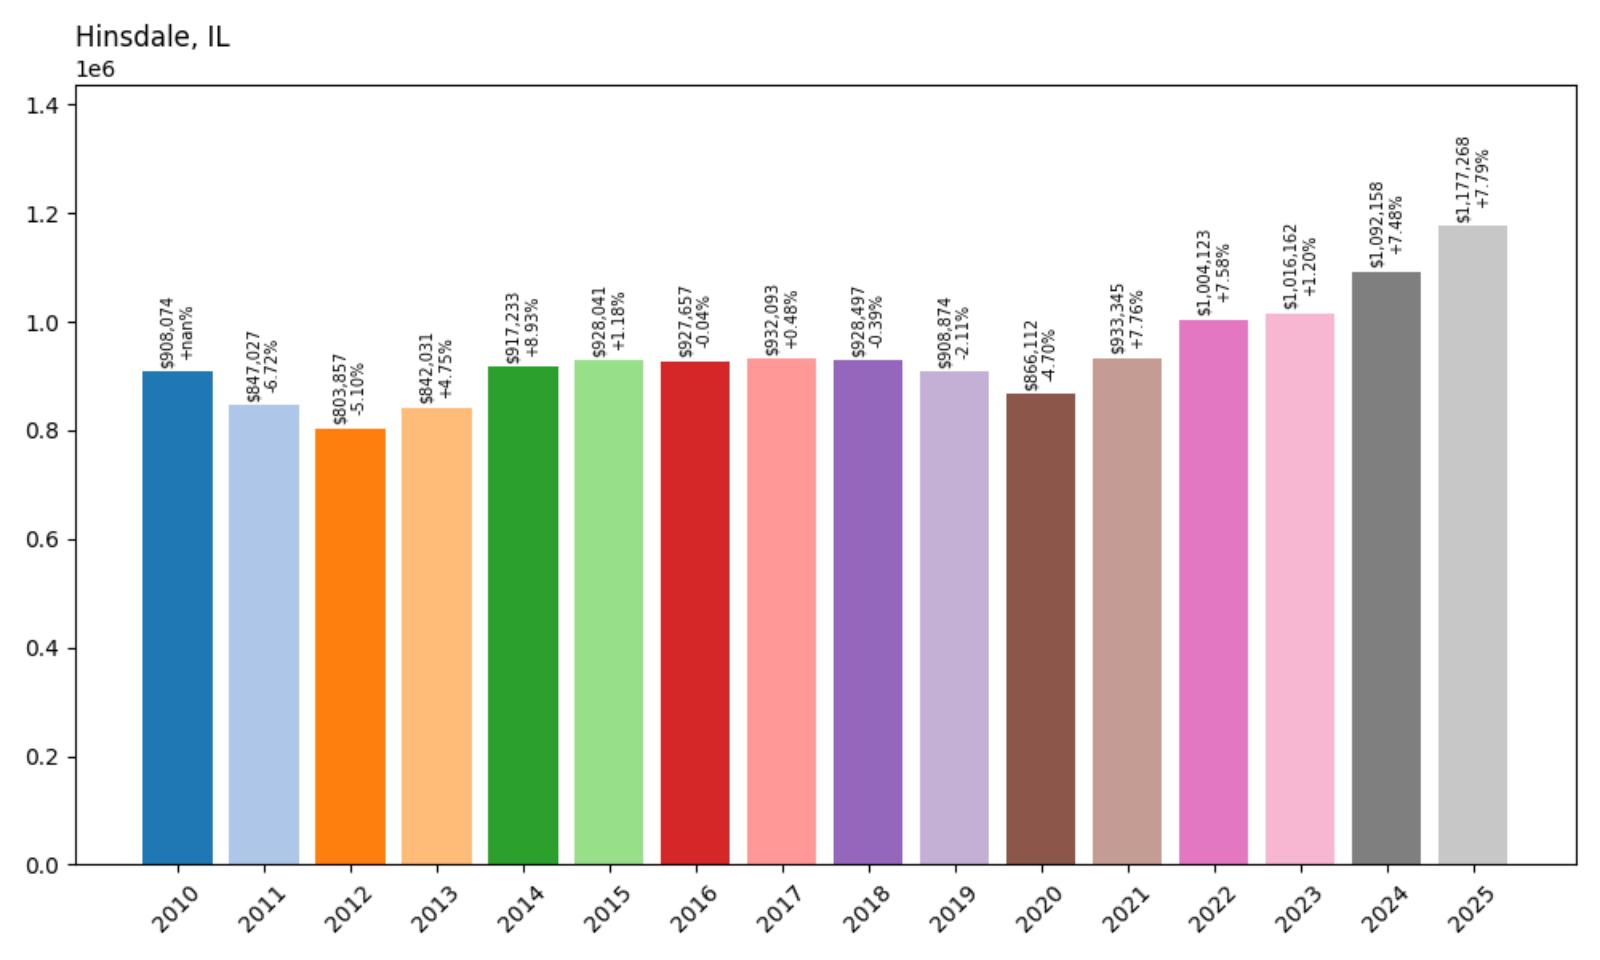
- 2010: $908,074
- 2011: $847,027 (−$61,047, −6.72% from previous year)
- 2012: $803,857 (−$43,170, −5.10% from previous year)
- 2013: $842,031 (+$38,174, +4.75% from previous year)
- 2014: $917,233 (+$75,201, +8.93% from previous year)
- 2015: $928,041 (+$10,809, +1.18% from previous year)
- 2016: $927,657 (−$384, −0.04% from previous year)
- 2017: $932,093 (+$4,436, +0.48% from previous year)
- 2018: $928,497 (−$3,596, −0.39% from previous year)
- 2019: $908,874 (−$19,624, −2.11% from previous year)
- 2020: $866,112 (−$42,762, −4.70% from previous year)
- 2021: $933,345 (+$67,233, +7.76% from previous year)
- 2022: $1,004,123 (+$70,778, +7.58% from previous year)
- 2023: $1,016,162 (+$12,039, +1.20% from previous year)
- 2024: $1,092,158 (+$75,996, +7.48% from previous year)
- 2025: $1,177,268 (+$85,110, +7.79% from previous year)
Hinsdale’s median home value of $1,177,268 represents a modest 29.6% increase since 2010, reflecting the community’s exceptionally high starting values and the measured appreciation typical of established luxury markets. The community experienced relatively minor declines during economic downturns, losing about 4.7% during the 2020 period, before demonstrating steady recovery with consistent gains. The impressive 7.79% increase in 2025 continues an upward trajectory that has brought values to historic highs, establishing Hinsdale’s position among Illinois’s most expensive residential communities.
Hinsdale – Western Suburbs Royalty
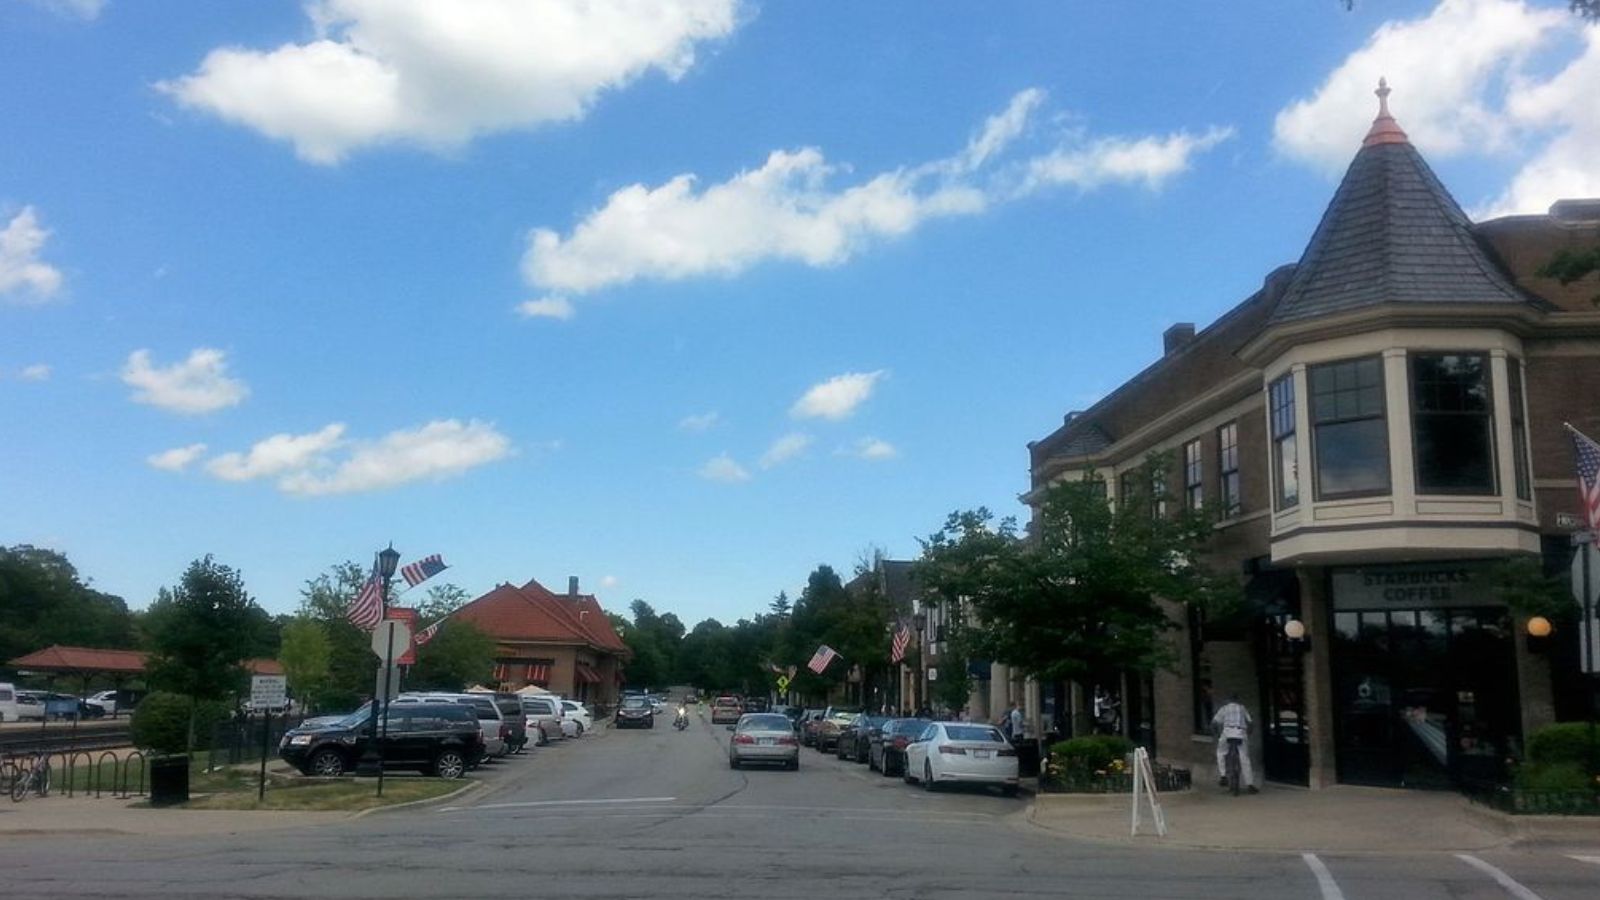
Located in DuPage County just 20 miles west of downtown Chicago, Hinsdale represents the pinnacle of western suburbs luxury living, combining historic elegance with modern sophistication in one of Illinois’s most prestigious residential communities. The village is renowned for its tree-lined streets, magnificent historic homes, and meticulously maintained neighborhoods that create an atmosphere of refined elegance. Hinsdale’s reputation is anchored by its exceptional municipal services, world-class recreational facilities including the exclusive Hinsdale Golf Club, and a charming downtown district that features upscale shopping and dining establishments catering to discerning residents.
Market performance reflects Hinsdale’s status as one of Illinois’s most stable and desirable luxury markets, with consistent appreciation that demonstrates the community’s enduring appeal to affluent buyers who prioritize educational excellence and community prestige. The steady growth pattern, with minimal volatility during challenging periods, indicates strong underlying demand from buyers who view Hinsdale as a long-term residential investment. Current median values exceeding $1.17 million represent the premium associated with western suburbs royalty while delivering the educational excellence, community amenities, and residential quality that have made Hinsdale synonymous with suburban luxury for over a century.
5. Golf – 54.7% Home Price Increase Since 2010
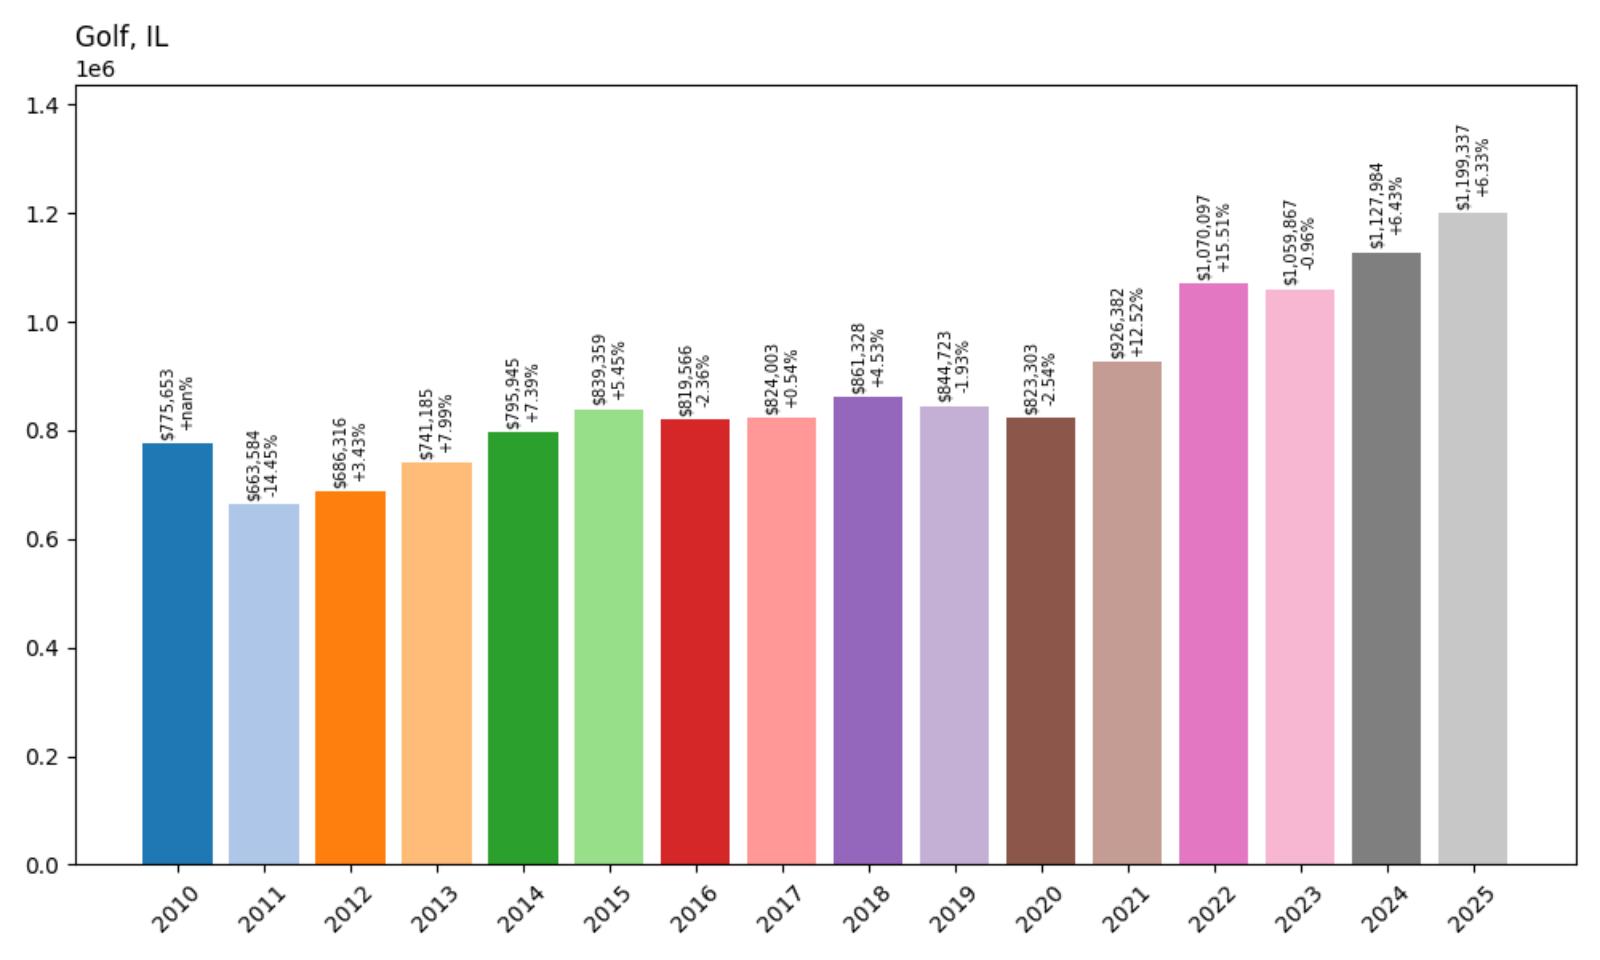
- 2010: $775,653
- 2011: $663,584 (−$112,069, −14.45% from previous year)
- 2012: $686,316 (+$22,732, +3.43% from previous year)
- 2013: $741,185 (+$54,869, +7.99% from previous year)
- 2014: $795,945 (+$54,760, +7.39% from previous year)
- 2015: $839,359 (+$43,414, +5.45% from previous year)
- 2016: $819,566 (−$19,793, −2.36% from previous year)
- 2017: $824,003 (+$4,437, +0.54% from previous year)
- 2018: $861,328 (+$37,326, +4.53% from previous year)
- 2019: $844,723 (−$16,606, −1.93% from previous year)
- 2020: $823,303 (−$21,419, −2.54% from previous year)
- 2021: $926,382 (+$103,079, +12.52% from previous year)
- 2022: $1,070,097 (+$143,715, +15.51% from previous year)
- 2023: $1,059,867 (−$10,231, −0.96% from previous year)
- 2024: $1,127,984 (+$68,117, +6.43% from previous year)
- 2025: $1,199,337 (+$71,354, +6.33% from previous year)
Golf’s current median home value of $1,199,337 represents an impressive 54.7% increase since 2010, with particularly exceptional performance during the recent market cycle. After experiencing a significant decline in 2011 that reduced values by over 14%, the community showed steady recovery through the decade before staging a dramatic surge during 2021-2022. The remarkable 15.51% increase in 2022 was among the highest recorded in Illinois that year, demonstrating Golf’s emergence as one of the state’s most dynamic luxury markets and establishing it firmly in the exclusive seven-figure median home value category.
Golf – Exclusive North Shore Enclave
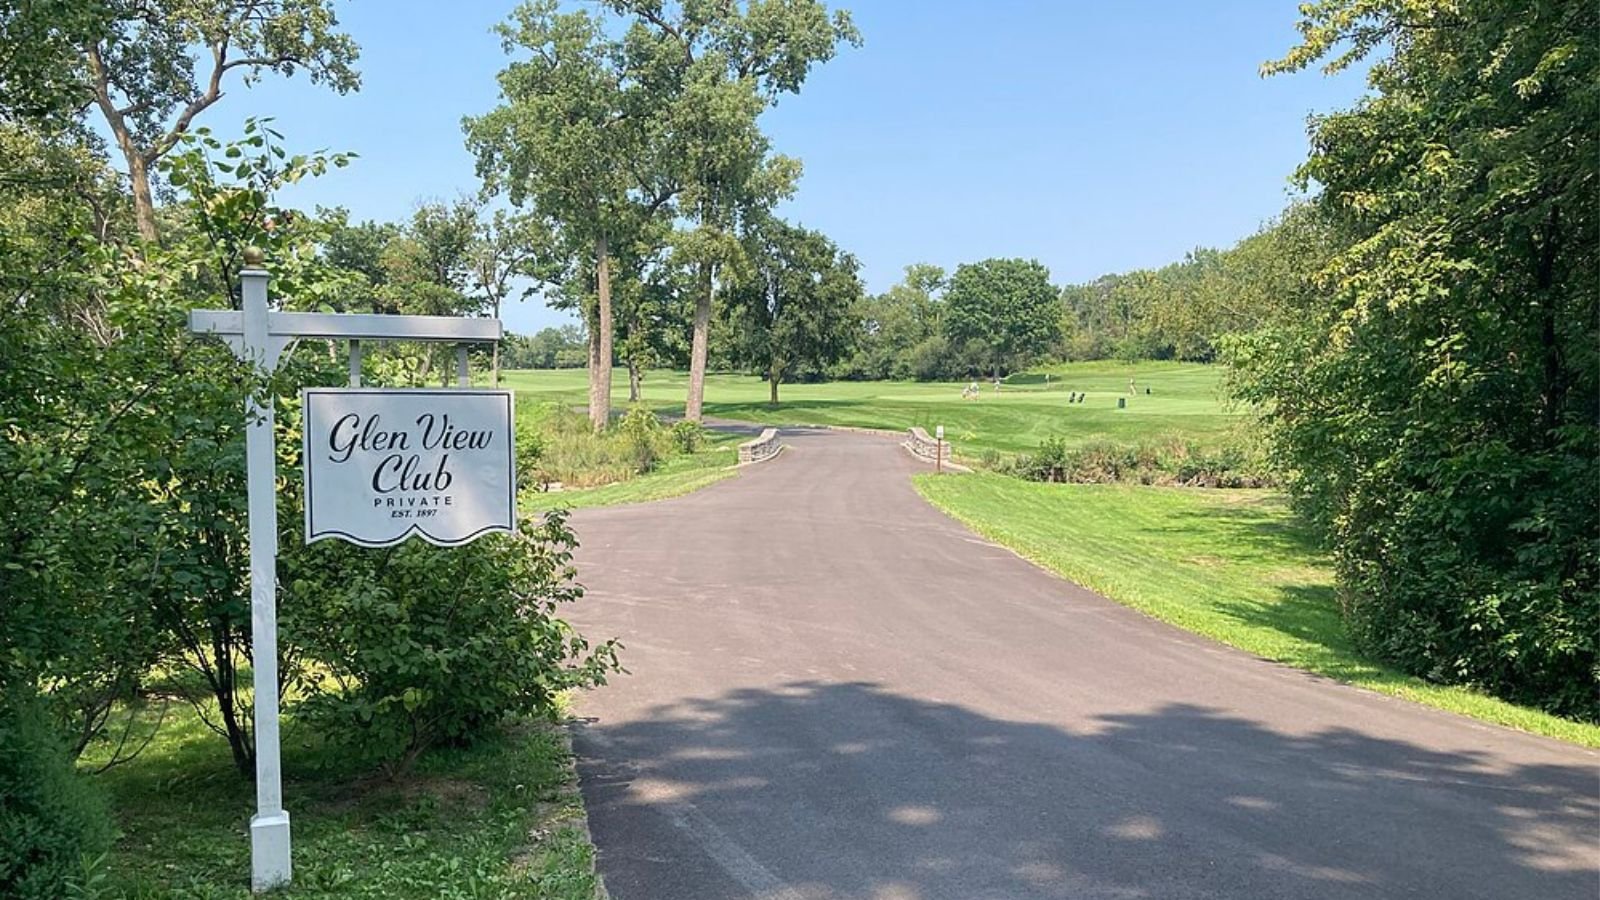
Situated in Cook County along the prestigious North Shore corridor, Golf represents one of Illinois’s most exclusive and tightly-knit residential communities, characterized by its small size, custom estates, and commitment to maintaining an intimate, private atmosphere. The village encompasses just over one square mile and maintains a population of fewer than 500 residents, creating an extraordinarily exclusive environment where neighbors know each other and community character is carefully preserved. This intimate scale, combined with large residential lots and architectural controls, appeals to ultra-affluent buyers seeking maximum privacy and exclusivity while remaining connected to Chicago’s economic and cultural opportunities.
Market performance demonstrates Golf’s emergence as a premier destination for ultra-luxury living, with the exceptional gains since 2020 reflecting increased demand from buyers seeking the ultimate in exclusive residential experiences. The outstanding appreciation of over $376,000 in just four years suggests sustained interest from ultra-high-net-worth individuals who value Golf’s unique combination of exclusivity, privacy, and North Shore prestige. Current median values approaching $1.2 million establish Golf among Illinois’s most expensive communities while offering the intimate scale and exclusive character that define the highest level of luxury residential living in the Chicago area.
4. Bannockburn – 37.3% Home Price Increase Since 2010
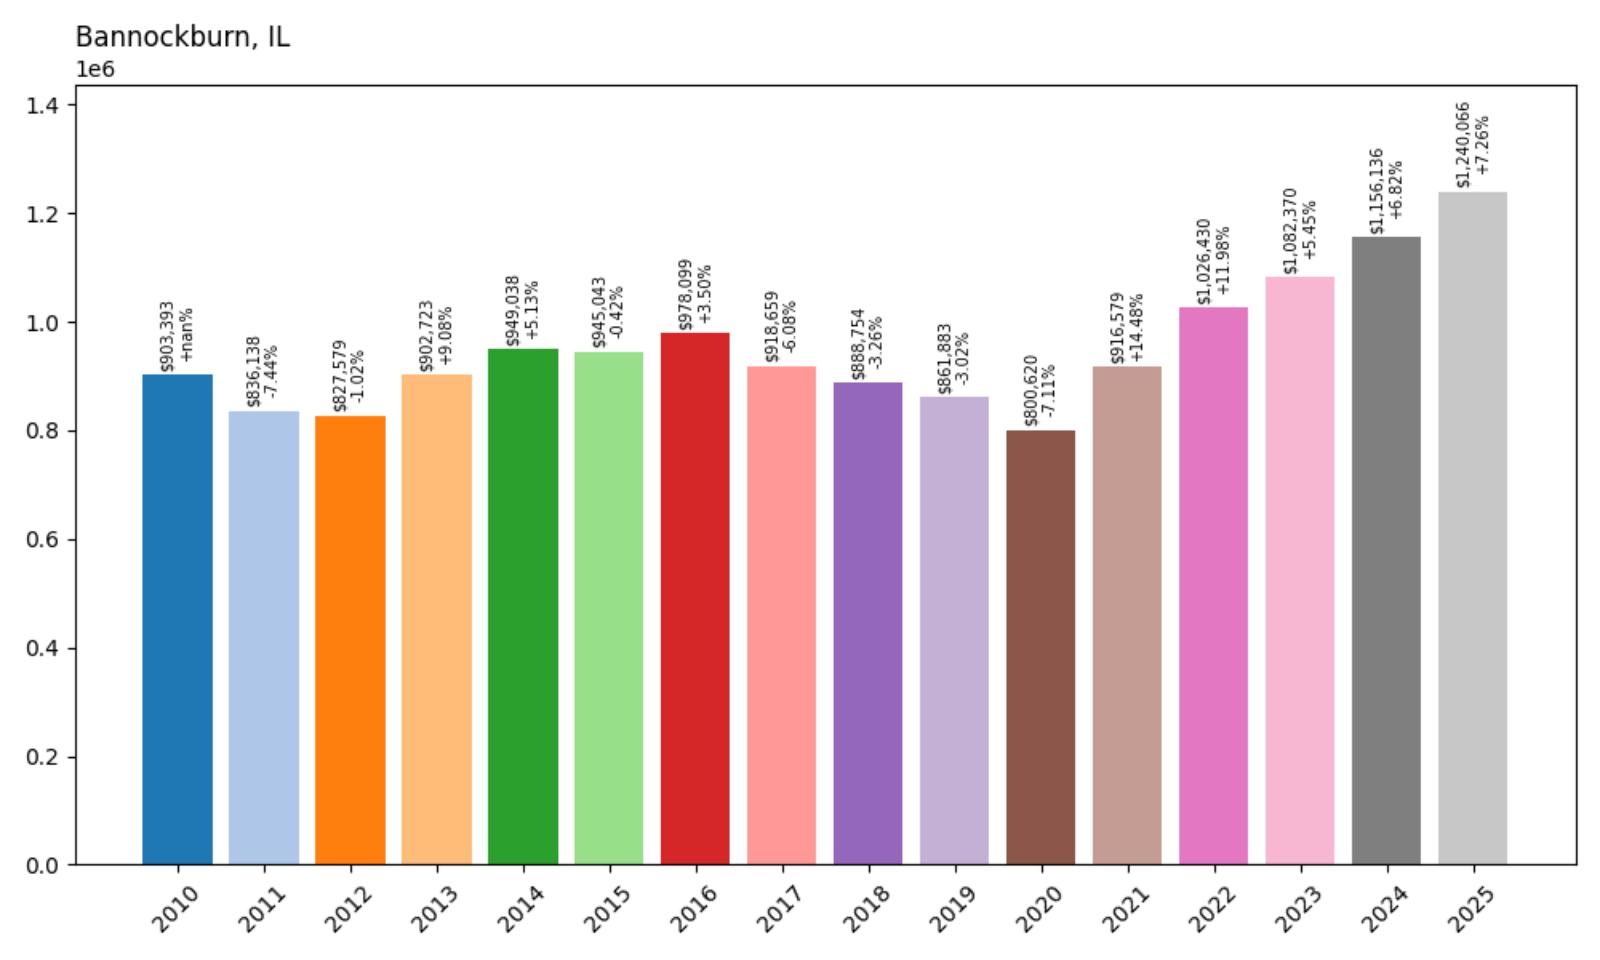
- 2010: $903,393
- 2011: $836,138 (−$67,255, −7.44% from previous year)
- 2012: $827,579 (−$8,559, −1.02% from previous year)
- 2013: $902,723 (+$75,145, +9.08% from previous year)
- 2014: $949,038 (+$46,314, +5.13% from previous year)
- 2015: $945,043 (−$3,995, −0.42% from previous year)
- 2016: $978,099 (+$33,056, +3.50% from previous year)
- 2017: $918,659 (−$59,440, −6.08% from previous year)
- 2018: $888,754 (−$29,905, −3.26% from previous year)
- 2019: $861,883 (−$26,871, −3.02% from previous year)
- 2020: $800,620 (−$61,263, −7.11% from previous year)
- 2021: $916,579 (+$115,959, +14.48% from previous year)
- 2022: $1,026,430 (+$109,851, +11.98% from previous year)
- 2023: $1,082,370 (+$55,940, +5.45% from previous year)
- 2024: $1,156,136 (+$73,766, +6.82% from previous year)
- 2025: $1,240,066 (+$83,930, +7.26% from previous year)
Bannockburn’s median home value of $1,240,066 represents a 37.3% increase since 2010, with remarkable performance during the recent market cycle following a challenging period from 2017-2020. The community experienced significant value erosion during those years, losing over 18% of its value, before staging one of the most dramatic recoveries in Illinois real estate history. The exceptional rebound since 2021, with values increasing over $439,000 in four years, has established Bannockburn firmly among Illinois’s most exclusive seven-figure markets and demonstrates the community’s underlying strength and appeal to ultra-affluent buyers.
Bannockburn – Corporate Executive Paradise
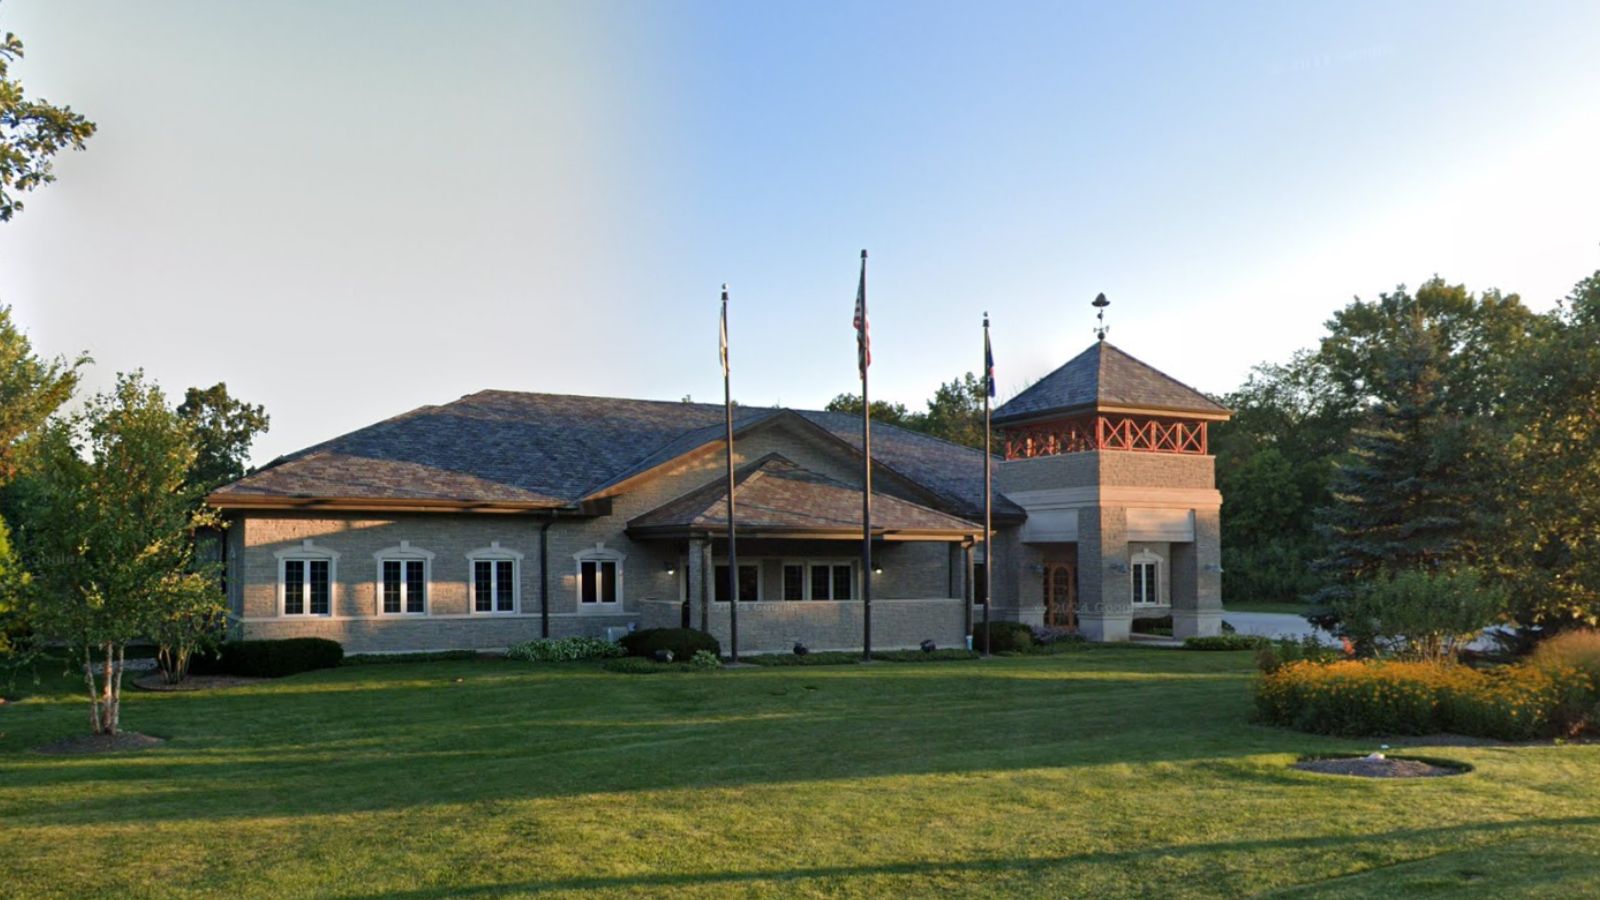
Strategically positioned in Lake County’s premier corporate corridor, Bannockburn offers residents an unparalleled combination of luxury residential living and proximity to major business centers, making it the preferred address for C-suite executives and senior professionals throughout the Chicago metropolitan area. The village is surrounded by Fortune 500 corporate headquarters and serves as home to many of the region’s most influential business leaders, creating a concentration of wealth and influence that supports exceptional property values and community amenities. This executive-oriented character, combined with custom estates on expansive lots and world-class recreational facilities, appeals to business leaders who demand the highest level of residential luxury while maintaining convenient access to major employment centers.
Market performance demonstrates Bannockburn’s resilience as an ultra-luxury executive market, with the dramatic recovery since 2020 reflecting renewed confidence among high-net-worth buyers in the community’s unique value proposition combining corporate convenience and residential excellence. The exceptional appreciation of over 50% in just four years suggests sustained demand from affluent executives who prioritize both luxury living and business accessibility. Current median values exceeding $1.24 million position Bannockburn among Illinois’s most exclusive communities while offering the corporate proximity and executive amenities that define the highest tier of suburban luxury living for business professionals.
3. Glencoe – 49.2% Home Price Increase Since 2010
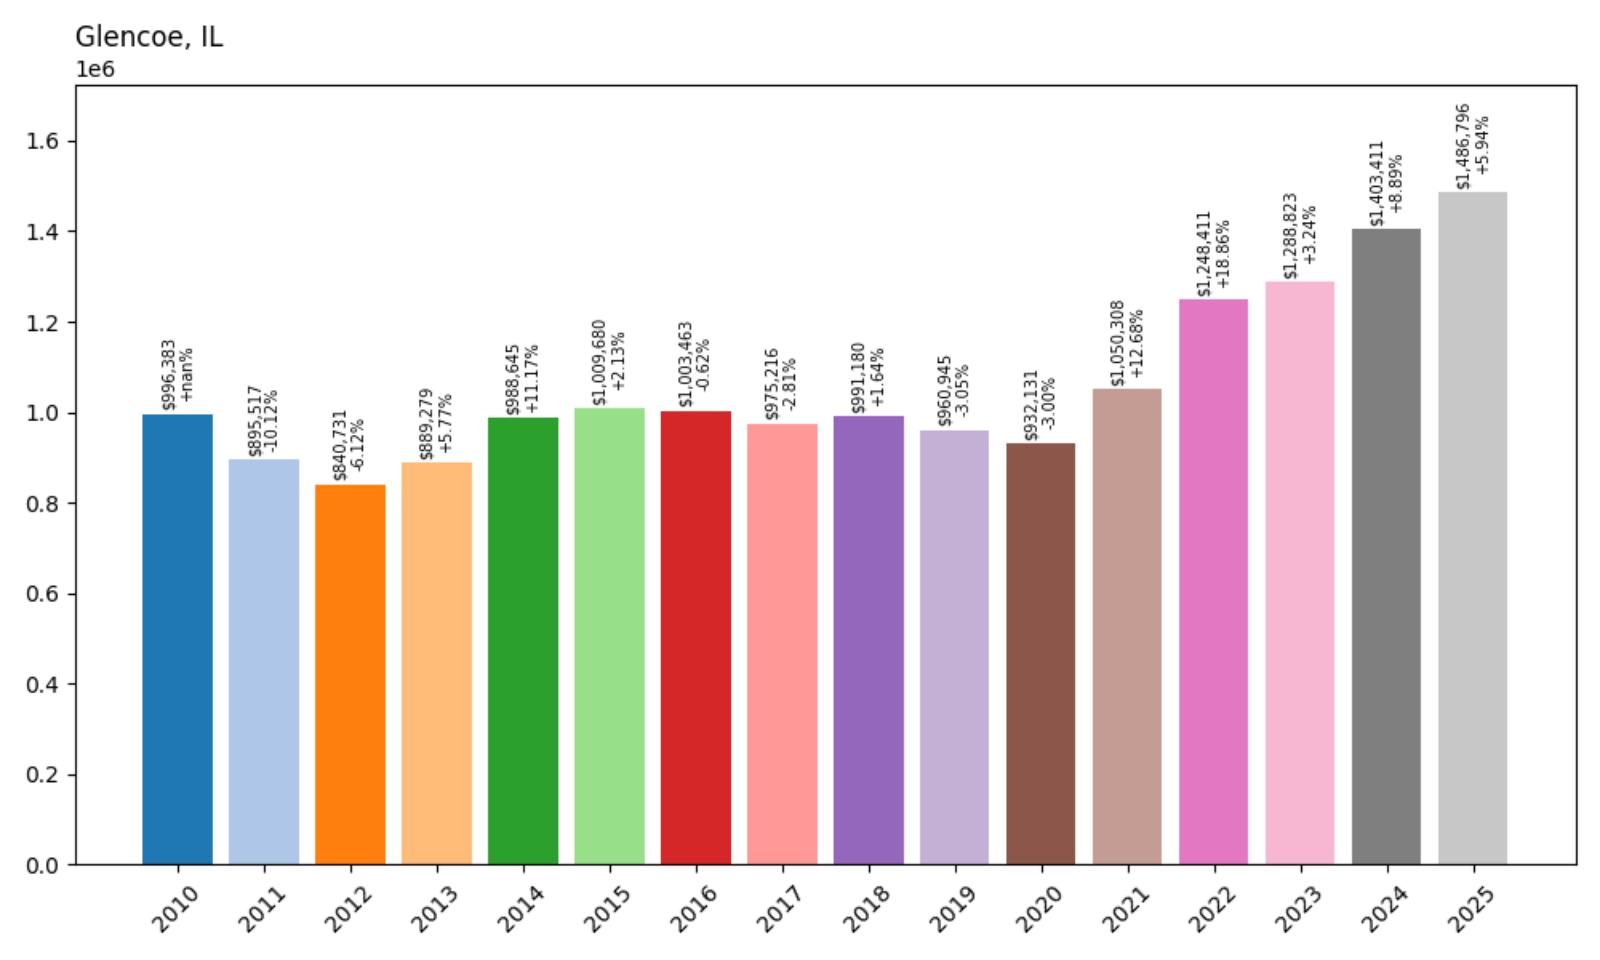
- 2010: $996,383
- 2011: $895,517 (−$100,866, −10.12% from previous year)
- 2012: $840,731 (−$54,786, −6.12% from previous year)
- 2013: $889,279 (+$48,548, +5.77% from previous year)
- 2014: $988,645 (+$99,367, +11.17% from previous year)
- 2015: $1,009,680 (+$21,035, +2.13% from previous year)
- 2016: $1,003,463 (−$6,218, −0.62% from previous year)
- 2017: $975,216 (−$28,247, −2.81% from previous year)
- 2018: $991,180 (+$15,965, +1.64% from previous year)
- 2019: $960,945 (−$30,236, −3.05% from previous year)
- 2020: $932,131 (−$28,813, −3.00% from previous year)
- 2021: $1,050,308 (+$118,176, +12.68% from previous year)
- 2022: $1,248,411 (+$198,104, +18.86% from previous year)
- 2023: $1,288,823 (+$40,412, +3.24% from previous year)
- 2024: $1,403,411 (+$114,588, +8.89% from previous year)
- 2025: $1,486,796 (+$83,385, +5.94% from previous year)
Glencoe’s current median home value of $1,486,796 represents a solid 49.2% increase since 2010, with extraordinary performance during the recent market cycle that has established it among Illinois’s most exclusive residential communities. After experiencing moderate declines through 2020, the community staged one of the most impressive recoveries in North Shore history, highlighted by an exceptional 18.86% surge in 2022 that represented one of the largest single-year gains among Illinois luxury markets. This dramatic rebound, followed by continued strong appreciation, has propelled Glencoe into the exclusive tier of communities with median home values approaching $1.5 million.
Glencoe – North Shore Sophistication Personified
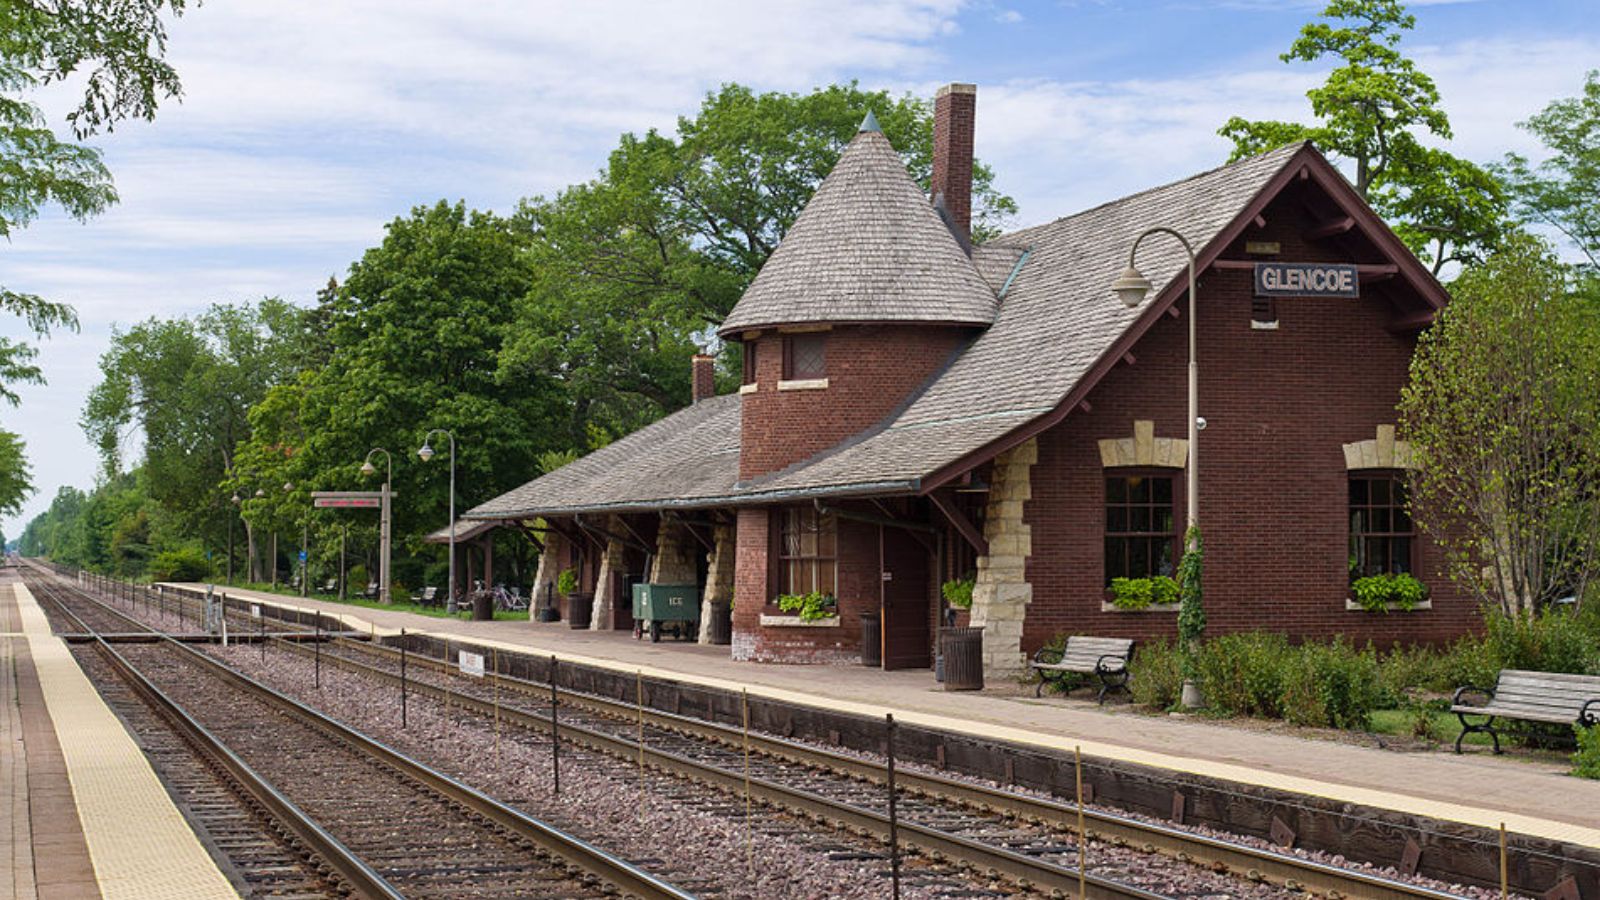
User:JeremyA, CC BY-SA 3.0, via Wikimedia Commons
Positioned along Lake Michigan’s pristine shoreline in Cook County, Glencoe represents the epitome of North Shore sophistication and cultural refinement, combining natural beauty with architectural distinction and educational excellence that has attracted Chicago’s most prominent families for over a century. The village is renowned for its magnificent lakefront parks, including the scenic Glencoe Beach and extensive ravine system that provides residents with unique natural beauty and recreational opportunities rarely found in suburban communities. This combination of lakefront living, preserved natural areas, and historic neighborhoods creates one of America’s most distinguished residential environments, consistently attracting buyers who value both luxury and cultural sophistication.
Market performance demonstrates Glencoe’s position as one of Illinois’s premier luxury destinations, with the remarkable recovery since 2020 reflecting renewed confidence in the community’s fundamental strengths and historic prestige among North Shore communities. The exceptional appreciation of over $554,000 in just four years suggests Glencoe has not only recovered from earlier challenges but has established itself as a premier choice for ultra-affluent buyers seeking the ultimate North Shore lifestyle. Current median values approaching $1.49 million represent the premium associated with North Shore legacy while delivering the lakefront lifestyle, educational excellence, and cultural sophistication that have defined Glencoe’s appeal to discerning buyers for generations.
2. Winnetka – 36.1% Home Price Increase Since 2010
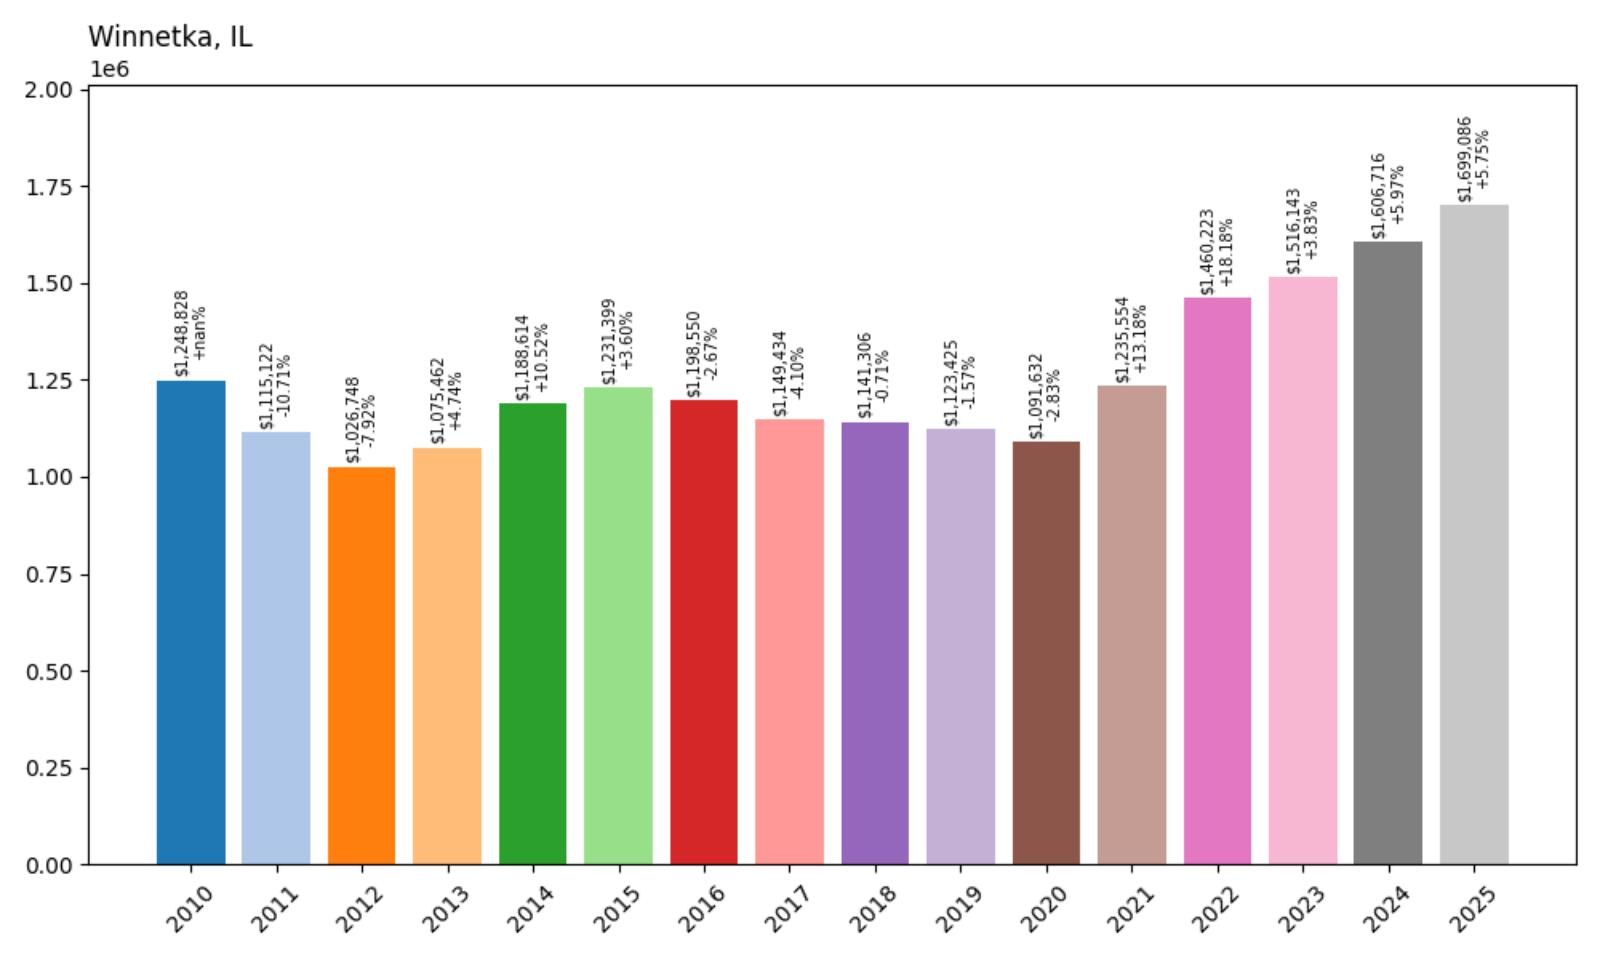
- 2010: $1,248,828
- 2011: $1,115,122 (−$133,706, −10.71% from previous year)
- 2012: $1,026,748 (−$88,373, −7.92% from previous year)
- 2013: $1,075,462 (+$48,713, +4.74% from previous year)
- 2014: $1,188,614 (+$113,152, +10.52% from previous year)
- 2015: $1,231,399 (+$42,785, +3.60% from previous year)
- 2016: $1,198,550 (−$32,849, −2.67% from previous year)
- 2017: $1,149,434 (−$49,117, −4.10% from previous year)
- 2018: $1,141,306 (−$8,127, −0.71% from previous year)
- 22019: $1,123,425 (−$17,882, −1.57% from previous year)
- 2020: $1,091,632 (−$31,793, −2.83% from previous year)
- 2021: $1,235,554 (+$143,922, +13.18% from previous year)
- 2022: $1,460,223 (+$224,669, +18.18% from previous year)
- 2023: $1,516,143 (+$55,920, +3.83% from previous year)
- 2024: $1,606,716 (+$90,573, +5.97% from previous year)
- 2025: $1,699,086 (+$92,370, +5.75% from previous year)
Winnetka’s median home value of $1,699,086 represents a 36.1% increase since 2010, reflecting the community’s exceptionally high starting values and the measured appreciation typical of ultra-luxury markets. The community experienced significant declines during 2011-2012, losing over 17% of its value, followed by gradual recovery and extended stagnation through 2020. However, Winnetka has demonstrated exceptional performance during the recent market cycle, with the remarkable 18.18% surge in 2022 representing one of the largest single-year gains in Illinois luxury real estate history, establishing the community as Illinois’s second-most expensive residential market.
Winnetka – The Crown Jewel Of The North Shore

Located along Lake Michigan’s most prestigious stretch of shoreline in Cook County, Winnetka stands as the undisputed crown jewel of the North Shore, representing over a century of American suburban excellence and serving as home to some of the nation’s most influential families. The village is internationally renowned for its magnificent lakefront estates, tree-lined streets designed by the Olmsted Brothers, and architectural treasures that include works by Frank Lloyd Wright and other legendary architects. This extraordinary combination of natural beauty, architectural heritage, and social prestige creates what many consider America’s most perfect suburban community, consistently attracting buyers who represent the pinnacle of success in business, politics, and cultural endeavors.
Market performance reflects Winnetka’s status as one of America’s most prestigious residential addresses, with the dramatic recovery since 2020 demonstrating the enduring appeal of the village among ultra-high-net-worth buyers who view Winnetka as the ultimate suburban address. The exceptional appreciation of over $607,000 in just four years suggests Winnetka has not only maintained its competitive position but has strengthened its appeal among buyers seeking the absolute pinnacle of suburban luxury living. Current median values approaching $1.7 million represent the premium associated with America’s most distinguished suburban community while delivering the lakefront lifestyle, educational excellence, and social prestige that have made Winnetka synonymous with suburban perfection for over a century.
1. Kenilworth – 33.1% Home Price Increase Since 2010
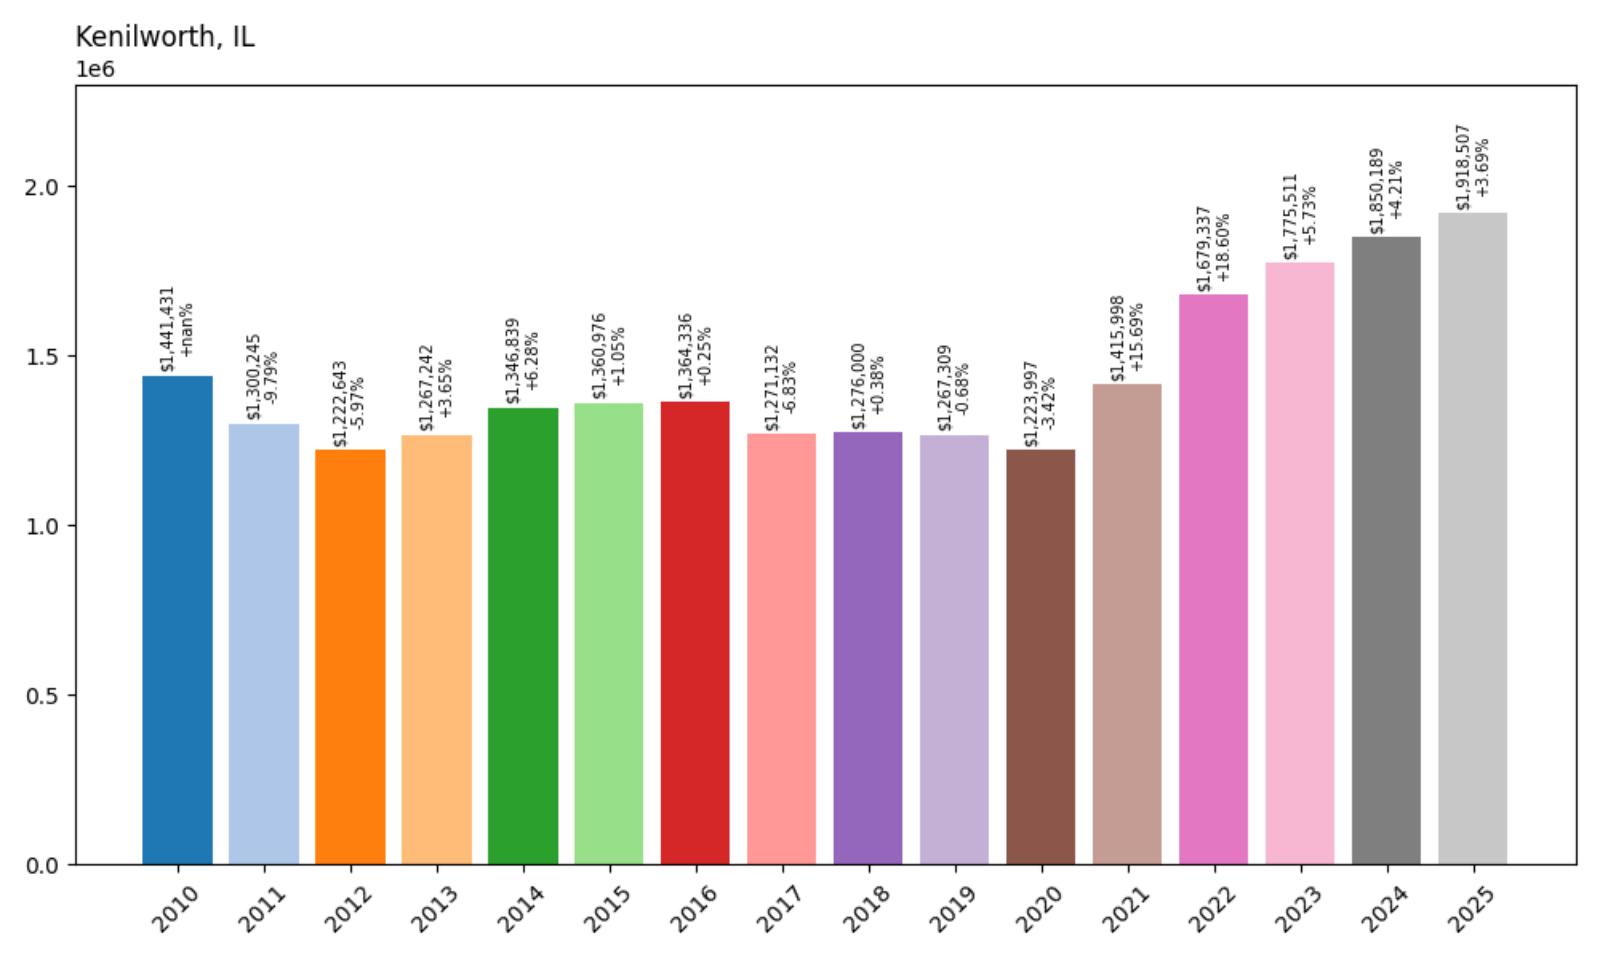
- 2010: $1,441,431
- 2011: $1,300,245 (−$141,186, −9.79% from previous year)
- 2012: $1,222,643 (−$77,602, −5.97% from previous year)
- 2013: $1,267,242 (+$44,599, +3.65% from previous year)
- 2014: $1,346,839 (+$79,597, +6.28% from previous year)
- 2015: $1,360,976 (+$14,137, +1.05% from previous year)
- 2016: $1,364,336 (+$3,360, +0.25% from previous year)
- 2017: $1,271,132 (−$93,204, −6.83% from previous year)
- 2018: $1,276,000 (+$4,868, +0.38% from previous year)
- 2019: $1,267,309 (−$8,691, −0.68% from previous year)
- 2020: $1,223,997 (−$43,312, −3.42% from previous year)
- 2021: $1,415,998 (+$192,001, +15.69% from previous year)
- 2022: $1,679,337 (+$263,339, +18.60% from previous year)
- 2023: $1,775,511 (+$96,174, +5.73% from previous year)
- 2024: $1,850,189 (+$74,678, +4.21% from previous year)
- 2025: $1,918,507 (+$68,318, +3.69% from previous year)
Kenilworth’s median home value of $1,918,507 represents a modest 33.1% increase since 2010, reflecting the community’s extraordinarily high starting values and the unique dynamics of ultra-luxury markets. The village experienced significant volatility through 2020, with values declining nearly 15% from 2010 levels before staging one of the most dramatic recoveries in American real estate history. The exceptional rebound since 2021, highlighted by an extraordinary 18.60% surge in 2022, has established Kenilworth as Illinois’s most expensive residential community and one of America’s most exclusive suburban addresses.
Kenilworth – The Ultimate American Suburb
Situated on a pristine stretch of Lake Michigan shoreline in Cook County, Kenilworth represents the absolute pinnacle of American suburban living, combining unparalleled exclusivity with architectural magnificence in what many consider the nation’s most perfect residential community. The village encompasses just 0.6 square miles and maintains a population of fewer than 2,500 residents, creating an extraordinarily intimate environment where every detail reflects the highest standards of residential excellence. Founded in 1889 as a planned community for Chicago’s elite, Kenilworth has maintained its exclusive character through careful planning, architectural controls, and a commitment to preserving the vision of its founder, Joseph Sears, who intended to create America’s most beautiful suburb.
Market performance reflects Kenilworth’s status as America’s most prestigious suburban address, with the dramatic recovery since 2020 demonstrating the village’s unique appeal among ultra-high-net-worth individuals who view Kenilworth as the ultimate residential achievement. The exceptional appreciation of nearly $695,000 in just four years suggests sustained demand from buyers who represent the absolute pinnacle of American success and who view Kenilworth not merely as a residence but as a symbol of having reached the highest levels of achievement. Current median values approaching $1.92 million establish Kenilworth as Illinois’s most expensive community and position it among America’s most exclusive residential addresses, delivering a lifestyle that combines lakefront magnificence, architectural distinction, and social prestige in a way that no other American suburb can match.